Submitted:
13 May 2025
Posted:
15 May 2025
You are already at the latest version
Abstract
Complex networks of stochastic processes are crucial for modelling the dynamics of interacting systems, particularly those involving High-Order Interactions (HOIs) among three or more components. Traditional measures—such as mutual information (MI), interaction information (II), the redundancy-synergy index (RSI), and O-information (OI)—are typically limited to static analyses not accounting for temporal correlations and become computationally unfeasible in large networks due to the exponential growth of the number of interactions to be analyzed. To address these challenges, first a framework is introduced to extend these information-theoretic measures to dynamic processes. This includes the II rate (IIR), RSI rate (RSIR), and the OI rate gradient (ΔOIR), enabling the dynamic analysis of HOIs. Moreover, a stepwise strategy identifying groups of nodes (multiplets) that maximize either redundant or synergistic HOIs is devised, offering deeper insights into complex interdependencies. The framework is validated through simulations of networks composed of cascade, common drive, and common target mechanisms, modelled using Vector AutoRegressive (VAR) processes. The feasibility of the proposed approach is demonstrated through its application in climatology, specifically by analyzing the relationships between climate variables that govern El Niño and the Southern Oscillation (ENSO) using historical climate data.
Keywords:
complex systems
; high order interactions
; information theory
; redundancy and synergy
; stochastic processes
; time series analysis
1. Introduction
The complexity of physical, biological, and technological systems arises from the intricate structural and functional interactions among their components. Modern science has shifted away from the reductionist view that the behavior of a networked system—composed of multiple potentially interacting units — can be fully understood by examining each unit in isolation. Additionally, the traditional approach of modelling networked systems through pairwise measures of coupling or causality [1,2] is being increasingly questioned, as it often fails to fully capture the emergent dynamics of the system. Growing evidence indicates that network dynamics cannot be explained solely by pairwise couplings, as Higher-Order Interactions (HOIs) — those involving multiple system components — play a crucial role in shaping the overall behavior [3,4]. As a result, new methods are being developed to incorporate these HOIs into generalized network models [5]. Higher-order relationships involving three or more systems can be redundant (where multiple interacting systems share the same information) or synergistic (where a set of systems holds some information that cannot be seen from any subset). However, implementing such approaches remains challenging, particularly when interactions need to be inferred from data, as is often the case with biological or functional networks that represent the dynamic activity of physical systems.
Information-theoretic measures have been extensively used to assess higher-order interdependences in multivariate dynamical systems across diverse fields including neuroscience [6,7], finance [8,9], physiology [10,11,12], and climatology [13] where redundancies and synergies have been found to play meaningful roles [14,15,16,17,18]. The Partial Information Decomposition (PID) framework has emerged as a prominent tool for analyzing complex higher-order statistical interdependencies [14,19]. PID is able to quantify as separate quantities the synergistic and the redundant information terms together with the unique information that is held by each source but not by the others. Several approaches have been proposed relying on the PID concept and can be divided into two families: directed approaches that decompose information provided by source systems about a target and, undirected methods disentangle shared information among stochastic processes without assigning distinct roles, capturing the interplay between redundancy and synergy while remaining invariant under permutations [20,21]. Despite the advantages of PID approaches, a key limitation is the super-exponential growth of its atoms, making full decomposition impractical for large systems. To mitigate this challenge, coarse-grained PID metrics have been introduced, which bypass the computation of individual atoms by focusing on their linear combinations [22,23,24]. However, this approach still struggles with scalability as the number of processes in the network increases. Another approach recently introduced by Stramaglia et al. [25] proposes method, based on partial conditioning in multivariate data sets a [26], for decomposing Transfer Entropy (TE) [27]; the method is very versatile, as it has been extended to assess feature importance in explainable artificial intelligence [28]. Specifically, this approach bridges dyadic and polyadic methodologies, providing a complementary perspective to those focused on assessing HOIs [14,22,29]. While these methods aim to decompose the total information about the target from multiple sources, the proposed framework focuses on analyzing how the environment modifies the TE between two processes of interest.
This work builds upon [25] by introducing a stepwise strategy to identify, starting from a target node in a complex network, groups of nodes (multiplets) that maximize either redundant or synergistic HOIs. Measures traditionally applied to static analyses of random variables — such as Interaction Information (II) [30], the Redundancy-Synergy Index (RSI) [31], and O-information (OI) [22] — are herein extended to the analysis of stochastic processes. Specifically, the proposed method incorporates the Interaction Information Rate (IIR), the Redundancy-Synergy Index Rate (RSIR), and the O-information Rate Gradient () to enable the dynamic analysis of these interactions. The approach is validated through simulations of interaction mechanisms that generate HOIs, including cascade effects, common driver motifs, and common target motifs. Finally, its feasibility is demonstrated through the analysis of a real-world climate network that captures the large-scale climate pattern of the El Niño-Southern Oscillation (ENSO), a key driver of global climate variability [32,33,34].
2. Sequential Method for Quantifying Higher-Order Interactions
This section outlines the methodology of the information-theoretic approach used to identify and quantify HOIs in complex networks. The Matlab Toolbox implementing the greedy approach proposed in this work is freely available for download from the repository https://github.com/helderpinto97/GS-HOIs.
2.1. Sequential Procedure Outline
Let us consider a set consisting of M processes, . This approach aims to identify, in a computationally efficient manner, a subset of processes within that form an informational circuit which is the most redundant or synergistic. To achieve this, the algorithm involves the following steps:
- Given the set , first identify the triplet that exhibits the highest level of redundancy or synergy according to a predefined metric.
- Expand the selected triplet iteratively by adding one process at a time, ensuring that its inclusion results in the maximal statistically significant increase in the overall redundancy or synergy of the joint multiplet according to the chosen metric. Repeat this until no additional inclusion produces a statistically significant increase in redundancy or synergy.
The measures employed in this study to evaluate the prevalence of redundancy or synergy within a subset of processes are as follows: (i) the Interaction Information Rate (IIR) [12], calculated here in its conditional form; (ii) the Redundancy-Synergy Index (RSI) [35], extended in this work to its rate form (RSIR); and (iii) the O-information rate gradient [12]. Importantly, the RSIR and measures reduce to the IIR when applied to scenarios involving processes.
Therefore, the IIR serves as the basic measure used in this work to implement Step 1 of our algorithm. The IIR for the triplet of processes , is defined as [12]:
where is the Mutual Information Rate (MIR) which quantifies the information shared between the two processes per unit of time [36], and is the conditional MIR (cMIR). The IIR indicates the prevalence of redundancy, while indicates the prevalence of synergy. Specifically, in the former case, the knowledge of reduces the information shared by and , indicating that the statistical dependence between and is suppressed when is observed. Conversely, in the latter case, the knowledge of increases the information shared by and , indicating that the statistical dependence between and emerges when is observed. Accordingly, step 1—identifying the most redundant or synergistic triplet—involves finding the maximum or minimum values of the IIR measure across all possible triplets within the set respectively. The maximally redundant and maximally synergistic triplets identified in this way are denoted as and , respectively.
The algorithm proceeds iteratively selecting, for each step k (), the process such that
in the case of a search for synergy, and selecting the process such that
in the case of a search for redundancy. If the measure is statistically significant, the process satisfying either Equations (3) or (4) is retained, updating the multiplet to or , respectively, and the procedure proceeds to the next step. If is not statistically significant, the procedure terminates, resulting in the final multiplet: in the case of redundancy, or in the case of synergy. The statistical significance of is assessed using the surrogate-based approach [25]. Processes are added one at a time to the current multiplet to construct a set that either maximizes or minimizes . The greedy search stops when any observed change in can reasonably be attributed to chance. To determine this, the probability is estimated that the observed increase (or decrease) in is smaller (or bigger) than what would result from adding a process with similar individual statistical properties but not coupled with the current multiplet .
The function applied to a process is the objective function of the minimization (or maximization), and is chosen in three different ways as follows. In the case (i), the conditional IIR (cIIR) is employed, where for the step :
and for :
In case (i), adding processes to the conditional vector can either increase or decrease the cIIR, revealing how the added processes interact in a synergistic or redundant way with the initial triplet . For this specific measure the final multiplets and is obtained appending the initial triplet to the conditioning vector. Regarding cases (ii) and (iii), Equations (7) and (8), the RSIR [35,37] and [12,38], quantify how the tested process contributes to the balance between redundant and synergistic interdependencies with the current multiplet .
Before delving into the technical details regarding the estimation of these information measures, it is essential to highlight that each objective function — , , and — used to identify the most synergistic or redundant multiplets can be expressed as a sum of MIR terms. In particular, for and , this follows directly from Equations (7) and (8). Conversely, the cIIR measure can be expressed as a sum of cMIR terms. For instance, for , Equation (5) can be decomposed as:
Moreover, each cMIR term can be expressed in terms of MIR [11], leading to the following reformulation:
The same reasoning applies at each step k. Therefore, for each step, it suffices to estimate only MIR terms to compute the functions and . For this purpose, a parametric approach based on the Vector AutoRegressive (VAR) model [39] is employed to estimate the MIR terms involve in the estimation of the three measures, which the details are presented in the next section.
Another key point to emphasize is that, when analyzing real-world complex systems, the focus is often on a specific process and its interaction with the surrounding environment — particularly how other processes influence this target process, either synergistically or redundantly. This consideration can be integrated into Step 1 of the algorithm, where the selected triplet must include the predefined target process.
2.2. Linear Parametric Estimation of Higher-Order Interaction Information Measures
Consider a general system of M units, and focus on the two units and while collecting the remaining units in the group . Since the system exhibits dynamic behavior, it is best described as a vector random process , where the temporal dependence is indicated by the time index n, and represents the sampled value of the process at time step n (, for discrete-time processes). The equivalent notation evidencing the dynamics of the units is . A widely used method to model the dynamics of is the linear Vector AutoRegressive (VAR) model [39], given by:
where and represent M-dimensional variables that capture the state of the process at the current time step n and k steps in the past, respectively. The matrix is an coefficient matrix, while denotes an independent and identically distributed (i.i.d.) innovation process, with an covariance matrix . Given the full model, represented in Equation (11), restricted models can be used to describe the dynamics of any given subset of processes. Specifically, the dynamics of processes X, Y, and their joint dynamics in the multivariate process are represented by:
where q is the model order (theoretically ). The parameters , and the residual covariances , can be derived from the full model parameters and by solving the Yule-Walker equations and reorganizing the covariance structure of to relate it to X, Y, or [40]. Assuming joint Gaussianity of the overall process , the MIR can be directly determined from the covariances of the residuals of the restricted models:
The aforementioned procedure can be iterated to construct restricted models that characterize the dynamics of the vector process and the joint processes and . These models are formulated using VAR representations, as outlined in Equation (12), enabling the derivation of expressions for the MIR terms and :
Then, the formulations presented in Equations (13)-(15) are directly applied in Equations (10), (7), and (8) to compute , , and , respectively, at each step of the algorithm. In practical analyses, these metrics are computed from synchronous time series realizations of the processes X, Y, and . The parameters of the full model (11) are estimated using least squares [39], and these estimates are used to derive the covariance matrices of the residuals from the restricted models [40]. These covariance matrices are then employed in Equations (13), (14) and (15) to estimate the MIR terms. The order p of the full model is selected using the Akaike Information Criterion (AIC) [41], while the order q of the restricted models is set to a high value (specifically, in this work) to capture the decay of correlations at increasing lags.
After estimation, the statistical significance of the measures is assessed at each step of the algorithm. Surrogate realizations of the candidate process for the multiplet are generated using the Iterative Amplitude-Adjusted Fourier Transform (IAAFT) method, which destroys cross-correlation while preserving autocorrelation and the power spectrum [42,43,44]. Depending on whether redundancy or synergy is being evaluated, the process is retained if the corresponding probability is above or bellow a predefined threshold, respectively. In this work, the 95% and 5% percentiles of the surrogates distribution are used as thresholds.
3. Simulation Studies
The proposed sequential method for detecting and quantifying HOIs in a network of interacting processes is validated using theoretical examples based on simulated VAR models. In these simulations, various interaction measures are computed directly from the theoretical model parameters, ensuring the evaluation of the proposed method. These simulations demonstrate how our approach can effectively identify processes that interact in a redundant or synergistic manner with respect to a predefined target process.
3.1. Five-Dimensional VAR Model
First, the proposed method is evaluated using a five-variate VAR model of order 2, defined by the following equations [7]:
where represents a zero-mean white Gaussian noise with covariance matrix . The node represents an isolated node which does not interact with other processes in the network. The graphical representation of the model (16) is presented in Figure 1(a). The parameter design in the set of equations (16) is chosen to enable autonomous oscillations in all five processes. This is achieved by placing complex-conjugate poles in the complex plane representation of the transfer function of the vector process, with amplitudes and normalized frequency . Causal interactions between processes and are controlled by the coupling parameter , while interactions between and are modulated by the parameter c. Specifically, the parameters were set as , , which results in oscillatory activity at 0.1 Hz when the sampling frequency is considered. The parameter c was allowed to vary freely between 0 and 1.
The median and the 5th–95th percentile range of , , and considering the process as target, are shown in Figure 1(a), (b), and (c), respectively, along with the most frequently observed redundant (red) and synergistic (blue) multiplets across the 100 generated realizations. In these heatmaps, each cell is colour-coded to indicate whether the process was part of the corresponding multiplet or not. The three information measures used in the function exhibit a similar pattern: increasing c enhances synergy up to , after which it declines. Redundancy follows the opposite trend, decreasing until and then increasing. This behavior is expected, as low c values lead to redundancy dominance due to the cascade [7]. At intermediate c, synergy and redundancy coexist, with synergy peaking at due to the common child structure , while redundancy reaches its minimum but persists due to the cascades and . Beyond this point, redundancy increases while synergy declines to zero, driven by the dominance of . This trend is captured by all three measures, though differences arise in the multiplets they identify. clearly detects the shift between the cascades and as c increases. Meanwhile, and identify as the most redundant multiplet, capturing both cascades and the common driver structure . Regarding synergy, notable differences are observed among the , , and multiplets. In all three measures, the common empty multiplet appears at both low and high values of c, as expected, since synergy is absent in these cases and the network is dominated by cascade effects. However, at intermediate values of c, the multiplet identified by differs from those found using and . The latter two measures consistently identify the multiplet , revealing the common child structure . In contrast, also includes the process in the multiplet. Specifically, for this measure, the final multiplet is formed by extending the initial triplet with the conditioning vector (see Section 2), where is part of the conditioning vector. By incorporating into the conditioning vector, the visibility of the structure is enhanced. Thus, the knowledge of helps clarify the interactions between , , and . This distinction can explain the differences observed in the multiplets identified for redundancy when using IIR when compared to RSIR and . In RSIR and , where a new process is added to the multiplet at each step, both methods detect three redundant motifs: the two cascade structures and the common driver structure . However, since IIR is formulated in terms of conditioning, it selects processes that enhance the visibility of the interaction detected in the initial triplet rather than simply adding a new process at each step. For instance, for lower values of c, IIR identifies the dominant cascade effect . However, no additional process is included in the conditioning vector because neither nor contains information relevant to the cascade effect detected in the first step. A similar reasoning applies to higher values of c.
3.2. Randomly Connected Networks
The simulated data-sets were generated according to different ground-truth networks by means of an VAR model used as a generator filter [45,46]. The simulated multivariate time series () were generated as realizations of a VAR process of order fed by Gaussian noise with variance equal to 1. Two different matrices of AR parameters were generated by the SEED-G software according with a predefined network density of 10% and 30% (16 and 48 out of 156 possible connections). The parameters were randomly assigned in the range and their values were selected in the interval . This value is imposed only at one lag among the possible p lags, randomly selected.
Figure 2(a) and (b) illustrate a randomly generated network with 13 nodes, featuring edge densities of 10% and 30%, respectively. The increase in density enhances connectivity, which can influence both the structural and dynamic properties of the network. Figure 2(c) presents the distribution of redundancy and synergy, computed using , , and , based on 20 realizations of the network shown in Figure 2(a). These distributions are evaluated for all possible target nodes, . Similarly, Figure 2(d) displays the redundancy and synergy distributions for the same three measures, obtained from 20 realizations of the denser network in Figure 2(b), again considering all possible target processes, . For the network with 10% density (Figure 2(c)), the results show a predominance of redundancy over synergy across all information measures used in the function . However, notable synergy peaks for the three measures — , , and — are observed when , , and are considered as target nodes. This can be explained by the common child structure , as seen in Figure 2(a).
Increasing the network density parameter to 0.3 results in a greater number of connections, as shown in Figure 2(b). Additionally, Figure 2(d) illustrates an increase in redundancy across all three measured parameters compared to the lower-density network, which is summarized in Figure 2(c). Furthermore, as shown in Figure 2(d), synergy arises when , , and are considered as target processes, which can be explained by the common child structure . Alternatively, this can be explained by comparing the prevalence of synergistic structures involving these three nodes with that of redundant structures. All three measures considered — , , and — identified the same initial triplet . However, while RSIR and retained this triplet as the final multiplet, IIR included additional processes, and , in the conditioning vector (result not shown for simplicity). Although these two processes are associated with redundancy, as they follow the cascade , their inclusion provides valuable insight into the synergistic interactions within the initial triplet. Another important observation is that the estimated values of redundancy and synergy, calculated for the three measures across both random networks, show minimal bias when compared to the theoretical values, presented as Table 1.
Overall our simulations show that increasing network density leads to a significant rise in HOIs, as expected, because a denser network offers more connections, which helps collective behaviours to emerge. Specifically, we found that more densely connected networks exhibit a predominance of redundant interactions, which can obscure underlying synergistic effects. This behavior can be explained by the presence of common-child structures, whereas redundant interactions are more strongly linked to cascade and common-driver effects — a finding consistent with prior studies [7,12].
4. Application to a Climate Network
The feasibility of the proposed framework is demonstrated through an exemplary case study in climate science, i.e. the network of interactions among the most representative indices descriptive of El Niño and the Southern Oscillation (ENSO) [33,34]. El Niño and the ENSO is a climate pattern involving periodic warming (El Niño) and cooling (La Niña) of the central and eastern Pacific Ocean, affecting global weather patterns through atmospheric pressure shifts [32]. ENSO is considered the most prominent form of interannual climate variability on Earth [33]. Since the exact mechanisms triggering ENSO warm and cool events are not fully understood, analyzing the statistical relationships among climate variables is crucial. The resulting network of interactions is tightly connected through various feedback loops that influence climate patterns over multiple years [34,47]. This highlights the need to study HOIs using a broader, dynamic approach.
The network considered was composed by 13 time series publicly available [34]: NINO34 (the East Central Tropical Pacific sea surface temperature anomal), SOI (Southern Oscillation Index), AIR (All Indian Rainfall), AMO (Atlantic Multidecadal Oscillation), GMT (Global Mean Temperature anomaly), HURR (total number of hurricanes or named tropical storms per month in the Atlantic region), NOA (North Atlantic Oscillation of pressure anomalies over the Atlantic), NP (North Pacific pattern of sea level pressure), NTA (North Tropical Atlantic), PDO (Pacific Decadal Oscillation), QBO (Quasi-Biennial Oscillation), Sahel (Sahel Standardized Rainfall), and TSA (Tropical Southern Atlantic Index). The time series were detrended and deseasonalized [34], covering the period of 66 years from 1950 to 2016. It is important to note that these variables may not represent entirely distinct processes, as underlying latent factors could influence multiple indices simultaneously. This highlights the necessity of an analytical approach that accounts for shared information and potential interdependencies among the variables, like the one presented in this work.
Figure 3 summarizes the redundant multiplets (first row in red) and synergistic multiplets (second row in blue) for all possible target processes, considering , , and . First, we focus on one of the most important processes in the network: the Southern Oscillation Index (SOI). A key observation is that the initial triplet identified for all three measures, regarding redundancy, was the same: . This corroborates in some extent the results presented in [34], where authors found that SOI may act as a common driver influencing both NINO34 and GMT. For , no additional redundant processes were included in the multiplet. However, for and , the final multiplet expanded significantly to . This expansion suggests that RSIR and capture a broader set of redundant motifs, potentially uncovering cascading effects such as and , as observed in [34]. Furthermore, this finding supports that the triplet interacts in a redundant manner, consistent with the results reported in [48] using the Partial Information Rate Decomposition framework. Regarding synergy, for all three measures, the initial triplet that contributed to the final multiplet was the same regardless of the considered approach: . This finding supports the presence of a common child structure, where SOI is influenced by the joint effects of AIR and TSA, potentially indicating an underlying atmospheric teleconnection pattern: [34]. These results also partially align with the findings of [25], where the authors observed that the pair NTA and TSA contribute to the synergy in the pairwise interaction . The differences observed in this study could be attributed to the methodological approaches: the measures used in the greedy framework presented here are undirected and capture HOIs in a more general sense, whereas [25] employed the conditioning of TE [27], a pairwise causality measure, to infer the presence of HOIs.
Interestingly, the HURR process was not present in any redundant or synergistic multiplet for any target considered, suggesting that this process does not play a role in the emergence of higher-order effects. This could be related with the fact is strongly influenced by ENSO, but it is generally considered an outcome rather than an active interacting variable in redundancy or synergy analyses but more as a pairwise interaction [49,50].
From Figure 3 and Table 2, it is clear that redundant interactions dominate the system behaviours over synergistic ones. This trend holds across all measures considered — , , and — where synergy values remained consistently close to zero. Given the higher density of connections in the climate network [34], this result aligns with the results of the simulation studies as discussed in Section 3.2, showing that the number of pairwise connections influences the presence of HOIs, particularly redundancy.
5. Conclusions
This study introduces a novel sequential approach based on the measures IIR, RSIR, and to detect and quantify HOIs in complex, high-dimensional networks. The proposed method iteratively identifies multiplets that interact redundantly or synergistically with a predefined target process. By doing so, it circumvents the computational explosion associated with exhaustively considering all possible combinations, as seen in the approaches presented in [14,22,37], which scale exponentially with the number of network nodes. This makes the method particularly well-suited for analyzing large-scale systems, such as biological and climate networks, where understanding HOIs is crucial for uncovering emergent behaviours and collective dynamics.
The simulations confirm that the proposed method effectively detects and quantifies both redundancy and synergy in complex networks. In a simple five-node network simulation, discussed in Section 3.1, the method successfully identified simultaneous redundancy and synergy, with the detected multiplets aligning closely with theoretical predictions. Extending the analysis to simulations of random network, presented in Section 3.2, revealed that higher connection density led to an increased presence of HOIs, particularly strengthening redundancy. This finding suggests that as network density grows, redundancy becomes the dominant contributor to overall interactions, surpassing cooperative or synergistic effects between nodes.
The proposed greedy approach was applied to a climate network to analyze the interplay between ENSO climate variables, revealing significant high-order effects, with redundancy prevailing over synergy. Particularly, the results indicate that SOI and NINO34 interact redundantly possible reflecting the driver role of this process in the network. Regarding synergistic effects, the multiplet [SOI, TSA, AIR] was identified, suggesting that SOI is influenced by the combined effects of AIR and TSA, potentially indicating an underlying atmospheric teleconnection pattern: .
The sequential framework presented here offers an alternative to PID for quantifying HOIs in complex systems. PID becomes computationally challenging as the number of atoms increases exponentially with the number of sources. In contrast, our approach addresses this issue by starting with a predefined target process and identifying other processes in the network that interact redundantly or synergistically with it. Additionally, the proposed methodology is computationally efficient, particularly when using a greedy search strategy to identify the optimal multiplets that maximize redundancy or synergy, without the need for exhaustive calculations. The measures herein proposed, , and differ in they nature with IIR being particularly distinct from the other two. Specifically, when RSIR and are considered, at each step, a process is added to a multiplet while in the case of IIR, after the identification of the first triplet, additional processes are incorporated through a conditioning vector. We showed that the processes added to the conditioning vector are those that enhance the visibility of redundancy or synergy within the initial triplet. This methodological difference explain the discrepancies observed between IIR and the other two measures, RSIR and .
The sequential framework proposed in this work demonstrates the ability to efficiently handle intricate networks with a large number of interacting processes at relatively low computational cost. This capability opens new perspectives for investigating complex biological systems and their interactions. In particular, the methodology offers promising perspectives for the study of physiological networks — such as cardiovascular and respiratory interactions [11,51,52] — as well as brain networks [53] and brain–heart interactions [54,55,56].
Author Contributions
Conceptualization, A.P.R, L.F, G.M; Data curation, H.P; Formal analysis, H.P, Y.A; Methodology, L.F, G.M and A.P.R; Software, H.P; Supervision, A.P.R, L.F, Y.A; Validation, A.P.R, L.F, G.M, Y.A, S.S; Writing original draft, H.P; Writing—review & editing, Y.A., G.M, L.F, L.S, S.S and A.P.R. All authors have read and agreed to the published version of the manuscript.
Funding
The authors A.P.R and H.P were partially supported by CMUP, member of LASI, which is financed by national funds through FCT – Fundação para a Ciência e a Tecnologia, I.P., under the projects with reference UID/00144 - Centro de Matemática da Universidade do Porto. H.P is supported by FCT, Portugal with the Ph.D. Grant 2022.11423.BD. Y.A. and L.F were supported by SiciliAn MicronanOTecH Research And Innovation CEnter “SAMOTHRACE” (MUR, PNRR-M4C2, ECS_00000022), spoke 3–Università degli Studi di Palermo S2-COMMs–Micro and Nanotechnologies for Smart & Sustainable Communities. G.M. is supported by the Ministry of Science, Technological Development and Innovation (Contract No. 451-03-65/2024-03/200156) and the Faculty of Technical Sciences (FTS), University of Novi Sad (UNS), through project “Scientific and Artistic Research Work of Researchers in Teaching and Associate Positions at the FTS, UNS” (No. 01-3394/1). S.S. was supported by the project “HONEST - High-Order Dynamical Networks in Computational Neuroscience and Physiology: an Information-Theoretic Framework”, Italian Ministry of University and Research (funded by MUR, PRIN 2022, code 2022YMHNPY, CUP: B53D23003020006) and by the project “Higher-order complex systems modeling for personalized medicine”, Italian Ministry of University and Research (funded by MUR, PRIN 2022-PNRR, code P2022JAYMH, CUP: H53D23009130001).
Data Availability Statement
The climate data can be downloaded at the NOAA website (https://psl.noaa.gov/data/climateindices/list/), with the exception of AIR, which is available via the Indian Institute of Tropical Meteorology (https://www.tropmet.res.in/).
Conflicts of Interest
The authors declare no conflicts of interest.
References
- Bashan, A.; Bartsch, R.P.; Kantelhardt, J.W.; Havlin, S.; Ivanov, P.C. Network physiology reveals relations between network topology and physiological function. Nature communications 2012, 3, 702. [Google Scholar] [CrossRef] [PubMed]
- Bassett, D.S.; Sporns, O. Network neuroscience. Nature neuroscience 2017, 20, 353–364. [Google Scholar] [CrossRef] [PubMed]
- Battiston, F.; Cencetti, G.; Iacopini, I.; Latora, V.; Lucas, M.; Patania, A.; Young, J.G.; Petri, G. Networks beyond pairwise interactions: Structure and dynamics. Physics Reports 2020, 874, 1–92. [Google Scholar] [CrossRef]
- Battiston, F.; Amico, E.; Barrat, A.; Bianconi, G.; de Arruda, G.F.; Franceschiello, B.; Iacopini, I.; Kéfi, S.; Latora, V.; Moreno, Y.; et al. The physics of higher-order interactions in complex systems. Nature Physics 2021 17:10 2021, 17, 1093–1098. [Google Scholar] [CrossRef]
- Bianconi, G. Higher-order networks : an introduction to simplicial complexes; Cambridge University Press, 2021; p. 140. [CrossRef]
- Antonacci, Y.; Barà, C.; Sparacino, L.; Pirovano, I.; Mastropietro, A.; Rizzo, G.; Faes, L. Antonacci, Y.; Barà, C.; Sparacino, L.; Pirovano, I.; Mastropietro, A.; Rizzo, G.; Faes, L. Spectral Information Dynamics of Cortical Signals Uncover the Hierarchical Organization of the Human Brain’s Motor Network. IEEE Transactions on Biomedical Engineering 2024, pp. 1–10. [CrossRef]
- Antonacci, Y.; Minati, L.; Nuzzi, D.; Mijatovic, G.; Pernice, R.; Marinazzo, D.; Stramaglia, S.; Faes, L. Measuring high-order interactions in rhythmic processes through multivariate spectral information decomposition. IEEE Access 2021, 9, 149486–149505. [Google Scholar] [CrossRef]
- Scagliarini, T.; Faes, L.; Marinazzo, D.; Stramaglia, S.; Mantegna, R.N. Synergistic information transfer in the global system of financial markets. Entropy 2020, 22, 1–13. [Google Scholar] [CrossRef]
- Bardoscia, M.; Barucca, P.; Battiston, S.; Caccioli, F.; Cimini, G.; Garlaschelli, D.; Saracco, F.; Squartini, T.; Caldarelli, G. The physics of financial networks. Nature Reviews Physics 2021, 3, 490–507. [Google Scholar] [CrossRef]
- Faes, L.; Marinazzo, D.; Nollo, G.; Porta, A. An information-theoretic framework to map the spatiotemporal dynamics of the scalp electroencephalogram. IEEE Transactions on Biomedical Engineering 2016, 63, 2488–2496. [Google Scholar] [CrossRef]
- Mijatovic, G.; Sparacino, L.; Antonacci, Y.; Javorka, M.; Marinazzo, D.; Stramaglia, S.; Faes, L. Assessing High-Order Links in Cardiovascular and Respiratory Networks via Static and Dynamic Information Measures. IEEE Open Journal of Engineering in Medicine and Biology 2024. [Google Scholar] [CrossRef]
- Faes, L.; Mijatovic, G.; Antonacci, Y.; Pernice, R.; Bara, C.; Sparacino, L.; Sammartino, M.; Porta, A.; Marinazzo, D.; Stramaglia, S. A New Framework for the Time-and Frequency-Domain Assessment of High-Order Interactions in Networks of Random Processes. IEEE Transactions on Signal Processing 2022, 70, 5766–5777. [Google Scholar] [CrossRef]
- Leung, L.Y.; North, G.R. Information theory and climate prediction. Journal of Climate 1990, 3, 5–14. [Google Scholar] [CrossRef]
- Williams, P.L.; Beer, R.D. Nonnegative Decomposition of Multivariate Information, 2010. arXiv:cs.IT/1004.2515].
- James, R.G.; Ellison, C.J.; Crutchfield, J.P. Anatomy of a bit: Information in a time series observation. Chaos: An Interdisciplinary Journal of Nonlinear Science 2011, 21. [Google Scholar] [CrossRef]
- Stramaglia, S.; Cortes, J.M.; Marinazzo, D. Synergy and redundancy in the Granger causal analysis of dynamical networks. New Journal of Physics 2014, 16, 105003. [Google Scholar] [CrossRef]
- Barrett, A.B. Exploration of synergistic and redundant information sharing in static and dynamical Gaussian systems. Phys. Rev. E 2015, 91, 052802. [Google Scholar] [CrossRef]
- Finn, C.; Lizier, J.T. Pointwise partial information decomposition using the specificity and ambiguity lattices. Entropy 2018, 20. [Google Scholar] [CrossRef]
- Wibral, M.; Priesemann, V.; Kay, J.W.; Lizier, J.T.; Phillips, W.A. Partial information decomposition as a unified approach to the specification of neural goal functions. Brain and Cognition 2017, 112, 25–38. [Google Scholar] [CrossRef]
- Rosas, F.; Ntranos, V.; Ellison, C.J.; Pollin, S.; Verhelst, M. Understanding interdependency through complex information sharing. Entropy 2016, 18. [Google Scholar] [CrossRef]
- Ince, R.A.A. The Partial Entropy Decomposition: Decomposing multivariate entropy and mutual information via pointwise common surprisal, 2017. arXiv:cs.IT/1702.01591].
- Rosas, F.E.; Mediano, P.A.; Gastpar, M.; Jensen, H.J. Quantifying high-order interdependencies via multivariate extensions of the mutual information. Physical Review E 2019, 100, 032305. [Google Scholar] [CrossRef]
- Rosas, F.E.; Mediano, P.A.M.; Jensen, H.J.; Seth, A.K.; Barrett, A.B.; Carhart-Harris, R.L.; Bor, D. Reconciling emergences: An information-theoretic approach to identify causal emergence in multivariate data. PLOS Computational Biology 2020, 16, 1–22. [Google Scholar] [CrossRef]
- Mediano, P.A.; Rosas, F.E.; Bor, D.; Seth, A.K.; Barrett, A.B. The strength of weak integrated information theory. Trends in cognitive sciences 2022, 26, 646–655. [Google Scholar] [CrossRef]
- Stramaglia, S.; Faes, L.; Cortes, J.M.; Marinazzo, D. Disentangling high-order effects in the transfer entropy. Physical Review Research 2024, 6, L032007. [Google Scholar] [CrossRef]
- Marinazzo, D.; Pellicoro, M.; Stramaglia, S. Causal Information Approach to Partial Conditioning in Multivariate Data Sets. Computational and Mathematical Methods in Medicine 2012, 2012, 303601. [Google Scholar] [CrossRef] [PubMed]
- Schreiber, T. Measuring information transfer. Physical Review Letters 2000, 85, 461–464. [Google Scholar] [CrossRef]
- Ontivero-Ortega, M.; Faes, L.; Cortes, J.M.; Marinazzo, D.; Stramaglia, S. Assessing high-order effects in feature importance via predictability decomposition. Phys. Rev. E 2025, 111, L033301. [Google Scholar] [CrossRef]
- Stramaglia, S.; Scagliarini, T.; Daniels, B.C.; Marinazzo, D. Quantifying dynamical high-order interdependencies from the o-information: an application to neural spiking dynamics. Frontiers in Physiology 2021, 11, 595736. [Google Scholar] [CrossRef]
- McGill, W. Multivariate information transmission. Transactions of the IRE Professional Group on Information Theory 1954, 4, 93–111. [Google Scholar] [CrossRef]
- Timme, N.; Alford, W.; Flecker, B.; Beggs, J.M. Synergy, redundancy, and multivariate information measures: An experimentalist’s perspective, 2014. [CrossRef]
- Timmermann, A.; An, S.I.; Kug, J.S.; Jin, F.F.; Cai, W.; Capotondi, A.; Cobb, K.; Lengaigne, M.; McPhaden, M.J.; Stuecker, M.F.; et al. El Niño–Southern Oscillation complexity, 2018. [CrossRef]
- McPhaden, M.J.; Zebiak, S.E.; Glantz, M.H. ENSO as an Integrating Concept in Earth Science. Science 2006, 314, 1740–1745. [Google Scholar] [CrossRef]
- Silini, R.; Tirabassi, G.; Barreiro, M.; Ferranti, L.; Masoller, C. Assessing causal dependencies in climatic indices. Climate Dynamics 2023, 61, 79–89. [Google Scholar] [CrossRef]
- Chechik, G.; Globerson, A.; Anderson, M.; Young, E.; Nelken, I.; Tishby, N. Group redundancy measures reveal redundancy reduction in the auditory pathway. Advances in neural information processing systems 2001, 14. [Google Scholar] [CrossRef]
- Duncan, T.E. On the calculation of mutual information. SIAM Journal on Applied Mathematics 1970, 19, 215–220. [Google Scholar] [CrossRef]
- Rosas, F.E.; Mediano, P.A.; Gastpar, M. Characterising Directed and Undirected Metrics of High-Order Interdependence. In Proceedings of the 2024 IEEE International Symposium on Information Theory Workshops (ISIT-W), 2024, pp. 1–6. [CrossRef]
- Scagliarini, T.; Nuzzi, D.; Antonacci, Y.; Faes, L.; Rosas, F.E.; Marinazzo, D.; Stramaglia, S. Gradients of O-information: Low-order descriptors of high-order dependencies. Physical Review Research 2023, 5, 013025. [Google Scholar] [CrossRef]
- Lütkepohl, H. New introduction to multiple time series analysis; Springer Science & Business Media, 2005. [CrossRef]
- Faes, L.; Porta, A.; Nollo, G.; Javorka, M. Information decomposition in multivariate systems: definitions, implementation and application to cardiovascular networks. Entropy 2017, 19, 5. [Google Scholar] [CrossRef]
- Akaike, H. A new look at the statistical model identification. IEEE Transactions on Automatic Control 1974, 19, 716–723. [Google Scholar] [CrossRef]
- Theiler, J.; Eubank, S.; Longtin, A.; Galdrikian, B.; Farmer, J.D. Testing for nonlinearity in time series: the method of surrogate data. Physica D: Nonlinear Phenomena 1992, 58, 77–94. [Google Scholar] [CrossRef]
- Schreiber, T.; Schmitz, A. Improved surrogate data for nonlinearity tests. Physical review letters 1996, 77, 635. [Google Scholar] [CrossRef]
- Pinto, H.; Lazic, I.; Antonacci, Y.; Pernice, R.; Gu, D.; Barà, C.; Faes, L.; Rocha, A.P. Testing dynamic correlations and nonlinearity in bivariate time series through information measures and surrogate data analysis. Frontiers in Network Physiology 2024, 4, 1385421. [Google Scholar] [CrossRef]
- Anzolin, A.; Toppi, J.; Petti, M.; Cincotti, F.; Astolfi, L. Seed-g: Simulated eeg data generator for testing connectivity algorithms. Sensors 2021, 21. [Google Scholar] [CrossRef]
- Antonacci, Y.; Toppi, J.; Pietrabissa, A.; Anzolin, A.; Astolfi, L. Measuring Connectivity in Linear Multivariate Processes With Penalized Regression Techniques. IEEE Access 2024, 12, 30638–30652. [Google Scholar] [CrossRef]
- Tsonis, A.A.; Swanson, K.L.; Roebber, P.J. What Do Networks Have to Do with Climate? Bulletin of the American Meteorological Society 2006, 87, 585–596. [Google Scholar] [CrossRef]
- Faes, L.; Sparacino, L.; Mijatovic, G.; Antonacci, Y.; Ricci, L.; Marinazzo, D.; Stramaglia, S. Partial Information Rate Decomposition, 2025. arXiv:stat.ME/2502.04550].
- Smith, S.R.; Brolley, J.; O’Brien, J.J.; Tartaglione, C.A. ENSO’s impact on regional U.S. hurricane activity. Journal of Climate 2007, 20, 1404–1414. [Google Scholar] [CrossRef]
- Rodríguez-Fonseca, B.; Suárez-Moreno, R.; Ayarzagüena, B.; López-Parages, J.; Gómara, I.; Villamayor, J.; Mohino, E.; Losada, T.; Castaño-Tierno, A. A review of ENSO influence on the North Atlantic. A non-stationary signal, 2016. [CrossRef]
- Mijatovic, G.; Antonacci, Y.; Javorka, M.; Marinazzo, D.; Stramaglia, S.; Faes, L. Network Representation of Higher-Order Interactions Based on Information Dynamics. IEEE Transactions on Network Science and Engineering 2025. [Google Scholar] [CrossRef]
- Sparacino, L.; Antonacci, Y.; Mijatovic, G.; Faes, L. Measuring hierarchically-organized interactions in dynamic networks through spectral entropy rates: Theory, estimation, and illustrative application to physiological networks. Neurocomputing 2025, 630, 129675. [Google Scholar] [CrossRef]
- Varley, T.F.; Pope, M.; Faskowitz, J.; Sporns, O. Multivariate information theory uncovers synergistic subsystems of the human cerebral cortex. Communications Biology 2023, 6. [Google Scholar] [CrossRef]
- Catrambone, V.; Valenza, G. Functional brain-heart interplay: From physiology to advanced methodology of signal processing and modeling; Springer International Publishing, 2021; pp. 1–236. [CrossRef]
- Candia-Rivera, D. Brain-heart interactions in the neurobiology of consciousness. Current Research in Neurobiology 2022, 3, 100050. [Google Scholar] [CrossRef]
- Candia-Rivera, D.; Faes, L.; Fallani, F.d.V.; Chavez, M. Measures and Models of Brain-Heart Interactions. IEEE Reviews in Biomedical Engineering 2025, pp. 1–17. [CrossRef]
Figure 1.
(a) Graphical representation of the five-variate VAR(2) process, generated according to Equation (16). Each node represents a distinct scalar process , where , with arrows indicating causal interactions. Self-loops illustrate the influence of past values on the current sample. (b) Profiles of for redundancy and synergy along with the theoretical value of each measure represented in black, highlighting the most redundant (red) and most synergistic (blue) multiplets. Middle and bottom plots show the most frequently observed multiplets across 100 realizations, with the colour indicating the presence of each process in the multiplet. The ∅ denotes that none multiplet was found. Similarly, panels (c) and (d) present the results for and , respectively.
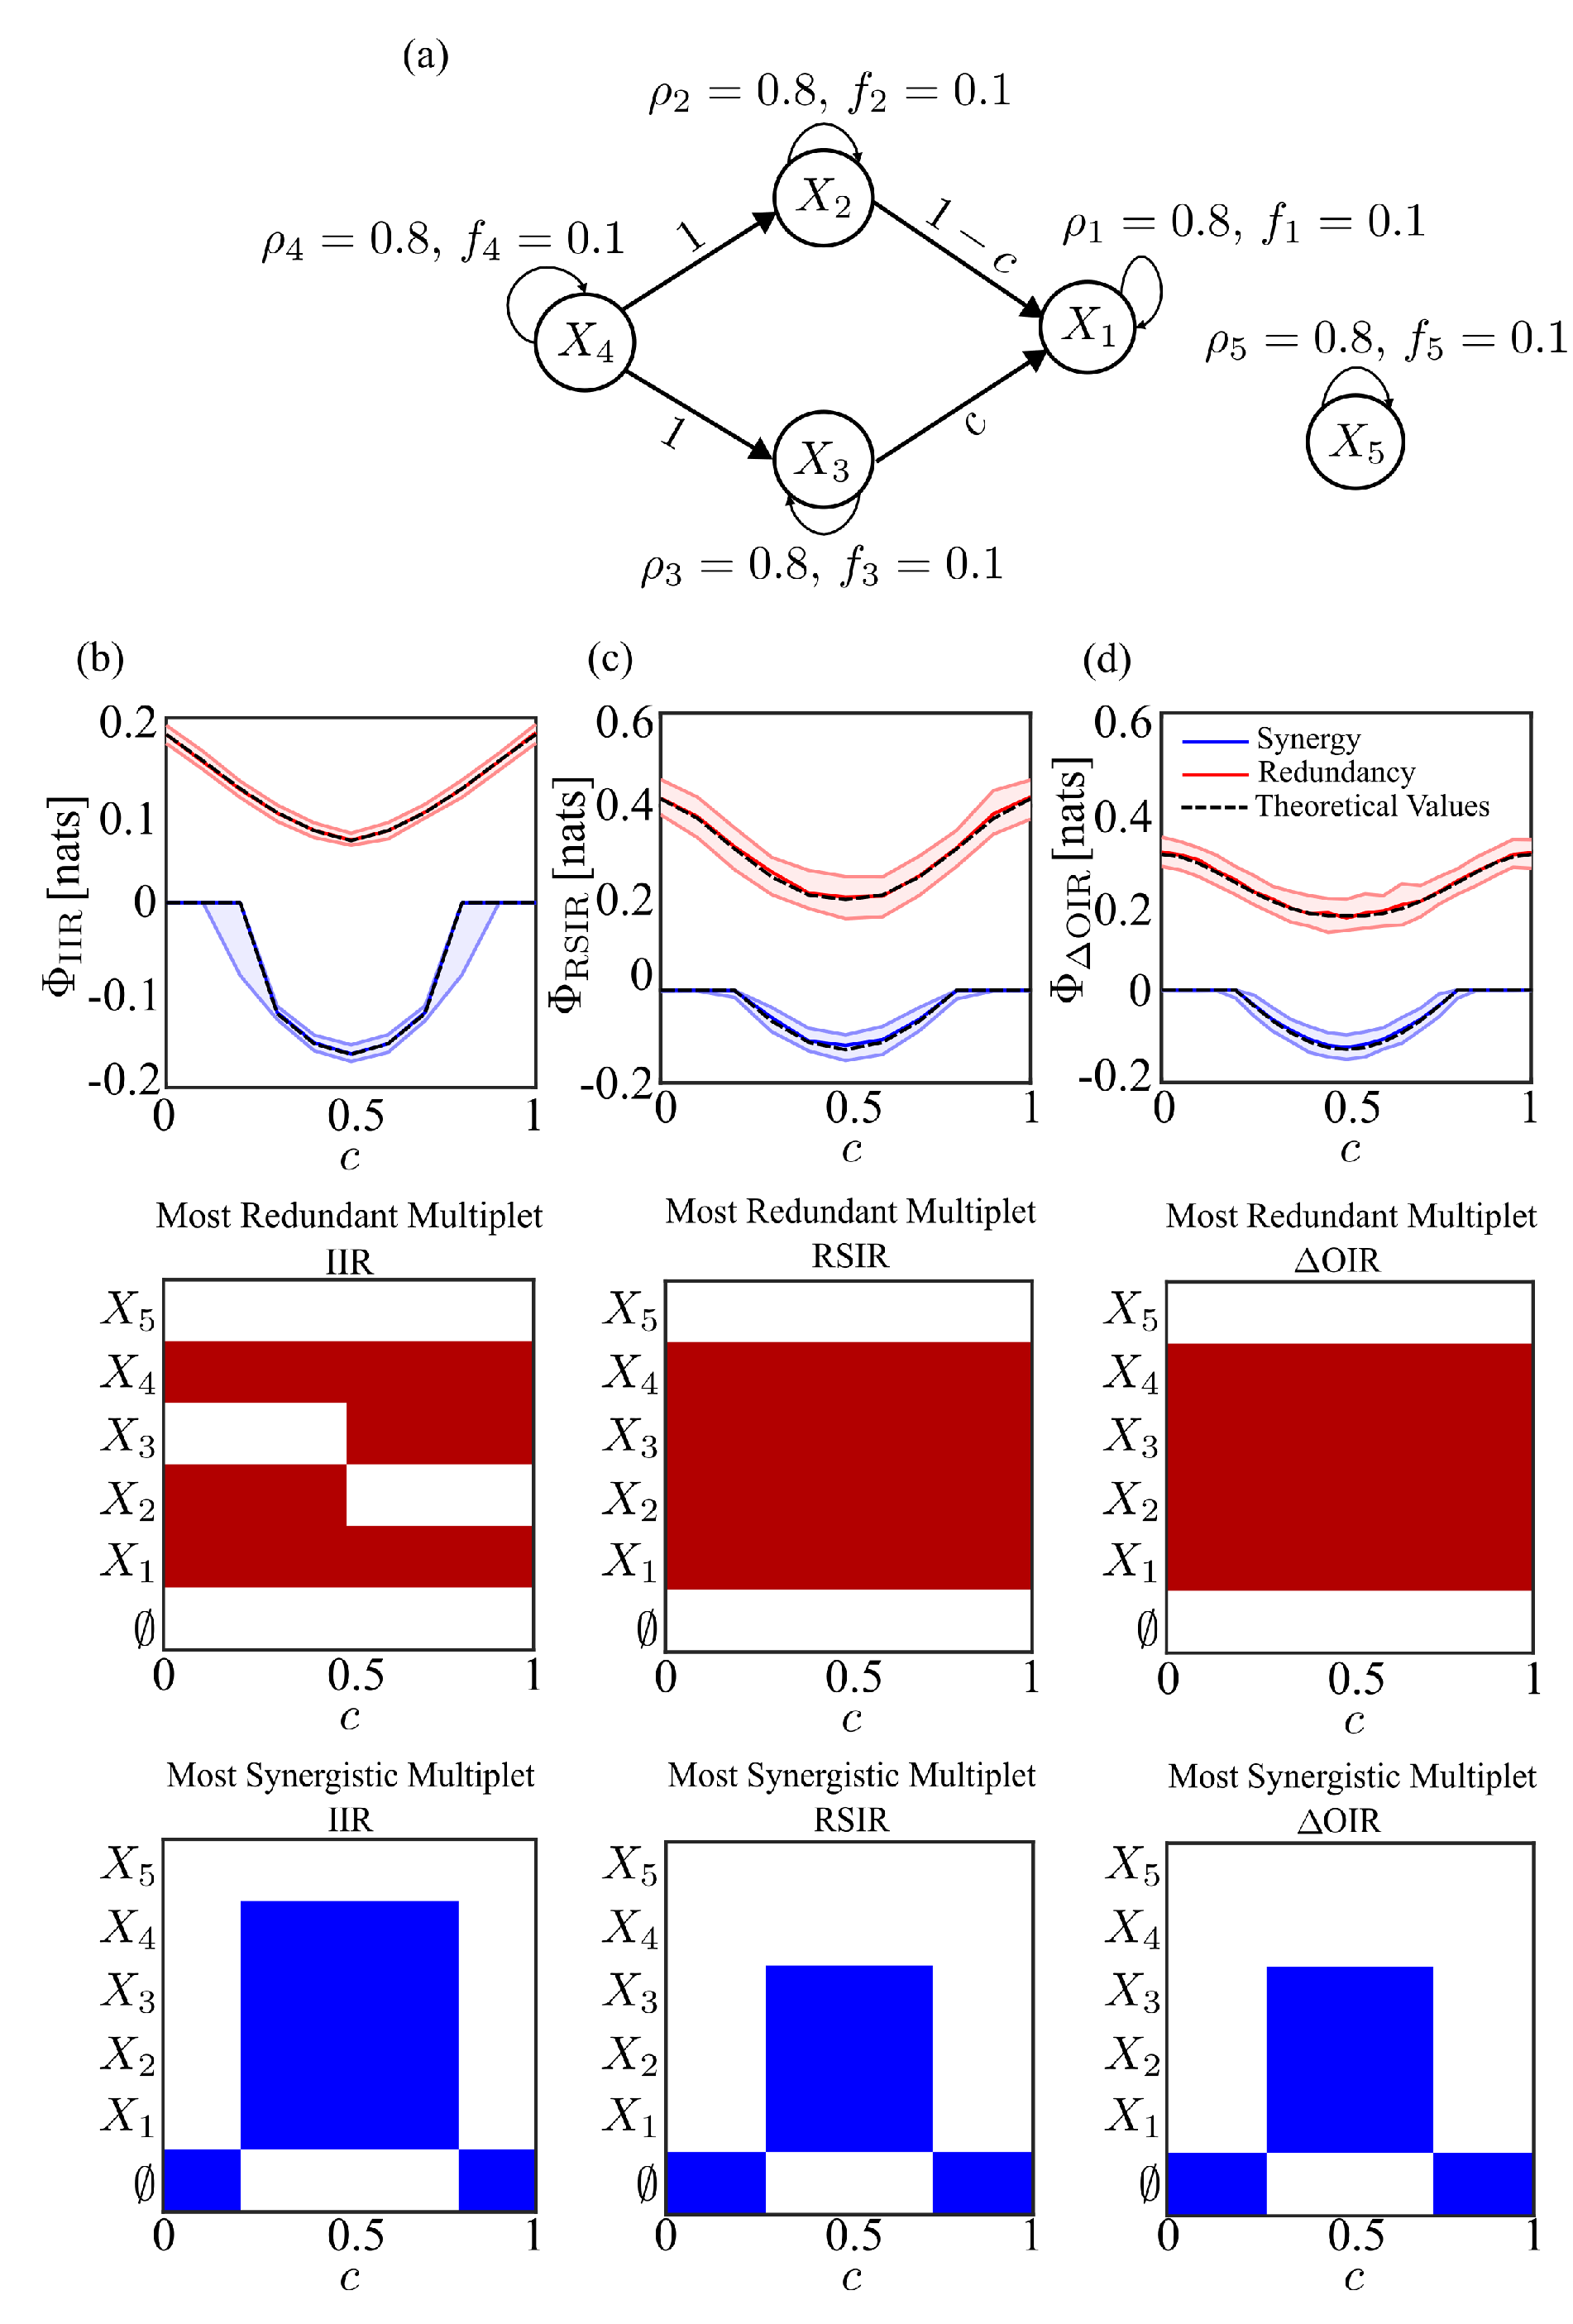
Figure 2.
(a) Graphical representation of a random network comprising 13 nodes with a density of 0.1 and (b) 0.3, respectively. The width of the arrows represents the strength of interactions — the wider the arrow, the stronger the connection between processes. Panels (c) and (d) display the distribution of redundancy (first row) and synergy (second row) for all possible targets , computed using and in random networks with densities of 0.1 and 0.3, respectively. Red points indicate outliers.
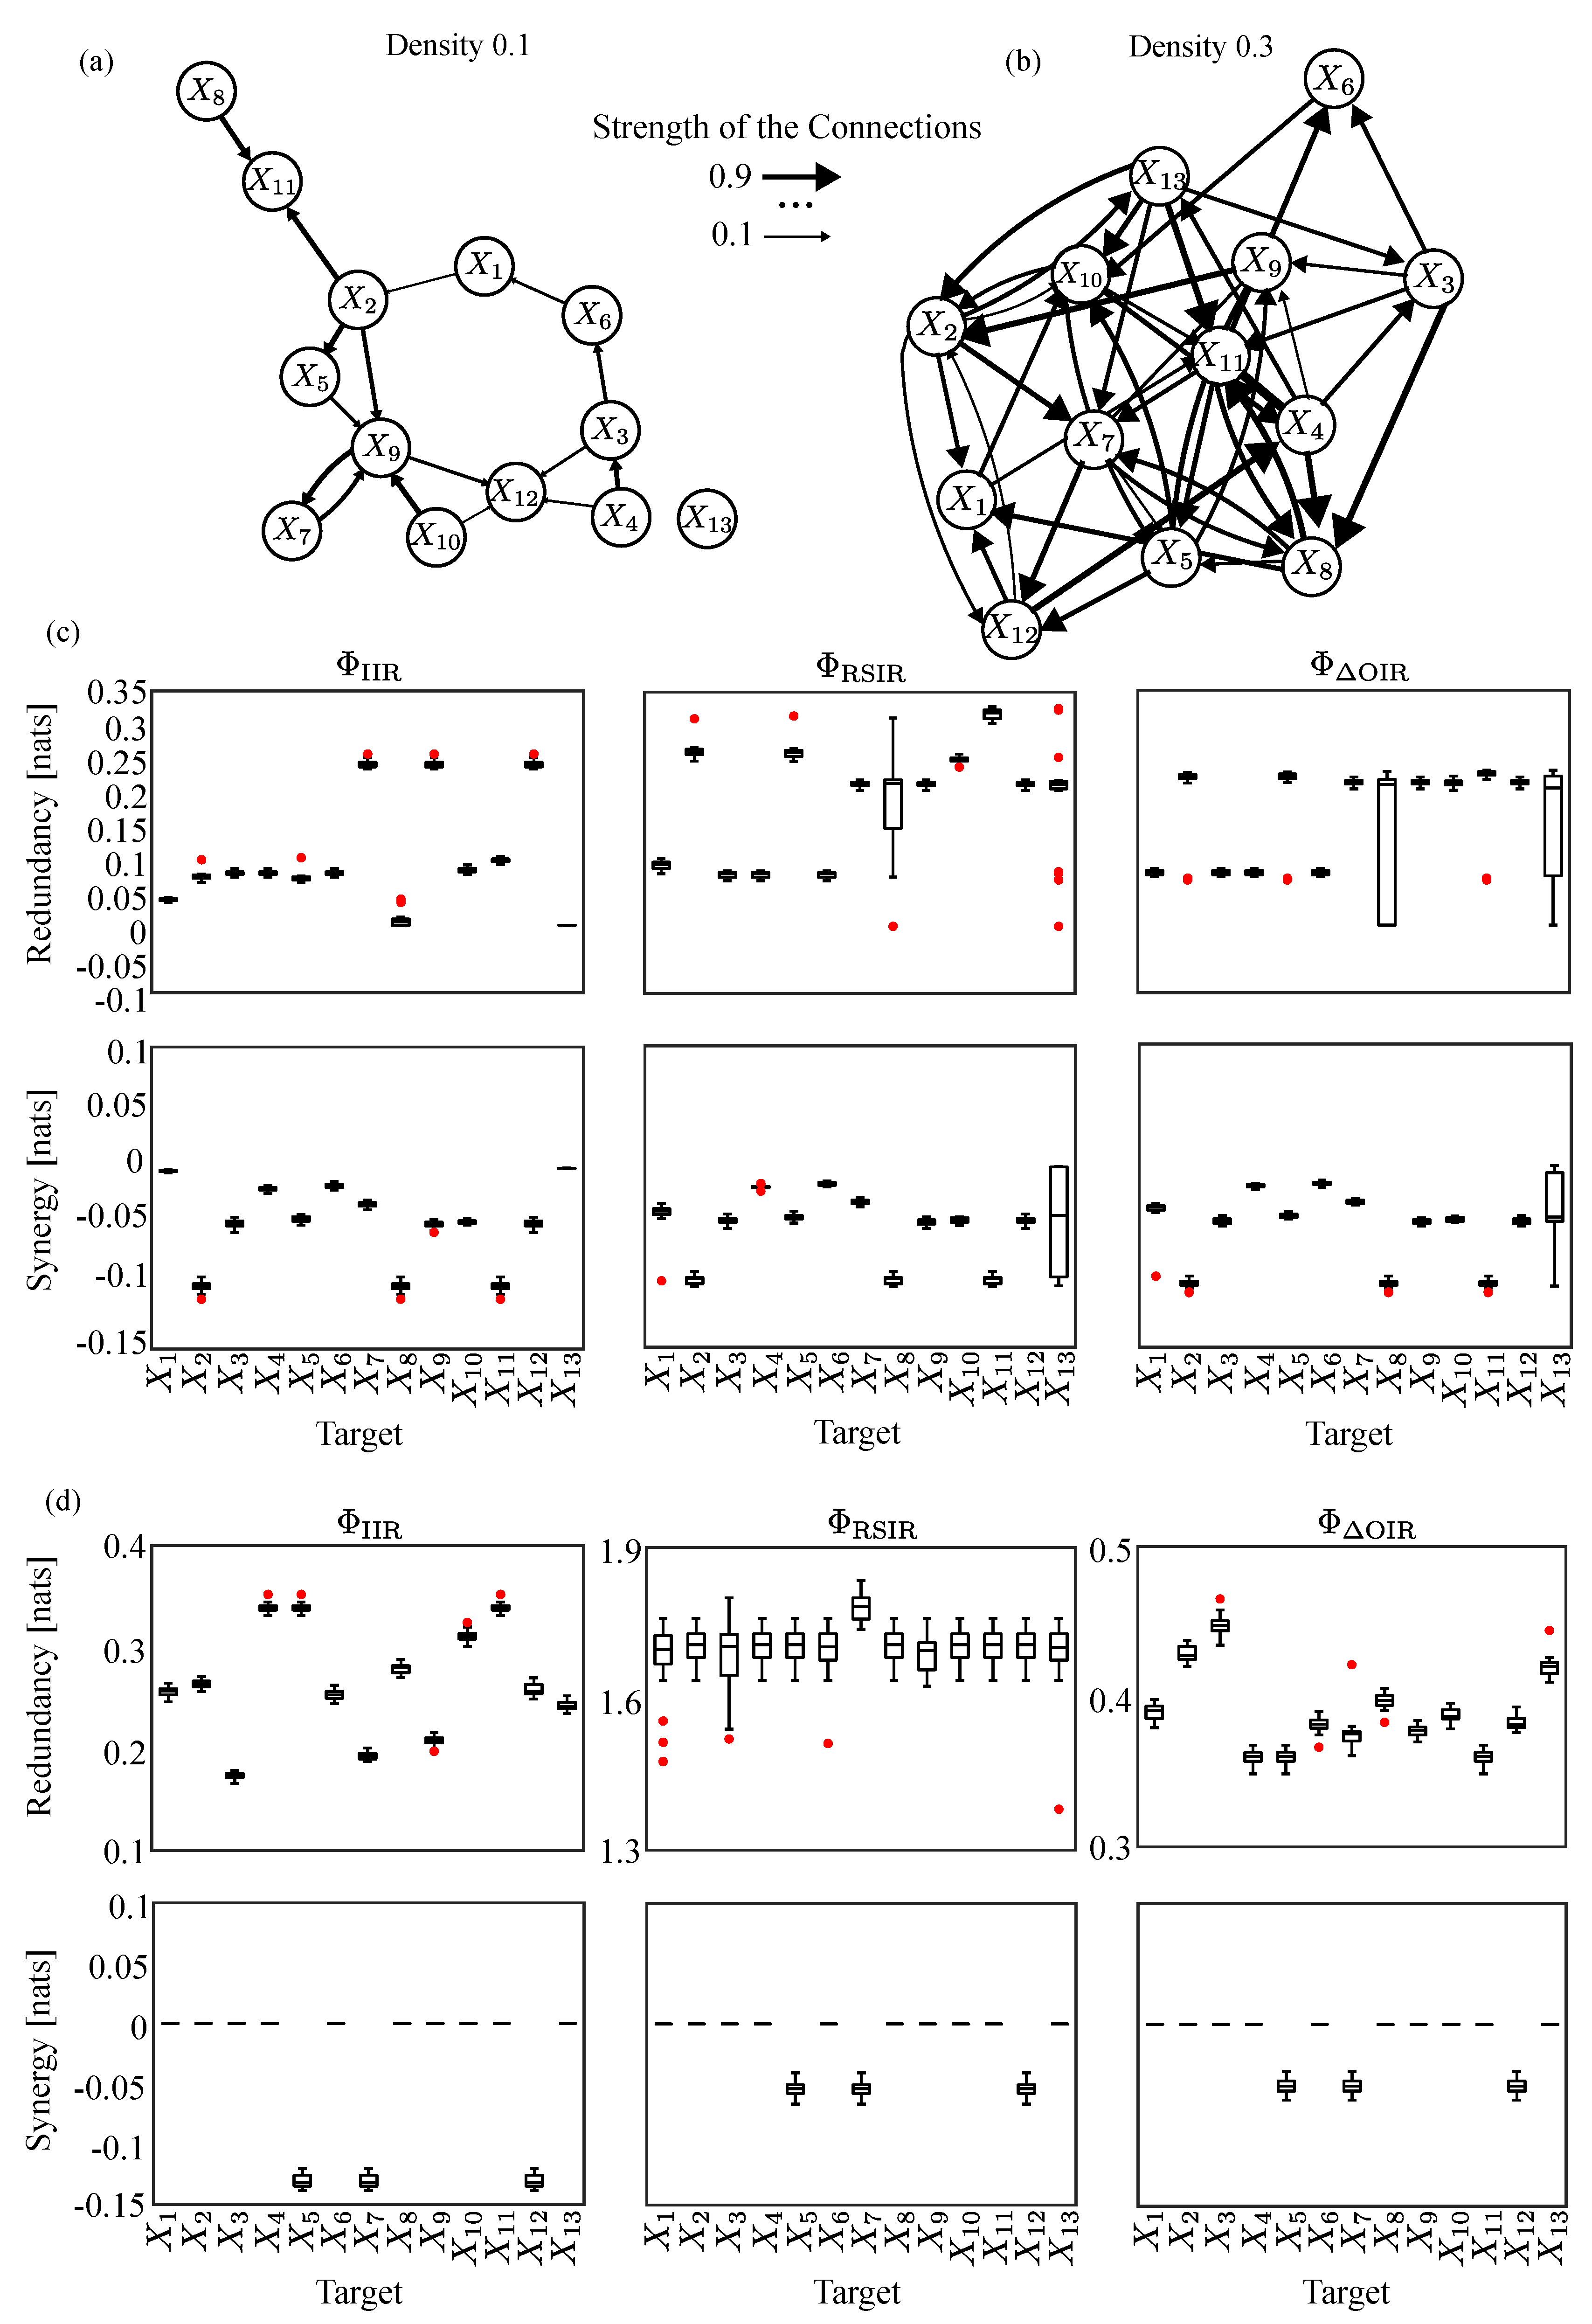
Figure 3.
Heatmaps showing the most redundant (red) and most synergistic (blue) multiplets for , , and across all possible targets in the considered climate network. The diagonal entries are highlighted in black to improve readability, as each target is inherently included in its corresponding multiplet. However, the focus is on identifying the processes that interact with each target.
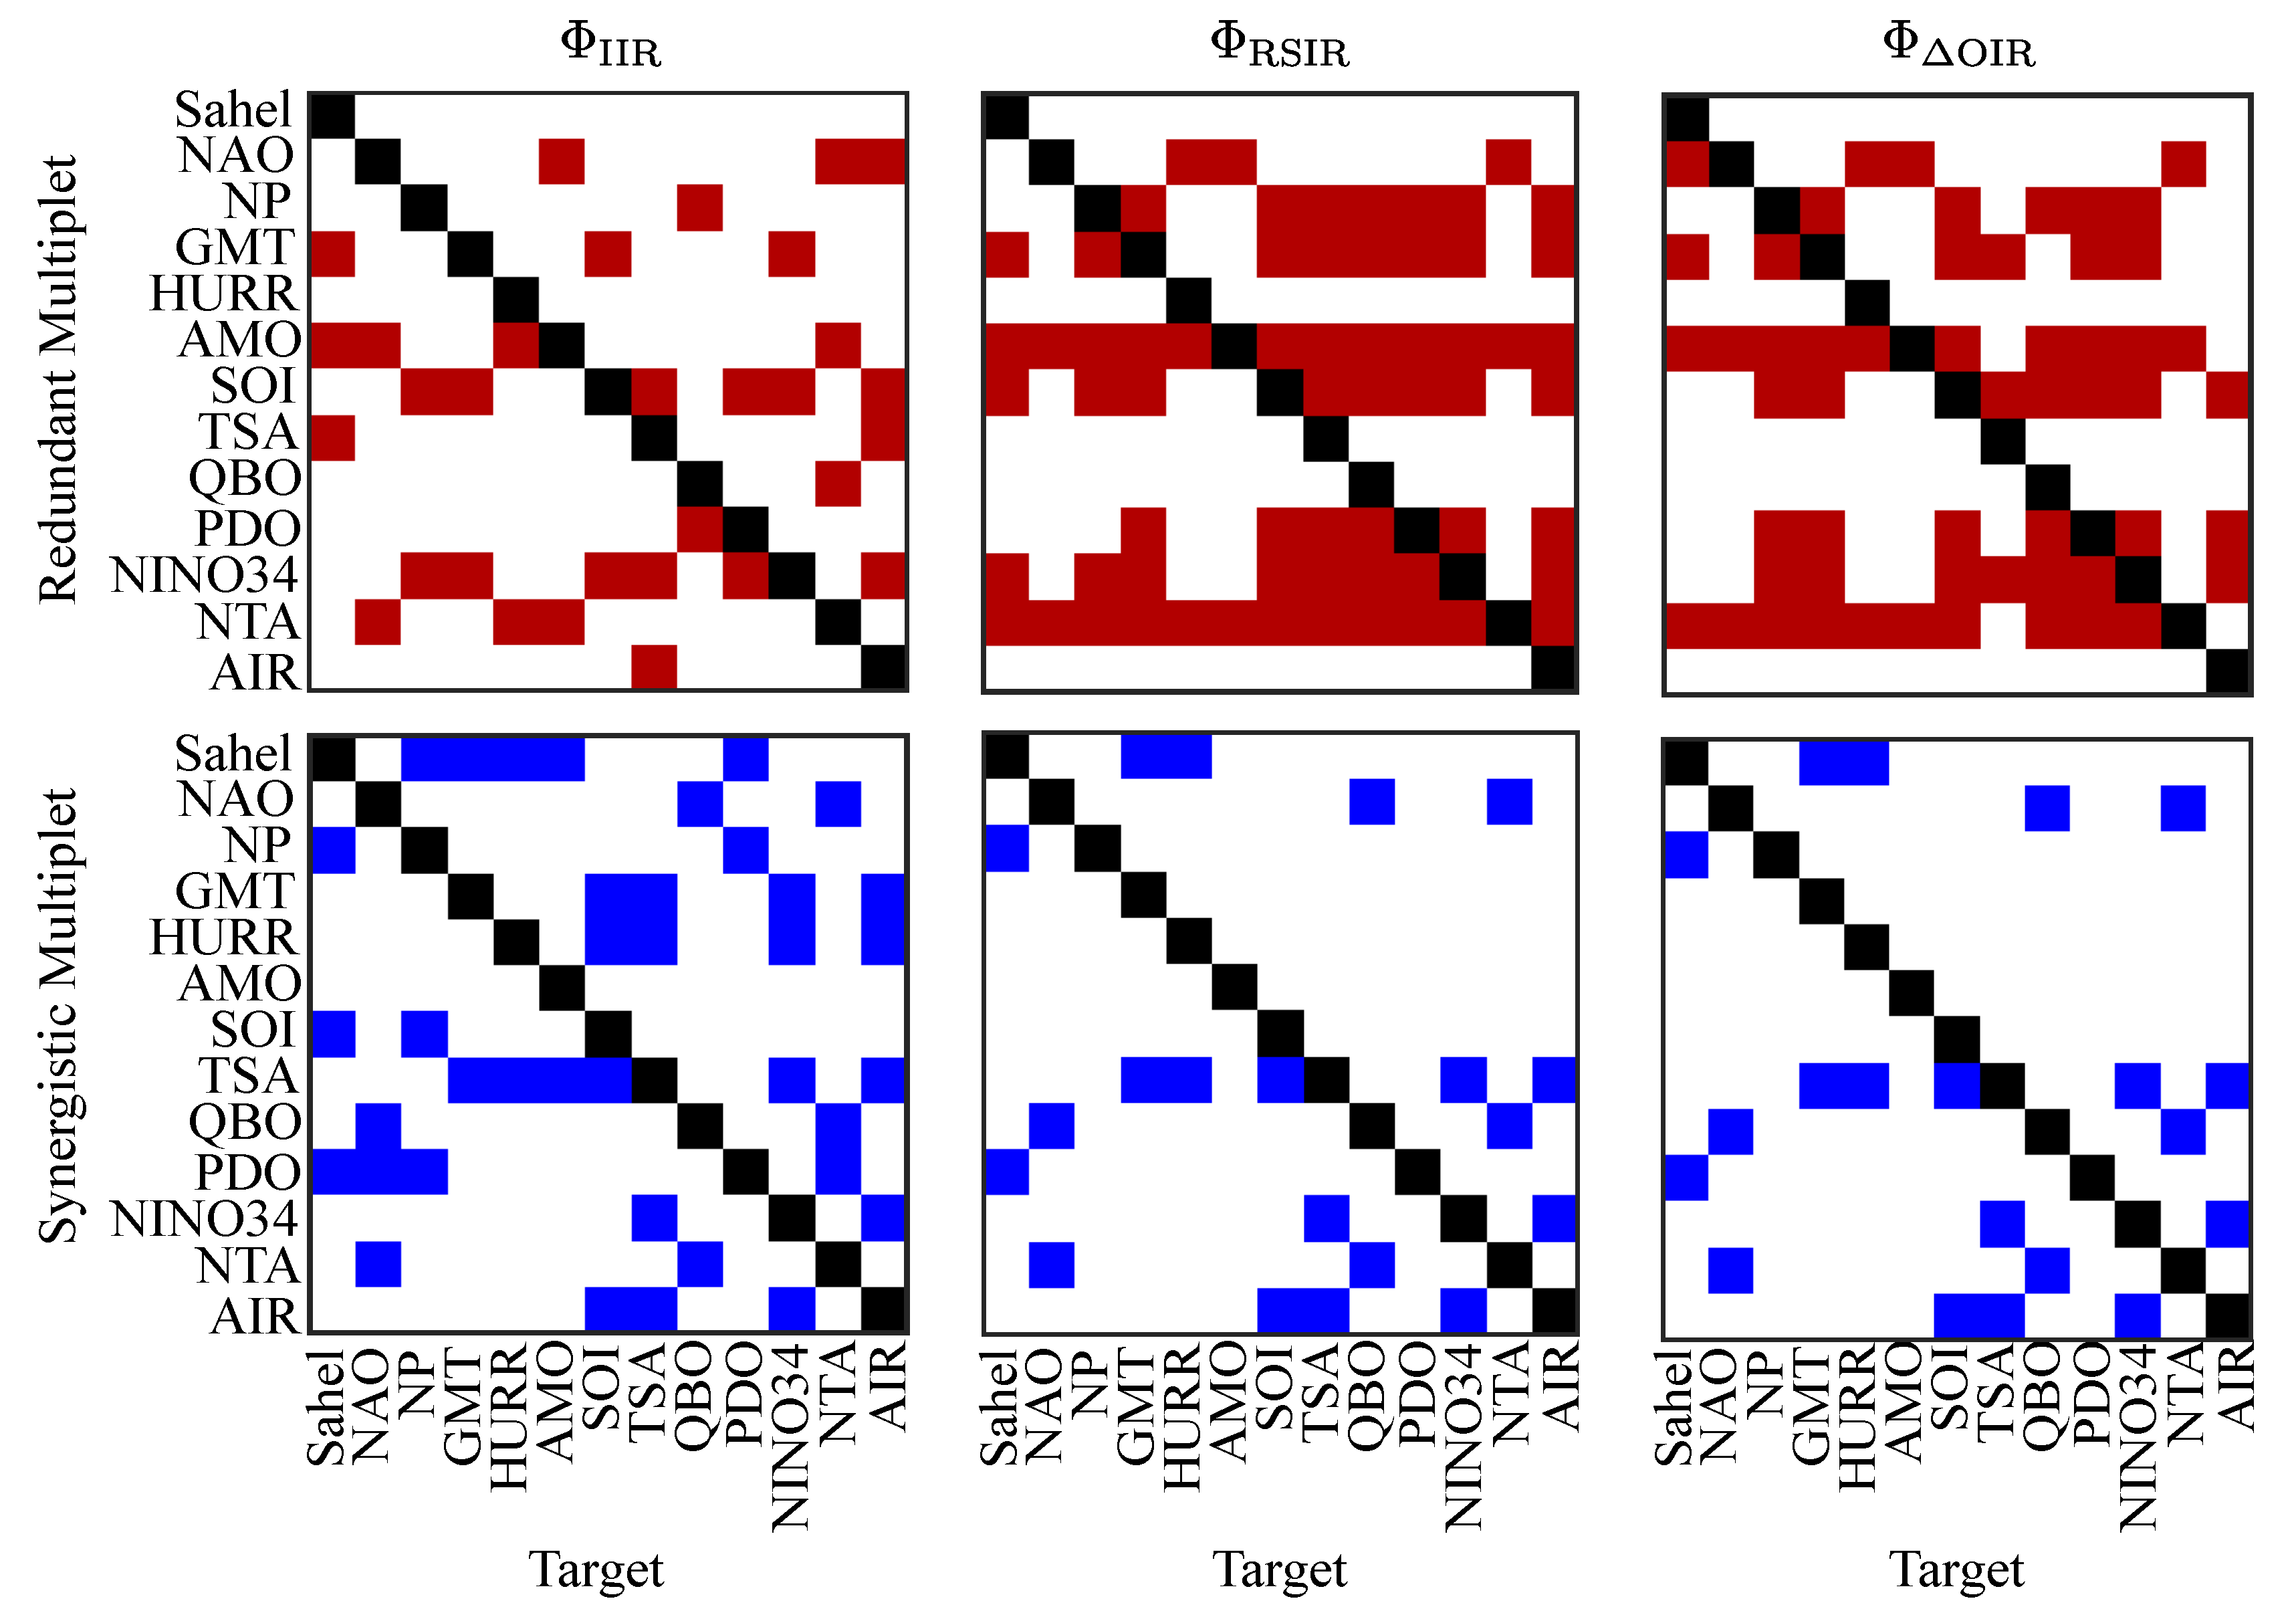

Table 1.
Theoretical values for redundancy and synergy, for , , and , obtained from the random network with parameter densities of 0.1 and 0.3, illustrated in Figure 2(a) and (b), respectively.
Table 1.
Theoretical values for redundancy and synergy, for , , and , obtained from the random network with parameter densities of 0.1 and 0.3, illustrated in Figure 2(a) and (b), respectively.
| Measure/Target | ||||||||||||||||
|---|---|---|---|---|---|---|---|---|---|---|---|---|---|---|---|---|
| Density 0.1 | Redundancy | 0.0391 | 0.0710 | 0.0783 | 0.0783 | 0.0690 | 0.0783 | 0.2430 | 0 | 0.2430 | 0.0835 | 0.0975 | 0.2430 | 0 | ||
| 0.0932 | 0.2589 | 0.0783 | 0.0783 | 0.2574 | 0.0783 | 0.2126 | 0.1174 | 0.2126 | 0.2482 | 0.3154 | 0.2126 | 0.1174 | ||||
| 0.0783 | 0.2209 | 0.0783 | 0.0783 | 0.2206 | 0.0783 | 0.2126 | 0.1025 | 0.2126 | 0.2118 | 0.2252 | 0.2126 | 0.1025 | ||||
| Synergy | -0.0026 | -0.0968 | -0.0457 | -0.0169 | -0.0419 | -0.0150 | -0.0296 | -0.0968 | -0.0457 | -0.0440 | -0.0968 | -0.0457 | 0 | |||
| -0.0377 | -0.0968 | -0.0457 | -0.0169 | -0.0419 | -0.0150 | -0.0296 | -0.0968 | -0.0457 | -0.0440 | -0.0968 | -0.0457 | -0.0227 | ||||
| -0.0348 | -0.0968 | -0.0457 | -0.0169 | -0.0419 | -0.0150 | -0.0296 | -0.0968 | -0.0457 | -0.0440 | -0.0968 | -0.0457 | -0.0208 | ||||
| Density 0.3 | Redundancy | 0.2544 | 0.2624 | 0.1728 | 0.3388 | 0.3388 | 0.2514 | 0.1921 | 0.2781 | 0.2091 | 0.3102 | 0.3388 | 0.2564 | 0.2395 | ||
| 1.7048 | 1.7048 | 1.6904 | 1.7048 | 1.7048 | 1.7048 | 1.7843 | 1.7048 | 1.6856 | 1.7048 | 1.7048 | 1.7048 | 1.7048 | ||||
| 0.3912 | 0.4293 | 0.4472 | 0.3609 | 0.3609 | 0.3819 | 0.3739 | 0.3982 | 0.3787 | 0.3895 | 0.3609 | 0.3848 | 0.4211 | ||||
| Synergy | 0 | 0 | 0 | 0 | -0.1368 | 0 | -0.1368 | 0 | 0 | 0 | 0 | -0.1368 | 0 | |||
| 0 | 0 | 0 | 0 | -0.0533 | 0 | -0.0533 | 0 | 0 | 0 | 0 | -0.0533 | 0 | ||||
| 0 | 0 | 0 | 0 | -0.0533 | 0 | -0.0533 | 0 | 0 | 0 | 0 | -0.0533 | 0 |
Table 2.
Values of redundancy and synergy obtained using , , and , considering all possible network processes as targets.
Table 2.
Values of redundancy and synergy obtained using , , and , considering all possible network processes as targets.
| Measure\Target | Sahel | NAO | NP | GMT | HURR | AMO | SOI | TSA | QBO | PDO | NINO34 | NTA | AIR | |
|---|---|---|---|---|---|---|---|---|---|---|---|---|---|---|
| Redundancy | 0.0090 | 0.0194 | 0.0162 | 0.0188 | 0.0069 | 0.0194 | 0.0188 | 0.0083 | 0.0034 | 0.0185 | 0.0188 | 0.0204 | 0.0165 | |
| 0.0514 | 0.0194 | 0.0492 | 0.0485 | 0.0213 | 0.0194 | 0.0485 | 0.0499 | 0.0591 | 0.0581 | 0.0485 | 0.0194 | 0.0636 | ||
| 0.0178 | 0.0194 | 0.0237 | 0.0237 | 0.0188 | 0.0194 | 0.0237 | 0.0205 | 0.0277 | 0.0288 | 0.0237 | 0.0194 | 0.0198 | ||
| Synergy | -0.0029 | -0.0023 | -0.0029 | -0.0021 | -0.0007 | -0.0012 | -0.0033 | -0.0037 | -0.0021 | -0.0022 | -0.0037 | -0.0023 | -0.0037 | |
| -0.0022 | -0.0021 | -0.0022 | -0.0021 | -0.0007 | -0.0012 | -0.0024 | -0.0025 | -0.0021 | -0.0022 | -0.0025 | -0.0021 | -0.0025 | ||
| -0.0022 | -0.0021 | -0.0022 | -0.0021 | -0.0007 | -0.0012 | -0.0024 | -0.0025 | -0.0021 | -0.0022 | -0.0025 | -0.0021 | -0.0025 |
Disclaimer/Publisher’s Note: The statements, opinions and data contained in all publications are solely those of the individual author(s) and contributor(s) and not of MDPI and/or the editor(s). MDPI and/or the editor(s) disclaim responsibility for any injury to people or property resulting from any ideas, methods, instructions or products referred to in the content. |
© 2025 by the authors. Licensee MDPI, Basel, Switzerland. This article is an open access article distributed under the terms and conditions of the Creative Commons Attribution (CC BY) license (http://creativecommons.org/licenses/by/4.0/).
Copyright: This open access article is published under a Creative Commons CC BY 4.0 license, which permit the free download, distribution, and reuse, provided that the author and preprint are cited in any reuse.


