Submitted:
13 May 2025
Posted:
13 May 2025
You are already at the latest version
Abstract
The mean force between two highly like-charged macroions in the presence of monovalent counterions and added multivalent salt, within solvents of varying dielectric constants has been studied using Monte Carlo simulations. Without additional salt, the mean force is strongly repulsive at all macroion separations in solvents with a dielectric constant ϵr ≥ 30. However, in solvents having ϵr ≤ 30, the macroions experience effective attraction, indicating that attractive interactions between highly charged macroions can occur even without multivalent salt in nonpolar solvents with low dielectric constants. At a multivalent counterion-to-macroion charge ratio of β = 0.075, the mean force becomes attractive at short separations in solvents with ϵr = 54 containing 1:3 salt, as well as in all solvents with 1:5 salt, while still exhibiting significant repulsion at longer separations. In contrast, for solvents with 1:3 salt and dielectric constants ϵr = 68 and ϵr = 78.4, the mean force turns attractive at a higher salt concentration, around β = 0.225. The shift of the mean force to an attractive state at short separations signifies charge inversion on the macroion surface when a sufficient amount of salt is present. At a stoichiometric ratio of multivalent counterions, long-range repulsion vanishes, and attraction becomes significant. However, with excess salt, the strength of the attractive mean force diminishes. Additionally, the attractive force at a given salt concentration increases as the dielectric constant decreases and is stronger in systems with 1:5 salt than in those with 1:3 salt.
Keywords:
dielectric constant
; macroions
; electrostatic interaction
; Monte Carlo simulations
; charge inversion
1. Introduction
Charged colloids are widely present in diverse biological and technological applications. Examples include micelles formed by charged surfactants, latex particles, proteins, silica particles, and microemulsions created by water, oil, and charged surfactants. The physicochemical characteristics of these colloidal solutions are controlled by electrostatic interactions [1]. In order to comprehend the behavior of electrostatic interactions in colloidal suspensions, a variety of models have been used in theoretical and computational techniques [2,3,4,5,6,7,8]. The basic model is a helpful model that may be used to study the intercolloidal structure of colloidal solutions and the distribution of tiny ions close to the charged colloids [9]. This model treats the solvent as a dielectric medium and depicts charged colloids and tiny ions as hard, electrically charged spheres [10,11,12].
The coulomb interactions in colloidal systems are primarily analyzed using the Poisson-Boltzmann (PB) mean field theory, where ions are treated as point charges and the solvent is represented as a dielectric medium. The results from PB theory for systems with weakly charged particles and low concentration of monovalent salts align well with experimental observations. However, PB theory overlooks ion and electrostatic potential fluctuations. As a result, it has limitations and requires corrections, particularly when dealing with multivalent ions, highly charged colloids, polyelectrolytes, and other macroions [13,14].
In systems of charged colloids, the repulsive forces between particles are reduced by the presence of small ions, a process known as Coulomb screening. This mechanism is fundamental to understanding a wide range of disciplines, including polymer physics, nanofluidics, colloid science, and molecular biophysics. When multivalent counterions are present, attraction occurs between like-charged colloids [5], a phenomenon known as charge inversion or overchargeing [15]. This effect arises from the correlations between counterions that emerge at short distances and high surface charge densities [10]. Charge inversion has been observed and explored through numerical simulations [5,6]. It happens when the effective charge of a surface exposed to a solution flips as a result of an excess of counterions accumulating near the surface. Charge inversion is significantly influenced by the valence Z of the ions [5,16]. Additionally, Besteman et al. [17] used atomic force spectroscopy to examine the effects of solvent dielectric constant and surface charge density on charge inversion. They discovered that the concentration of multivalent salt needed for charge inversion to occur can be decreased by decreasing the solvent’s dielectric constant and raising the surface charge density. Allahyarov etal.’s computer simulations of the electrolyte’s primitive model [18] showed that the concentration of salt has a significant impact on the efficient interaction between colloidal particles that are lightly charged in solvents with a low or moderate dielectric constant. Additionally, even at low concentrations of monovalent salt, the interaction between like-charged colloids is attractive, whereas when salt is absent, the interaction is repulsive.
The effect of the dielectric constant on the zeta potential of highly charged colloidal particles in solvents ranging from polar (e.g., water) to nonpolar, with multivalent salts present, was studied through primitive Monte Carlo (MC) simulations [19]. Results indicate that the zeta potential (ξ) decreases with a lower dielectric constant and declines further as salinity and salt valency increase. To build on these findings, we extend our study by employing Monte Carlo (MC) simulations to examine how the medium’s dielectric constant influences charge inversion between two highly charged colloids in asymmetric electrolyte solutions. Here, we extend our study by applying Monte Carlo (MC) simulation to investigate the dependence of charge inversion between highly charged colloids in asymmetric electrolyte solutions on the dielectric constant of the medium.
2. Model and Method
2.1. Model
The primitive model, in which macroions are represented as hard spheres with a radius of RM = 20 Å and a charge of ZM = -60, is used to analyze systems of asymmetric electrolytes. With a radius of RI = 2 Å and charges of ZI = +1, +2, and +3, counterions are represented as charged hard spheres. The solvent’s dielectric constant is used to incorporate it into the model. Small ions with a radius of 2 Å make up added salt. These include cations with valences of +3 and +5, as well as monovalent anions with Za = -1. The ratio of the total charge of the additional cation charge to the total charge of the macroion, = where is the number density of the respective kinds, determines the amount of salt that is added.
A simulation cell with a radius of Rcyl = 80 Å and a length of Lcyl = 398 Å was defined using a cylindrical confinement technique. Two macroions (NM = 2) were symmetrically positioned along the symmetry axis within this cell. NI = |ZM/ZI|NM was used to determine the proper amount of counterions to introduce in order to maintain charge neutrality. The total potential energy U of the cylindrical system, which is electrostatically isolated from its surroundings, can be found using the following formula:
where Uhs representing
the hard sphere repulsion, is defined by
with
where rij is the center-to-center distance between the particles i and j, where i and j stand for a macroion, a monovalent counterion, a multivalent counterion, or a coion. The definition of the electrostatic interaction Uelec is
with
where e is the elementary charge, is the vacuum permittivity, is the solvent’s relative permittivity, and Zi and Zj are the charges of particles i and j, respectively. In Eq. (1), the confinement potential energy Uext is provided by
with
All systems maintained the macroion number density , which corresponds to a macroion volume charge fraction . T = 298 K was chosen as the temperature.
The distance between two unit charges where
their Coulomb interaction equals the thermal energy is defined by the Bjerrum
length, . The dielectric constants and matching Bjerrum lengths for the solvents investigated in this investigation are shown in Table 1.
2.2. Method and Simulation Settings
Metropolis Monte Carlo (MC) simulations within the canonical ensemble (constant temperature, volume, and particle count) were used to solve the model. Eqs. (1–8) were used to get the mean force. The two macroions were initially positioned symmetrically along the cylindrical cell’s axis, with z = 0 at its center. The fixed separations were usually between 42 Å and 80 Å. Initially, tiny ions were dispersed at random throughout the cylindrical cell, and their locations were subjected to trial displacement. Production runs, which usually had 106 trail moves per particle, were carried out following the equilibration phase. The integrated Monte Carlo/molecular dynamics/Brownian dynamics simulation program MOLSIM [20] was used for all of the simulations.
2.3. Mean Force and Potential of Mean Force
The effective interactions between two macroions have been analyzed before, using the cylindrical cell technique [6,21]. The effective interaction is widely thought to be only marginally impacted by the particular form of the cylindrical cell, even though it is influenced by the cell size due to counterion entropy [22]. When projected onto the interparticle vector r, the mean force F acting on macroion M is represented as
indicating an ensemble average over the particle’s positions, where F(r) > 0 indicates a repulsive mean force and F(r) < 0 indicates an attractive mean force. The associated mean force potential (pmf) is defined as Upmf (r), where
F(r) and both get closer to 0 when r gets
large enough.
The force is a mean force rather than an effective one because the macroions and their counterions are restricted within a cell, approximating the effect of the surrounding electrolyte [23]. There are several ways to express the mean force operating on a single macroion based on the broad concepts of regional equilibrium [20]. F(r) is divided in one such form as follows:
where:
and
while Fhs(r) and Felec(r) are average forces that emerge across the plane at z = 0 and originate from the hard-sphere repulsion between tiny ions and the electrostatic interaction between all the charged particles, respectively, the term Fidesl(r) arises from the variation in the transfer of linear moments of the tiny ions across the planes z = 0 and z = Lcyl/2. The number density of small ion types i in the plane , averaged across the cylindrical cross-sectional area A, is represented by in eq. 11. Only particle pairs situated on opposite sides of the plane z = 0 should be taken into consideration, according to the prime in the summation of eqs. (12) and (13). Fideal(r) is mostly governed by the term for r Lcyl/2.
3. Results and Discussion
3.1. Salt-Free Solvents
For a 60:1 system in different solvents with dielectric constants given in Table 1, Figure 1a shows the mean force between two like-charged macroions and their counterions trapped in a cylindrical cell as a function of macroion spacing r (Å). The potential of mean force pmf, promoted by integrating the mean force using Eq. (10), is shown in Figure 1b.
The figures show that the mean force and pmf are strongly repulsive and increase monotonically for monovalent counterions in solvents with dielectric constants of 78.4, 68, 54, and 40. A vertical shift is used to make sure the potential of mean force pmf approaches zero as r→∞ since the mean force stays positive at the largest separation, r = 80 Å. The effective long-range repulsion is essentially nonexistent in a solvent with a dielectric constant of 30, and the mean force approaches attractiveness between r = 45 Å and 48 Å. At r = 45 Å, the pmf correspondingly displays a shallow minimum. The mean force for solvents with < 30 is only nonzero at short separations; it is repulsive for r < 44 Å and attractive between 44 and 55 Å. The macroion-macroion surface distance equal to the counterion’s diameter coincides with the 44 Å spacing. The pmf minimum is roughly -5 kT, -10 kT, and -20 kT for solvents with dielectric constants of 20, 15, and 10, respectively. In these instances, monovalent counterions operate as a mediator between the macroions, facilitating their effective attraction to one another. This implies that the attractive interaction between highly charged colloids may take place in a fluid with a low dielectric constant and without salt. In contrast, E. Allahyarov et al. [18] found that, in the absence of salt, weakly charged colloids interacted repulsively with monovalent counterions in liquids with moderate and low dielectric constants. The charged surface’s counterion-counterion coupling parameter, Γ, was less than two in their system. And the correlation-induced attraction is known to occur at 2 [5,11]. Here, the intensity of electrostatic interactions is described by , which can be raised by decreasing the solvent’s dielectric constant. The Bjerrum length is , and the average distance between two nearby counterions on a surface with a surface charge density of σ is denoted by Table 2 displays the determined coupling parameters for each system between the counterions on the charged surface. While the solvent with = 30 corresponds to = 2.04 , the solvents with dielectric constants of 20, 15, and 10 correspond to Γ = 3.058, 4.078, and 6.117, respectively, which are more than 2, while the solvents with dielectric constants of 78.4, 68, 54, and 40 have values of Γ< 2. As the solvent’s dielectric constant drops, an attractive force shows that charge inversion has taken place on the macroion’s surface. This is seen in solvents with = 20, 15, and 10.
The distribution of counterions surrounding the macroion in a 60:1 system with various solvents is shown in Figure 2. Figure 2h demonstrates unequivocally how the strong polarity of the aqueous solvent, which has a high dielectric constant of 78.4 at 298 K, influences the separation of counterions from the macroion surface while maintaining the stability of the colloidal system. When moving from aqueous to less polar solvents, the counterions’ dissociation from the macroion surface decreases, and they get closer to the macroion’s surface, which lowers the solvent’s dielectric constant from 78.4 to low values, as seen in Figure 2. Figure 2a shows that the counterions are compacted and firmly adhered to the macroion’s surface in a solvent with a dielectric constant of 10.
By computing the macroion-counterion radial distribution functions (rdfs), which characterize the relative densities of counterions at a distance r from the macroion, the distribution of monovalent counterions close to the macroions has been investigated. Systems of uncorrelated particles are represented by the horizontal dotted line, where rdfs equals unity in the bulk. We used a spherical cell with one macroion and an equal number of monovalent counterions in our investigation. The findings shed light on how counterions are distributed around a particular macroion that is distinct from other macroions. Figure 3 displays the rdfs of macroion-counterions in various solvents. The accumulation of the counterions close to the macroion is indicated by the peak in the figure at the hard sphere contact separation r = RM + 2RI = 22 Å for the macroion-counterion rdfs. The contact value is 633 at = 10. The contact value drops monotonically as the solvent’s dielectric constant rises, reaching a value of 120 at = 78.4.
For reference, the equivalent mean forces with different counterion valences but without added salt are shown. Figure 4 shows the emergence of attractive interactions with divalent (Γ=2.3, 2.5, 3.1, and 4.2) and trivalent (Γ=4.1, 4.7, 5.7, and 7.8) counterions in solvents with dielectric constants of 78.4, 68,54, and 40. On the other hand, the typical image of a like-charged macroion displaying effective repulsion is seen for monovalent counterions. As seen in table (2), attraction between monovalent and multivalent counterions happens in solvents with low dielectric constants < 30 and no salt because the coupling parameters are bigger than Γ^* ≈ 2. Where the minimum is getting deeper than with divalent counterions, the attraction is strongest with trivalent counterions and weakest with monovalent ones. Because a higher coupling parameter indicates a stronger electrostatic connection, the attraction rises as the dielectric constant falls.
3.2. Solvents with the Presence of Added Salt
The electrostatic interactions between macroions can be modulated by adding salt to the solution, as the presence of additional counterions and coions enhances screening and reduces repulsion [5,6,8]. Under varying concentrations of 1:3 and 1:5 salts, respectively, Figure 5 and Figure 6 show the mean force between two like-charged macroions in a 60:1 system as a function of their separation distance r. For solvents with dielectric constants of 78.4, 68, and 54, the findings are shown. The three solvents’ mean force curves show notable variations with salt concentration. The repulsive mean force first becomes weaker across all separations, with the greatest decrease seen at short distances, as the concentration of simple salt rises. Then, the mean force changes to an attractive interaction. Later, the attractive force’s strength and range increase, while the long-range repulsion disappears. Finally, the attractive force’s magnitude decreases. Interestingly, a considerable initial decrease in repulsion can be induced with a very modest amount of salt. Additionally, the commencement of attraction at short separation happens as early as β = 0.075 in a solvent with = 54 that contains 1:3 salt and in all solvents with 5:1 salt. On the other hand, attraction appears at greater salt concentrations (β > 0.075) for solvents with a 1:3 salt content and dielectric constants of = 68 and 78.4. In accordance with Linse et al. [21], the maximum attraction is seen close to β = 1, although it diminishes at β = 6.25.
The 60:1 systems with dielectric constants of = 78.5, 68, and 54 (Figures 3a–3c) have mean forces that are quite similar to those of the 60:1 systems at β = 1 for the 1:3 salt (Figures 4a–4c). This extra electrolyte has very little effect on screening the attractive mean force since the 60:1 systems at β = 1 can be thought of as the result of adding a 1:1 electrolyte to the 60:3 systems. In contrast to solvents with dielectric values of 68 and 78.4, the decrease in repulsive force is more noticeable in the solvent with a dielectric constant of 54. Likewise, because the coupling parameters in 1:5 salt systems are higher than those in 1:3 salt systems, the reduction proceeds more quickly in the former than in the latter. In particular, for dielectric constants of 78.4, 68, and 54, the coupling parameter values for solvents containing 1:3 salt are 4.1, 4.7, and 5.7, respectively, whereas for 1:5 salt, they are 8.9, 10.1, and 12.3 (Table 2).
When there is enough salt present, the repulsive mean force changes to an attractive one at short separations (around 42 Å < r < 50 Å), indicating charge inversion on the macroion surface in solvent. In solvents with = 54 that contain 1:3 salt and in all solvents that include 1:5 salt, this inversion takes place at β = 0.075. On the other hand, charge inversion is seen at a larger concentration, approximately β ≈ 0.225, for liquids with 1:3 salt and dielectric constants of = 68 and 78.4. These findings imply that when the dielectric constant falls, the attractive force at a given concentration rises. Because of the greater coupling parameter (Table 2), Figure 7 illustrates a stronger attraction in 1:5 salt systems compared to 1:3.
4. Conclusions
Monte Carlo simulations using a cylindrical cell model containing two highly charged macroions were conducted to determine the mean force between them under varying salt concentrations and solvent dielectric constants. In the absence of additional salt, the repulsive mean force observed with monovalent counterions progressively weakens and eventually becomes purely attractive as the counterions are replaced by trivalent and then pentavalent ions in solvents with a dielectric constant 30. In contrast, in solvents with < 30, an attractive mean force is present even with monovalent counterions, regardless of salt absence. With added salt, a similar but gradual transition occurs when trivalent and pentavalent counterions are introduced into a monovalent counterion system, up to a stoichiometric ratio of multivalent counterions. Beyond this point, the attractive mean force starts to diminish. The introduction of small amounts of multivalent salt progressively reduces the effective charge of the macroions, resulting in a decrease in stability of the solution.
In solvents with polarity lower than that of water, the transition from a repulsive to an attractive mean force takes place at an extremely low multivalent counterion-to-macroion charge ratio (β = 0.075). Furthermore, at a fixed salt concentration, the mean force increases as solvent polarity decreases and is stronger in systems with pentavalent counterions than in those with trivalent ones due to the higher Coulomb coupling parameter. Moreover, the addition of small quantities of multivalent salt gradually lowers the effective charge of the macroion, resulting in reduced solution stability. Ultimately, this study further supports the development of attractive forces between like-charged colloids, driven by multivalent counterions, across various solutions.
References
- Evans, D.; Wennerström, H. The Colloidal Domain: Where Physics, Chemistry, Biology, and Technology Meet, 2nd ed.; Wiley-VCH: USA, 1999. [Google Scholar] [CrossRef]
- Strunk, W., Jr.; White, E.B. The Elements of Style, 4th ed.; Longman: New York, NY, USA, 2000. [Google Scholar]
- Bao, X.; Lee, H.; Qiu, S. Behavior of complex knots in single DNA molecules. Phys. Rev. Lett. 2003, 91, 265506. [Google Scholar] [CrossRef] [PubMed]
- Meiners, J.C.; Quake, S.R. Femtonewton Force Spectroscopy of Single Extended DNA Molecules. Phys. Rev. Lett. 2000, 84, 5014–5017. [Google Scholar] [CrossRef] [PubMed]
- Ong, G.M.C.; Gallegos, A.; Wu, J. Modeling Surface Charge Regulation of Colloidal Particles in Aqueous Solutions. Langmuir 2020, 36, 11918–11928. [Google Scholar] [CrossRef] [PubMed]
- Lobaskin, V.; Qamhieh, K. Effective Macroion Charge and Stability of Highly Asymmetric Electrolytes at Various Salt Conditions. J. Phys. Chem. B 2003, 107, 8022–8029. [Google Scholar] [CrossRef]
- Qamhieh, K.; Linse, P. Effect of discrete macroion charge distributions in solutions of like-charged macroions. J. Chem. Phys. 2005, 123, 104901. [Google Scholar] [CrossRef]
- Qamhieh, K.; Nylander, T. Electrostatic interactions between cationic dendrimers and anionic model biomembrane. Chem. Phys. Lipids 2022, 246, 105214. [Google Scholar] [CrossRef]
- Qamhieh, K.; Amleh, M.; Khaleel, M. Effect of Discrete Macroion Charge Distributions on Electric Double Layer of a Spherical Macroion. J. Dispers. Sci. Technol. 2013, 34, 1517–1525. [Google Scholar] [CrossRef]
- Linse, P. Electrostatics in the presence of spherical dielectric discontinuities. J. Chem. Phys. 2008, 128, 214505. [Google Scholar] [CrossRef]
- Bouyer, F.; Robben, A.; Yu, W.L.; Borkovec, M. Aggregation of colloidal particles in the presence of oppositely charged polyelectrolytes: Effect of surface charge heterogeneities. Langmuir 2001, 17, 5225–5231. [Google Scholar] [CrossRef]
- Rouzina, I.; Bloomfield, V.A. Macroion attraction due to electrostatic correlation between screening counterions. 1. Mobile surface-adsorbed ions and diffuse ion cloud. J. Phys. Chem. 1996, 100, 9977–9989. [Google Scholar] [CrossRef]
- Guldbrand, L.; Jönsson, B.; Wennerström, H.; Linse, P. Electrical double layer forces. A Monte Carlo study. J. Chem. Phys. 1983, 80, 2221–2228. [Google Scholar] [CrossRef]
- Messina, R.; Holm, C.; Kremer, K. Strong attraction between charged spheres due to metastable ionized states. Phys. Rev. Lett. 2000, 85, 872–875. [Google Scholar] [CrossRef] [PubMed]
- Tanaka, M.; Grosberg, A.Y. Electrophoresis of a charge-inverted macroion complex: Molecular-dynamics study. Eur. Phys. J. E 2002, 7, 371–379. [Google Scholar] [CrossRef]
- Martín-Molina, A.; Quesada-Pérez, M.; Galisteo-González, F.; Hidalgo-Álvarez, R. Looking into overcharging in model colloids through electrophoresis: Asymmetric electrolytes. J. Chem. Phys. 2003, 118, 4183–4189. [Google Scholar] [CrossRef]
- Besteman, K.; Zevenbergen, M.A.G.; Heering, H.A.; Lemay, S.G. Direct observation of charge inversion by multivalent ions as a universal electrostatic phenomenon. Phys. Rev. Lett. 2004, 93, 170802. [Google Scholar] [CrossRef]
- Besteman, K.; Zevenbergen, M.A.G.; Lemay, S.G. Charge inversion by multivalent ions: Dependence on dielectric constant and surface-charge density. Phys. Rev. E 2005, 72, 061501. [Google Scholar] [CrossRef]
- Allahyarov, E.; Zaccarelli, E.; Sciortino, F.; Tartaglia, P.; Löwen, H. Interaction between charged colloids in a low dielectric constant solvent. EPL 2007, 78, 38002. [Google Scholar] [CrossRef]
- Qamhieh, K. Effect of dielectric constant on the zeta potential of spherical electric double layer. Molecules 2024, 29, 2484–2496. [Google Scholar] [CrossRef]
- Linse, P. MOLSIM; Lund University: Lund, Sweden, 2004. [Google Scholar]
- Angelescu, D.G.; Linse, P. Monte Carlo simulation of the mean force between two like-charged macroions with simple 1:3 salt added. Langmuir 2003, 19, 9661–9668. [Google Scholar] [CrossRef]
- Linse, P. Mean force between like-charged macroions at high electrostatic coupling. J. Phys. Condens. Matter 2002, 14, 13449–13467. [Google Scholar] [CrossRef]
- Belloni, L. Colloidal interactions. J. Phys. Condens. Matter 2000, 12, R549–R587. [Google Scholar] [CrossRef]
Figure 1.
(a) Mean force (Å -1), and (b) reduced potential of mean force Upmf (r) / kT between two highly charged macroions as a function of their separation r (Å) for a 60:1 system in different solvents, with dielectric constants specified in the figures.
Figure 1.
(a) Mean force (Å -1), and (b) reduced potential of mean force Upmf (r) / kT between two highly charged macroions as a function of their separation r (Å) for a 60:1 system in different solvents, with dielectric constants specified in the figures.
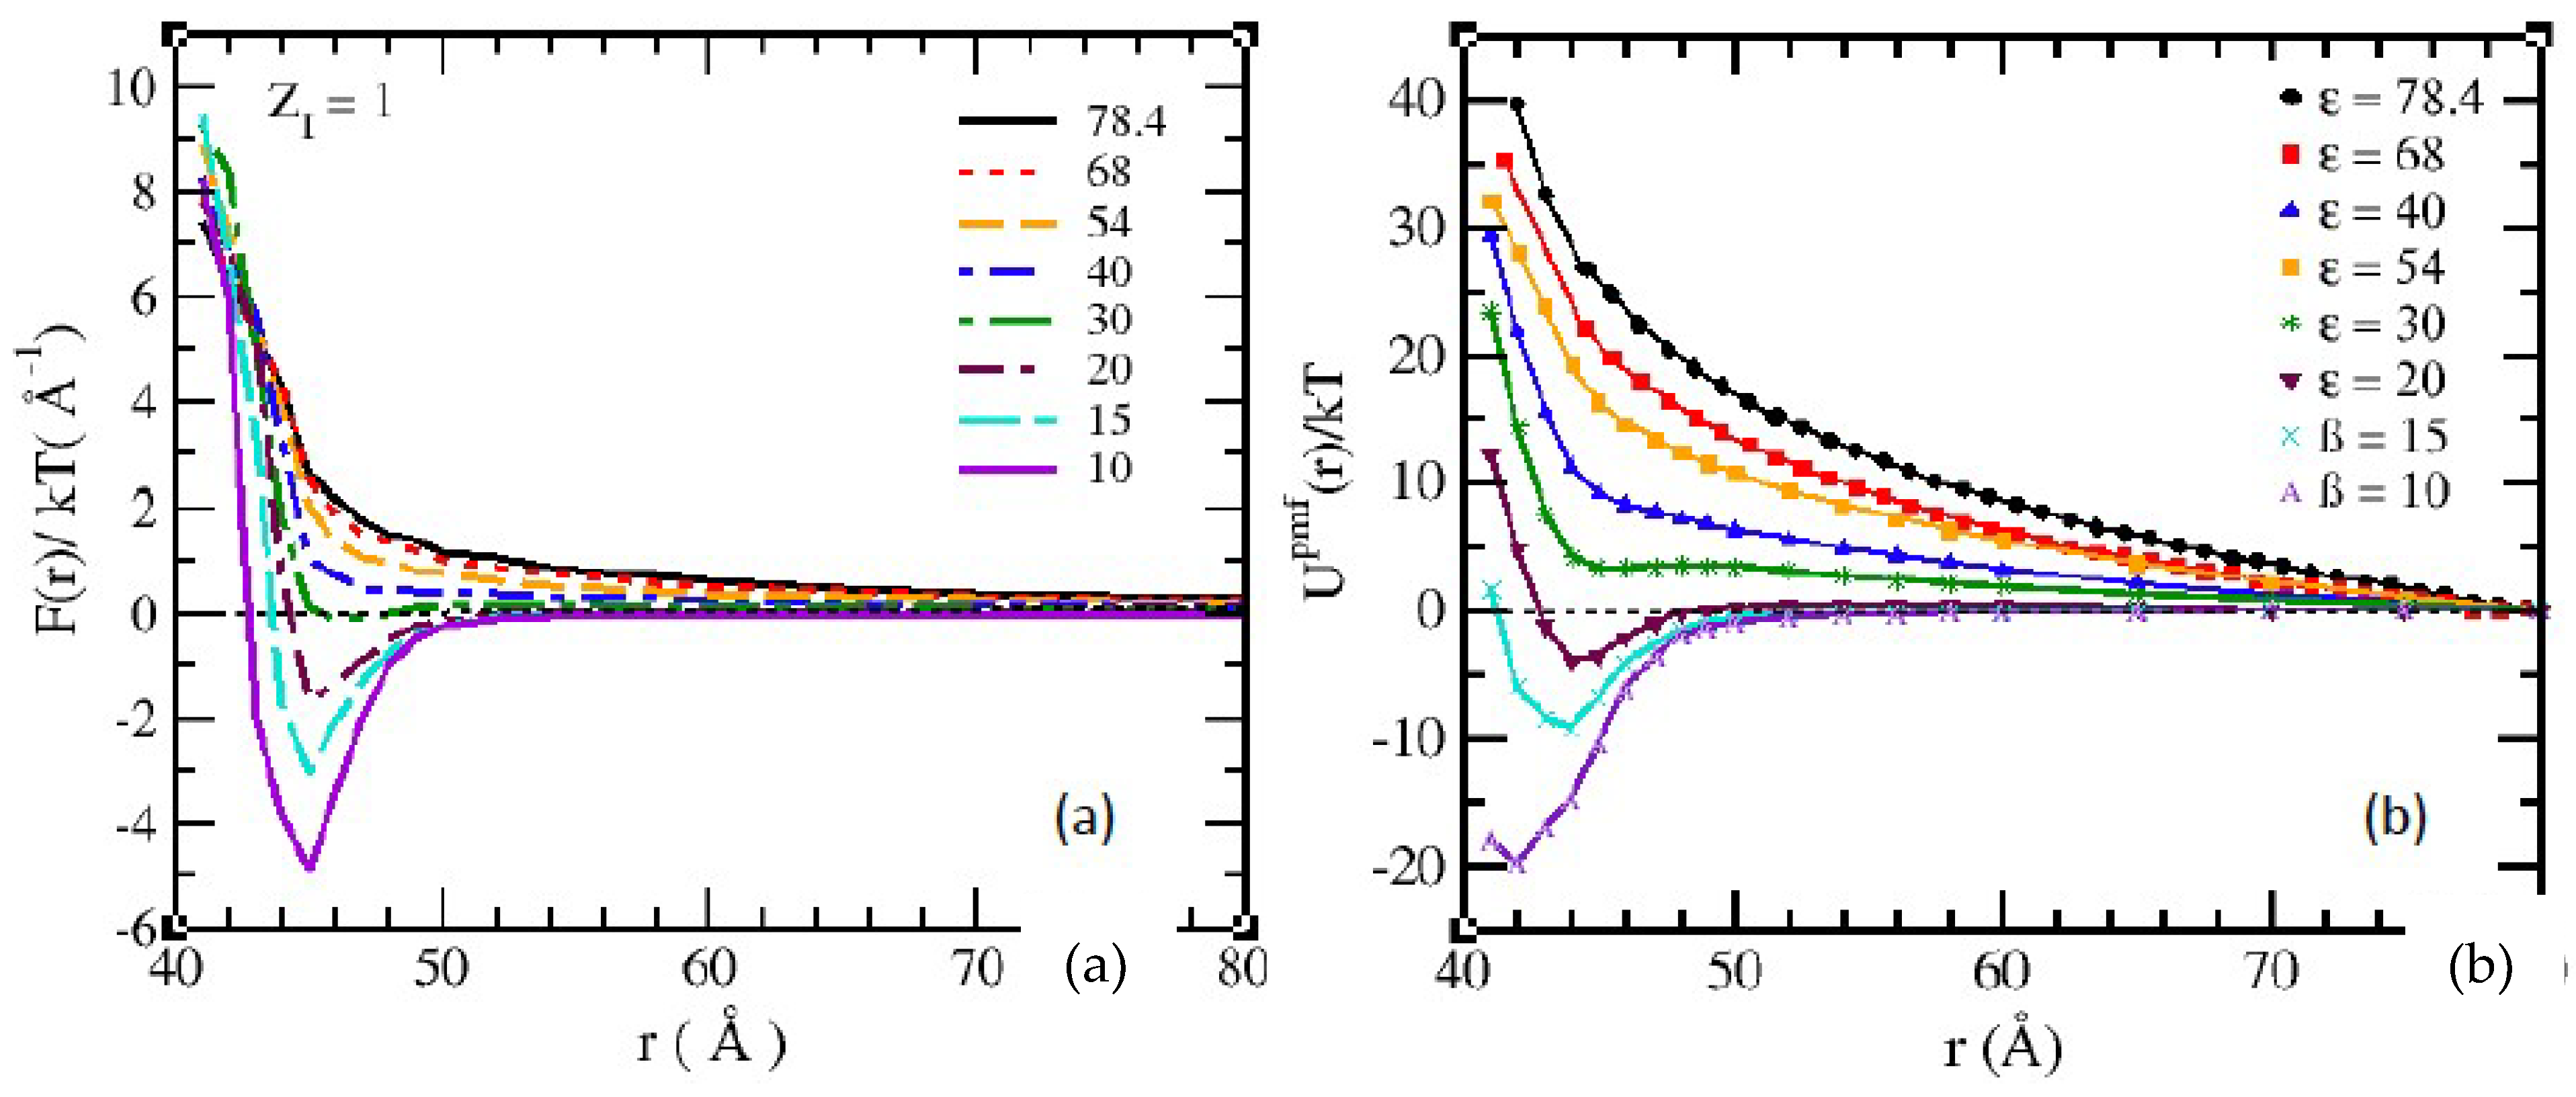
Figure 2.
Snapshots of the cylindrical cell system consisting of two macroions (red spheres) and monovalent counterions (green dots) in different solvents without added salt: (a) = 10, (b) = 15, (c) = 20, (d) = 30, (e) = 40, (f) = 54, (g) = 68, and (h)
Figure 2.
Snapshots of the cylindrical cell system consisting of two macroions (red spheres) and monovalent counterions (green dots) in different solvents without added salt: (a) = 10, (b) = 15, (c) = 20, (d) = 30, (e) = 40, (f) = 54, (g) = 68, and (h)
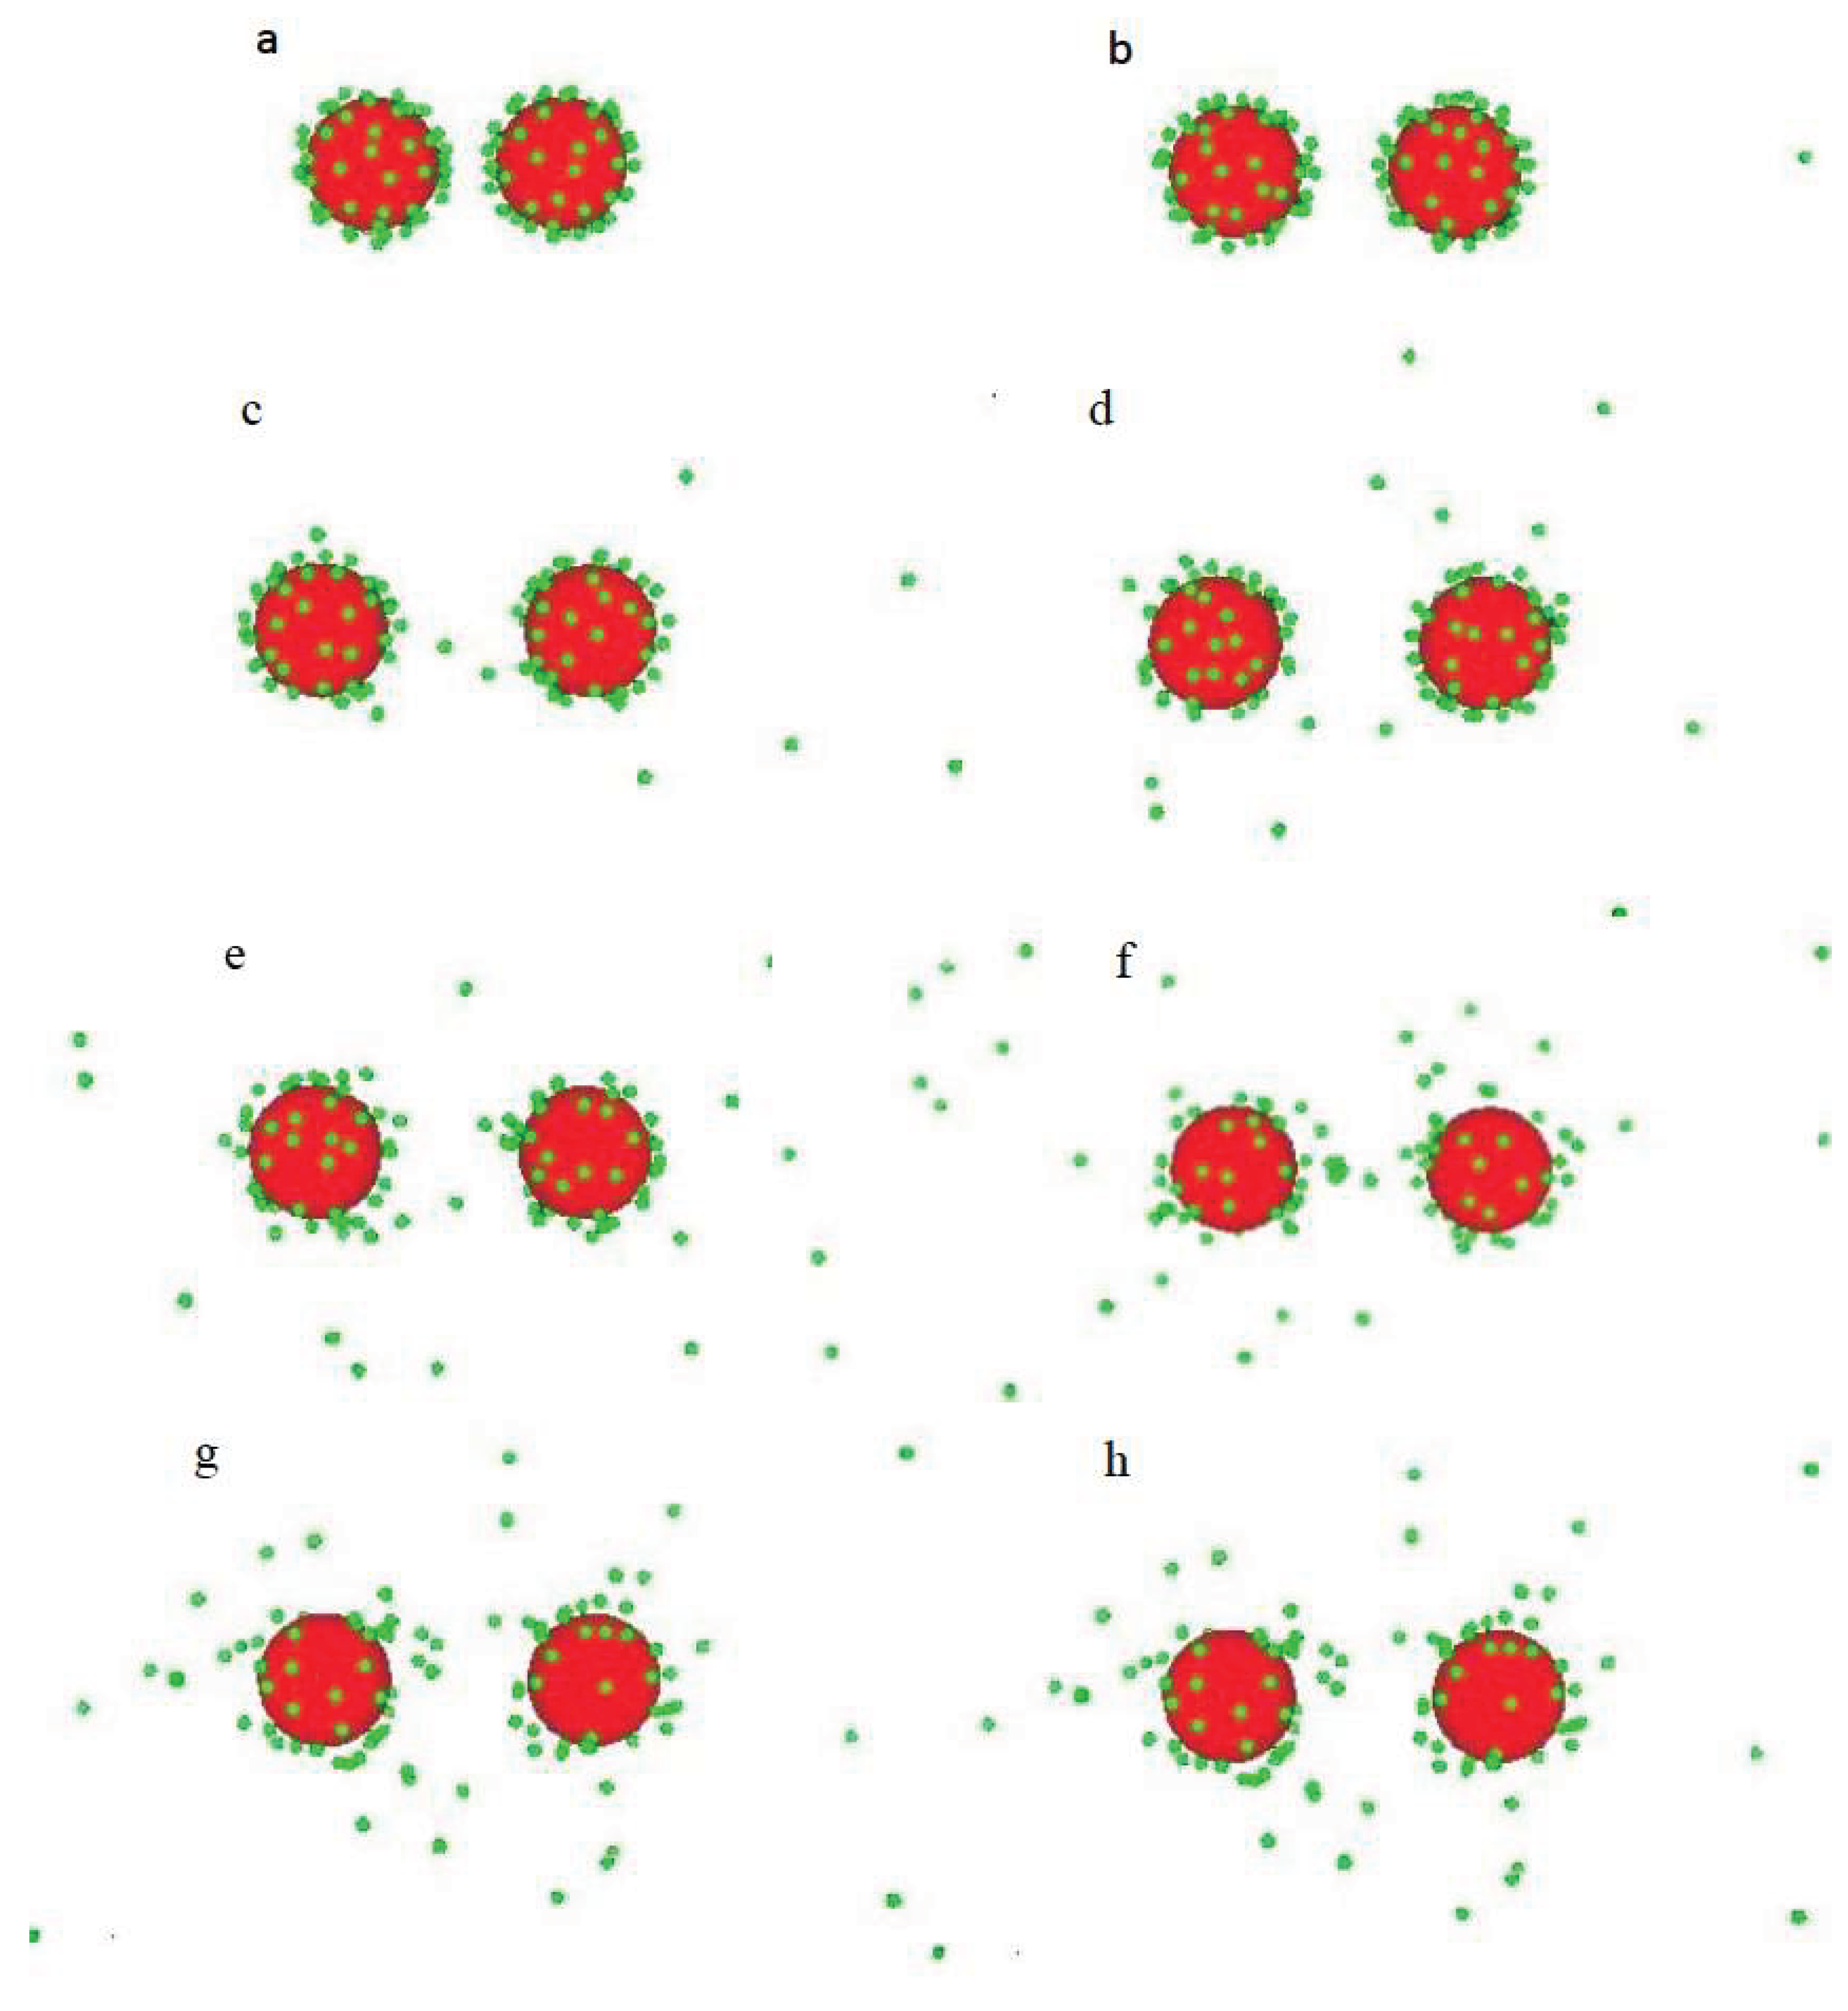
Figure 3.
Macroion-counterion radial distribution functions (RDFs) for two highly charged macroions and monovalent counterions in solutions with dielectric constants as indicated in the figure.
Figure 3.
Macroion-counterion radial distribution functions (RDFs) for two highly charged macroions and monovalent counterions in solutions with dielectric constants as indicated in the figure.
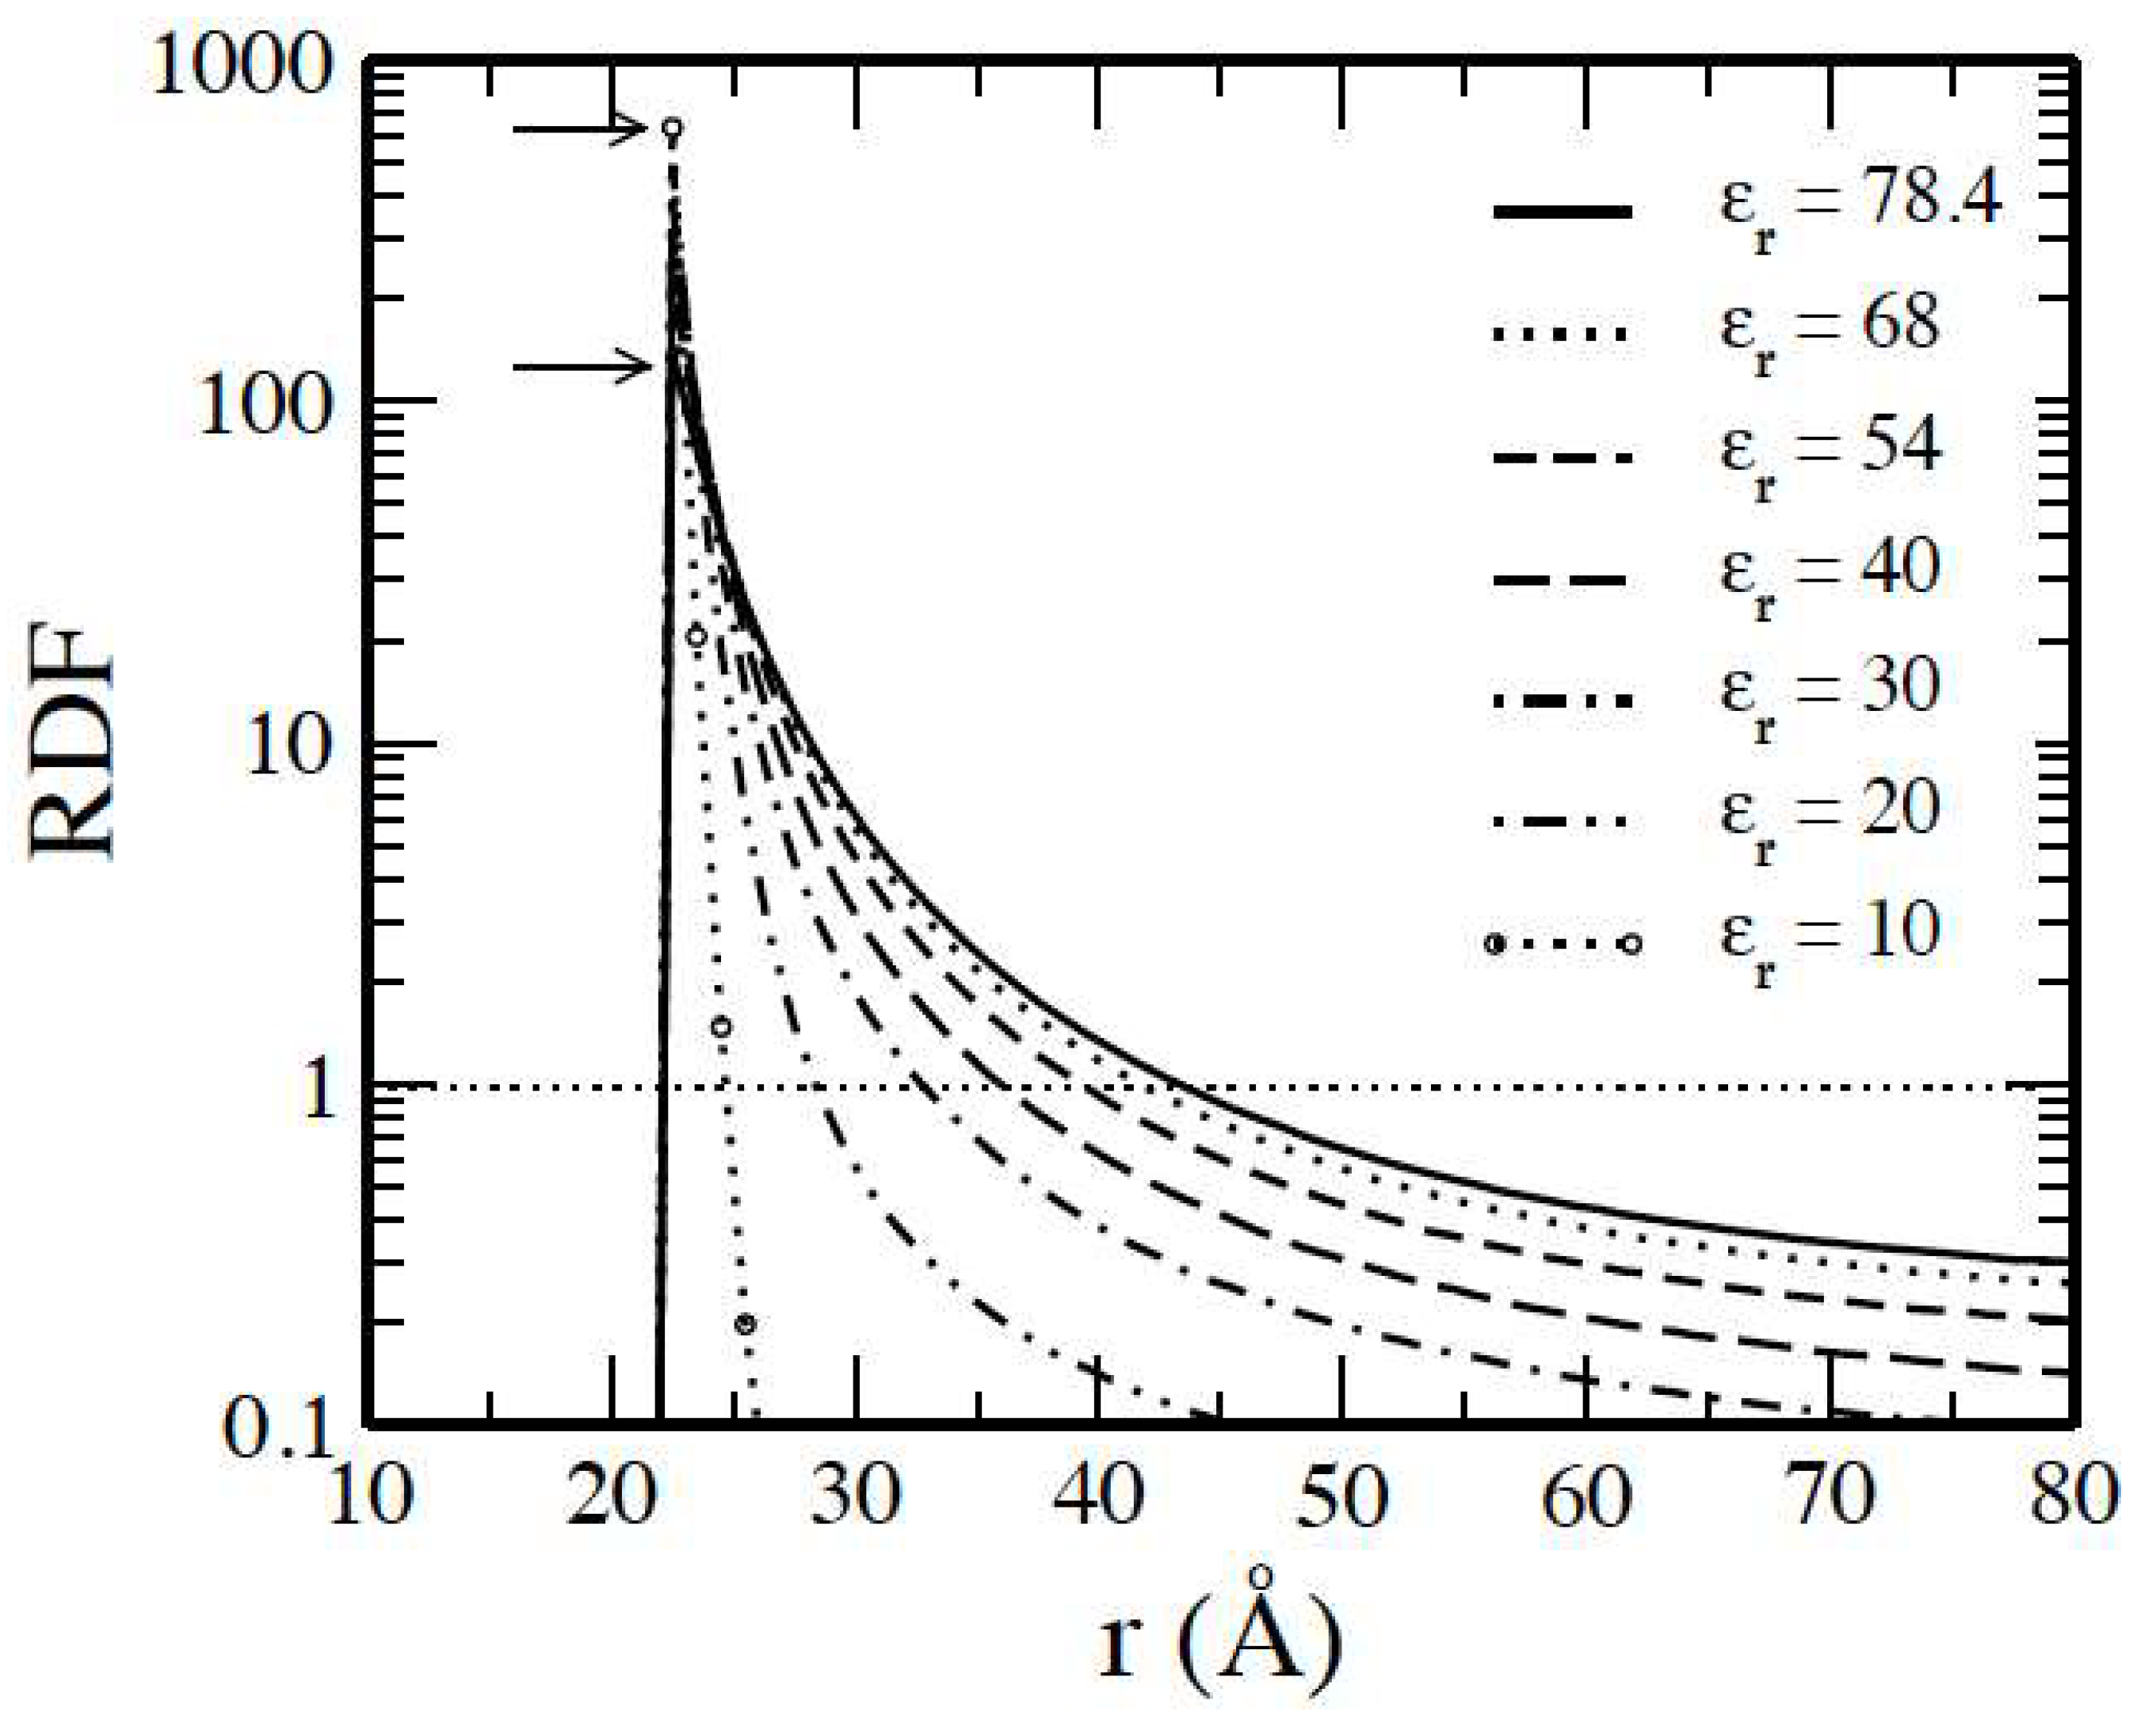
Figure 4.
Mean force (Å-1) between two highly charged macroions as a function of their separation r for the 60:1 (ZI = 1), 60:2 (ZI = 2), and 60:3 (ZI = 3) cylindrical cell systems. The results are presented for different relative permittivities: (a) = 78.4 , (b) = 68 , (c) = 54, (d) = 40 , (e) = 30, and (f) = 20
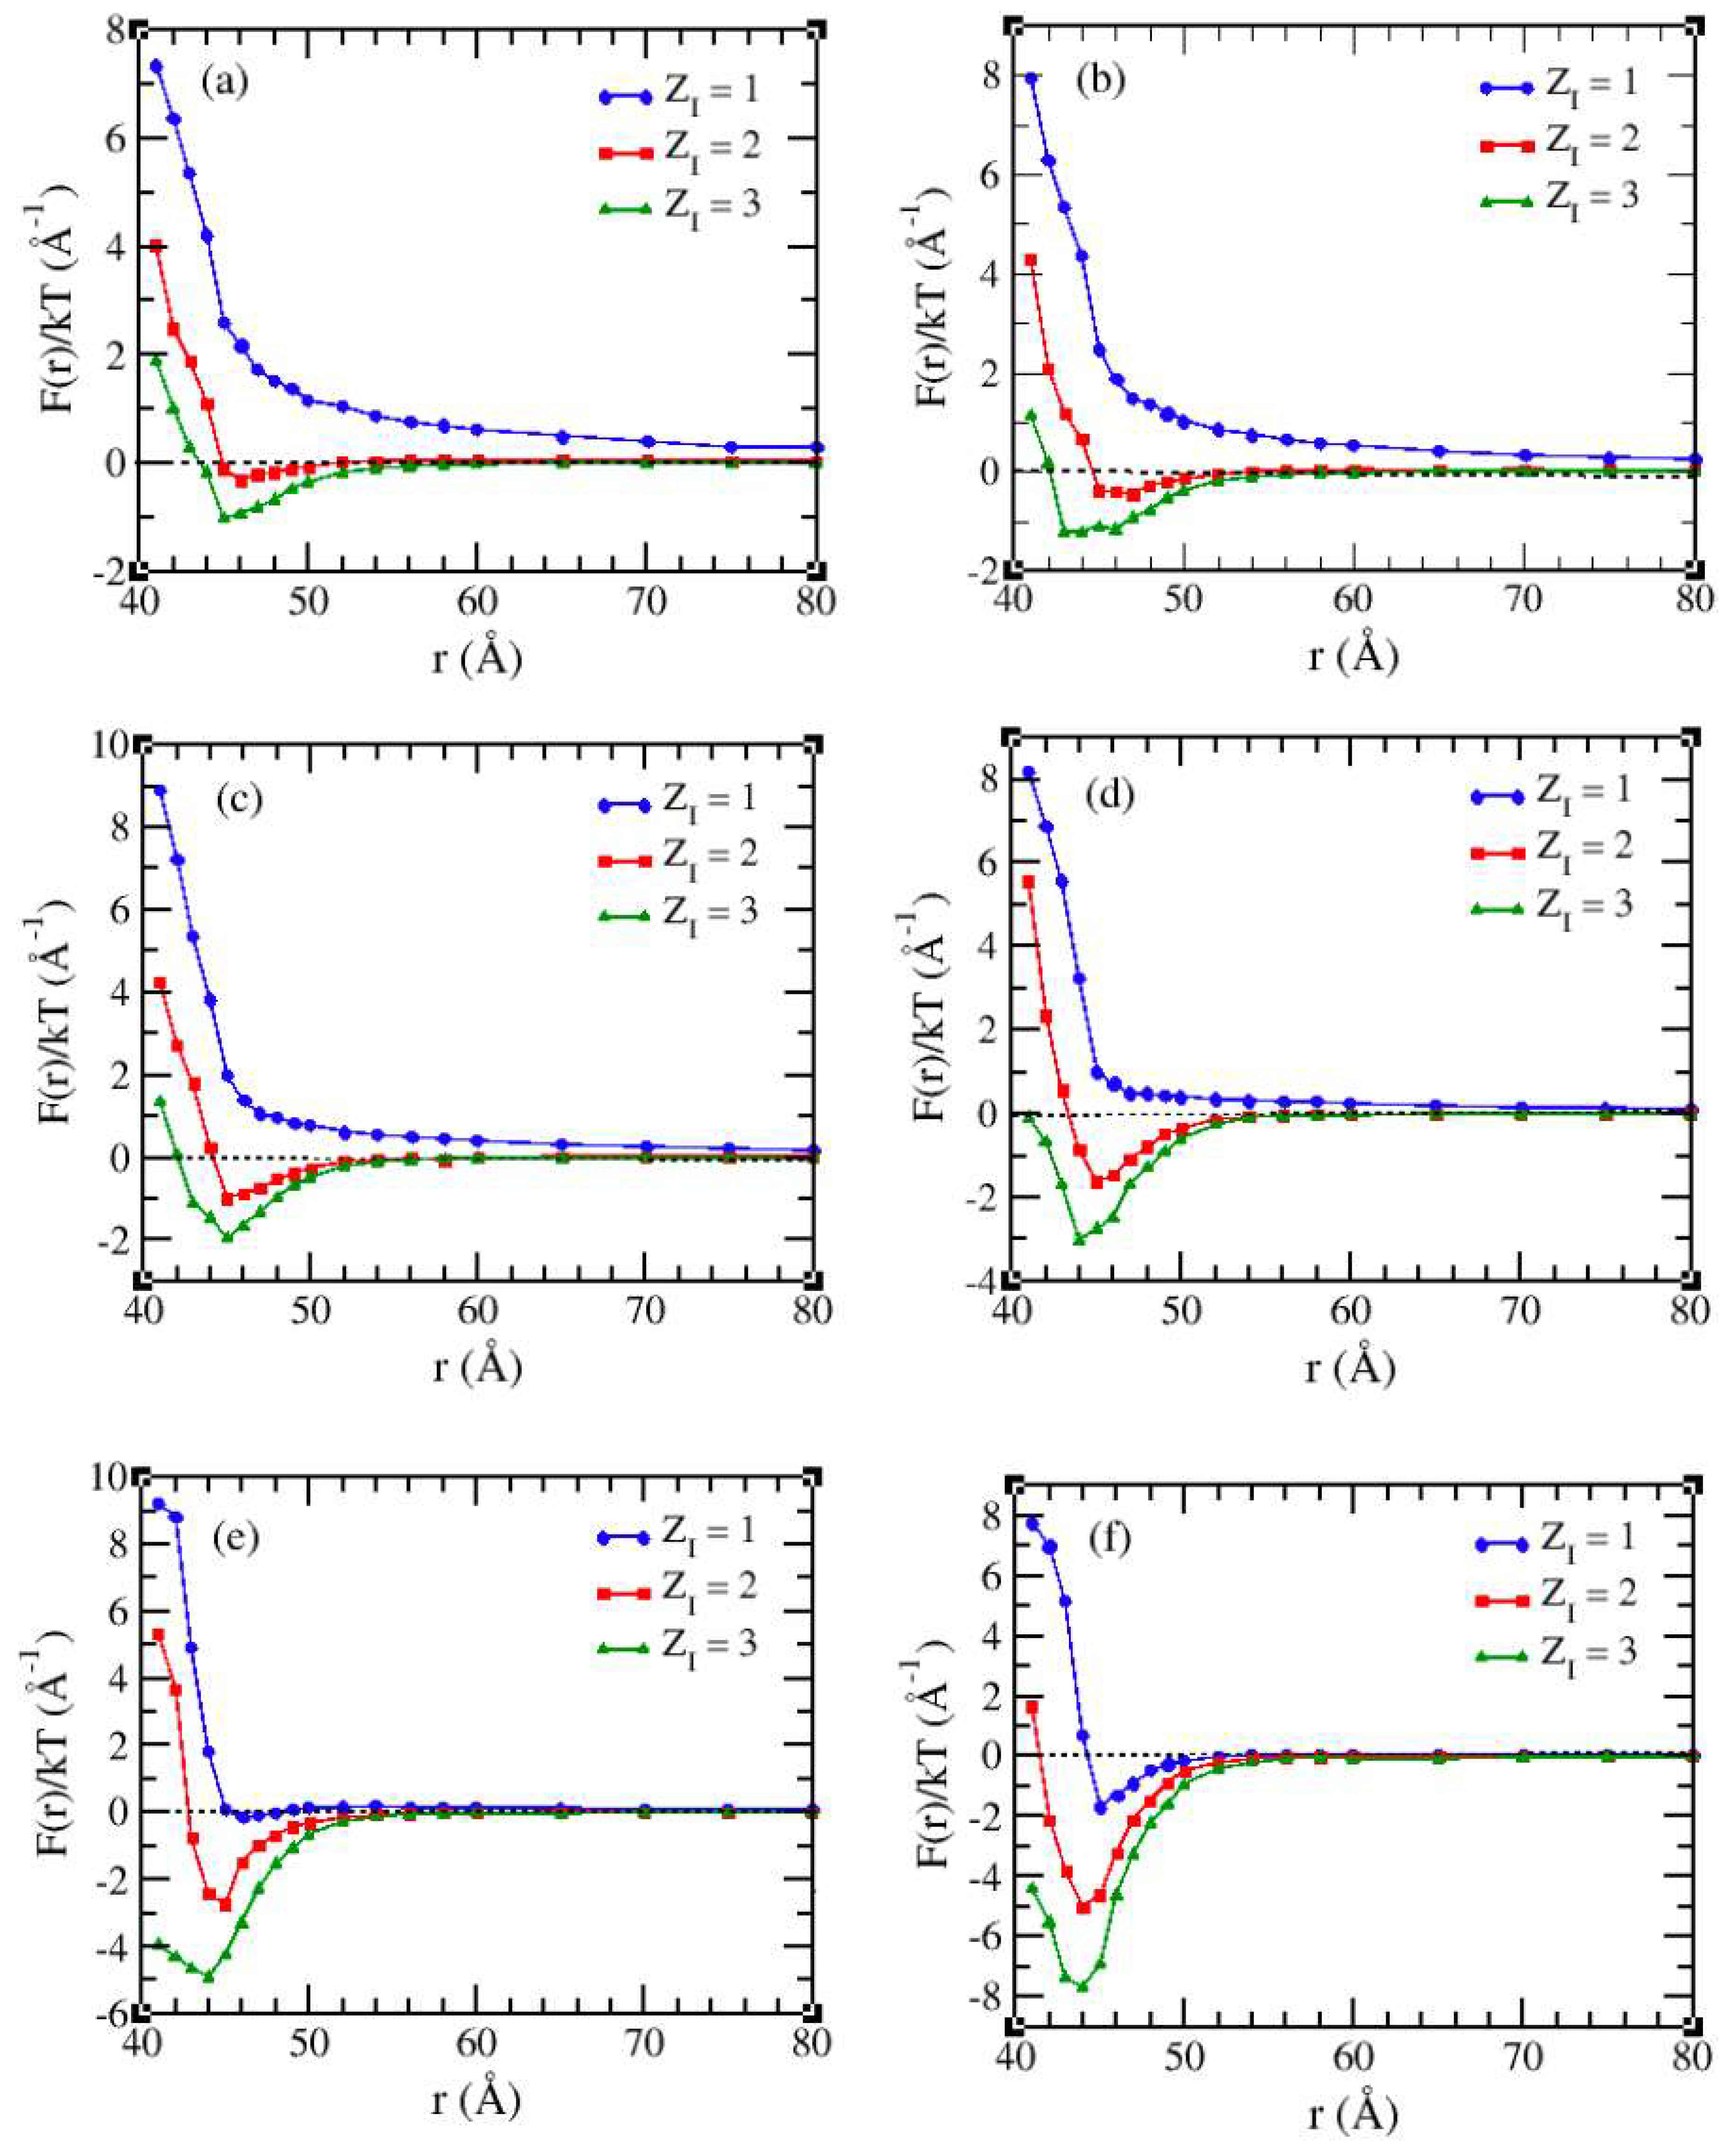
Figure 5.
Reduced Mean force (Å -1) for 60:1 system in different solvents with dielectric constants (a) = 78.4, (b) = 68 and (c) = 54 as a function of macroions separation r. The solution contains (1:3) salt at varying concentrations β as indicated (the curves at β = 6.25 are represented by filled symbols).
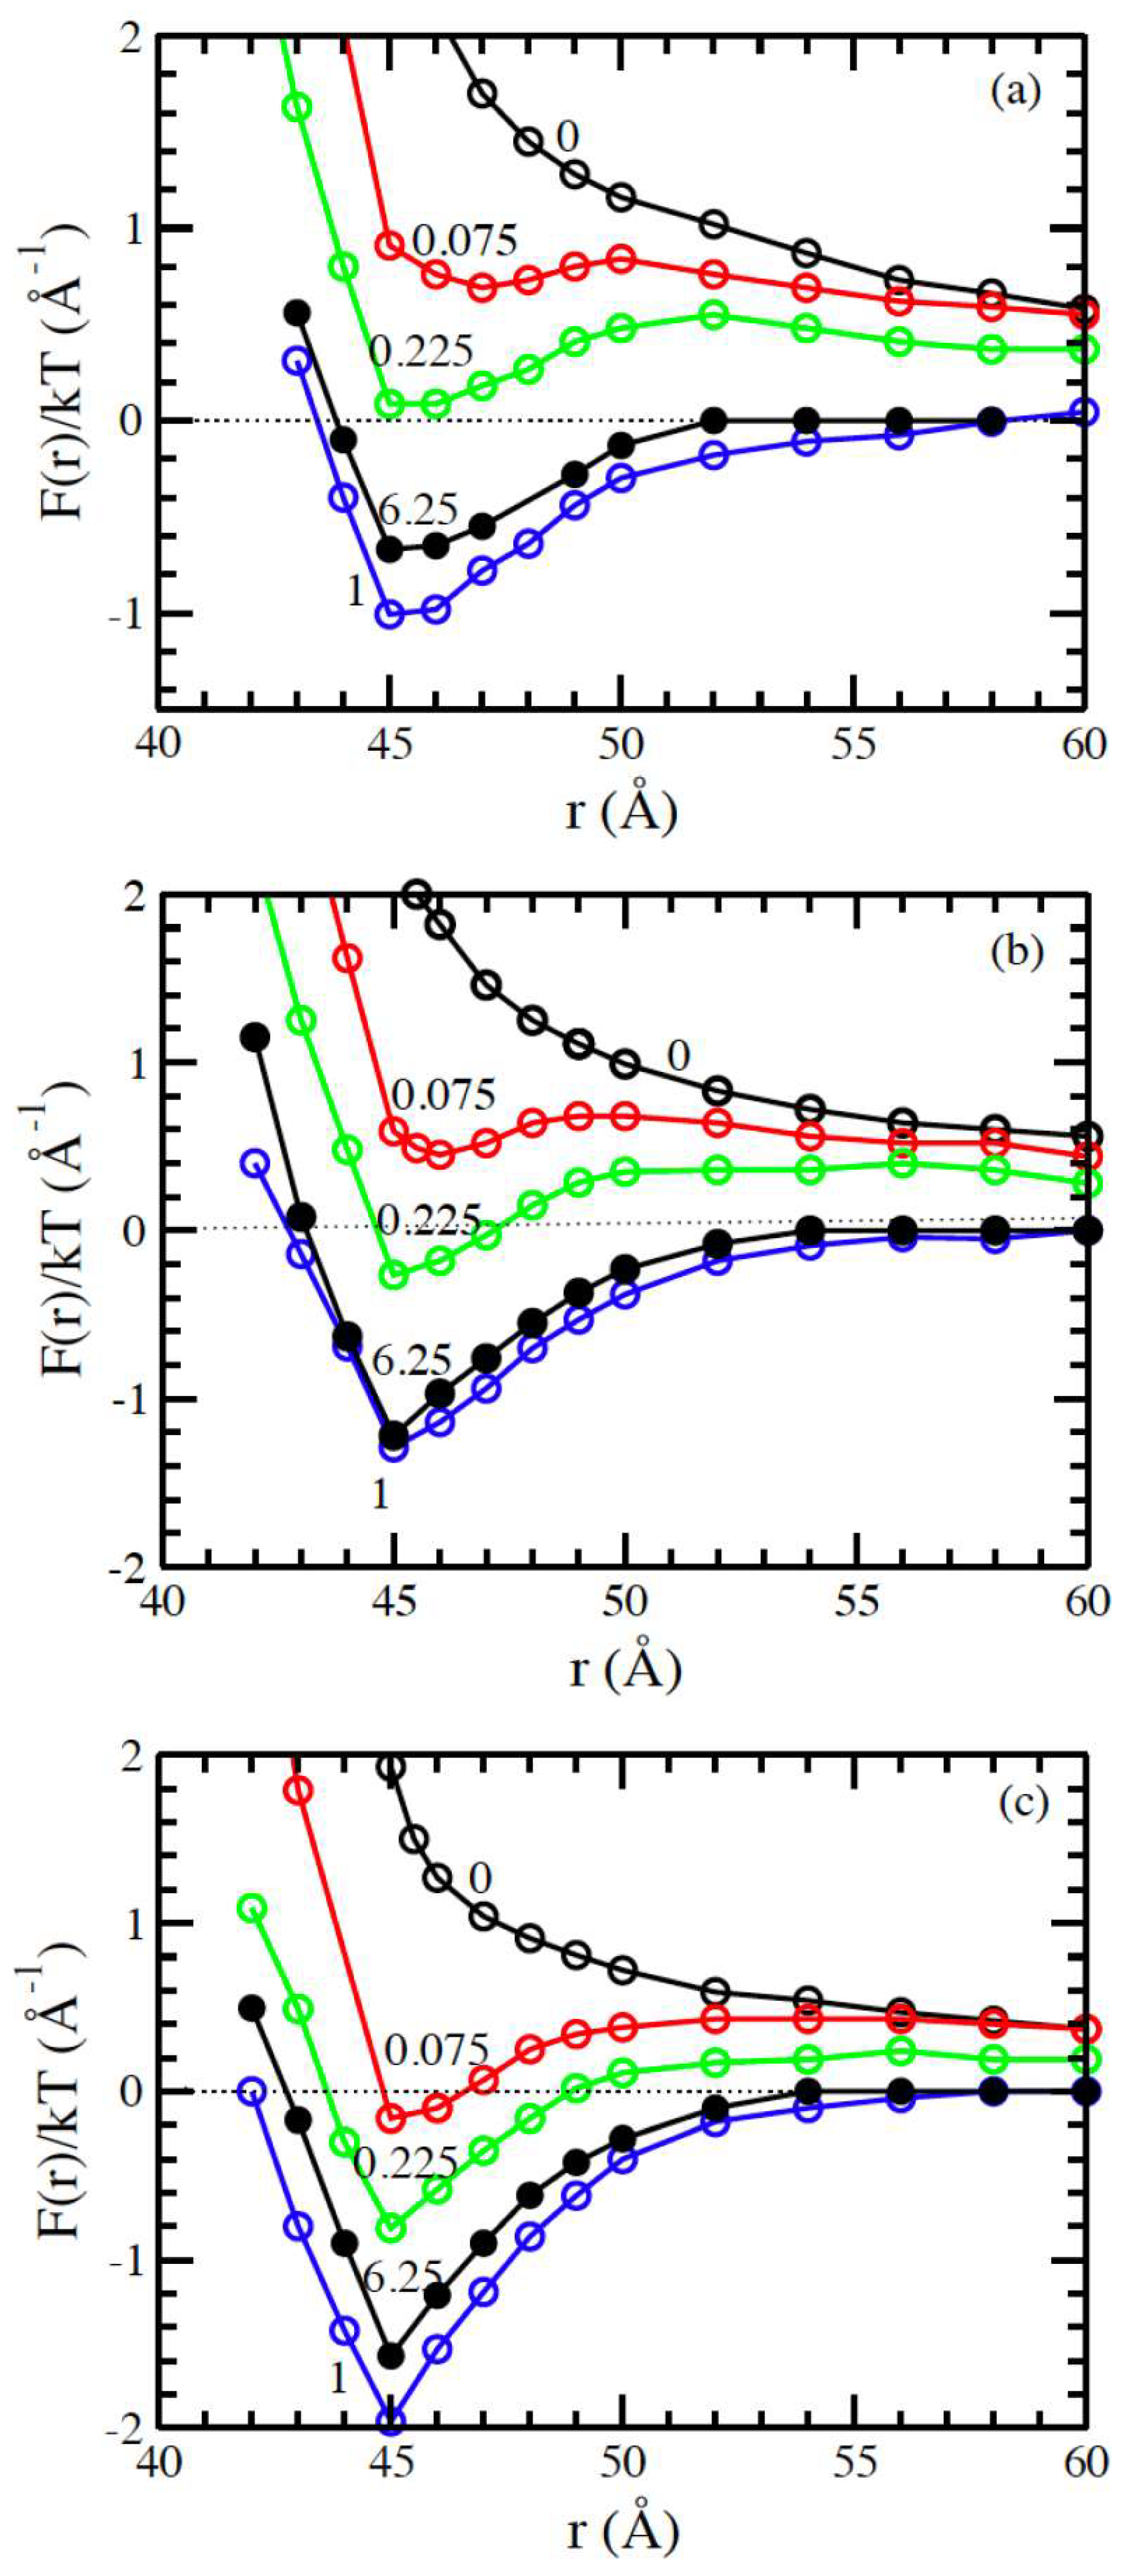
Figure 6.
Reduced Mean force (Å -1) for 60:1 system in different solvents with dielectric constants (a) = 78.4, (b) = 68 and (c) = 54 as a function of macroions separation r. The solution includes (1:5) salt at varying concentrations β as indicated (the curves at β = 6.25 are represented by filled symbols).
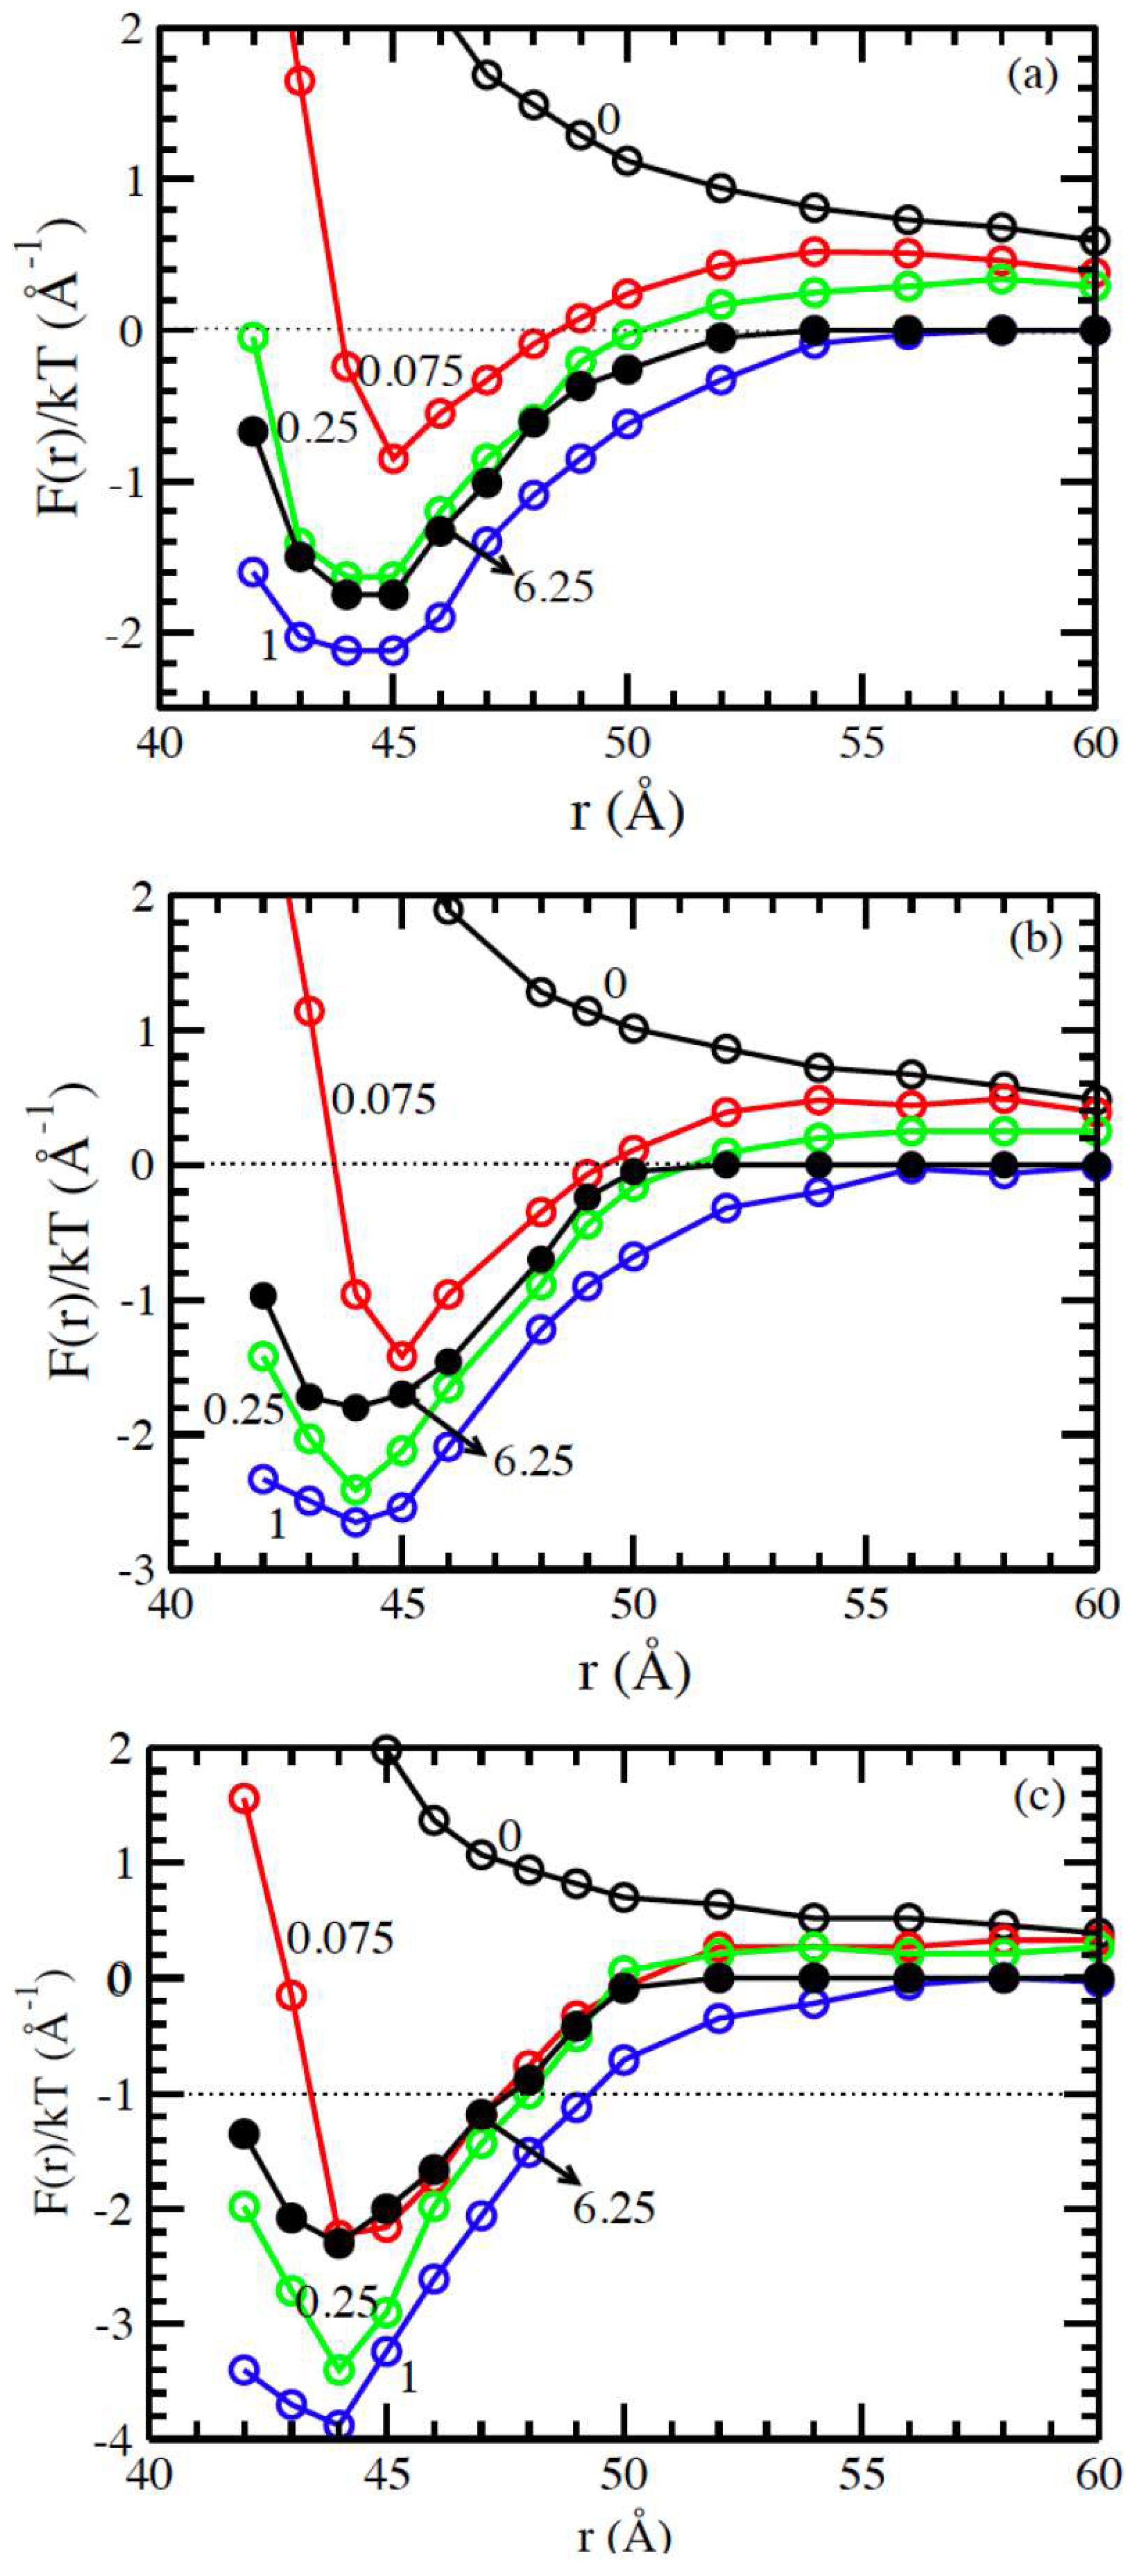
Figure 7.
Reduced Mean force (Å -1) for 60:1 system in different solvents with dielectric constants (a) = 78.4, (b) = 68 and (c) = 54 as a function of macroions separation r. The solution includes (1:3) salt as lines without symbols, and (1:5) salt as lines with symbols at a constant concentration β = 0.075.
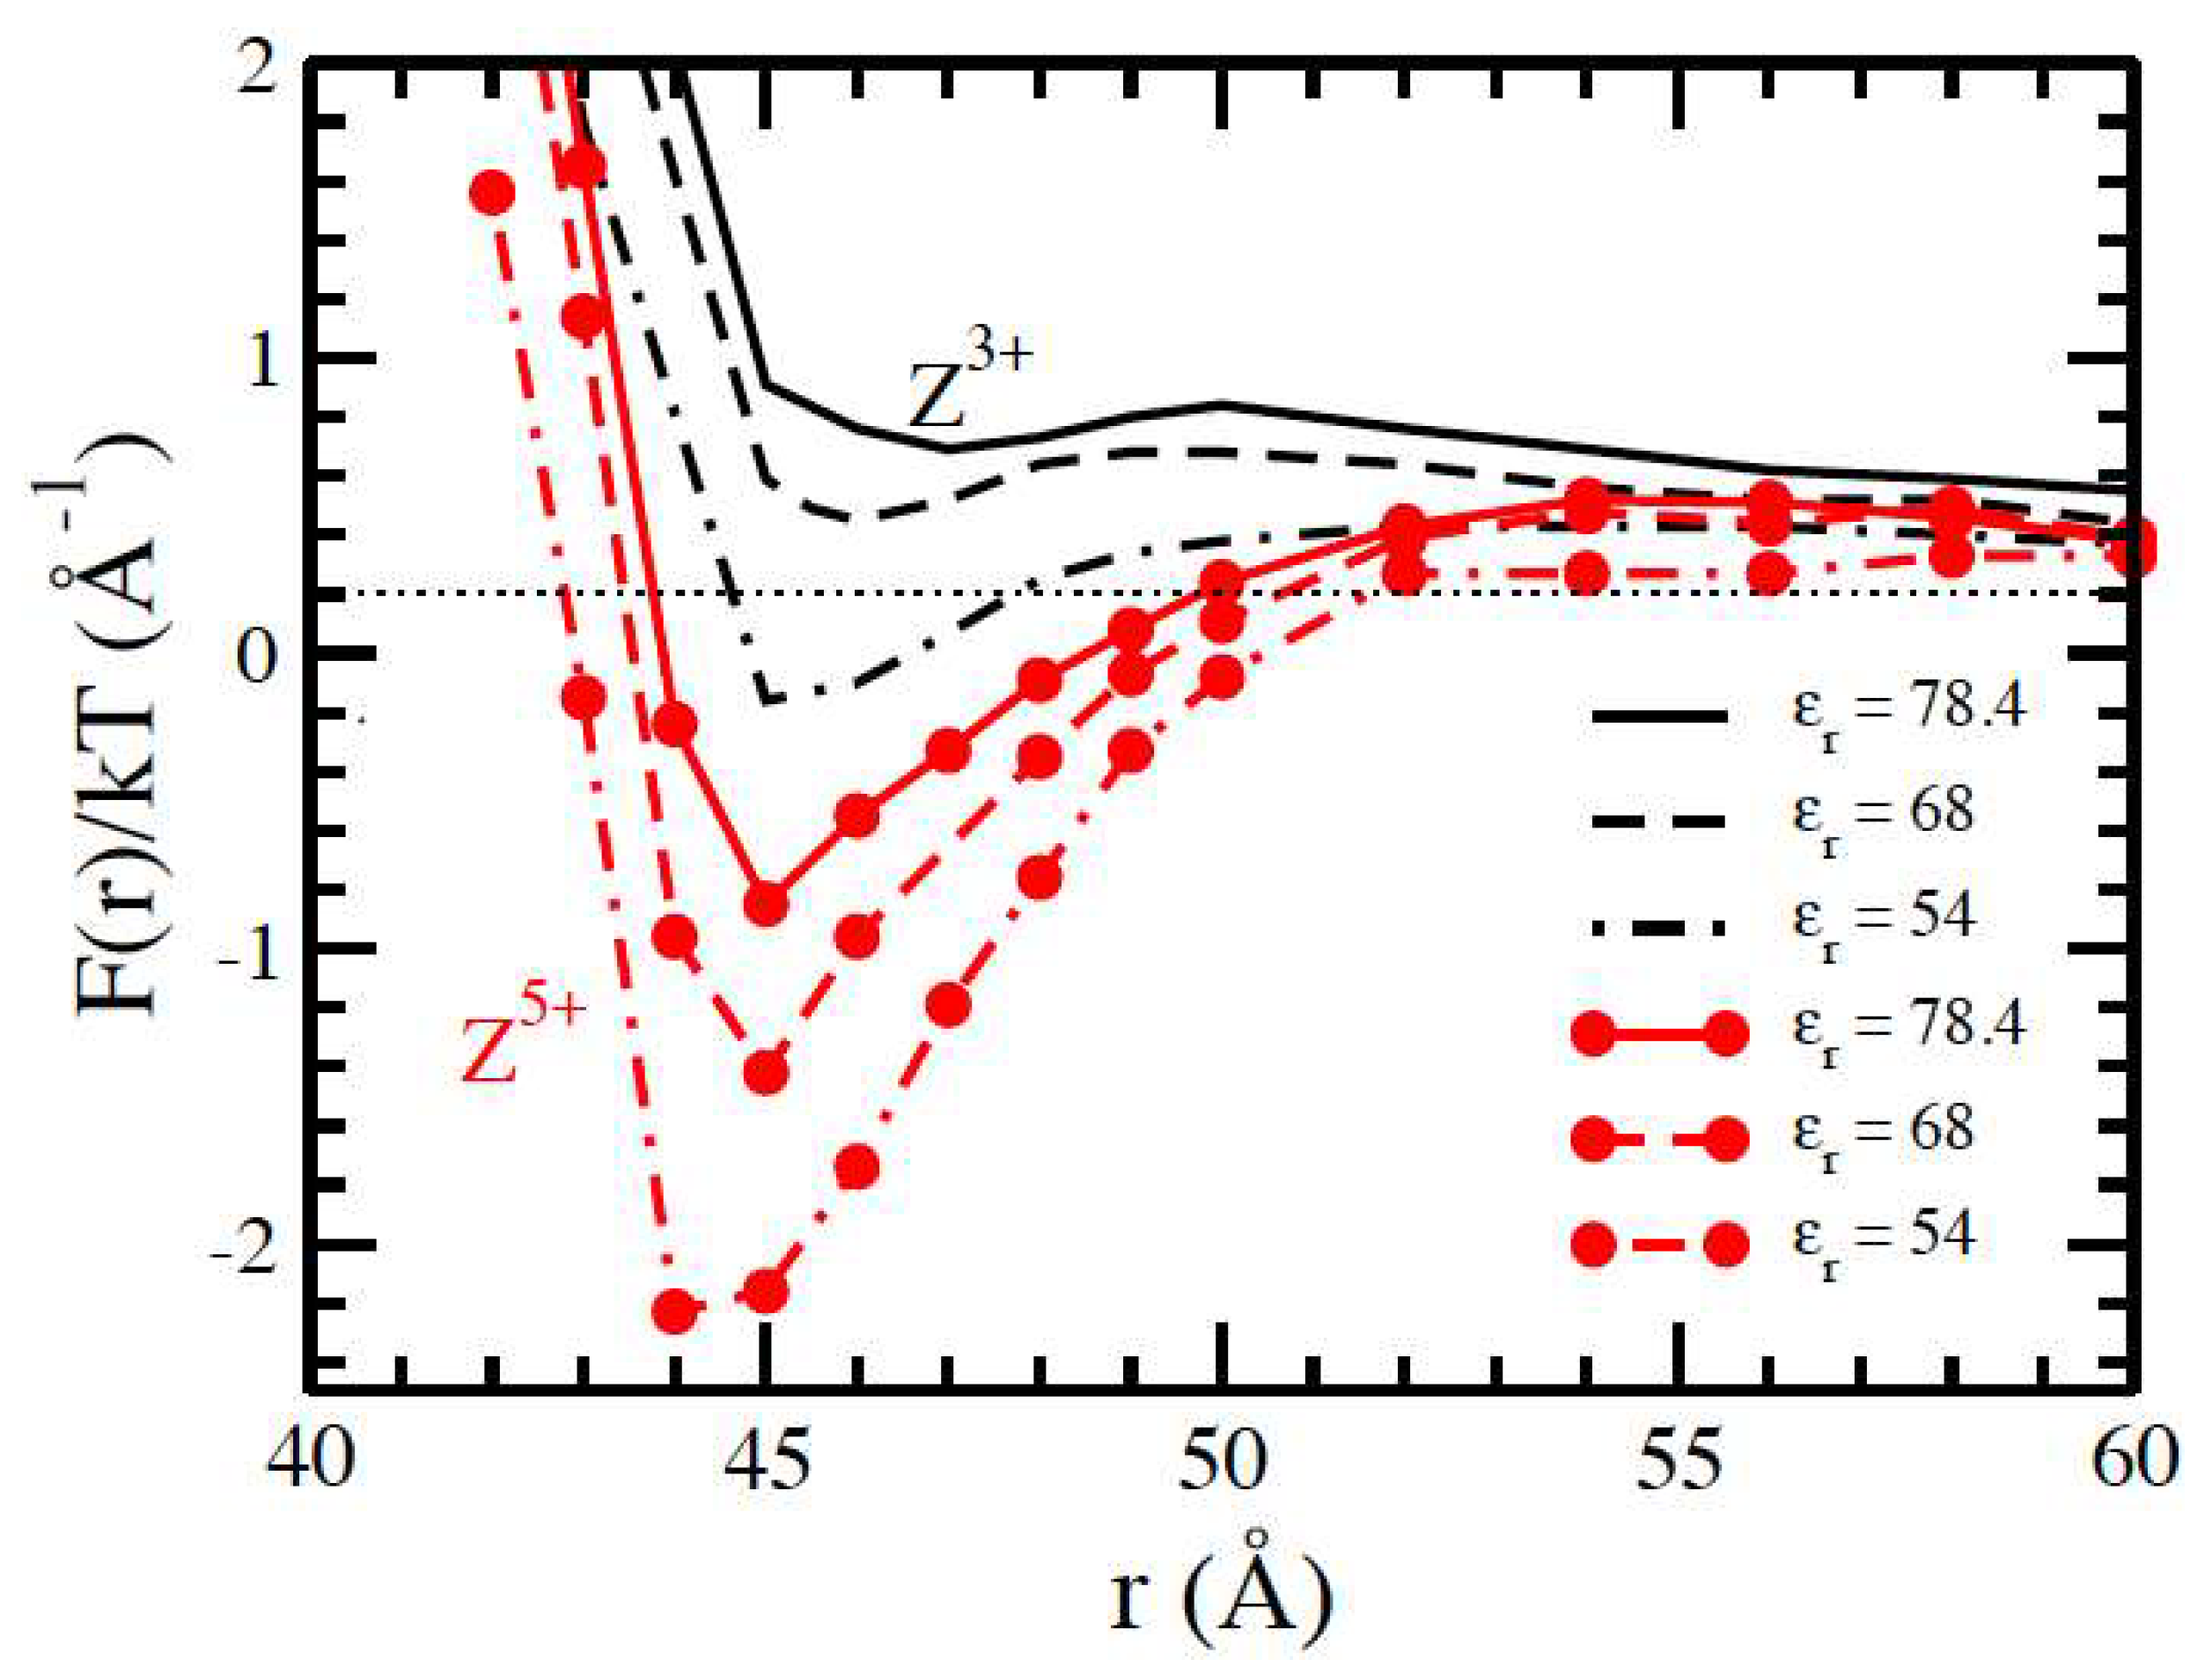

Table 1.
lists the solvents’ Bjerrum lengths and dielectric constants.
| The solvent | Water | 75%water, 25%ethanol | Methyl alcohol | Glycerin | Methanol | Ethanol | Cyclohexanol | Butyl Chloral |
| Dielecrtiric constant( | 78.4 | 68 | 54 | 40 | 30 | 20 | 15 | 10 |
| 7.1 | 8.23 | 10.36 | 14.0 | 18.657 | 27.986 | 37.315 | 55.973 |
Table 2.
The Coulomb coupling parameter () between monovalent, divalent, trivalent, and pentavalent counterions on the charged surface evaluated in all solvents.
Table 2.
The Coulomb coupling parameter () between monovalent, divalent, trivalent, and pentavalent counterions on the charged surface evaluated in all solvents.
| The solvent | Water | Methyl alcohol | Glycerin | Methanol | Ethanol | Cyclohexanol | Butyl Chloral | |
| Dielecrtiric constant( | 78.4 | 68 | 54 | 40 | 30 | 20 | 15 | 10 |
| (Å) | 7.1 | 8.2 | 10.4 | 14.0 | 18.6 | 28.0 | 37.3 | 56 |
| 0.8 | 0.9 | 1.1 | 1.5`` | 2.0 | 3.0 | 4.1 | 6.1 | |
| 2.3 | 2.5 | 3.1 | 4.2 | 5.6 | 8.5 | 11.6 | 17.2 | |
| 4.1 | 4.7 | 5.7 | 7.8 | 10.4 | 15.6 | 21.3 | 31.7 | |
| 8.9 | 10.1 | 12.3 | 16.8 | 22.4 | 33.5 | 45.8 | 68.2 |
Disclaimer/Publisher’s Note: The statements, opinions and data contained in all publications are solely those of the individual author(s) and contributor(s) and not of MDPI and/or the editor(s). MDPI and/or the editor(s) disclaim responsibility for any injury to people or property resulting from any ideas, methods, instructions or products referred to in the content. |
© 2025 by the authors. Licensee MDPI, Basel, Switzerland. This article is an open access article distributed under the terms and conditions of the Creative Commons Attribution (CC BY) license (http://creativecommons.org/licenses/by/4.0/).
Copyright: This open access article is published under a Creative Commons CC BY 4.0 license, which permit the free download, distribution, and reuse, provided that the author and preprint are cited in any reuse.


