Submitted:
12 May 2025
Posted:
12 May 2025
You are already at the latest version
Abstract
China's urban development is transitioning from an extensive expansion model to an intensive improvement approach. Promoting urban renewal through stock land resources has become a key focus in contemporary urban spatial governance. As cities enter the stock development era, accurately identifying the quantity and spatial distribution of inefficient stock land is crucial for improving land use efficiency. However, existing identification methods for inefficient existing space face challenges including limited data sources, over-reliance on expert experience and insufficient identification accuracy. These factors impede the realization of large-scale, high-precision, and universally applicable identification frameworks. This study proposes an identification method integrating multi-source big data, including land surveys, socioeconomic data, spatiotemporal trajectories, and air quality metrics. Using Shenzhen as a case study, we developed an index system with three dimensions (social, economic, and ecological) and eight indicators. The entropy weight method determined indicator weights, while mean-standardization and Moran’s I index characterized spatial distribution. The study identified a total of 65.37 km² of inefficient existing land in Shenzhen, accounting for approximately 7% of the city's construction land in 2019. Clusters mainly appear in the northwestern part of the city, including administrative boundary zones and urban fringe areas. Longgang District (21.11 km²) and Baoan District (12.57 km²) collectively contribute 51.5% of the inefficient land. Shenzhen's inefficient existing land exhibits an "edge aggregation and corridor extension" spatial pattern, and its formation is subject to the compound influence of historical development patterns, ecological control policies, and urban spatial structure. This study provides a scientific basis for urban renewal and inefficient land redevelopment through the integration of multidimensional big data and spatial statistical analysis. The proposed framework offers replicable technical support for sustainable urban governance and precision regeneration strategies in high-density Chinese cities.
Keywords:
existing land stock
; land use identification
; entropy weight
; urban renewal
; Moran’ I
1. Introduction
As a core mechanism in urban development and spatial governance during the stock era, urban renewal has become a focal point in territorial spatial planning and management. Against this backdrop, constructing an intensive and efficient spatial utilization model to optimize the allocation and use of urban space resources is at the forefront of urban planning research [1,2]. The exploration of stock development in urban areas in China began in Shenzhen [3], where the transition from "incremental expansion" to "stock optimization" has gradually become a consensus among local governments, markets, and society [4]. Innovative urban renewal practices leveraging intelligent interactions between land resources and urban renewal planning are key to revitalizing, optimizing, and enhancing stock land, thereby improving urban governance and fostering resilient and livable cities [5].
The identification of inefficient stock land is fundamental to urban renewal, as it is essential for optimizing urban spatial structure, improving land-use efficiency, and promoting sustainable urban development. Internationally, the concept of inefficient land originates from the term "Brownfield," which refers to abandoned, idle, or underutilized land [6,7,8]. In China's urban renewal practice, the definition of inefficient stock land has evolved. Initially, Guangzhou referred to it as "legacy urban redevelopment zones", while Shanghai and Shenzhen defined it as "urban renewal units." Other cities, such as Hangzhou, Nanjing, and Wuhan, termed it "urban inefficient land redevelopment." In 2013, the Guidance on Carrying out Pilot Projects for Redevelopment of Inefficient Urban Land issued by the Ministry of Natural Resources explicitly defined inefficient urban land as "existing construction land in urban areas that is scattered in layout, extensively utilized, and unreasonably used." In 2023, the Notice on Carrying out Pilot Projects for Redevelopment of Inefficient Land issued by the Ministry of Natural Resources expanded the scope of inefficient land from urban areas to urban and rural construction land.
Research on inefficient stock land has mainly focused on land use intensity evaluation and land-use structure optimization abroad [9,10,11,12], often employing remote sensing imagery and traditional data rating methods [13,14]. Domestic studies have concentrated on urban spatial governance and management mechanisms [15,16,17,18,19,20], identification and causation analysis of inefficient land [21,22,23,24,25], redevelopment potential evaluation [26,27,28,29,30], and development strategies [31,32,33,34,35]. Research has primarily targeted pilot cities, including Beijing [36], Shenzhen [3,18], Guangzhou [21], Zhuhai [37], Chengdu [22,38], Nanjing [26,27], Suzhou [25], and Changzhou [39], with a predominant focus on residential [40,41] and industrial land [30,34,42]. However, there is a lack of systematic research on the overall identification of inefficient stock land covering all land-use types in urban areas.
From a methodological perspective, various initiatives have been implemented nationwide within the territorial spatial planning framework, leading to significant advancements in inefficient stock land investigation, evaluation, and renewal. Research has utilized drone technology [43], oblique photogrammetry, and satellite remote sensing methods [44] to acquire high-resolution remote sensing images and building-related information [45]. GIS-based urban land-use databases have been established, with inefficient land evaluation frameworks developed according to functional attributes [46,47,48]. Additionally, machine learning and deep learning techniques, particularly convolutional neural network-based image recognition, have been widely applied to classify urban spatial functions and assess land-use efficiency [49,50,51,52].
Beyond spatial data analysis, urban health assessments have been conducted in China, providing multidimensional evaluations of urban functions, facilities, and environments. Current research often constructs inefficient land evaluation indices based on social, economic, and environmental dimensions [32], employing a combination of qualitative and quantitative methods. Weight determination techniques, such as the Analytic Hierarchy Process (AHP) and Delphi method, are commonly used [53,54,55,56,57]. These approaches support the identification and assessment of inefficient stock land, providing a scientific basis for redevelopment. However, current inefficient land identification methods still face challenges, including large research scales, complex indicator systems, and subjectivity in evaluation. The identification process often relies on labor-intensive field surveys, requiring multiple stages of investigation, reporting, verification, and approval [37], limiting data timeliness and continuity while hindering precise urban-rural land classification and evaluation [58].
To address the limitations in identifying inefficient existing spaces (including single data sources, low accuracy, and poor method universality), this study leverages spatiotemporal geographic big data to construct an evaluation index system adaptable to complex land-use changes, integrating social, economic, and ecological dimensions. The entropy weight method is applied to determine indicator weights, while GIS-based spatial analysis enables multi-criteria evaluation. A mean-standardization method is then used to classify evaluation grades, achieving precise identification of inefficient stock land at the urban scale. A database of inefficient stock land in Shenzhen has been developed, providing fundamental data for redevelopment and in-depth analysis of its quantity and spatial distribution. Compared with traditional survey methods, this approach enables rapid, large-scale, and low-cost identification of multiple types of inefficient stock land in megacities. The study aims to provide a comprehensive understanding of Shenzhen's inefficient stock land, offering theoretical and practical insights into its spatial distribution and refined urban planning.
2. Materials and Methods
2.1. Study Area
According to the Shenzhen Statistical Yearbook 2023, Shenzhen has a total area of 1,997.47 km² and a permanent population of 17.79 million, with an urbanization rate of 99.81%, ranking first among Chinese cities. Meanwhile, Shenzhen is also the first city in China to enter the era of urban stock renewal [3]. In 2024, Shenzhen’s Yuanfen New Village urban village and Maozhou River ecological environment management project were selected as exemplary cases in the first batch of urban renewal demonstration projects announced by the Ministry of Housing and Urban-Rural Development. These projects provide important insights into improving urban renewal mechanisms, implementation methods, and technological approaches.
The study selects 2019 as the critical time point for identifying inefficient urban stock land in Shenzhen. This period is not only pivotal for Shenzhen's territorial spatial planning but also marks a milestone in its smart city development. Additionally, the public health crisis around 2019 heightened the urgency of identifying inefficient urban spaces. The selection of this time frame fully considers the specificity of the event and the accessibility of data. The administrative divisions of Shenzhen in 2019 are shown in Figure 1.
2.2. Data Sources and Data Processing
The year 2019 serves as the key temporal reference for this study. To ensure methodological rigor and facilitate cross-domain applicability, the selection of spatio-temporal big data adhered strictly to criteria of verifiability, accessibility, comparability, and computability. The utilized datasets encompass building data, land use data, population data, transportation data, economic statistics, and air quality data. Specifically, building data and Point of Interest (POI) data are sourced from the Baidu API, while traffic flow (Origin-Destination, OD) data are obtained from the Amap API. Population and GDP data with a 1 km spatial resolution are provided by the Institute of Geographic Sciences and Natural Resources Research, Chinese Academy of Sciences. Land use classification data are sourced from the Shenzhen Planning and Natural Resources Bureau, and CO2 Data are obtained from the National Earth System Science Data Center. Detailed data sources and descriptions are shown in Table 1.
Population and GDP data reflect regional economic vitality. Remote sensing images are used to acquire various land use types, such as farmland, forest land, and urban construction land, which serve as the fundamental units for Habitat Quality calculations. Additionally, CO2 concentration data is integrated to assess the ecological environment.
Transportation OD and POI data are spatially processed for mapping and spatial analysis. Traffic coverage is calculated based on POI transportation facilities, referencing the Design code for urban road and transportation planning, which considers a reasonable distance of 800 meters for bus stops and 1500 meters for subway stations when analyzing transportation accessibility.
The acquired multi-source data undergoes deduplication, missing value interpolation, and outlier removal. Non-spatial data is rasterized, and a GIS-based database is established. Spatial data undergoes coordinate projection transformation and geospatial registration. The registered data is clipped using the shapefile of Shenzhen for subsequent spatial overlay analysis. Finally, ArcMap 10.5 is used to integrate multi-source geographic data through a combination of GIS spatial analysis tools.
2.3. Methods
The study employs GIS spatial analysis techniques to quantify indicators and conduct weighted overlay analysis for identifying inefficient urban stock land. The technical framework is illustrated in Figure 2. Drawing on previous research and standards, and considering Shenzhen's regional characteristics, the study selects appropriate indicators from social, economic, and ecological dimensions to construct an indicator system for identifying inefficient urban stock land. The entropy weight method is used to determine indicator weights, and GIS spatial analysis is utilized for multi-indicator comprehensive evaluation. The results are classified using the mean-standard deviation method, with the first-level results serving as the identification criteria for inefficient urban stock land. Further analysis is conducted on its quantity and spatial variation characteristics.
2.3.1. Indicator System Based on a Multi-Factor Comprehensive Evaluation Method
This study is based on the intrinsic attributes of land resources, taking a comprehensive approach that balances social, economic, and ecological value orientations. Referring to the Standard for evaluation of saving and intensive use of construction land, an indicator system for identifying underutilized stock land was established through expert consultation, literature review, standard inquiries, and factor selection methods. From a social perspective, residents' quality of life, transportation accessibility, and public service facilities are essential aspects of measuring social benefits. The study selects three indicators—floor area ratio (FAR), transportation facility coverage (TFC), and living convenience (LC)—to quantify the contribution of land resources to social development. To assess economic benefits, indicators such as population size (POP), economic vitality (GDP), and human activity index (HAI) are used to reflect the role of different land use types in economic performance. For environmental benefits, ecological quality and pollutant emissions serve as key indicators of whether land development and utilization align with sustainability principles. Therefore, this study adopts the habitat quality index (HQ) and air quality index (AQ) as two indicators to represent environmental benefits. In summary, considering factors such as representativeness, suitability, dominance, and data availability, the study establishes a set of eight universal indicators across three dimensions. Detailed descriptions and calculation formulas are provided in Table 2.
2.3.2. Indicator Weights Determination
In this study, the entropy weight method is employed to calculate the weights of each indicator factor. The entropy weight method, also known as the information entropy method, is a technique for determining the weights of indicators by calculating information entropy under fuzzy conditions [15]. It primarily consists of three steps: indicator normalization, entropy value calculation, and entropy weight determination. Compared to other weight analysis methods such as the Analytic Hierarchy Process (subjective weighting), CRITIC method (numerical variability), and Principal Component Analysis (dimensionality reduction and variance calculation), the entropy weight method can effectively compute the weights of each indicator and objectively reflect the differences and importance among different indicator factors. Indicator normalization eliminates the influence of data with different dimensions and is processed using the range method (Equation 1). Entropy value calculation obtains the information content of each indicator factor (Equation 2), and entropy weight determination assigns weights to each indicator (Equations 3 and 4).
Here, represents the normalized result of each indicator, where denotes the j-th parameter of the i-th indicator, represents the minimum value of the j-th parameter, represents the maximum value of the i-th parameter, and denotes the proportion of the j-th parameter of the i-th indicator.represents the entropy value of the j-th parameter, and denotes the weight of the j-th parameter. For the weights of the three dimensions, the sum of the weights of each indicator is used as the evaluation criterion.
2.3.3. Mean-Standard Deviation Classification
The Mean-Standard Deviation method is a well-established data classification technique [16]. This study combines multi-objective weighted evaluation results with standard deviation thresholds to classify land into six levels (Table 3). The results of the first level are taken as the basis for the selection of stock land. Here, represents the comprehensive evaluation result, which is the weighted sum of the weights of each indicator and the indicator factors; represents the average value of the comprehensive evaluation results; and σ represents the standard deviation of the comprehensive evaluation.
2.3.4. Local Moran's I
Local Moran's I is a method for assessing the local spatial autocorrelation of spatial data [17] (Equation 5). By calculating the weights of each spatial unit and its adjacent spatial units, it verifies the spatial clustering and spatial heterogeneity of the region. A positive value indicates that a certain geographical feature and its neighboring units share similar high or low values, suggesting a clustered distribution of this feature; a negative value denotes values with distinct attribute characteristics, identifying them as outliers. When passing the P-test (P < 0.05), the clustered distribution and outliers hold statistical significance.
Here, represents the attribute of element i, is the average value of the attributes of adjacent spatial elements, is the weight between spatial element i and spatial element j, which can generally be represented by distance, and n is the number of elements in the geographic feature set.
3. Results
3.1. Spatial Heterogeneity Characteristics of Indicators
Based on the theoretical framework of geographical spatial heterogeneity, this study employed the Natural Breaks Classification method to categorize and visually represent eight core indicators into five levels (Figure 3). By applying the statistical clustering principle of minimizing intra-class variance and maximizing inter-class differences, the spatial heterogeneity patterns of each indicator were objectively identified. The spatial visualization results reveal that: Shenzhen's transportation network coverage is relatively high and exhibits a homogeneous distribution pattern. The FAR indicator forms a high-density continuous belt along the urban axis of Luohu-Futian-Nanshan near the Shenzhen-Hong Kong border, displaying a pronounced central decay pattern in its spatial distribution. The high-value areas of the dual-core indicators—population and GDP—are concentrated in the western part of the city, specifically in the Baoan central area-Qianhai cooperation zone, forming a multi-center linkage pattern with the traditional CBD. Static POI data and dynamic OD data reveal that the spatial differentiation of vitality hotspots in Shenzhen follows an agglomeration-diffusion model centered around commercial districts such as Coastal City, Convention and Exhibition Center, Science and Technology Park, and MixC World. Analysis of ecological environment indicators shows a significant spatial coupling between the Habitat Quality and the distribution of forest, wetland, and water resources within the ecological control line, highlighting the service functions of critical ecological nodes.
Notably, the spatial distribution of CO₂ concentration in Shenzhen exhibits a typical "low-high-low" concentric structure. CO₂ levels are lower in the western coastal areas and eastern Dapeng New District, which are urban fringe zones, while peaking in the urban core and gradually decreasing toward the peripheral ecological control zones. This gradient characteristic aligns with Shenzhen's polycentric and clustered urban spatial structure, corroborating the environmental effects of a compact urban development model.
3.2. Multidimensional Indicators Weight Analysis
The indicator weight system constructed based on information entropy theory (Figure 5) reveals the heterogeneous characteristics of factors influencing urban spatial efficiency. The entropy weight method calculation results, as illustrated in the radar chart (Table 4), indicate that LC (0.261) and FAR (0.221) constitute the core driving factors, with a cumulative contribution rate of 48.2%, underscoring the dominant role of urban functional mix and spatial intensity in the evaluation of existing land use. In contrast, transportation facility coverage (0.053) exhibits the lowest weight, which aligns with the relatively balanced distribution of transportation facilities in Shenzhen, as shown in Figure 4. The homogeneous distribution of infrastructure results in significantly lower information entropy for this indicator compared to others. The convergence of weights for total population (0.073), CO₂ concentration (0.068), and GDP (0.063) warrants attention, with a possible explanation being the reduced sensitivity of these indicators due to the 1 km × 1 km spatial resolution limitation.
From a systemic dimension analysis, the weights of social indicators (0.534), economic indicators (0.294), and ecological indicators (0.172) exhibit structural coupling with Shenzhen's polycentric axial expansion urban spatial morphology. The dominant weights of the first two categories reflect the synergistic development of "scale-efficiency" in high-density built-up areas, while stable pattern of ecological indicators reduces their decision-making weight, scientifically validating the effectiveness of Shenzhen's ecological control line policy.
3.3. Identification Results of Existing Land Stock Area
Using spatial weighted overlay analysis and a mean-standard deviation classification model, areas with comprehensive evaluation scores below one standard deviation from the mean (i.e., the lowest grade in the evaluation results) were identified as inefficient existing land area (Figure 5). The study identified a total of 65.37 km² of inefficient existing land in Shenzhen, accounting for approximately 7% of the city's construction land in 2019. This result aligns with official statistics showing that Shenzhen's stock residential land area reached approximately 1000 hectares (10 km²) in 2019 (https://www.sz.gov.cn/), with residential land accounting for ~20% of total construction land. Clusters mainly appear in the northwestern part of the city, including administrative boundary zones and urban fringe areas, exhibiting a notably homogeneous spatial distribution pattern. After overlaying land use data and excluding non-target plots such as scenic spots within the ecological control line and major infrastructure sites (e.g. airports, ports), the identified inefficient land (Figure 5-b) serves as the result for Shenzhen's inefficient existing land in 2019.
Spatial statistical analysis indicates a significant negative correlation between the scale of inefficient land and the level of regional development. The inefficient existing land in Shenzhen is primarily distributed in the northwestern part of the city, including administrative boundary zones and urban fringe areas. Specifically, Longgang District (21.11 km²) and Baoan District (12.57 km²) collectively contribute 51.5% of the inefficient land, which is directly related to their "urban-rural intertwined" spatial morphology. In contrast, the low value in Futian Central District (0.62 km²) confirms the saturation of land use in high-intensity development zones. The inefficient land in Nanshan District (5.13 km²) is mainly concentrated around Xili University Town, reflecting the lag in functional replacement of educational and scientific land in response to the city's innovation-driven development strategy. Dapeng New District (3.11 km²), as an ecotourism-dominated area, has inefficient land primarily due to development control of unused coastal land. Notably, Longhua (5.83 km²), Guangming (5.68 km²), Pingshan (5.43 km²), Nanshan (5.13 km²), and Luohu (3.79 km²) exhibit similar scales of inefficient existing land, forming a medium-gradient cluster. The structured differences in land use efficiency among administrative units spatially correspond to Shenzhen's polycentric networked urban spatial structure.
3.4. Spatial Patterns and Driving Forces of Inefficient Land Stock
Utilizing local spatial autocorrelation analysis, this study reveals significant spatial clustering characteristics of inefficient existing land in Shenzhen (p < 0.01), which is crucial for understanding the interrelationships among inefficient land data and regional disparities. The results (Figure 7) indicate that high-high (H-H) clustering units are uniformly distributed within Longgang District and Nanao Subdistrict (in Dapeng New District). High-low (H-L) and low-low (L-L) heterogeneous clustering zones form gradient transition belts along administrative boundaries, with H-L types concentrated in contiguous hotspot areas such as Buji, Qingshuihe, Minzhi, Xili, and Xixiang subdistricts, as well as the eastern part of Guangming District. Low-high (L-H) clustering units are densely distributed in the transitional zone between Longhua and Longgang Districts, where spatial gradient variations are most pronounced in typical areas such as Fukang, Shuijing, Shangmugu, and Fucheng'ao. This highlights the discontinuity in land use efficiency between urban core areas and peripheral expansion zones.
GIS spatial adjacency analysis further reveals that some inefficient existing land is adjacent to ecological spaces (e.g., woodlands and water bodies), with notable concentrations along the edges of ecological corridors such as Tanglang Mountain and Yinhu Mountain. This spatial coupling phenomenon can be attributed to the restrictive effects of ecological management policies on the development intensity of adjacent areas, leading to a lag in land functional replacement relative to urban expansion demands. From a spatial econometric perspective, the research findings validate the synergistic influence of the dual driving factors — "edge effects" and "ecological constraints"— on the formation of inefficient land.
4. Discussion
This study constructed a three-dimensional "social-economic-ecological" evaluation system for identifying inefficient urban existing land by integrating multi-source spatiotemporal data. Using the entropy weight method and spatial autocorrelation analysis, it revealed the spatial distribution patterns and formation mechanisms of inefficient existing land in Shenzhen (2019). The results show that the total area of inefficient existing land in Shenzhen is 65.37 km², accounting for 7% of the city's construction land, with a significant clustering pattern primarily distributed in administrative border areas such as Longgang and Bao'an, as well as along ecological corridor fringes. This phenomenon is closely related to the spatial evolution model of "rapid expansion-boundary stitching" in urban development: early extensive development led to complex land ownership and mixed functions in urban-rural fringe areas, while ecological control line policies imposed rigid constraints on development intensity in adjacent areas. The dual effects have turned these regions into low-efficiency zones for land use.
Compared to megacities like Beijing and Shanghai, Shenzhen has a relatively lower proportion of inefficient existing land but exhibits higher spatial fragmentation [4,36], reflecting the contradiction between its polycentric networked urban structure and land scarcity under high-intensity development. Although Shenzhen generally achieves high land-use efficiency, localized "efficiency-locked" phenomena persist due to historical urban-rural mixed patterns, delayed functional replacement under ecological constraints, and insufficient coverage of public service facilities.
The proposed multi-source data fusion method overcomes the limitations of traditional manual surveys and single-source remote sensing identification. By synergistically analyzing dynamic OD data and static POI data, it achieves dual-dimensional validation of "human activity intensity-spatial functional compatibility." Innovatively, this study incorporates ecological constraint indicators such as air quality into the evaluation system, establishing a more comprehensive spatial efficiency assessment framework. Compared to fixed-weight models [27], the entropy-based flexible indicator system dynamically responds to differences in urban development stages, reflecting the spatial efficiency characteristics of high-density cities through core indicators like LC and FAR. However, the study still faces constraints in data timeliness and spatial scale dependency—1 km resolution may obscure micro-level plot heterogeneity, necessitating future integration of street-view imagery and deep learning models for refined identification [49].
The indicator system design adheres to universal principles across social, economic, and ecological dimensions, making it suitable for identifying inefficient land in high-density urban areas. However, data dependency may limit its application in small and medium-sized cities—for instance, some underdeveloped regions lack OD trajectory or high-precision building data, requiring adaptive adjustments using alternative data sources such as nighttime lights or mobile signaling [52]. The static indicator weight system struggles to dynamically respond to urban development stage transitions; future research could introduce time-series analysis to construct adaptive weight models. Additionally, the study unit scale (1 km²) limits identification accuracy for micro-level inefficient spaces like urban villages, necessitating integration with street-view imagery and deep learning techniques for plot-level refinement [49].
Spatial econometric analysis reveals that approximately 23% of inefficient land is adjacent to ecological control lines, confirming the synergistic effects of "edge effects" and "policy inertia." Tailored renewal strategies should be adopted for different spatial types: in urban-rural mixed areas, implement the "whole-village coordination + unit development" model, drawing lessons from the micro-renewal experience of Yuanfen New Village; in ecologically sensitive areas, explore "ecological banking" and ecology-oriented development mechanisms; in efficiency transition zones, prioritize transit-oriented underground space development. Differentiated renewal strategies can provide scientific support for Shenzhen's "14th Five-Year Plan" urban renewal initiatives while offering a reference paradigm for the governance of existing spaces in the Guangdong-Hong Kong-Macao Greater Bay Area urban agglomeration.
5. Conclusions
Taking Shenzhen City as an empirical case study, this research constructs a framework based on multi-source spatiotemporal data for the identification and characteristic analysis of inefficient existing land. Through the Entropy Weight Method - Mean-Standard Deviation model, it achieves the automated evaluation of city-wide land use efficiency in this mega-city, providing methodological innovation and a practical paradigm for spatial renewal in high-density cities. The research found that Shenzhen's inefficient existing land exhibits an "edge aggregation and corridor extension" spatial pattern, and its formation is subject to the compound influence of historical development patterns, ecological control policies, and urban spatial structure. Compared with official land survey data, the identification results demonstrate high credibility in spatial distribution and scale statistics, particularly in typical areas such as the Buji-Bantian sector in Longgang District and the Songgang-Shajing cluster in Baoan District, where the results align closely with field surveys.
The study confirms the technical advantages of spatiotemporal geographic big data in identifying inefficient existing land, offering quantitative support for delineating urban renewal units. Future research could deepen in the following directions: (1) constructing a multi-scale collaborative analysis framework integrating satellite nighttime light data and mobile signaling to establish a dynamic monitoring platform linking "city-level" and "plot-level"; (2) introducing reinforcement learning models to simulate renewal response mechanisms under different policy scenarios, providing predictive support for spatial governance. With the accelerating digital transformation in territorial spatial governance, the proposed technical framework could be upgraded into a standard module for urban spatial health assessment, offering a benchmark paradigm for optimizing existing spaces nationwide. Follow-up studies will focus on comparative research across the Guangdong-Hong Kong-Macao Greater Bay Area urban agglomeration to reveal spatial spillover effects of land use efficiency among cities, providing scientific basis for regional coordinated development policies.
Author Contributions
Conceptualization, Minmin Li, Ding Ma, and Ye Zheng; methodology, Wei Zhu and Yebin Chen; formal analysis, Wei Zhu and Yafei Wang; data curation, Wei Zhu; writing—original draft preparation, Minmin Li, Wei Zhu, Yafei Wang, and Shilong Wei; writing—review and editing, Wei Zhu, Minmin Li, Yafei Wang, Ye Zheng, Xiaoming Li, and Shilong Wei; funding acquisition, Minmin Li and Xiaoming Li. All authors have read and agreed to the published version of the manuscript.
Funding
This work was supported by National Key R&D Program of China (2023YFC3804800), and the Open Fund of Key Laboratory of Urban Land Resources Monitoring and Simulation, Ministry of Natural Resources (KF-2023-08-17).
Data Availability Statement
The data presented in this study are available upon request from the corresponding author.
Conflicts of Interest
The authors declare no conflicts of interest.
References
- Wu, Z.; Wu, J.; Zhang, J.; et al. Implementation Mechanisms for the Renewal and Renovation of Aging Residential Communities in Urban Areas. Urban Planning Journal 2021, 3, 1–10. [Google Scholar] [CrossRef]
- Huang, L., Zheng, W., Hong, J., et al. Paths and strategies for sustainable urban renewal at the neighborhood level: A framework for decision-making[J]. Sustainable Cities and Society, 2020. 55. [CrossRef]
- Zou, B. From Physical Expansion to Built-up Area Improvement: Shenzhen Master Plan Transition Forces And Paths. Planner 2013, 29, 5–10. [Google Scholar] [CrossRef]
- Tian, L.; Yao, Z.; Yu, J.; et al. Evolution and Transition of Urban Renewal Planning in China: An Analytical Framework of State-Market-Society Relationship. Planner 2024, 40, 1–7. [Google Scholar] [CrossRef]
- Mou, G.; Liu, R.; Peng, Q. A Study on Methods for Identifying Renewal Targets in the Context of National Land Space—A Case Study of Zoucheng. In Proceedings of the China Urban Planning Annual Conference, Wuhan, Hubei, China; 2023. [Google Scholar]
- Yount, K.R.; Meyer, P.B. Project Scale and Private Sector Environmental Decision Making: Factors Affecting Investments in Small- and Large-Scale Brownfield Projects. Urban Ecosystems 1999, 3, 179–193. [Google Scholar] [CrossRef]
- Glumac, B.; Han, Q.; Schaefer, W.; et al. Negotiation Issues in Forming Public–Private Partnerships for Brownfield Redevelopment: Applying a Game Theoretical Experiment. Land Use Policy 2015, 47, 66–77. [Google Scholar] [CrossRef]
- Longo, A.; Campbell, D. The Determinants of Brownfields Redevelopment in England. Environmental and Resource Economics 2017, 67, 261–283. [Google Scholar] [CrossRef]
- Firman, T. Major Issues in Indonesia's Urban Land Development. Land Use Policy 2004, 21, 347–355. [Google Scholar] [CrossRef]
- Garba, S.B.; Al-Mubaiyedh, S. An Assessment Framework for Public Urban Land Management Intervention. Land Use Policy 1999, 16, 269–279. [Google Scholar] [CrossRef]
- Green, T.L. Evaluating Predictors for Brownfield Redevelopment. Land Use Policy 2018, 73, 299–319. [Google Scholar] [CrossRef]
- Roose, A.; Kull, A.; Gauk, M.; et al. Land Use Policy Shocks in the Post-Communist Urban Fringe: A Case Study of Estonia. Land Use Policy 2013, 30, 76–83. [Google Scholar] [CrossRef]
- Devkota, P.; Dhakal, S.; Shrestha, S.; et al. Land Use Land Cover Changes in the Major Cities of Nepal from 1990 to 2020. Environmental and Sustainability Indicators 2023, 17, 100227. [Google Scholar] [CrossRef]
- Pineda-Pinto, M.; Frantzeskaki, N.; Chandrabose, M.; et al. Planning Ecologically Just Cities: A Framework to Assess Ecological Injustice Hotspots for Targeted Urban Design and Planning of Nature-Based Solutions. Urban Policy and Research 2022, 40, 206–222. [Google Scholar] [CrossRef]
- Huang, Z.; Li, X. Comparative Study on the Policy Mechanism of Urban Renewal Life Cycle Management. Urban and Rural Construction 2023, 2, 38–41. [Google Scholar]
- Liang, Y.; Zeng, P. Evolution of Value-Added Revenue Distribution Mechanism for the Renewal of Stock Industrial Land in Beijing. Urban Planning Journal 2023, 1, 69–73. [Google Scholar] [CrossRef]
- Mo, Z.; Ye, Q.; Zhao, Y. The Evolutionary Context of Policies, Theories and Practices for the Utilization of Stock Construction Space in China. Economic Geography 2022, 42, 156–167. [Google Scholar] [CrossRef]
- Lin, Q.; Li, M.; Li, Q.; et al. A New Model of Existing Land Stock Development: The Research of Land Readjustment Planning and Policy Mechanism in Shenzhen. Urban and Rural Planning 2022, 3, 127–132. [Google Scholar] [CrossRef]
- Lin, Q.; Li, Y.; Xia, H.; et al. From Separation to Integration: Policy Reflections and Suggestions on the Development of Existing Land Stock in Shenzhen. Urban Planning Journal 2020, 2, 89–94. [Google Scholar] [CrossRef]
- Dai, Z.; Sun, Y.; Qin, Q. Integrated Development of the Stock Land and Urban Rail Transit in Shenzhen. Urban Transport 2023, 21, 23–31. [Google Scholar] [CrossRef]
- Fan, S. Research on Recognition Methods of Inefficient Construction Land Based on Remote Sensing and Open Data in Baiyun District of Guangzhou City. Master's Thesis, South China Agricultural University, Guangzhou, China, 2019. [Google Scholar] [CrossRef]
- Zhong, T.; Li, C.; Yao, N.; et al. Exploration of Identification Methods for Inefficient Urban Land Use Under the National Spatial Planning Framework: A Case Study of Chengdu’s Downtown Area. Sichuan Environment 2020, 39, 140–150. [Google Scholar] [CrossRef]
- Wang, L. Identification of Low-Utility Land in Urban Centers Using Entropy Weight-BP Neural Network. Master's Thesis, Nanjing Normal University, Nanjing, China, 2021. [Google Scholar] [CrossRef]
- Wang, Y.; Wang, K.; Hao, R.; et al. Study on the Identification and Redevelopment Path of Urban Low-Utility Land: Taking the Central City of Hohhot as an Example. Journal of Northeast Normal University (Natural Science Edition) 2023, 55, 139–150. [Google Scholar] [CrossRef]
- Sun, L. Study on the Identification of Inefficient Residential Land in the Ancient City of Suzhou from the Perspective of System Theory. Urban Architecture 2024, 21, 101–104. [Google Scholar] [CrossRef]
- Li, X. Research on the Identification and Redevelopment Potential of Low-Efficiency Industrial Land in Downtown Areas: A Case Study of Two Districts in Nanjing. Master's Thesis, 2018.
- Tian, Y.; Jiang, L. Research on the Potential Evaluation Method of Stock Land Based on GIS: A Case Study of Gulou District, Nanjing. Urban Housing 2019, 26, 150–151. [Google Scholar] [CrossRef]
- Guan, W.; Li, Y. Analysis of the Current Situation and Potential Evaluation of Inefficient Urban Land in Anyang City. Land Resources Informatization 2020, 2, 54–59. [Google Scholar]
- Xiang, M. Research on the Identification and Redevelopment Potential of Inefficient Industrial Land under the Background of Inventory Planning. Master's Thesis, Central China Normal University, Wuhan, China, 2021. [Google Scholar] [CrossRef]
- Zhang, C. Potential Evaluation of Urban Low-Efficiency Industrial Land Redevelopment Based on Scenario Planning. Ph.D. Thesis, China University of Mining and Technology, Xuzhou, China, 2023. [Google Scholar] [CrossRef]
- Wang, T. Study on Identification and Redevelopment of Inefficient Land in Kaifeng City. Master's Thesis, Henan University, Kaifeng, China, 2022. [Google Scholar] [CrossRef]
- Huang, Y.; Yang, Z. Research Progress of Urban Land Redevelopment in China Land and Natural Resources Research 2022, 6, 20–24. [CrossRef]
- Xu, W. Research on Identification and Redevelopment Strategy of Inefficient Land Use in Suichuan County Based on “Pressure-State-Response” Model. Master's Thesis, Jiangxi Agricultural University, Nanchang, China, 2023. [Google Scholar] [CrossRef]
- Shi, L. Research on the Construction of Low-Efficiency Industrial Land Evaluation Index System and Countermeasures: A Case Study of Guangxi Development Zone. Master's Thesis, Guangxi University, Nanning, China, 2023. [Google Scholar] [CrossRef]
- Lian, Y. Survey Methods and Development Strategies for Inefficient Urban Land. Real Estate World 2024, 18, 35–37. [Google Scholar]
- Meng, P.; Hao, J.; Zhou, N.; et al. Research on Evaluation of Industrial Land Intensive Use in the Context of New Urbanization: A Case Study in Yizhuang New Town. China Land Science 2014, 28, 83–89. [Google Scholar] [CrossRef]
- Zhong, S. Identification and Redevelopment of Inefficient Industrial Land in Zhuhai Based on Performance Evaluation. Urban Architectural Space 2023, 30, 116–118. [Google Scholar] [CrossRef]
- Liu, J.; Liang, R.; Liu, T. Practice and Reflection on the "Mapping and Storage" Work of Inefficient Urban Land Redevelopment in Chengdu. Resources and Human Settlements 2024, 7, 60–63. [Google Scholar] [CrossRef]
- Xiao, D. Evaluation of Industrial Land and Redevelopment of Inefficient Land in Xinbei District of Changzhou. Master's Thesis, Nanjing Agricultural University, Nanjing, China, 2019. [Google Scholar] [CrossRef]
- Wang, J. Research on Low-Efficiency Land Use Identification of Urban Housing Based on AMM Model Theory Price: A Case of Ulanhot Urban Area. Master's Thesis, Inner Mongolia Normal University, Hohhot, China, 2021. [Google Scholar] [CrossRef]
- Liu, Y. Research on Inefficient Residential Land Identification Method Based on Multi-Source Data: A Case Study of Wanquan Urban District, Zhangjiakou City. Master's Thesis, Hebei University of Architecture, Zhangjiakou, China, 2023. [CrossRef]
- Zhao, K.; Chen, B.; Zhang, S. Research Progress and Hotspot Analysis of Stock Planning in China Based on Cite Space. In Proceedings of the Annual National Urban Planning Conference, Wuhan, China, 2023.
- Sun, G.; Pan, X. Survey and Research on Urban Inefficient Land Redevelopment Based on Uav Tilt Photogrammetry Technology. Jiangxi Building Materials 2019, 12, 55+57. [Google Scholar] [CrossRef]
- Li, X. Application of Aerial Imagery in Urban Land Surveys. Beijing Surveying and Mapping 2005, 4, 44–47. [Google Scholar] [CrossRef]
- Li, J.; Zhang, L.; Wu, B.; et al. Study on Extracting Building Density and Floor Area Ratio Based on High Resolution Image. Remote Sensing Technology and Application 2007, 3, 309–313. [Google Scholar] [CrossRef]
- Zeng, S.; Xue, Y.; Xu, C.; et al. Multi-criteria Evaluation on the Inefficient of Urban Land Use Based on the Major Function Oriented Zone: A Case of Xuzhou City. Land and Natural Resources Research 2018, 3, 24–28. [Google Scholar] [CrossRef]
- Jia, Y. Identification and Optimization Strategy for Inefficient Industrial Land in Urban Built-up Area of Shrinking City: A Case Study of Qiqihar. Master's Thesis, Central China Normal University, Wuhan, China, 2020. [Google Scholar] [CrossRef]
- Peng, H.; Li, H.; Wu, Y. Investigation of Inefficient Land Using 3D Modeling Based on Urban Cadastral Database. China Agricultural Resources and Regionalization 2020, 41, 72–79. [Google Scholar] [CrossRef]
- Chen, J.; Chen, L.; Li, Y.; et al. Measuring Physical Disorder in Urban Street Spaces: A Large-Scale Analysis Using Street View Images and Deep Learning. Annals of the American Association of Geographers 2023, 113, 469–487. [Google Scholar] [CrossRef]
- Hu, W.; Winter, S.; Khoshelham, K. Forecasting Fine-Grained Sensing Coverage in Opportunistic Vehicular Sensing. Computers, Environment and Urban Systems 2023, 100, 101939. [Google Scholar] [CrossRef]
- Laport-López, F.; Serrano, E.; Bajo, J.; et al. A Review of Mobile Sensing Systems, Applications, and Opportunities. Knowledge and Information Systems 2020, 62, 145–174. [Google Scholar] [CrossRef]
- Wang, X.; Meng, X.; Wang, C.; et al. Identification of inefficient spaces in resource-depleted cities: A case study of Hegang City. Resources Science 2024, 46, 1119–1130. [Google Scholar] [CrossRef]
- Chen, Z.; Bi, R.; Chen, L.; et al. Identification and Inquiry of Urban Inefficient Industrial Land Based on Multi-Level Indicator System: A Case Study of Yushe County, Shanxi Province. China Agricultural Resources and Regionalization 2019, 40, 31–38. [Google Scholar]
- Shao, J. Research on Recognition and Synergy Strategies of Inefficient Industrial Land: A Case Study of Dongcheng Park in Jieshou High-Tech Zone, Fuyang, Anhui. Urban Housing 2019, 26, 87–92. [Google Scholar] [CrossRef]
- Ding, Y.; Guo, Q.; Chen, Z.; et al. Identification and redevelopment strategy of underused urban land in underdeveloped counties using system theory. Transactions of the Chinese Society of Agricultural Engineering 2020, 36, 316–326. [Google Scholar] [CrossRef]
- Lu, Z.; Wang, H.; Liu, G.; et al. The Spatial Reconstruction of Inefficient Land Redevelopment under Ecological-Economic Competition and Cooperation: A Case Study of Urban District in Zhanjiang. China Land Science 2018, 32, 34–41. [Google Scholar] [CrossRef]
- Qu, Z.; Wang, C.; Gao, L. The Urban Inefficient Industrial Land Evaluation based on the Principle of Land-saving: Taking Hailing District of Taizhou, Jiangsu Province as an Example. China Land Science 2018, 32, 50–56. [Google Scholar] [CrossRef]
- Ma, X. Current Identification and Redevelopment Practices of Inefficient Land. China Bidding 2024, 8, 200–203. DOI: 10.3969/j.issn.1004-2415.2024.8. zhonggzb202408066.
- Shenzhen Stock Residential Land Information (as of March 31, 2024): Location Map of Shenzhen Stock Residential Land. Available online: https://pnr.sz.gov.cn/xxgk/ztzl/rdzt/clzzyd/content/post_11251635.html (accessed on 19 April 2024).
Figure 1.
Administrative Divisions of Shenzhen in 2019.
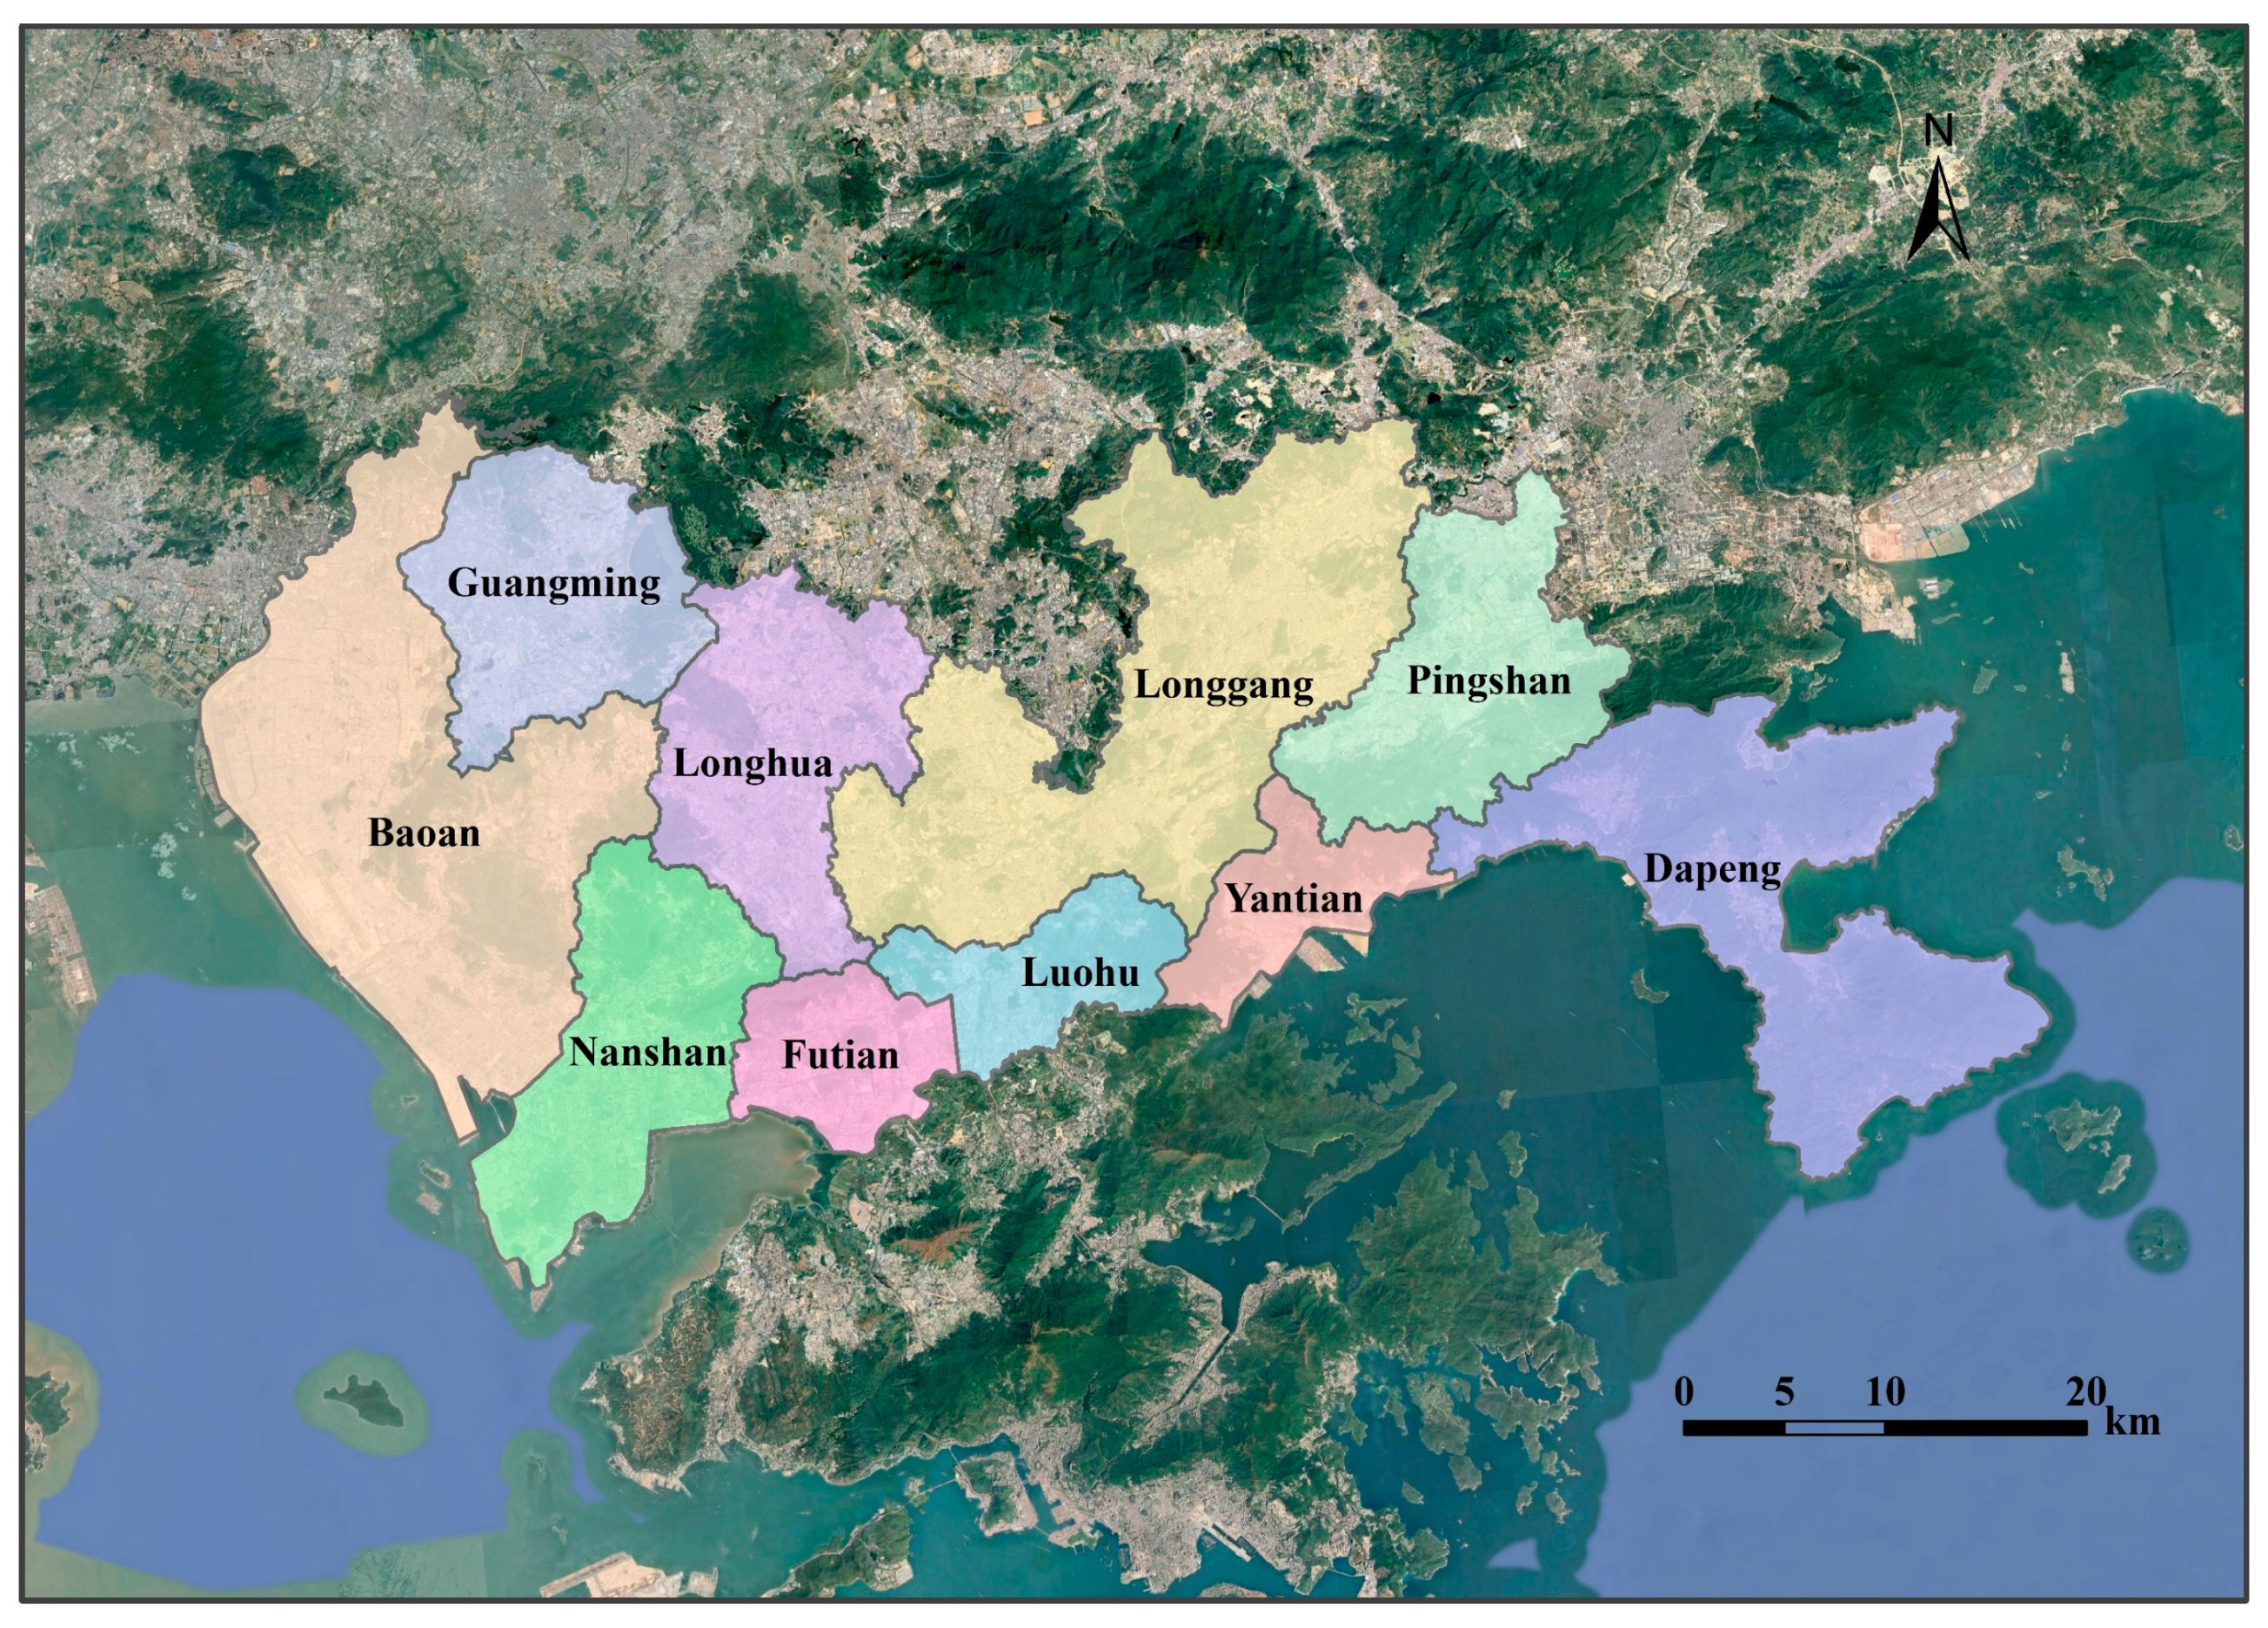
Figure 2.
Technical Framework.
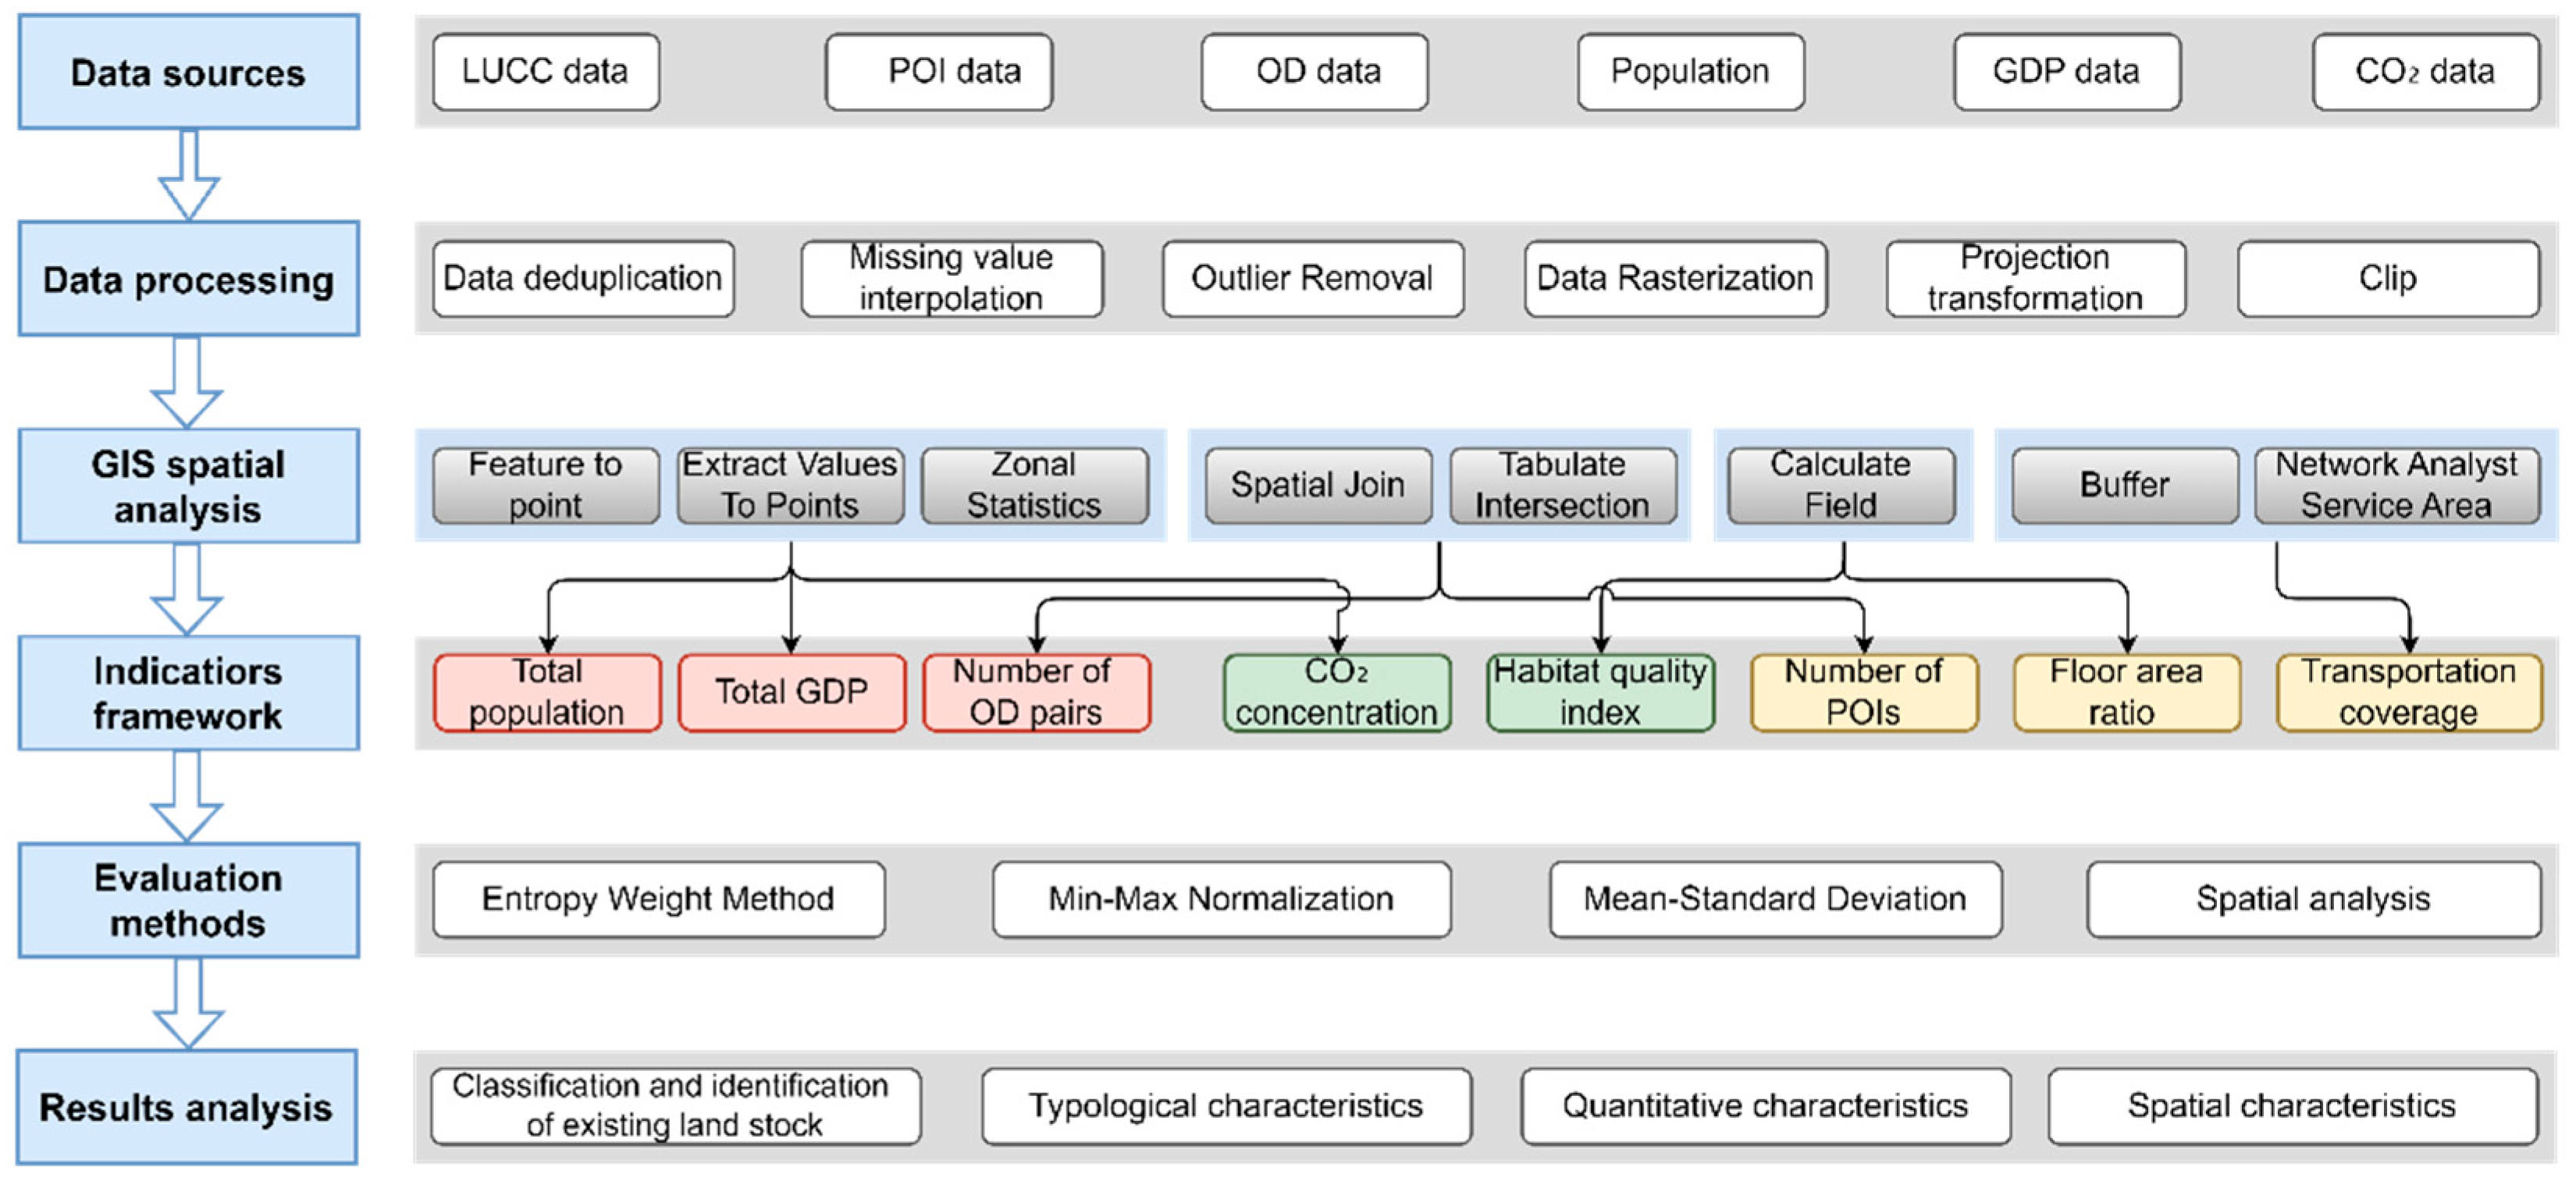
Figure 3.
Spatial Characteristics of Eight Indicators in Shenzhen (2019).
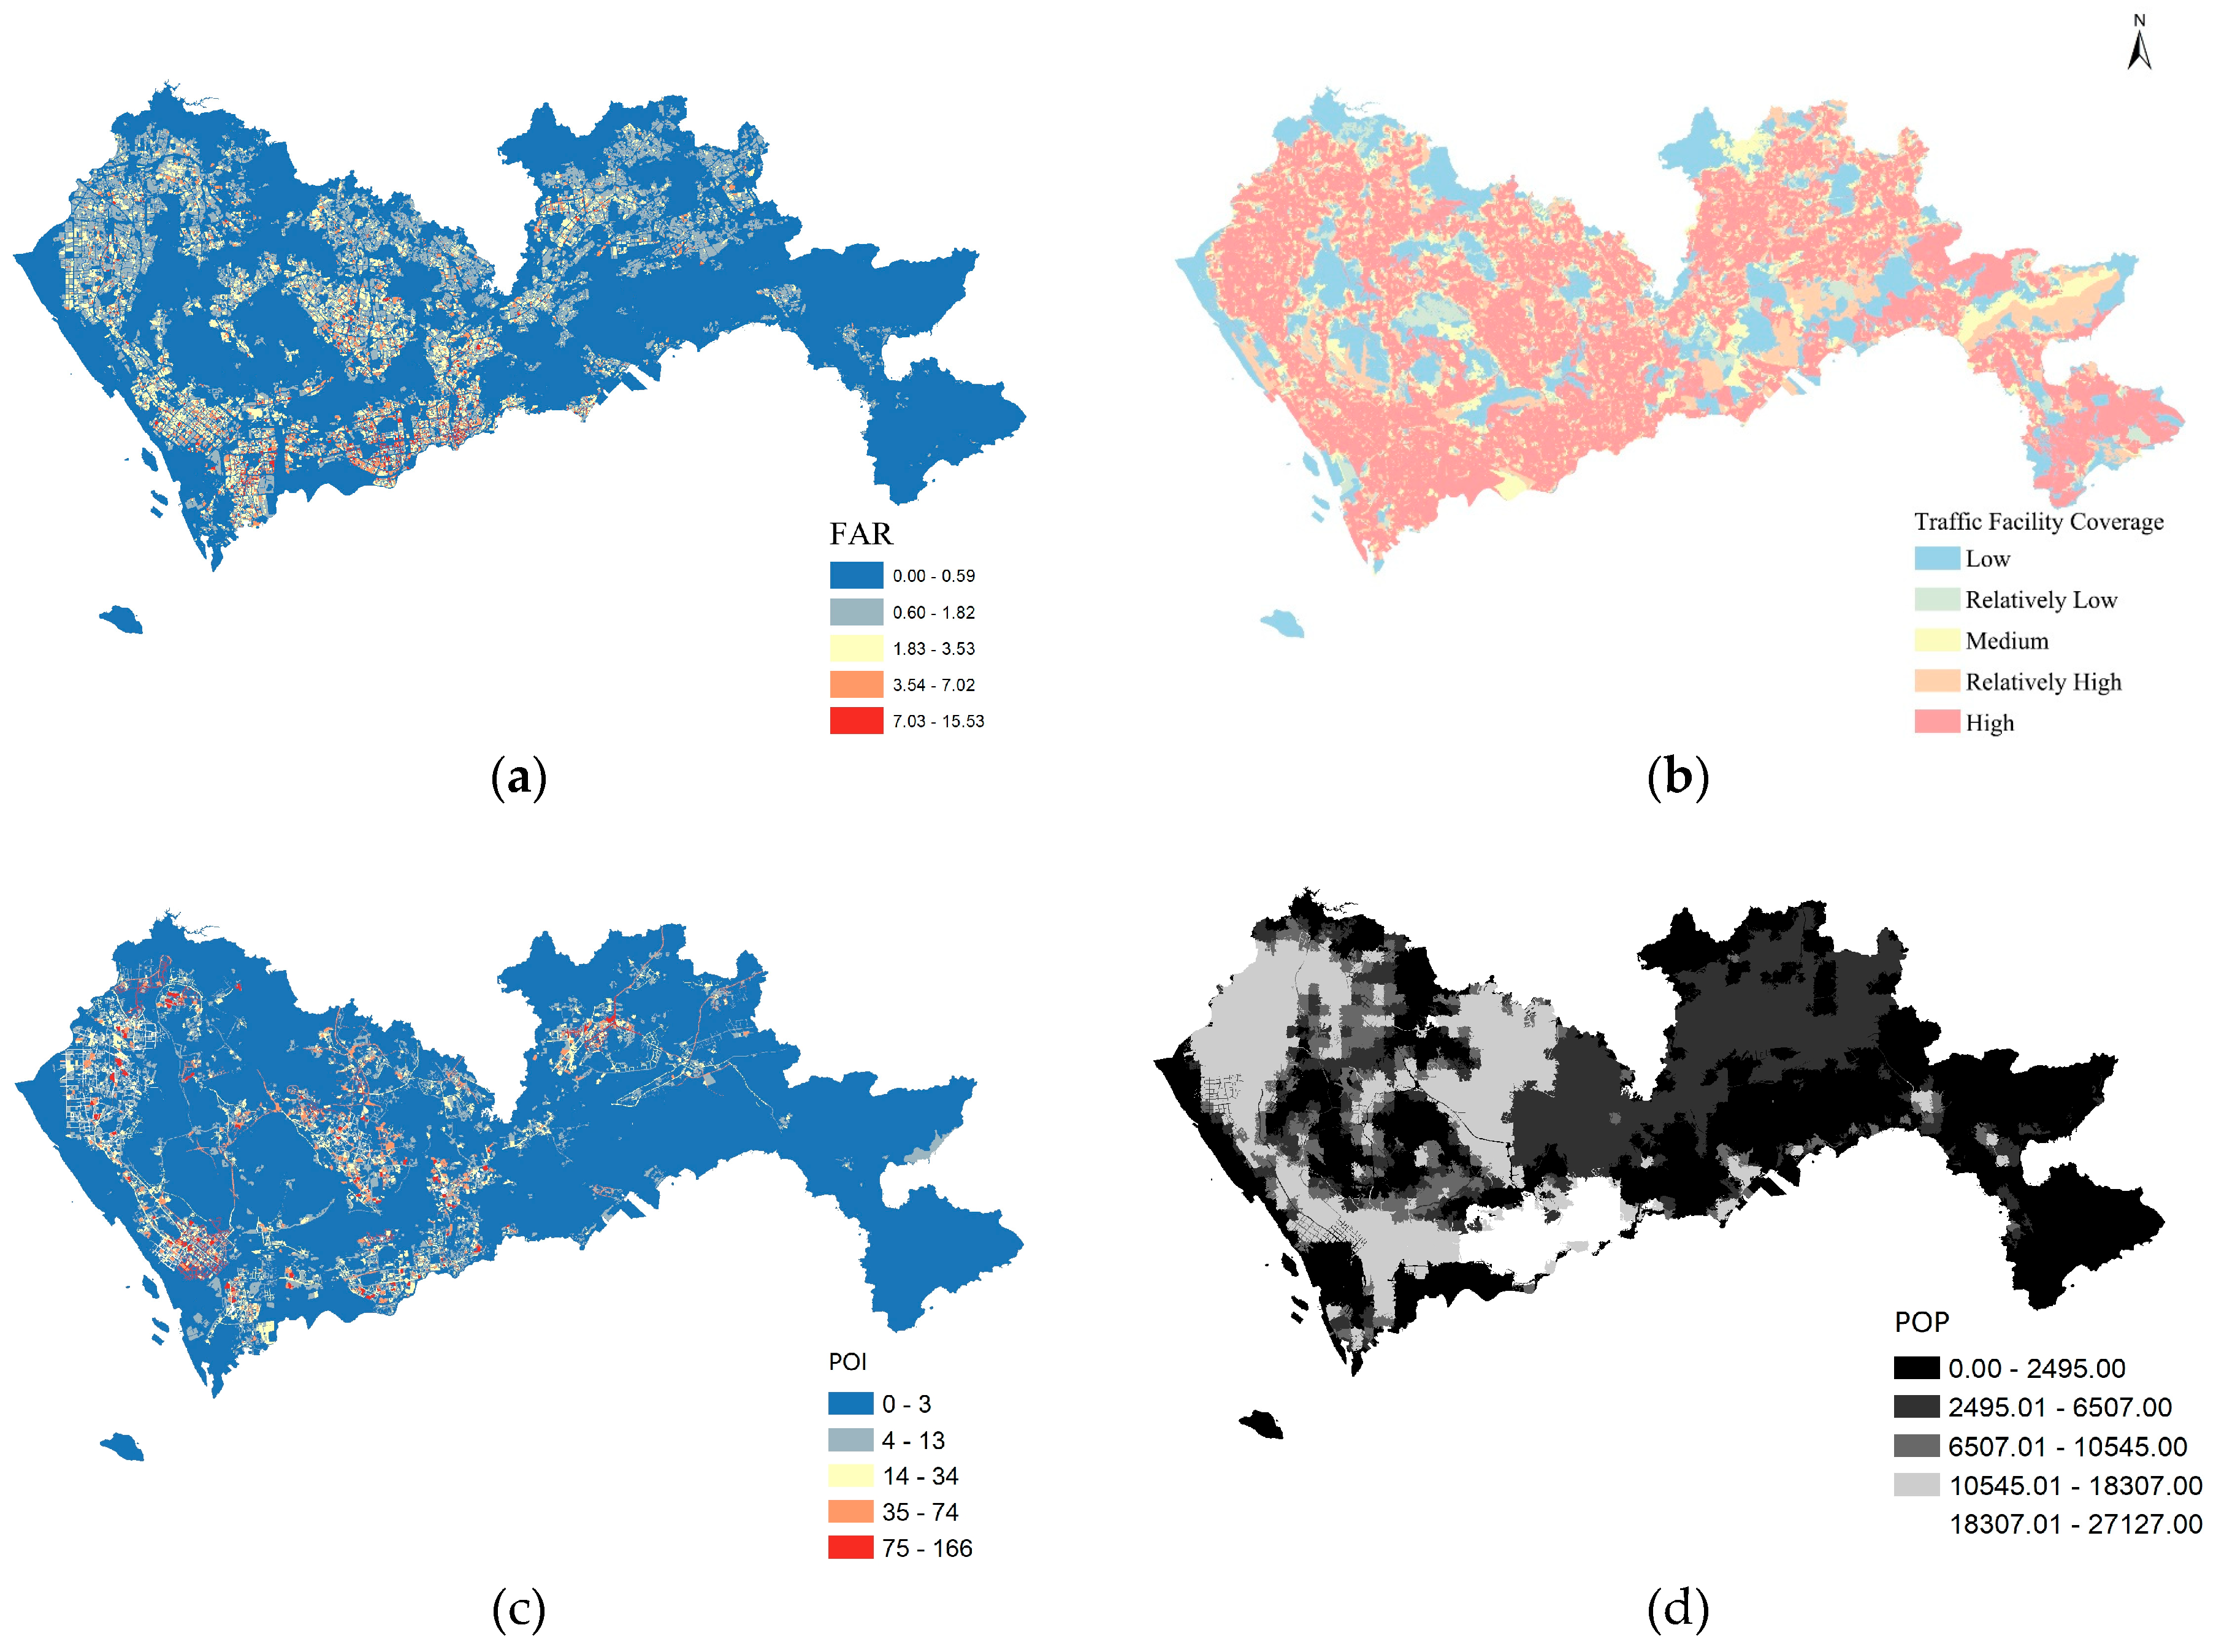
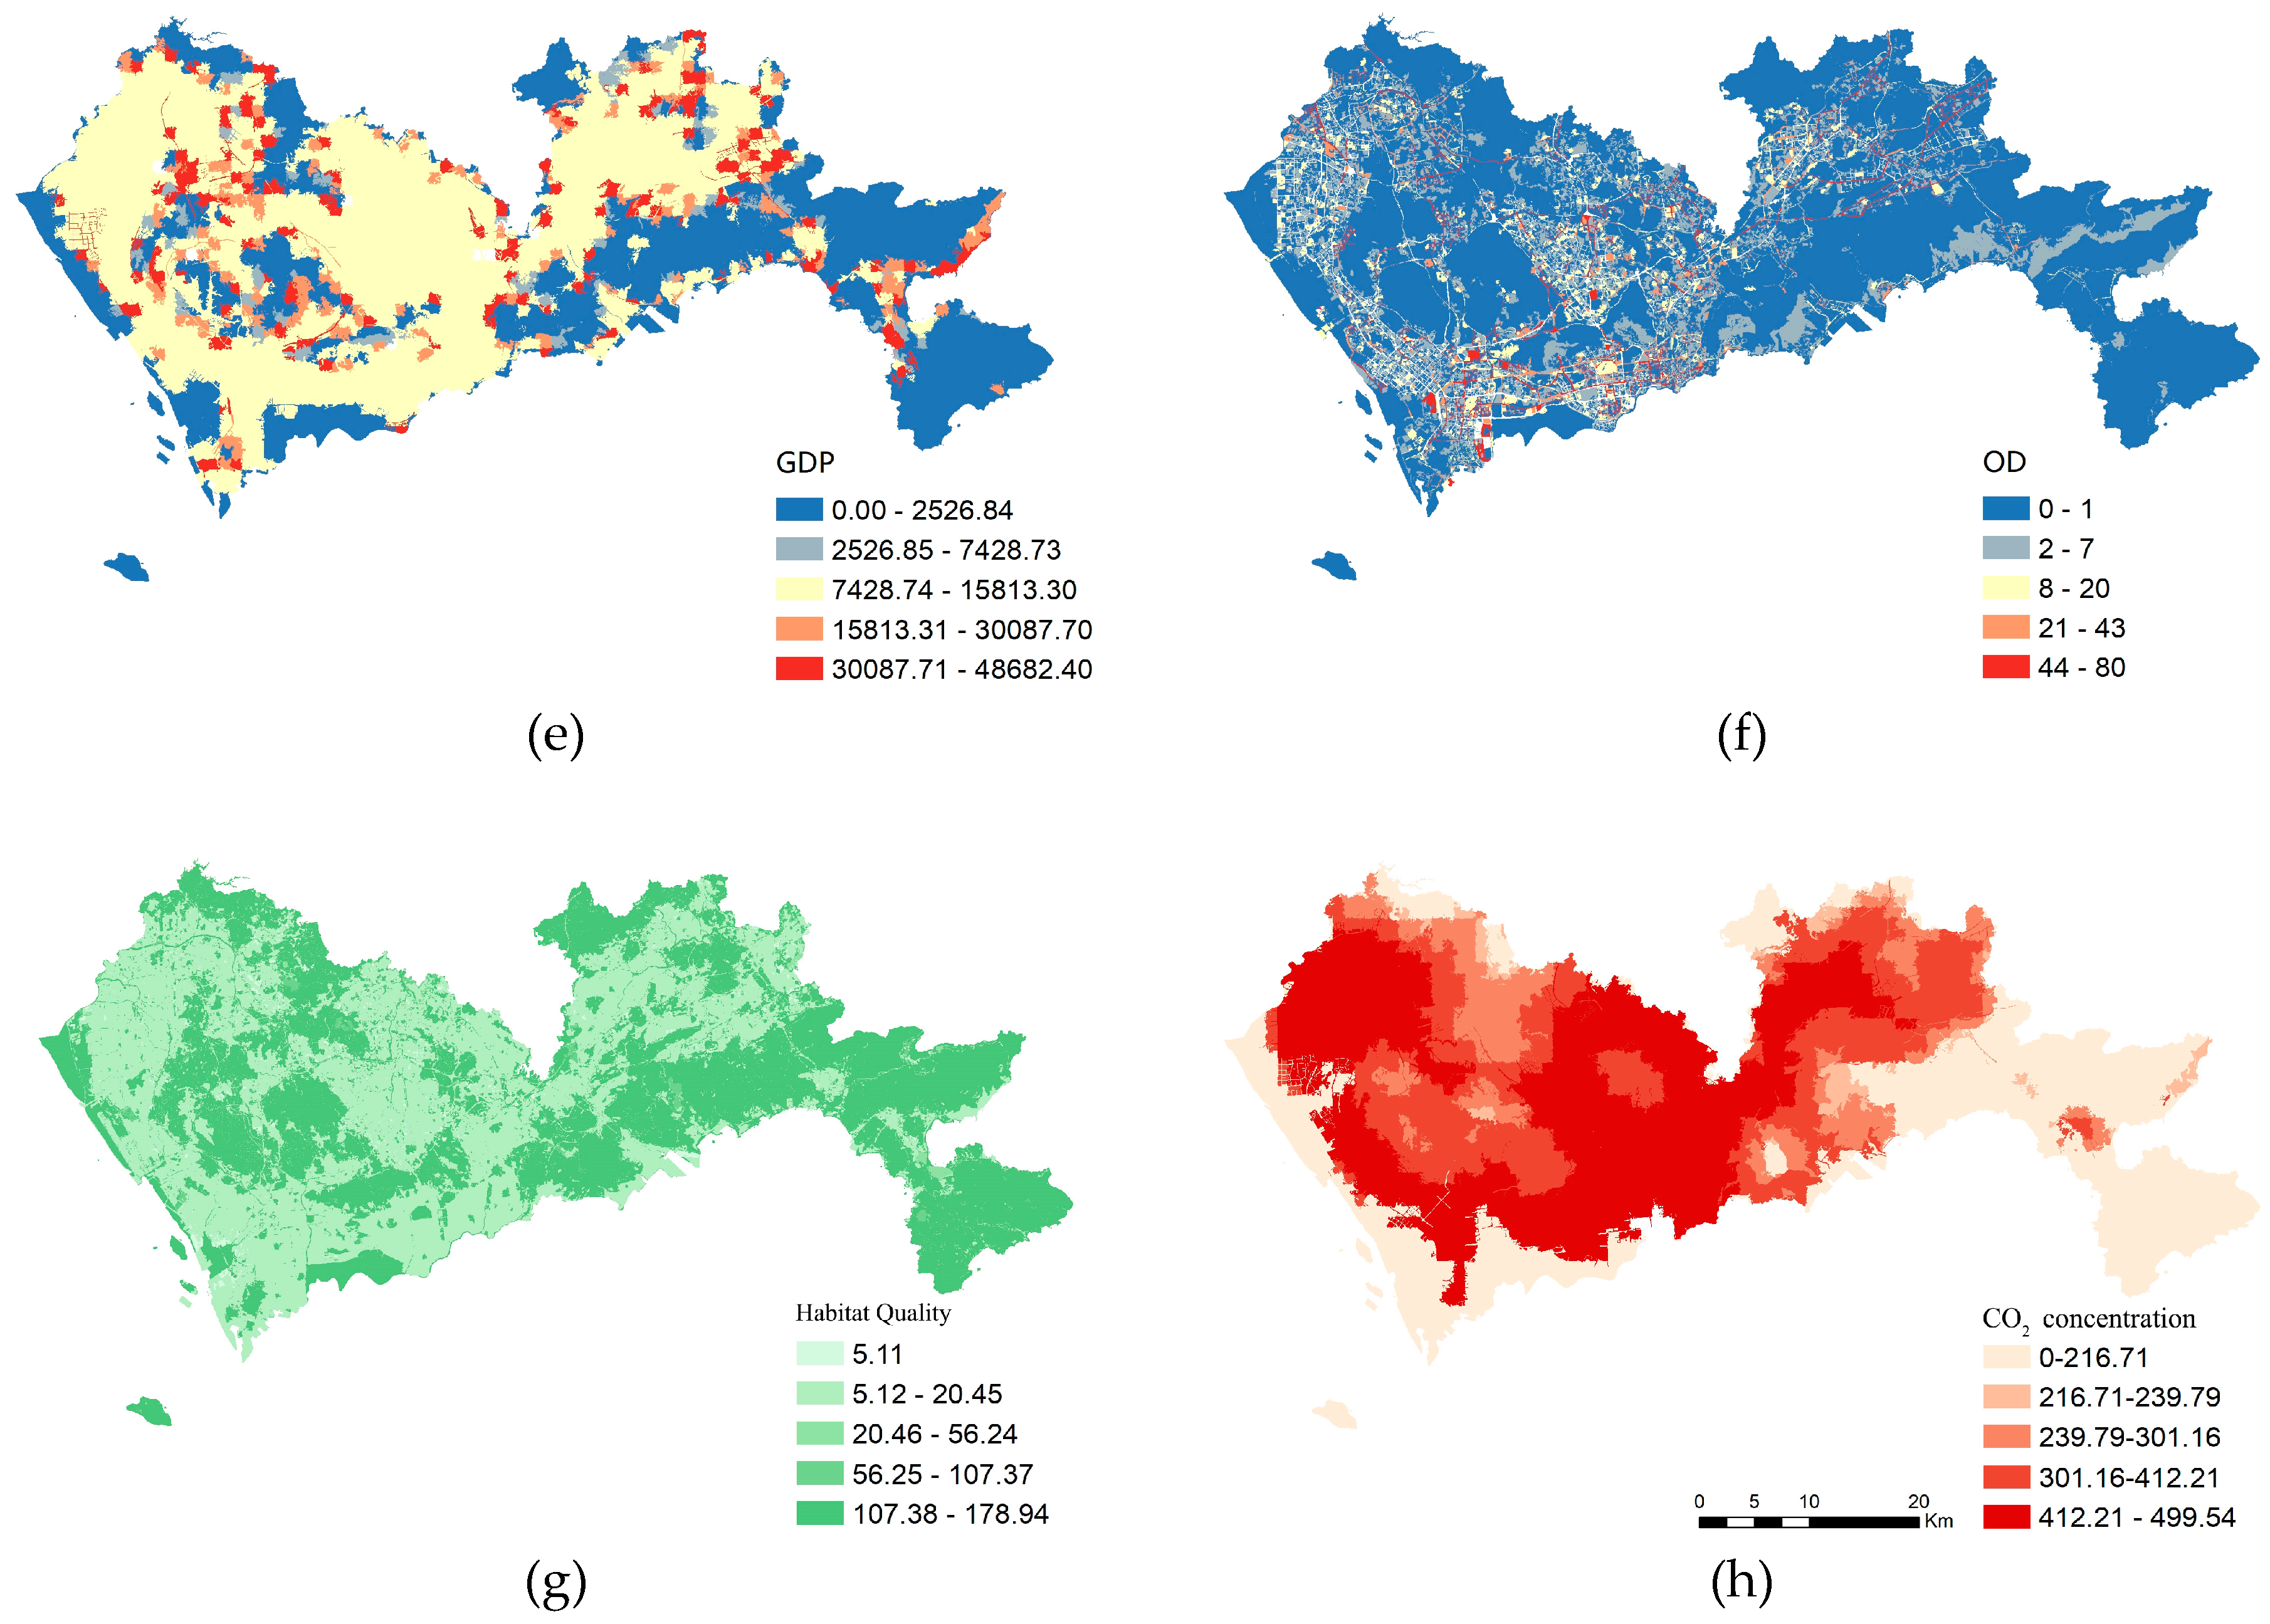
Figure 4.
Weight Values of Indicator Factors.
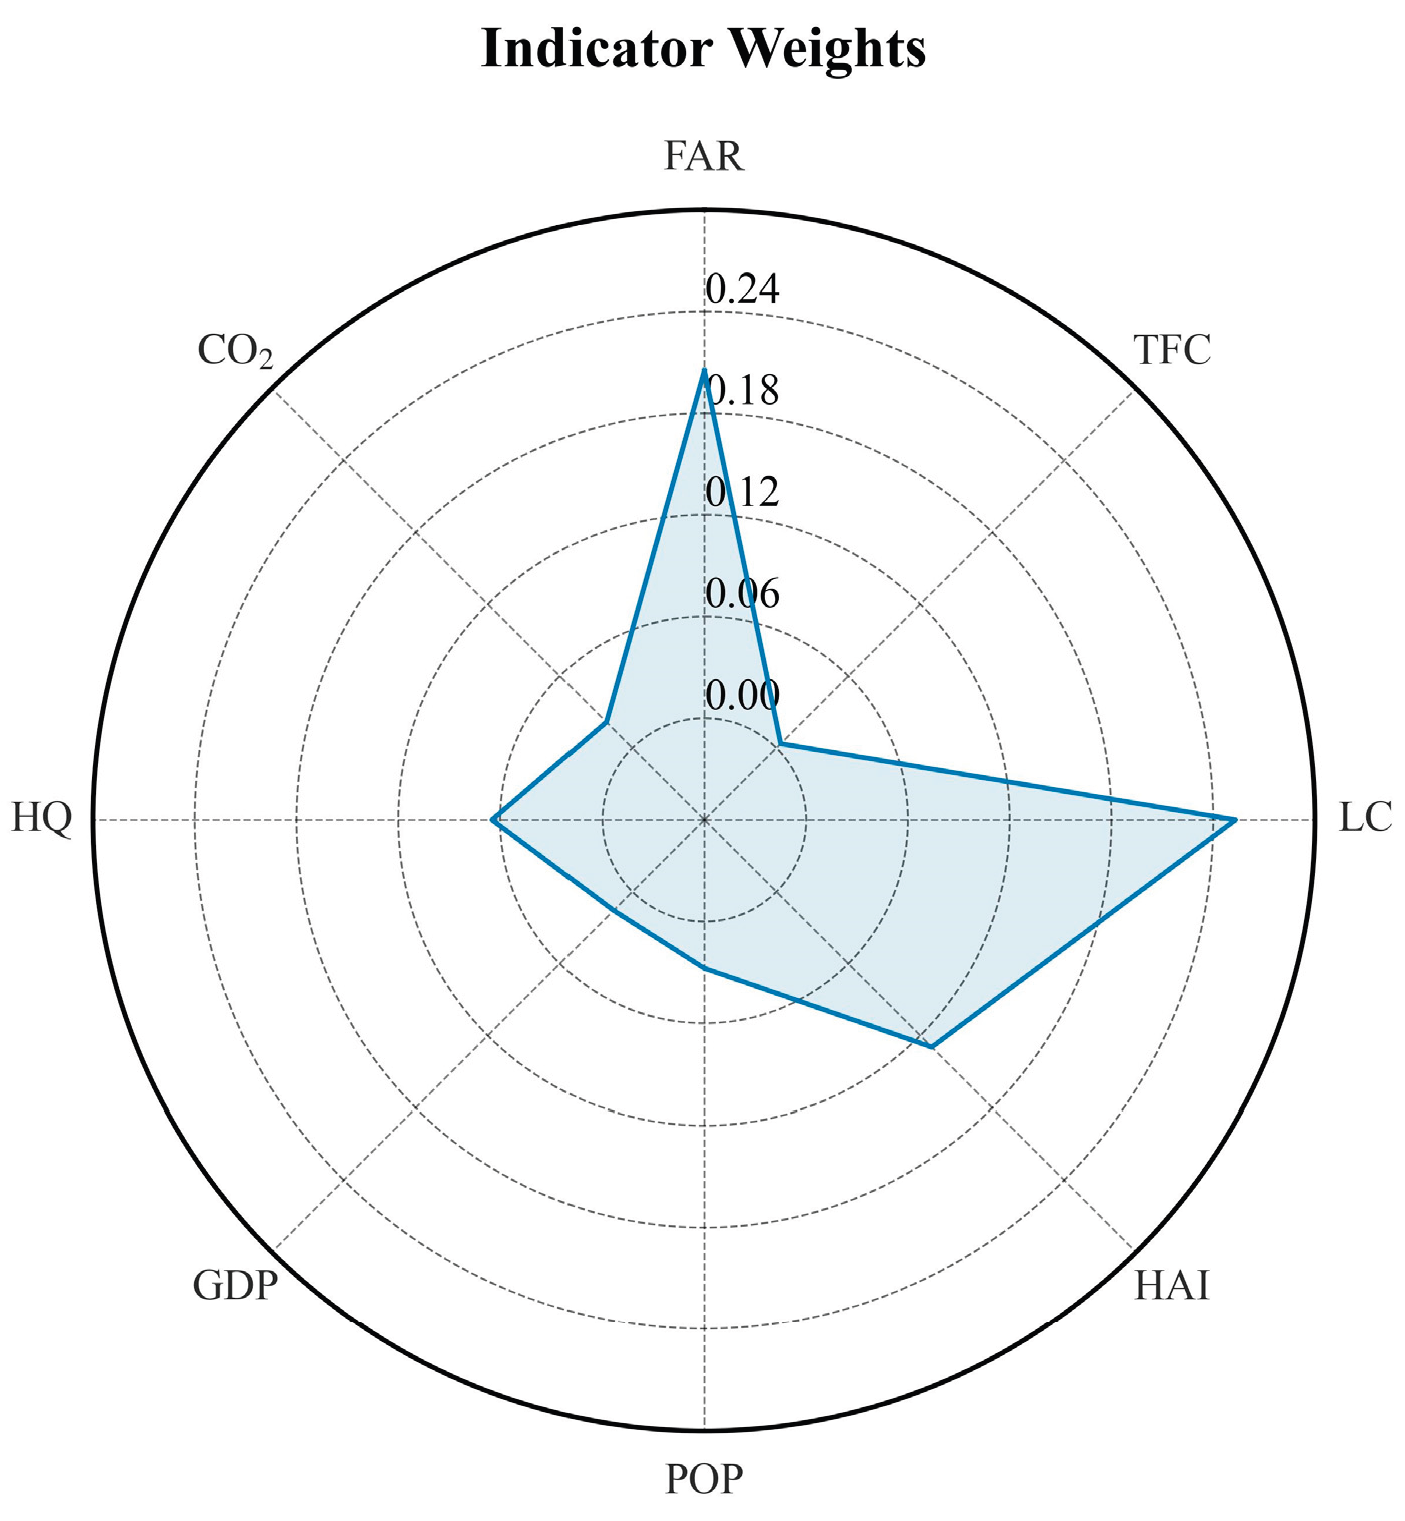
Figure 5.
Spatial Distribution of Inefficient Existing Land in Shenzhen (2019).
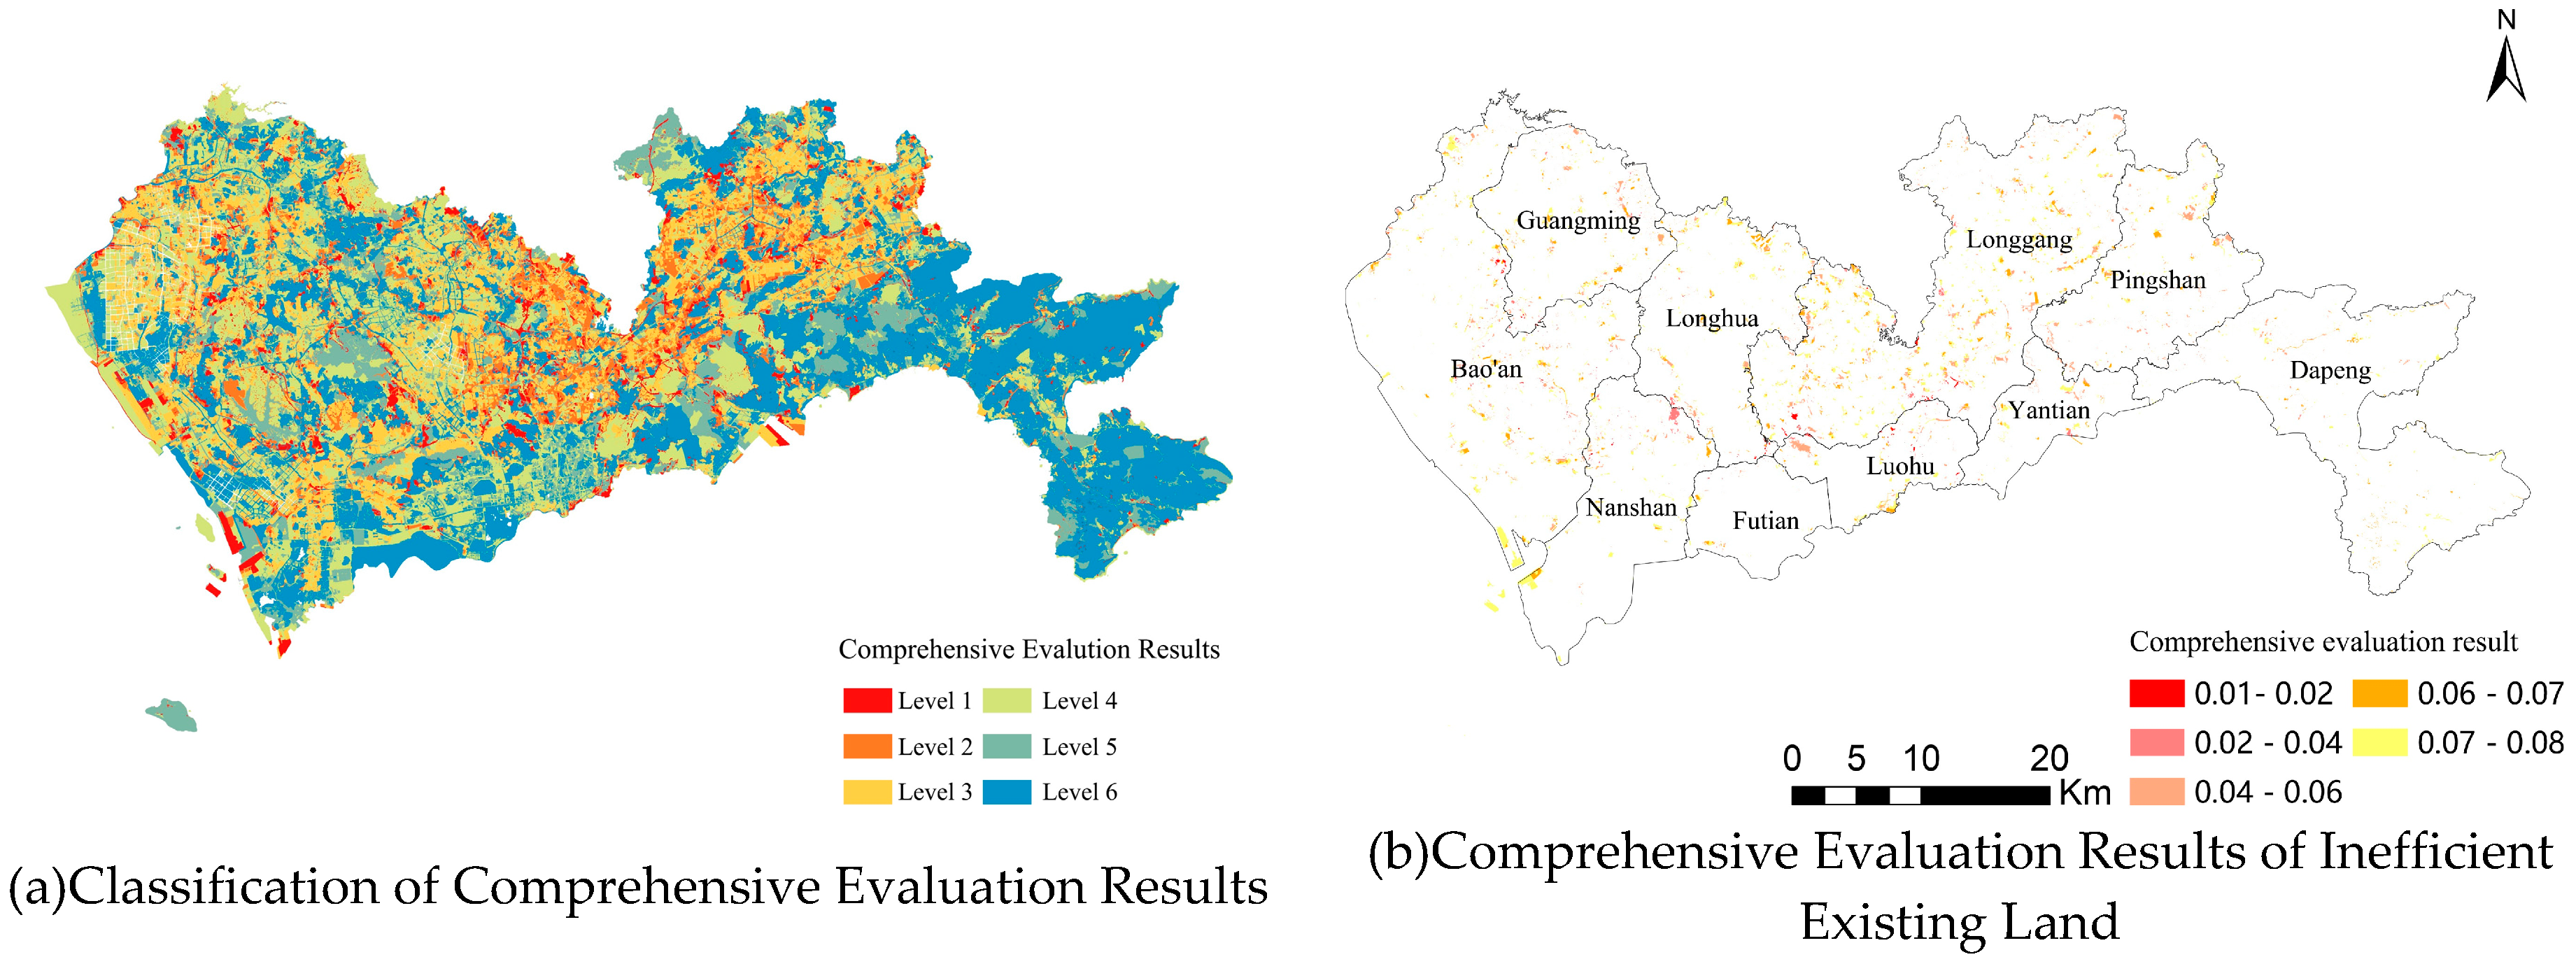
Figure 6.
Area of Inefficient Existing Land in Shenzhen's Administrative Districts (2019).
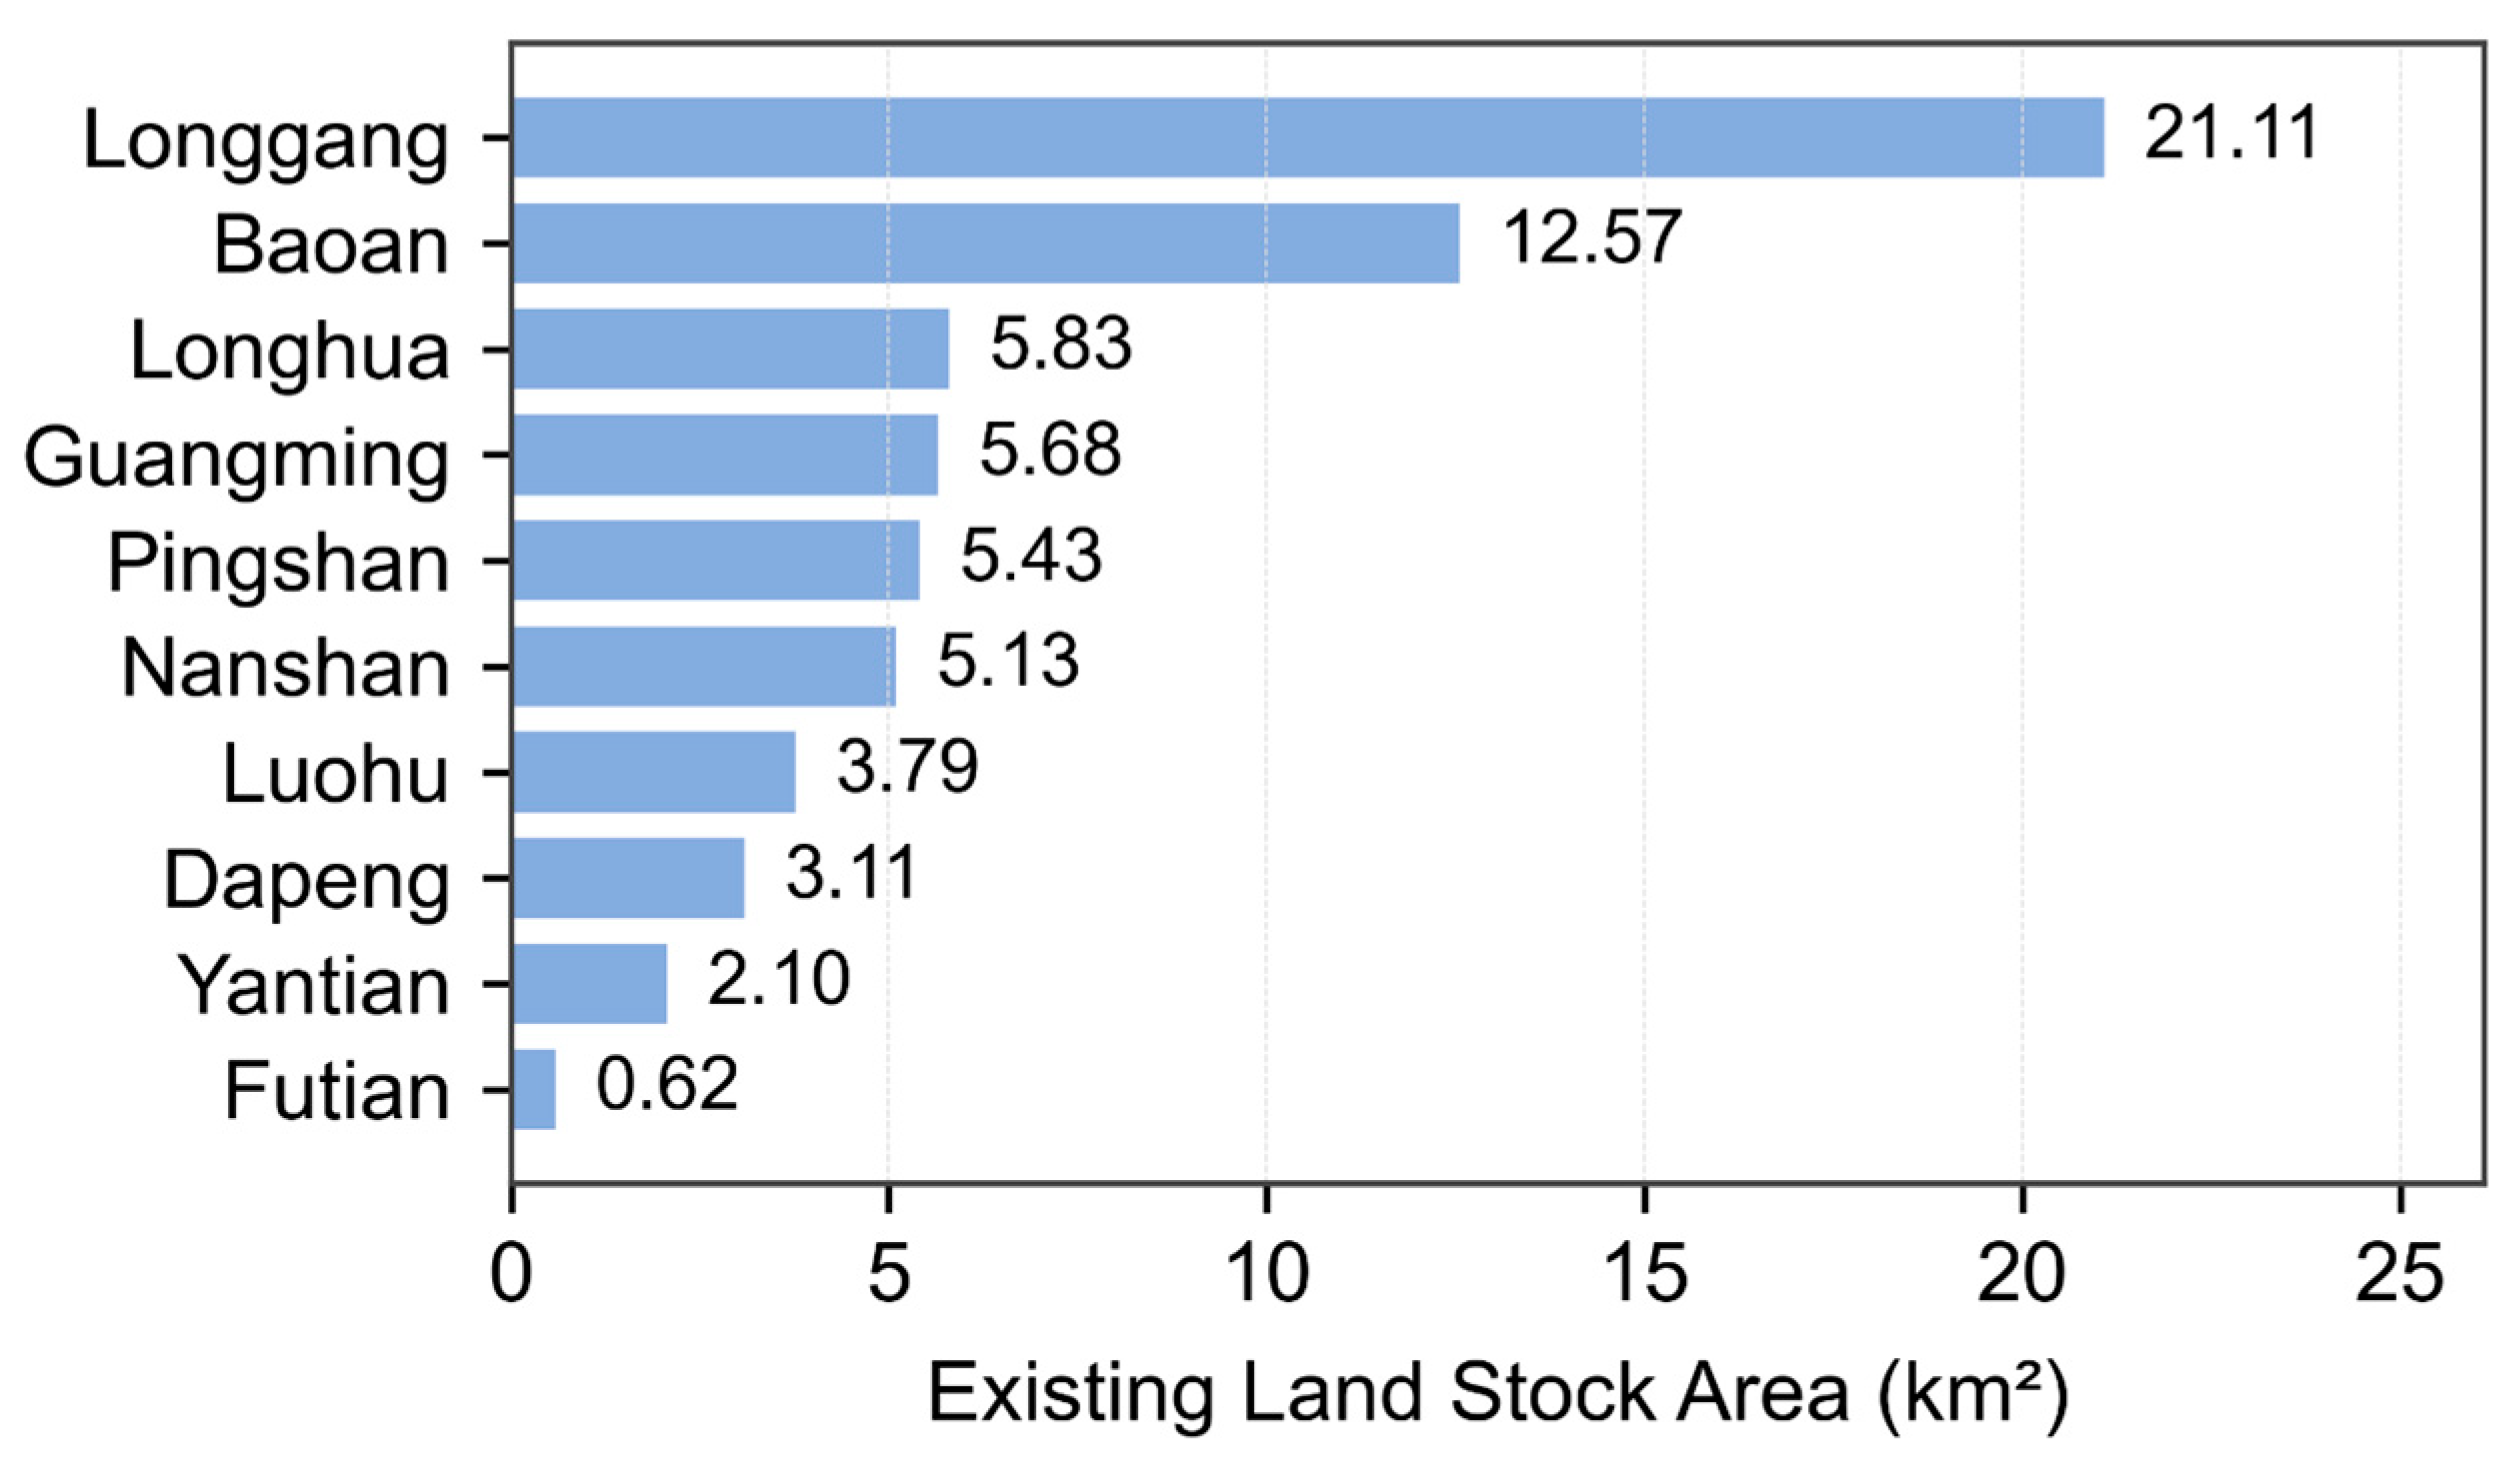
Figure 7.
Spatial Autocorrelation Analysis of Inefficient Existing Land in Shenzhen (2019).
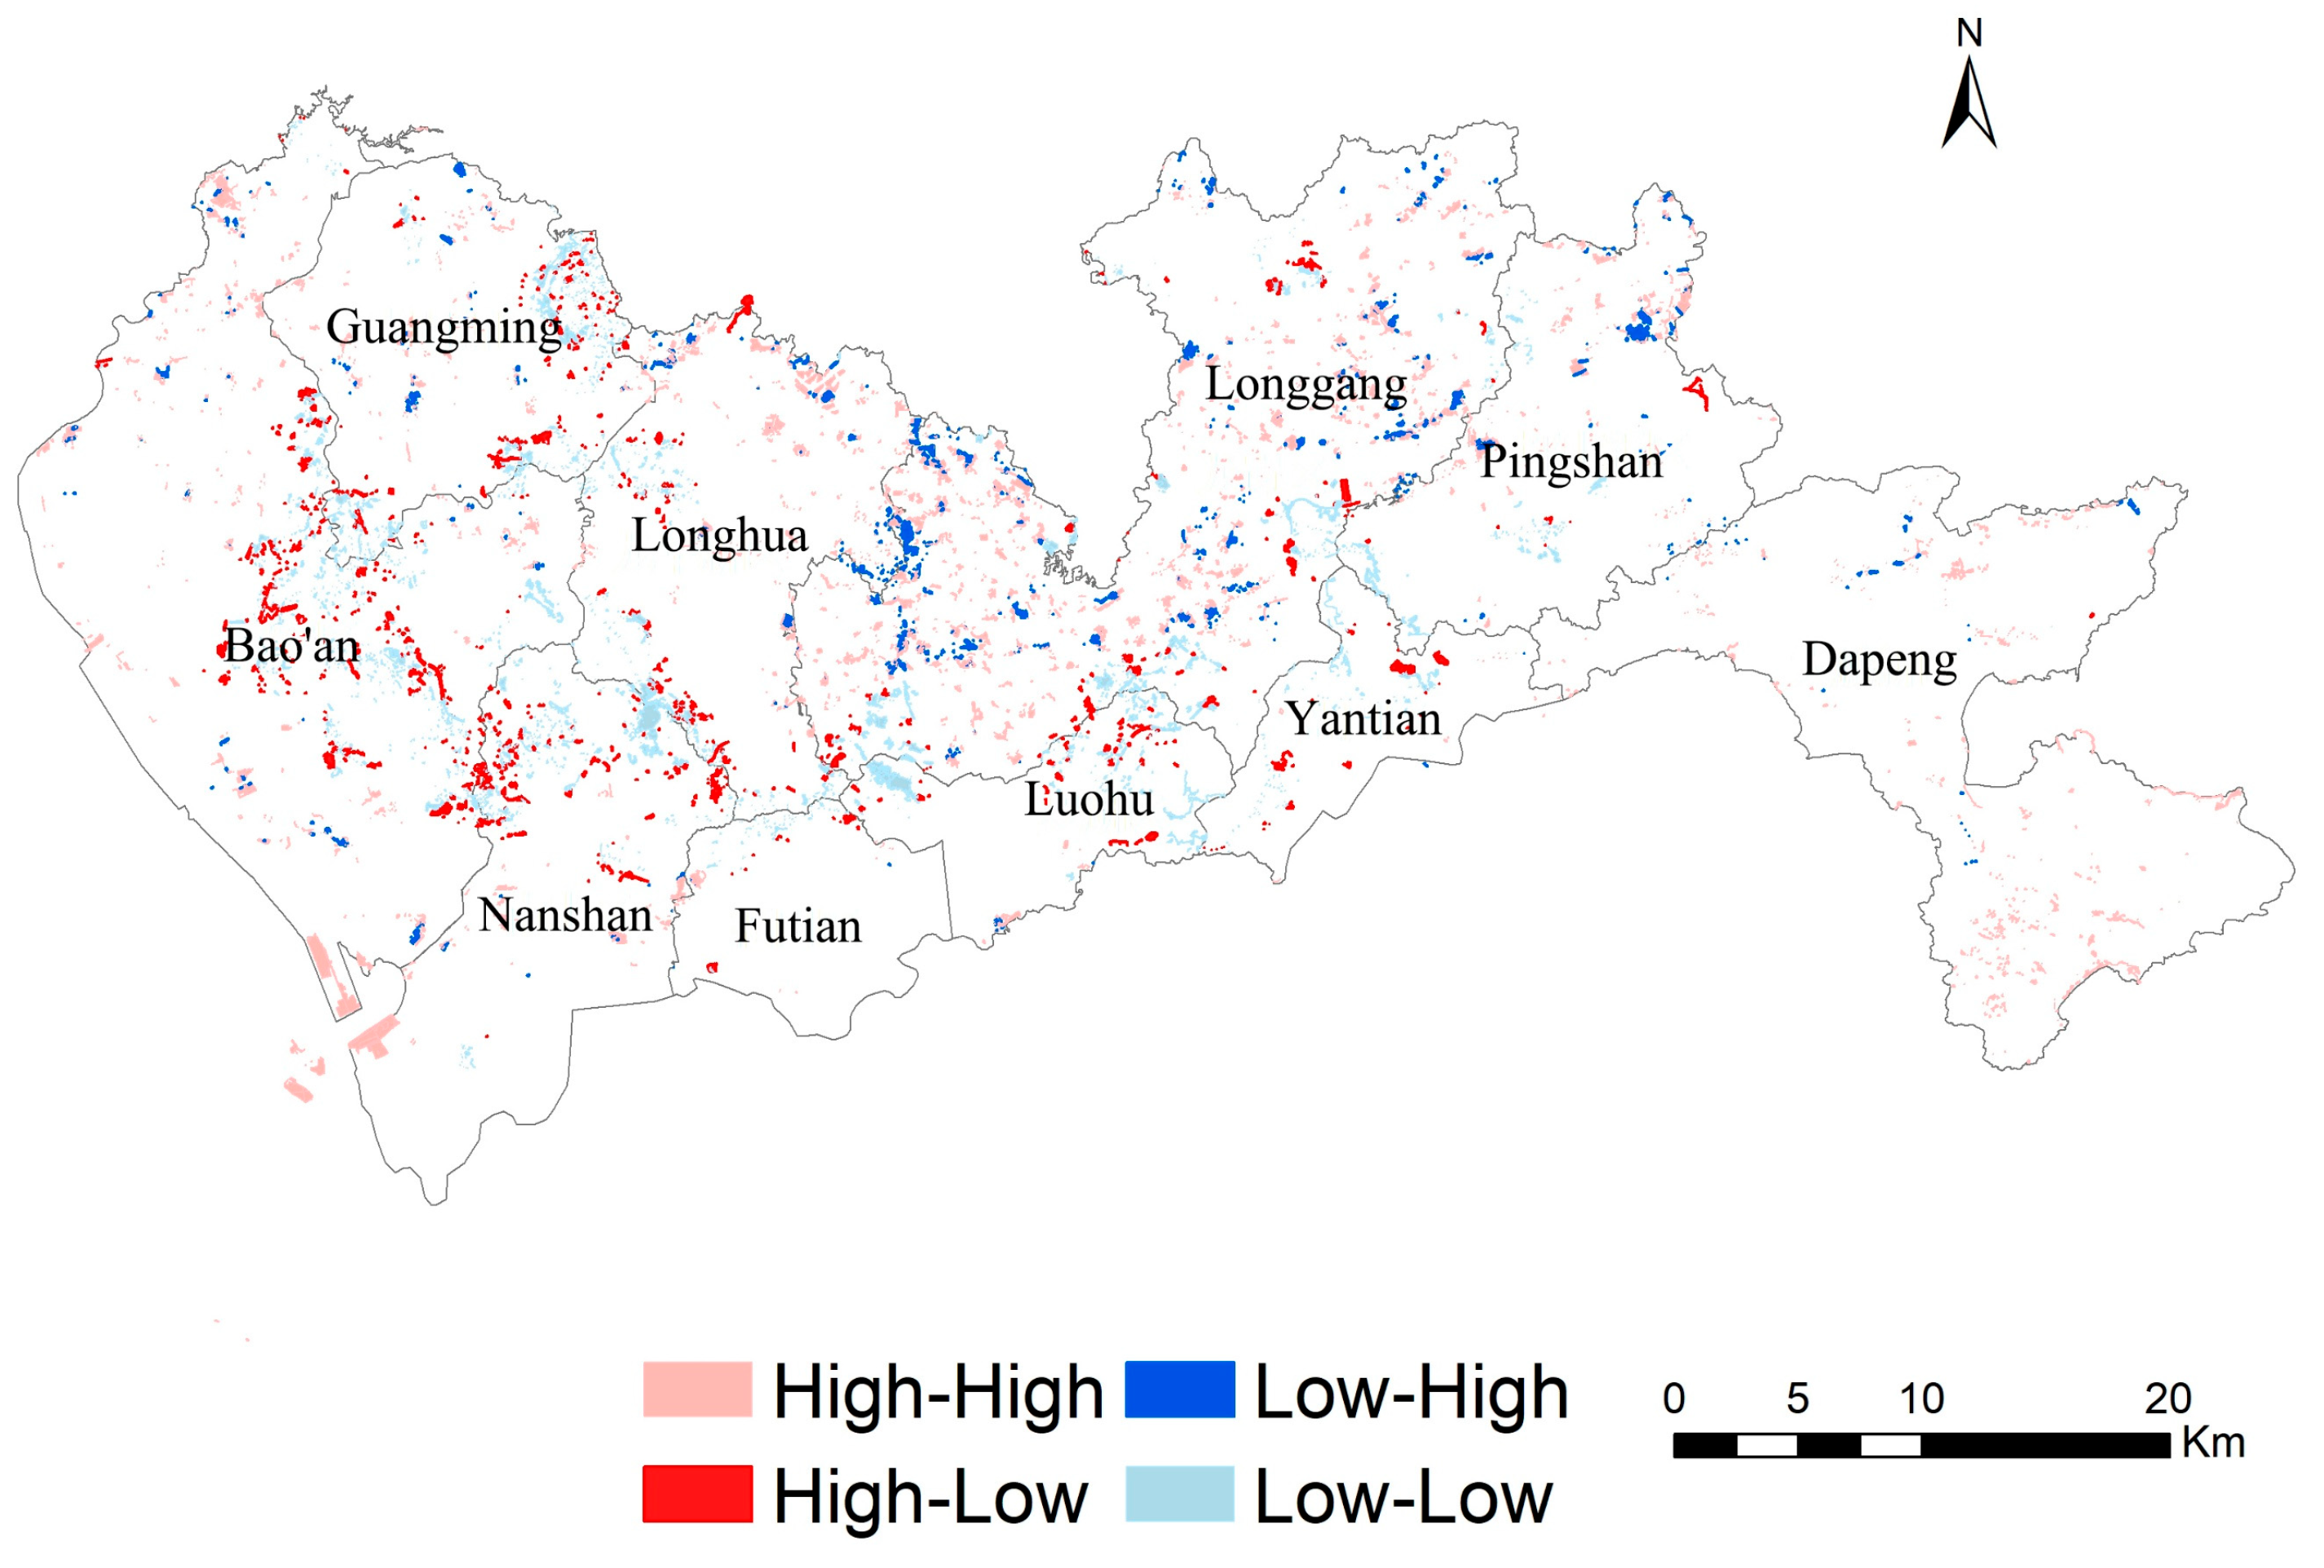

Table 1.
Data Sources and Descriptions of the Study Area.
| Data Name | Description | Source |
|---|---|---|
| Building Data | Includes 468,792 building footprints and floor data in Shenzhen | https://map.baidu.com/ |
| POI Data | Contains 11 categories such as catering, scenic spots, public facilities, transportation, education, finance, and residential areas | https://lbs.baidu.com/products/search |
| Transportation OD Data | Includes origin-destination (OD) travel trajectory data to analyze traffic flow and travel patterns | https://ditu.amap.com/ |
| Population Data | 1 km resolution population grid dataset | https://www.resdc.cn/DOI/ |
| GDP Data | 1 km resolution GDP grid dataset | https://www.resdc.cn/DOI/ |
| Land Use Data | Land use classification dataset, 1 km resolution | Project data |
| CO2 Data | CO2 concentration dataset, 1 km resolution | https://www.geodata.cn/main/ |
Table 2.
Indicators for Identifying Inefficient Urban Stock Land.
| Dimension | Indicator | Calculation Formula | Meaning |
|---|---|---|---|
| Social | Floor Area Ratio | Represents the total above-ground building area of the region divided by the planned land area. represents the total number of buildings; represents the area of the i-th building; represents the planned land area of the region. |
|
| Transportation Facility Coverage | = | Represents the influence range of transportation facilities (e.g., bus stops and metro stations). denotes the distance function to a certain transportation facility and represents the sum of the number of bus stops within 800 meters and metro stations within 1500 meters in the region. |
|
| Living Convenience | Represents the convenience of living within the region. is the total number of POI types, and represents the number of POIs of type i within the region. | ||
| Economic | Human Activity Index | Represents the dynamic indicator of human activity within the region, where denotes the set of the minimum distances from any 's to region . | |
| Population Size | Represents the population size within the region, where is the spatialized POP data, is the weight of various POP characterization factors within the spatial unit, and Q is the total weight value. | ||
| Economic Vitality | Represents the economic vitality within the region, where is the spatialized GDP data, is the weight of various GDP characterization factors within the spatial unit, and Q is the total weight value. | ||
| Ecological | Habitat Quality Index | Represents the quality of the ecological environment within the region, where denotes the normalization coefficient of the Habitat Quality, with a reference value of 511.26. | |
| Air Quality Index | Represents the air quality within the region, where the CO2 concentration values of unknown points are interpolated based on known points. |
Table 3.
Mean-Standard Deviation Classification of Comprehensive Evaluation Results.
| Comprehensive Evaluation Level | Classification Criteria |
|---|---|
| Level 1 | |
| Level 2 | |
| Level 3 | |
| Level 4 | |
| Level 5 | |
| Level 6 |
Table 4.
Weight Values of Major-category and Sub-category Indicators.
| Sub-categoryIndicator | Weight | Major-categoryIndicator | Weight |
| FAR | 0.221 | Livability | 0.534 |
| TFC | 0.053 | ||
| LC | 0.261 | ||
| HAI | 0.158 | Economy | 0.294 |
| POP | 0.073 | ||
| GDP | 0.063 | ||
| HQ | 0.104 | Ecology | 0.172 |
| CO₂ | 0.068 |
* This study strictly adheres to the entropy weight method calculation process, with each indicator weight value rounded to three decimal places to meet geographic computation accuracy requirements.
Disclaimer/Publisher’s Note: The statements, opinions and data contained in all publications are solely those of the individual author(s) and contributor(s) and not of MDPI and/or the editor(s). MDPI and/or the editor(s) disclaim responsibility for any injury to people or property resulting from any ideas, methods, instructions or products referred to in the content. |
© 2025 by the authors. Licensee MDPI, Basel, Switzerland. This article is an open access article distributed under the terms and conditions of the Creative Commons Attribution (CC BY) license (http://creativecommons.org/licenses/by/4.0/).
Copyright: This open access article is published under a Creative Commons CC BY 4.0 license, which permit the free download, distribution, and reuse, provided that the author and preprint are cited in any reuse.


