Submitted:
09 May 2025
Posted:
12 May 2025
You are already at the latest version
Abstract
AI can play a prominent role in the medical field, specifically in physical therapy, by detecting injuries, or areas of concern, that may lead to injury. Many athletes are more susceptible to injury than the average person. AI has the potential of detecting many of these injuries, possibly before they even occur. Supervised learning used in conjunction with machine learning can play a significant role in identifying injuries. Machines can be trained with data such as x-rays and MRIs, showing healthy body scans in juxtaposition to unhealthy or injury prone ones.
Keywords:
artificial intelligence
; machine learning
; data learning
; athlete
; physical therapy
; injury
Introduction
Artificial intelligence (AI) is the broadest concept of all and gives a machine the ability to imitate human behavior. Machine learning (ML) is the application of AI into a system or machine, which helps it to self-learn and improve continually. Data learning (DL) uses complex algorithms and deep neural networks to repetitively train a specific model or pattern.
In the U.S., there are more than 3.5 million instances of injury due to sports each year [1]. Many of these injuries are classified as overuse, which comes from a large amount of pressure [2]. According to the National Library of Medicine, AI enables sports professionals to make more informed decisions, reducing the risk of injury and improving athlete performance [3]. ML, on the other hand, allows systems to learn from historical data and make predictions without being explicitly programmed. Finally, DL is particularly useful in sports injury prediction when working with data from wearables, video analysis, or sequential performance metrics. DL methods such as convolutional neural networks (CNNs), artificial neural networks (ANNs), and recurrent neural networks (RNNs) provide powerful tools for identifying subtle injury risk factors and predicting potential injuries based on an athlete’s historical and real-time data [3]. (Figure 1).
These data sets are designed to train or “supervise” algorithms into classifying data or predicting outcomes accurately [5]. Examples of data sets that could be used may be x-rays and MRIs. Previous body scans of healthy bodies, unhealthy or injured bodies, and bodies that are prone to injuries could be used as data for this study. The data can be labeled as healthy, unhealthy, and injury prone.
Results
Injuries are common in individual and team sports and can have significant physical, psychosocial, and financial consequences. Sports injuries are a consequence of complex interactions of multiple risk factors and inciting events making a comprehensive model necessary. It has to account for the events leading to the injury situation, as well as to include a description of body and joint biomechanics at the time of injury [6].
Machine learning, the application of AI into a system or machine that can help it to self-learn and improve continually, can be used to identify body scans that are healthy, unhealthy, or prone to injuries. The goal of machine learning is to train the model on preexisting data instead of having to program all of the details manually. The data that is input is trained, validated, and tested before it is output. Learning approaches such as supervised, unsupervised, and reinforced learning are used for ML (Figure 2).
The specific approach that can be used to predict injuries is supervised learning [5]. Supervised machine learning models can learn a function that maps an input (e.g., external workloads, internal workloads, and self-reported wellness) to an output (e.g., injury label). (Figure 1). In past reviews about injury forecasting by machine learning models, it has been asserted that the results detected are promising in the sense that these models may be able to help coaches, physical trainers, and medical practitioners in the decision-making process for injury prevention and prediction. The most common supervised machine learning models used for injury forecasting are decision trees, binary logistic regression, random forests, and supporting vector machines [5]. (Figure 3)
Classification, regression, and clustering are specific mechanisms used in machine learning. The specific mechanism that could be used in predicting injuries is classification. Classification is all about putting things into categories. For example, classification is used when sorting emails into “important” and “spam” folders automatically [9,10]. In order to predict injuries, body scans can be placed and labeled into sections with scans showing a large amount of pressure on a specific body part and scans that are completely healthy. The scans that have too much pressure on a specific body part are most likely prone to injury. The scans that are prone to injury, can be separated into multiple groups based on the body part that has too much pressure applied, such as elbow, knee, ankle, shoulder, etc. A confusion matrix is a table that is used to define the performance of a classification algorithm. It visualizes and summarizes the performance of a classification algorithm [11]. This would be used to show how many of the outputs of the body scans are put into the correct groups. It would be shown as TP (true positive), TN (true negative), FP (false positive), or FN (false negative). An example of a confusion matrix is shown in the figure below [11]. (Figure 4)
Multiclass classification is a machine learning classification task that consists of more than two classes, or outputs [12]. Multiclass classification will divide the injury prone body scans into groups that classify a specific area that has too much applied pressure. Another model for classification is the Naive Bayes model. It is simple and trains super quick. The Bayes’ Theorem is used to break down the joint probability of membership in a class into a series of conditional probabilities. The model makes the naive assumption (hence Naive Bayes) that all the input features to the model are mutually independent. While this isn’t true, it’s often a good enough approximation to get the results we want [12]. Bayes’ Theorem finds the probability of an event occurring given the probability of another event that has already occurred [13]. If a human has had an ankle injury occur due to an intense amount of pressure, it is highly likely that another person will obtain an ankle injury due to that same amount of pressure. (Figure 5).
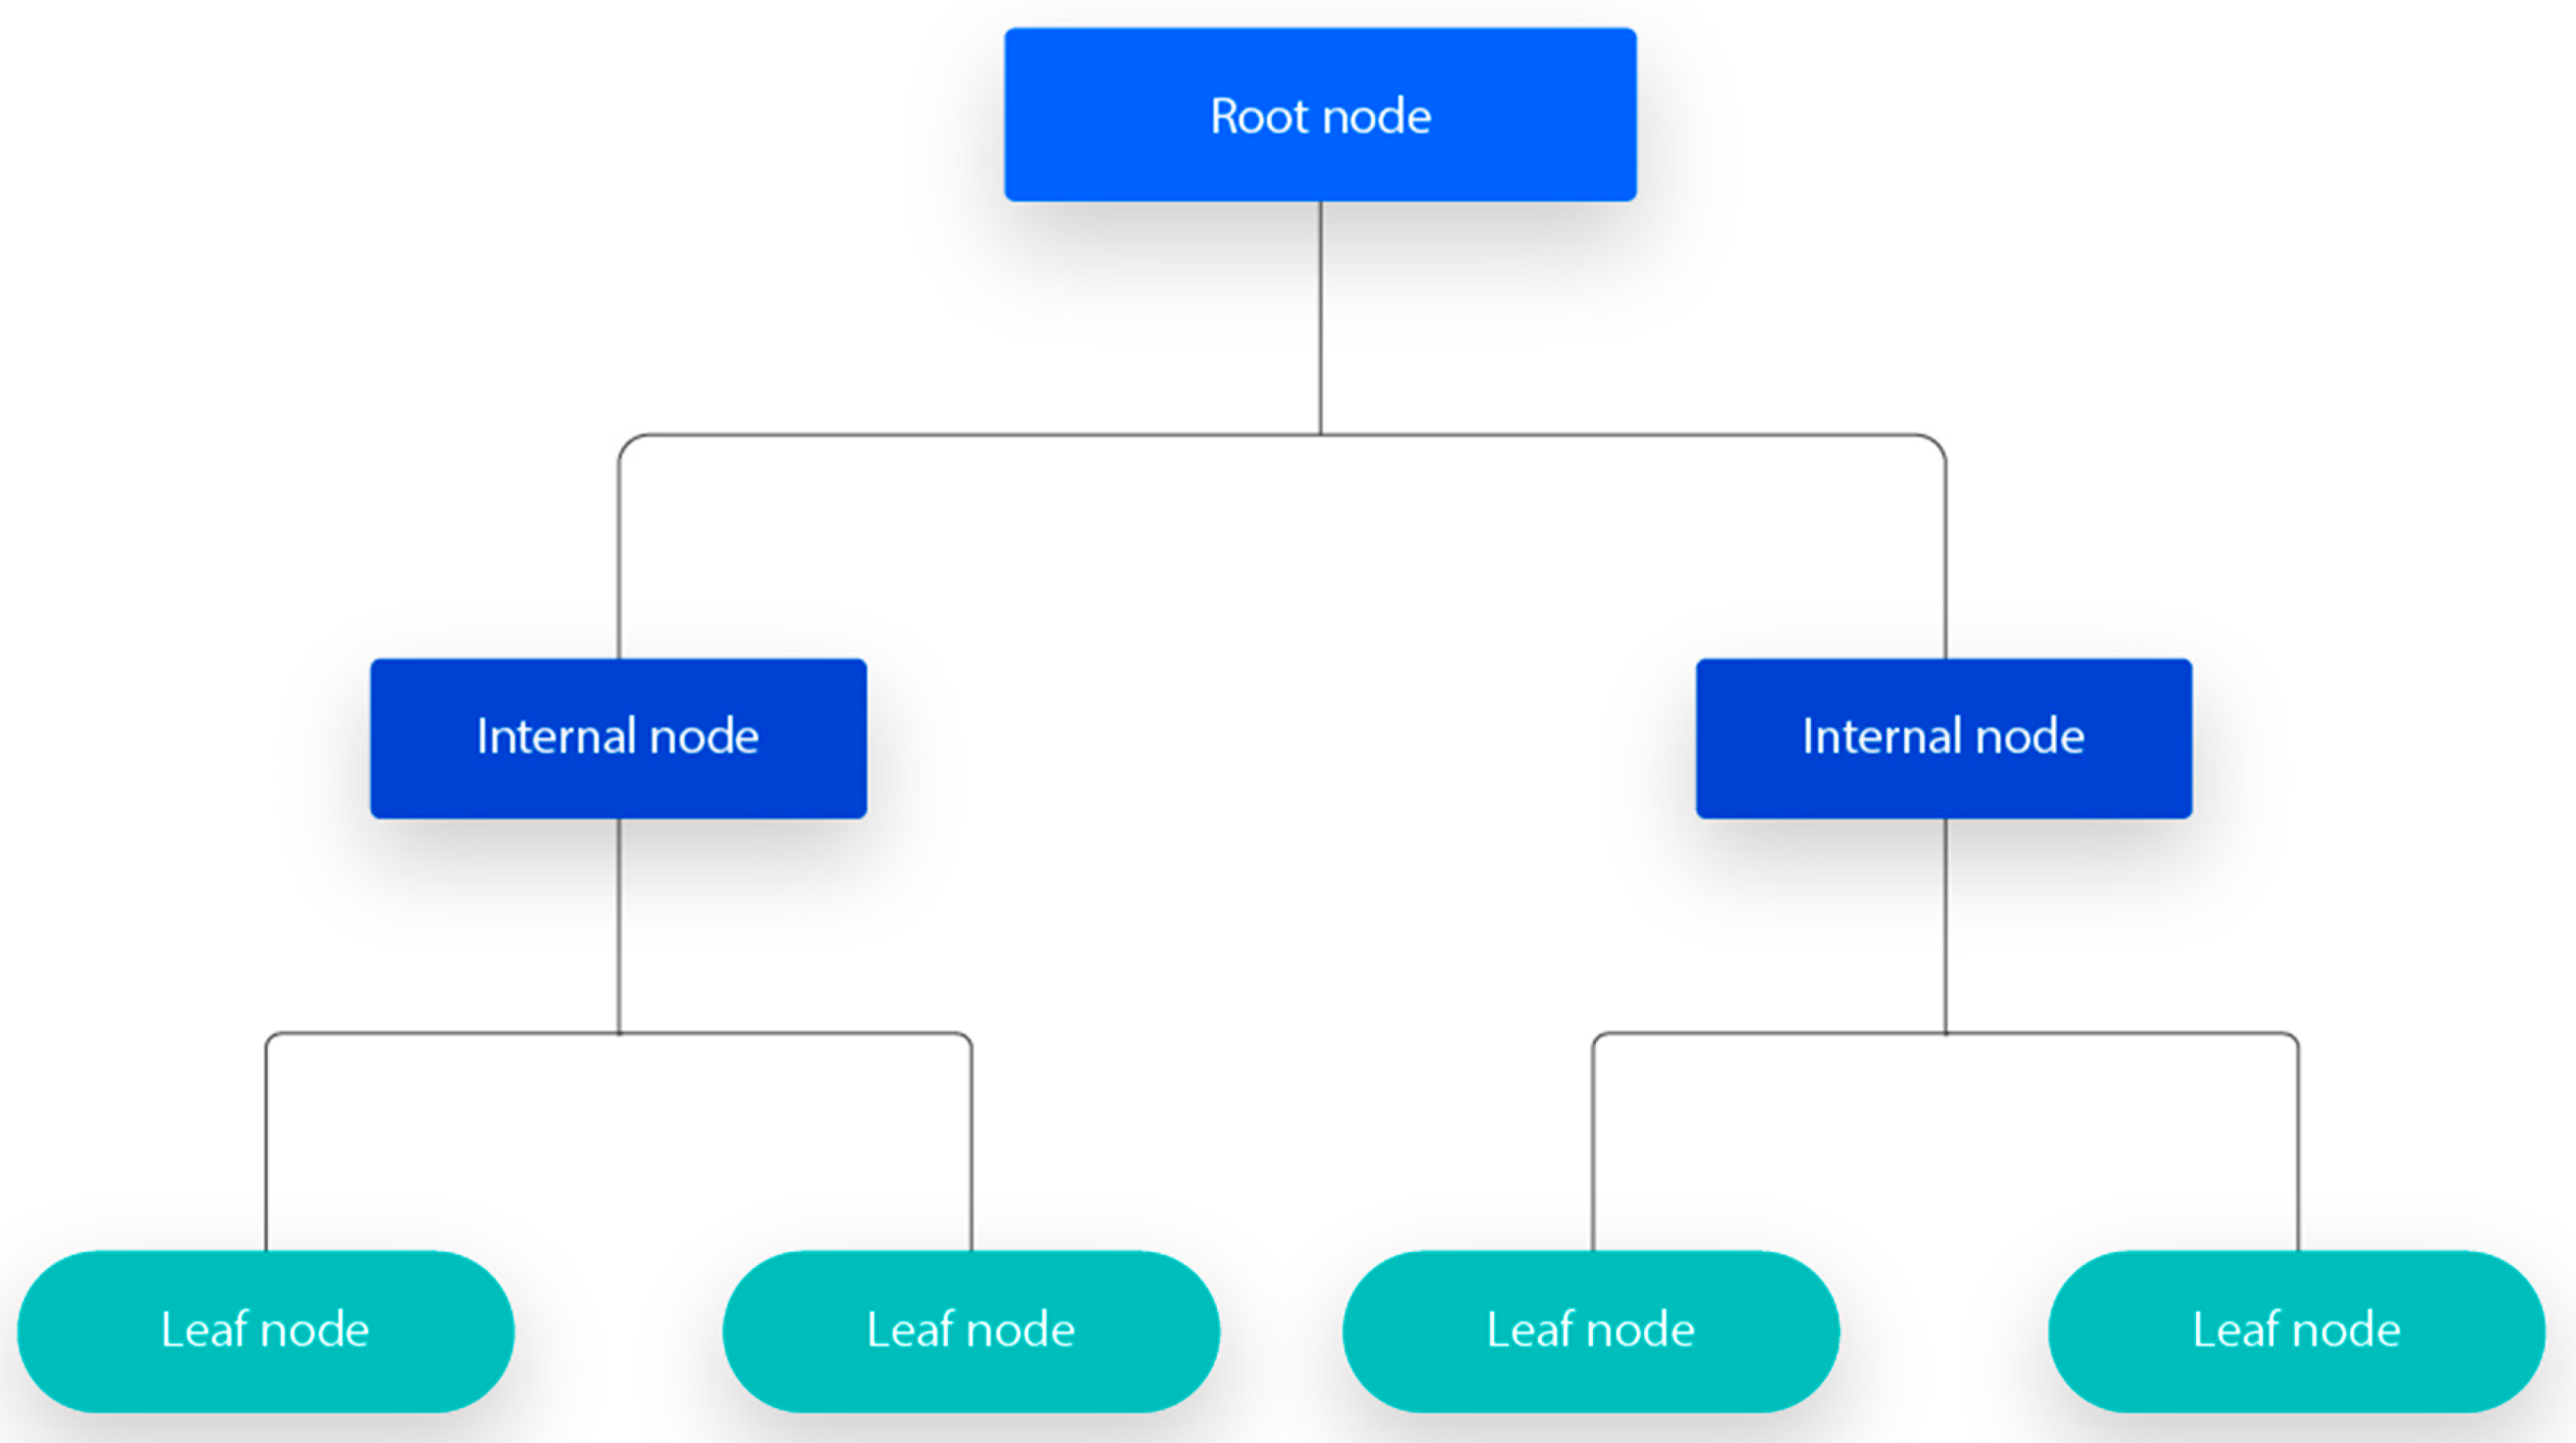
Another model that could be used is a decision tree. A decision tree is a type of supervised machine learning used to categorize or make predictions based on how a previous set of questions were answered. The model is trained and tested on a set of data that contains the desired categorization. The decision tree may not always provide a clear-cut answer or decision. Instead, it may present options so the data scientist can make an informed decision on their own [15]. It basically imitates human thinking in order to make it easier for a scientist to understand and interpret the results. In this example where injuries are being predicated, the data would be split into groups but not labeled. For example, the body scans would be split into two groups of injury prone and healthy, and then the injury prone group would be split into specific groups based on where the pressure is applied. Key terms that exist in a decision tree are root node, splitting, decision node, leaf node, pruning, and branch. The root node is the base of the decision tree and it flows through a series of decision nodes that depict decisions to be made. The decision node is when a sub-node is further split into additional sub-nodes [15]. From the decision node represents a question or a split point, and the lead nodes that stem from a decision node represent possible answers. Leaf nodes are when a sub-node does not further split into additional sub-nodes, representing possible outcomes. Each subsection of a decision tree is called a branch [15]. (Figure 6)
Injury prediction could be a huge step up in the medical world. If bodies could be scanned and a person could immediately be told that they will have an injury occurrence, it would prevent thousands of injuries. During a three year study, a total of 319 male athletes sustained 705 injuries, and 254 female athletes sustained 612 injuries. Of all of these injuries, 29.3% were overuse injuries [17]. Injuries that are classified as overuse can be prevented before they occur. Body scans that classify specific parts of the body where too much pressure is applied can show athletes, or any person using a body part, where there is too much pressure. The athlete or person would know to give that body part a break, lowering the percentage of overuse injuries.
Discussion
While this is an idea that has many benefits, it is very hard to obtain the correct data that needs to be used. A large amount of MRIs and x-rays must be used in order to train the machine. MRIs and x-rays are confidential and barely ever shared with anyone other than the doctor and the patient, therefore making it difficult to obtain these body scans. Because of this, there is no past literature providing this data. Even if this data was of availability, it would take a significant amount of years to obtain enough body scans and data to be able to train a machine. Programming a machine to predict injuries is possible through many different algorithms but is still very difficult due to the hundreds of possible outputs.
If possible, it would be superficial if in the future people could allow their body scans, including MRIs and x-rays, visible to the public. This would allow researchers and engineers to train a machine into being able to tell the difference between a body that is prone to an injury and a body that is healthy. The machine would also be able to point out where too much pressure is applied, causing that specific body part to obtain an injury.
Conclusions
Injuries, specifically overuse injuries, are not uncommon for athletes. In the United States, there are more than 3.5 million noted instances of injury due to sports each year [1]. During a study, 319 male athletes sustained 705 injuries, and 254 female athletes sustained 612 injuries. Of these injuries, 29.3% were overuse injuries [17]. Overuse injuries come from a crazy amount of pressure on a specific body part. Body scans can be looked at to determine them as injury prone or healthy. Supervised learning is a type of machine learning that can be used to label these body scans into two groups. Multiclass classification can split the injury prone group into groups based on the specific body part that is injured such as the ankle, elbow, knee, wrist, or anything else. Models such as the Naive Bayes model or the decision tree model can be a huge help in dividing these body scans into groups.
References
- ‘Sports Injury Statistics’, accessible at https://www.hopkinsmedicine.org/health/conditions-and-diseases/sports-injuries/sports-injury-statistics.
- Chimera NJ, Warren M. Use of clinical movement screening tests to predict injury in sport. World J Orthop. 2016 Apr 18;7(4):202-17. PMID: 27114928; PMCID: PMC4832222. [CrossRef] [PubMed]
- Musat, Carmina Liana, et al. "Diagnostic Applications of AI in Sports: A Comprehensive Review of Injury Risk Prediction Methods." Diagnostics 14.22 (2024): 2516. https://pmc.ncbi.nlm.nih.gov/articles/PMC11592714/.
- ‘A Guide to Convolutional Neural Networks - the ELI5 way’ accessible at https://saturncloud.io/blog/a-comprehensive-guide-to-convolutional-neural-networks-the-eli5-way/.
- ‘Supervised versus unsupervised learning: What's the difference’, accessible at https://www.ibm.com/think/topics/supervised-vs-unsupervised-learning.
- Van Eetvelde, H., Mendonça, L.D., Ley, C. et al. Machine learning methods in sport injury prediction and prevention: a systematic review. J EXP ORTOP 8, 27 (2021). [CrossRef]
- Meskher, H., Belhaouari, S.B., Thakur, A.K. et al. A review about COVID-19 in the MENA region: environmental concerns and machine learning applications. Environ Sci Pollut Res 29, 82709–82728 (2022). [CrossRef]
- Rossi A, Pappalardo L, Cintia P. A Narrative Review for a Machine Learning Application in Sports: An Example Based on Injury Forecasting in Soccer. Sports. 2022; 10(1):5. [CrossRef]
- ‘Classic Machine Learning: Part 1/4 Regression, Classification and Clustering, which one do you need?’, accessible at: https://medium.com/@a.r.amouzad.m/classic-machine-learning-part-1-4-regression-classification-and-clustering-which-one-do-you-need-ed3dd31405eb.
- ‘Classification in Machine Learning: An Introduction’, accessible at: https://www.datacamp.com/blog/classification-machine-learning.
- ‘Confusion Matrix’, accessible at https://www.sciencedirect.com/topics/engineering/confusion-matrix#:~:text=A%20confusion%20matrix%20is%20a,performance%20of%20a%20classification%20algorithm.
- Multiclass classification in machine learning’, accessible at https://www.datarobot.com/blog/multiclass-classification-in-machine-learning/.
- ‘Naive Bayes Classifiers’, accessible at https://www.geeksforgeeks.org/naive-bayes-classifiers/.
- ‘Naive Bayes Classifier’ accessible at https://medium.com/@palakvb02/naive-bayes-classifier-211afcb07bff.
- ‘What is a Decision Tree?’, accessible at https://www.mastersindatascience.org/learning/machine-learning-algorithms/decision-tree/.
- ‘What is a decision tree?’, accessible at https://www.ibm.com/think/topics/decision-trees.
- Yang J, Tibbetts AS, Covassin T, Cheng G, Nayar S, Heiden E. Epidemiology of overuse and acute injuries among competitive collegiate athletes. J Athl Train. 2012 Mar-Apr;47(2):198-204. PMID: 22488286; PMCID: PMC3418132. [CrossRef] [PubMed]
Figure 1.
Convolutional neural network diagram [4].
Figure 1.
Convolutional neural network diagram [4].

Figure 2.
Machine learning techniques [7].
Figure 2.
Machine learning techniques [7].
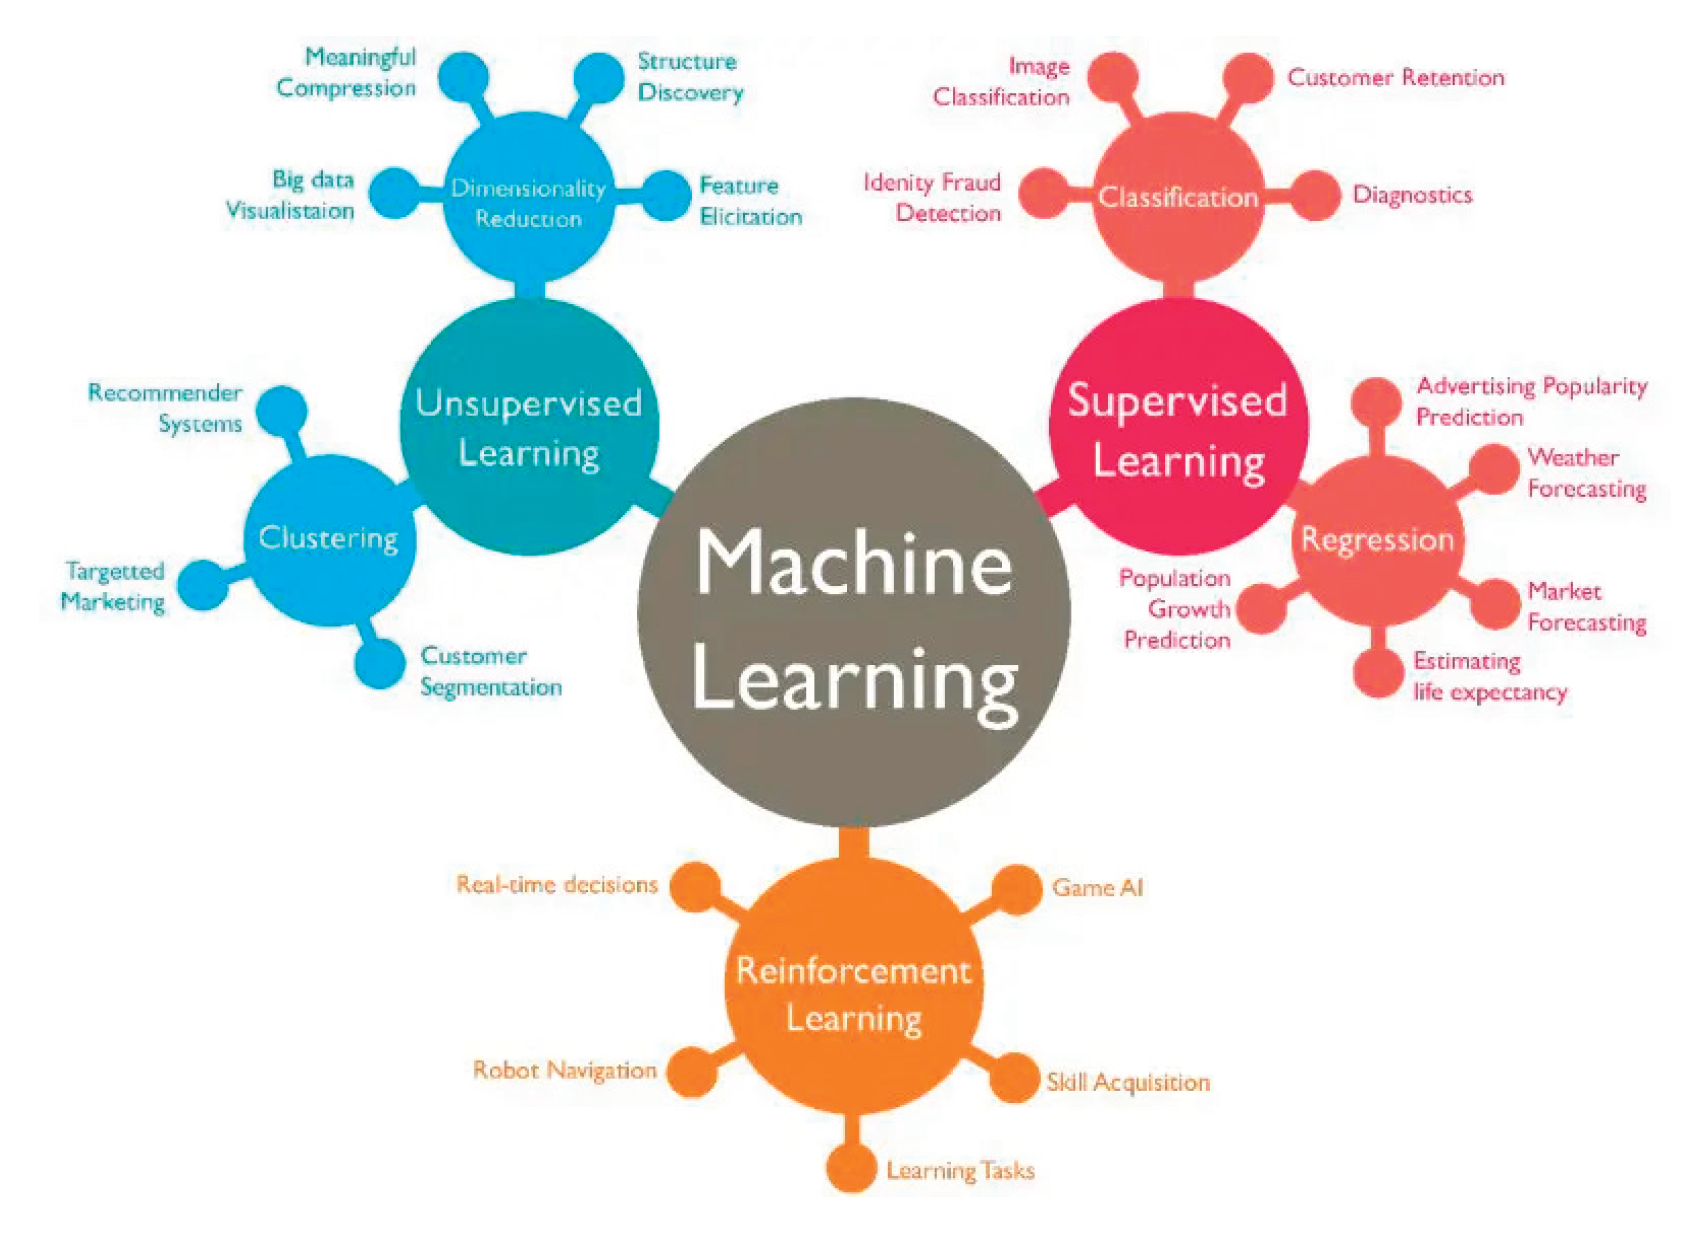
Figure 3.
Diagram of the injury prediction validation [8].
Figure 3.
Diagram of the injury prediction validation [8].
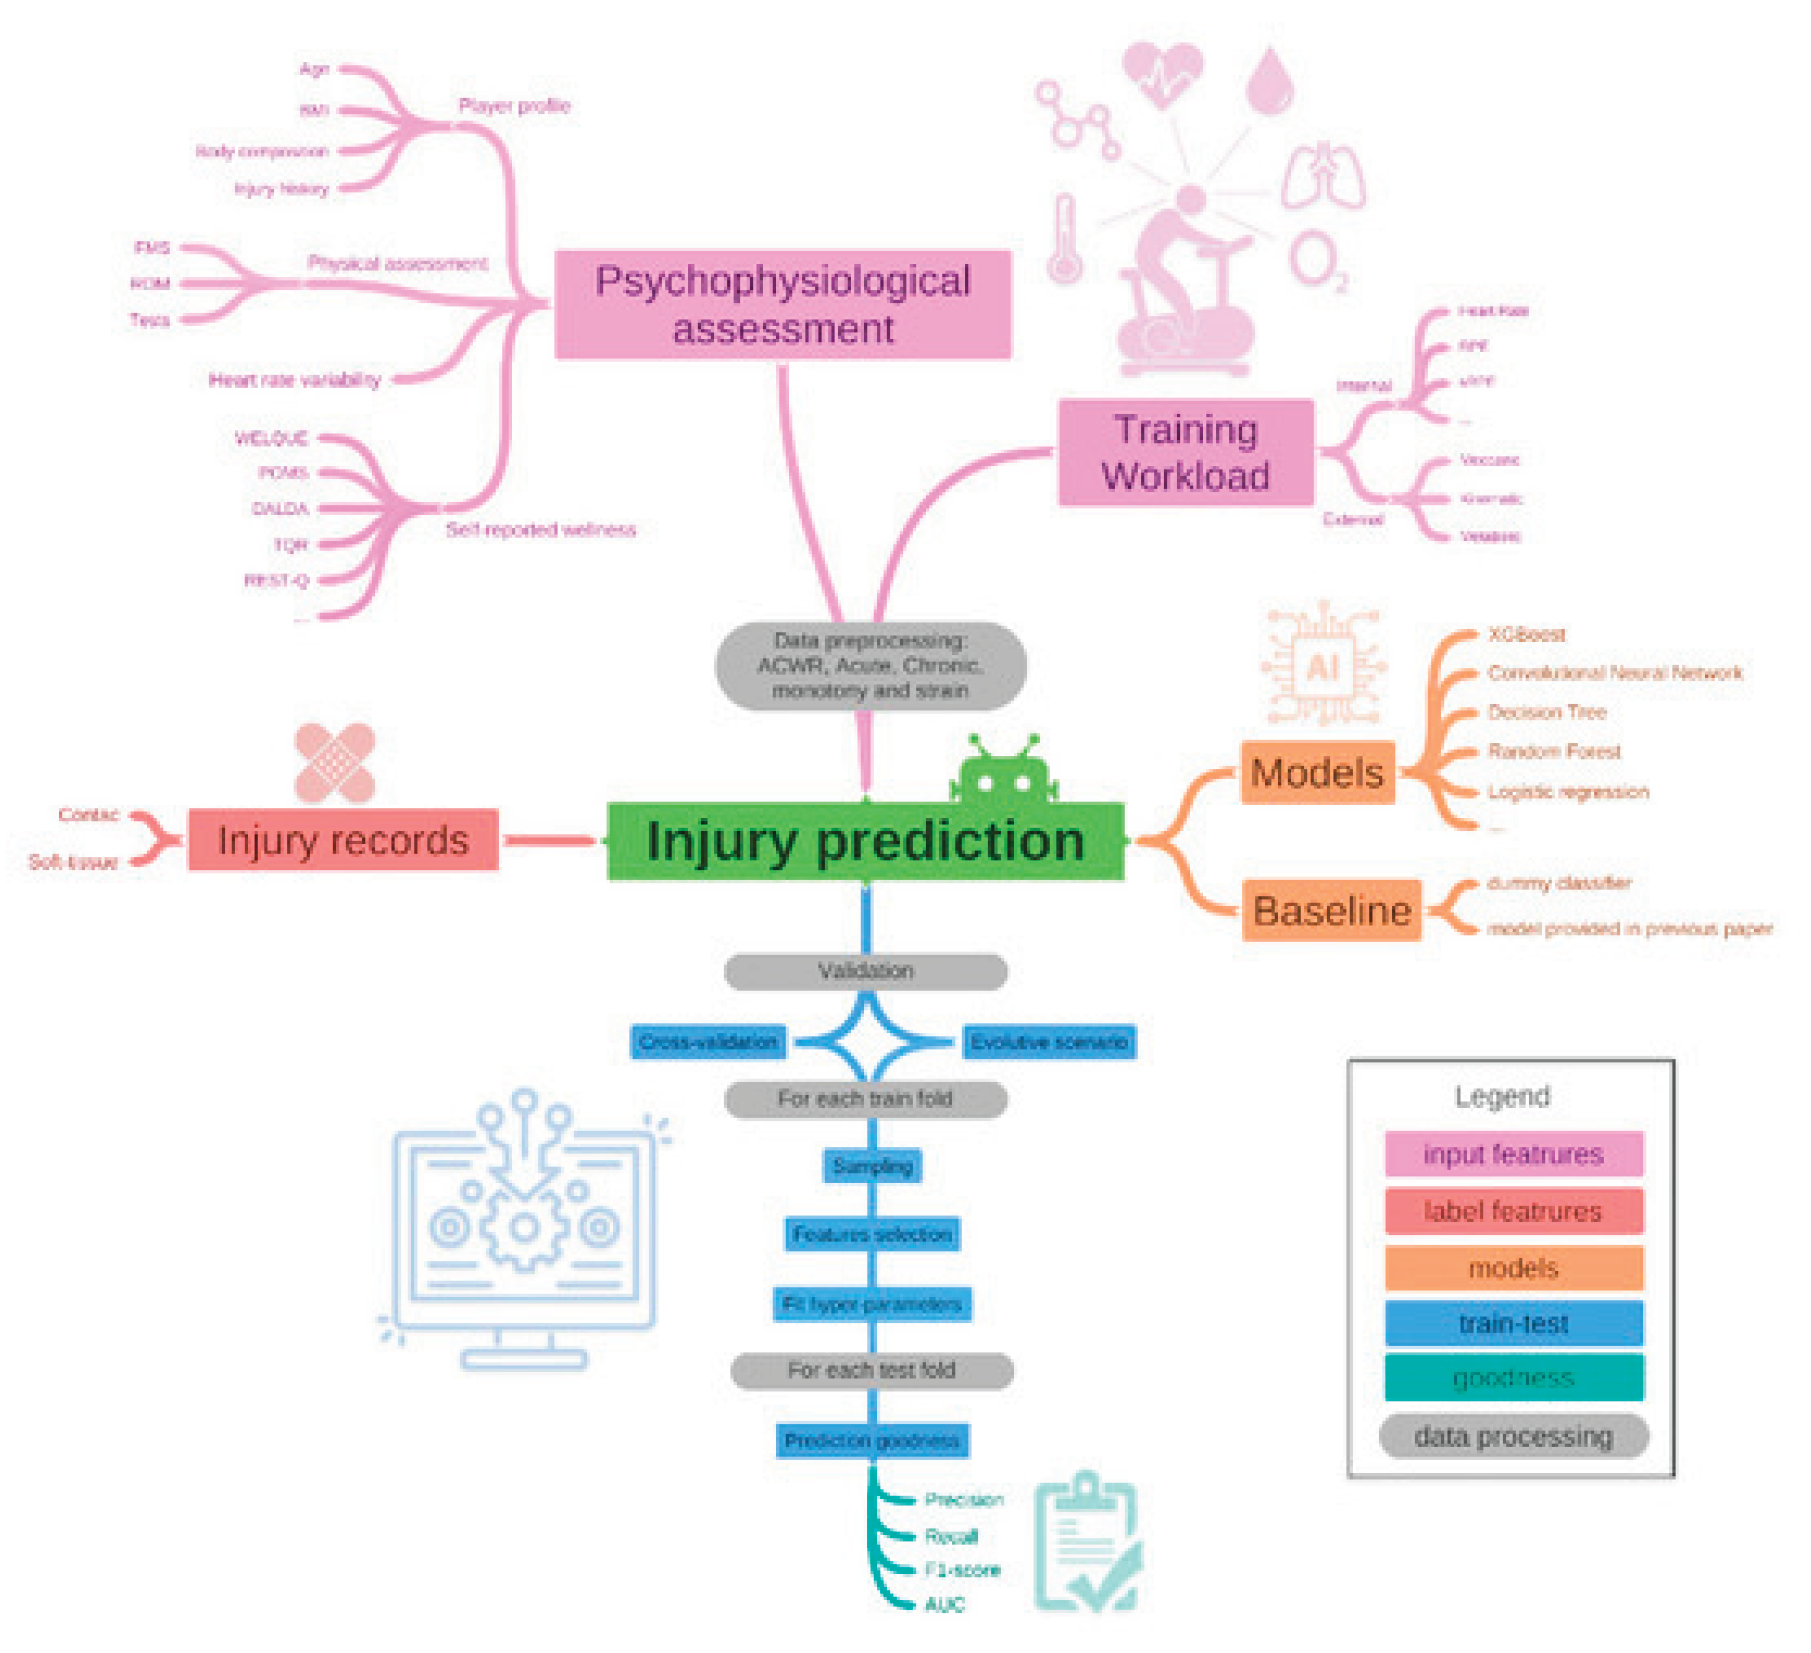
Figure 4.
Confusion matrix example [11].
Figure 4.
Confusion matrix example [11].
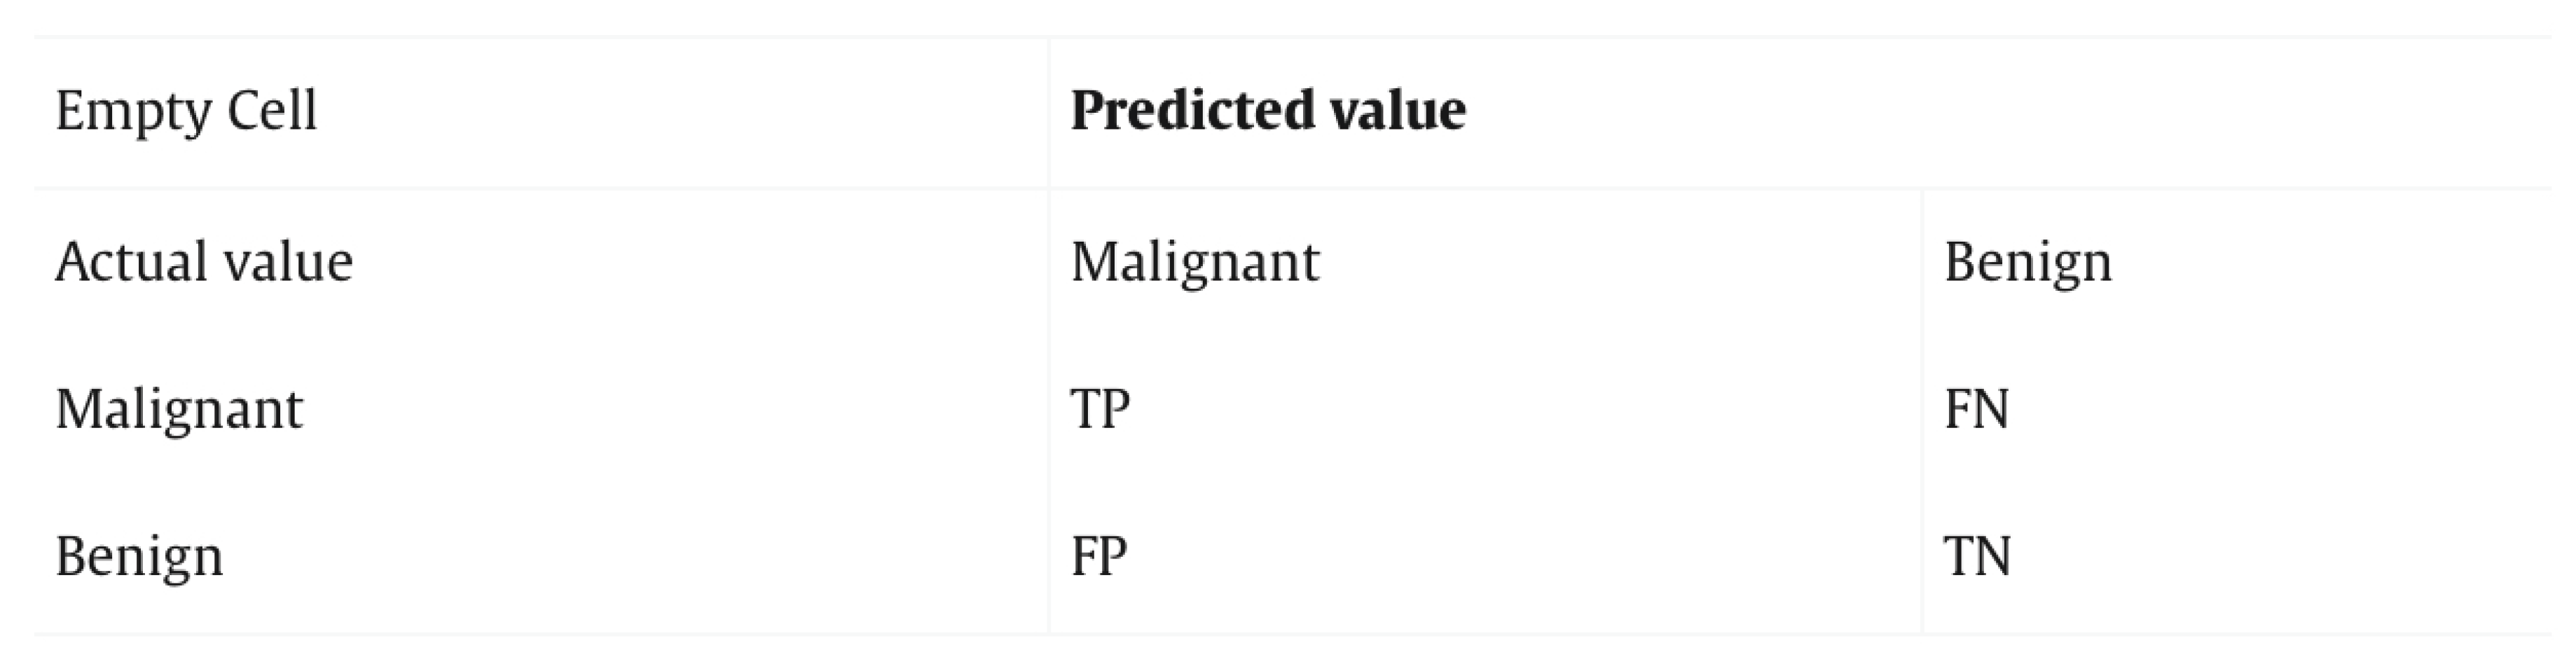
Figure 5.
Naive Bayes Classifier [14].
Figure 5.
Naive Bayes Classifier [14].

Figure 6.
Decision tree model [16].
Figure 6.
Decision tree model [16].
Disclaimer/Publisher’s Note: The statements, opinions and data contained in all publications are solely those of the individual author(s) and contributor(s) and not of MDPI and/or the editor(s). MDPI and/or the editor(s) disclaim responsibility for any injury to people or property resulting from any ideas, methods, instructions or products referred to in the content. |
© 2025 by the authors. Licensee MDPI, Basel, Switzerland. This article is an open access article distributed under the terms and conditions of the Creative Commons Attribution (CC BY) license (http://creativecommons.org/licenses/by/4.0/).
Copyright: This open access article is published under a Creative Commons CC BY 4.0 license, which permit the free download, distribution, and reuse, provided that the author and preprint are cited in any reuse.


