Submitted:
07 May 2025
Posted:
07 May 2025
You are already at the latest version
Abstract
Intrinsic parameter estimation by self-calibration is commonly used in Unmanned Aerial Vehicle (UAV) - based photogrammetry with Structure from Motion (SfM). However, obtaining stable estimates of these parameters from image-based SfM - which relies solely on images, without auxiliary data such as ground control points (GCPs) - remains challenging. Aerial imagery acquired with the constant-pitch (CP) flight pattern often exhibits non-linear deformations, highly unstable intrinsic parameters, and even alignment failures. We hypothesize that CP flights form a “critical configuration” that renders certain intrinsic parameters indeterminate. Through numerical experiments, we confirm that a CP flight configuration does not provide sufficient constraints to estimate focal length (f) and the principal point coordinate (cy) in image-based SfM. Real-world CP datasets further demonstrate pronounced instability of these parameters. As a remedy, we show that by introducing intermediate short strips into CP flight plan-what we call a CP-Plus flight - can effectively mitigate the indeterminacy of f and cy in simulations and markedly improve their stability in all tested cases. This approach enables more effective image-only SfM workflows without auxiliary data, simplifies data acquisition and improves three-dimensional reconstruction accuracy.
Keywords:
UAV-based photogrammetry
; Structure from Motion (SfM)
; indeterminacy
; intrinsic parameters
; critical configuration
1. Introduction
Unmanned aerial vehicle (UAV) - based photogrammetry has emerged recently as an effective technique to generate high-resolution three-dimensional (3D) models across multiple fields including infrastructure inspection [1,2,3], mining surveying [4,5,6], hazard modeling [7,8,9] and environmental condition monitoring [10,11]. Structure from Motion (SfM) underpins this technique, estimating camera intrinsic and extrinsic parameters. These parameters are then exploited in the Multi-View Stereo (MVS) to produce dense point clouds, enabling the generation of high-resolution deliverables, such as meshes, digital elevation models (DEMs), ortho-photos. Therefore, the precision of camera parameters estimation in SfM has a direct effect on the accuracy and precision of reconstructed models. While the accurate estimation of these parameters relies hardly on the number and distribution of auxiliary information such as Ground Control Points (GCPs), it is cost-intensive and time-consuming. Ensuring accurate parameter estimation without heavy reliance on GCPs remains a primary concern for UAV-based photogrammetry.
Intrinsic parameters - such as focal length (f), principal point coordinates (cx,cy), radial distortion, tangential distortion - can be estimated during the bundle adjustment (BA) stage in a typical SfM pipeline (self-calibration), or alternatively, calculated using imagery captured specially for calibration purposes (pre-calibration). However, in UAV-based photogrammetry, where lightweight and compact drones with small cameras are commonly used, pre-calibrated intrinsic parameters are often considered unstable [12,13,14,15]. This instability can arise from mechanical effects during camera shooting, changes in image sensor temperature [16,17,18] or ambient temperature [19] during drone operations, potentially affecting the sensor geometry. Therefore, self-calibration has become the preferred approach for estimating these intrinsic parameters. By eliminating GCP surveys and dedicated calibration process, self-calibration using image-based SfM significantly reduces fieldwork time and cost, enabling rapid, cost-effective surveys even in remote or hazardous areas.
A widely employed image acquisition method in UAV-based photogrammetry is the constant-pitch (CP) flight [18,20,21,22,23,24], where the optical axes of images within the same strip are parallel. In this flight design (Figure 1), the camera is tilted at a fixed pitch angle along the flight lines, and when drones fly in the opposing direction, the local convergence is achieved, thereby facilitating 3D reconstruction.
SfM using CP-based images has been reported to perform well when the camera positions measured by RTK-GNSS are incorporated in BA [21,23]. However, when camera position measurements are unavailable, referred to as images-based SfM, the performance of SfM becomes notably unstable. Sanz-Ablanedo et al. [18] reported poor images-based SfM performance using CP flight images captured at 25o pitch angle, highlighting non-linear deformation (dome effect). Their study also noted large mean vertical errors at validation points located at the four corners of the model, which can be caused by inaccuracy in the estimation of focal length (f). Similarly, Kon et al. [25] reported dome errors accompanied with large RMS errors of all validation points, and in some cases, alignment failures, across various SfM analysis settings (1500 trials) for images captured by CP flights at 20o pitch angle. For these 1500 SfM trials, the standard deviation of f and cy were notably large, 209 pixels and 84 pixels for camera Phantom 4 RTK drone, and 53 pixels and 36 pixels for camera SONY α7 III drone, respectively. Observations of large mean vertical errors at validation points and alignment failures, coupled with the instability in estimations of f and cy, suggest that factors beyond the dome effect may contribute to poor performance of images-based SfM. Despite these observations, the root causes of this instability have not been thoroughly investigated.
It has been mathematically shown that certain combinations of camera motion and scene geometry, known as critical configurations, can introduce indeterminacy into the bundle adjustment with self-calibration [26]. We suspected that the instability of camera parameters observed in images-based SfM under CP flights [21,23,27] stems from such critical configurations, leading to inaccurate or even incorrect model reconstructions.
Therefore, the objectives of this study are: 1) investigate the indeterminacy of certain intrinsic parameters, particularly focal length (f) and principal point vertical coordinate (cy) in images-based SfM under CP flight through numerical experiments under ideal conditions; (2) validate these numerical findings using real datasets acquired at three different ground sampling distances (GSDs); and (3) discuss a practical mitigation strategy to stabilize intrinsic parameter estimation. By bridging the theoretical–practical gap, we aim to provide reliable a UAV-SfM workflow without auxiliary information.
2. Materials and Methods
2.1. Numerical Experiments
The indeterminacy of f and cy was investigated by analyzing RMS reprojection error, which is the objective function (the function to be minimized) at BA stage in SfM. This was achieved by fixing either f or cy to incorrect values in BA and estimating the other parameters along with extrinsic parameters and tie points. If RMS reprojection error remains nearly unchanged regardless of the input values of f or cy, it indicates that these parameters do not influence the objective function, thereby demonstrating their indeterminacy in SfM.
a) Synthetic image acquisition
We used Blender version 2.79b [28], an open-source source computer graphic (CG) software to generate a flat plane (20,000 x 20,000 pixels) and randomly place multiple rectangular parallelepiped objects of various size on it. The textures applied to the plane and objects included local feature suitable for matching in SfM, as shown in Figure 2.
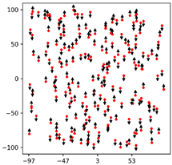
Synthetic image acquisition of the target plane was performed using the image and camera specifications described in Table 1. In CG space, three image-sets were captured using three different flights: CP, CP random and CP-Plus flight. The CP- Plus flight was derived from constant-pitch (CP) flight by adding one image between every two flight lines. The pitch angle was set to 20o for all three flight designs and the flight altitude was fixed at 73 meters to achieve the Ground Sample Distance (GSD) of 20 mm. Details of flight designs are provided in Table 2.
b) SfM processing
For each simulated image-set created in CG space, SfM was performed using the commercial software Agisoft Metashape version 1.5.5. The SfM workflow (Figure 3) began with “align photos”, followed by bundle adjustment (BA) with the camera parameters effectively fixed to their true values to generate accurate set of tie points. The settings used are detailed in Table 3.
Based on these tie points, a camera intrinsic parameter (either f or cy) was fixed to values higher than true value (v+) and values lower than true values (v-), while the other parameter (cy or f) was not fixed. Then, BA was rerun. In this process, BA was performed using the previously generated accurate tie points. This approach allowed us to observe the behavior of RMS reprojection error in relation to the fixed intrinsic parameters (f or cy).
c) Evaluation of the indeterminacy of camera intrinsic parameters in SfM
The variation in RMS reprojection error between BA with fixed true intrinsic parameters (f and cy) and BA with fixed incorrect intrinsic parameters (f or cy) was quantified by the rate of increase in RMS reprojection error. This metric effectively evaluates the impact of inaccurate intrinsic parameters on SfM and helps identify occurrences of their indeterminacy. Additionally, fixing either f or cy to incorrect values while estimating the remaining parameter (cy or f, respectively) provides insight into the correlation between f and cy.
Where: R increase is the rate of increase in RMS reprojection error.
E incorrect (pixels) is RMS reprojection error when fixing either f or cy to the incorrect values and estimating the remaining parameter in BA.
E true (pixels) is RMS reprojection error when fixing both f and cy to true values (1824 and 0 pixels, respectively) in BA.
2.2. Real-Data Analysis
a) Study site
The in-situ data in this study utilized the data from Truc et al. [23]. These images captured an area of around 100 x 100 m2, located in Tsukubamirai city, Ibaraki prefecture, Japan. This area was constructed for housing purposes. Figure 4 shows the ground condition of target terrain, mostly bare land covered with short vegetation.
b) Image acquisition
Aerial photos were collected using a high-precision 1-inch 20 MP CMOS camera sensor attached to a lightweight quad-copter UAV (DJI Phantom 4 RTK, hereafter named P4RTK) [29]. The assembled camera lens has an approximate focal length of 8.8 mm and a mechanical shutter feature that avoids typical rolling shutter problems. This UAV can measure the camera position at the time of exposure by RTK-GNSS (real-time kinematic global navigation satellite system) positioning. A set of nine validation points (Figure 4) was employed to evaluate the accuracy of the SfM performance using the Aerobo marker [30].
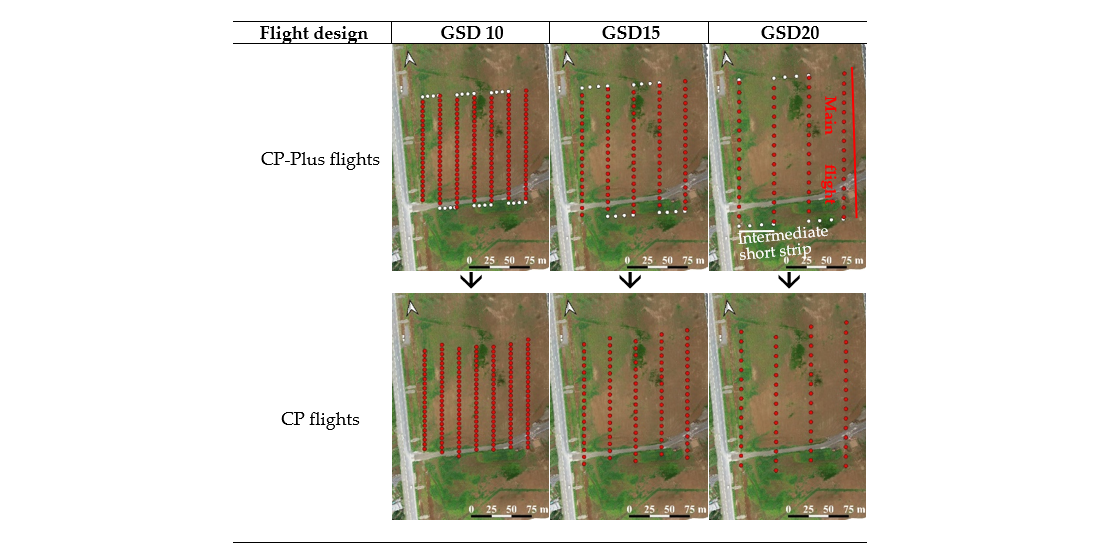
A flight design similar to CP-Plus flight design was adopted for data acquisition. This flight pattern was generated using the 3D photogrammetry preset feature in the P4RTK system to capture images at two-second intervals and record camera coordinates via RTK-GNSS during image capture. In these CP-Plus flights, the camera was tilted at a fixed pitch angle of 20o along the flight lines and the consecutive images with yaw angle deviation over 10o from the main flight line, taken during the drone rotation, were referred to as the intermediate short strips. They were removed to simulate three CP flights (Figure 5).
In this study, P4RTK was flown at three altitudes of 73, 55, and 36 m above ground level (at the drone’s home point), which yielded three GSDs of 20, 15, and 10 mm, respectively. All photographs were captured along parallel flight lines with an overlap ratio of 80% forward and 60% side lap when the camera’s optical axis was oriented toward nadir. The details of image-sets used in the real-data analysis are described in Table 4.
c) SfM Processing
For each image set, SfM was performed following the “align photos” in Agisoft Metashape version 1.5.5 software. In this process, camera parameters were estimated by using images only, then the point clouds were georeferenced using projection centers recorded by RTK-GNSS embedded in the images taken by P4RTK. The absolute coordinates of the validation points evaluated by multi-view triangulation using camera parameters estimated in SfM were used to validate the accuracy of the SfM-derived model, in accordance with the nine validation points. It is worth to note that in this study self-calibration was performed using images only, without additional information.
SfM was tested through a combination of SfM analysis settings summarized in Table 5, resulting in 30 settings with 50 trials for each image-set listed in Table 4. This analysis was conducted to observe the variation in the estimation of intrinsic parameters under different SfM settings.
In order to evaluate the variation of intrinsic parameters estimates in one SfM setting, we used a standard SfM setting repeated in 50 times (trials), with the following parameters:
- Size of input images for feature detection: High
- Keypoint limit: a half (½ ) to the average number of detectable keypoints for the input images (35643).
- Intrinsic parameters considered in Brown models: f, cx, cy, k1-k3, p1-p2.
d) Intrinsic parameters estimation and error evaluation
In this study, we quantified the variation of intrinsic parameters estimation (f and cy), in accordance with the accuracy and precision of SfM for each image-set. The accuracy and precision of SfM is evaluated by the root mean square (RMS) error of all nine validation points for each analysis setting, as recommended by James et al. [31]. The validation point error represents the difference between the estimated 3D coordinates of the validation points (calculated through triangulation using camera parameters estimated during SfM process) and those obtained through static GNSS positioning by Aerobo markers. Additionally, we calculate statistics of RMS errors of all validation points for one standard setting (with 50 trials) and 30 settings (with 50 trials for each setting) such as: the maximum value, 75th percentile (Q3), 50th percentile (Q2) and interquartile range (IQR).
Moreover, we evaluate the mean vertical error of all nine validation points for each analysis setting. The mean vertical error is defined as the average difference between the estimated elevation of the validation points (derived using camera parameters estimated by SfM) and the measured elevation of corresponding validation points obtained by Aerobo markers.
3. Results
The results are divided into two main sections: numerical experiments and real-data analysis. In the numerical experiments, we present verification of the indeterminacy of intrinsic parameters in image-based SfM for three flight designs, and observation of the RMS reprojection error for each camera in CP-Plus flight. The real data analysis focuses on three points: the estimates of camera intrinsic parameters (f, cy) across multiple repetitions of a single SfM setting and in various SfM settings, and the correlation between the estimates of f and the mean vertical error for all validation points.
3.1. Numerical Experiments
3.1.1. Verification of the Indeterminacy of Intrinsic Parameters in Image-Based SfM for Three Flights
The RMS reprojection error and its rate of increase were analyzed to evaluate the sensitivity of SfM when the intrinsic parameters were fixed to inaccurate values relative to their true values (Table 6, Table 7).
As shown in Table 7, the rate of increase in RMS reprojection error in CP flight and CP random flight was 0, while for CP-Plus flight, it ranged from 5.8 to 7.6. In CP and CP random flight, the RMS reprojection error remained unchanged regardless of values of intrinsic parameters f or cy fixed in BA. However, in CP-Plus flight, the addition of one image between two flight lines results in a significant increase in RMS reprojection error. Moreover, when f was fixed to incorrect values, the estimates of cy derived from BA were strongly inaccurate compared to the true value, and vice versa (Table 6).
These results indicate that both f and cy are indeterminate in image-based SfM. In CP random flight, where camera positions were randomly distributed compared to CP flights, and the camera orientation remained fixed at 20o forward and backward, RMS reprojection error does not change, whether intrinsic parameters are fixed to incorrect values or the true values. This indicates that altering the shooting positions alone does not resolve the indeterminacy.
In contrast, for CP-Plus flight, the values of f or cy had a substantial impact on RMS reprojection error, with rates of increase in RMS reprojection error exceeding 7 for f and 5.8 for cy (Table 7). This demonstrates that f and cy are no longer indeterminate in SfM when at least one image is added to intermediate short strip.
3.1.2. Observation of the Variation of RMS Reprojection Error for Each Camera in CP-Plus Flight
The CP-Plus flight appears to overcome indeterminacy of f and cy in images-based SfM. To better understand this phenomenon, we analyzed the RMS reprojection error for each camera when the intrinsic parameters f or cy were fixed at incorrect values in SfM.
As shown in Figure 6, the RMS reprojection error for cameras in the intermediate short strips is significantly larger than those in the main flight strips. Additionally, cameras positioned near the intermediate short strips or with a high overlap to images from these strips also exhibit higher RMS reprojection errors. This finding indicates that tiepoints in these images geometrically contradicts with wrong camera parameters, even after BA, thereby preventing the convergence of camera parameters to wrong values in usual BA when f and cy are not fixed. This suggests that adding images into the intermediate short strip of the CP flight design is the key to mitigate the indeterminacy of intrinsic parameters f and cy in image-based SfM.
In summary, numerical experiments showed that the intrinsic parameters f and cy are indeterminate in image-based SfM when using aerial images captured by CP flight design. Adding images to the intermediate short strips effectively resolves the indeterminacy of f and cy.
In the next section, we will evaluate the estimation of intrinsic parameters in image-based SfM using in-situ data captured by CP and CP-Plus flight.
3.2. Real-Data Analysis
3.2.1. Estimates of Camera Intrinsic Parameters (f, cy) Across 50 Trials of a Single SfM Setting
Table 8 presents the SfM results for three image-sets captured at three different GSDs of two flight designs: the CP and CP-Plus. Across 50 trials of a standard SfM setting, the standard deviation in the estimates of intrinsic parameters f and cy was zero for the image-sets taken by CP-Plus flight design. In contrast, for CP flight design, the standard deviation was substantial (0.32 pixels for f and 0.08 pixels for cy). This variation also resulted in a 0.008 m deviation in the interquartile range (IQR) of RMS error of all validation points within the same SfM setting, for image-sets from CP flight.
These results demonstrate that the estimation of f and cy is unstable in SfM when using images from CP flight. However, in CP-Plus flight, where images were added to the intermediate short strips of CP flight, the estimates of the intrinsic parameters f and cy became more stable.
3.2.2. Estimates of Camera Intrinsic Parameters (f and cy) Across 30 SfM Settings
The estimates of f and cy in images-based SfM obtained from 30 different SfM settings, each repeated 50 times, exhibit instability (Table 9). The standard deviation of f ranges from over 1 pixel to 7.3 pixels, while the standard deviation of cy ranges from 0.6 to 3.1 pixels. This instability is particularly pronounced when using images from CP flight, where the standard deviation is about six times higher for f and five times higher for cy (GSD-20 image sets), compared to those taken by CP-Plus flight.
As shown in Table 9, the median RMS error of all validation points is substantially higher for image-sets from CP flight (0.151 m), approximately four times greater than the 0.039 m observed for CP-Plus flight (GSD15). Furthermore, the accuracy and precision of SfM vary considerably across 30 SfM settings for CP flight image-sets. The interquartile range (IQR) of the RMS error of all validation points is 0.105 m for CP flights, compared to 0.047 m for CP-Plus flights (GSD15).
Overall, the estimates of f and cy are significantly less stable for images captured by CP flight than CP-Plus flight, both across multiple trials of a single setting and across different settings.
3.2.3. Correlation Between the Estimates of f and the Mean Vertical Error for all Validation Points
Theoretically, incorrect estimates of f lead to mean vertical error (MEZ) for all validation points in model reconstruction. As illustrated in Figure 7, a negative correlation is observed between the estimates of f and MEZ across 30 different SfM settings (1,500 trials). This relationship can be explained by a simple pinhole camera model: as the estimated f increases, the triangulated ground points move farther from the cameras, causing their estimated vertical coordinates to decrease.
To assess the contribution of vertical error due to incorrect f estimation to the total vertical error, the vertical error ratio was calculated as the proportion of the absolute mean vertical error (MEZ) to the total vertical error (RMSE). As shown in Table 10, the average vertical error ratio for each image set exceeds 80%, indicating that vertical error resulting from incorrect f estimation serves as the primary contributor to the total vertical error, regardless of flight design.
In summary, the indeterminacy of intrinsic parameters, especially f and cy, in images-based SfM has been demonstrated using three flight designs in numerical experiments and its effect has been demonstrated in real-data analysis using three image-sets. In the next section, we will discuss the implications of these findings on existing studies and suggestions for practical application.
4. Discussion
4.1. Indeterminacy of Camera Intrinsic Parameters in Images-Based SfM
To our knowledge, this study provides the first combined numerical and in-situ analysis of the indeterminacy of intrinsic parameters in images-based SfM for CP flight. The numerical experiments show that, when images are captured under a CP flight design, f and cy, are indeterminable in images-based SfM.
Critical configurations - specific combinations of camera motion and scene geometry- are known to induce intrinsic-parameter indeterminacy. Previous studies have extensively documented critical configurations related to linear images (images captured by a pin hole camera without lens distortion) [26,32]. For example, planar motion over general terrain, in which the camera moves on a plane while rotating around an axis normal to that plane, prevents estimation of a single intrinsic parameter [26].
CP flight represents a restrictive form of planar motion in which the camera’s movement is constrained into a plane, and rotation is limited to only two orientations (pitch and yaw) rather than allowing free rotation around the roll axis. Therefore, it is possible that these additional constraints cause more than one intrinsic parameter to become indeterminate, and in fact our study confirmed that two parameters (f and cy) become indeterminate for CP flight.
In three real CP-flight datasets acquired at three different GSDs, we observed significant variations in f and cy across 30 distinct SfM analysis settings and across 50 repeat trials of a single setting. These results demonstrate that the theoretical indeterminacy of intrinsic parameters observed in numerical experiments, manifests in real-world scenarios as pronounced instability.
Our findings suggest that the previously reported poor performance of image-based SfM using CP-flight images [18,25], commonly attributed to the dome effect—is also influenced by inaccurate estimation of f, which causes large mean vertical errors. Images acquired under CP flight, as confirmed in our study, significantly compromise the accuracy and precision of image-based SfM and can even lead to incorrect model reconstruction in MVS. Therefore, practical surveys should avoid employing CP flight design or apply appropriate countermeasure such as augmenting camera coordinates measured by RTK-GNSS or adding many GCPs to ensure stable SfM results when using CP flight.
4.2. Remedy for Indeterminacy of Intrinsic Parameters in Images-Based SfM
Our numerical experiments demonstrate that adjustments to the shooting positions of CP flight, such as CP random flight, do not resolve the indeterminacy of intrinsic parameters (f and cy). However, introducing intermediate short strips between primary CP lines, as the CP-Plus flight, effectively eliminates this indeterminacy in numerical experiments and substantially reduces f and cy instability in real-data analysis.
This finding suggests that practitioners can largely mitigate concerns regarding the significant instability of intrinsic parameters estimated by image-based SfM by incorporating intermediate short strips into CP flights. Some built-in flight missions in flight planning software packages automatically include intermediate short strips. Such strips can be achieved using timed-interval or distance-interval shot modes, as seen in the 3D photogrammetry function of the DJI P4RTK drone or the "area route" option of the DJI Mavic 3E drone, for example.
In contrast, there are other flight missions that do not include intermediate short strips, such as "waypoint" flight, where the camera shutter is triggered at specific pre-defined points. Additionally, some flight planning software, such as Pix4D Capture [18,24,33,34] or Pix4D Capture Pro, does not generate intermediate short strips by default. These choices preserve the CP critical configuration and risk intrinsic parameters unstable. Overall, embedding short cross-strips within CP flight plans prevents theoretical indeterminacy of intrinsic parameters, delivering more stable and accurate SfM reconstructions in practice without reliance on camera coordinates measured by RTK-GNSS or extensive GCP networks.
5. Conclusions
In this study, we investigated how certain camera intrinsic parameters in image-based SfM become indeterminate using aerial photos from CP flights. Our numerical experiments (Section 3.1) confirmed that the CP flight is a critical configuration that causes the indeterminacy of intrinsic parameters, particularly focal length (f) and principal point coordinate (cy), under idealized conditions in CG simulation. Further analysis with real data (Section 3.2), involving three image-sets over 30 different SfM settings, demonstrated that estimates of f and cy are highly unstable when using CP flight imagery.
As a countermeasure, we found that integrating intermediate short strips into the CP flight design eliminates the indeterminacy of intrinsic parameters (f and cy) in numerical experiments and markedly improves the stability of these parameters in real-data analyses.
Our study reveals the potential to improve the accuracy of self-calibration using only aerial images in SfM, without the need for GCPs or RTK-GNSS data. This advancement not only simplifies the data acquisition process but also makes it more accessible and cost-effective for practitioners. By stabilizing SfM calibration, all the subsequent stages - such as MVS, dense point cloud generation - can be effectively enhanced, leading to more accurate 3D reconstruction.
Author Contributions
Conceptualization: Ariyo Kanno; Methodology and Software: Truc Thanh Ho and Riku Sato; Formal analysis: Truc Thanh Ho and Riku Sato; Writing-original draft preparation: Truc Thanh Ho; Writing—review & editing: Ariyo Kanno, Tsuyoshi Imai, Koichi Yamamoto and Takaya Higuchi; Visualization: Truc Thanh Ho; Supervision: Ariyo Kanno.
Funding
This research was funded by JSPS KAKENHI Grant Number 22K04333.
Acknowledgments
The in-situ data (photos and ground surveying data) was obtained by Fujita Corporation, Japan.
Conflicts of Interest
The authors declare no conflicts of interest.
Abbreviations
The following abbreviations are used in this manuscript:
| BA | Bundle adjustment |
| CP | Constant-Pitch |
| DEM | Digital Elevation Model |
| GCP | Ground Control Point |
| GNSS | Global Navigation Satellite System |
| MVS | Multi-view Stereo |
| RMSE | Root Mean Square Error |
| RTK-GNSS | Real-Time Kinematic Global Navigation Satellite System |
| SfM | Structure-from-Motion |
| UAV | Unmanned Aerial Vehicle |
References
- Xu, Y.; Zhang, J. UAV-Based Bridge Geometric Shape Measurement Using Automatic Bridge Component Detection and Distributed Multi-View Reconstruction. Autom Constr 2022, 140. [Google Scholar] [CrossRef]
- Wang, F.; Zou, Y.; del Rey Castillo, E.; Ding, Y.; Xu, Z.; Zhao, H.; Lim, J.B.P. Automated UAV Path-Planning for High-Quality Photogrammetric 3D Bridge Reconstruction. Structure and Infrastructure Engineering 2024, 20, 1595–1614. [Google Scholar] [CrossRef]
- Khaloo, A.; Lattanzi, D.; Cunningham, K.; Dell’Andrea, R.; Riley, M. Unmanned Aerial Vehicle Inspection of the Placer River Trail Bridge through Image-Based 3D Modelling. Structure and Infrastructure Engineering 2018, 14, 124–136. [Google Scholar] [CrossRef]
- Siqueira, H.L.; Marcato, J.; Matsubara, E.T.; Eltner, A.; Colares, R.A.; Santos, F.M. The Impact of Ground Control Point Quantity on Area and Volume Measurements with UAV SFM Photogrammetry Applied in Open Pit Mines. In Proceedings of the IGARSS 2019 - 2019 IEEE International Geoscience and Remote Sensing Symposium; IEEE, July 2019; pp. 9093–9096. [Google Scholar]
- Hao, J.; Zhang, X.; Wang, C.; Wang, H.; Wang, H. Application of UAV Digital Photogrammetry in Geological Investigation and Stability Evaluation of High-Steep Mine Rock Slope. Drones 2023, 7, 198. [Google Scholar] [CrossRef]
- Dawei, Z.; Lizhuang, Q.; Demin, Z.; Baohui, Z.; Lianglin, G. Unmanned Aerial Vehicle (UAV) Photogrammetry Technology for Dynamic Mining Subsidence Monitoring and Parameter Inversion: A Case Study in China. IEEE Access 2020, 8, 16372–16386. [Google Scholar] [CrossRef]
- Bonali, F.L.; Corti, N.; Russo, E.; Marchese, F.; Fallati, L.; Pasquaré Mariotto, F.; Tibaldi, A. Commercial-UAV-Based Structure from Motion for Geological and Geohazard Studies. In; 2021; pp. 389–427.
- Yakar, M.; Ulvi, A.; Yiğit, A.Y.; Alptekin, A. Discontinuity Set Extraction from 3D Point Clouds Obtained by UAV Photogrammetry in a Rockfall Site. Survey Review 2023, 55, 416–428. [Google Scholar] [CrossRef]
- Butcher, B.; Walton, G.; Kromer, R.; Gonzales, E.; Ticona, J.; Minaya, A. High-Temporal-Resolution Rock Slope Monitoring Using Terrestrial Structure-from-Motion Photogrammetry in an Application with Spatial Resolution Limitations. Remote Sens (Basel) 2023, 16, 66. [Google Scholar] [CrossRef]
- Saito, T.; Kawai, T.; Takahara, Y.; Nagamatsu, D.; Inosako, K. Sand Movement Analysis of the Tottori Sand Dunes Using Aerial Photogrammetry by UAVs. 2024, 34–87. [CrossRef]
- Laporte-Fauret, Q.; Marieu, V.; Castelle, B.; Michalet, R.; Bujan, S.; Rosebery, D. Low-Cost UAV for High-Resolution and Large-Scale Coastal Dune Change Monitoring Using Photogrammetry. J Mar Sci Eng 2019, 7, 63. [Google Scholar] [CrossRef]
- Fraser, C.S.; Al-Ajlouni, S. Zoom-Dependent Camera Calibration in Digital Close-Range Photogrammetry. Photogramm Eng Remote Sensing 2006, 72, 1017–1026. [Google Scholar] [CrossRef]
- Fraser, C.S. PHOTOGRAMMETRY & REMOTE SENSING Digital Camera Self-Calibration; 1997; Vol. 52.
- Abeho, D.R.; Shoko, M.; Odera, P.A. Effects of Camera Calibration on the Accuracy of Unmanned Aerial Vehicle Sensor Products. International Journal of Engineering and Geosciences 2024. [Google Scholar] [CrossRef]
- Senn, J.A.; Mills, J.; Walsh, C.L.; Addy, S.; Peppa, M. On-site Geometric Calibration of RPAS Mounted Sensors for SfM Photogrammetric Geomorphological Surveys. Earth Surf Process Landf 2022, 47, 1615–1634. [Google Scholar] [CrossRef]
- Daakir, M.; Zhou, Y.; Pierrot Deseilligny, M.; Thom, C.; Martin, O.; Rupnik, E. Improvement of Photogrammetric Accuracy by Modeling and Correcting the Thermal Effect on Camera Calibration. ISPRS Journal of Photogrammetry and Remote Sensing 2019, 148, 142–155. [Google Scholar] [CrossRef]
- Elias, M.; Eltner, A.; Liebold, F.; Maas, H.-G. Assessing the Influence of Temperature Changes on the Geometric Stability of Smartphone- and Raspberry Pi Cameras. Sensors 2020, 20, 643. [Google Scholar] [CrossRef] [PubMed]
- Sanz-Ablanedo, E.; Chandler, J.H.; Ballesteros-Pérez, P.; Rodríguez-Pérez, J.R. Reducing Systematic Dome Errors in Digital Elevation Models through Better UAV Flight Design. Earth Surf Process Landf 2020, 45, 2134–2147. [Google Scholar] [CrossRef]
- Smith, M.J.; Cope, E. The Effects of Temperature Variation on Single-Lens-Reflex Digital Camera Calibration Parameters. In Proceedings of the International Archives of Photogrammetry, Remote Sensing and Spatial Information Sciences, Vol. XXXVIII, Part 5 Commission V Symposium, Newcastle upon Tyne, UK, 2010; Vol. XXXVIII, p. 554559. [Google Scholar]
- Luo, W.; Shao, M.; Che, X.; Hesp, P.A.; Bryant, R.G.; Yan, C.; Xing, Z. Optimization of UAVs-SfM Data Collection in Aeolian Landform Morphodynamics: A Case Study from the Gonghe Basin, China. Earth Surf Process Landf 2020, 45, 3293–3312. [Google Scholar] [CrossRef]
- Ariyo Kanno; Matsuoka Yuji; Yuki Otsu; Kazuo Sugimoto; Masaya Takada Effect of Constant Pitch Meandering Flight Method and Analysis Settings in SfM without GCPs (Translated from Japanese). Proceedings of JSPRS Annual Conference 2021 (日本写真測量学会令和3年度秋季学術講演会発表論文集) 2021, 49–52.
- Ariyo, K.; Junnosuke, K.; Truc, T.H.; Masaki, H.; Tatsuji, F.; Kyouhei, K. Accuracy Verification Experiment of UAV Photogrammetry Using Optical Axis Optimization Shooting with Airpeak S1 + A7Ⅲ(Translated from Japanese). Proceedings of JSPRS Annual Conference 2022 (日本写真測量学会令和4年度秋季学術講演会発表論文集) 2022, 41–42.
- Truc, T.H.; Ariyo, K.; Yuji, M.; Masahiko, S.; Tsuyoshi, I.; Koichi, Y.; Takaya, H. Robustness of Structure from Motion Accuracy/Precision against the Non-Optimality in Analysis Settings: Case Study in Constant-Pitch Flight Design. Int. J. of Automation Technology 2024, 18. [Google Scholar]
- Nesbit, P.R.; Hugenholtz, C.H. Enhancing UAV-SfM 3D Model Accuracy in High-Relief Landscapes by Incorporating Oblique Images. Remote Sens (Basel) 2019, 11. [Google Scholar] [CrossRef]
- Junnosuke Kon; Ariyo Kanno; Masaki Haruna; Tatsuji Fujii; Kyouhei Kurita The Robustness of SfM Settings and Vulnerability to Dome-Shaped Deformation in Four Types of UAV Oblique Photography Methods. (Translated from Japanese). Proceedings of JSPRS Annual Conference 2023 (日本写真測量学会令和5年度春季学術講演会発表論文集) 2023, 37–38.
- Hartley, R.; Zisserman, A. Multiple View Geometry in Computer Vision, 2nd ed.; Cambridge University Press, 2004; ISBN 9780521540513. [Google Scholar]
- Štroner, M.; Urban, R.; Seidl, J.; Reindl, T.; Brouček, J. Photogrammetry Using UAV-Mounted GNSS RTK: Georeferencing Strategies without GCPs. Remote Sens (Basel) 2021, 13. [Google Scholar] [CrossRef]
- Blender Foundation Blender 2.79 Release Notes.
- DJI Enterprise Phantom 4 RTK Available online:. Available online: https://www.dji.com/jp/support/product/phantom-4-rtk (accessed on 19 November 2024).
- Aerosense Inc. Aerobo Marker. Available online: https://aerosense.co.jp/en/products/equipment_systems/ (accessed on 19 November 2024).
- James, M.R.; Chandler, J.H.; Eltner, A.; Fraser, C.; Miller, P.E.; Mills, J.P.; Noble, T.; Robson, S.; Lane, S.N. Guidelines on the Use of Structure-from-Motion Photogrammetry in Geomorphic Research. Earth Surf Process Landf 2019, 44, 2081–2084. [Google Scholar] [CrossRef]
- Kahl, F.; Triggs, B.; Åström, K. Critical Motions for Auto-Calibration When Some Intrinsic Parameters Can Vary. J Math Imaging Vis 2000, 13, 131–146. [Google Scholar] [CrossRef]
- Iheaturu, C.; Okolie, C.; Ayodele, E.; Egogo-Stanley, A.; Musa, S.; Ifejika Speranza, C. A Simplified Structure-from-Motion Photogrammetry Approach for Urban Development Analysis. Remote Sens Appl 2022, 28, 100850. [Google Scholar] [CrossRef]
- Ahmed, S.; El-Shazly, A.; Abed, F.; Ahmed, W. The Influence of Flight Direction and Camera Orientation on the Quality Products of UAV-Based SfM-Photogrammetry. Applied Sciences (Switzerland) 2022, 12. [Google Scholar] [CrossRef]
Figure 1.
Constant-pitch flight at 20o pitch angle.
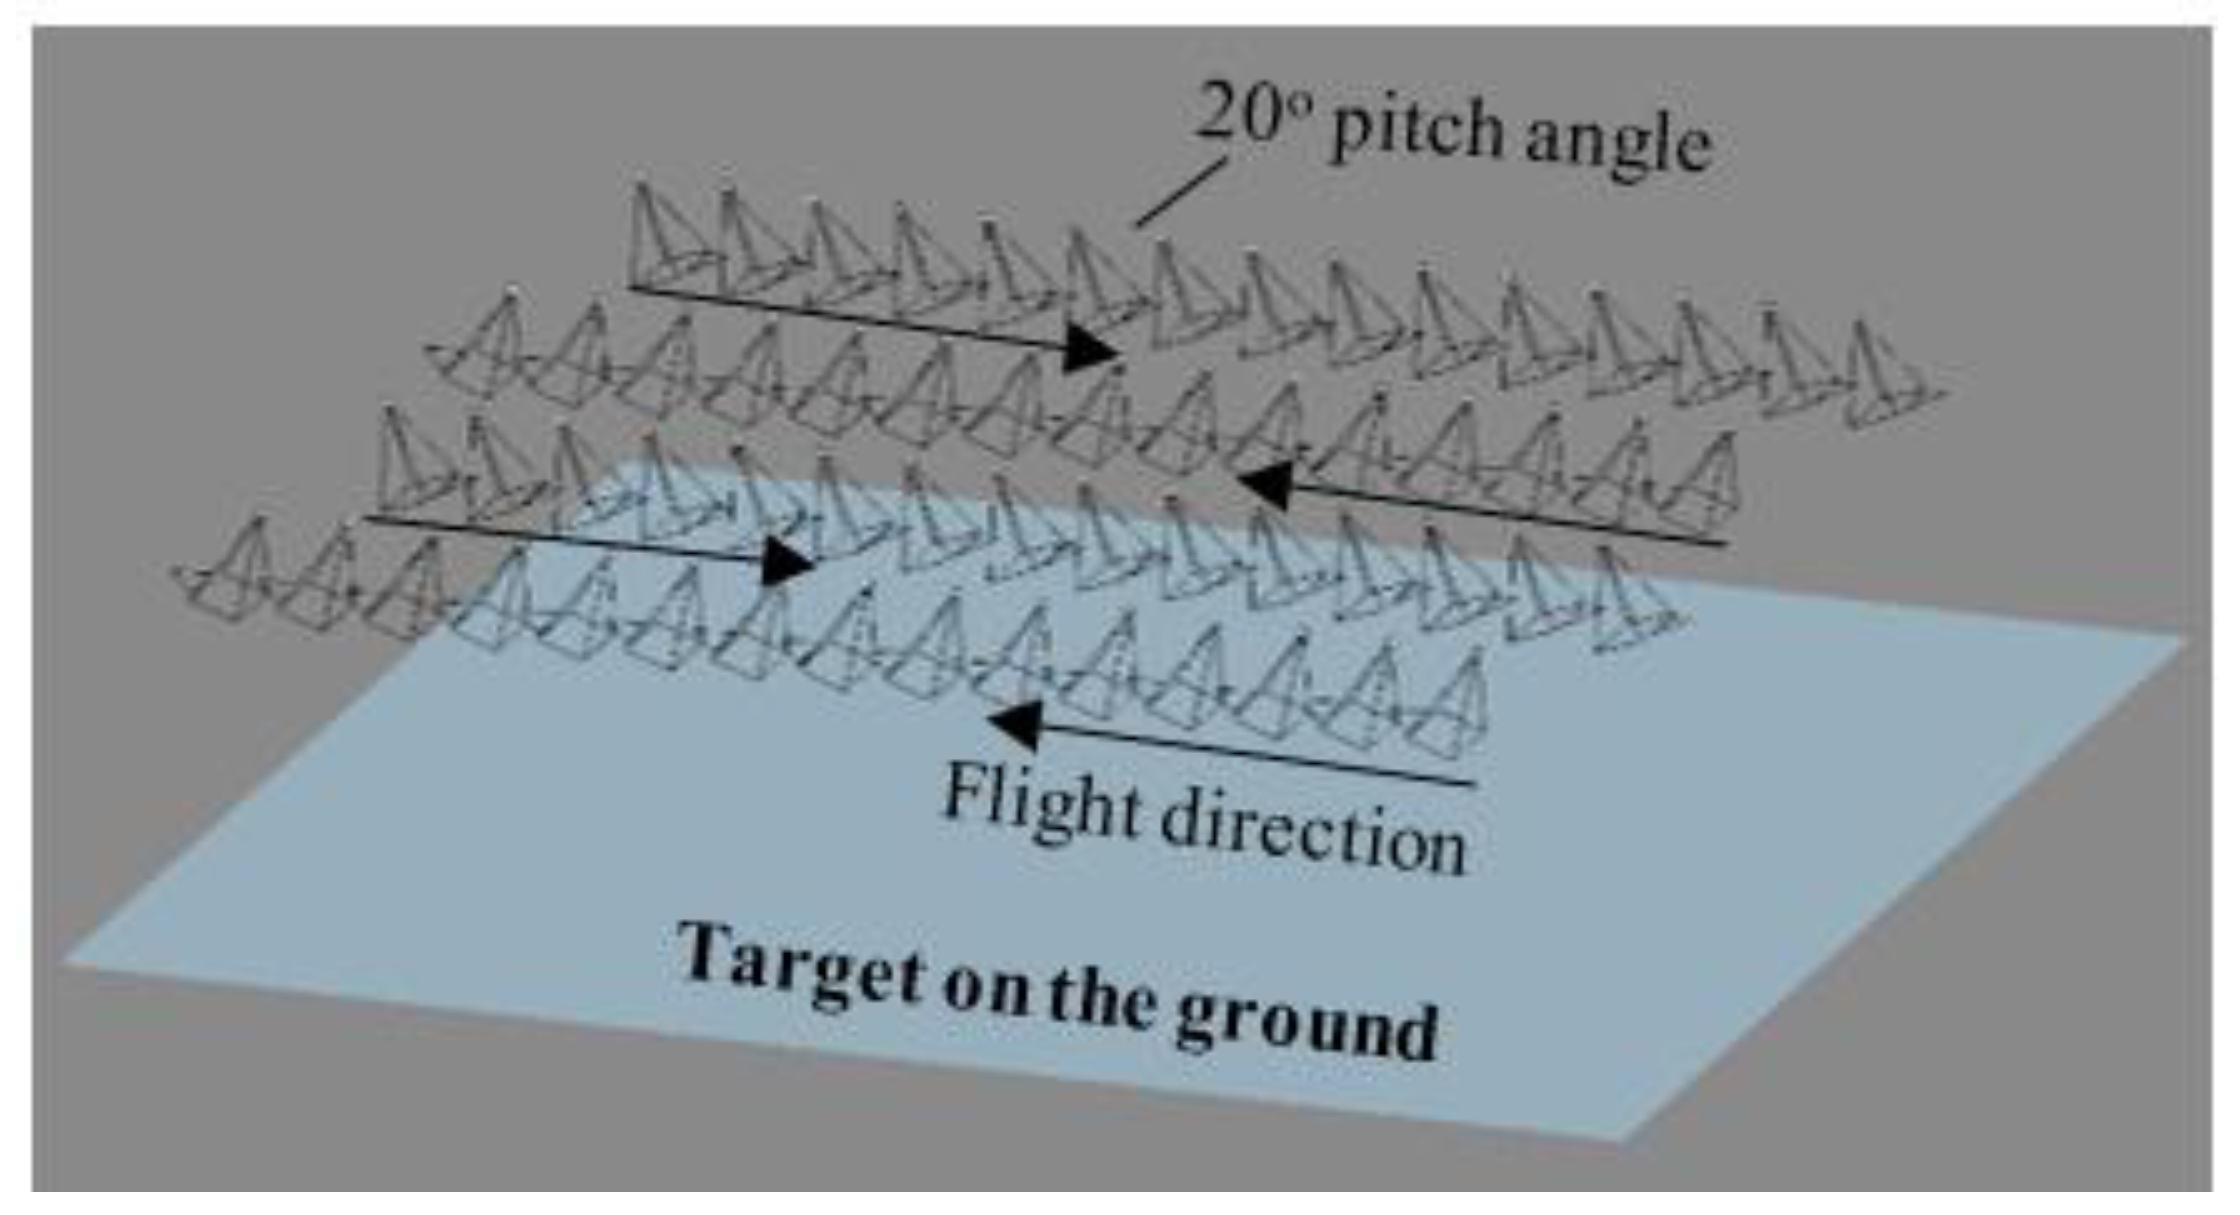
Figure 2.
Two views of the target used for image acquisition in the numerical experiments: (a) Side view; (b) Front view.
Figure 2.
Two views of the target used for image acquisition in the numerical experiments: (a) Side view; (b) Front view.
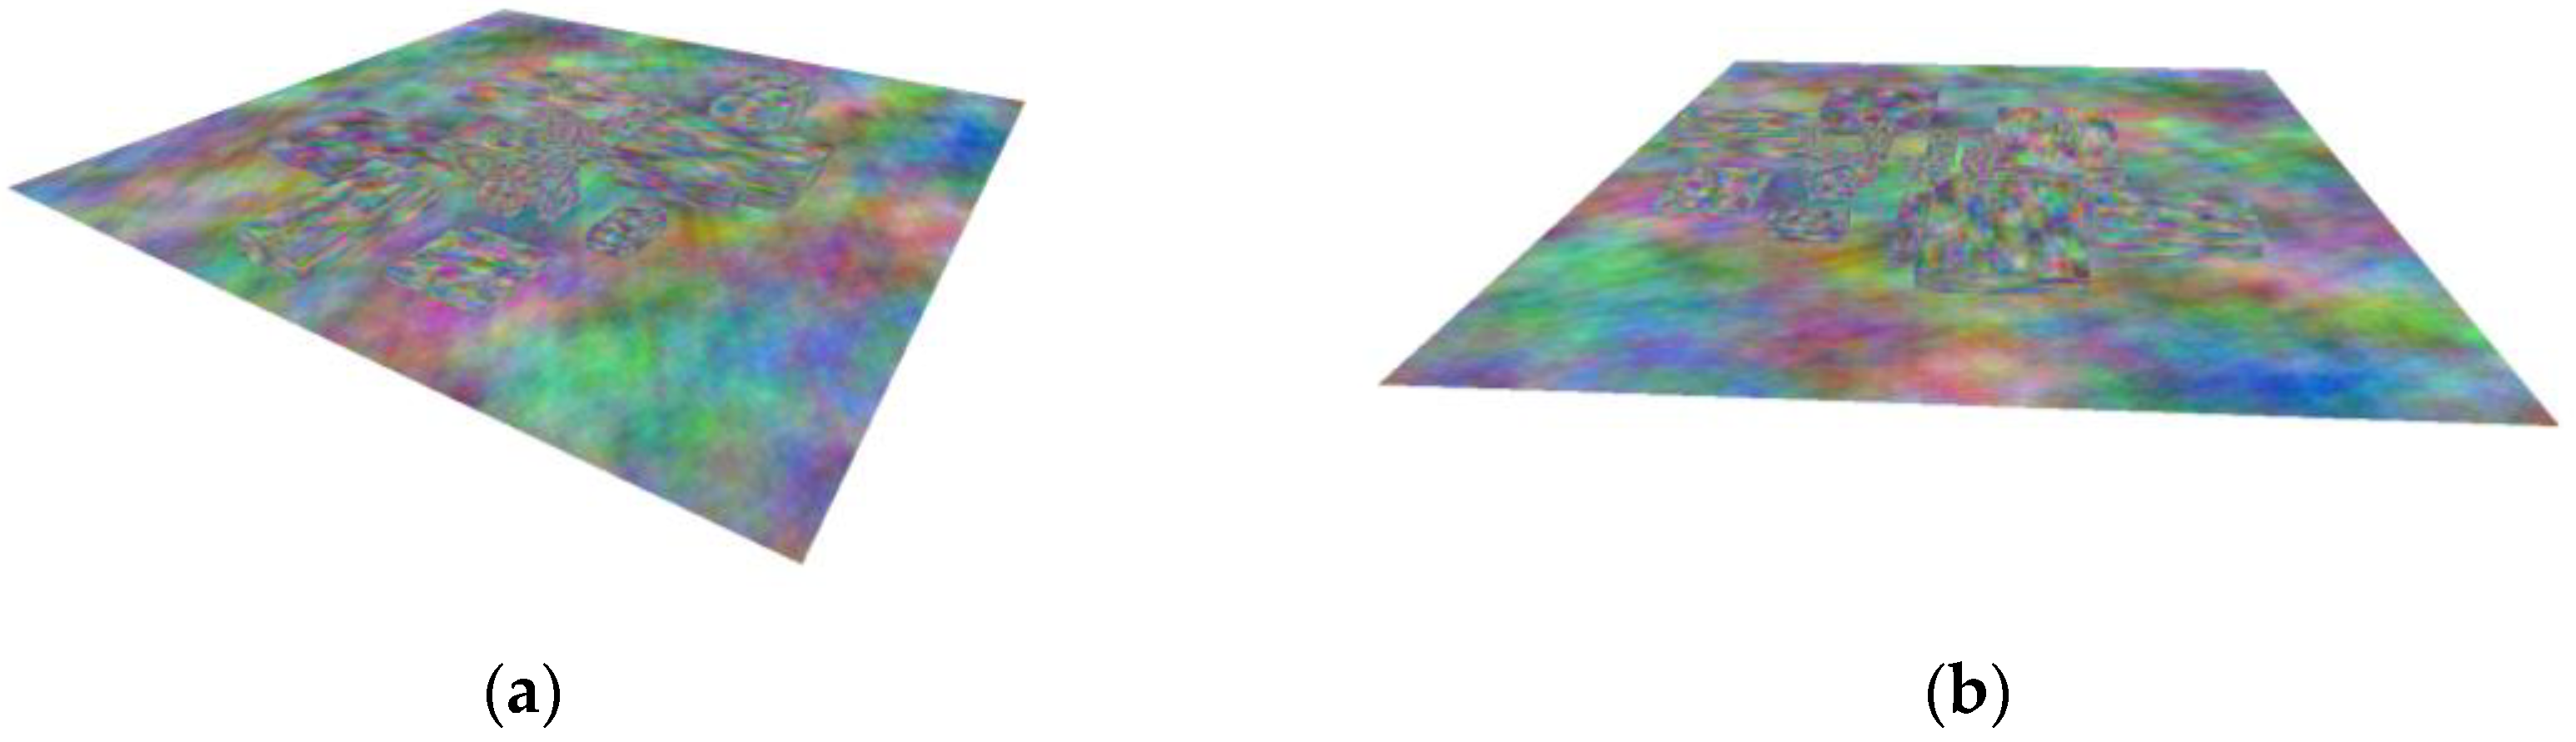
Figure 3.
SfM flow in numerical experiments to evaluate the indeterminacy of each intrinsic parameter (f or cy).
Figure 3.
SfM flow in numerical experiments to evaluate the indeterminacy of each intrinsic parameter (f or cy).
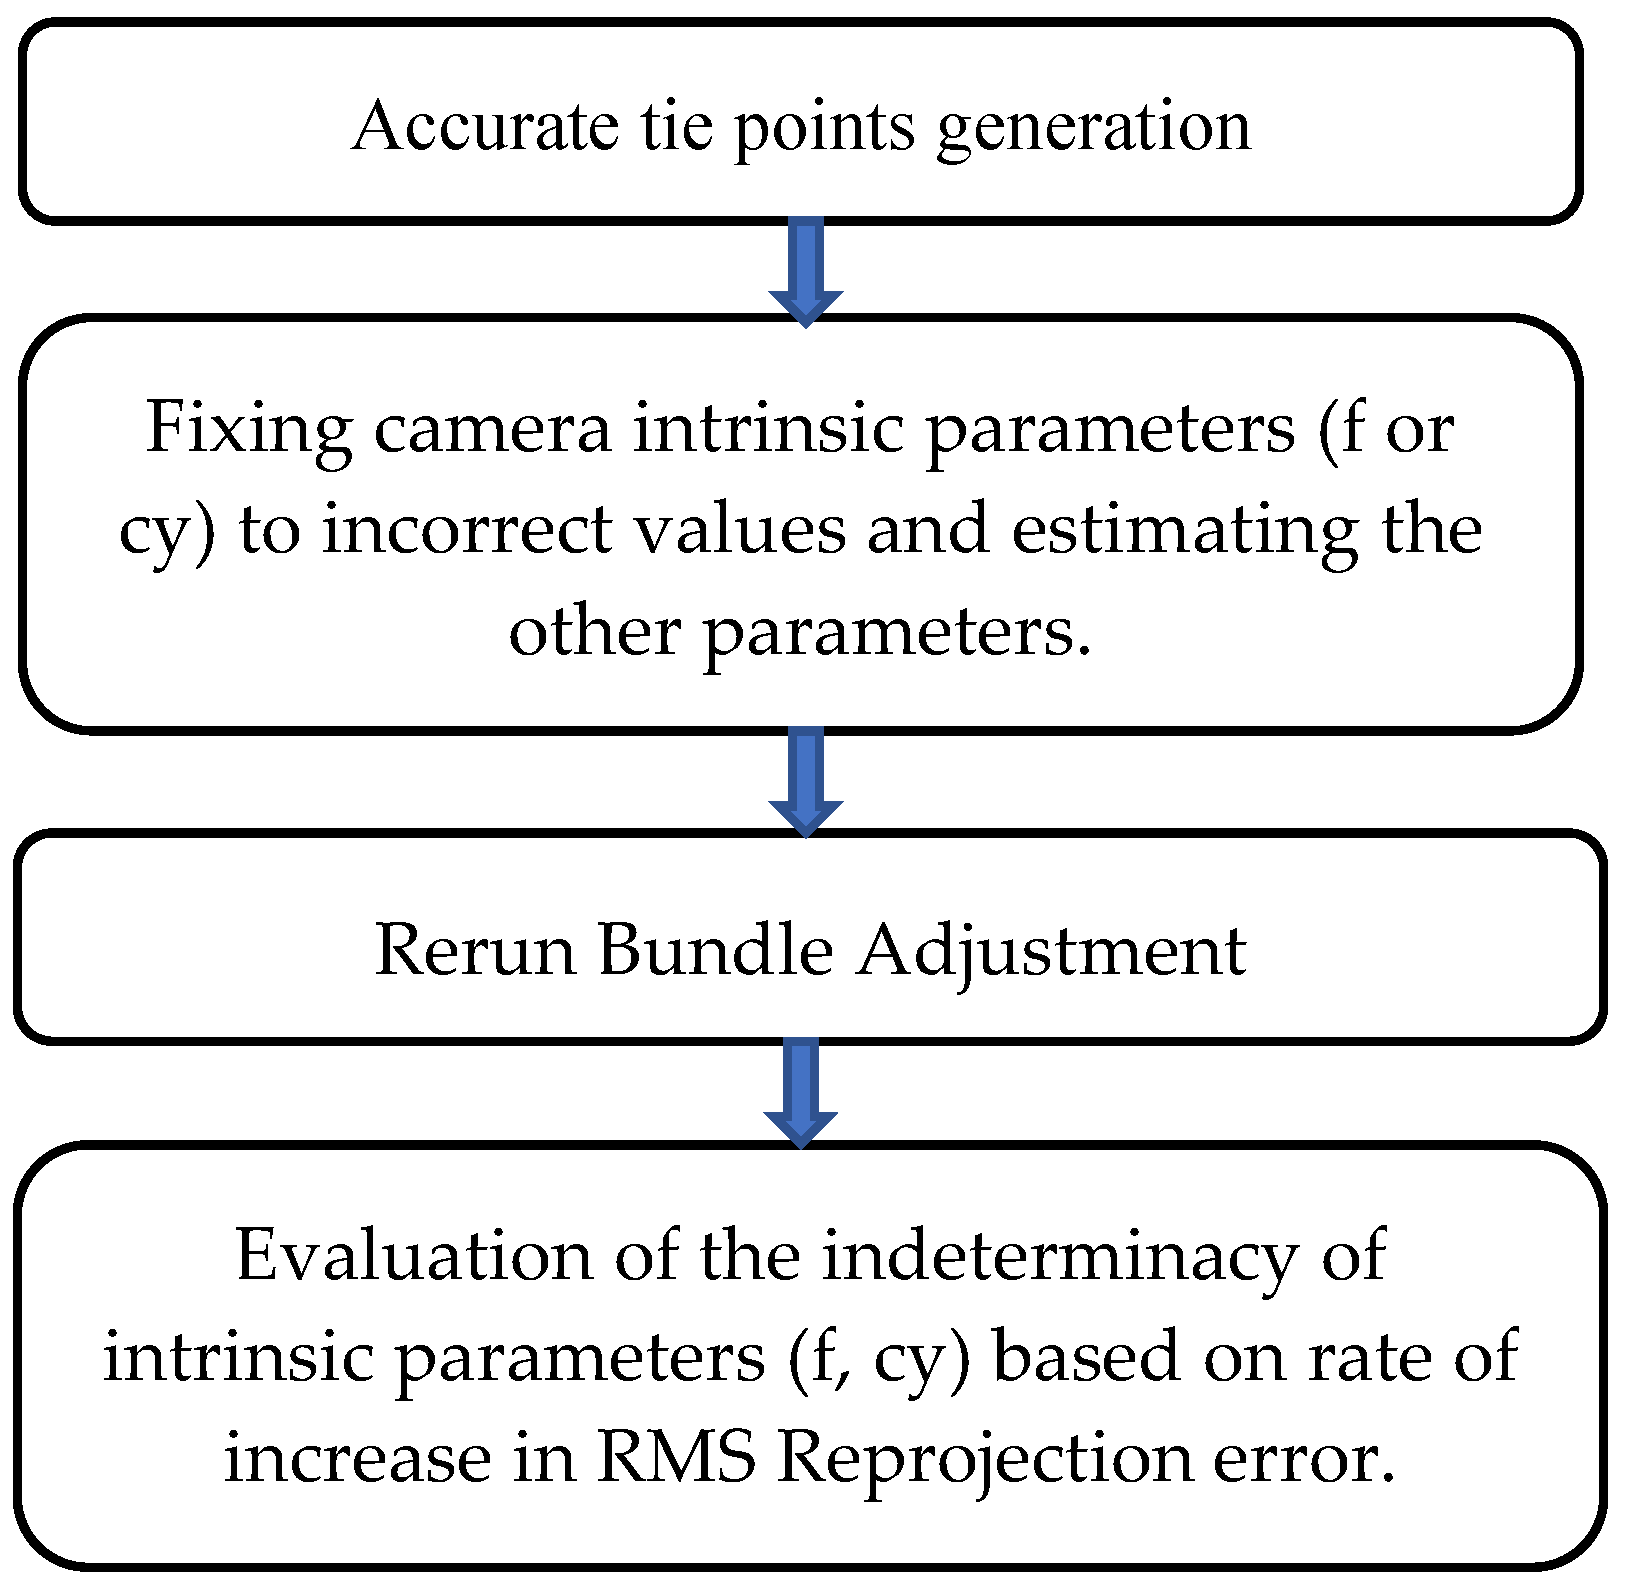
Figure 4.
Distribution of camera positions and validation points at the study site overlaid with orthophotos generated by: GSD 10 (a), GSD 15 (b), GSD 20 (c). At each validation point, world coordinates were measured by Aerobo markers with a built-in GNSS receiver.
Figure 4.
Distribution of camera positions and validation points at the study site overlaid with orthophotos generated by: GSD 10 (a), GSD 15 (b), GSD 20 (c). At each validation point, world coordinates were measured by Aerobo markers with a built-in GNSS receiver.

Figure 5.
Generation of CP flights from CP-Plus flights used in real-data analysis.

Figure 6.
Camera location and RMS reprojection error (pixels) for each camera in CP-Plus flight.
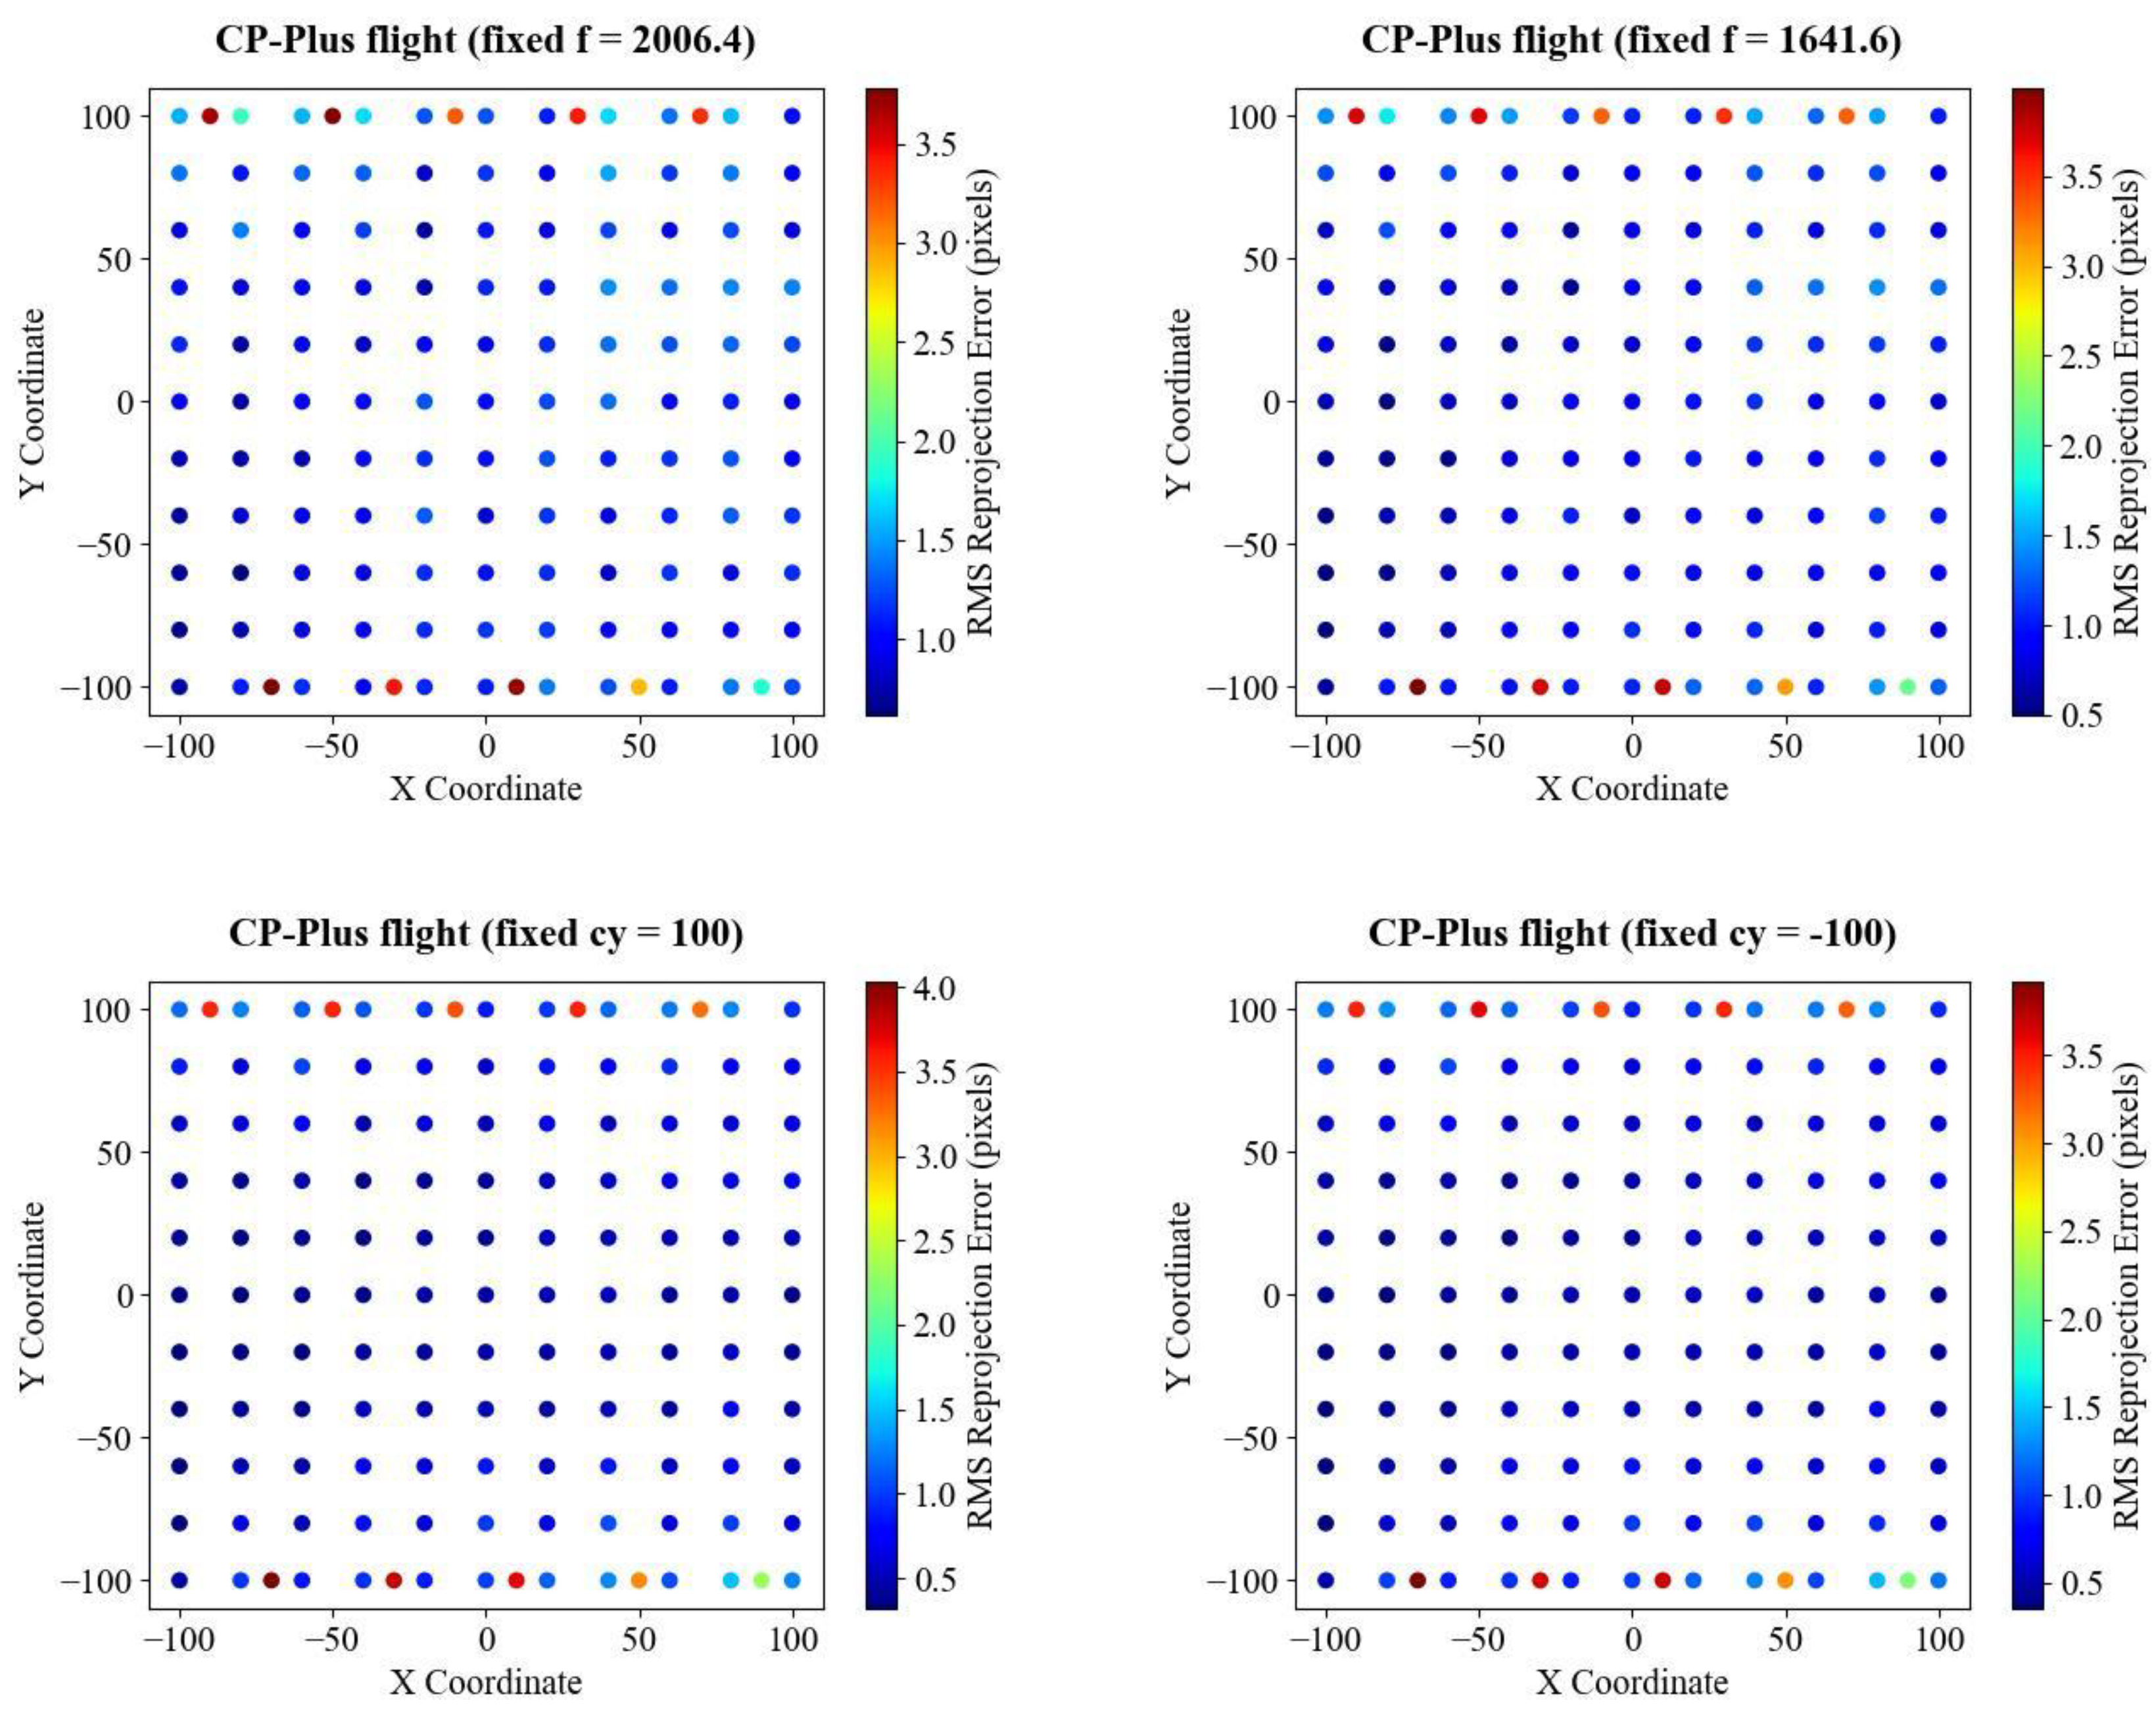
Figure 7.
The correlation between estimated f and mean vertical error (MEZ).
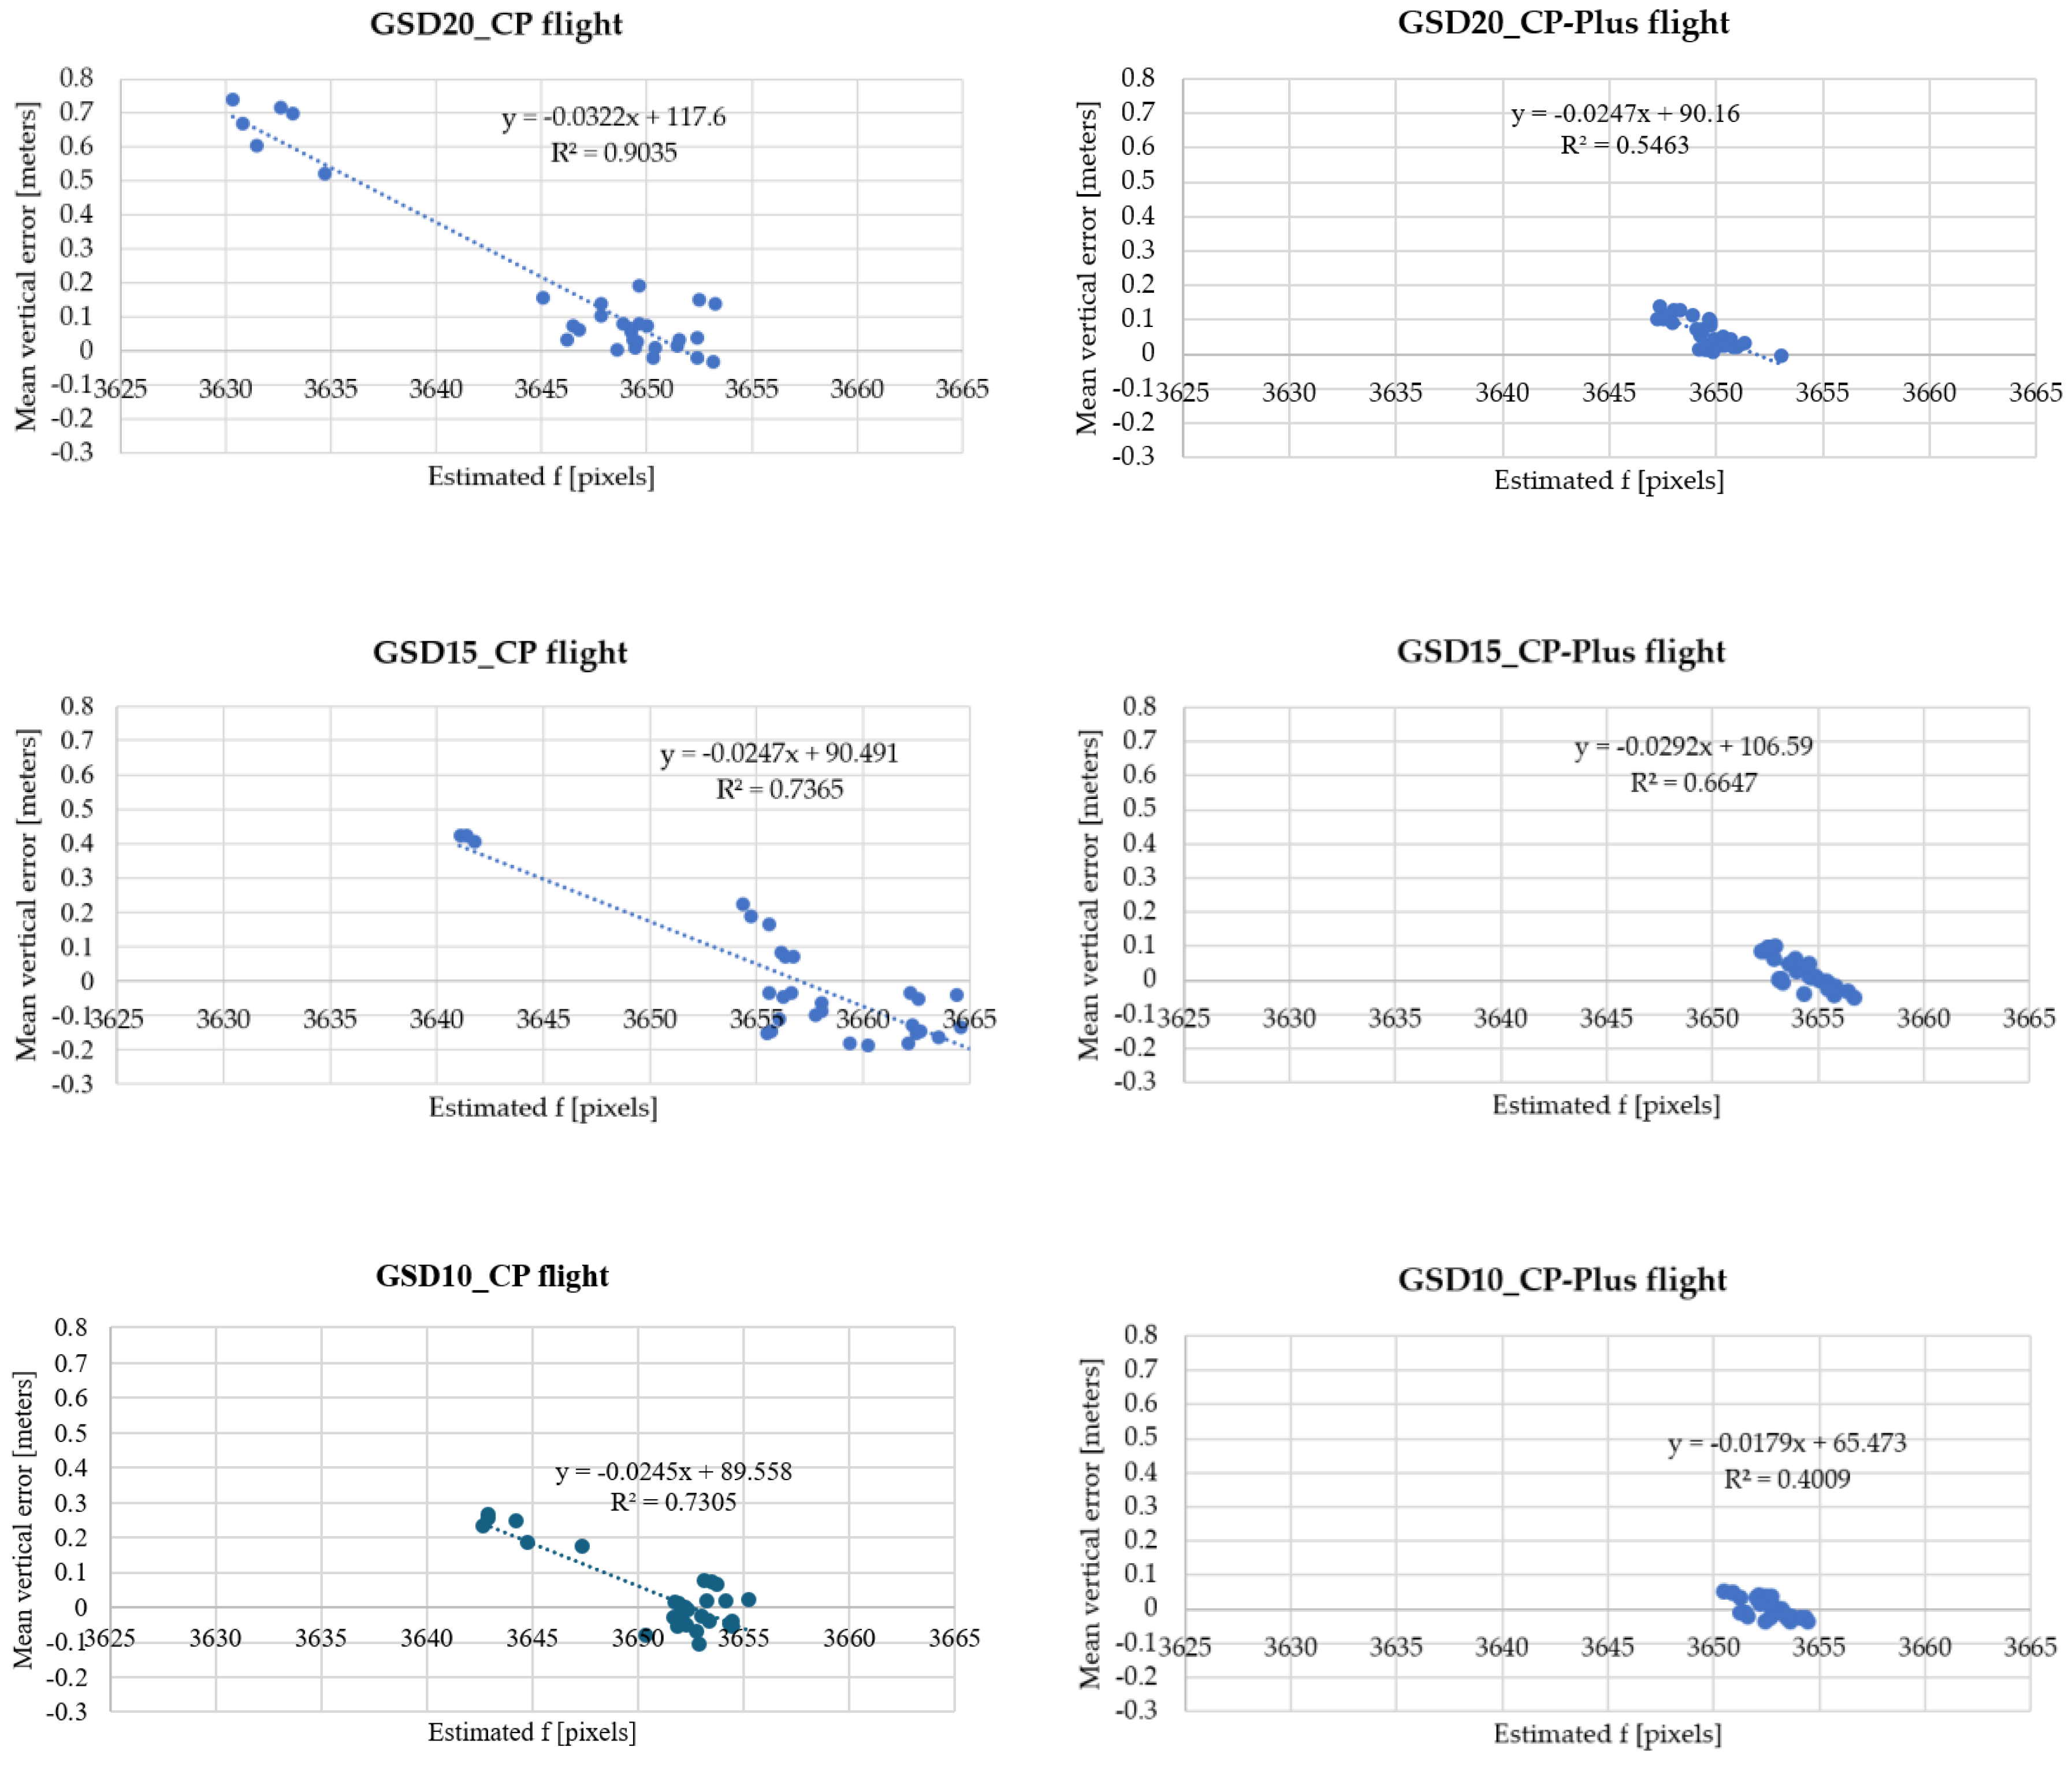

Table 1.
Camera specifications used in CG space.
| Parameters | Value |
|---|---|
| Pin hole camera | Linear camera with no distortion |
| Focal length (pixels) Image size (pixels) |
1,824 2,736 x 1,824 |
Table 2.
Descriptions of three image-sets taken by three flight designs in numerical experiments.
| Parameters | CP Flight | CP Random Flight | CP-Plus Flight |
|---|---|---|---|
| Flight design | Constant pitch flight | Cameras were randomly placed on the horizontal plane 73 m above the target plane. Each camera was oriented in one of the two orientations appearing in CP flight. | One image with the same pitch angle was added to each intermediate short strip (strip between two flight lines) of CP flight. |
| Strip interval (meters) | 43.8 | Random | 43.8 |
| Images interval in one strip (meters) | 14.6 | Random | 14.6 |
| Number of images | 121 | 200 | 131 |
| Illustration | 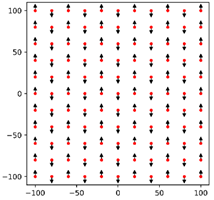 |
 |
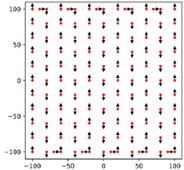 |
Table 3.
Settings for “Alignment” used to generate accurate tie points.
| Parameters | Values |
|---|---|
| Input image size | High (original size) (2736 x 1824 pixels) |
| Key point limit | 50,000 |
| Intrinsic parameters estimation | Fixed to true value during BA. |
Table 4.
Summary of three CP-Plus flights acquired by P4RTK and three generated CP flights in real-data analysis.
Table 4.
Summary of three CP-Plus flights acquired by P4RTK and three generated CP flights in real-data analysis.
| Shooting Attitude [m] | Shooting Attitude [m] | Overlap Ratio [%] | |
|---|---|---|---|
| CP-Plus Flights | CP Flights | ||
| 73 (GSD20) | 74 | 61 | 80% forward, 60% side lap. |
| 55 (GSD15) | 107 | 91 | |
| 36 (GSD10) | 187 | 163 | |
Table 5.
Summary of the analysis settings tested in this study.
| Setting Items | Meaning | Setting Values |
|---|---|---|
| Align photos Accuracy |
Set the size of input images (shrinkage ratio) for feature extraction. • High: used original size. • Medium: image downscaled by a factor of two at each image side. |
High, medium |
| Key point limit | Set the maximum number of feature points detected in each image. | 1/2, 1/3, 1/4 of the average number of detectable keypoints for the input images, corresponding to: 35643, 23762, 17821 when the size of input images is set as High. 8229, 5486, 4115 when the size of input images is set as Medium. |
| Tie point limit | Set the maximum number of tie points to be detected in each image. | 0 It will attempt to detect as many tie points as possible in each image. |
| Optimize camera alignment |
Set the intrinsic parameters considered in Brown models. |
① f, cx, cy, k1-k4, p1-p4, b1, b2 ② f, cx, cy, k1-k4, p1-p4 ③ f, cx, cy, k1-k4, p1-p2 ④ f, cx, cy, k1-k3, p1-p4 ⑤ f, cx, cy, k1-k3, p1-p2 |
| 2 x 3 x 5 = 30 analysis settings with 50 trials/setting, equivalent to 1500 trials for each image set. | ||
Table 6.
RMS reprojection error and estimated parameter values when fixing parameter f or cy to incorrect values for three flight designs.
Table 6.
RMS reprojection error and estimated parameter values when fixing parameter f or cy to incorrect values for three flight designs.
 |
E incorrect: RMS reprojection error when fixing either f or cy to the incorrect values and estimating the remaining parameter in BA. E true: RMS reprojection error when fixing both f and cy to true values (1824 and 0 pixels, respectively) in BA.
Table 7.
Rate of increase in RMS reprojection error when fixing parameter f or cy to incorrect values for three flight designs.
Table 7.
Rate of increase in RMS reprojection error when fixing parameter f or cy to incorrect values for three flight designs.
 |
Table 8.
Intrinsic parameters estimation and statistics of RMS error of all validation points for each image-set (one SfM analysis settings with 50 trials).
Table 8.
Intrinsic parameters estimation and statistics of RMS error of all validation points for each image-set (one SfM analysis settings with 50 trials).
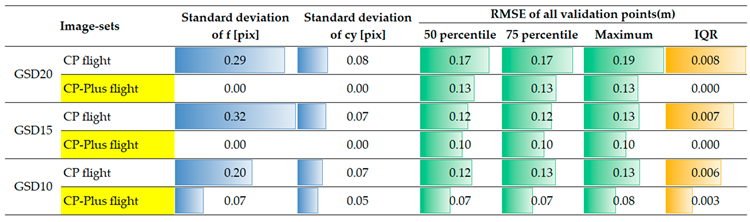 |
Table 9.
Intrinsic parameters estimation and statistics of RMS error of all validation points for each image-set (30 analysis settings with 50 trials of each setting).
Table 9.
Intrinsic parameters estimation and statistics of RMS error of all validation points for each image-set (30 analysis settings with 50 trials of each setting).
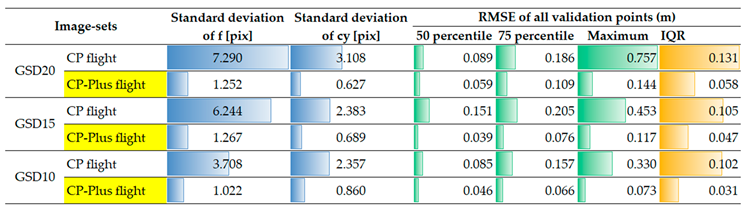 |
Table 10.
Average of vertical error ratio for each image-set (30 SfM analysis settings and 50 trials per setting).
Table 10.
Average of vertical error ratio for each image-set (30 SfM analysis settings and 50 trials per setting).
| Image Sets | Average of Vertical Error Ratio (%) | |
|---|---|---|
| CP - Plus Flight | CP Flight | |
| GSD 10 | 80.65 | 84.09 |
| GSD 15 | 80.71 | 97.84 |
| GSD 20 | 88.60 | 88.37 |
Disclaimer/Publisher’s Note: The statements, opinions and data contained in all publications are solely those of the individual author(s) and contributor(s) and not of MDPI and/or the editor(s). MDPI and/or the editor(s) disclaim responsibility for any injury to people or property resulting from any ideas, methods, instructions or products referred to in the content. |
© 2025 by the authors. Licensee MDPI, Basel, Switzerland. This article is an open access article distributed under the terms and conditions of the Creative Commons Attribution (CC BY) license (https://creativecommons.org/licenses/by/4.0/).
Copyright: This open access article is published under a Creative Commons CC BY 4.0 license, which permit the free download, distribution, and reuse, provided that the author and preprint are cited in any reuse.


