Submitted:
06 May 2025
Posted:
07 May 2025
You are already at the latest version
Abstract
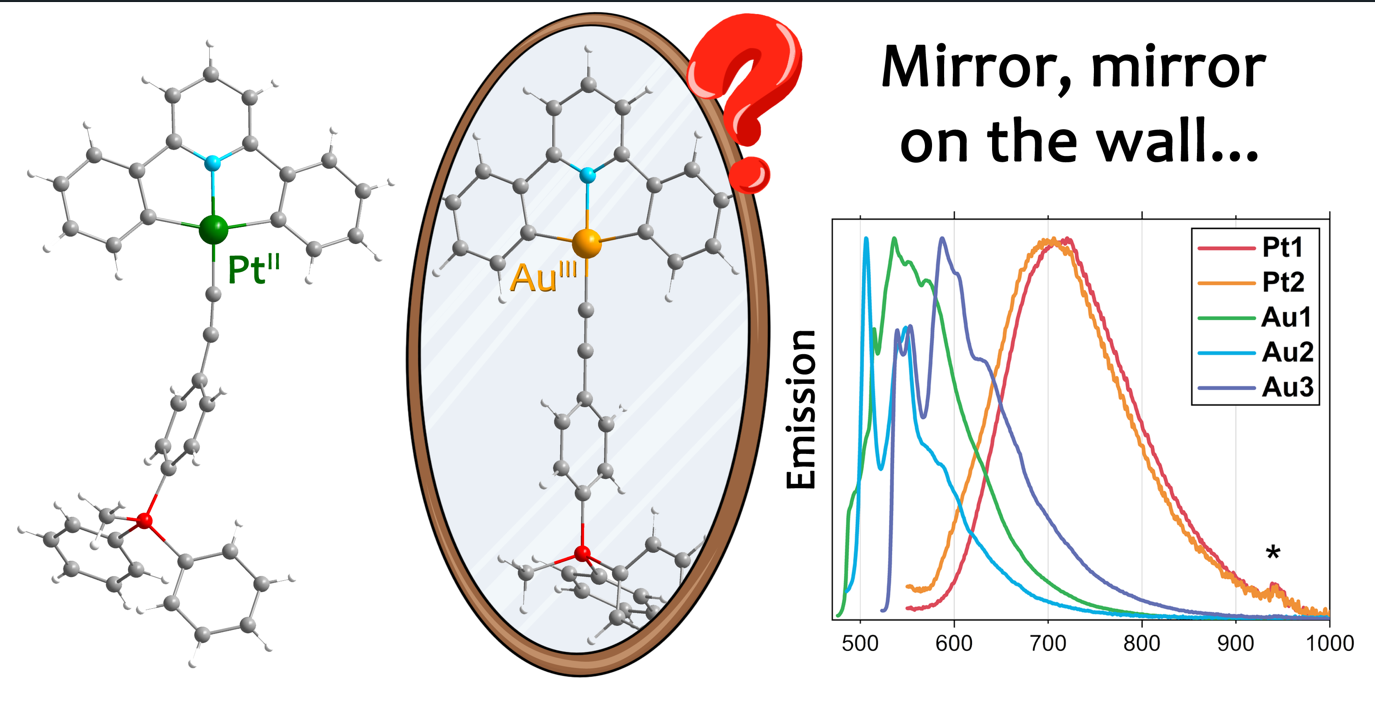
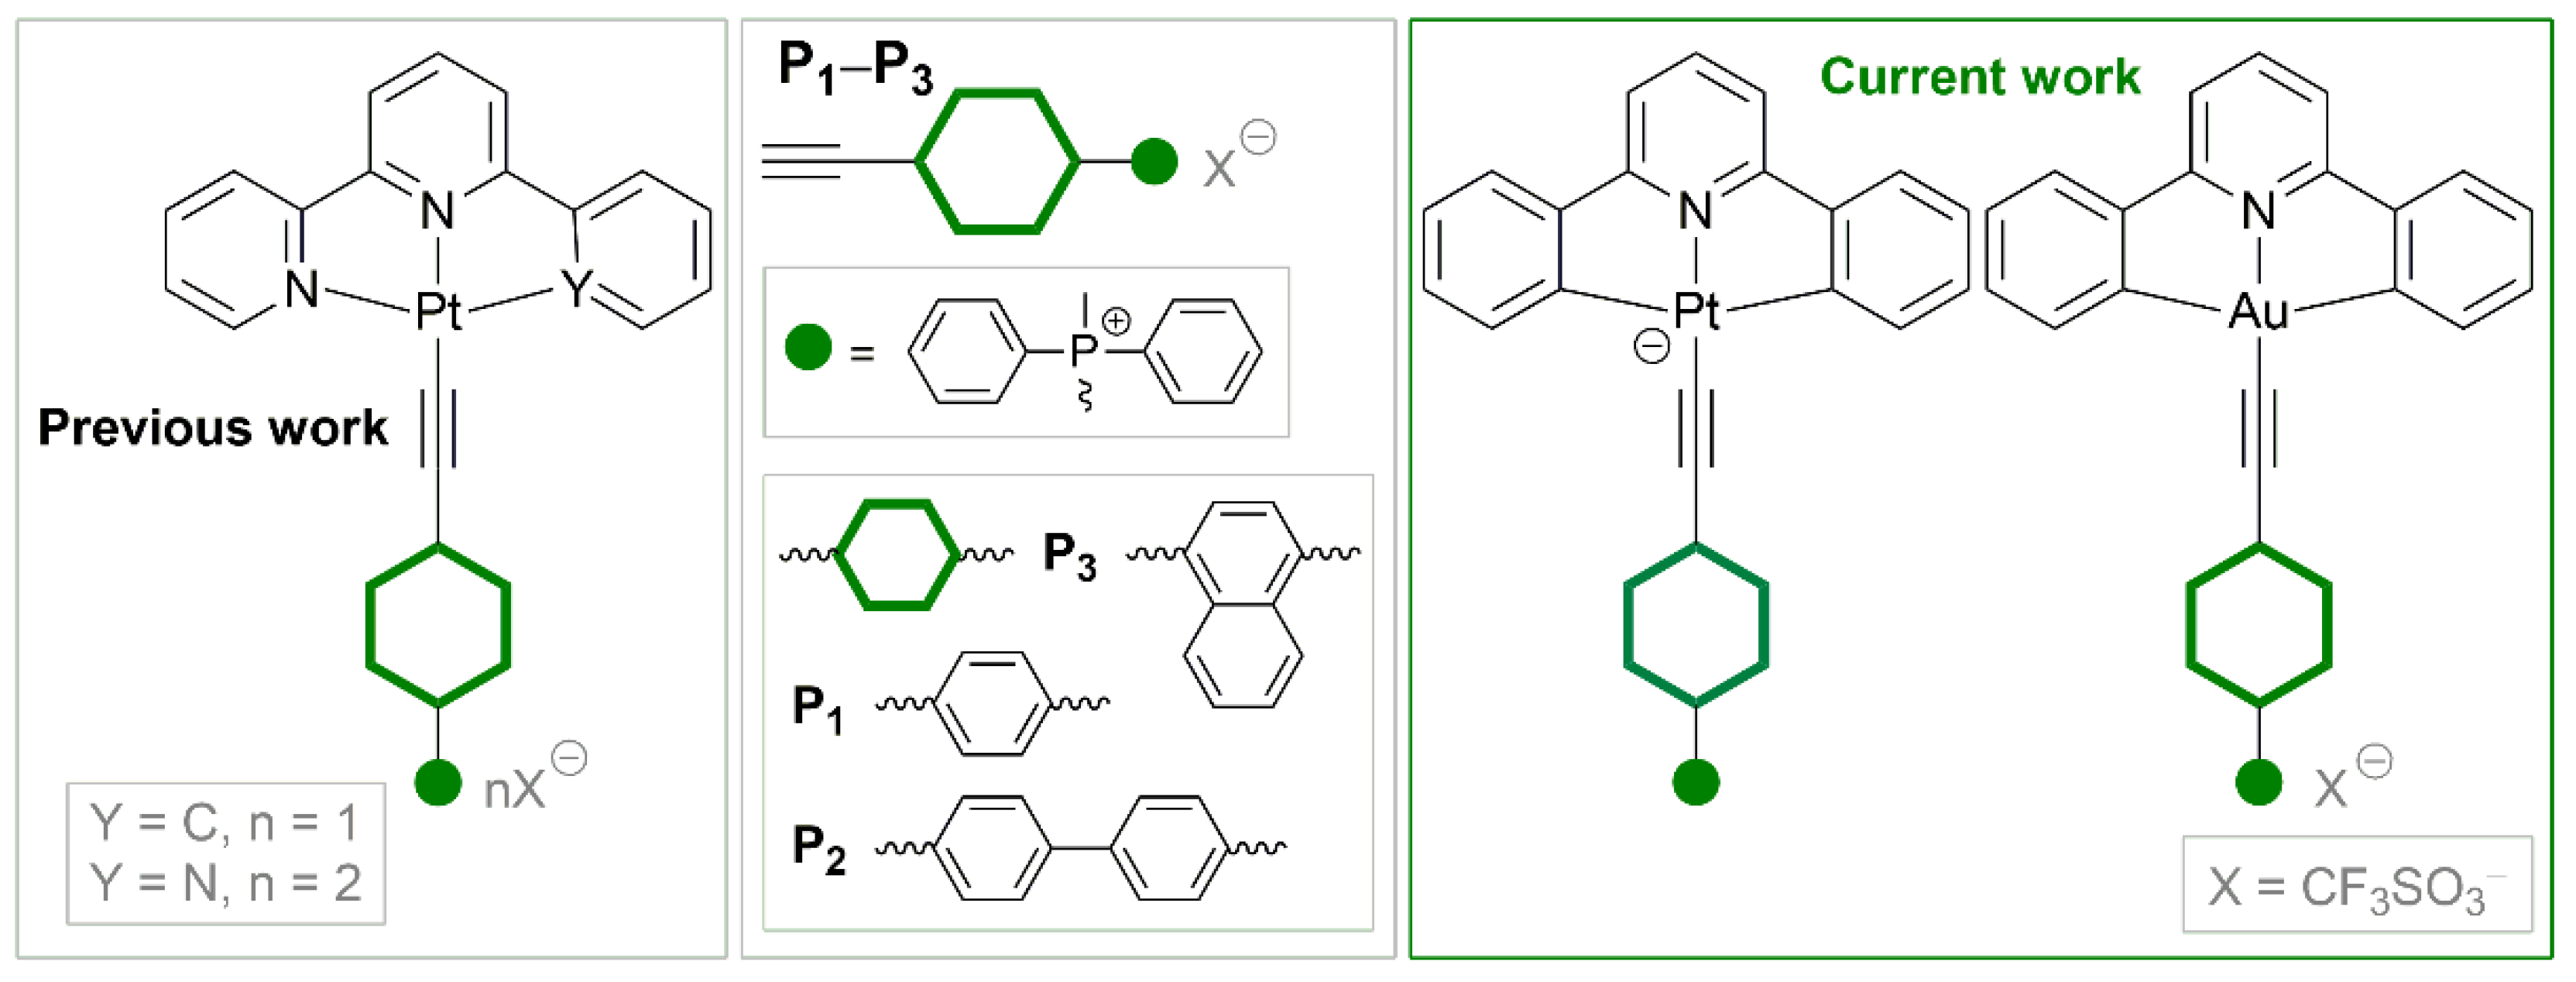
In this work, two series of isostructural Au(III) and Pt(II) alkynylphosphonium complexes [M(CNC)(C2−L−P(CH3)Ph2)]n+ Pt1–Pt3 (n = 0) and Au1–Au3 (n = 1), (CNC = 2,6-diphenylpyridine; L = phenyl, M1; biphenyl, M2; naphthyl, M3) were synthesized and characterized to discover the similarities and differences in photophysical properties between isoelectronic metallocenters. It is shown, that Au(III) and Pt(II) complexes obtained demonstrate different photophysical properties despite isoelectronic metal centres, and some reasons for that are discussed based on experimental data and quantum-chemical calculation results. Complex Pt1 also demonstrated the first example of room-temperature solution phosphorescence in the family of [Pt(CNC)(alkynyl)] complexes. It has been found that the crystal packing of Pt1 contains a Pt–H interaction, qualified by quantum-chemical calculations as unique hydrogen bond.
Keywords:
platinum complex
; gold complex
; alkynylphosphonium ligand
; luminescence
; DFT calculations
; Pt–H hydrogen bond
1. Introduction
Pt(II) complexes are widely studied because of their rich photophysical properties. They can find applications in various fields, among them OLED devices [1], photocatalysis [2], sensors [3], bioimaging [4] and even anti-counterfeiting [5]. Over the past few years, a growing interest of their isoelectronic analogues, Au(III) complexes, is emerging [6,7]. Although Au(III) complexes have long been considered non-luminescent due to low-lying d-d states [8], cyclometallated species do demonstrate interesting photophysical properties, e.g. TADF and TDSP [9,10,11] and can be also used in OLED devices [11,12].
It is known that Pt(II) and Au(III) are isoelectronic metal centers, and their complexes can be considered as isostructural analogues. Despite this fact, there is no literature data regarding comparison of these complexes. In this contribution, we synthesized and compared two bis-cyclometallated series of Au(III) and Pt(II) with CNC and alkynylphosphonium ligands (Scheme 1).
Previous studies of the Pt(II) complexes with CNN/NNN and alkynylphosphonium ligands revealed intriguing photophysical properties. Among others, the complexes [Pt(NNN)(C2−L−P(CH3)Ph2)]2+ in solid state show significantly different emission wavelengths upon variation of anion size.[13] Herein, we seek to discover, if alkynylphosphonium complexes of Pt(II) and Au(III) with ancillary CNC ligand can be called “analogues” in terms of their photophysical properties. Also, the influence of charged PR4+ fragment on complexes’ emission properties is considered.
2. Results and Discussion
2.1. Synthesis and Characterization of Pt(II) and Au(III) Complexes
The Pt(II) complexes Pt1−Pt3 (Scheme S1) were synthesized in two steps (Scheme 2). At first, lithiation of corresponding alkynylphosphonium proligand was made, and after stirring for 30 min, [Pt(CNC)dmso] was added. Compared to the literature method,[14] higher yields were generally observed. Besides, our method involved less amount of alkynylphosphonium ligand (1:8 molar ratio of Pt(II) precursor to the alkyne in the literature versus 1:2 molar ratio in our method). This general procedure worked well for complexes Pt1 and Pt2, whereas for Pt3 it was not the case, with reaction yield of less than 10%. We believe that it could be caused by some side reactions of P3 ligand upon lithiation. Compounds Pt1 and Pt2 are sparingly soluble in acetone and acetonitrile and well-soluble in DMSO. Complex Pt3 was insoluble, and therefore was characterized only by FTIR (KBr pellets) and ESI+ mass-spectrometry.
The Au(III) complexes Au1−Au3 (Scheme S1) were obtained by reaction of [Au(CNC)Cl] with corresponding alkynylphopshonium salt under oxygen-free conditions in DCM in the presence of triethylamine and catalytic amount of CuI (Scheme 2). Due to the presence of chloride ion in the starting compound, the reaction mixture contained complexes with two different counterions (Cl− and OTf−), and were separated by column chromatography. Chloride-containing derivatives demonstrated lower yields, lower solubility and similar photophysical properties compared to the triflate ones, and thus they will not be considered in this work. All obtained Au(III) complexes are highly soluble in DMSO and DCM. However, Au2 precipitates out of the DCM/acetone mixture, after which its solubility is significantly reduced.
The identity of all studied complexes was fully established by 1H, 31P{1H}, 19F{1H} and 1H1H COSY NMR experiments together with ESI+ mass-spectrometry and FTIR spectroscopy. In the 1H NMR spectra, which were interpreted using 1H1H COSY experiment, all the integral intensities and multiplicities correspond to the proposed ones (Figures S1−S5). 31P{1H} NMR spectra of both series demonstrate one signal at ca. 21 ppm, which is characteristic for the phosphonium group (Figures S1−S5).[13,15,16,17] 19F{1H} NMR spectra of complexes Au1–Au3 exhibit only one singlet signal at 77.8 ppm which is attributed to triflate anion (Figures S3−S5).
The ESI+ mass-spectra of Pt1 and Pt2 are dominated by two signals, corresponding to the [M + H]+ and [M + MeOH + H]+ fragments, as the studied compounds are neutral. In the Pt3 ESI+ mass-spectrum, the [M + H]+ fragment could also be found, but due to the extremely low solubility, the intensity of the signal is very low (Figure S6). The ESI+ mass-spectra of cationic Au1−Au3 show high intensity signal corresponding to [M]+ ion (Figure S7). FTIR spectra of all complexes show the C≡C vibrations in the expected area (2000−2150 cm−1, Figure S8).
Complex Pt1 was crystallized from the diluted acetone solution. The key crystallographic details and some selected bond angles and distances are summarized in the Tables S1 and S2. Single-crystal XRD studies revealed the expected distorted square-planar configuration of the metal center (Figure 1). Among the four Pt(II) bonds, the Pt–Caryl distances are nearly the same, whereas Pt–N and Pt–Calkynyl are much shorter. The bond angle between Caryl–Pt–Caryl differs from ideal 180° by 20°, which is caused by the rigidity of the CNC ligand. The {Pt−C≡C−R} fragment of the structure is slightly bent, and as we suppose, it can be induced by the bulky phosphonium fragment. Overall, the observed crystallographic parameters are in line with the reported experimental data of isostructural compounds.[14]
The packing of Pt1 demonstrates paired molecules in head-to-tail fashion, which is easily explained by zwitterionic nature of the compound (Figure 1). These supramolecular dimers form two layers, arranged in a “herringbone” manner. Also, the Pt∙∙∙H intermolecular interaction has been found in dimer of Pt1 between Pt atom and hydrogen of CH3 group with distance of 2.565 Å and angle Pt−H−C of 159°. This type of interaction can be considered as a rare case of hydrogen bond with Pt(II) atom as acceptor or attractive anagostic interaction.[18] Such intermolecular interactions Pt∙∙∙H−E has been previously described for Pt(II) complexes with E = O, N.[19,20,21] In our case, the high Lewis basicity of the platinum atom is the result of CNC ligand coordination, and mobility of the CH3 group proton is provided by the acceptor nature of the phosphonium group.
The Hirshfeld surface of Pt1 was mapped over dnorm (range −0.1 Å to 1.5 Å). Red spots on surface denote the dominant interactions (Figure S9). In our case, we aimed to prove the existence of the intermolecular interaction Pt−H, as well as to determine the contribution of this interaction to the total Hirshfeld surface area, so only this interaction is shown (Figure S9). The Hirshfeld surface analysis indeed shows a Pt−H contact where the hydrogen of the CH3 group of phosphonium fragment interacts with the metal center, and the contribution of this interaction is 2.5%. In addition, the shape index (Figure S9) shows a π-π interaction between the phenyl ring at the phosphorus atom and the CNC ligand, which may further stabilize the Pt−H bond.
2.2. Optical and Photophysical Properties
The UV-Vis spectra of the complexes Pt1 and Pt2 were measured in DMSO solution due to low solubility. Absorption wavelengths are summarized in the Table 1, and the corresponding spectra are depicted in the Figure 2.
Similar to the literature data, the studied Pt(II) complexes exhibit strong absorption bands in high-energetic (<300 nm) and low-energetic (350–450 nm) parts of the spectrum.[14,23,24,25,26,27,28] With the reference of abovementioned studies, the former ones were assigned to the 1LC transitions, localized both at CNC and alkynylphosphonium ligands. Weaker red-shifted bands arise from the complex IL/LL’/MLCT transitions, namely mixed 1MLCT (dπ(Pt)→CNC) and 1LL’CT (CNC→alkynyl). We presume that the bands at 378 nm and 381 nm for Pt1 and Pt2 respectively have more 1MLCT character, as they are nearly independent from the alkynylphosphonium substituent. On the contrary, the absorption bands at ca. 410 nm (Pt1) and 423 nm (Pt2) can correspond to the different alkynylphosphonium ligand moiety. Thus, the extended π-conjugated linker in the ligand P2 brings additional π-donating ability, which is not only bathochromically shifting the corresponding absorption band, but also enhancing the extinction coefficient, as the 1LLCT becomes more efficient.
There is also an additional band in the 500–550 nm region of the UV-vis spectrum of both Pt1 and Pt2 (Figure S10). It could not be attributed to the d–d transitions because of the CNC ligands’ strong σ-donating nature. In addition, these transitions are unlikely observed at such low energies. Similar low intensity red-shifted absorption bands are examined in the works by Che and Yam, and with this in mind, we ascribe this band to a spin-forbidden 3LC transition.[23,24] It becomes possible due to the large spin-orbit coupling, caused by the presence of Pt atom as the metal center.
The UV-Vis spectra of Au1–Au3 in DCM demonstrate three absorption bands (Table 1, Figure 2). The high-energetic bands ca. 250 nm, apparently, can be assigned to the 1LC transitions in alkynylphosphonium ligands. Then, the bands in the range 310−380 nm demonstrate bathochromic shift associated with an increase in conjugation or condensation of linkers. This suggests localization of transition on alkynylphosphonium ligands. In the case of Au1 and Au2 the structureless shape of bands allows us to attribute the transitions to ILCT (alkynyl/linker→PR4+) state. At the same time, for Au3 structured band with vibrational progression from 1260 to 1440 cm−1 testifies to 1LC transition localized on naphthyl moiety which was reported previously for complexes bearing the same alkynylphosphonium ligand.[13,15,16,17] Finally, the bands in the range of 375–425 nm are characteristic for [Au(CNC)C2R] and can be attributed to 1LC at CNC ligand mixed with 1ILCT (phenyl→pyridine ring).[6,29,30,31,32] Interesting that the same bands for Pt1 and Pt2 are more red-shifted, that can be explained by a stronger spin-orbit coupling of the Pt atom relative to the Au one, or by stronger electron-donating ability of Pt(II) compared to the Au(III).
Upon excitation at 365 nm, deaerated DMSO solution of complex Pt1 surprisingly demonstrates green emission (Table 1, Figure 2). This is in sharp contrast with the reported isostructural analogue without phosphonium fragment, [14] and that means that introduction of an electron-withdrawing group “turns on” the luminescence in this case. Based on the excited-state lifetime values and the rise of emission intensity upon deaeration, we state its phosphorescent nature. We assume that this emission is of mixed 3MLCT + 3LC nature, because upon freezing the solution, this band demonstrates hypsochromic shift and becomes vibronically structured (Figure 2). Besides, we see an additional band in the red part of the spectrum ca. 700 nm, apparently, arising because of Pt1 aggregated forms. According to the literature,[33] the absence of emission in [Pt(CNC)(alkynyl)] complexes has fundamental nature: upon excitation, structural distortion takes place, paving the way for non-radiative relaxation. The emergence of luminescence in Pt1 can be presumably caused by the introduction of accepting phosphonium moiety on the periphery of the ligand environment. Thus, this fragment can withdraw the excess of electron density from the {Pt(CNC)} fragment and by this means hinder the structural distortion upon the MLCT excitation. Solution of complex Pt2 decomposes under the UV irradiation.
In contrast to the Pt(II) complexes, the studied Au(III) complexes demonstrate extremely low intensity emission even in deaerated DCM or DMSO solution upon excitation at 365 nm. It also may be related with the presence of strong electron-acceptor group on the periphery of alkynyl ligands. The cationic phosphonium fragment decreases σ-donor properties of alkynyl moiety and makes non-emissive d−d states of Au(III) accessible. [34]
Complexes Pt1 and Pt2 are also luminescent in the solid state, both at room temperature and at 77K (Table 1, Figure 2). Their emission spectra at 298K show broad structureless bands at ca. 700 nm. It is interesting to note that the spectra of studied compounds are almost identical both at room and low temperature, thus implying similar emission state. Upon cooling, the emission demonstrates small bathochromic shift and intensifies, which is characteristic for triplet character of luminescence. We assume that this emission could be attributed to either 3MC or “π-dimeric” luminescence, similar to [Pt(CNN)P1]Cl and [Pt(NNN)P2]Cl, discussed in our previous work.[13] In favor of the first version are the small lifetime values and the band narrowing upon cooling. It means that, in contrast with the emission in solution, alkynylphosphonium ligand does not participate in the solid-state luminescence of Pt1 and Pt2 directly.
Similar to Pt1 and Pt2 complexes, Au1–Au3 also demonstrate luminescence in the solid state. However, as in the solution, this emission has extremely low intensity at room temperature. The complexes Au1 and Au2 demonstrate emission band with maxima at ca. 560 nm at room temperature. Cooling of the complexes to 77K increases the luminescence efficiency, which, together with long life-time of excited state, indicates the triplet nature of emission. Upon cooling, a hypsochromic shift of emission is shown for the both complexes. The Au1 demonstrates an emission band with a weakly pronounced structure. Grinding of the fine crystalline powder as well as cooling does not essentially change the shape of the band. This suggests that the emission is characterized by a metal-perturbed 3LC at CNC ligand with admixture of 3MLCT (metal→CNC or metal→alkynyl) or 3ILCT at alkynylphosphonium ligand.
In the case of Au2, structureless band have been observed upon photoexcitation. However, after grinding, the shape of the band changes (Figure S11). Cooling to 77K leads to an even more pronounced vibronic progression of this band (ca. 1250 cm−1). This can be explained as a coexistence of low-lying emissive states 3MLCT and 3LC, with the larger contribution of the former in case of room-temperature Au2 emission. Since we consider the solid phase, it is possible that 3LC radiative relaxation is blocked due to aggregation-induced quenching. Grinding the sample partially disrupts aggregation, resulting in two pathways of luminescence. Finally, upon cooling, we observe “temperature switching” of emissive states, as described in the literature.[16,35] The emission spectrum for Au3 contains one band with a vibronic progression of 1450 cm−1. There is no shift of the band upon cooling. This, as well as the long lifetime of the excited state, allows to attribute the emission for Au3 to metal-perturbed 3LC localized at the naphthyl moiety.
2.3. DFT Calculations
The crystal structure of Pt1 revealed a unique Pt–H interaction. To further investigate the nature of this interaction, we performed computational modeling. Analysis of the equilibrium geometry of the Pt1 monomer reveals an anisotropic distribution of the molecular electrostatic potential (MESP) around the platinum atom (Figure 3a). The MESP is lower (approximately –34 kcal/mol) on one side of the platinum atom and higher (around –45 kcal/mol) on the opposite side, indicating a polarization of electron density. The van der Waals potential map shows regions near the platinum atom that are favorable for dispersion interactions (Figure 3b). These observations suggest that the platinum atom in Pt1 is capable of participating in non-covalent interactions with electron density acceptors through both electrostatic and dispersion forces.
To assess the stability of potential CH···Pt interactions, we optimized the geometries of Pt1 supramolecular dimers with short CH···Pt contacts, where CH groups of the methyl group or the phenyl ring act as proton donors (Figure 4). During geometry optimization, both CH···Pt contacts shorten, and the structural framework of each monomer undergoes notable changes. For the dimer involving the CH proton of the methyl group, optimization leads to the formation of a second, equivalent CH···Pt bond with the methyl proton of the phosphonium group of the initially accepting molecule. Analysis of the electron density parameters in the optimized dimer structure (Figure 4a) suggests that this CH···Pt interaction has a moderate strength, estimated to be approximately 10 kcal/mol. This suggests that this type of CH···Pt interaction is energetically favorable and not solely a consequence of crystal packing It is important to note that this value represents an upper estimate of the actual interaction strength in the crystal. Furthermore, NBO analysis reveals a noticeable charge transfer from the hydrogen atom to the platinum atom, further supporting the stabilizing nature of this interaction.
For the second dimer, optimization also results in a shorter interatomic distance between the hydrogen and platinum atoms. However, the CH···Pt angle is significantly distorted in the optimized structure (139 degrees). This indicates that this type of CH···Pt interaction is less likely to be a dominant structure-forming factor, suggesting the presence of other, more energetically favorable interactions in the crystal. For instance, the distortion observed in the optimized dimer structure in Figure 4b correlates with the formation of Pt···π interactions.
In summary, computational modeling focused on Pt1 revealed the significance of non-covalent interactions, particularly CH···Pt, in influencing the supramolecular assembly. While Pt···π interactions may also play a role, the CH···Pt interactions are demonstrated to be energetically favorable, potentially contributing to the solid-state packing observed in the crystal structure. The observed anisotropic distribution of the molecular electrostatic potential around the Pt atom suggests its ability to engage in both electrostatic and dispersion interactions with neighboring molecules. Despite the relatively short H···Pt distances, the positive Laplacian of the electron density at the bond critical point suggests that these interactions are best described as hydrogen bonds, rather than agostic interactions. Agostic interactions, commonly observed in transition metal complexes, involve the coordination of a C-H σ-bond to a metal center, typically characterized by a negative Laplacian of the electron density, indicating a concentration of electron density between the metal and hydrogen atoms [36,37,38]. These findings emphasize the importance of considering non-covalent interactions in understanding the photophysical properties and solid-state behavior of this class of alkynylphosphonium Pt(II) complexes.
In order to understand the origins of the observed photophysical behaviour of the studied compounds, quantum chemical calculations were carried out. The structures of Pt1−Pt3 and Au1–Au3 complexes were optimized by DFT calculations (Figures S12 and S13). The coordination environment of the platinum and gold atoms in complexes was found to be planar, the N1−M−C18≡C19 fragments are linear (M = Au, Pt; atoms identifiers are similar to that used in Figure 1a). The main bond angles and distances are equal in complexes with the same coordination center and slightly differ for various metals, namely, for bond lengths: M−N1 = 2.026/2.039 Å, M−C18 = 1.970/1.957 Å, M−C1(C17) = 2.085/2.081 Å, C18−C19 = 1.209/1.222 Å, angles: N1−M−C1(C17) = 80.65°/79.98°, C1(C17)−M−C18 = 99.40°/99.77°, C1−M−C17 = 161.30°/159.93°. For Pt1 complex these values can be compared with the experimental ones. It can be seen from Table S2 and the values provided above, that the difference between experimentally measured and calculated bond lengths and angles is less than 0.03Å and 1°, respectively, which suggests a good agreement of the structures obtained.
For Au1−Au3 complexes the main absorption bands wavelengths, which are related to the active singlet transitions, with oscillator strengths f were obtained by TDDFT calculations, the values are 278 nm (f = 1.37), 294 nm (f = 1.77) and 323 nm (f = 0.80), respectively. While calculated wavelengths are blue-shifted by ca. 30 nm, as compared to the experimental UV-vis spectra, the effect of the linker on photophysical properties is exactly the same as in the experimental study: from Au1 to Au3 a bathochromic shift is observed; the oscillator strength (intensity) is the highest for Au2 and the lowest for Au3.
NTO analysis of TDDFT results shows that the nature of the active singlet excited state S3* of Au1 includes almost the entire complex: transition occurs from the gold atom + alkynyl ligand to the alkynyl ligand with a moderate contribution of the phosphonium fragment; the electron density is also redistributed within the pyridyl moiety, including the gold atom (Figure 5). To summarize the above, the transition in question can be characterized as a complex ILCT(alkynyl linker)/LC(CNC ligand)/LL’/MLCT one. For Au2 and Au3 the active singlet excited states (S3* and S2*, respectively) can be interpreted as ILCT/LL’/MLCT, while the transition occurs mainly within the central part of the complexes and the contribution of CNC ligand is minimal (Figure S14, S15).
The lowest singlet states for Au1−Au3 complexes with a calculated wavelength of 336 nm are of the same nature and can be described as IL transitions within the pyridyl moiety with an admixture of the metal (Figures S16−S18).
The lowest triplet state T1 (Figure 6) for Au1 complex with a calculated wavelength of 442 nm primarily involves the pyridyl ring of CNC ligand and can be characterized as intraligand with a contribution of MLCT from the gold atom. A different nature is observed for the lowest triplet transitions in Au2 and Au3 complexes (443 nm and 539 nm, respectively). The transitions resemble the active singlets and occur mainly inside the alkinyl linker with a moderate participation of gold atom (Figure 6 and Figure S19). Even though the lowest triplet transitions for Au1 and Au2/Au3 are of different nature, all of them can be characterized as LC with MLCT admixture.
The results obtained can be compared with the results of the recent study of very similar gold complexes with the phosphine oxide group instead of phosphonium fragment.[39] The values of wavelengths of active singlets, lowest singlets and triplets appear to be very close for the related gold complexes with the same linker, but the nature of the same transitions may be different in some cases. The most pronounced difference is observed for the nature of Au1 active singlet and Au2 lowest triplet transitions. In the present study, lowest active singlet S3* transition for Au1 complex engages almost the whole molecule, while in the case of [Au(CNC)C2−L−P(O)Ph2] only the CNC ligand and the metal atom take part in the transition. For the triplet T1 transition in Au2 it was found that the redistribution of electron density occurs mainly within the alkynyl linker, while in the related complex [Au(CNC)C2−L−P(O)Ph2] this transition affects only the pyridine fragment.
For Pt1 and Pt2 complexes, TDDFT calculations for the optimized ground states yield controversial results. For this reason, computational data for these two complexes were obtained via the optimization of the lowest triplet structure. Pt3 was not considered due to the unavailability of the corresponding experimental data.
The main absorption bands wavelengths for Pt1 and Pt2 complexes obtained by TDDFT are red-shifted compared to the Au1 and Au2 complexes. For both Pt1 and Pt2 complexes low-energy active singlet transitions are observed: at 473 nm for Pt2 with a high intensity (f = 2.0668) and at 449 nm for Pt1 with a low intensity (f = 0.1123). These singlet transitions are the lowest ones. The S2 transition (409 nm) for Pt1 is also active and has even higher intensity (f = 1.3656) than S1*. For Pt2 the second active singlet is S3 at 382 nm (f = 0.1551). These observations are in line with the experimental UV-vis spectra (Figure 2a).
The nature of excited states was analyzed, and the results show that for Pt1 complex the active singlet transitions S1* and S2* resemble the S3* transition for Au1 complex, i.e., involve almost all parts of the molecule (Figure S20): the electron density is redistributed between the alkinyl ligand, metal atom and pyridine fragment. The active singlet transition S1* for Pt2 occurs from the {linker + M + CNC(partly)} to the alkinyl fragment (Figure S21), which is also the case for the active singlet transition for Au2 complex. For the S3* transition (the second active singlet) it can be seen that electron density is transferred from {C≡C + M + CNC} fragment almost entirely to the pyridine moiety.
Since the optimization of the lowest triplet transitions for Pt1 and Pt2 was provided, the structures obtained can be compared with the optimized structures of the ground states. For Pt1 the most pronounced difference is in the dihedral angle between the plane of the pyridine fragment and the phenyl ring of the alkynyl linker (Figure S22). For the ground state this dihedral is 92.6°, for the triplet T1 state the value is 161.0°, i.e. the orientation of the planes changes from almost perpendicular to the near-parallel. For Pt2 the reorientation of phenyl rings is observed in T1 triplet state (Figure S23). The value of the dihedral angle between the rings changes from 143° to 180°.
The lowest triplet state wavelength of Pt1, obtained by DTDFT calculations is 661 nm. This transition occurs within the alkynyl ligand with the moderate participation of the platinum atom, suggesting a mixed LC/MLCT assignment (Figure 7), which is completely different from the transition in Au1 complex with the same ligand. The possible cause of this difference could be the different orientation of the phenyl ring in the alkynyl linker. Pt2 complex has a triplet state with a very low energy (840 nm), which cannot be realized in the solution due to complex destruction. The nature of the transition is similar to that observed for Pt1 and Au2 complexes (Figure 7).
Comparing the series of Au and Pt complexes in general, it could be mentioned that for Pt1 complex the lowest active singlet S1* is the fifth lowest state in the calculated spectrum, for Pt2 S1* – the second lowest, while for Au1, Au2 and Au3 complexes the lowest active singlets are the 19th, 15th, and 10th states in spectra, respectively. As a result, Au(III) complexes have significantly more opportunities for non-radiative transitions and thus demonstrate extremely low intensity emission in the experimental measurements.
3. Materials and Methods
Precursory phosphonium salts [Pi]OTf,[15] [Pt(CNC)dmso][40] and [Au(CNC)Cl][41], were synthesized according to the literature methods. All other reagents were purchased from Merck, Alfa Aesar, ABCR and used without further purification. Solvents were purchased from Vecton and purified according to the published methods.[42] All Pt(II) and Au(III) complexes discussed were obtained under an inert atmosphere using Schlenk equipment. The characterization included NMR spectroscopy, mass spectrometry, FTIR spectroscopy and elemental analysis. 1H, 31P{1H}, 19F, and 1H1H COSY spectra were recorded on a Bruker AVANCE NEO (500 MHz) NMR and Bruker Avance III (400 MHz) spectrometer. Mass spectra were recorded on a MaXis Bruker Daltonik GmbH (Germany) instrument in the ESI+ mode.
Synthesis of Pt(II) complexes. The synthesis of complexes Pt1–Pt3 was carried out according to the modified literature method.[14] At the first step, 0.28 mmol (2 eq) of corresponding alkynylphosphonium salt [Pi]OTf was dissolved in 10 ml of freshly distilled THF, degassed and cooled to –50°C. Then, 10% excess of 2.5M nBuLi hexanes solution was added (ca. 0.1 ml). The resulting yellow solution was stirred for half an hour. After that, 0.14 mmol (1 eq) of [Pt(CNC)dmso] was added under argon and the reaction mixture was left to stir overnight, slowly coming to the room temperature. The resulting suspension was centrifuged. The orange precipitate was washed with DCM (4 times), methanol (1 time), diethyl ether (1 time) and dried in vacuo.
[Pt(CNC)(P1)], Pt1. Orange powder, yield 56%. 1H NMR (400 MHz, DMSO-d6) δ 7.87 (m, 2H, P1), 7.77 (m, 8H, P1), 7.76 (m, 2H, CNC), 7.66 (t, J = 7.9 Hz, 1H, CNC), 7.50 (m, 6H, P1), 7.49 (m, 2H, CNC), 7.03 (m, 2H, CNC), 6.92 (m, 2H, CNC), 3.06 (d, J = 14.3 Hz, 3H, P1). 31P{1H} NMR (162 MHz, DMSO-d6) δ 21.74 (s, 1P, P1). ESI HRMS (m/z): calcd for [M+H]+: 725.1687; found: 725.1689. FTIR (KBr): 2067.8 cm−1 (C≡C vibration). Single crystals of Pt1 were obtained by the slow evaporation of diluted acetone solution.
[Pt(CNC)(P2)], Pt2. Orange powder, yield 66%. 1H NMR (400 MHz, DMSO-d6) δ 8.07 (dd, J = 8.5, 2.8 Hz, 2H, P2), 7.90 (m, 2H, P2), 7.84 (m, 2H, CNC), 7.77 (m, 10H, P2), 7.70 (d, J = 8.5 Hz, 2H, P2), 7.65 (t, J = 7.9 Hz, 1H, CNC), 7.48 (d, J = 7.9 Hz, 2H, CNC), 7.38 (d, J = 24.3, 8.4 Hz, 4H, P2), 7.06 (m, 2H, CNC), 6.93 (m, 2H, CNC), 3.13 (s, 3H, P2). 31P{1H} NMR (162 MHz, DMSO-d6) δ 22.21 (s, 1P, P2). ESI HRMS (m/z): calcd for [M+H]+: 801.2004; found: 801.2001. FTIR (KBr): 2072.6 cm−1 (C≡C vibration).
[Pt(CNC)(P3)], Pt3. Dark-brown powder, yield 8%. ESI HRMS (m/z): calcd for [M+H]+: 775.1845; found: 775.1840. FTIR (KBr): 2053.3 cm−1 (C≡C vibration).
Synthesis of Au(III) complexes. The synthesis of complexes Au1–Au3 were carried out according to the modified literature method.[29] A mixture of [Au(CNC)Cl] (45 mg) and [Pi]OTf (1 eq) in the presence of copper(I) iodide (6 mg) in triethylamine (3 ml) and dichloromethane (30 ml) was stirred at room temperature for 4 h in the absence of light. After evaporation to dryness, the solid residue was purified by column chromatography on silica using dichloromethane/acetone (5/1→5/3 v/v) as eluent.
[Au(CNC)(P1)]OTf, Au1. Beige powder, yield 94%. 1H NMR (400 MHz, DMSO-d6) 1H NMR (400 MHz, DMSO-d6) δ 8.18 (t, J = 7.95 Hz, 1H, CNC), 7.98 (d, J = 8.0 Hz, 2H, CNC), 7.95 – 7.67 (m, 18H, CNC/P1), 7.40 (td, J = 7.3, 1.4 Hz, 2H, CNC), 7.34 (td, J = 7.5, 1.4 Hz, 2H, CNC), 3.15 (d, J = 14.5 Hz, 3H, P1). 31P{1H} NMR (162 MHz, DMSO-d6) δ 22.57 (s, 1P, P1). 19F NMR (376 MHz, DMSO-d6) δ −77.73 (s, 3F, OTf). ESI HRMS (m/z): calcd for [M]+: 726.1619; found: 726.1624. FTIR (KBr): 2151.7 cm−1 (C≡C vibration).
[Au(CNC)(P2)]OTf, Au2. Yellow powder, yield 65%. 1H NMR (400 MHz, DMSO-d6) 1H NMR (400 MHz, DMSO-d6) δ 8.19 (t, J = 8.0 Hz, 1H, CNC), 8.15 – 8.07 (m, 2H, P2), 7.99 (d, J = 8.0 Hz, 2H, CNC), 7.92 (m, 6H, CNC/P2), 7.88 – 7.74 (m, 12H, P2), 7.73 – 7.65 (m, 2H, P2), 7.44 (td, J = 7.3, 1.3 Hz, 2H, CNC), 7.35 (td, J = 7.6, 1.4 Hz, 2H, CNC), 3.17 (d, J = 14.6 Hz, 3H, P2). 31P{1H} NMR (162 MHz, DMSO-d6) δ 22.43 (s, 1P, P2). 19F NMR (376 MHz, DMSO-d6) δ −77.73 (s, 3F, OTf). ESI HRMS (m/z): calcd for [M]+: 802.1938; found: 802.1925. FTIR (KBr): 2145.9 cm−1 (C≡C vibration).
[Au(CNC)(P3)]OTf, Au3. Beige powder, yield 80%. 1H NMR (400 MHz, DMSO-d6) 1H NMR (400 MHz, DMSO-d6) δ 8.77 (d, J = 8.5 Hz, 1H, P3), 8.20 (t, J = 8.0 Hz, 1H, CNC), 8.08 – 7.97 (m, 3H, CNC/P3), 7.97 – 7.82 (m, 11H, CNC/P3), 7.82 – 7.74 (m, 5H, P3), 7.68 – 7.52 (m, 2H, P3), 7.41 (td, J = 7.3, 1.4 Hz, 2H, CNC), 7.35 (td, J = 7.5, 1.5 Hz, 2H, CNC), 3.28 (d, J = 14.0 Hz, 3H, P3). 31P{1H} NMR (162 MHz, DMSO-d6) δ 22.13 (s, 1P, P3). 19F NMR (376 MHz, DMSO-d6) δ −77.73 (s, 3F, OTf). ESI HRMS (m/z): calcd for [M]+: 776.1767; found: 776.1781. FTIR (KBr): 2144.0 cm−1 (C≡C vibration).
X-Ray structure determination. The crystal structure of Pt1 was determined by the means of single crystal XRD analysis using Rigaku Oxford Diffraction diffractometer for the data collection at a temperature of 100K. Diffraction data were processed in CrysAlisPro program.[43] The unit-cell and refinement parameters are listed in the Table S1. The structure was solved by dual-space algorithm and refined using the SHELX programs [44,45] incorporated in the OLEX2 program package.[46,47] The crystal of Pt1 was found to be non-merohedrally twinned and was refined using the HKLF5 routine, with the twin law (1.000 0 0.976, 0 −1 0, 0 0 −1) and BASF parameter of 0.199(2). Supplementary crystallographic data for this paper have been deposited at Cambridge Crystallographic Data Centre and can be obtained free of charge via www.ccdc.cam.ac.uk/structures/.
Pt1: I2/c (15), a = 24.9558(8), b = 12.2843(3), c = 21.9034(7) Å; α = 90, β = 115.373(4), γ = 90 °; V = 6067.1(4) Å3; Z = 4; R1 = 0.0482; CCDC 2383597.
Hirshfeld surface analysis. The intermolecular interactions in the crystal were quantified using Hirshfeld surfaces and the associated 2D fingerprint plot which were explored by means of Crystal Explorer based on a structure input file from CIF (Crystallographic Information File).[48]
Photophysical study. The UV-vis absorption spectra were registered on a Shimadzu UV-1800 spectrophotometer in a 1 cm quartz cuvette (DMSO, DCM, 10‒5 M). The emission spectra for solid samples were recorded using Avantes AvaSpec-2048×64 spectrometer (Avantes, Apeldoorn, Netherlands). The pulse laser DTL-399QT ‘Laser-export Co. Ltd’ (wavelength 351 nm, pulse energy 50 μJ, pulse width 6 ns, repetition rate 0.01−1 kHz), an Ocean Optics monochromator Monoscan-2000 (interval of wavelengths 1 nm; Ocean Optics, Largo, FL, USA), photon counting head H10682 (Hamamatsu), and multiple-event time digitizer P7887 (FAST ComTec GmbH) were used for solid-state lifetime measurements. The Avantes integration sphere (Avantes, Apeldoorn, Netherlands) was used to measure the solid-state emission quantum yield.
Computational details
Pt–H bond modelling. Calculations were performed using the Gaussian16.A03 software package.[49] Geometry optimizations and harmonic vibrational frequency calculations were carried out at the B3LYP-G3BJ/jorge-TZP level of theory.[50,51] All structures were verified to ensure the absence of imaginary harmonic vibrational frequencies. The MultiWFN program was employed for electron density topology analysis and for calculating the surfaces of electron density, molecular electrostatic potential, and van der Waals potential.[52,53,54] Natural Bond Orbital (NBO) analysis was conducted using the NBO 7.0 program.[55] Visualization was performed using GaussView 6.0.[56]
Photophysical properties. Theoretical investigation of photophysical properties of complexes was provided by density functional theory (DFT) calculations. All complexes were considered using CAM-B3LYP range-separated hybrid functional.[57] The Au and Pt atoms were represented by SDD basis set with MWB60 effective core potential;[58] other atoms were described by the def2-TZVP basis set.[59] Calculations for complexes were performed in the presence of the implicit solvents (DCM for Au complexes and DMSO for Pt complexes), which were described by C-PCM model.[60,61] Time-dependent DFT (TDDFT) calculations were carried out to investigate the excited states of complexes: for Au complexes the optimized ground-state molecular geometries were used, while for Pt complexes optimization of the excited states was required. All DFT calculations were carried out using the Gaussian 16 package. [49] The nature of the excited states was demonstrated via natural transition orbitals (NTO),[62] which were obtained by Multiwfn 3.7 software.[52]
4. Conclusions
In this work, two series of isostructural Au(III) and Pt(II) alkynylphosphonium complexes with ancillary CNC ligand were synthesized and fully characterized. Complex Pt1 possesses a Pt–H interaction in its crystal structure, confirmed by quantum-chemical calculations. This compound is also the first example of room-temperature solution luminescence in [Pt(CNC)(alkynyl)] complexes. Au(III) complexes do not emit in the solution.
In the solid state, both series of complexes demonstrate weak emission. In case of Pt1 and Pt2, the spectra look almost identical and are independent of the alkynyl ligand. Moreover, the lifetime values are very small, and the bands narrow upon cooling. These facts indicate the 3MC emission nature. Turning to the Au(III) series, these complexes demonstrate emission with significant participation of the ligand. For the complexes with π-conjugated linkers, Au1 and Au2, ILCT and LC, located at CNC ligand, excited states are very close in energy, and can be switched upon cooling. For the complex with naphthyl linker Au3, the fused moiety plays determinative role: only LC luminescence is observed.
To sum it up, Au(III) and Pt(II) bis-cyclometallated alkynylphosphonium complexes demonstrate different photophysical properties despite isoelectronic metal centers. Apparently, the oxidation state of the metal center plays a considerable role. In the case of electron-deficient Au(III), the introduction of the acceptor to the periphery of ligand environment additionally increases the metal center electrophilicity and lowers the d−d states. All these factors worsen the emission properties of Au1–Au3 complexes. On the contrary, withdrawing of excess electron density from {Pt(CNC)} core with the help of accepting phosphonium fragment allows to stabilize the structures of Pt1 and Pt2 upon photoexcitation, and thus enhance the photophysical properties.
Supplementary Materials
The following supporting information can be downloaded at: Preprints.org, Scheme S1: The complexes Pt1–Pt3 and Au1–Au3; XRD structure determination; Table S1: Crystallographic data for the compound Pt1; Table S2: Selected bond angles and distances for the compound Pt1; Figure S1: (A) 1H (top) and 31P{H} (bottom) spectra in aromatic range of Pt1; (B) 1H1H COSY spectra in aromatic range of Pt1; Figure S2: (A) 1H (top) and 31P{H} (bottom) spectra in aromatic range of Pt2; (B) 1H1H COSY spectra in aromatic range of Pt2; Figure S3: (A) 1H (top), 31P{H} (middle) and 19F (bottom) spectra in aromatic range of Au1; (B) 1H1H COSY spectra in aromatic range of Au1; Figure S4: (A) 1H (top), 31P{H} (middle) and 19F (bottom) spectra in aromatic range of Au2; (B) 1H1H COSY spectra in aromatic range of Au2; Figure S5: (A) 1H (top), 31P{H} (middle) and 19F (bottom) spectra in aromatic range of Au3; (B) 1H1H COSY spectra in aromatic range of Au3; Figure S6: Experimental (left) ESI+ MS spectra of Pt1–Pt3 and simulated (right) isotopic patterns of the [M+H]+; Figure S7: Experimental (left) ESI+ MS spectra of Au1–Au3 and simulated (right) isotopic patterns of the [M]+; Figure S8: FTIR spectra of Pt1–Pt3 and Au1–Au3 in the region of C≡C vibration, KBr; Figure S9: (a) Hirshfeld surface 2D fingerprint plot (all interactions), (b) Hirshfeld surface 2D fingerprint plot (Pt–H interaction), (c) dnorm Hirshfeld surface (Pt–H contacts only), and (d) shape index, Pt1; Figure S10: (a) The low-energy part of the UV-vis spectra of Pt1 and Pt2, DMSO, r.t.; Figure S11: Normalized solid-state emission spectra of Au2 under different conditions; Figure S12: The structures of Pt1−Pt3 complexes optimized by DFT calculations; Figure S13: The structures of Au1–Au3 complexes optimized by DFT calculations; Figure S14: Natural transition orbitals for the active singlet S3* of the complex Au2 (294 nm, f = 1.77); Figure S15: Natural transition orbitals for the active singlet S2* of the complex Au3 (323 nm, f = 0.80); Figure S16: Natural transition orbitals for the lowest singlet S1 of the complex Au1; Figure S17: Natural transition orbitals for the lowest singlet S1 of the complex Au2; Figure S18: Natural transition orbitals for the lowest singlet S1 of the complex Au3; Figure S19: Natural transition orbitals for the lowest triplet T1 of the complex Au3 (539 nm); Figure S20: Natural transition orbitals for the active singlets S1* (449 nm, f = 0.1123) and S2* (409 nm, f = 1.3656) of the complex Pt1; Figure S21: Natural transition orbitals for the active singlets S1* (473 nm, f = 2.0668) and S3* (382 nm, f = 0.1551) of the complex Pt2; Figure S22: Optimized structures of the ground (left) and the lowest triplet (right) states for Pt1; Figure S23: Optimized structures of the ground (left) and the lowest triplet (right) states for Pt2.
Author Contributions
Conceptualization, A.P. and E.G.; Funding acquisition, E.G.; Investigation, M.L., A.P., A.S., E.T.; Project administration, E.G.; Resources, E.G.; Supervision, E.G.; Validation, M.L., A.P.; Visualization, M.L., A.P., A.S., E.T. and E.G.; Writing – original draft, M.L., A.P., A.S., E.T.; Writing – review & editing, E.G.
Funding
This research was funded by the Russian Science Foundation grant 24-13-00024, https://rscf.ru/en/project/24-13-00024/
Institutional Review Board Statement
Not applicable.
Informed Consent Statement
Not applicable.
Data Availability Statement
All data reported herein are accompanying the present article.
Acknowledgments
The work was carried out using equipment of St Petersburg University Research Park (Centres of Magnetic Resonance, Optical and Laser Materials Research, Chemical Analysis and Materials Research; X-ray Diffraction, Computational and Cryogenic).
Conflicts of Interest
The authors declare no conflict of interest.
References
- Wang, X.; Wang, S. Phosphorescent Pt(II) Emitters for OLEDs: From Triarylboron-Functionalized Bidentate Complexes to Compounds with Macrocyclic Chelating Ligands. Chem. Rec. 2019, 19, 1693–1709. [Google Scholar] [CrossRef]
- Sakai, K.; Ozawa, H. Homogeneous Catalysis of Platinum(II) Complexes in Photochemical Hydrogen Production from Water. Coord. Chem. Rev. 2007, 251, 2753–2766. [Google Scholar] [CrossRef]
- Guerchais, V.; Fillaut, J.-L. Sensory Luminescent Iridium(III) and Platinum(II) Complexes for Cation Recognition. Coord. Chem. Rev. 2011, 255, 2448–2457. [Google Scholar] [CrossRef]
- Mauro, M.; Aliprandi, A.; Septiadi, D.; Kehr, N.S.; De Cola, L. When Self-Assembly Meets Biology: Luminescent Platinum Complexes for Imaging Applications. Chem. Soc. Rev. 2014, 43, 4144–4166. [Google Scholar] [CrossRef]
- Zhang, Y.; Ni, J.; Zhu, Y.; Zeng, Q.; Ai, Y.; Li, Y. Multi-Stimuli Responsive Pt(II) Complexes for Information Storage and Anti-Counterfeiting. Chem. Eng. J. 2024, 498, 155049. [Google Scholar] [CrossRef]
- Wong, K.M.C.; Zhu, X.; Hung, L.L.; Zhu, N.; Yam, V.W.W.; Kwok, H.S. A Novel Class of Phosphorescent Gold(III) Alkynyl-Based Organic Light-Emitting Devices with Tunable Colour. Chem. Commun. 2005. [Google Scholar] [CrossRef] [PubMed]
- Currie, L.; Fernandez-Cestau, J.; Rocchigiani, L.; Bertrand, B.; Lancaster, S.J.; Hughes, D.L.; Duckworth, H.; Jones, S.T.E.; Credgington, D.; Penfold, T.J.; et al. Luminescent Gold(III) Thiolates: Supramolecular Interactions Trigger and Control Switchable Photoemissions from Bimolecular Excited States. Chem. - A Eur. J. 2017, 23, 105–113. [Google Scholar] [CrossRef]
- Vogler, A. Photoreactivity of Gold Complexes. Coord. Chem. Rev. 2001, 219–221, 489–507. [Google Scholar] [CrossRef]
- Leung, M.-Y.; Tang, M.-C.; Cheung, W.-L.; Lai, S.-L.; Ng, M.; Chan, M.-Y.; Wing-Wah Yam, V. Thermally Stimulated Delayed Phosphorescence (TSDP)-Based Gold(III) Complexes of Tridentate Pyrazine-Containing Pincer Ligand with Wide Emission Color Tunability and Their Application in Organic Light-Emitting Devices. J. Am. Chem. Soc. 2020, 142, 2448–2459. [Google Scholar] [CrossRef]
- Lee, C.; Tang, M.; Leung, M.; Cheng, S.; Wong, G.Y.; Cheung, W.; Lai, S.; Ko, C.; Chan, M.; Yam, V.W. Phosphine Oxide-Containing Gold(III) Complexes with Tunable Emission Color and Thermally Enhanced Luminescence Behavior. Adv. Opt. Mater. 2024, 12, 202401841. [Google Scholar] [CrossRef]
- To, W.; Zhou, D.; Tong, G.S.M.; Cheng, G.; Yang, C.; Che, C. Highly Luminescent Pincer Gold(III) Aryl Emitters: Thermally Activated Delayed Fluorescence and Solution-Processed OLEDs. Angew. Chemie Int. Ed. 2017, 56, 14036–14041. [Google Scholar] [CrossRef] [PubMed]
- Tang, M.C.; Chan, A.K.W.; Chan, M.Y.; Yam, V.W.W. Platinum and Gold Complexes for OLEDs. Top. Curr. Chem. 2016, 374, 46. [Google Scholar] [CrossRef] [PubMed]
- Paderina, A.; Slavova, S.; Tupikina, E.; Snetkov, D.; Grachova, E. Aggregation Game: Changing Solid-State Emission Using Different Counterions in Monoalkynylphosphonium Pt(II) Complexes. Inorg. Chem. 2024, 63, 17548–17560. [Google Scholar] [CrossRef] [PubMed]
- Berenguer, J.R.; Lalinde, E.; Torroba, J. Synthesis, Characterization and Photophysics of a New Series of Anionic C,N,C Cyclometalated Platinum Complexes. Inorg. Chem. 2007, 46, 9919–9930. [Google Scholar] [CrossRef]
- Petrovskii, S.; Paderina, A.; Sizova, A.; Grachova, E. Homoleptic Alkynylphosphonium Au(I) Complexes as Push–Pull Phosphorescent Emitters. Inorg. Chem. 2023, 62, 5123–5133. [Google Scholar] [CrossRef]
- Paderina, A.; Slavova, S.; Petrovskii, S.; Grachova, E. Alkynylphosphonium Pt(II) Complexes: Synthesis, Characterization, and Features of Photophysical Properties in Solution and in the Solid State. Inorg. Chem. 2023, 62, 18056–18068. [Google Scholar] [CrossRef]
- Grachova, E.; Paderina, A.; Sizova, A. Cationic or Neutral: Dependence of Photophysical Properties of Bis-alkynylphosphonium Pt(II) Complexes on Ancillary Ligand. Chem. – A Eur. J. 2024, 30, e202402242. [Google Scholar]
- Tiekink, E.R.T. Supramolecular Assembly Based on “Emerging” Intermolecular Interactions of Particular Interest to Coordination Chemists. Coord. Chem. Rev. 2017, 345, 209–228. [Google Scholar] [CrossRef]
- Rizzato, S.; Bergès, J.; Mason, S.A.; Albinati, A.; Kozelka, J. Dispersion-Driven Hydrogen Bonding: Predicted Hydrogen Bond between Water and Platinum(II) Identified by Neutron Diffraction. Angew. Chemie - Int. Ed. 2010, 49, 7440–7443. [Google Scholar] [CrossRef]
- Glosz, D.; Jędrzejowska, K.; Niedzielski, G.; Kobylarczyk, J.; Zakrzewski, J.J.; Hooper, J.G.M.; Gryl, M.; Koshevoy, I.O.; Podgajny, R. Influence of O−H⋅⋅⋅Pt Interactions on Photoluminescent Response in the (Et4N)2{[Pt(Bph)(CN)2][Phenylene-1,4-Diresorcinol]} Framework. Chem. - A Eur. J. 2024, 30, e202400797. [Google Scholar] [CrossRef]
- Gokul, G.; Thirumaran, S.; Vijaya, P. Synthesis and Anticancer Activity of Pd(II) and Pt(II) Complexes of Dodecyl Based Dithiocarbamate Ligands: Insight into the C-H∙∙∙Pt Interaction Using X-Ray Structure, DFT, Hirshfeld Surface and AIM Analysis. J. Mol. Struct. 2025, 1321, 139998. [Google Scholar] [CrossRef]
- Sillen, A.; Engelborghs, Y. The Correct Use of “Average” Fluorescence Parameters. Photochem. Photobiol. 1998, 67, 475–486. [Google Scholar] [CrossRef]
- Lu, W.; Chan, M.C.W.; Cheung, K.K.; Che, C.M. π-π Interactions in Organometallic Systems. Crystal Structures and Spectroscopic Properties of Luminescent Mono-, Bi-, and Trinuclear Trans-Cyclometalated Platinum(II) Complexes Derived from 2,6-Diphenylpyridine. Organometallics 2001, 20, 2477–2486. [Google Scholar] [CrossRef]
- Yam, V.W.W.; Tang, R.P.L.; Wong, K.M.C.; Lu, X.X.; Cheung, K.K.; Zhu, N. Syntheses, Electronic Absorption, Emission, and Ion-Binding Studies of Platinum(II) C^N^C and Terpyridyl Complexes Containing Crown Ether Pendants. Chem. - A Eur. J. 2002, 8, 4066–4076. [Google Scholar] [CrossRef]
- Leung, S.Y.; Lam, E.S.; Lam, W.H.; Wong, K.M.; Wong, W.; Yam, V.W. Luminescent Cyclometalated Alkynylplatinum(II) Complexes with a Tridentate Pyridine-Based N-Heterocyclic Carbene Ligand: Synthesis, Characterization, Electrochemistry, Photophysics, and Computational Studies. Chem. – A Eur. J. 2013, 19, 10360–10369. [Google Scholar] [CrossRef]
- Prokhorov, A.M.; Hofbeck, T.; Czerwieniec, R.; Suleymanova, A.F.; Kozhevnikov, D.N.; Yersin, H. Brightly Luminescent Pt(II) Pincer Complexes with a Sterically Demanding Carboranyl-Phenylpyridine Ligand: A New Material Class for Diverse Optoelectronic Applications. J. Am. Chem. Soc. 2014, 136, 9637–9642. [Google Scholar] [CrossRef]
- Fang, B.; Zhu, Y.; Hu, L.; Shen, Y.; Jiang, G.; Zhang, Q.; Tian, X.; Li, S.; Zhou, H.; Wu, J.; et al. Series of C^N^C Cyclometalated Pt(II) Complexes: Synthesis, Crystal Structures, and Nonlinear Optical Properties in the Near-Infrared Region. Inorg. Chem. 2018, 57, 14134–14143. [Google Scholar] [CrossRef]
- Ogawa, T.; Sameera, W.M.C.; Yoshida, M.; Kobayashi, A.; Kato, M. Phosphorescence Properties of Anionic Cyclometalated Platinum(II) Complexes with Fluorine-Substituted Tridentate Diphenylpyridine in the Solid State. Chem. Phys. Lett. 2020, 739, 137024. [Google Scholar] [CrossRef]
- Yam, V.W.W.; Wong, K.M.C.; Hung, L.L.; Zhu, N. Luminescent Gold(III) Alkynyl Complexes: Synthesis, Structural Characterization, and Luminescence Properties. Angew. Chemie - Int. Ed. 2005, 44, 3107–3110. [Google Scholar] [CrossRef]
- Au, V.K.-M.; Wong, K.M.-C.; Tsang, D.P.-K.; Chan, M.-Y.; Zhu, N.; Yam, V.W.-W. High-Efficiency Green Organic Light-Emitting Devices Utilizing Phosphorescent Bis-Cyclometalated Alkynylgold(III) Complexes. J. Am. Chem. Soc. 2010, 132, 14273–14278. [Google Scholar] [CrossRef]
- Au, V.K.-M.; Tsang, D.P.-K.; Wong, K.M.-C.; Chan, M.-Y.; Zhu, N.; Yam, V.W.-W. Functionalized Bis-Cyclometalated Alkynylgold(III) Complexes: Synthesis, Characterization, Electrochemistry, Photophysics, Photochemistry, and Electroluminescence Studies. Inorg. Chem. 2013, 52, 12713–12725. [Google Scholar] [CrossRef] [PubMed]
- Au, V.K.-M.; Tsang, D.P.-K.; Wong, Y.-C.; Chan, M.-Y.; Yam, V.W.-W. Synthesis of Alkynylgold(III) Complexes with Bis-Cyclometalating Ligand Derived from Ethyl 2,6-Diphenylisonicotinate and Their Structural, Electrochemical, Photo- and Electroluminescence Studies. J. Organomet. Chem. 2015, 792, 109–116. [Google Scholar] [CrossRef]
- Tong, G.S.; Che, C. Emissive or Nonemissive? A Theoretical Analysis of the Phosphorescence Efficiencies of Cyclometalated Platinum(II) Complexes. Chem. – A Eur. J. 2009, 15, 7225–7237. [Google Scholar] [CrossRef] [PubMed]
- Zehnder, T.N.; Blacque, O.; Venkatesan, K. Luminescent Monocyclometalated Cationic Gold( <scp>iii</Scp> ) Complexes: Synthesis, Photophysical Characterization and Catalytic Investigations. Dalt. Trans. 2014, 43, 11959. [Google Scholar]
- Hua, F.; Kinayyigit, S.; Rachford, A.A.; Shikhova, E.A.; Goeb, S.; Cable, J.R.; Adams, C.J.; Kirschbaum, K.; Pinkerton, A.A.; Castellano, F.N. Luminescent Charge-Transfer Platinum(II) Metallacycle. Inorg. Chem. 2007, 46, 8771–8783. [Google Scholar] [CrossRef]
- Agostic Interaction. In The IUPAC Compendium of Chemical Terminology; International Union of Pure and Applied Chemistry (IUPAC): Research Triangle Park, NC, 2014.
- Brookhart, M.; Green, M.L.H.; Parkin, G. Agostic Interactions in Transition Metal Compounds. Proc. Natl. Acad. Sci. 2007, 104, 6908–6914. [Google Scholar] [CrossRef]
- Lein, M. Characterization of Agostic Interactions in Theory and Computation. Coord. Chem. Rev. 2009, 253, 625–634. [Google Scholar] [CrossRef]
- Luginin, M.; Snetkov, D.; Sizova, A.; Paderina, A.; Sizov, V.; Grachova, E. Cyclometalated Au(III) Complexes with Alkynylphosphine Oxide Ligands: Synthesis and Photophysical Properties. Dalt. Trans. 2025, 54, 2950–2963. [Google Scholar] [CrossRef]
- Cave, G.W. V.; Fanizzi, F.P.; Deeth, R.J.; Errington, W.; Rourke, J.P. C−H Activation Induced by Water. Monocyclometalated to Dicyclometalated: C∧N∧C Tridentate Platinum Complexes. Organometallics 2000, 19, 1355–1364. [Google Scholar] [CrossRef]
- Wong, K.-H.; Cheung, K.-K.; Chan, M.C.-W.; Che, C.-M. Application of 2,6-Diphenylpyridine as a Tridentate [C^N^C] Dianionic Ligand in Organogold(III) Chemistry. Structural and Spectroscopic Properties of Mono- and Binuclear Transmetalated Gold(III) Complexes. Organometallics 1998, 17, 3505–3511. [Google Scholar] [CrossRef]
- Armareg, W.L.F.; Cha, C. Purification of Laboratory Chemicals; Elsevier, 2013; ISBN 9780123821614.
- CrysAlisPro, Rigaku Oxford Diffraction. CrysAlisPro, Rigaku Oxford Diffr. 2017, Version 1.171.39.35a, 2017.
- Sheldrick, G.M. SHELXT - Integrated Space-Group and Crystal-Structure Determination. Acta Crystallogr. Sect. A Found. Crystallogr. 2015, 71, 3–8. [Google Scholar] [CrossRef] [PubMed]
- Sheldrick, G.M. Crystal Structure Refinement with SHELXL. Acta Crystallogr. Sect. C Struct. Chem. 2015, 71, 3–8. [Google Scholar] [CrossRef] [PubMed]
- Bourhis, L.J.; Dolomanov, O. V.; Gildea, R.J.; Howard, J.A.K.; Puschmann, H. The Anatomy of a Comprehensive Constrained, Restrained Refinement Program for the Modern Computing Environment – Olex2 Dissected. Acta Crystallogr. Sect. A Found. Adv. 2015, 71, 59–75. [Google Scholar] [CrossRef]
- Dolomanov, O. V.; Bourhis, L.J.; Gildea, R.J.; Howard, J.A.K.; Puschmann, H. OLEX2 : A Complete Structure Solution, Refinement and Analysis Program. J. Appl. Crystallogr. 2009, 42, 339–341. [Google Scholar] [CrossRef]
- Spackman, P.R.; Turner, M.J.; McKinnon, J.J.; Wolff, S.K.; Grimwood, D.J.; Jayatilaka, D.; Spackman, M.A. CrystalExplorer: A Program for Hirshfeld Surface Analysis, Visualization and Quantitative Analysis of Molecular Crystals. J. Appl. Crystallogr. 2021, 54, 1006–1011. [Google Scholar] [CrossRef]
- Frisch, M.J.; Trucks, G.W.; Schlegel, H.B.; Scuseria, G.E.; Robb, M.A.; Cheeseman, J.R.; Scalmani, G.; Barone, V.; Petersson, G.A.; Nakatsuji, H.; et al. Gaussian 16, Revision A.03 2016.
- Grimme, S.; Ehrlich, S.; Goerigk, L. Effect of the Damping Function in Dispersion Corrected Density Functional Theory. J. Comput. Chem. 2011, 32, 1456–1465. [Google Scholar] [CrossRef]
- MacHado, S.F.; Camiletti, G.G.; Neto, A.C.; Jorge, F.E.; Jorge, R.S. Gaussian Basis Set of Triple Zeta Valence Quality for the Atoms from K to Kr: Application in DFT and CCSD(T) Calculations of Molecular Properties. Mol. Phys. 2009, 107, 1713–1727. [Google Scholar] [CrossRef]
- Lu, T.; Chen, F. Multiwfn: A Multifunctional Wavefunction Analyzer. J. Comput. Chem. 2012, 33, 580–592. [Google Scholar] [CrossRef]
- Zhang, J.; Lu, T. Efficient Evaluation of Electrostatic Potential with Computerized Optimized Code. Phys. Chem. Chem. Phys. 2021, 23, 20323–20328. [Google Scholar] [CrossRef]
- Lu, T.; Chen, Q. Van Der Waals Potential: An Important Complement to Molecular Electrostatic Potential in Studying Intermolecular Interactions. J. Mol. Model. 2020, 26, 315. [Google Scholar] [CrossRef] [PubMed]
- Glendening, E.D.; Badenhoop, K.; Reed, E.; Carpenter, J.E.; Bohmann, J.A.; Morales, C.M.; Karafiloglou, P.; Landis, C.R.; Weinhold, F. NBO Version 7. 0 2018.
- Dennington, R.; Keith, T.A.; Millam, J.M. GaussView, Version 6.0 2009.
- Yanai, T.; Tew, D.P.; Handy, N.C. A New Hybrid Exchange–Correlation Functional Using the Coulomb-Attenuating Method (CAM-B3LYP). Chem. Phys. Lett. 2004, 393, 51–57. [Google Scholar] [CrossRef]
- Andrae, D.; Haussermann, U.; Dolg, M.; Stoll, H.; Preuss, H. Energy-Adjusted Ab Initio Pseudopotentials for the Second and Third Row Transition Elements. Theor. Chim. Acta 1990, 77, 123–141. [Google Scholar] [CrossRef]
- Weigend, F.; Ahlrichs, R. Balanced Basis Sets of Split Valence, Triple Zeta Valence and Quadruple Zeta Valence Quality for H to Rn: Design and Assessment of Accuracy. Phys. Chem. Chem. Phys. 2005, 7, 3297–3305. [Google Scholar] [CrossRef] [PubMed]
- Barone, V.; Cossi, M. Quantum Calculation of Molecular Energies and Energy Gradients in Solution by a Conductor Solvent Model. J. Phys. Chem. A 1998, 102, 1995–2001. [Google Scholar] [CrossRef]
- Cossi, M.; Rega, N.; Scalmani, G.; Barone, V. Energies, Structures, and Electronic Properties of Molecules in Solution with the C-PCM Solvation Model. J. Comput. Chem. 2003, 24, 669–681. [Google Scholar] [CrossRef]
- Martin, R.L. Natural Transition Orbitals. J. Chem. Phys. 2003, 118, 4775–4777. [Google Scholar] [CrossRef]
Scheme 1.
Alkynylphosphonium salts P1−P3 used as ligands, and Pt(II) and Au(III) complexes based on them.
Scheme 1.
Alkynylphosphonium salts P1−P3 used as ligands, and Pt(II) and Au(III) complexes based on them.
Scheme 2.
Synthesis of complexes Pt1–Pt3 and Au1–Au3.
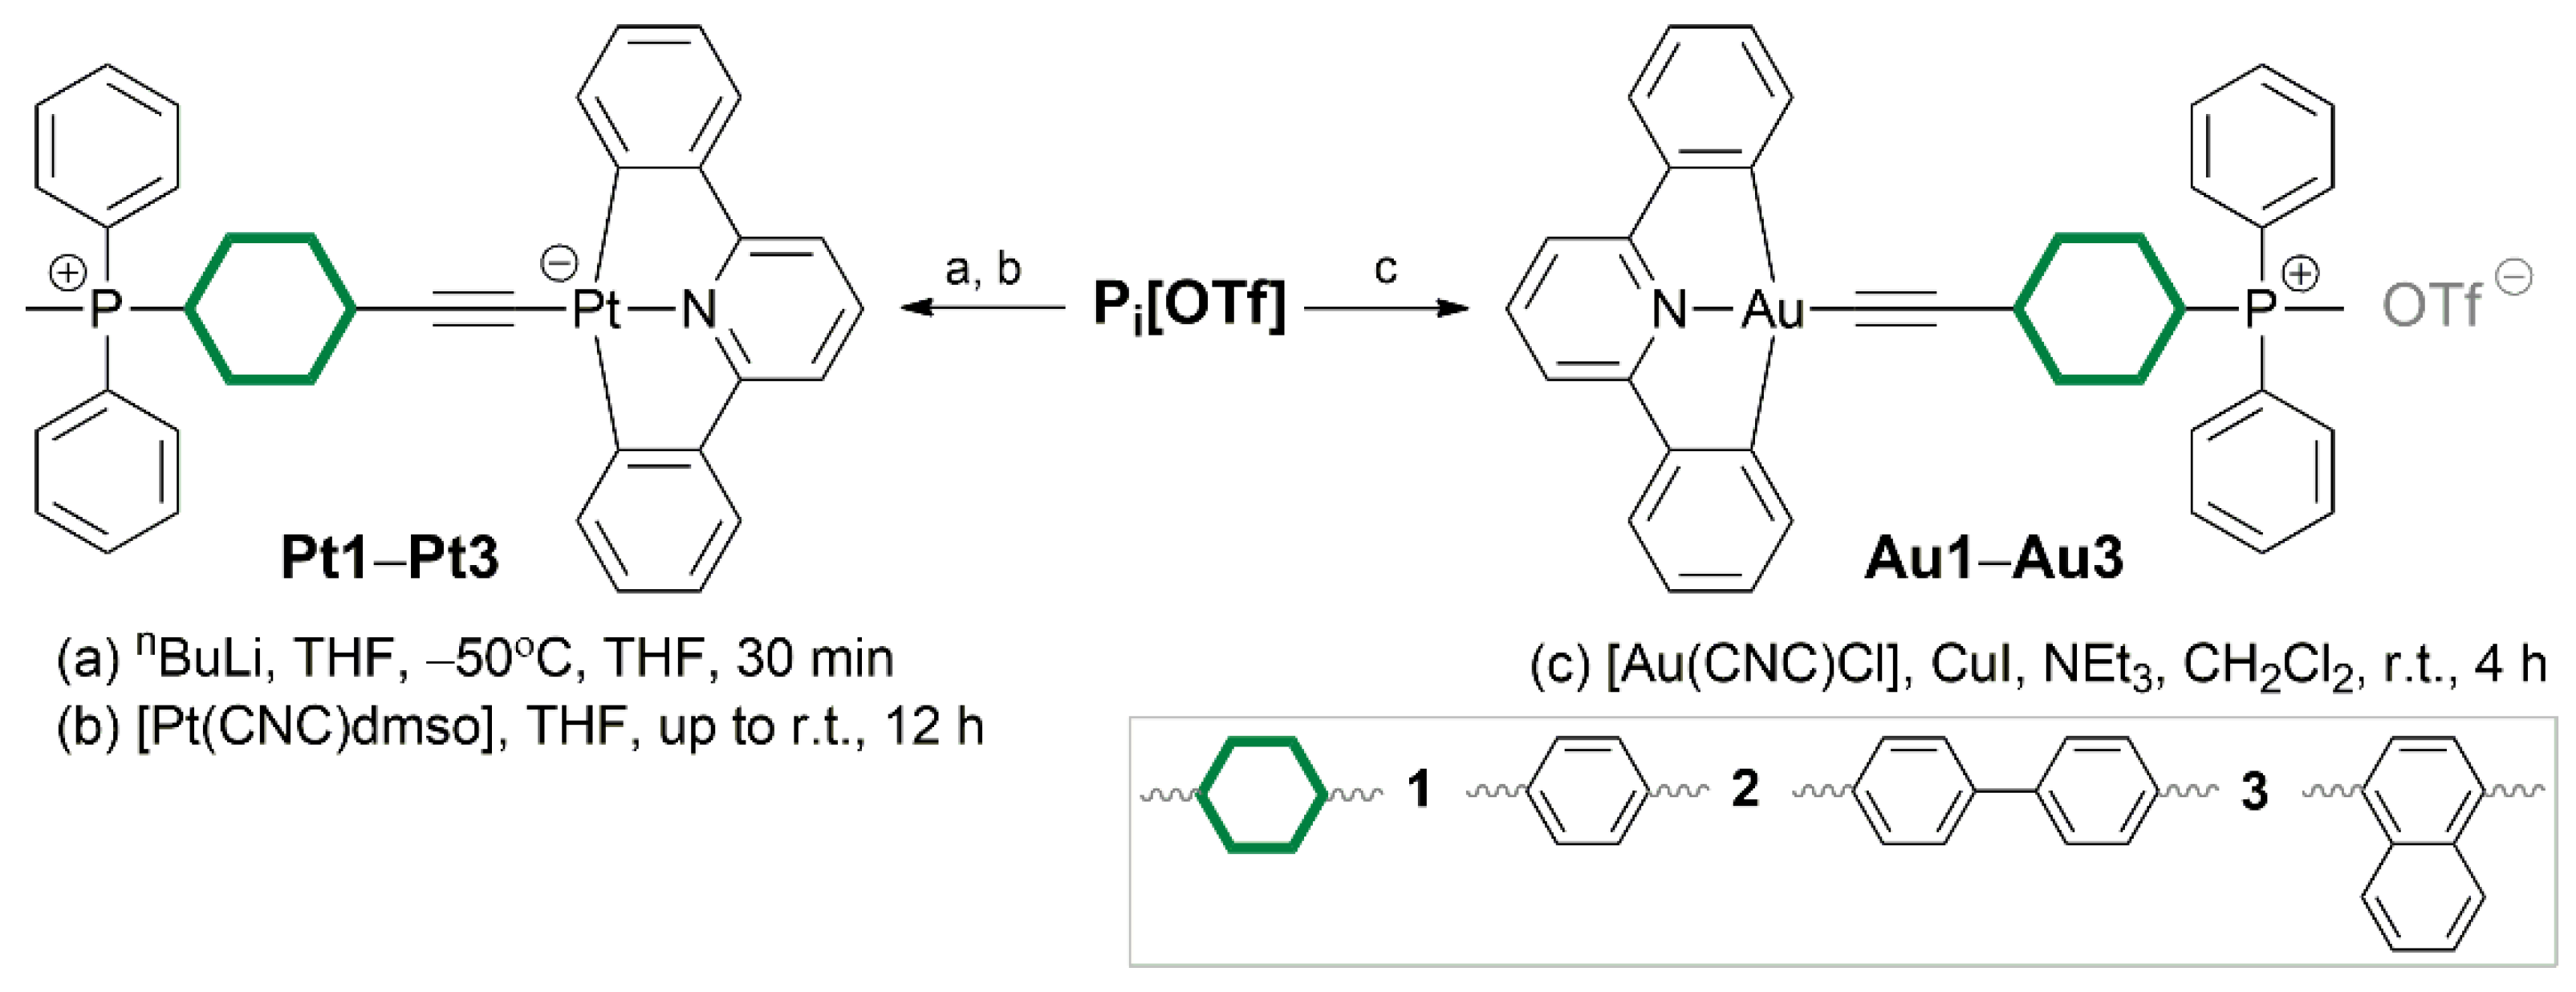
Figure 1.
(a) ORTEP view of Pt1 molecular structures, the thermal ellipsoids are set at a 50% probability level; (b) supramolecular dimer in the solid state of Pt1 with CH···Pt short contacts formed by a CH3 group, H−Pt distances are indicated by green dotted line. Solvent molecules are omitted for clarity.
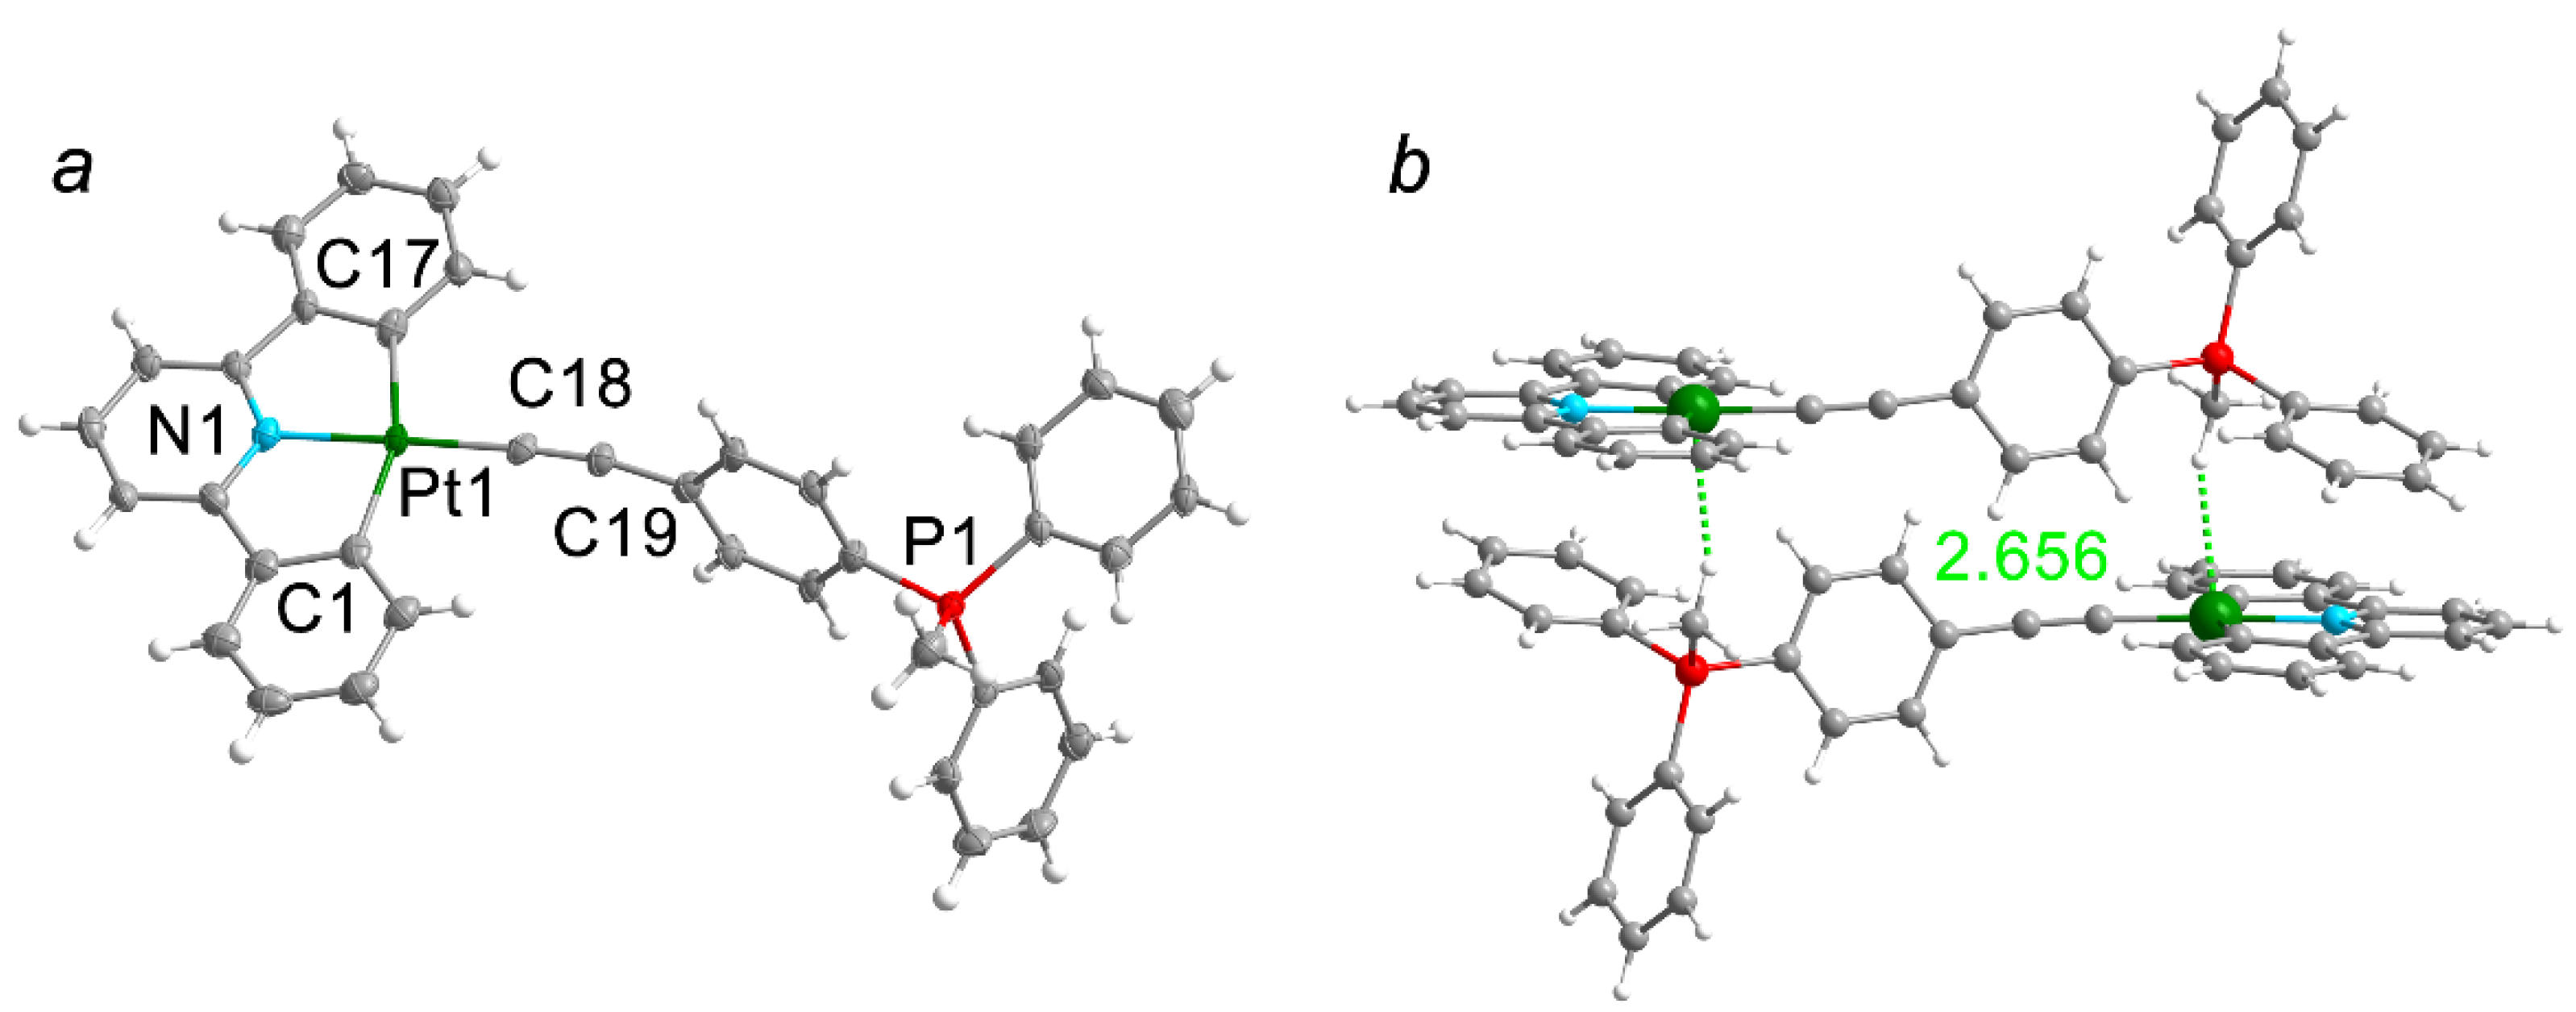
Figure 2.
(a) UV-vis absorption spectra of Pt1, Pt2 (DMSO solution) and Au1–Au3 (DCM solution), r.t. Normalized solid-state emission spectra of the Pt1, Pt2 and Au1–Au3 at (b) 292K and (c) 77K. An asterisk denotes an artifact.
Figure 2.
(a) UV-vis absorption spectra of Pt1, Pt2 (DMSO solution) and Au1–Au3 (DCM solution), r.t. Normalized solid-state emission spectra of the Pt1, Pt2 and Au1–Au3 at (b) 292K and (c) 77K. An asterisk denotes an artifact.
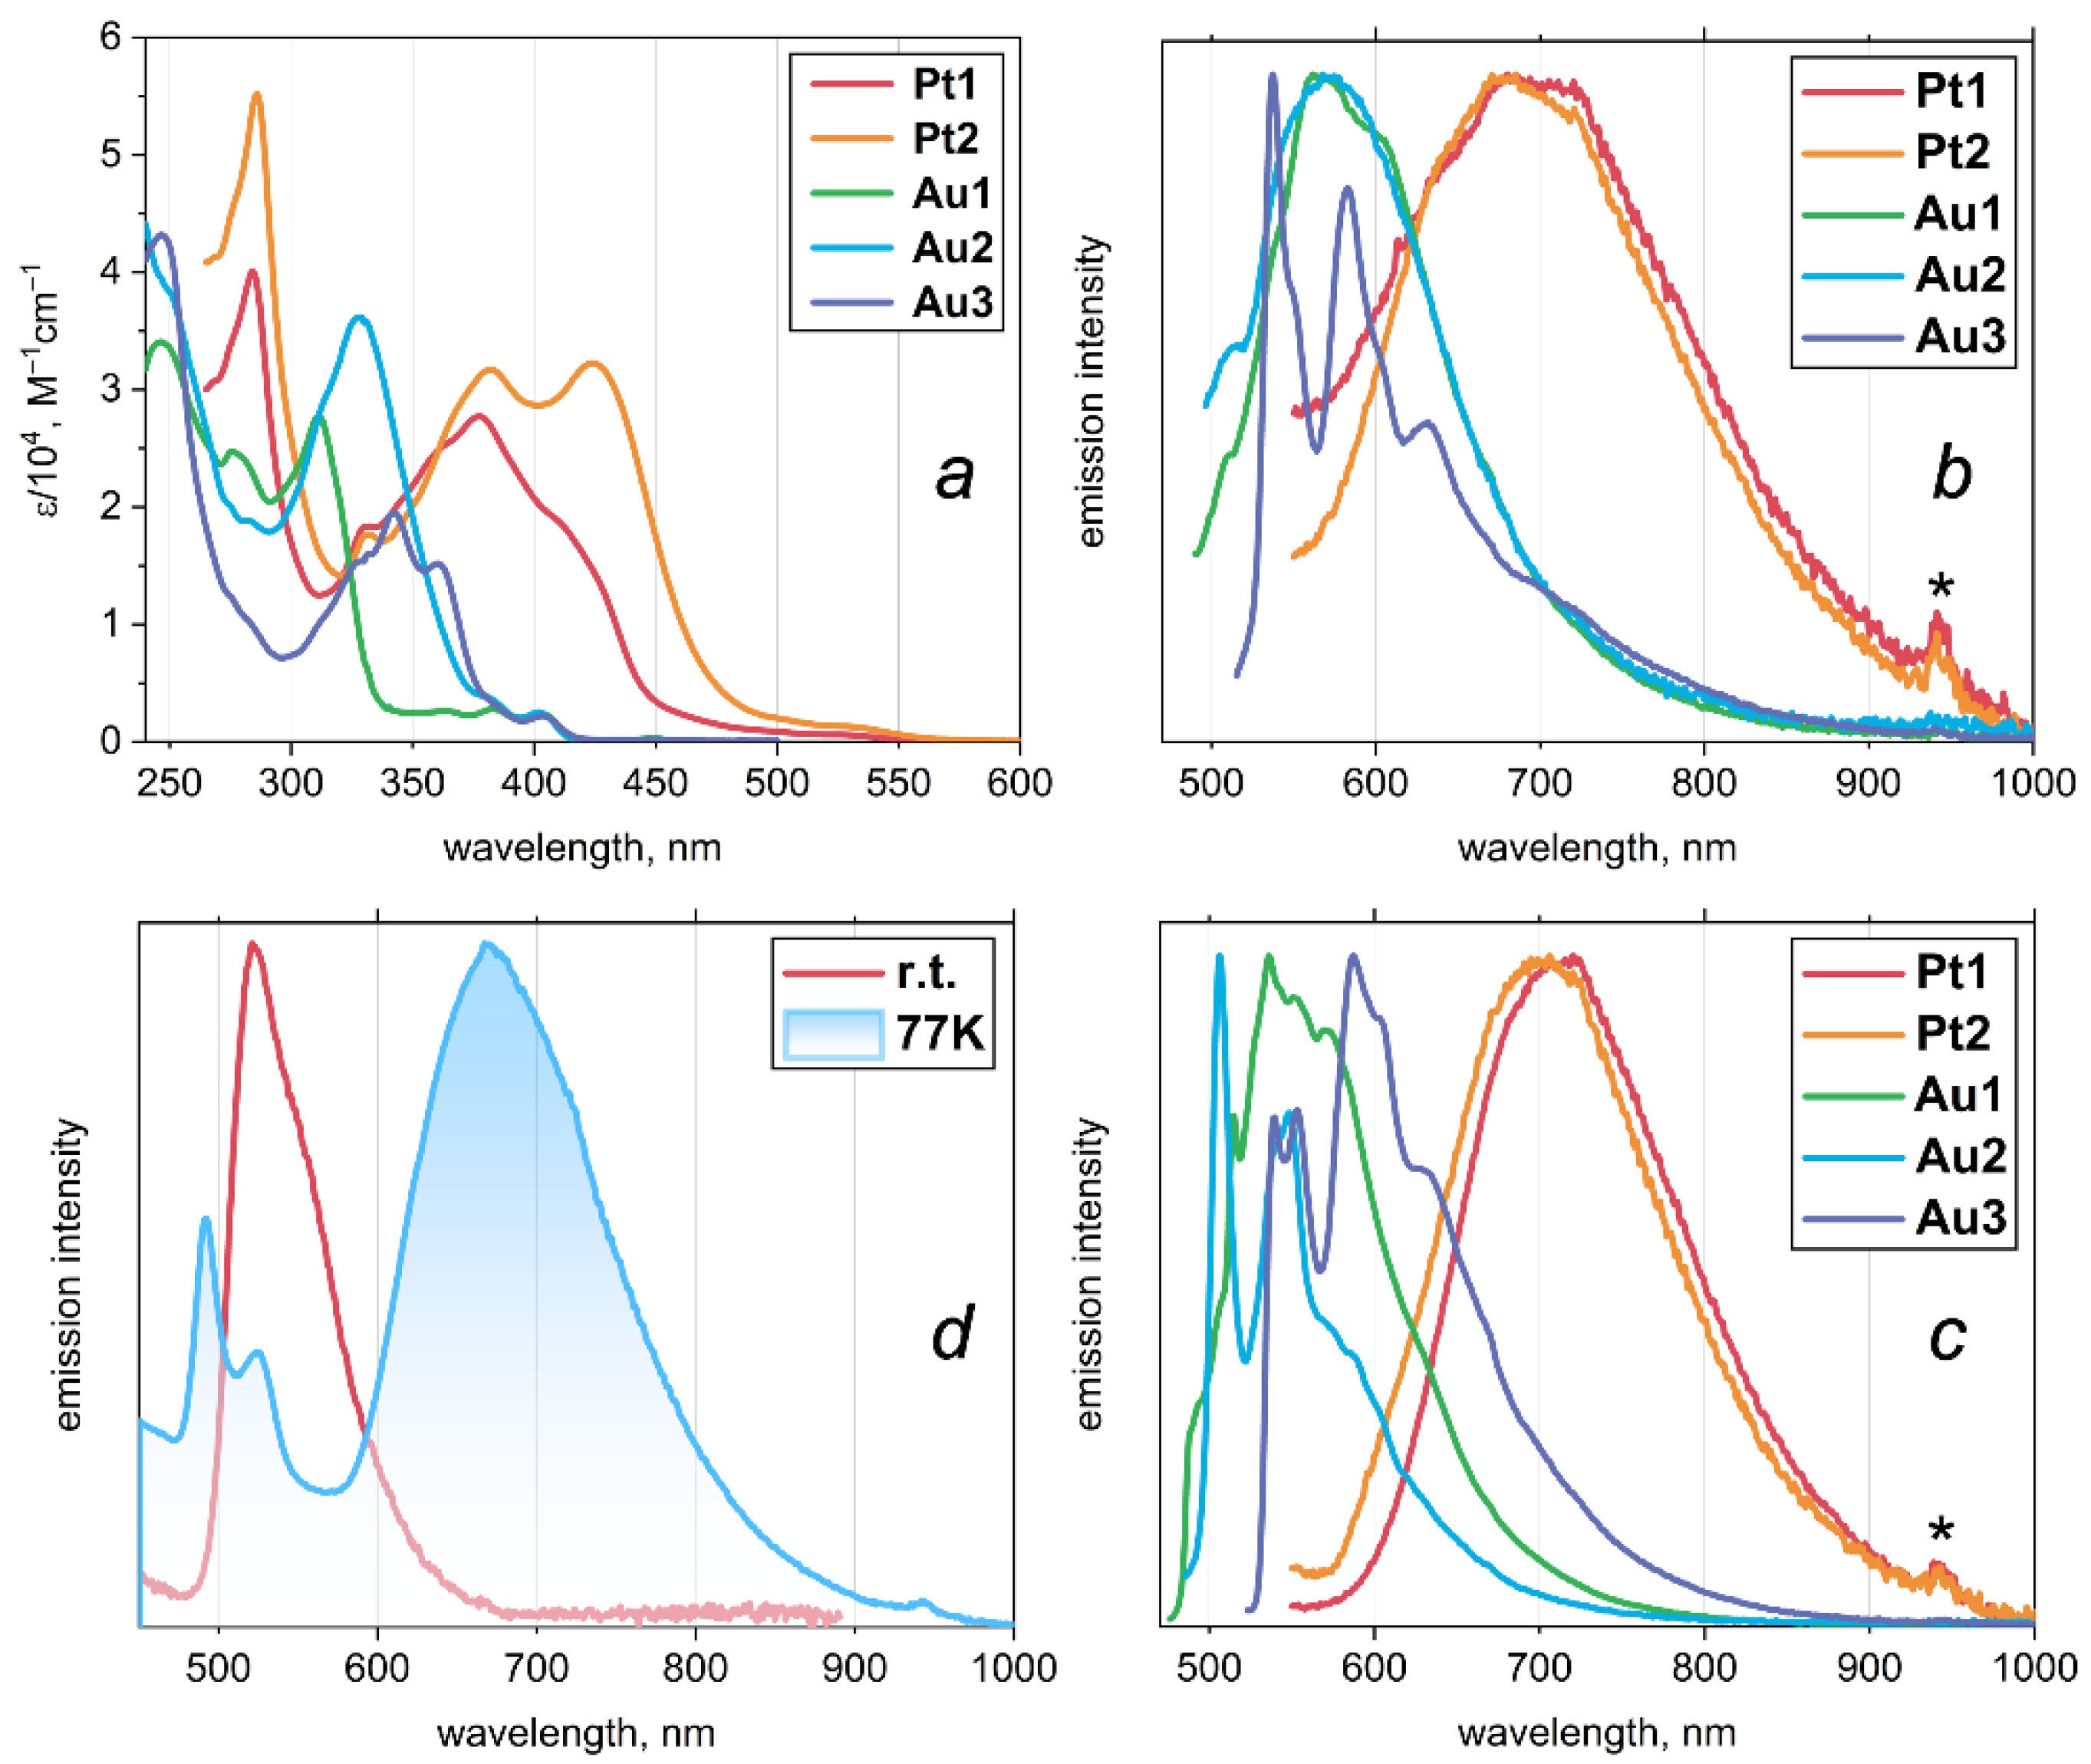
Figure 3.
(a) Electron density isosurface (0.001 a.u.) colored by molecular electrostatic potential (MESP) for the equilibrated Pt1 monomer. MESP local maxima values near the Pt atom are indicated. (b) Van der Waals potential isosurface of the interaction energy between the Pt1 monomer and a He atom, equal to ±0.5 kcal/mol. The grey region corresponds to the exchange-repulsion term, and the yellow regions to the dispersion term.
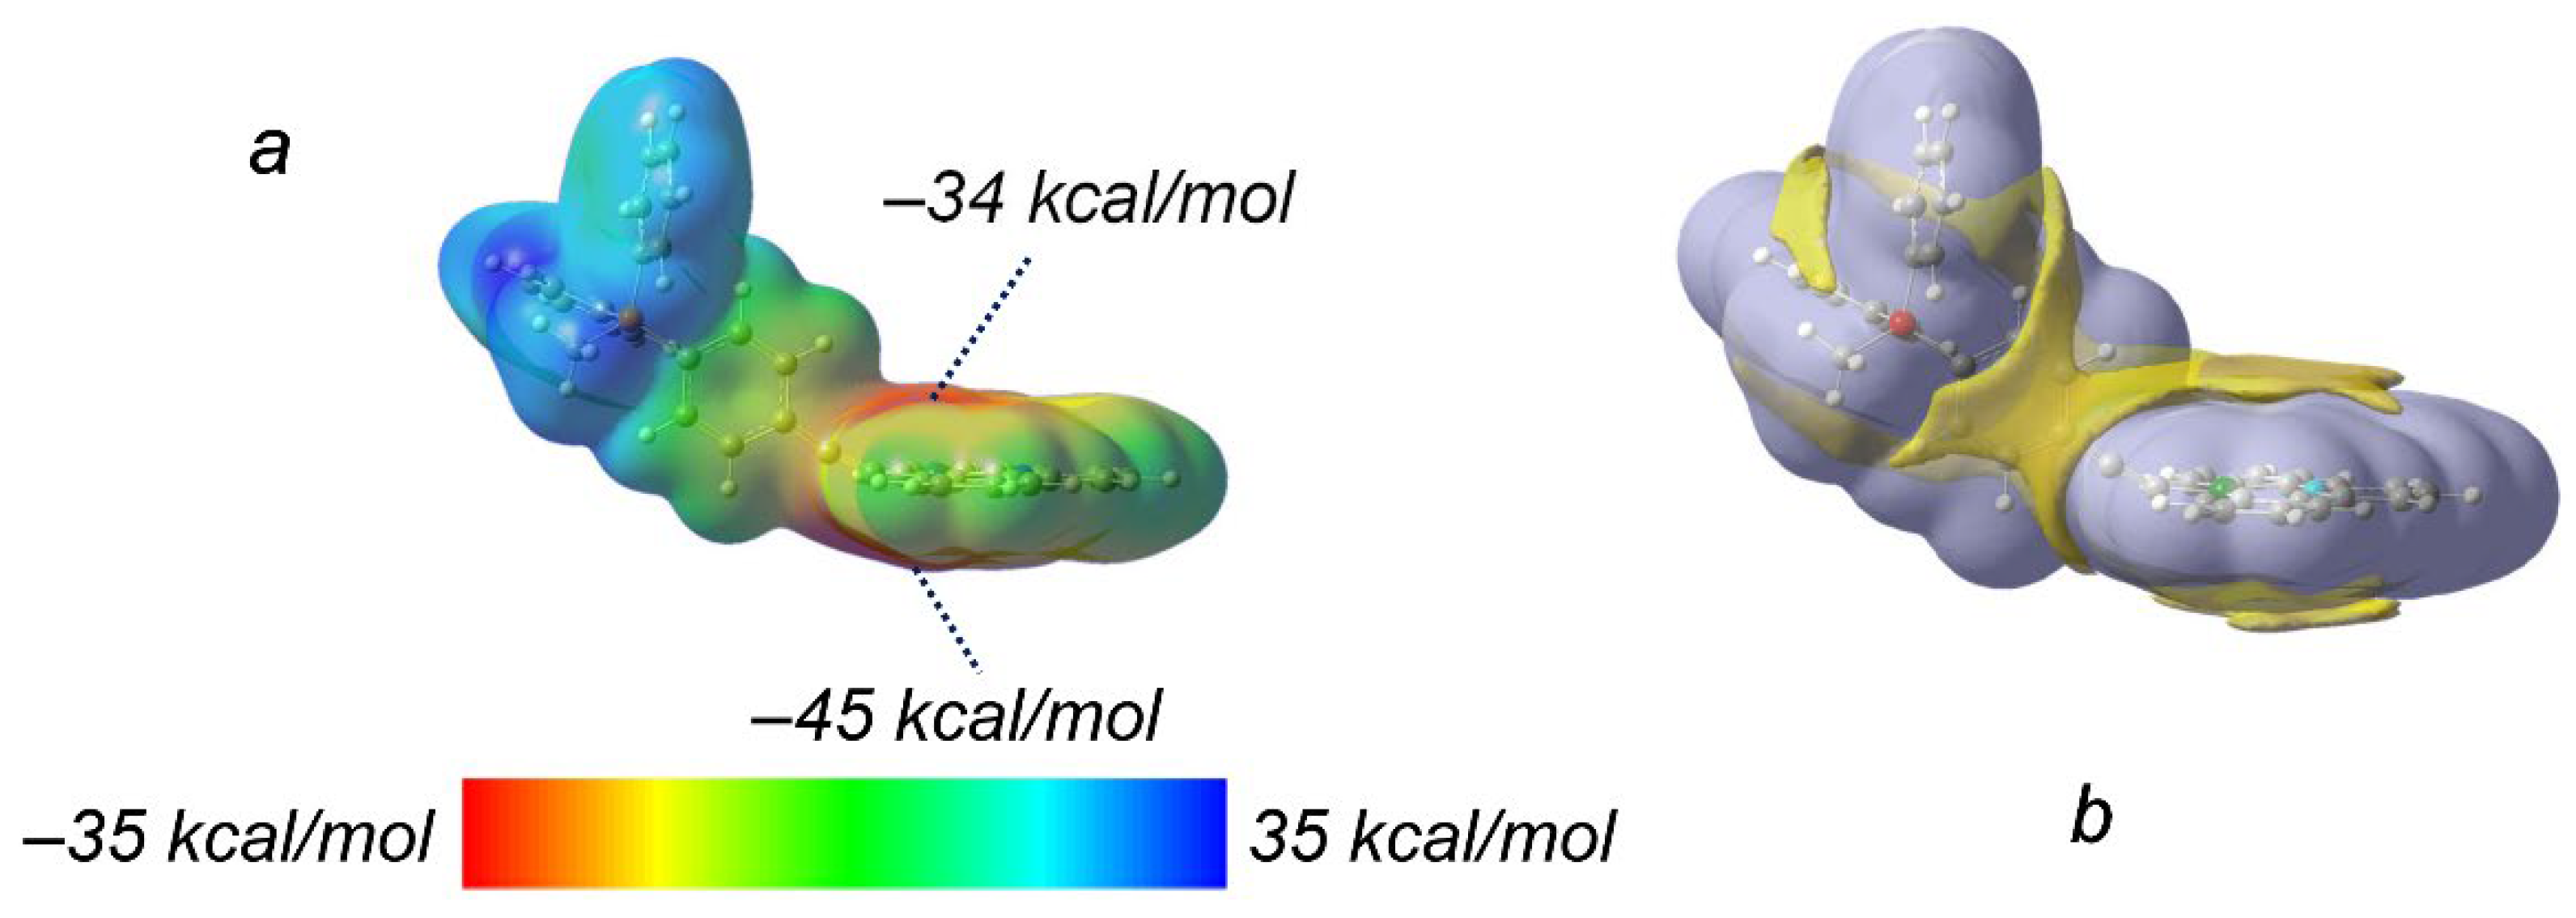
Figure 4.
Optimized geometries of Pt1 supramolecular dimers with CH···Pt short contacts formed by (a) a CH3 group and (b) a CH proton of the phenyl ring acting as the proton donor. The dashed lines illustrate the bonding paths between (3;−1) and (3;−3) electron density critical points that involve platinum (green), nitrogen (blue), and carbon (black) atoms. (3;−1) critical points are given in violet. Corresponding geometric parameters (interatomic distance rH…Pt, rC…Pt and angle CHPt) and electron density parameters in (3;−1) critical points (electron density ρ, the Laplacian of electron density ∇2ρ, density of local electronic kinetic G and potential V energies) are given in dark blue.
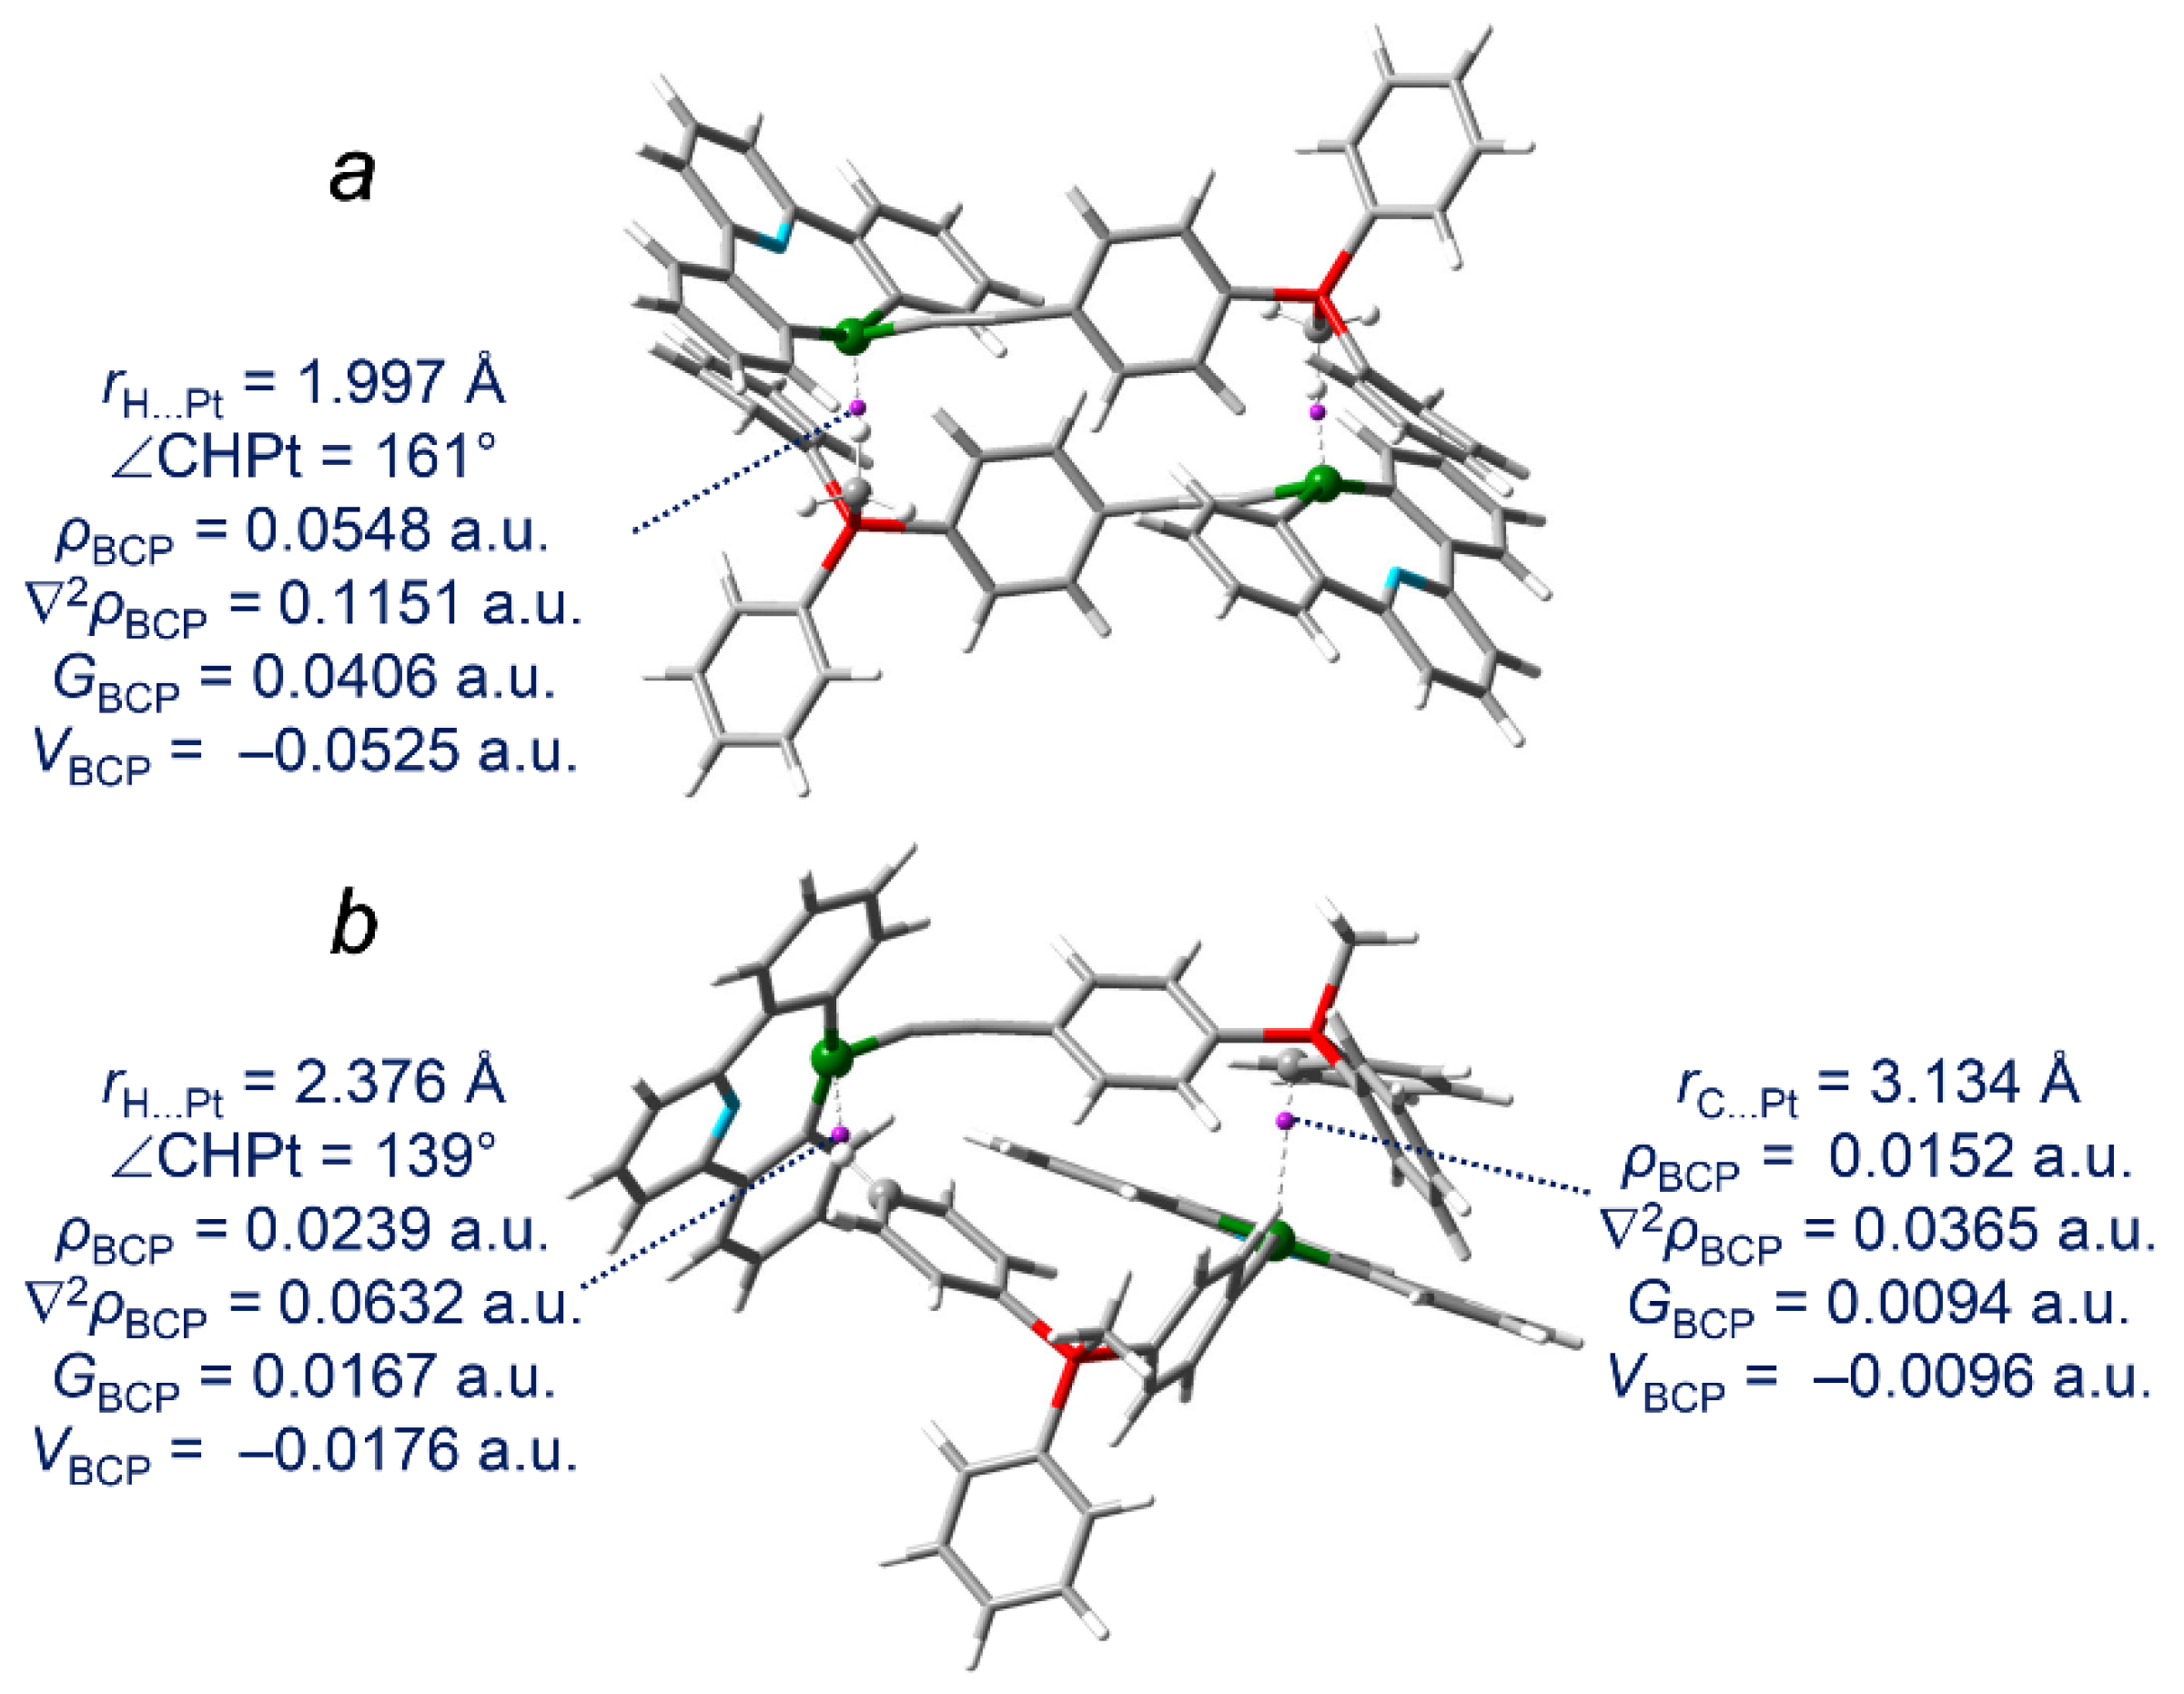
Figure 5.
Natural transition orbitals for the active singlet S3* of the complex Au1 (278 nm, f = 1.37). Two main components of the transition are shown.
Figure 5.
Natural transition orbitals for the active singlet S3* of the complex Au1 (278 nm, f = 1.37). Two main components of the transition are shown.
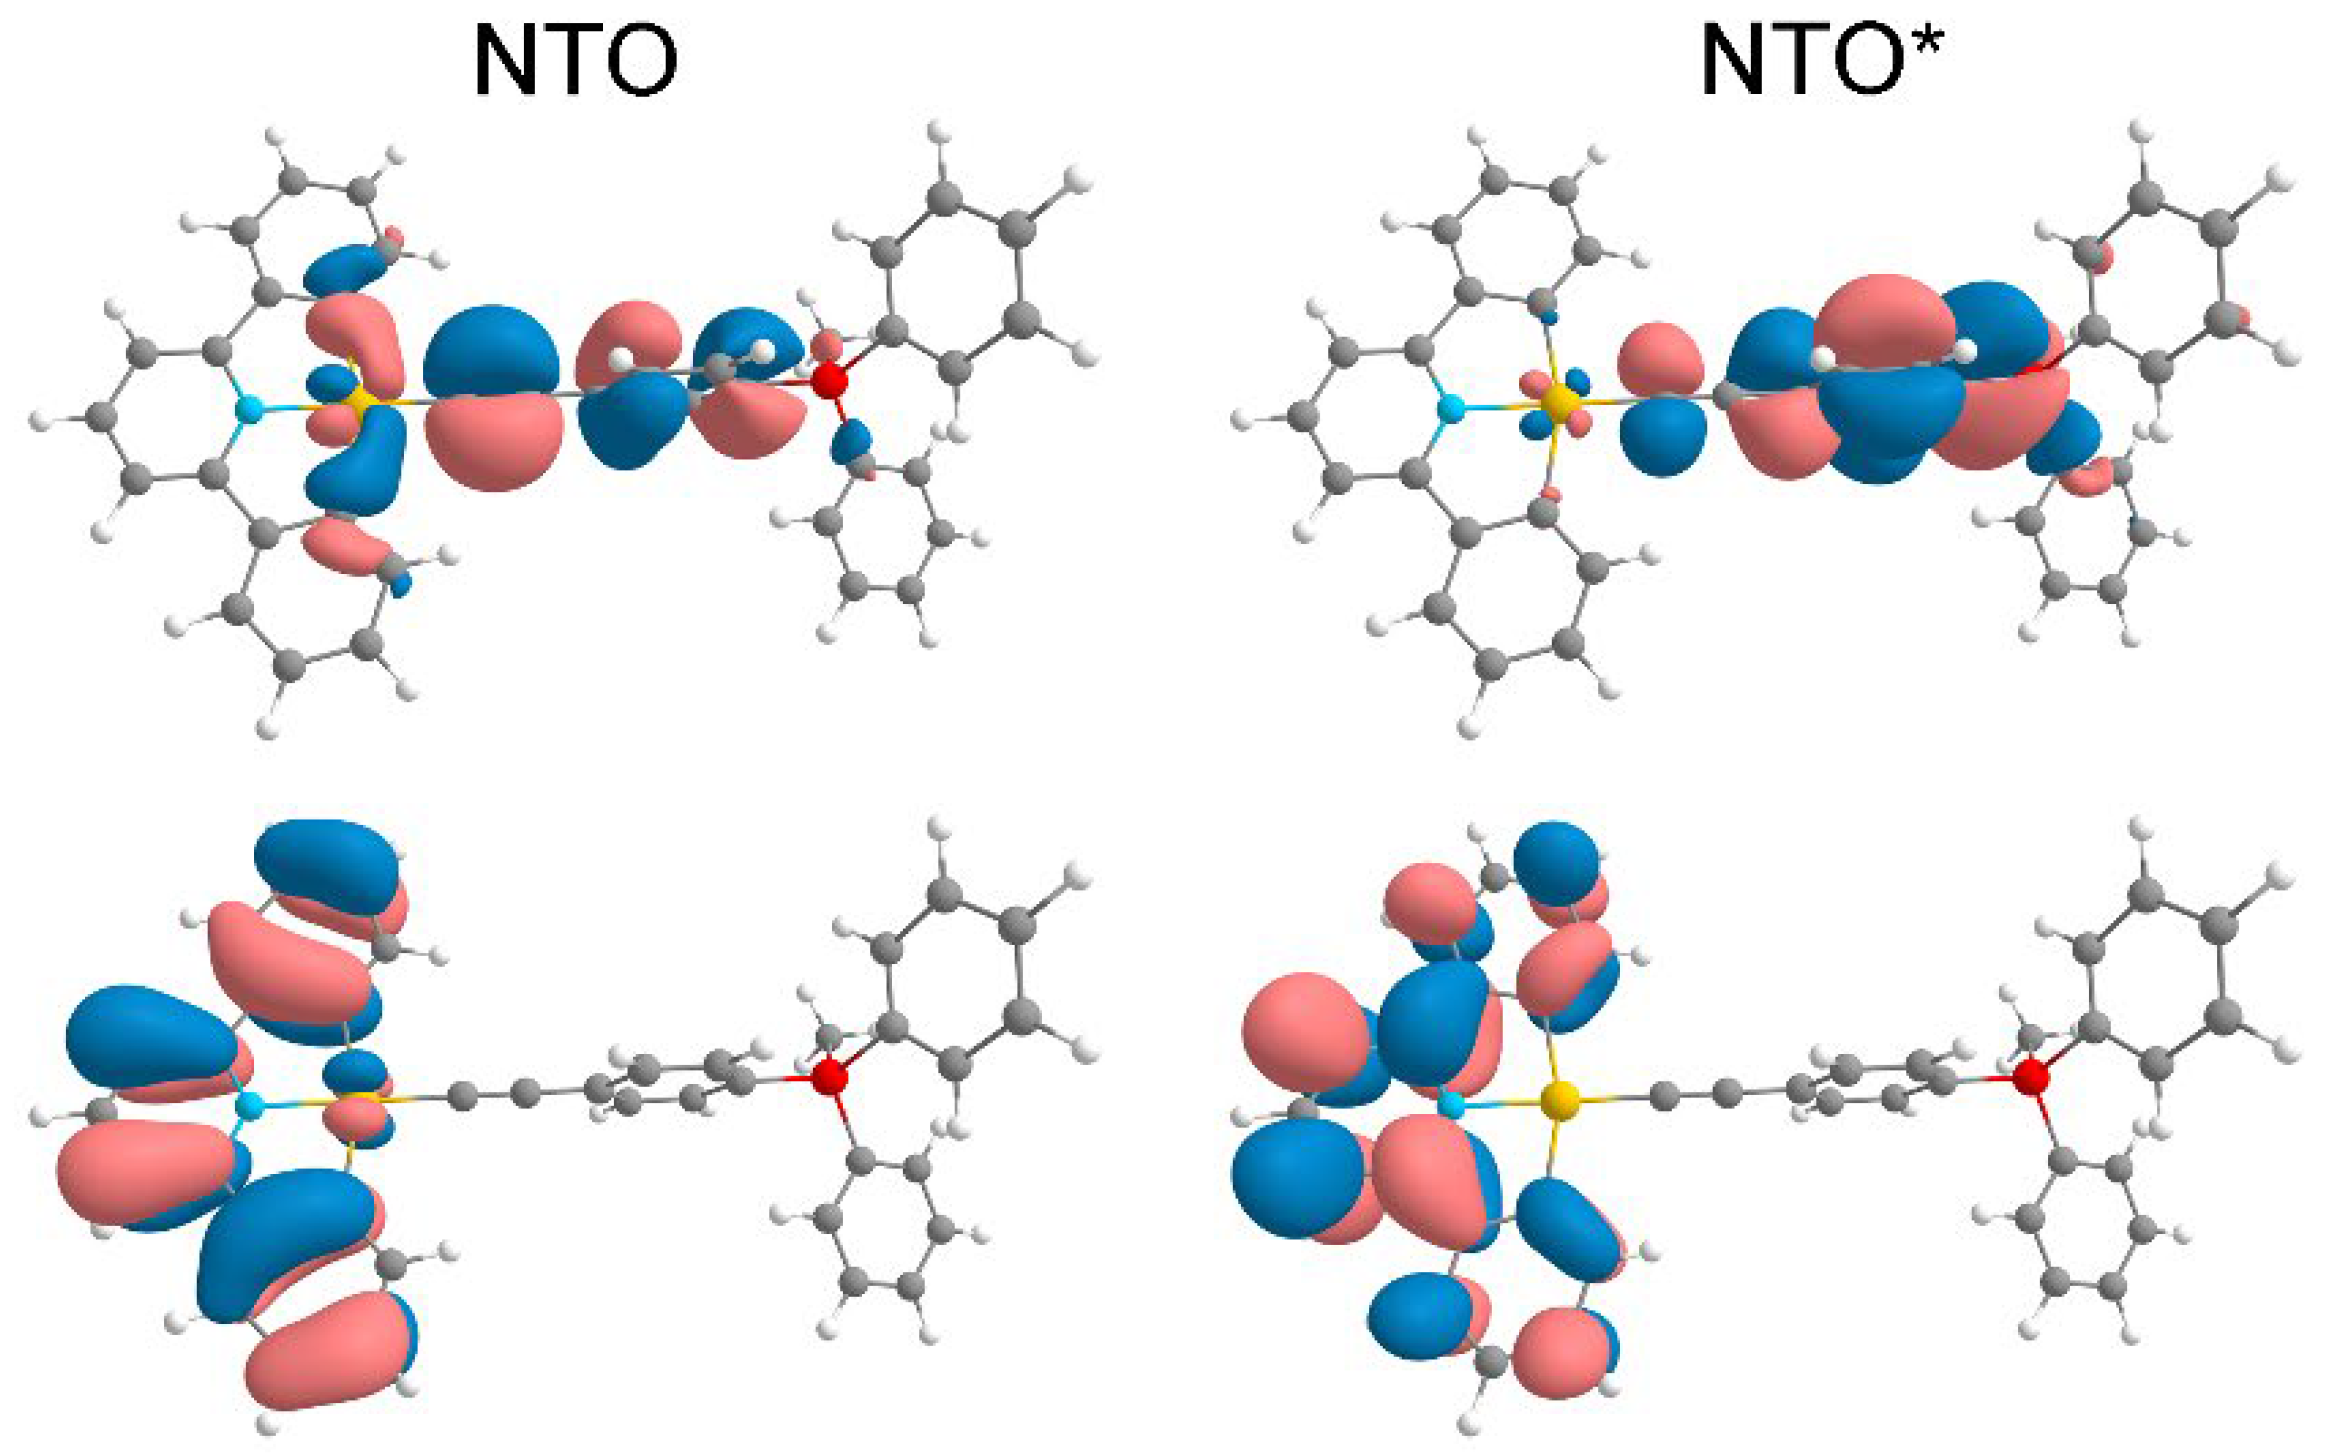
Figure 6.
Natural transition orbitals for the lowest triplet T1 of the complexes Au1 (442 nm) and Au2 (443 nm).
Figure 6.
Natural transition orbitals for the lowest triplet T1 of the complexes Au1 (442 nm) and Au2 (443 nm).
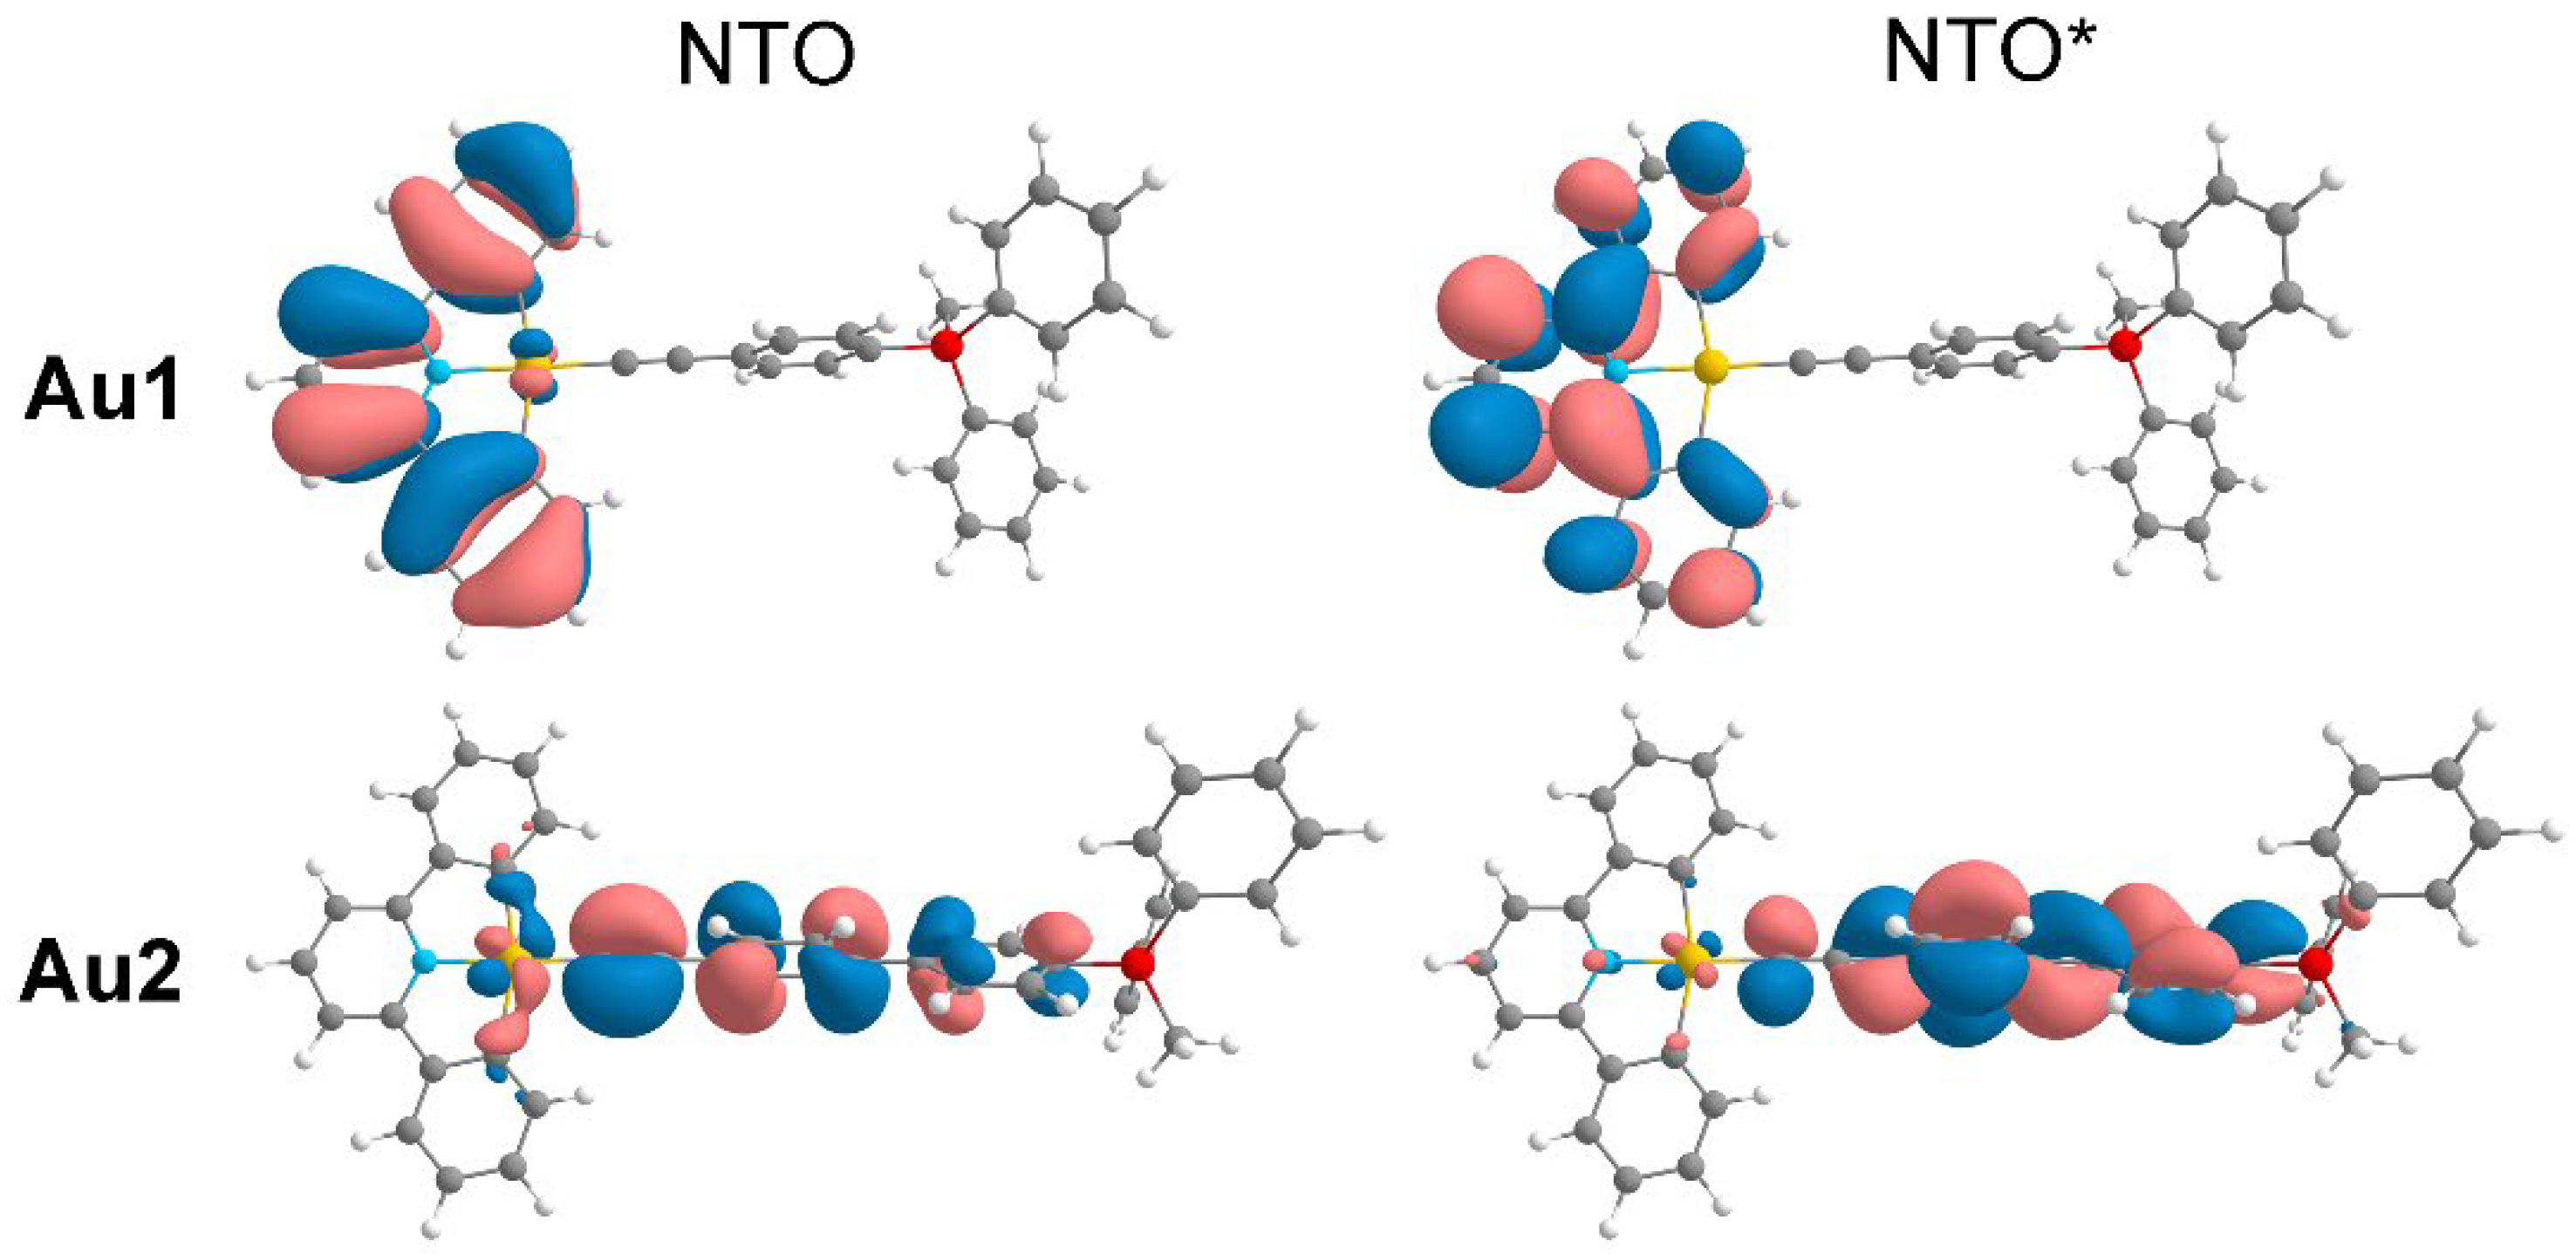
Figure 7.
Natural transition orbitals for the lowest triplet T1 of the complexes Pt1 (661 nm) and Pt2 (840 nm).
Figure 7.
Natural transition orbitals for the lowest triplet T1 of the complexes Pt1 (661 nm) and Pt2 (840 nm).
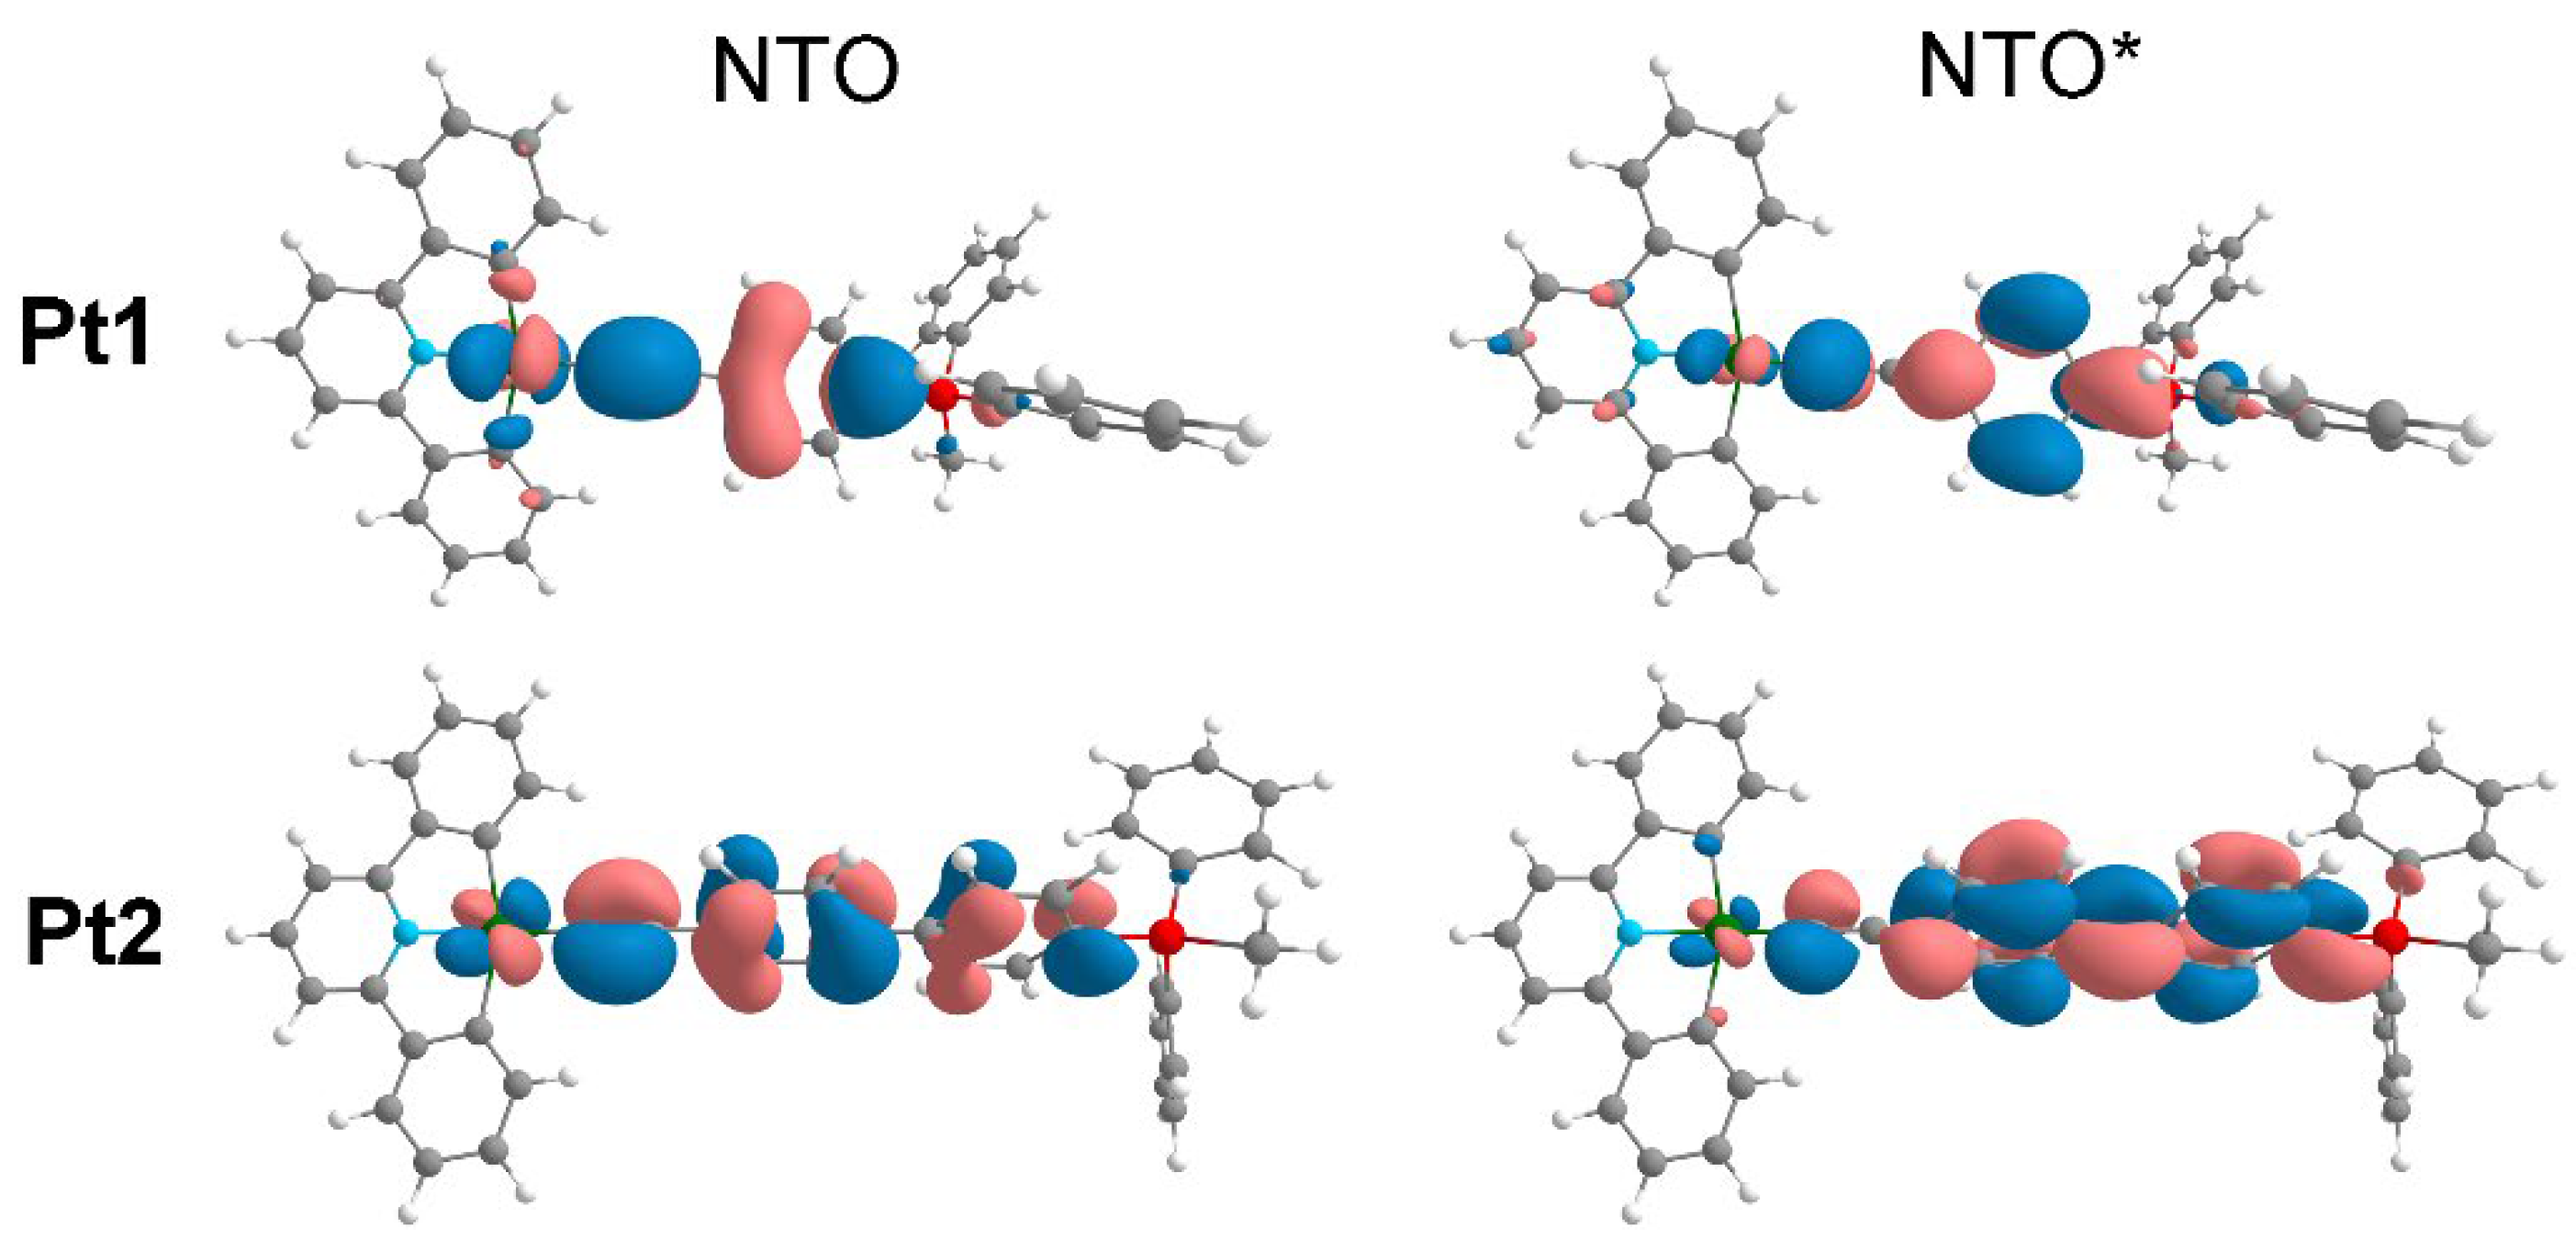

Table 1.
Optical and photophysical properties of Pt1–Pt2 and Au1–Au3 complexes.
| Complex | λabs, nm | λem,* nm | λem,* nm | τ,** ns | ||
|---|---|---|---|---|---|---|
| DMSO r.t. |
solid 77K |
solid r.t. |
DMSO r.t. |
Solid r.t. |
||
| Pt1 | 284, 332, 378, ~410, 522 | 521 | 710 | 692 | 89 (aer)147 (deg) | 2.0 |
| Pt2 | 286, 332, 381, 423, 525 | – | 700 | 680 | – | 23 |
| Au1 | 247, 276, 312, 368, 384, 403 | – | 536 | 563 | – | 55218 |
| Au2 | 250sh, 275sh, 283, 328, 381sh, 402, | – | 506 | 563 | – | 33221 |
| Au3 | 247, 278sh, 283sh, 328sh, 343, 360, 385sh, 403 | – | 587 | 538 | – | 14958 |
* λexct 365 nm. ** λexct 351 nm. Amplitude average lifetime τaver = ∑Aiτi was calculated according to published method.[22] The values of emission quantum yields for all compounds are less than 1%.
Disclaimer/Publisher’s Note: The statements, opinions and data contained in all publications are solely those of the individual author(s) and contributor(s) and not of MDPI and/or the editor(s). MDPI and/or the editor(s) disclaim responsibility for any injury to people or property resulting from any ideas, methods, instructions or products referred to in the content. |
© 2025 by the authors. Licensee MDPI, Basel, Switzerland. This article is an open access article distributed under the terms and conditions of the Creative Commons Attribution (CC BY) license (http://creativecommons.org/licenses/by/4.0/).
Copyright: This open access article is published under a Creative Commons CC BY 4.0 license, which permit the free download, distribution, and reuse, provided that the author and preprint are cited in any reuse.


