Submitted:
03 May 2025
Posted:
07 May 2025
You are already at the latest version
Abstract
Background/Objectives: Anemia and undernutrition are severe public health concerns in Ethiopia. These are the two most common nutritional disorders in pregnant women and frequently coexist. However, to our knowledge, there is little evidence of the coexistence of anemia and undernutrition among pregnant women. Therefore, this study aimed to examine the prevalence of coexisting anemia and undernutrition (CAU) and associated factors among pregnant women. Methods: A community-based cross-sectional study was conducted from June 1–25, 2024, on 515 pregnant women in the Hawela Lida district of Sidama, Ethiopia. We utilized a multi-stage sampling method to choose eligible study participants. A pre-tested and structured questionnaire was used to collect data via the online Open Data Kit mobile tool. We controlled the effect of confounders and clustering by using a multilevel mixed-effect modified Poisson regression analysis model. Results: The prevalence of CAU among pregnant women was 25.4% (95% CI: 21.9–28.9). The prevalence of CAU was associated with household food insecurity (adjusted prevalence ratio [APR]: 2.17; 95% CI: 1.43–3.28), training on model family (APR: 0.66; 95% CI: 0.45-0.96), inadequate dietary diversity (APR: 1.51; 95% CI: 1.18–1.95), and having poor knowledge of nutrition (APR: 1.55; 95% CI: 1.06-2.26) at individual levels. Low community-level women’s autonomy (APR: 6.19; 95% CI: 3.42-11.22) and community-level road accessibility (APR: 0.65; 95% CI: 0.43-0.98) were the identified determinants of CAU at the community level. Conclusions: One in four pregnant women was CAU in the study area. Household food insecurity, receiving model family training, inadequate dietary diversity, poor nutrition knowledge, low community-level women’s autonomy, and community-level road accessibility were the significant determinants of CAU. Therefore, inter-sectorial collaboration should be required to comprehensively address CAU’s determinants at different levels. Besides, any CAU prevention and intervention programs should provide model family training explicitly targeting women with poor nutritional knowledge and low autonomy in healthcare decision-making.
Keywords:
coexisting anemia and undernutrition
; pregnant women
; prevalence
; determinants
; modified poisson regression
; multilevel analysis
; dietary diversity
; food insecurity
; Sidama region
; Ethiopia
1. Introduction
Anemia is a global public health concern, affecting 36.5% of pregnant women worldwide, with particularly high prevalence in sub-Saharan Africa and Southeast Asia [1]. Similarly, 41% of pregnant women are suffering from anemia in Ethiopia, which ranges from 9% in Addis Ababa to 65.9% in the Somali region [2]. Anemia during pregnancy is linked to negative health and socioeconomic outcomes. Pregnant women who are anemic frequently experience decreased physical strength and a higher risk of maternal morbidity and mortality. For instance, severe anemia increases the risk of death by 20% [3]. Anemic pregnant mothers have a higher risk of pre-term birth, fetal anemia, low birth weight (LBW), intrauterine fetal growth restriction, decreased gestational weight gain, and perinatal death [3,4,5]. Furthermore, anemia can result in a vicious cycle where a person’s ability to work is diminished, which can have an adverse economic effect on both the individual and society [6].
The World Health Organization (WHO) designed two broad strategies to address the issues of anemia and undernutrition: nutrition-sensitive and nutrition-specific. Nutrition-specific strategies address the proximal causes of anemia, primarily inadequate dietary intake of hematopoietic nutrients such as iron or vitamin A, supplementation, and access to fortified foods. Dietary diversification is an approach designed to increase the availability, accessibility, and use of locally accessible and acceptable foods with high micronutrient content and bioavailability annually [7]. The Ethiopian government has implemented different strategies to prevent anemia and undernutrition among pregnant women, such as promoting dietary diversification and iron and folic acid supplementation, malaria prevention and treatment, utilization of bed nets, and deworming pills [8]. Also, the government has exerted considerable efforts to decrease maternal anemia and undernutrition by adopting and developing a nutrition and food strategy, program, and policy. Furthermore, the government developed the “Seqota Declaration” to guarantee year-round 100% access to sufficient food in the country by 2030 [9]. Moreover, health extension programs explicitly focusing on community-wide nutrition education are considered the most significant measures that can help promote adequate nutrition in the first 1000 days [8].
Despite all national commitments, measures, and efforts, anemia and undernutrition prevalence among pregnant women was high in the country as a whole, particularly in rural areas [2,10,11,12]. Also, there were considerable regional and urban/rural disparities in the prevalence of anemia and undernutrition at the national level [2], implying the need for further research into the landscape of anemia and undernutrition prevalence patterns in local settings. However, previous studies on the prevalence of anemia and undernutrition among pregnant women in Ethiopia focused primarily on individual-level factors, with little consideration given to community-level, household-level, and contextual factors. Furthermore, the factors contributing to anemia and undernutrition among pregnant women vary by region in Ethiopia; the prevalence of anemia and undernutrition is highly variable, and existing evidence is insufficient to develop comprehensive prevention strategies.
Undernutrition and anemia are two crucial indicators of maternal undernutrition that can impact the health of both the mother and the fetus. Maternal anemia and undernutrition are linked to an increased risk of pre-term birth, stillbirth, LBW, and neonatal deaths. If anemia and undernutrition coexist simultaneously, the risks increase [13]. Several studies have been conducted to assess anemia [14,15,16,17] and undernutrition [18,19,20,21,22,23,24] separately. However, to our knowledge, there is no evidence on the coexistence of anemia and undernutrition among pregnant women in developing countries, including Ethiopia, the effect of coexistence on pregnancy outcomes, or whether specific interventions should be targeted toward women who share this dual burden. Therefore, we aimed to assess the prevalence and determinants of coexisting anemia and undernutrition among pregnant women in the Hawela Lida district of Sidama, Ethiopia.
The result of this study helps inform program managers, policymakers, decision-makers, and implementers about designing effective and efficient prevention strategies to improve maternal nutrition status and achieve the Sustainable Development Goals (SDGs). Furthermore, this study generated results that can inform maternal health champions by providing determinants for coexisting anemia and undernutrition in the Sidama region.
2. Materials and Methods
2.1. Study Area
This study was done in the Hawela Lida district of the Sidama region, Ethiopia. Hawela Lida district is one of the 10 districts in the north zone of the Sidama region. It is located 289 kilometers away from Addis Ababa, Ethiopia’s capital city. It consisted of 11 rural and two rural kebeles, the least administrative structure in Ethiopia.
2.2. Study Design, Period, and Population
A community-based cross-sectional study was done among 515 randomly selected pregnant women from June 1–25, 2024. All pregnant women in their first trimester and randomly selected pregnant women residing in the district for at least 6 months were this study’s source and study population, respectively. Pregnant women who had severe illnesses and were temporary residents were excluded from this study.
2.3. Sample Size Calculation and Sampling Procedures
We calculated the minimum required sample size utilizing OpenEpi version 3 for this study. The sample size required to estimate the prevalence of anemia is computed by considering the anticipated prevalence of anemia (19.3%), according to the report of a previous study [10], a margin of error of 5%, a 5% level of confidence, and a design effect (DEF) of 2. The DE is calculated using the formula DEFF = 1+ (m-1)* infraclass correlation coefficient (ICC), while ‘m’ is the average number of clusters. The required number of clusters was computed by multiplying the initial sample size by the ICC value. However, previous studies did not report the ICC value to facilitate sample size replication. We received an ICC value of 0.01 to facilitate our sample size calculation from a range value based on the existing recommendation.[25].
Accordingly, the minimum number of clusters is 240 * 0.01 = 2.4. However, we included 10 kebeles (clusters) to maintain the power adequacy for this study. The sample size was corrected for the non-response rate by adding 10% of the anticipated non-response rate. Based on the above information, the final estimated sample size was 528. We used a multi-stage sampling method to recruit the study participants. The primary sampling unit was the district, and the Hawela Lida district was chosen purposefully from the Sidama region using the purposive sampling method. We purposively selected the Hawela Lida district because, immediately following this baseline study, an interventional study was implemented to investigate the effect of amaranth grain flatbread on anemia over six months. This district will provide geographic access to carefully implement, coordinate, supervise, and correct any unexpected problems near Hawassa City. The secondary sampling unit was kebeles, and 10 were selected using a simple random sampling procedure. The third sampling unit was households containing pregnant women, identified by conducting a house-to-house census in the selected kebeles. Pregnant women who were unavailable after three consecutive visits were considered non-respondents for this study. One mother was included by using a lottery sampling procedure when two or more pregnant mothers were in the chosen households.
2.4. Study Variables
The outcome variable was coexisting anemia and undernutrition. In pregnancy, anemia is defined as hemoglobin <11 g/dl and is classified into three categories based on WHO criteria: mild (10.0–10.9 g/dl), moderate (7.0–9.9 g/dl), and severe (less than 7.0 g/dl) [26]. Laboratory technologists performed hemoglobin analysis in all health posts. Each pregnant woman’s hemoglobin concentration was determined by taking a finger-prick blood sample with a HemoCue Hb 301 (HemoCue AB, Angelholm, Sweden). The site was disinfected, and a prick was conducted on the tip of the middle finger. The device used to measure hemoglobin concentration will eliminate the first drop of blood and collect the second drop to fill the micro cuvette. The cuvette holder held the microcuvette. We examined the meter’s performance daily using control standards to improve test reliability. While the meter was prepared to utilize capillary blood, the micro cuvette owner was first pulled to the loading position, and then the sample was filled continuously for the examination. Within 10 minutes of filling, it was placed in the holder and pushed into its measuring position. Finally, using WHO’s field survey recommendation techniques, the result was recorded and displayed after 15–60 seconds [27,28]. Before the data was entered, the hemoglobin level was corrected for altitude using the formula [28]. Serum ferritin and C-reactive protein were tested further in all samples with hemoglobin levels less than 11 g/dl. The Cobas 6000 e601 module from Roche (Germany) was used to analyze serum ferritin, and the Cobas 6000 c501 module was used to analyze CRP. All laboratory procedures were carried out following standard operating procedures (SOPs). In this study, pregnant women with mid-upper arm circumference (MUAC) measurements less than 23 cm were classed as undernourished, whereas those with values greater than 23 cm were classified as normal.
The independent variables are socioeconomic and demographic, such as women’s age, education status, husband’s education, and occupation status, wealth index, family size, and mass media utilization; reproductive characteristics like planned pregnancy, previous history of stillbirth, women’s age at first marriage, and previous history of stillbirth; knowledge and practice of dietary diversity; and household food security. Every detail of individual and community-level variable measurements is provided in Supplementary File S1.
2.5. Data Collection Tools and Techniques
The study tool was a standardized and pre-tested interviewer-administered questionnaire derived from similar previous research [29,30,31]. The questionnaire was initially created in English (see S2 file). This tool was translated into Sidaamu Afoo (the native language used by the locals) and then converted back to English to ensure compatibility between the two versions. A linguistic expert in English and Sidaamu Afoo translated. The principal investigator (PI) and another individual with expertise in both languages reviewed the translated study tool. At that point, the inconsistency between the two language versions was corrected based on the identified issues. Twenty data collectors and four supervisors oversaw the data-gathering technique. The PI monitored and supervised the whole data-gathering process, correcting any issues.
2.6. Blood Collection and Serum Preparation Procedures
Standard procedures were followed for blood sample collection and laboratory analyses. Phlebotomists prepared the necessary materials (alcohol swabs, sterile gloves, a tourniquet, a vacutainer needle, a vacutainer tube, and a syringe) and collected blood from each participant. They were to clean and dry the collection site, apply a tourniquet, locate the vein, and prepare the needle and tube. Participants were instructed to make a fist, and the phlebotomist inserted the needle to collect 5 ml of blood. Afterward, the needle was withdrawn, pressure was applied to the puncture site, and it was safely discarded. The phlebotomist expressed gratitude to the participants for their cooperation.
After blood collection, the hemoglobin concentration was measured in the field using a hemocue photometer (Hb 301+ System) with collected blood drops. An altitude adjustment for hemoglobin was made based on WHO standards. Serum extraction was performed within 45 minutes of sample collection at the nearby health institution to prevent hemolysis and contamination. The extracted serum samples were frozen at -20 °C and transported on dry ice to the Hawassa Referral Comprehensive Specialized Hospital for further analysis.
Serum ferritin levels were analyzed using the Elecsys 2010 analyzer, an automated clinical analyzer manufactured by Elecsys in Mannheim, Germany. The analysis utilized the enzyme-linked immunosorbent assay (ELISA) method. Additionally, a serum C-reactive protein (CPR) level, used to assess inflammation, was measured using the Cobas 6000 system, a clinical chemistry analyzer manufactured by Roche Diagnostic GmbH.
2.7. Data Quality Assurance
The PI trained the data collectors, field assistants, and field supervisors on the study tool for two days, emphasizing the significance of the research, the data collection procedure, objectives, sampling procedures, blood sample collection procedures, and ethical considerations. The data was collected using a well-designed, standardized, pre-tested, structured, face-to-face interviewer-administered. Following the pre-test, necessary adjustments were made before beginning the primary data collection procedure on the tool. The data collection procedure was strictly monitored. Data’s completeness, consistency, and accuracy were reviewed daily during data collection. The data was cleaned, coded, and exported to Stata 17 for further processing and analysis. Data collectors, field assistants, and supervisors were blinded to the exposure and outcome variables to reduce the likelihood of reporting bias. Furthermore, maximum efforts were made to reduce the bias risk by carefully selecting subjects representing the source population, increasing response, and training data collectors, field assistants, and supervisors.
2.8. Ethics Statement
This study was ethically approved by the Hawassa University College of Medicine and Health Sciences institutional review board (IRB) with the IRB/027/16 reference number. A letter of support was received from Hawassa University School of Public Health, Sidama region, Hawela Lida district, and kebeles leaders. Pregnant women provided written consent before data collection and receiving information about the study. All data collection techniques were carried out strictly and confidentially. No specific personal identifiers were collected, and only researchers had access to data that may identify individual respondents during or after data collection. Furthermore, pregnant women who showed severe anemia and undernutrition during the survey were transferred to a neighboring healthcare facility for additional assessment and treatment.
2.9. Data Analysis Techniques
Before the main analyses, quantitative variables were processed through recoding, computations, and categorization. Descriptive analyses were performed to obtain measures for key variables of interest, such as frequency, percentage, mean, and standard deviation (SD). For this research, the wealth index was computed using Principal Component analytic (PCA) [32], and the S1 File contains information on variable preparation and analytic processes.
We estimated the intra-class correlation coefficient (ICC) utilizing a multilevel logistic regression intercept-only model [33,34]. The computed ICC value was more significant than 5%, which is one reason to use the multilevel regression analysis for this research. Bivariable and multivariable analyses were performed using multilevel mixed effects modified Poisson regression models with robust standard error to control the impacts of clusters and known confounders. Variables having p-values < 0.25 on the bivariable analysis and practical significance backed by relevant literature were built-in in a multivariable regression model to identify determinants independently related to CAU, controlling for other variables in the model [35].
We constructed multilevel models to account for the effects of clustering and the hierarchical structure of our data. Thus, four models were evaluated for this research. Model 1 was empty or intercept-only, whereas Model 2 contained only individual-level determinants, Model 3 contained only community-level determinants, and Model 4 consisted of individual and community-level determinants. The ICC value and median prevalence ratio (MPR) were used to evaluate the random model data [36]. The MPR is a predictor of the unexplained kebeles-level heterogeneity, while the ICC value was utilized to characterize the percentage of variability in the prevalence of undernutrition attributable to the clustering variable (kebele). The MPR predicts unexplained kebeles-level heterogeneity, whereas the ICC value characterizes the fraction of variability in the prevalence of CAU due to the clustering variable (kebele). The MPR was calculated using the formula , and is defined as the mean of the prevalence ratio between the areas with the highest and lowest risk of CAU prevalence when two areas are randomly selected [37,38].
This study examined effect modification and multicollinearity. The variance inflation factor (VIF) < 5 indicated that multicollinearity had little impact on the study’s results [39]. The S1 File contains detailed information about the effect modification findings.
The strength and presence of a statistically significant association between CAU and the independent factors were determined using APRs with a 95% confidence interval and a 5% significance level. A statistically significant association between CAU and the independent factors was confirmed when the 95% confidence intervals of the APRs did not contain one or had a P-value less than 0.05.
3. Results
3.1. Socio-Demographic Characteristics of Research Subject
We properly interviewed 515 pregnant women out of 528, resulting in a response rate of 97.53% for this study. The study participants’ mean (+ SD) age was 25.89 (+ 4.53) years. Almost all 486 (94.4%) study participants were of Sidama ethnicity. Most research participants, 438 (85.2%), identified as Protestant Christians. Nearly all pregnant women were married, with 511 (99.2%) and 468 (90.9%) housewives, respectively.
3.2. Study Participants’ Reproductive Health Characteristics
Study participants’ mean age of first marriage (+ SD) was 21.01 + 3.10 years. 81 (15.7%) women have previously had an abortion, and 93 (18.1%) have experienced an infection during their present pregnancy. Similarly, 49 (9.5%) and 28 (5.4%) women have had a history of stillbirths and neonatal deaths, respectively.
3.3. Prevalence of Coexisting Anemia and Undernutrition
The overall prevalence of CAU was 25.4% (95% CI: 21.9-28.9) (Figure 1). The prevalence of anemia among pregnant women was 42.9% (95% CI: 38.4-47.6), while undernutrition was 41.7% (95% CI: 37.3-45.6).
Similarly, 15.5, 19.2, and 8.2% of study participants had mild, moderate, and severe anemia, respectively (Figure 2).
3.4. Determinants of Coexisting Anemia and Undernutrition
Pregnant women who had obtained model family training from health extension workers had a 34% higher likelihood of CAU than their counterparts (APR = 0.66; 95% CI: 0.45-0.96). Compared to women with adequate dietary diversity, pregnant women’s inadequate dietary diversity increased the likelihood of CAU prevalence (APR = 2.17; 95% CI: 1.43-3.28). Pregnant women in the food-insecure household had 51% more CAU prevalence than those in the food-secure household (APR = 1.51; 95% CI: 1.18-1.95). Women with poor nutrition knowledge had a higher prevalence of CAU than their counterparts (APR = 1.55; 95% CI: 1.06-2.26). While the community-level road access decreased the likelihood of CAU prevalence (APR = 0.65; 95% CI: 0.43–0.98) as compared to the community-level road inaccessibility, the likelihood of CAU prevalence was 6.19 times higher for pregnant women who lived in high community-level women autonomy (APR = 6.19; 95% CI: 3.42–11.22) as compared to women who lived in low community-level women autonomy (Table 1).
3.3. Random Effect Model and Model Fitness Information on CAU Prevalence
Our study revealed that the multilevel modified Poisson regression model fit better than the standard Poisson regression model (p < 0.001). According to the ICC value, involvement with kebeles explained 27.23% of the disparity in the prevalence of CAU among pregnant women. When two participants were randomly picked from different residential areas, the MPR value revealed that residual heterogeneity between the areas was related to 2.20 times the individual probability of having CAU. The final model revealed that the heterogeneity in CAU prevalence between residential areas remained statistically significant even after accounting for all potential contributing factors.
The CAU model fitness evaluation test showed that the empty model (AIC = 590.21, BIC = 598.70, and log-likelihood = -293.10) was the least fit. However, the models’ fitness increased dramatically, particularly the final model (AIC = 474.30, BIC = 512.50, and log-likelihood = -228.15). As a result, compared to the previous models, the final model fits the data well (Table 2).
4. Discussion
The prevalence of CAU among pregnant women was 25.4%. Inadequate dietary diversity, poor knowledge of nutrition, food-insecure status, training on model families, community-level women’s autonomy, and road inaccessibility were determinants of CAU among pregnant women.
The prevalence of undernutrition among pregnant women was 25.4%. There has been no previous publication on the prevalence of CAU and its determinants in Ethiopia or other African nations, limiting the comparability of our findings.
The significant association between pregnant mothers’ inadequate dietary diversity and CAU prevalence may be explained by the fact that women who consume a diverse diet obtain a wider range of nutrients, making their overall nutrient intake higher than mothers with lower dietary diversity scores. Furthermore, this could be because women do not consume extra meals during pregnancy, and maternal dietary habits, socio-cultural beliefs, and food taboos can all affect nutrition during pregnancy. Preventing malnutrition in all forms, before and during pregnancy, depends on appropriate nutrition practices, essential nutrition services, and healthy diets. Thus, all prenatal care must equip pregnant women with dietary teaching and counseling, which should be expanded. Furthermore, the researchers contended that this could be expressed as follows: Eating a diverse diet is vital for obtaining all the nutrients required to prevent undernutrition caused by nutritional deficiencies. [40].
This research found that the training on model families decreased the prevalence of CAU. The possible rationale is as follows: women who have received model family training from health extension workers tend to have good knowledge of nutrition during pregnancy and lactation or nutrition benefits during the first 1000 days, a positive attitude toward nutritious diets, and avoiding food taboos, health-seeking behavior, and information on the benefits of dietary diversity practices.
The positive relationship between household food insecurity and CAU prevalence may be because a lack of food in the household leads to insufficient daily nutrient intake, resulting in undernutrition in pregnant women. Researchers also claimed that one of the primary underlying causes of undernutrition is household food insecurity, which occurs when a household does not always have physical, social, or financial access to enough food to meet its nutritional needs for a healthy life. Women tend to consume less than men, which could be attributed to the limited food availability. Furthermore, the women used coping methods to reduce their food intake while nourishing their small children and newborns during a food shortage. As a result, improving community food security for homes is critical to avoiding and eliminating acute undernutrition and its negative long-term consequences [41].
Poor nutritional knowledge among pregnant women was associated with an increased prevalence of CAU, possibly because a limited understanding of nutrition often leads to inadequate dietary intake and, consequently, undernutrition. Furthermore, women with nutrition knowledge may better perceive the benefits of eating a healthy and appropriate diet during their pregnancy and be prepared to adopt it.
This study documented that high community-level women’s autonomy decreased the prevalence of CAU. Communities with significant women’s autonomy had higher knowledge about nutrition and health-seeking behavior. Autonomous mothers are more educated and financially independent, have more job opportunities, and understand the importance of adequate dietary diversity. Another factor might be that literate populations utilize more community-level mass media, which may increase community discussion about maternal health issues. According to the WHO report, mothers who reside in affluent communities may have been exposed to more mass media, which has increased their awareness and knowledge of nutrition and appropriate dietary diversification practices [42]. The research results in low-income nations further support this idea [43,44].
The prevalence of CAU increased for pregnant women who lived in poor, road-accessible communities. One possible rationale is that community-level road inaccessibility reduces access to fundamental services such as health and education. Researchers also highlighted Ethiopia’s geographic difference in health services [45,46,47]. Another reason might be that healthcare providers give less attention to screening and linking undernutrition pregnant women from road inaccessible places, which contributed to the high prevalence of CAU in settings with low road accessibility.
5. Conclusions
One in four pregnant women was CAU in the study setting. Inadequate dietary diversity, poor knowledge of nutrition, food-insecure status, training on model families, community-level women’s autonomy, and road inaccessibility were determinants of CAU among pregnant women. Thus, any programs related to maternal nutritional improvement strategies should address these determinants to decrease the high prevalence of CAU. Likewise, particularly intervention approaches should be considered for pregnant women with poor knowledge of nutrition, pregnant women who have not obtained training in a model family, and pregnant mothers who have inadequate dietary diversity. Moreover, there is a significant level of food insecurity in the research area, which adds to the high rate of CAU among pregnant women. Designing and enhancing the promotion of food security policies based on Ethiopian national directives and WHO guidelines is a thoughtful demand. Furthermore, there is an urgent need for nutritional screening for women living in poor, road-accessible areas to circumvent the high prevalence of CAU. Finally, reforms for women’s autonomy-raising communities with low women’s autonomy with the help of rural health extension workers must be considered.
Supplementary Materials
The following supporting information can be downloaded at the website of this paper posted on Preprints.org. S1 File: Detailed information of some methods and result section; S2 File: English version study questionnaire; S3 File: data set
Author Contributions
Data curation, AY; Formal analysis, AY; Investigation, AY, FGG, IAO, LM, MB; Methodology, AY, FGG, IAO, LM, MB, GM; Project administration, AY, FGG, IAO, LM, MB, GM; Resources, AY; Software, AY, FGG, IAO, LM, MB, GM; Supervision, AY, FGG, IAO, LM, MB, GM; Validation, AY, FGG, IAO, LM, MB, GM; Visualization, AY, FGG, IAO, LM, MB, GM; Writing – original draft, AY, FGG, IAO, LM, MB, GM; Writing – review & editing, AY, FGG, IAO, LM, MB, GM. All authors have read and agreed to the published version of the manuscript.
Funding
This research was funded by the Nestle Foundation with grant number NFHUC/0212/2024.
Institutional Review Board Statement
This study was ethically approved by the Hawassa University College of Medicine and Health Sciences institutional review board (IRB) with the IRB/027/16 reference number.
Informed Consent Statement
Pregnant women provided written consent before data collection and receiving information about the study
Data Availability Statement
Data is available in the supplementary file S3 file
Acknowledgments
We thank the Nestle Foundation for their financial support. This study would not be possible without their financial assistance. We are also thankful to the Sidama region, Hawela Lida district health office, study subjects, data collectors, field assistants, and supervisors for their direct contributions to the study’s successful completion. Finally, we thank the Hawassa University School of Public Health team for their invaluable help during the study’s design and data analysis.
Conflicts of Interest
The authors declare no conflicts of interest.
Abbreviations
The following abbreviations are used in this manuscript:
| AIC | Akaike information criteria |
| APR | Adjusted prevalence ratio; |
| BIC | Bayesian information criteria |
| CI | Confidence interval; |
| CPR | Crude prevalence ratio |
| EDHS | Ethiopian Demographic and Health Survey |
| FANTA | Food and nutrition technical assistance |
| FAO | Food and agriculture organization |
| HCPs | Health Care Providers |
| HEW | Health extension worker |
| ICC | Intra-class correlation coefficient |
| IRB | Institutional review board |
| IUGR | Intrauterine growth retardation |
| MPR | Median prevalence ratio |
| NGO | Non-governmental organization |
| PI | Principal Investigator |
| SD | Standard deviation |
| VIF | Variance inflation factor |
| WHO | World Health Organization |
| WRA | Women of reproductive age |
References
- World Health Organization (2021) Anemia in women and children. Available online from https://www.who.int/data/gho/data/themes/topics/anaemia_in_women_and_children. (accessed on May 3, 2025).
- “CSAC (2017) [Ethiopia] and ICF,” Ethiopia Mini Demographic and Health Survey: Key Indicators Report: Addis Ababa, Ethiopia, and Rockville, CSA and ICF, Maryland, USA.
- Derso T, Abera Z, Tariku A. Magnitude and associated factors of anemia among pregnant women in Dera District: a cross-sectional study in northwest Ethiopia. BMC Res Notes. 2017 Aug 1;10(1):359. [CrossRef]
- Haggaz AD, Radi EA, Adam I. Anaemia and low birthweight in western Sudan. Trans R Soc Trop Med Hyg. 2010 Mar;104(3):234-6. [CrossRef]
- Kidanto HL, Mogren I, Lindmark G, Massawe S, Nystrom L. Risks for preterm delivery and low birth weight are independently increased by severity of maternal anaemia. S Afr Med J. 2009 Feb;99(2):98-102. PMID: 19418670.
- Moench-Pfanner R, Silo S, Laillou A, Wieringa F, Hong R, Hong R, Poirot E, Bagriansky J. The Economic Burden of Malnutrition in Pregnant Women and Children under 5 Years of Age in Cambodia. Nutrients. 2016 May 14;8(5):292. [CrossRef]
- World Health Organization (2017) Nutritional anaemias: tools for effective prevention and control Geneva: World Health Organization. https://apps.who.int/iris/handle/10665/259425. (accessed on May 3, 2025).
- MoFED Health Sector Growth and Transformation Plan (GTP) 2010/11-2014/15. The Federal Democratic Republic of Ethiopia, 2010. Available on https://extranet.who.int/countryplanningcycles/sites/default/files/planning_cycle_repository/ethiopia/ethiopia_gtp_2010-2015.pdf (accessed on May 3, 2025).
- Federal Democratic Republic of Ethiopia National Nutrition Program Multi-sectoral Implementation Guide. Addis Ababa: 2016. http://dataverse.nipn.ephi.gov.et/bitstream/handle/123456789/1029/NNP%20multisectoral%20guideline.pdf?sequence=1 (accessed on May 3, 2025).
- Dessalegn, F. N.; Taye, W.; Wordofa, D. Prevalence of Iron Deficiency Anemia and Associated Factors among Pregnant Women Attending Antenatal Care Follow-up at Dodola General Hospital, West Arsi Zone, Oromia Region, South East Ethiopia. Arch. Med. 2021, 13 (8), 40. https://www.itmedicalteam.pl/articles/prevalence-of-iron-deficiency-anemia-and-associated-factors-among-pregnant-women-attending-antenatal-care-follow-up-at-dodola-gene.pdf (accessed on May 3, 2025).
- Laelago, F., Paulos, W., & Halala Handiso, Y. (2023). Prevalence and predictors of iron deficiency anemia among pregnant women in Bolosso Bomibe district, Wolaita Zone, Southern Ethiopia Community-based cross-sectional study. Cogent Public Health, 10(1). [CrossRef]
- Woldegebriel AG, Gebregziabiher Gebrehiwot G, Aregay Desta A, Fenta Ajemu K, Berhe AA, Woldearegay TW, Mamo Bezabih N. Determinants of Anemia in Pregnancy: Findings from the Ethiopian Health and Demographic Survey. Anemia. 2020 Jun 5;2020:2902498. [CrossRef]
- Patel A, Prakash AA, Das PK, Gupta S, Pusdekar YV, Hibberd PL. Maternal anemia and underweight as determinants of pregnancy outcomes: cohort study in eastern rural Maharashtra, India. BMJ Open. 2018 Aug 8;8(8):e021623. [CrossRef]
- Deriba, B. S.; Bala, E. T.; Bulto, G. A.; Geleta, T. A.; Ayalew, A. F.; Gebru, A. A.; Desta, H. O.; Shiferaew, M. B.; Sahile, L. Z. Determinants of Anemia among Pregnant Women at Public Hospitals in West Shewa, Central Ethiopia: A Case-Control Study. Anemia 2020, 2020, 2865734, 9 pp. [CrossRef]
- Addis Alene K, Mohamed Dohe A. Prevalence of Anemia and Associated Factors among Pregnant Women in an Urban Area of Eastern Ethiopia. Anemia. 2014;2014:561567. [CrossRef]
- Bekele A, Tilahun M, Mekuria A. Prevalence of Anemia and Its Associated Factors among Pregnant Women Attending Antenatal Care in Health Institutions of Arba Minch Town, Gamo Gofa Zone, Ethiopia: A Cross-Sectional Study. Anemia. 2016;2016:1073192. [CrossRef]
- Teshome MS, Meskel DH, Wondafrash B. Determinants of Anemia Among Pregnant Women Attending Antenatal Care Clinic at Public Health Facilities in Kacha Birra District, Southern Ethiopia. J Multidiscip Healthc. 2020 Sep 24;13:1007-1015. [CrossRef]
- Lesage J, Hahn D, Léonhardt M, Blondeau B, Bréant B, Dupouy JP. Maternal undernutrition during late gestation-induced intrauterine growth restriction in the rat is associated with impaired placental GLUT3 expression, but does not correlate with endogenous corticosterone levels. J Endocrinol. 2002 Jul;174(1):37-43. [CrossRef]
- Muze M, Yesse M, Kedir S, Mustefa A. Prevalence and associated factors of undernutrition among pregnant women visiting ANC clinics in Silte zone, Southern Ethiopia. BMC Pregnancy Childbirth. 2020 Nov 19;20(1):707. [CrossRef]
- Nigatu M, Gebrehiwot TT, Gemeda DH. Household food insecurity, low dietary diversity, and early marriage were predictors for undernutrition among pregnant women residing in Gambella, Ethiopia. Adv Public Health. 2018;2018:1350195. [CrossRef]
- Shiferaw A, Husein G (2019) Acute Under Nutrition and Associated Factors among Pregnant Women in Gumay District, Jimma Zone, South West Ethiopia. J Women's Health Care 8:459. [CrossRef]
- Tadesse A, Hailu D, Bosha T. Nutritional status and associated factors among pastoralist children aged 6–23 months in Benna Tsemay Woreda, South Omo Zone, Southern Ethiopia. Int J Nutr Food Sci. 2017;7(1):11–23. [CrossRef]
- Tikuye HH, Gebremedhin S, Mesfin A, Whiting S. Prevalence and Factors Associated with Undernutrition among Exclusively Breastfeeding Women in Arba Minch Zuria District, Southern Ethiopia: A Cross-sectional Community-Based Study. Ethiop J Health Sci. 2019 Jan;29(1):913-922. [CrossRef]
- Zewdie S, Fage SG, Tura AK, Weldegebreal F. Undernutrition among Pregnant Women in Rural Communities in Southern Ethiopia. Int J Womens Health. 2021 Jan 8;13:73-79. [CrossRef]
- Donner A, Birkett N, Buck C. Randomization by cluster. Sample size requirements and analysis. Am J Epidemiol. 1981 Dec;114(6):906-14. [CrossRef]
- Obai G, Odongo P, Wanyama R. Prevalence of anaemia and associated risk factors among pregnant women attending antenatal care in Gulu and Hoima Regional Hospitals in Uganda: A cross sectional study. BMC Pregnancy Childbirth. 2016 Apr 11;16:76. [CrossRef]
- Bull BS; National Committee for Clinical Laboratory Standards. Reference and selected procedures for the quantitative determination of hemoglobin in blood: approved standard. 2nd ed. Villanova (PA): National Committee for Clinical Laboratory Standards; 1994.
- World Health Organization. Haemoglobin concentrations for the diagnosis of anaemia and assessment of severity. Vitamin and mineral nutrition information system. Document reference WHO. NMH/NHD/MNM/11.1 https://www.who.int/publications/i/item/WHO-NMH-NHD-MNM-11.1 (accessed on May 3, 2025).
- World Health Organization (2015) Improving nutrition outcomes with better water, sanitation and hygiene: practical solutions for policies and programmes. https://www.who.int/publications/i/item/9789241565103 (accessed on May 3, 2025).
- Alem M, Enawgaw B, Gelaw A, Kena T, Seid M, Olkeba Y. Prevalence of anemia and associated risk factors among pregnant women attending antenatal care in Azezo Health Center Gondar town, Northwest Ethiopia. J Interdiscipl Histopathol. 2013 Jun 1;1(3):137-44. [CrossRef]
- Getachew M, Yewhalaw D, Tafess K, Getachew Y, Zeynudin A. Anaemia and associated risk factors among pregnant women in Gilgel Gibe dam area, Southwest Ethiopia. Parasit Vectors. 2012 Dec 17;5:296. [CrossRef]
- Gwatkin DR. Health inequalities and the health of the poor: what do we know? What can we do? Bull World Health Organ. 2000;78(1):3-18. PMID: 10686729; https://pmc.ncbi.nlm.nih.gov/articles/PMC2560590/pdf/10686729.pdf (accessed on May 3, 2025).
- Tabachnick BG, Fidell LS, Ullman JB (2007) Using multivariate statistics: Pearson Boston, MA.
- Kleiman E (2017) Understanding and analyzing multilevel data from real-time monitoring studies: An easily-accessible tutorial using R.
- Hosmer DW LS (2000) Applied Logistic Regression. New York: Wiley.
- Koo TK, Li MY. A Guideline of Selecting and Reporting Intraclass Correlation Coefficients for Reliability Research. J Chiropr Med. 2016 Jun;15(2):155-63. doi: 10.1016/j.jcm.2016.02.012. Epub 2016 Mar 31. Erratum in: J Chiropr Med. 2017 Dec;16(4):346. [CrossRef]
- Gebeyehu FG, Geremew BM, Belew AK, Zemene MA. Number of antenatal care visits and associated factors among reproductive age women in Sub-Saharan Africa using recent demographic and health survey data from 2008-2019: A multilevel negative binomial regression model. PLOS Glob Public Health. 2022 Dec 27;2(12):e0001180. [CrossRef]
- Merlo J, Chaix B, Ohlsson H, Beckman A, Johnell K, Hjerpe P, Råstam L, Larsen K. A brief conceptual tutorial of multilevel analysis in social epidemiology: using measures of clustering in multilevel logistic regression to investigate contextual phenomena. J Epidemiol Community Health. 2006 Apr;60(4):290-7. [CrossRef]
- Senaviratna NAMR, & A. Cooray, T. M. J, (2019) Diagnosing Multicollinearity of Logistic Regression Model. Asian Journal of Probability and Statistics, 5(2), 1-9. [CrossRef]
- Lee SE, Talegawkar SA, Merialdi M, Caulfield LE. Dietary intakes of women during pregnancy in low- and middle-income countries. Public Health Nutr. 2013 Aug;16(8):1340-53. [CrossRef]
- Adem HA, Usso AA, Hebo HJ, Workicho A, Ahmed F. Determinants of acute undernutrition among pregnant women attending primary healthcare unit in Chinaksen District, Eastern Ethiopia: a case-control study. PeerJ. 2023 Jun 5;11:e15416. [CrossRef]
- World Health Organization. Nutrition in Adolescence –Issues and Challenges for the Health Sector. Available online from https://iris.who.int/bitstream/handle/10665/43342/92;jsessionid=268FA3727B4187B66A6232E6FC093BD5?sequence=1 Accessed on August 20, 2024.
- Sserwanja Q, Mutisya LM, Musaba MW. Exposure to different types of mass media and timing of antenatal care initiation: insights from the 2016 Uganda Demographic and Health Survey. BMC Womens Health. 2022 Jan 11;22(1):10. [CrossRef]
- Shah N, Zaheer S, Safdar NF, Turk T, Hashmi S. Women's awareness, knowledge, attitudes, and behaviours towards nutrition and health in Pakistan: Evaluation of kitchen gardens nutrition program. PLoS One. 2023 Sep 14;18(9):e0291245. [CrossRef]
- Kraemer K, Cordaro J, Fanzo J, Gibney M, Kennedy E, et al. (2016) The economic causes of malnutrition. Good nutrition: Perspectives for the 21st century: Karger Publishers. pp. 92-104.
- Ver Ploeg M, Breneman V, Dutko P, Williams R, Snyder S, Dicken C, et al. Access to affordable and nutritious food: updated estimates of distance to supermarkets using 2010 data. Economic Research Report No. 262227. Washington (DC): United States Department of Agriculture, Economic Research Service; 2012. [CrossRef]
- French SA, Tangney CC, Crane MM, Wang Y, Appelhans BM. Nutrition quality of food purchases varies by household income: the SHoPPER study. BMC Public Health. 2019 Feb 26;19(1):231. [CrossRef]
- Zegeye K, Gezahegn A, Melese T. The role of geographical access in the utilization of institutional delivery service in rural Jimma Horro District, Southwest Ethiopia. Prim Health Care. 2014;4:150. [CrossRef]
- Ahmed R, Sultan M, Abose S, Assefa B, Nuramo A, Alemu A, Demelash M, Eanga S, Mosa H. Levels and associated factors of the maternal healthcare continuum in Hadiya zone, Southern Ethiopia: A multilevel analysis. PLoS One. 2022 Oct 10;17(10):e0275752. [CrossRef]
- Singh P, Singh KK, Singh P. Maternal health care service utilization among young married women in India, 1992-2016: trends and determinants. BMC Pregnancy Childbirth. 2021 Feb 10;21(1):122. [CrossRef]
- Fatema K. Impact of mass media on the utilization of maternal healthcare services in South Asia [dissertation]. Memphis (TN): University of Memphis; 2019. Available from: https://digitalcommons.memphis.edu/etd/2031 (accessed on May 3, 2025).
- Ethiopian Public Health Institute (EPHI), ICF. Ethiopia mini demographic and health survey 2019: key indicators. Rockville (MD): EPHI and ICF; 2019. Available from: https://www.unicef.org/ethiopia/media/1721/file/The%202019%20Ethiopia%20Mini%20Demographic%20and%20Health%20Survey%20.pdf. (accessed on May 3, 2025).
- Shudura E, Yoseph A, Tamiso A. Utilization and predictors of maternal health care services among women of reproductive age in Hawassa University Health and Demographic Surveillance System site, South Ethiopia: a cross-sectional study. Adv Public Health. 2020;2020:5865928. [CrossRef]
- Asefa A, Gebremedhin S, Messele T, Letamo Y, Shibru E, Alano A, Morgan A, Kermode M. Mismatch between antenatal care attendance and institutional delivery in south Ethiopia: A multilevel analysis. BMJ Open. 2019 Mar 20;9(3):e024783. [CrossRef]
- Kennedy G, Ballard T, Dop M. Guidelines for measuring household and individual dietary diversity. Rome: Food and Agriculture Organization of the United Nations; 2011. Available from: https://www.fao.org/4/i1983e/i1983e00.pdf (accessed May 3, 2025).
- Coates, J.; Swindale, A.; Bilinsky, P. Household Food Insecurity Access Scale (HFIAS) for Measurement of Household Food Access: Indicator Guide (v. 3) [Online]; FHI 360/FANTA: Washington, DC, 2007. Available online: https://www.fantaproject.org/sites/default/files/resources/HFIAS_ENG_v3_Aug07.pdf (accessed on 3 May 2025).
- Negash WD, Fetene SM, Shewarega ES, Fentie EA, Asmamaw DB, Teklu RE, Aragaw FM, Belay DG, Alemu TG, Eshetu HB. Multilevel analysis of quality of antenatal care and associated factors among pregnant women in Ethiopia: a community based cross-sectional study. BMJ Open. 2022 Jul 28;12(7):e063426. [CrossRef]
- Huda TM, Chowdhury M, El Arifeen S, Dibley MJ. Individual and community level factors associated with health facility delivery: A cross sectional multilevel analysis in Bangladesh. PLoS One. 2019 Feb 13;14(2):e0211113. [CrossRef]
- Liyew AM, Teshale AB. Individual and community level factors associated with anemia among lactating mothers in Ethiopia using data from Ethiopian demographic and health survey, 2016; a multilevel analysis. BMC Public Health. 2020 May 24;20(1):775. [CrossRef]
- Tessema ZT, Animut Y. Spatial distribution and determinants of an optimal ANC visit among pregnant women in Ethiopia: further analysis of 2016 Ethiopia demographic health survey. BMC Pregnancy Childbirth. 2020 Mar 4;20(1):137. [CrossRef]
- Chaka EE (2022) Multilevel analysis of continuation of maternal healthcare services utilization and its associated factors in Ethiopia: A cross-sectional study. PLOS Glob Public Health 2(5): e0000517. [CrossRef]
- Zegeye B, Olorunsaiye CZ, Ahinkorah BO, Ameyaw EK, Budu E, Seidu AA, Yaya S. Individual/Household and Community-Level Factors Associated with Child Marriage in Mali: Evidence from Demographic and Health Survey. Biomed Res Int. 2021 Jun 22;2021:5529375. [CrossRef]
- Vyas S, Kumaranayake L. Constructing socio-economic status indices: how to use principal components analysis. Health Policy Plan. 2006 Nov;21(6):459-68. [CrossRef]
- Fry K. FR, Chakraborty N.M, (2014) Measuring Equity with Nationally Representative Wealth Quintiles. Washington, DC: PSI. . Available online from https://media.psi.org/wp-content/uploads/2020/02/31012157/Wealth-Quintile-Guide.pdf (accessed on May 3, 2025).
- Lindsey, A. E. Principal Component Analysis [Online]; SlidePlayer. https://slideplayer.com/slide/4238108/ (accessed May 3, 2025).
Figure 1.
Prevalence of coexisting anemia and undernutrition among pregnant women in the Hawela Lida district of Sidama region, Ethiopia, 2024
Figure 1.
Prevalence of coexisting anemia and undernutrition among pregnant women in the Hawela Lida district of Sidama region, Ethiopia, 2024
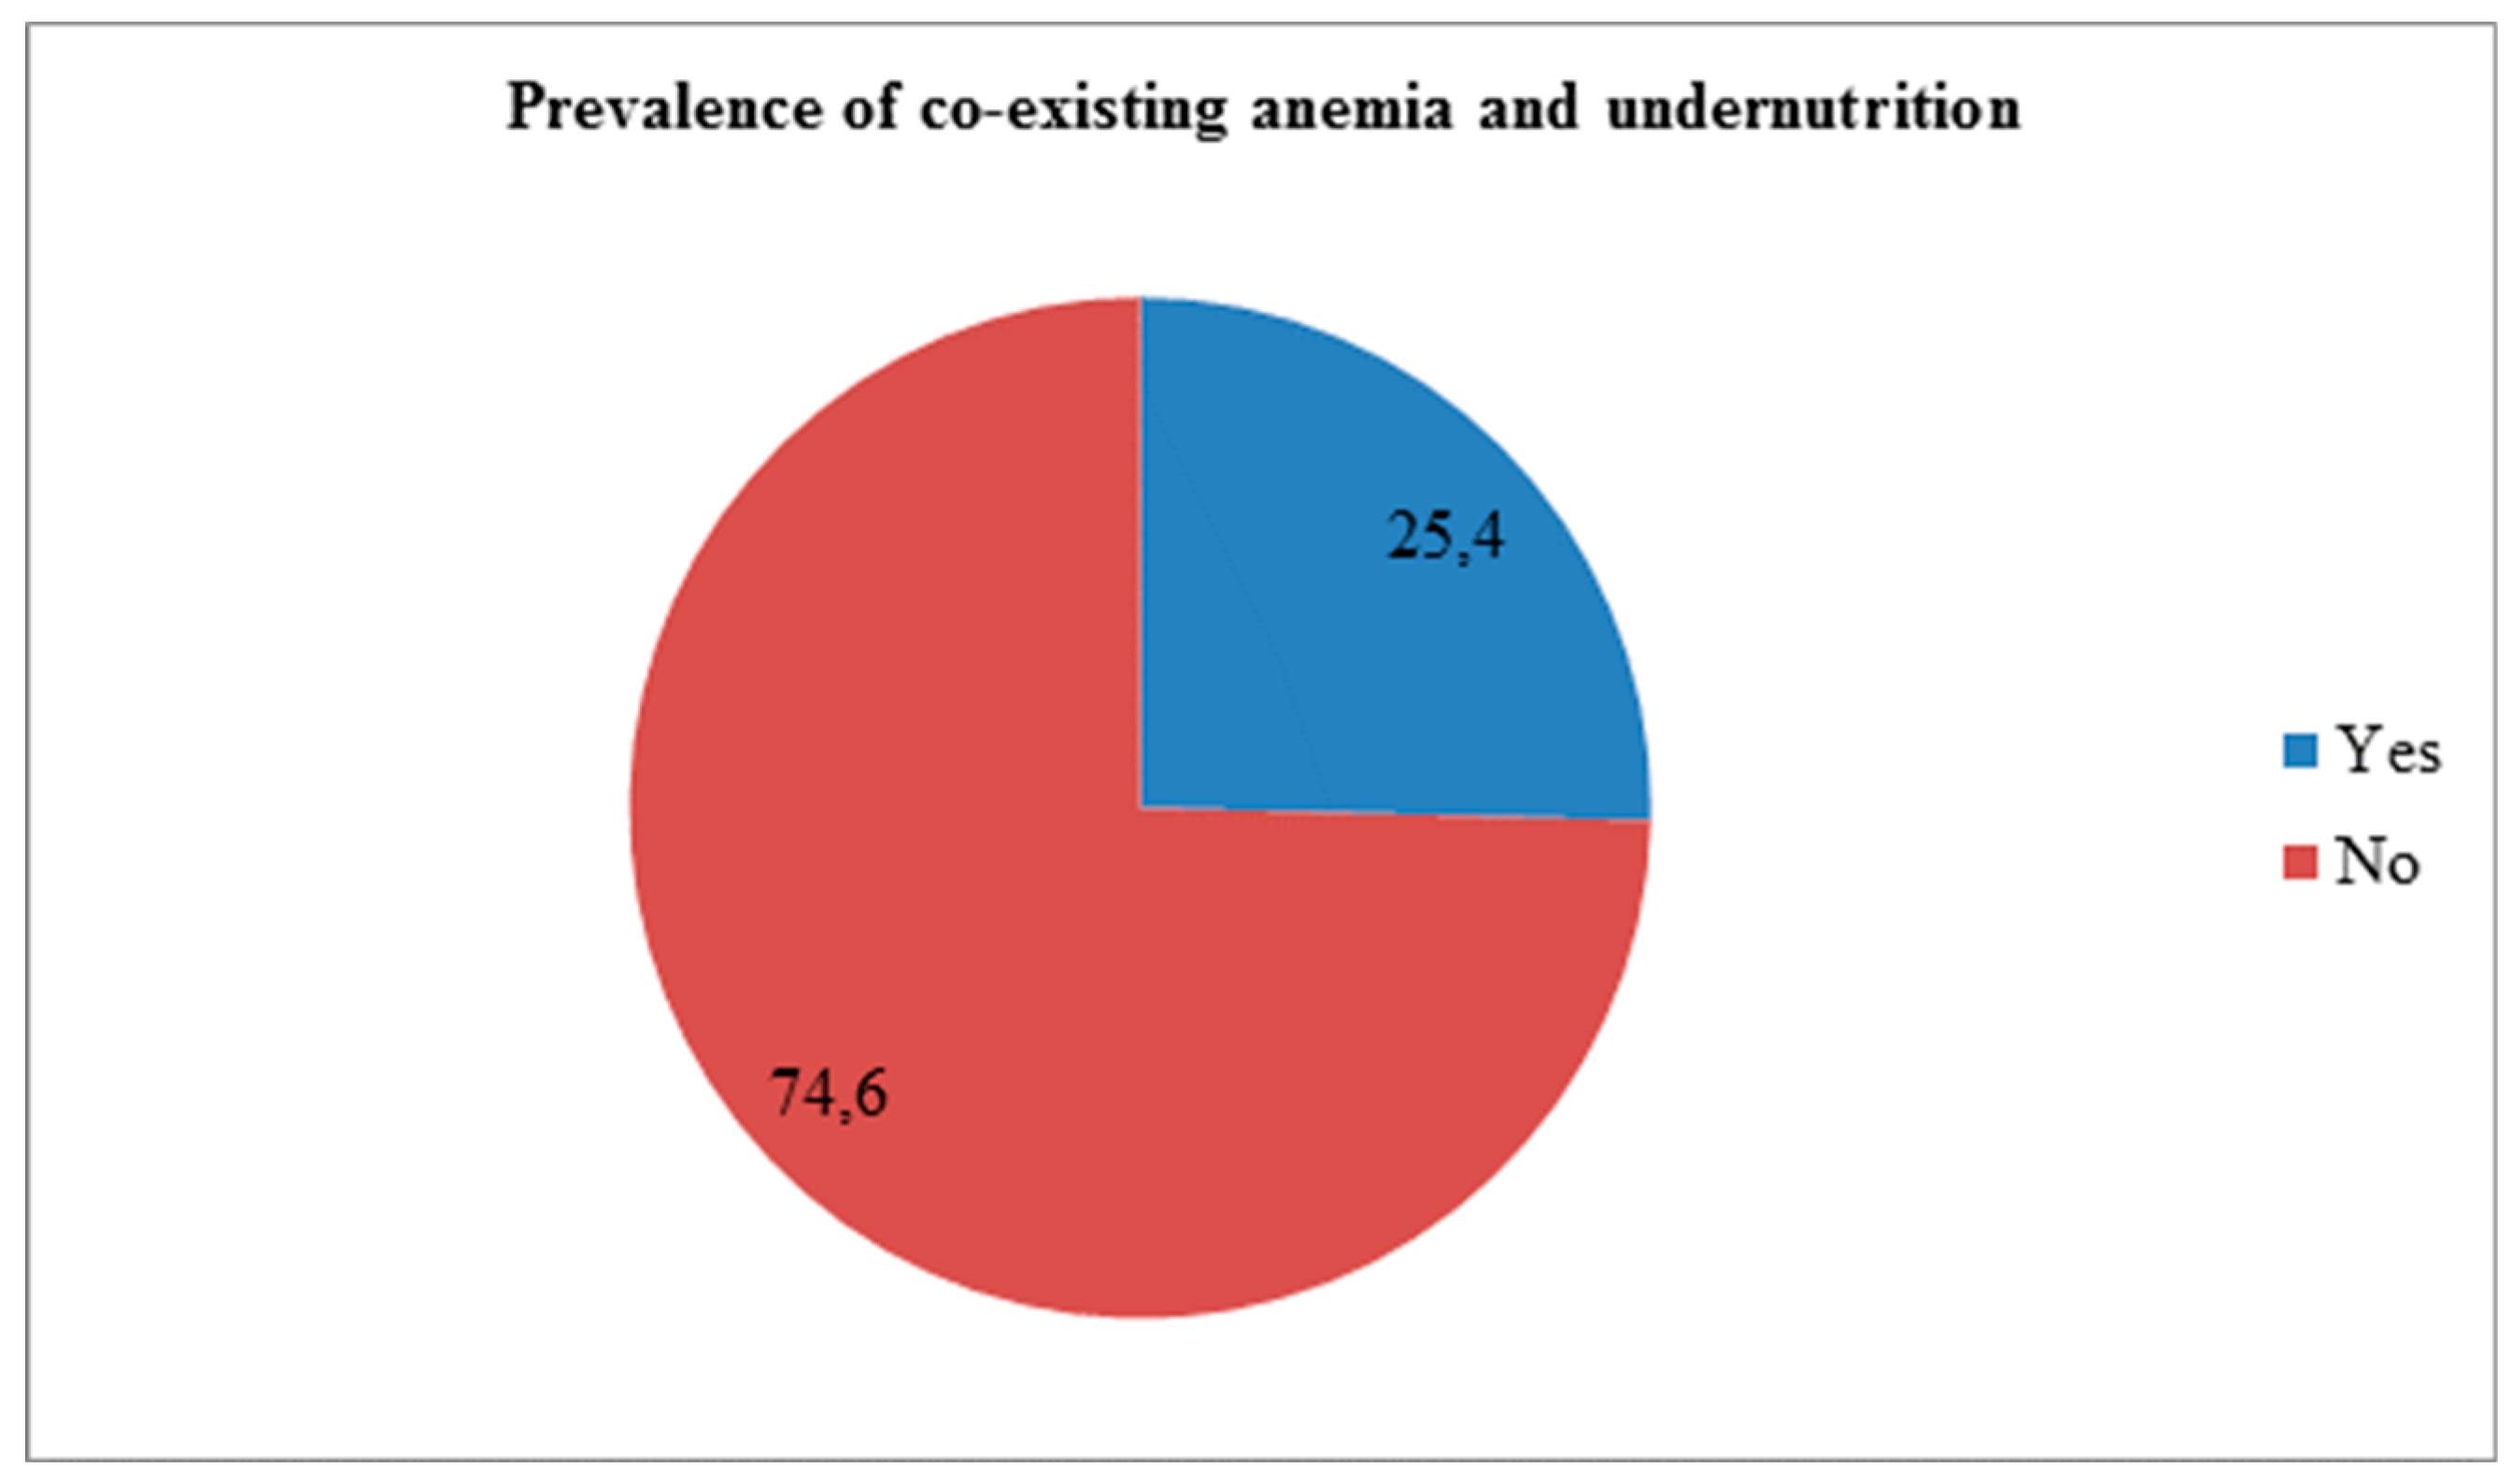
Figure 2.
Prevalence of anemia among pregnant women in the Hawela Lida district of Sidama region, Ethiopia, 2024.
Figure 2.
Prevalence of anemia among pregnant women in the Hawela Lida district of Sidama region, Ethiopia, 2024.
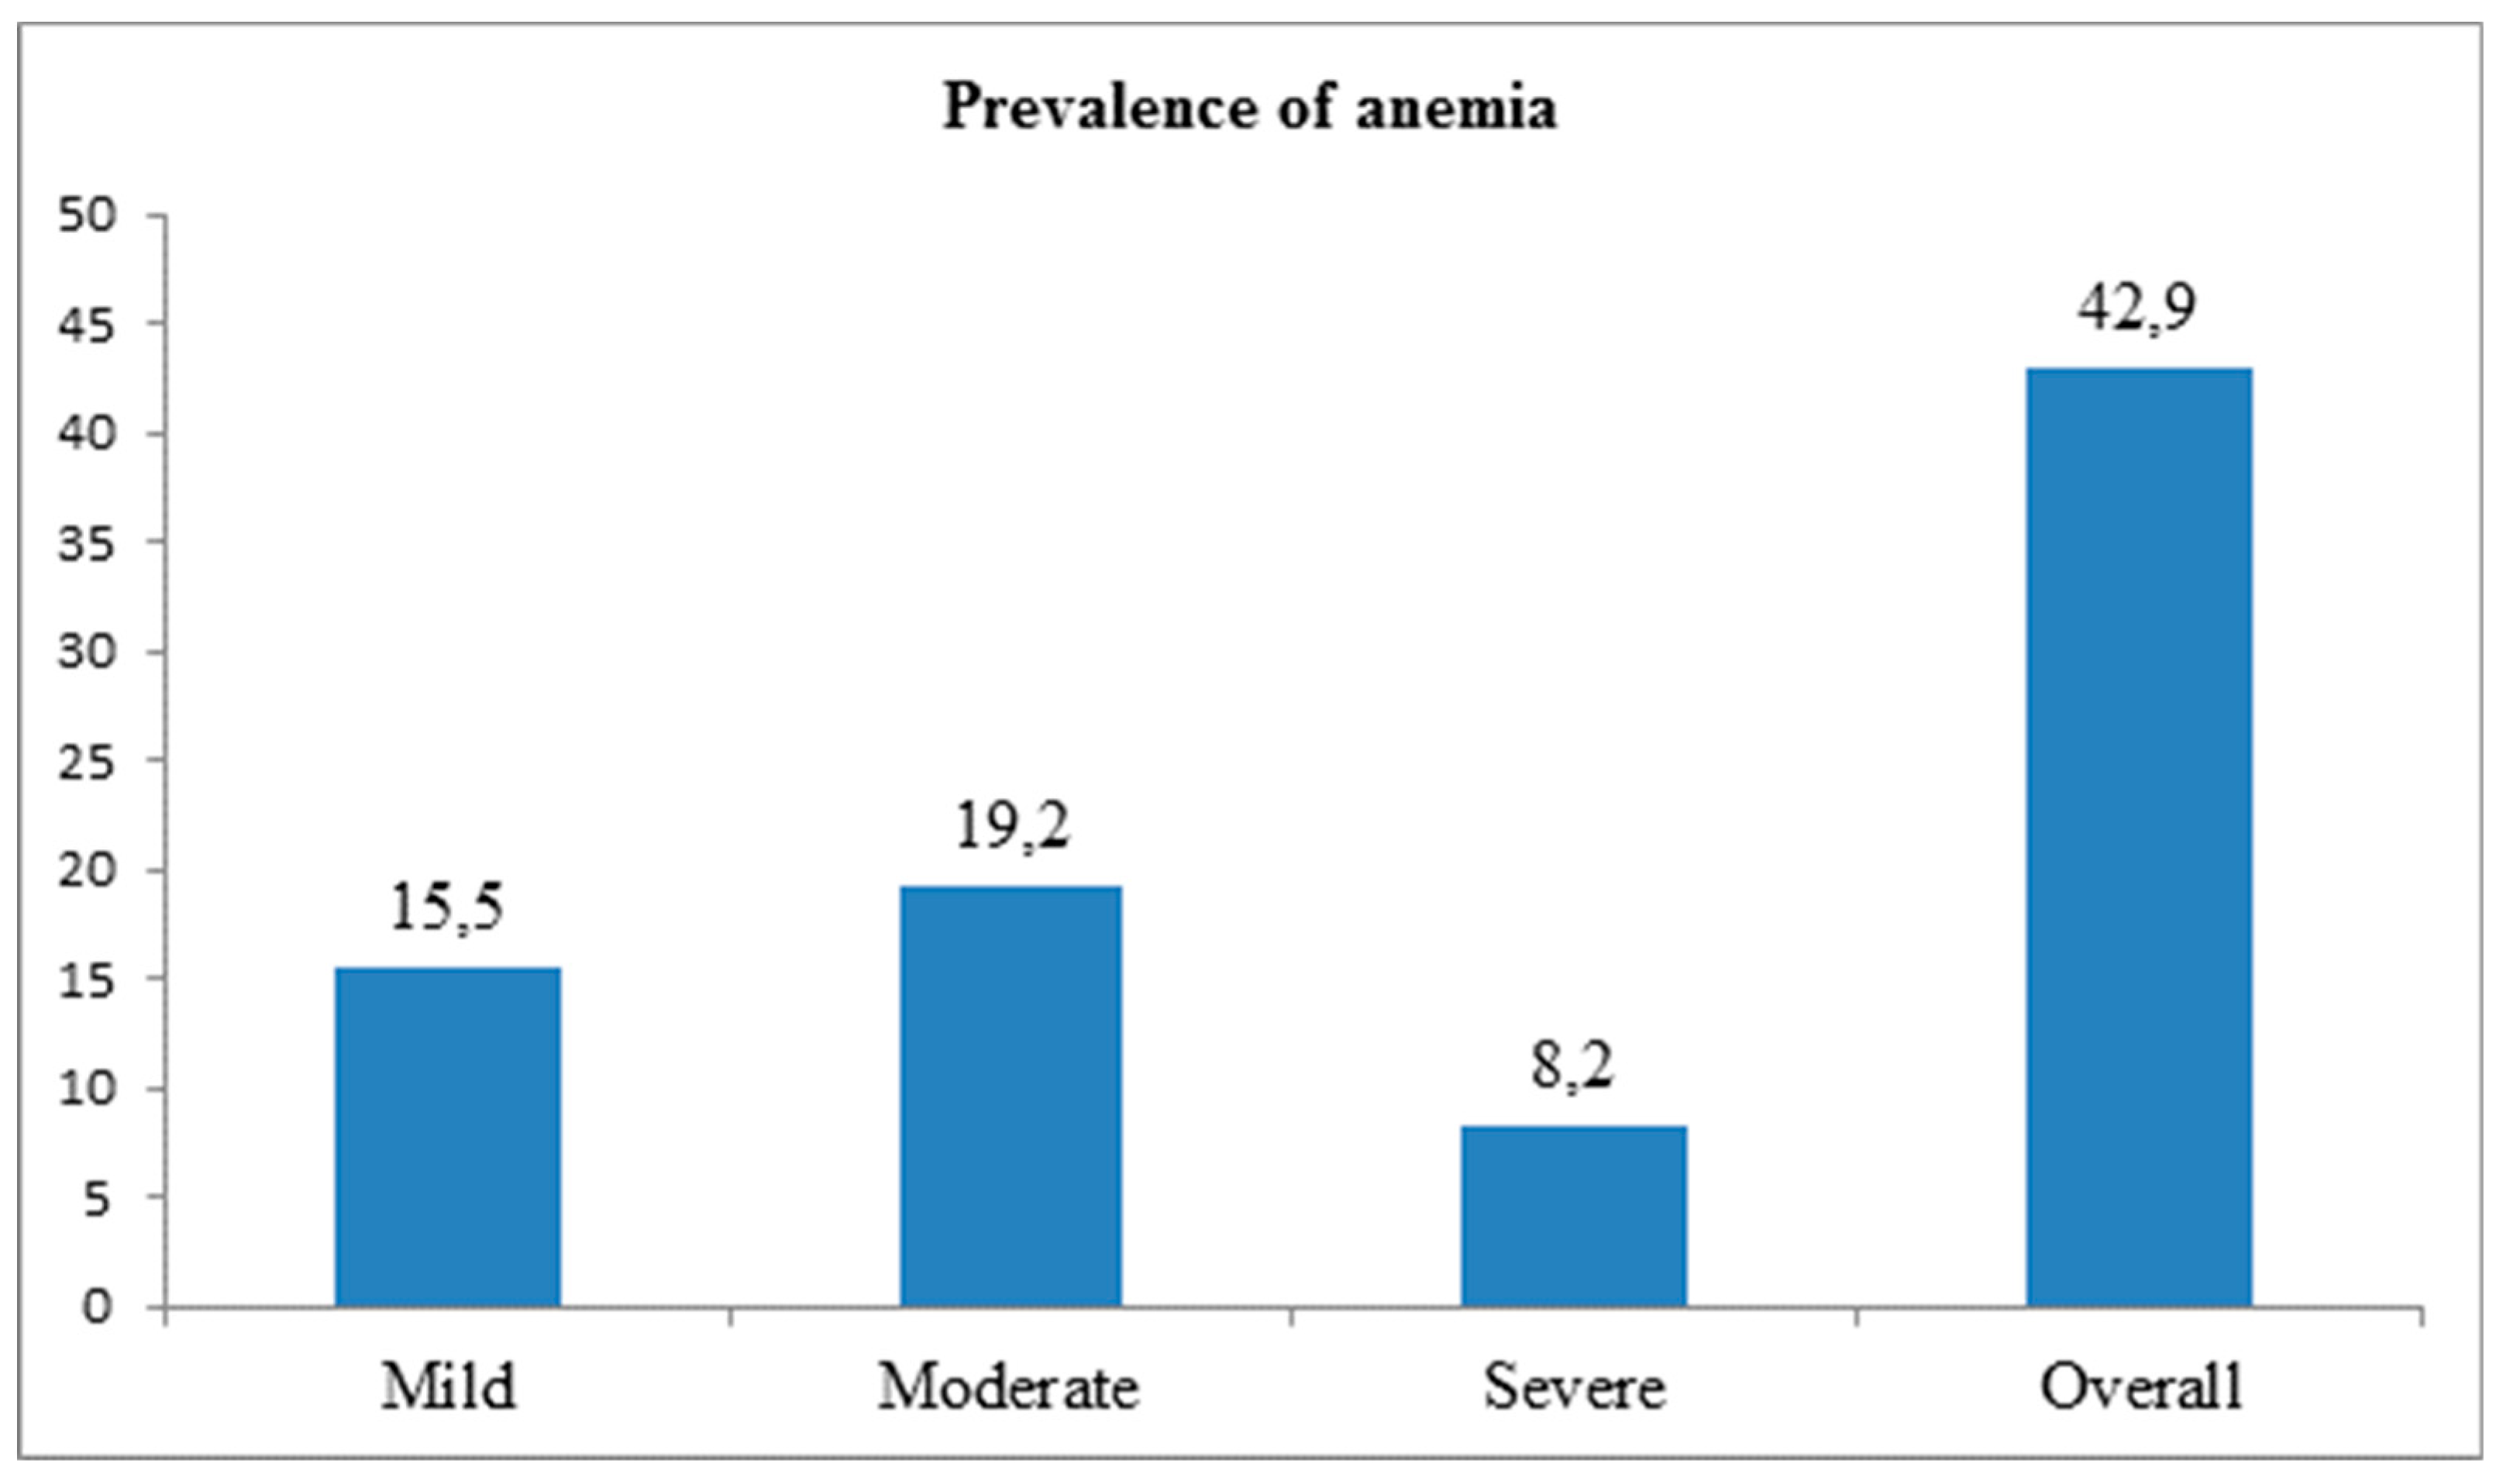

Table 1.
Determinants of Coexisting Anemia and Undernutrition (CAU) among pregnant women in the Hawela Lida district of Sidama region, Ethiopia, 2024
Table 1.
Determinants of Coexisting Anemia and Undernutrition (CAU) among pregnant women in the Hawela Lida district of Sidama region, Ethiopia, 2024
| Variables | Nutritional status | CPR (99% CI) | APR (99% CI) | |
|---|---|---|---|---|
| Under-nutrition | Normal | |||
| Individual level determinants | ||||
| Women’s education | ||||
| Have formal education | 80 (23.2) | 265 (76.8) | Ref | Ref |
| No formal education | 51 (30.0) | 119 (70.0) | 1.14 (0.85, 1.54) | 0.87 (0.75, 1.01) |
| Family size | ||||
| Small | 97 (23.9) | 309 (76.1) | Ref | Ref |
| Large | 34 (31.2) | 75 (68.8) | 1.12 (0.83, 1.50) | 0.92 (0.64, 1.31) |
| Women’s occupation status | ||||
| Housewife | 113 (24.4) | 350 (75.4) | Ref | |
| Merchant | 11 (36.7) | 19 (63.3) | 0.99 (0.55, 1.77) | 0.98 (0.59, 1.62) |
| Government employee | 7 (31.8) | 15 (68.2) | 0.73 (0.19, 2.78) | 0.78 (0.31, 1.95) |
| Decision-making power of women | ||||
| Autonomous | 66 (20.9) | 250 (79.1) | Ref | Ref |
| Non-autonomous | 65 (32.7) | 134 (67.3) | 2.26 (0.89, 5.78) | 1.37 (0.41, 4.54) |
| Model family training | ||||
| Not obtained | 45 (29.8) | 106 (70.2) | Ref | Ref |
| Obtained | 86 (23.6) | 278 (76.4) | 0.63 (0.37, 1.06) | 0.66 (0.45, 0.96)* |
| Food security status | ||||
| Secured households | 46 (14.4) | 274 (85.6) | Ref | Ref |
| Insecure households | 85 (43.6) | 110 (56.4) | 2.89 (1.50, 5.57) | 2.17 (1.43, 3.28)** |
| Dietary diversity status | ||||
| Adequate | 39 (15.9) | 206 (84.1) | Ref | Ref |
| Inadequate | 92 (34.1) | 178 (65.9) | 1.91 (1.50, 2.42) | 1.51 (1.18, 1.95)** |
| Women’s knowledge about nutrition | ||||
| Good | 36 (13.6) | 228 (86.4) | Ref | Ref |
| Poor | 95 (37.8) | 156 (62.2) | 2.40 (1.59, 3.61) | 1.55 (1.06, 2.26)* |
| Women’s attitude towards nutrition | ||||
| Positive | 92 (26.7) | 252 (73.3) | Ref | Ref |
| Negative | 39 (22.8) | 132 (77.2) | 0.87 (0.50, 1.52) | 0.78 (0.30, 2.01) |
| Community-level determinants | ||||
| Place of residence | ||||
| Urban | 10 (11.0) | 81 (89.0) | Ref | Ref |
| Rural | 121 (28.5) | 303 (71.5) | 3.13 (0.36, 26.95) | 3.53 (0.33, 37.40) |
| Community-level wealth status | ||||
| High | 50 (16.4) | 255 (83.6) | Ref | Ref |
| Low | 81 (38.6) | 129 (61.4) | 1. 68 (0.67, 4.17) | 1.25 (0.76, 2.06) |
| Community-level distance | ||||
| Not big problem | 77 (23.6) | 249 (76.4) | Ref | Ref |
| Big problem | 54 (28.6) | 135 (71.4) | 0.96 (0.45, 2.06) | 0.78 (0.30, 2.02) |
| Community-level literacy | ||||
| High | 13 (8.8) | 134 (91.2) | Ref | Ref |
| Low | 118 (32.1) | 250 (67.9) | 4.28 (0.83, 21.98) | 2.16 (0.49, 9.54) |
| Community-level road access | ||||
| Inaccessible | 18 (36.0) | 32 (64.0) | Ref | Ref |
| Accessible | 113 (24.3) | 352 (75.7) | 0.73 (0.45, 1.17) | 0.65 (0.43, 0.98)* |
| Community-level autonomy | ||||
| High | 16 (8.2) | 178 (91.8) | Ref | Ref |
| Low | 115 (35.8) | 206 (64.2) | 7.75 (3.52, 17.05) | 6.19 (3.42,11.22)** |
* APR: adjusted prevalence ratio; *: significant association (p < 0.05); **: highly significant association (p <0.01); CI: confidence interval; CPR: crude prevalence ratio; Ref: reference group. .
Table 2.
Multilevel Modified Poisson regression analysis result of model selection criteria and random effect model information.
Table 2.
Multilevel Modified Poisson regression analysis result of model selection criteria and random effect model information.
| Measure of variation | Model 0 (95% CI) | Model 1 (95% CI) | Model 2 (95% CI) | Model 3 (95% CI) |
|---|---|---|---|---|
| Variance of intercept | 0.69 (0.16, 3.02) | 0.58 (0.08, 3.92) | 0.57 (0.20, 1.58) | 0.49 (0.14, 1.73) |
| ICC percentage | 27.23 (10.49-54.40) | |||
| MPR | 2.20 (1.46 -5.21) | 1.95 (1.42, 3.49) | ||
| Model fitness | ||||
| Log-likelihood ratio | -293.10 | -257.72 | -245.67 | -228.15 |
| AIC | 590.21 | 533.45 | 505.35 | 474.30 |
| BIC | 598.70 | 571.64 | 535.06 | 512.50 |
MPR: Median prevalence ratio and ICC: Intra-class correlation coefficient; AIC: Akaike information criteria; BIC: Bayesian information criteria; CI: confidence interval 3.1. Subsection.
Disclaimer/Publisher’s Note: The statements, opinions and data contained in all publications are solely those of the individual author(s) and contributor(s) and not of MDPI and/or the editor(s). MDPI and/or the editor(s) disclaim responsibility for any injury to people or property resulting from any ideas, methods, instructions or products referred to in the content. |
© 2025 by the authors. Licensee MDPI, Basel, Switzerland. This article is an open access article distributed under the terms and conditions of the Creative Commons Attribution (CC BY) license (http://creativecommons.org/licenses/by/4.0/).
Copyright: This open access article is published under a Creative Commons CC BY 4.0 license, which permit the free download, distribution, and reuse, provided that the author and preprint are cited in any reuse.


