
Submitted:
30 April 2025
Posted:
02 May 2025
You are already at the latest version
Abstract
Medication safety in non-pharmacy storage areas (NPSAs) presents significant challenges in iden-tifying and mitigating potential hazards and errors. Traditional training methods often lack standardization and situational awareness training. This study describes an in-house developed Virtual Medication Horror Room (VMHR) as an innovative educational training program to en-hance medication safety awareness through interactive learning. VMHR simulates medication “horrors” in NPSAs, such as the wards and clinics, through interactive and realistic 360-degree video environments. Participants navigate scenarios from a first-person perspective, identifying hazards/errors through interactive elements. A pilot study with 33 healthcare learners assessed knowledge improvements via pre- and post-program quizzes and evaluated user perceptions and experience using the Technology Acceptance Model. Results showed a significant increase in quiz scores (pre-scores 58.7±9.0% versus post-scores 68.6±10.3%, p< 0.001), high perceived trust of the technology platform (5.55±0.81) and perceived usefulness of the program (5.44±0.87). Exploratory factor analyses indicated that perceived usefulness (0.743), perceived playfulness (0.828), per-ceived enjoyment (0.775) and perceived compatibility (0.835) were important drivers of behavior-al intention to use VMHR for learning. In conclusion, VMHR is an engaging educational tool for enhancing medication safety awareness among healthcare learners, providing a standardized technology-enhanced approach to medication safety education in a safe, authentic learning envi-ronment.
Keywords:
360-degree video technology
; healthcare education
; medication safety
; pharmacy practice
; technology acceptance model
; virtual training
1. Introduction
Non-pharmacy storage areas (NPSAs), such as ward prep rooms, clinics, and operating theatres, store medications to provide quick access to patients’ treatments. Medications stored at these locations pose high risks to patient safety (e.g., emergency kits, high alert medications (HAMs), look-alike sound-alike (LASA) medications) and require special storage, labelling and handling procedures in order to minimize safety risks. Moreover, in highly stressful situations, such as emergency resuscitations, it is important that e-kits/resuscitation trolleys have uniformity and consistency across the institution to reduce risks and improve patient outcomes. For example, in Finland, ~16% of LASA medications in an automated dispensing cabinet at the intensive care unit were stored unsafely close to at least one other LASA medication, and ~4% of the LASA medications were unsafely stored HAMs [1]. Additionally, majority of dispensed medications among community pharmacies and general practitioners in Malaysia were not labelled according to regulatory requirements [2]. In Singapore, ~25% of serious complications resulting from medication use are related to drug packaging and labelling issues [3].
As good practice, audits of NPSAs need to be regularly conducted by trained staff. For example, at our hospital, internal inspection audits (“ward checks”) are conducted 3 times annually at NPSAs (e.g., ward stock cupboards, Automated Medication Cabinets, medication trolleys, etc). The purpose of these checks is to ensure patient safety through proper storage of medications (e.g., room temperature, refrigerated, controlled drugs, emergency drug kits, etc), thus preventing medication administration errors. There are professional guidances both locally [3] and internationally [4,5,6,7,8] on the safe storage, supply and disposal of medications. However, non-compliance practices still occur, such as expiring infusions not being labelled with an “Expire Soon” sticker and placed in front for easy identification (40%), and infusions not arranged in First-Expiry-First-Out (FEFO) order (39%) [9].
Healthcare professionals (HCPs), audit staff and external service partners need to be trained to perform proper risk assessments and propose appropriate risk-reduction strategies in order to improve patient safety. However, patient safety education curricula are usually knowledge-based, have little skills training and no standardized way to assess the skills and attitudes of safety-focused practices [10]. Research has shown that learners are more able to identify patient accident-type errors/hazards (69%) than infection-/medication-type errors/hazards (<50%) [11]. Furthermore, the rate of correct identification of medication-type errors differs among different HCPs, ranging from pharmacists (78%) and in decreasing order, doctors and nurses (67% each), pharmacy technicians (65%) and other HCPs (58%) [12]. In general, finding safety hazards is not easy for HCPs as they lack a sense of situational awareness, possibly due to a normalization towards unsafe environments and systems in their daily work. This is in contrast to the high self-estimation regarding their ability to recognize potential safety issues [11]. Recognizing safety hazards and knowing how to manage risk requires skillsets other than theoretical knowledge. Thus, there is a need to train and assess HCPs to recognize, identify and manage potential risks of medication errors/hazards.
“Horror rooms” are an effective way to train on safety-focused content, with average error detection rates ranging from 47% to 71% [10,11,13]. They generally comprise of hospital-based safety threats in which learners have to identify safety errors/hazards in a physically simulated environment within a limited time. These rooms provide hands-on experience to help the learner identify blind spots, as well as train situational awareness, observational and critical thinking skills [11]. In addition, using design- and behavior-dependent safety indicators (e.g., drug labels, refrigerator storage, work surfaces, medication storage and arrangement, medication list reviews) can promote a medication safety culture [14]. Studies have shown that participants’ feedback on their horror room experiences have generally been positive [10,11,12,15].
COVID-19 has negatively impacted training programs with hands-on components, including physical horror rooms. Moreover, factors such as stress, fatigue, burnout and lack of compliance with procedures may increase the risks of errors and impact patient safety [14]. There are disadvantages in utilizing physical horror rooms for training. For example, learners may move or manipulate the objects in the room, leading to new errors in the simulation, thus causing the later batches to face a different situation instead [12]. In contrast, a virtual horror room is attractive due to advantages such as enabling learners to learn anywhere at their own time and pace, and it is also ethically justifiable since learners can learn without the fear and stress of causing medication/medical errors and impacting patient safety in real-life [16].
Therefore, the main objectives of this project were to design and develop an interactive Virtual Medication Horror Room (VMHR) training program on medication safety in NPSAs, and evaluate the usefulness, practicability and receptiveness of this program. Our ultimate goal was to enhance the awareness, knowledge and skills among HCP learners regarding medication safety in NPSAs in relation to types of medication errors/hazards and risk management strategies.
2. Materials and Methods
2.1. Design and Development of the Virtual Medication Horror Room (VMHR)
The VMHR was designed and developed as an online in-house interactive 360-degree training program. The program comprised of two standardized hospital scenarios of a NPSA in a ward and a clinic. Our team conducted brainstorming sessions to develop scenarios based on several considerations: (i) non-pharmacy drug storage area concerned, (ii) frequency of medication error occurrence, and (iii) feasibility of a realistic simulation of the items/scenario/situation. Each scenario comprised 3 parts. The first part would be of a 360-degree virtual tour that aimed to help learners understand the procedures for performing ward/clinic checks and learn about the types of medication “horrors” that could potentially occur in the different environments. The second part was an interactive assessment book designed to reinforce the content knowledge gained from the virtual tour. The video inside the assessment book would allow the learner to imagine themselves performing a ward/clinic check from a first-party viewpoint. Learners could also self-identify/assess whether they had gained the necessary content knowledge based on the questions and feedback provided. The third part consisted of a “Find-the-Errors” spots quiz that was meant to be a quick assessment for learners to self-check if they could identify the medication errors/hazards in a quick turnaround time, since in clinical practice, the ward/clinic checkers would need to quickly “spot” the errors/hazards within short amounts of time, sometimes with other distractions as well, when the clinics and wards might be busy. Visual prompters/markers were incorporated in the virtual tour and interactive assessment book to guide learners to explore the rooms and objects/items. Each prompter/marker will comprise of either a medication error/hazard, a decoy or an information resource. Learners would need to indicate the presence or absence of an error/hazard and identify the type of error/hazard where applicable. Real-time feedback would be provided in the VMHR.
2.2. VMHR Pilot User Experience Study
A pilot user experience study was conducted among pharmacy learners at our institution. The study consisted of several key phases: (i) a 25-item pre-quiz that assessed their baseline medication safety knowledge in NPSAs; (ii) the VMHR program to identify various medication errors/hazards (“horrors”); (iii) a post-quiz that comprised of the same questions as the pre-quiz to measure any changes in knowledge; and (iv) a self-administered user-experience survey evaluating the VMHR’s user-friendliness, usefulness, and overall acceptability for medication safety training based on an adaptation of the Technology Acceptance Model (TAM), using a 7-point agreement scale (1=Totally Disagree to 7=Totally Agree) [17]. Both the quizzes and the survey were done online using a governmental survey platform that was available to public healthcare institutions. The study was approved as an exemption study (Ref. 2023/2749) by the SingHealth Centralised Institutional Review Board.
2.2.1. TAM Model
The proposed TAM model in this study (Figure 1) was an extension of the original TAM, which investigates users’ receptiveness towards a new technology in relation to its perceived usefulness (PU), perceived ease of use (PEOU), attitude towards use (ATU) and behavioral intention (BI) to use the technology [17,18]. Several additional variables were incorporated into the model to better identify the receptiveness of users to the VMHR program, in which the main technology used was 360-degree videos. These variables were classified into an individual’s intrinsic factors, external influences and system credibility factors. Technologies that are difficult to navigate are less likely to be engaging and motivating to users, hence our assumption was that the users’ intrinsic motivations, such as perceived playfulness (PP), perceived enjoyment (PE) and perceived compatibility (PC) with learning styles and lifestyles, would affect their BI to use the VMHR. In contrast, external influences like the users’ perceived image (PI) of 360-degree video technology in relation to their professional status as adult healthcare learners, and the impact of social norm (SN) from the viewpoint of organizational encouragement and peer acceptance might influence PU and BI respectively. The system credibility factors in this model were perceived knowledge (PK) and perceived trust (PT). PK represented our users’ understanding of 360-degree video technologies in comparison with other similar technologies (such as interactive videos and virtual reality), while PT reflected their perceptions of the platform’s reliability and trustworthiness. Studies have shown that PK and PT can potentially influence the user’s acceptance of new technologies [19,20,21]. As the VMHR represents a relatively new approach of using 360-degree video technology for medication safety training in our organization, we postulated that both PK and PT would impact their PU and PEU, which would ultimately influence their BI to use the VMHR. Hence, combining all these variables into our proposed model would provide an insight whether our VMHR program would be perceived as useful and easy to use for our healthcare learners, as well as whether we could potentially implement this as part of our medication safety training program at our institution.
2.2.2. Statistical Analysis
Data were gathered at three time points – pre-quiz, post-quiz, and in the survey. No personal data was collected, and all responses were coded and anonymized before analysis. The data collected were subjected to descriptive statistics and biostatistical tests. Overall quiz scores and scores in each quiz category were converted to percentages for consistent reporting. Sub-group analyses were conducted on the pre- and post-quiz scores based on the participants’ demographics, and all findings were reported in aggregate. Wilcoxon signed-rank tests were used to determine the statistical differences between the pre-quiz and post-quiz scores (paired data), while Mann Whitney U and Kruskal Wallis tests were used to determine the statistical differences in improvement in quiz scores among different demographic groups and participant informativeness ratings of the VMHR content (independent data), between 2 groups/categories and 3 or more groups/categories respectively. If Kruskal Wallis tests showed statistical significance among 3 or more groups, post-hoc pairwise comparisons with Bonferroni corrections were performed. Statistical significance was defined as p<0.05.
The TAM statement on requiring mental effort to play the VMHR was converted to a reverse scale (1=Totally Agree to 7=Totally Disagree) for analysis to align all the perceived ease of use statements in one direction. Exploratory factor analysis (EFA) was conducted on the TAM parameters based on participants’ ratings, using the correlation matrix with varimax rotation and Kaiser normalization applied. The maximum iterations for convergence was 25. A factor loading of 0.4 or higher was considered a minimally acceptable to be included in the model as an exploratory analysis technique [22]. Three factors were extracted based on the scree plot and a cumulative model variance of more than 80%. Due to a small sample size, Spearman’s correlation coefficient (rs) was used to determine whether there was a significant correlation among the TAM measures with BI. All statistical analyses were performed using IBM SPSS Statistics (version 30).
3. Results
3.1. The VMHR Training Program on Medication Safety in NPSAs
The VMHR training program was structured into three main sections: an online tutorial, a ward-based scenario and a clinic-based scenario. All sections had interactive 360-degree video environments embedded for the learner to navigate. The whole program would take approximately one hour to complete. A conceptual brochure and video trailer of the VMHR used to introduce this training program to our learners, and screenshots of the 360-degree video environment and examples of medication “horrors” are shown in Figure 2.
Learners would begin with the online tutorial, which would orientate them to navigate within the 360-degree environment. This part was meant to familiarize learners with the interface, so that they could smoothly navigate the ward- and clinic-based scenarios later on. In the virtual tours of the ward-based and clinic-based scenarios, learners would assume a first-person viewpoint to navigate typical NPSAs in a ward and clinic. They would encounter various instructional resources on how to perform a ward check and identify medication errors and hazards, such as inappropriately stored HAMs and LASA drugs, mislabeled drugs, or expired medications. There would also be embedded videos and additional walkthroughs that highlighted specific pitfalls to watch for. In the interactive book sections, learners would be tasked to identify various medication “horrors” in ward and clinic check video simulations. Finally, learners would conclude their training by completing a picture-based “Find-the-Errors” spots quiz in which they would have to visually identify medication hazards in static images of the NPSAs, with feedback to reinforce key learning points in identifying hazardous practices.
3.2. Pilot Study Results
3.2.1. Demographics of Participants
A total of 33 pharmacy staff participated in this study. Majority of participants were females (69.7%) and 30 years or younger (81.8%) (Table 1). They comprised mainly of pre-registration pharmacists (48.5%), pharmacy technicians (30.3%) and pharmacists (15.2%). Three quarters had a pharmacy educational background (78.8%), while a small proportion were from pharmaceutical sciences (12.1%). Most had university-level education (72.7%), while a quarter (27.3%) had pre-university qualifications. The participants were almost equally distributed between inpatient (51.5%) and outpatient/retail (48.5%) work settings. In terms of practice experience, half (51.5%) had at least one year of experience, about one-third (30.3%) had less than a year of experience, while 18.2% had no prior working experience. Majority (87.9%) had local practice experience, with only 12.1% having overseas practice experience. Regarding immersive technology familiarity, the participants had varying degrees of prior experience, including virtual reality (42.4%), augmented reality (39.4%), mirror worlds and 360-degree video/image applications (36.4% each). Almost half had never tried extended reality (45.5%) and 360-degree video/image applications (42.4%) before, but a small percentage (12.1%—18.2%) had used these technologies at least once in the past 6 months.
3.2.2. Participants’ Medication Safety Knowledge and Perceptions of the VMHR Content
Overall, participants showed an improvement in their medication safety knowledge in NPSAs after going through the VMHR (Table 2). Their total post-quiz score was significantly higher than their pre-quiz score (means 68.6% versus 58.7%, p<0.001). Furthermore, the participants also scored better in several quiz categories after going through the VMHR training – emergency kit errors (65.7% versus 48.5%, p=0.003), expired medications (87.9% versus 78.8%, p=0.022), labeling errors (61.6% versus 48.0%, p=0.013), and medication storage hazards (65.4% versus 58.4%, p=0.027).
Generally, participants had positive perceptions toward the VMHR content and its educational value (Table 3). When asked about which sections would be useful for improving medication safety knowledge, majority (57.6%) identified the 360-degree virtual tour as most beneficial, followed by the interactive assessment book (48.5%) and the “Find-the-Errors” spots quiz (36.4%). The informational value of the VMHR content was highly rated across multiple domains, including understanding the types of medication storage errors (90.9%), understanding how to mitigate medication storage hazards (87.9%), and understanding the equipment and tools needed for ward/clinic checks (78.8%). Despite having varied prior experience with immersive technologies, nearly two-thirds of participants (63.6%) expressed interest in using extended reality and/or 360-degree video/image technologies for future training, suggesting that they had a receptive attitude towards innovative educational approaches for medication safety training.
In sub-group analyses of score improvements between the pre- and post-quizzes, statistically significant differences were observed in the quiz categories of emergency kit errors, expired medications and inspection process inconsistencies (Table 4). Males had better score improvements than females in the emergency kit error category (median score improvement 33.3% versus 0%, p=0.049). In the expired medications category, pharmacy technicians and pharmacy assistants had better score improvements than pharmacists (median score improvement 20.0% versus 0%, p=0.025 post-hoc analysis), as with those working in outpatient and retail compared to inpatient settings (median score improvement 20.0% versus 0%, p=0.015). Furthermore, those who rated the VMHR content question on understanding the equipment and tools needed to perform ward/clinic checks as “not so informative” had higher score improvements in the inspection process inconsistencies category than those who rated it as “informative” (median score improvement 50.0% versus 0.0%, p=0.018).
3.2.3. Reliability of TAM Scale
Cronbach’s alpha tests were used to identify the internal consistency of the TAM items/statements. Due to the exploratory nature of this study, a value of 0.6 or higher was considered an acceptable level of reliability [23]. Cronbach’s alpha value for the overall scale of all 33 statements was 0.951 (Table 5). Similarly, Cronbach’s alpha values were above 0.6 for nearly all the TAM measures, except for SN (α=0.499). Thus, the SN measure was excluded from all analyses other than the reporting of descriptive statistics. After removal of SN measure, the Kaiser-Meyer-Olkin (KMO) value indicated sampling adequacy for the analysis (KMO=0.803) and the Bartlett’s test for sphericity indicated that the correlations between the TAM measures were sufficiently large for EFA (df=45, X2=283.4, p<0.001).
3.2.4. Participants’ Perceptions and User Experience of VMHR
The top TAM measures rated by participants were PK (5.58±1.37), with most participants reporting that they had good understanding of 360-video technologies (84.8% agreed); PT (5.55±0.81) indicative of their trust in the reliability and security of the platform (84.8% agreed); PU (5.44±0.87) and BI (5.34±0.87), indicating that the educational value and adoption readiness to use VMHR was high (Table 6). Participants’ strong educational value perception was reflected by the majority believing that VMHR was more effective than traditional learning methods (93.9%, 5.67±0.92), and three-quarters indicating that VMHR improved their learning performance (78.8%, 5.33±1.02) and helped them learn more quickly (81.8%, 5.33±1.14).
PP (5.35±0.86) and PE (5.32±1.07) also received high ratings with most participants reporting that they had an interactive and engaging experience (87.9%) and that VMHR enhanced their learning experiences by making it more fun (84.8%). A large proportion also indicated that VMHR increased their imagination on how 360-degree videos could be used creatively for education (93.9). Over half (69.7%) were curious to explore other 360-degree video programs, highlighting the innovative approach of this program.
Participants agreed that VMHR would be accepted by our institution/organization (5.73±0.88, 87.9%), and trainers and learners (5.30±1.05, 78.8%) as a medication safety training program. The overall PC rating of participants was 5.25±1.00, with over half indicating that VMHR fitted well with their learning styles (72.7%) and lifestyles (66.7%). However, they also noted that this program might imply major changes to how education would be carried out at our institution (5.85±0.76, 93.9%).
In contrast, PEU (4.65±0.83) and ATU (4.23±1.21) were the lowest scoring TAM measures. Although participants agreed that the VMHR was easy to navigate (5.73±1.01, 93.9%) and had intuitive controls (5.30±1.19, 81.8%), three-quarters also indicated that it required mental effort to go through the program (2.76±1.17, 75.8%). They were mostly neutral in terms of their attitude towards using VMHR for learning (ATU=4.23±1.21). Nonetheless, majority still indicated that VMHR would be beneficial for training (5.61±0.86, 87.9%) and that they would recommend this program to others (5.33±0.99, 78.8%).
3.2.5. Associations of TAM Measures with Participants’ Prior Experience and Interest with Immersive Technologies, and Usefulness of VMHR Content
In sub-group analyses of TAM measures in relation to participants’ prior experience and interest in immersive technologies, and their perceived usefulness of the VMHR content, several associations were observed. Those with prior virtual reality experiences rated VMHR significantly lower across several TAM measures than those without, including PT (median ratings of 5.0 versus 6.0, p=0.026), PU (5.3 versus 6.0, p=0.006), PP (4.9 versus 6.0, p=0.006), PC (5.0 versus 6.0, p=0.003), PI (4.0 versus 5.7, p=0.006), and BI (5.2 versus 6.0, p=0.008). However, there were no statistically significant differences in the TAM measures between participants with and without prior experiences with augmented reality, augmented virtuality, mirror worlds and 360-degree video/image applications (Table 7).
Participants who were interested in using immersive technologies (e.g., extended reality and 360-degree video/image technologies) rated almost all the TAM measures significantly higher than those who were less interested (Table 7). Similarly, participants who found the 360-degree virtual tour in VMHR useful rated PU (median ratings 6.0 versus 5.0, p=0.030), PP (6.0 versus 4.8, p=0.032), PE (6.0 versus 5.0, p=0.009) and PC (5.7 versus 4.8, p=0.040) significantly higher than those who did not. In contrast, participants who found the “Find-the-Errors” spots quiz useful had significantly lower ratings than those who did not (5.3 versus 6.0, p=0.025) in their PK of the differences between 360-degree video technologies with interactive videos and virtual reality applications.
3.2.6. Correlation of TAM Measures with Participants’ Behavioral Intention to Use VMHR
The top TAM measures that were most correlated to BI to use VMHR for education (Table 8) were PC (rs=0.835, p<0.001, CI: 0.683, 0.917), PP (rs=0.828, p<0.001, CI: 0.672, 0.914) and PE (rs=0.775, p<0.001, CI: 0.582, 0.886), indicating that alignment with the users’ intrinsic factors, such as learning styles, lifestyles and belief in 360-degree video technology as innovative educational approach, as well as their perceptions on the interactive, engaging and enjoyable aspects of VMHR significantly influences their adoption intention. Although not as strong, PU (rs=0.743, p<0.001, CI: 0.529, 0.868) and PI (rs=0.651, p<0.001, CI: 0.387, 0.816) also had significant correlations to BI, showing that the educational value and perceived image enhancement to be the first among their institutional peers to use VMHR are also important for adoption intention. While PK (rs=0.582, p<0.001, CI: 0.288, 0.775) and PEU (rs=0.560, p<0.001, CI: 0.258, 0.762) had moderately significant correlations to BI, the higher Spearman correlation values for PU and PI suggests that the educational usefulness of VMHR may be more crucial than its ease of use in our TAM model. In contrast, the weak correlations of PT (rs=0.387, p=0.026, CI: 0.039, 0.651) and ATU (rs=0.241, p=0.177, CI: -0.122, 0.547) suggest that the users’ intention to use VMHR might not necessarily be influenced by usage attitudes.
Exploratory factor analyses identified 3 factors that explained 82.0% of the model variance. The first factor encompassed the participants’ perceived knowledge of and user experience with 360-degree technologies, with moderate to high loadings for PK (0.950), PE (0.840), PU (0.610), PP (0.565) and PC (0.532). On the other hand, the second factor was mainly made up of PI (0.911), PP (0.555), PC (0.516) and PU (0.458), representing the status and engagement value of being one of the first in our institution to try out this program. Factor 2 also had the highest loading for BI (0.465). Lastly, PEU was the TAM measure that had the highest loading on the third factor (0.896). All these factors in combination suggests that users’ prior knowledge, user experience, external perceptions of using innovative technological approaches to education, and ease of use – all play a role in influencing their adoption intentions of using digital education programs for training at our institution.
4. Discussion
The development of the VMHR represents a significant advancement of our hospital’s digital transformation of our medication safety education and training program. Currently, pharmacy learners at our institution undergo a short 10-15 minutes medication safety mini-lecture to familiarize themselves with an in-house inspection checklist on medication handling, storage and disposal. Similarly, nursing staff attend an annual one-hour sharing session on the types of errors that could occur in medication storage areas. There is no standardized method of training on the types of medication storage hazards to look out for and how to manage these hazards. There is also no assessment component to identify the level of awareness and/or knowledge of the staff regarding these hazards, risks and risk-reduction strategies. Poor compliance practices can predispose medication errors and safety hazards. Hence, our education team saw a need to enhance the medication safety culture among staff by improving their awareness, knowledge and skills through digital education technologies, to minimize the negative consequences on patient safety.
Our findings show both an improvement in medication safety knowledge and technology receptiveness among participants based on 360-degree video/image technology. The significant increase in overall quiz scores suggests that interactive authentic learning environments can effectively enhance medication safety knowledge. This improvement was particularly pronounced in areas such as emergency kit errors, labeling errors, and medication storage hazards. Our findings align with previous research showing that “horror rooms” can effectively train safety-focused content [10,11,13]. However, the VMHR can potentially address the gap identified in the literature regarding healthcare professionals’ difficulty in identifying medication-type errors compared to other patient accident-type hazards [11].
From our TAM results, PC, PP and PE were the strongest predictors of BI to use VMHR. Our results align with broader TAM research showing that intrinsic factors, such as educational compatibility with learning styles and the engaging and interactive nature of the application, can influence the adoption of novel educational technologies [24,25,26]. However, in our participant cohort, PEU and ATU had lower correlations than PU with BI, which deviated from the original TAM model by Davis. Our results suggest that in healthcare professional education, the educational value of the digital education technology may be more important for its adoption, rather than its usability, technical complexity, or learner’s attitude towards the technology. Healthcare learners may be more willing to invest effort in learning new educational systems if they perceive educational benefits that come with it. Our postulation is consistent with the participants’ high ratings for VMHR’s usefulness compared to traditional learning methods, despite acknowledging that going through the program required mental effort. Interestingly, a recent Australian study exploring the educational compatibility of virtual reality models had also identified no significant link between PEU and PU [26]. The authors also suggested that the educational compatibility-ATU construct could be excluded for educational technology models as it had no real bearing on their model’s power.
Furthermore, we believe that the lower correlations between ATU and PT with BI in our study may be explained by the context of the VMHR program within our institution’s digital education strategy. Many healthcare institutions are undergoing digital transformation, and our institution is no different. With an increasing focus on technology-enhanced learning strategies, our participants might have perceived organizational/institutional acceptance as more important than their own attitudes towards use of digital education technologies, such as VMHR. The high percentage of participant agreement to the item/statement on the “organization will encourage VMHR as a training program” supports our interpretation, suggesting that broader institutional directions might play a more important role. To this end, it is worth noting that our institution’s pharmacy division is the first in Singapore to adopt a comprehensive digital education strategy and approach to train our pharmacy staff. Programs like our Virtual Reality Apprenticeship Program (VRx) [16], Virtual Aseptic Compounding (VAC) program [27], Metaverse Art Gallery of Image Chronicles (MAGIC) [28], and The Saltomachy War (TSW) [29], explore upcoming immersive technologies like extended reality, serious games and generative artificial intelligence, which we believe will position us ahead of other hospital institutions in terms of technology-enhanced learning. Our division’s approach to digital education transformation could have likely influenced our participants’ perceptions and acceptance of the VMHR program.
As far as we know, there is no standardized method of training and evaluating the skills needed for safety practices [10], particularly for medication-related hazards in NPSAs. The VMHR overcomes this limitation of by providing standardized “horror room” scenarios to ensure that learners have consistent and comparable learning experiences that cover the required learning objectives. Furthermore, the ability to do this training online provides a feasible alternative to overcome barriers of time scheduling and trainer manpower in the clinical practice setting. The content experts in our team designed the medication “horrors” (errors and hazards) based on the core learning objectives and baseline knowledge that our learners needed to know for ward and clinic check procedures. As we delved deeper into content development, we realized that our trainees would need reinforcement of key concepts in identifying and managing these medication errors/hazards. Thus, we enhanced the training program by developing two scenarios (ward and clinic) to help our trainees understand the similarities and differences between these check procedures. Each sub-section had a different purpose: the 360-degree virtual tour served as “lecture notes” with instructions and information provided to the learner, the interactive assessment book served as knowledge reinforcement material for the learner to go through the ward/clinic check procedures from a first-person perspective, and the “Find-the-Errors” spots quiz was meant as a rapid formative assessment of error/hazard identification skills. These sub-sections provide different learning components to accommodate different learning styles and preferences for our learners, who have a variety of ages, education levels, working and practice experiences.
Our participants’ preferences for the different sub-sections could be explained through our TAM results. The 360-degree virtual tour was rated as the most useful section, and our TAM analysis showed that these participants also rated PU, PP, PE and PC higher than those who did not, thus suggesting that the immersive nature and authentic learning environment of the 360-degree tour enhanced their engagement and also aligned well with their learning expectations. In contrast, participants who had lower PK of 360-degree video technologies found the “Find-the-Errors” spots quiz more useful, suggesting that users with less familiarity with immersive technologies may prefer a simpler assessment-focused learning approach. Nonetheless, our results suggest that it is important to consider a holistic approach to education and training using multiple learning strategies, to accommodate the variety of learning styles and technological preferences of adult learners in a hospital institutional setting. To this end, our institution has embarked on a 4-tiered training strategy comprising of non-digital (Tier 1), simple digital (Tier 2), extended reality (Tier 3), and metaverse and generative artificial intelligence components (Tier 4) [30]. The VMHR is an example that falls under Tier 3 of our training strategy that enhances our hospital’s medication safety training program in a safe learning environment.
5. Limitations and Future Work
The main limitation of the VMHR is that this training program is currently not integrated with our institution’s e-learning system due to technical limitations in supporting high-resolution 360-degree videos. As such, it has limited reach in terms of accessibility and scalability. Moreover, during the design of VMHR, our team deemed that the use of virtual reality headsets might not be a feasible idea due to the limitation of the number of headsets that our department has. Hence, we decided to compromise the immersivity of the VMHR experience through the use of a H5P-enabled website [31] to make the training more autonomous and asynchronous. Next, our pilot study participants mainly comprised of pharmacy staff learners from a single institution, while the training scenarios used in the VMHR were of our hospital’s ward and clinic environments, hence our findings may be limited in terms of generalizability to other healthcare professional learners and clinical settings. For future work, we plan to develop additional scenarios covering other medication safety contexts and expand our program to include other healthcare professions to enhance interprofessional collaborations and practice.
6. Conclusions
The Virtual Medication Horror Room (VMHR) developed in this study provides a standardized form of medication safety training in non-pharmacy storage areas (NPSAs), such as the wards and clinics. By simulating realistic medication “horrors” in an authentic virtual hospital learning environment through 360-degree videos, the VMHR enables healthcare learners to hone their medication safety knowledge and skills in a risk-free setting. Through a multi-pronged strategy of the virtual tour, interactive assessment book and the spots quiz, the VMHR can cater to different learning preferences and styles to reinforce key safety concepts. As healthcare education continues to transform in the digital age, VMHR is an innovative educational tool that has considerable potential to enhance medication safety training through improved error/hazard recognition and risk management skills, ultimately enhancing patient safety in clinical practices.
Author Contributions
Conceptualization, K.Y, S.H.R, and P.F.; methodology, K.Y, M.P, F.Q, S.L, L.M.C, J.A.W, and Y.C.L.; formal analysis, K.Y, F.Q, and S.J.Y.; funding acquisition, K.Y, S.L, L.M.C, J.A.W, Y.C.L, S.H.R, and P.F.; investigation, K.Y, S.L, L.M.C, J.A.W, Y.C.L, and S.H.R.; writing—original draft preparation, K.Y, and S.H.R.; writing—review and editing, K.Y.; visualization, K.Y, and S.J.Y.; supervision, K.Y, S.L, L.M.C, J.A.W, and S.H.R.; project administration, K.Y, and S.H.R. All authors have read and agreed to the published version of the manuscript.
Funding
This research was funded by the Academic Medicine Education Institute (AMEI) grant (EING 2303) awarded by SingHealth Duke-NUS, Singapore.
Conflicts of Interest
The authors declare no conflicts of interest.
References
- Ruutiainen, H.K.; Kallio, M.M.; Kuitunen, S.K. Identification and safe storage of look-alike, sound-alike medicines in automated dispensing cabinets. Eur J Hosp Pharm 2021, 28, e151–e156. [Google Scholar] [CrossRef] [PubMed]
- Neoh, C.F.; Hassali, M.A.; Shafie, A.A.; Awaisu, A.; Tambyappa, J. Compliance towards dispensed medication labelling standards: a cross-sectional study in the state of Penang, Malaysia. Curr Drug Saf 2009, 4, 199–203. [Google Scholar] [CrossRef] [PubMed]
- Ministry of health Singapore; Singapore Pharmacy Board. Medication Safety Practice Guidelines & Tools; Ministry of Health Singapore: Singapore, 2006, pp. 1-85. Available online: https://www.moh.gov.sg/docs/librariesprovider4/guidelines/medication-safety.pdf (accessed on 26 August 2021).
- Australian Commission on Safety and Quality in Health Care. Safe selection and storage of medicines, 2022. Available online: https://www.safetyandquality.gov.au/our-work/medication-safety/safer-naming-labelling-and-packaging-medicines/safe-selection-and-storage-medicines (accessed on 12 December 2024).
- Royal Pharmaceutical Society. Professional guidance on the safe and secure handling of medicines. Royal Pharmaceutical Society, 2022. Available online: https://www.rpharms.com/recognition/setting-professional-standards/safe-and-secure-handling-of-medicines/professional-guidance-on-the-safe-and-secure-handling-of-medicines (accessed on 12 December 2024).
- Gray, R.C.F.; Hogerzeil, H.V.; Prüss, A.M.; Rushbrook, P. Guidelines for safe disposal of unwanted pharmaceuticals in and after emergencies; World Health Organization: Geneva, Switzerland, 1999, pp. 1-32.
- Cierniak, K.H. Integrating packaging, storage, and disposal options into the medication use system. US Food & Drug Administration. Available online: https://www.fda.gov/media/109538/download (accessed on 12 December 2024).
- Cello, R.; Conley, M.; Cooley, T.; De la Torre, C.; Dorn, M.; Ferer, D.S.; Nickman, N.A.; Tjhio, D.; Urbanski, C.; Volpe, G. ASHP guidelines on the safe use of automated dispensing cabinets. Am J Health Syst Pharm 2022, 79, e71–e82. [Google Scholar] [CrossRef] [PubMed]
- Tay, H.H.; Abdullah, R.B.; Cally Yin Fang, C.; Leow, S. Singapore General Hospital inpatient ward check report (March 2022): Singapore, 2022, pp. 1-19.
- Farnan, J.M.; Gaffney, S.; Poston, J.T.; Slawinski, K.; Cappaert, M.; Kamin, B.; Arora, V.M. Patient safety room of horrors: A novel method to assess medical students and entering residents’ ability to identify hazards of hospitalisation. BMJ Qual Saf 2016, 25, 153–158. [Google Scholar] [CrossRef] [PubMed]
- Zimmermann, C.; Fridrich, A.; Schwappach, D.L.B. Training situational awareness for patient safety in a room of horrors: An evaluation of a low-fidelity simulation method. J Patient Saf 2021, 17, e1026–e1033. [Google Scholar] [CrossRef] [PubMed]
- Daupin, J.; Atkinson, S.; Bedard, P.; Pelchat, V.; Lebel, D.; Bussieres, J.F. Medication errors room: A simulation to assess the medical, nursing and pharmacy staffs’ ability to identify errors related to the medication-use system. J Eval Clin Pract 2016, 22, 907–916. [Google Scholar] [CrossRef] [PubMed]
- Löber, N.; Garske, C.; Rohe, J. Room of horrors: A low-fidelity simulation practice for patient safety-relevant hazards of hospitalization. Z Evid Fortbild Qual Gesundhwes 2020, 153-154, 104–110. [Google Scholar] [CrossRef] [PubMed]
- Rozenbaum, H.; Gordon, L.; Brezis, M.; Porat, N. The use of a standard design medication room to promote medication safety: Organizational implications. Int J Qual Health Care 2013, 25, 188–196. [Google Scholar] [CrossRef] [PubMed]
- Wiest, K.; Farnan, J.; Byrne, E.; Matern, L.; Cappaert, M.; Hirsch, K.; Arora, V. Use of simulation to assess incoming interns’ recognition of opportunities to choose wisely. J Hosp Med 2017, 12, 493–497. [Google Scholar] [CrossRef] [PubMed]
- Tsang, W.Y.; Fan, P.; Raj, S.D.H.; Tan, Z.J.; Lee, I.Y.Y.; Boo, I.; Yap, K.Y.-L. Development of a three-dimensional (3D) virtual reality apprenticeship program (VRx) for training of medication safety practices. Int J Dig Health 2022, 2, 4. [Google Scholar] [CrossRef]
- Davis, F.D.; Granić, A. The Technology Acceptance Model - 30 Years of TAM; Springer Cham: Switzerland AG, 2024; pp. 1–117. [Google Scholar]
- Davis, F.D. Perceived usefulness, perceived ease of use, and user acceptance of information technology. MIS Quarterly 1989, 13, 319–340. [Google Scholar] [CrossRef]
- Alsharhan, A.; Salloum, S.A.; Aburayya, A. Technology acceptance drivers for AR smart glasses in the middle east: A quantitative study. Int J Data Netw Sci 2022, 6, 193–208. [Google Scholar] [CrossRef]
- Toraman, Y.; Gecit, B.B. User acceptance of metaverse: An analysis for e-commerce in the framework of Technology Acceptance Model (TAM). Sosyoekonomi 2023, 31, 85–104. [Google Scholar] [CrossRef]
- Mostafa, l. Measuring Technology Acceptance Model to use metaverse technology in Egypt. JSST 2022, 23, 118–142. [Google Scholar] [CrossRef]
- Hair Jr., J. F.; Black, W.C.; Babin, B.J.; Anderson, R.E. Multivariate Data Analysis, 7th ed.; Pearson College Div: USA, 2009; p. 785. [Google Scholar]
- Ursachi, G.; Horodnic, I.A.; Zait, A. How reliable are measurement scales? External factors with indirect influence on reliability estimators. Procedia Economics and Finance 2015, 20, 679–686. [Google Scholar] [CrossRef]
- Al-Adwan, A.S.; Li, N.; Al-Adwan, A.; Abbasi, G.A.; Albelbisi, N.A.; Habibi, A. Extending the Technology Acceptance Model (TAM) to predict university students’ intentions to use metaverse-based learning platforms. Educ Inf Technol (Dordr) 2023, 28, 15381–15413. [Google Scholar] [CrossRef] [PubMed]
- Granić, A. Technology acceptance and adoption in education. In Handbook of Open, Distance and Digital Education; Zawacki-Richter, O., Jung, I., Eds.; Springer: Singapore, 2023, pp. 183-197.
- Kemp, A.; Palmer, E.; Strelan, P.; Thompson, H. Exploring the specification of educational compatibility of virtual reality within a technology acceptance model. Australasian J Educ Technol 2022, 38, 15–34. [Google Scholar] [CrossRef]
- Yap, K.; Ng, C.L.; Han, J.; Tsang, W.Y.; Fan, P.; Raj, S.D.H. Immersive training for sterile drug preparation through extended reality: Insights into the Virtual Aseptic Compounding (VAC) Programme, 2024. Available online: https://www.researchgate.net/publication/382636915_Immersive_Training_for_Sterile_Drug_Preparation_through_Extended_Reality_Insights_into_the_Virtual_Aseptic_Compounding_VAC_Programme (accessed on 26 August 2024).
- Yap, K.Y.-L.; Ho, J.; Toh, P.S.T. Development of a Metaverse Art Gallery of Image Chronicles (MAGIC) for healthcare education: A digital health humanities approach to patients’ medication experiences. Information 2024, 15, 431. [Google Scholar] [CrossRef]
- Ahmad, A.B.; Tan, S.; Yap, K. The Saltomachy War - A metaverse escape room on the War Against Salt. Stud Health Technol Inform 2024, 310, 1251–1255. [Google Scholar] [PubMed]
- Yap, K.Y.; Raj, S.D.H. “I am Groot” – How to be a “Guardian” of the Pharmacy Eduverse (Vol. 4). In Proceedings of the The 32nd Singapore Pharmacy Congress, Singapore, 9 Sep, 2023.
- H5P. Create, share and reuse interactive HTML5 content in your browser. H5P Group, 2025. Available online: https://h5p.org/ (accessed on 22 April 2025).
Figure 1.
Proposed TAM model for the VMHR training program.
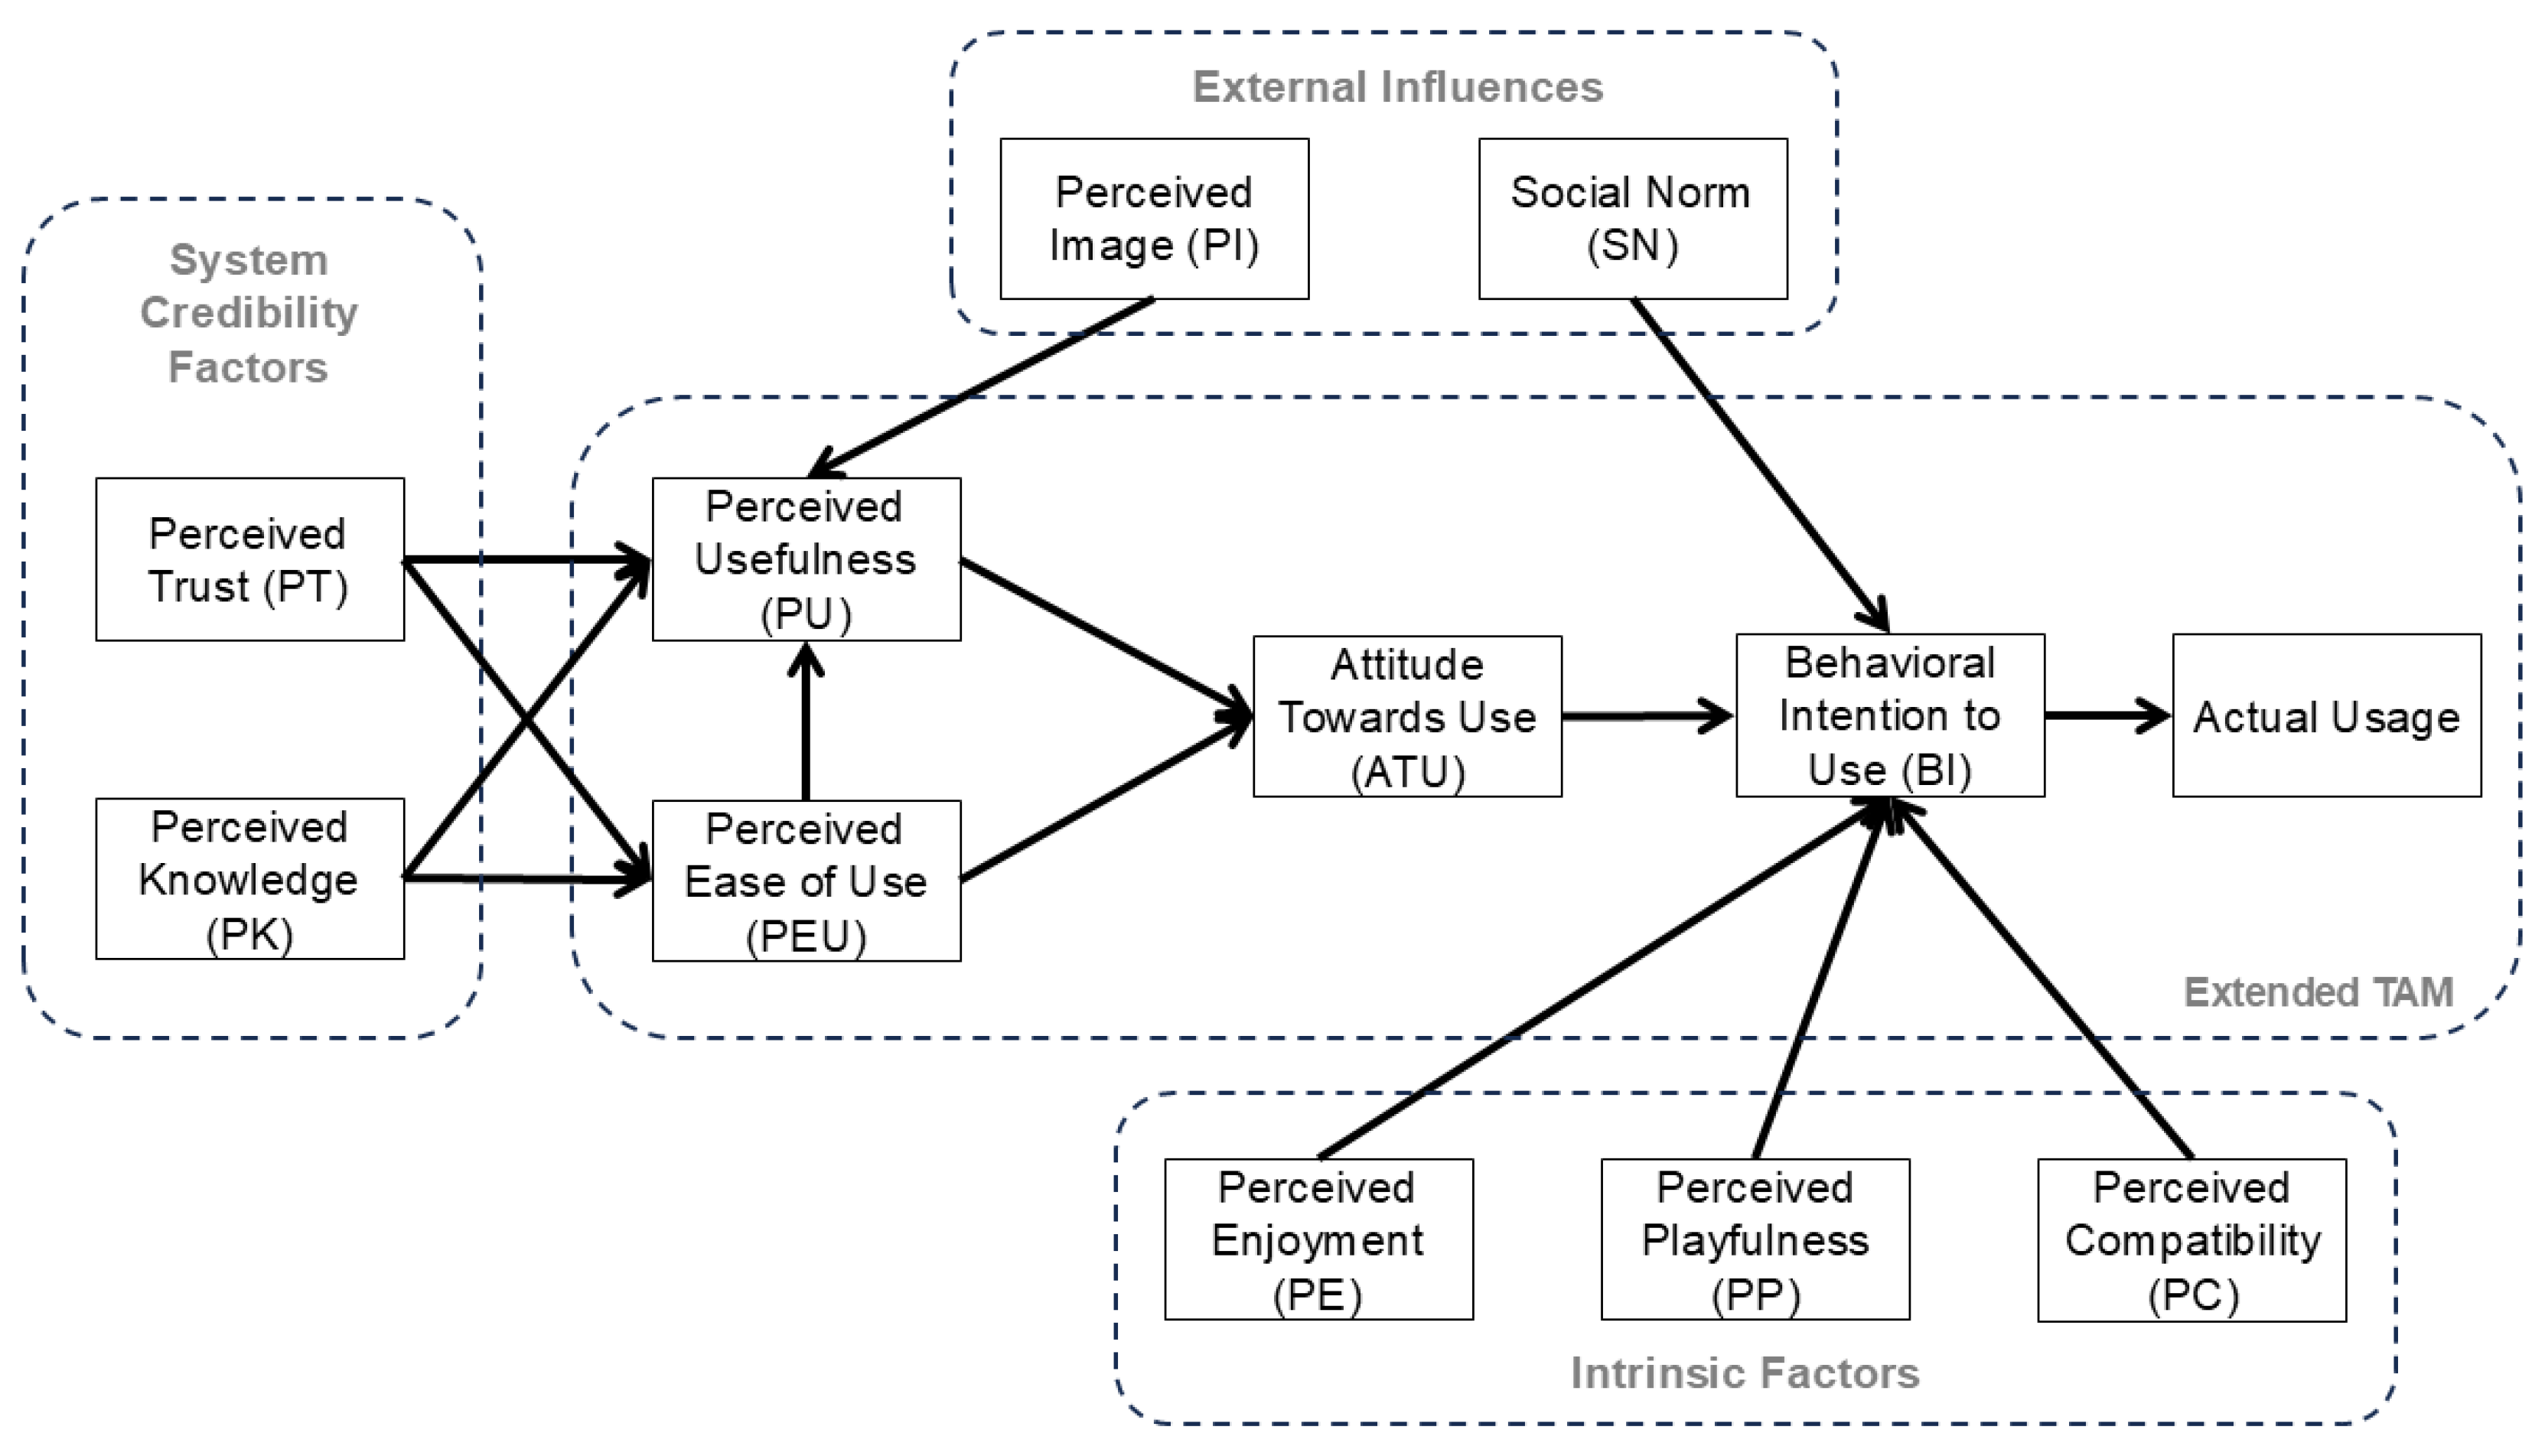
Figure 2.
The VMHR training program on medication safety: (a) Promotional art of the VMHR created by generative artificial intelligence with QR code of a video trailer; (b) Screenshot of the 360-degree video environment and interactive elements in the ward section; (c) Example of information/instructions to learners on identifying and managing potential medication “horrors”.
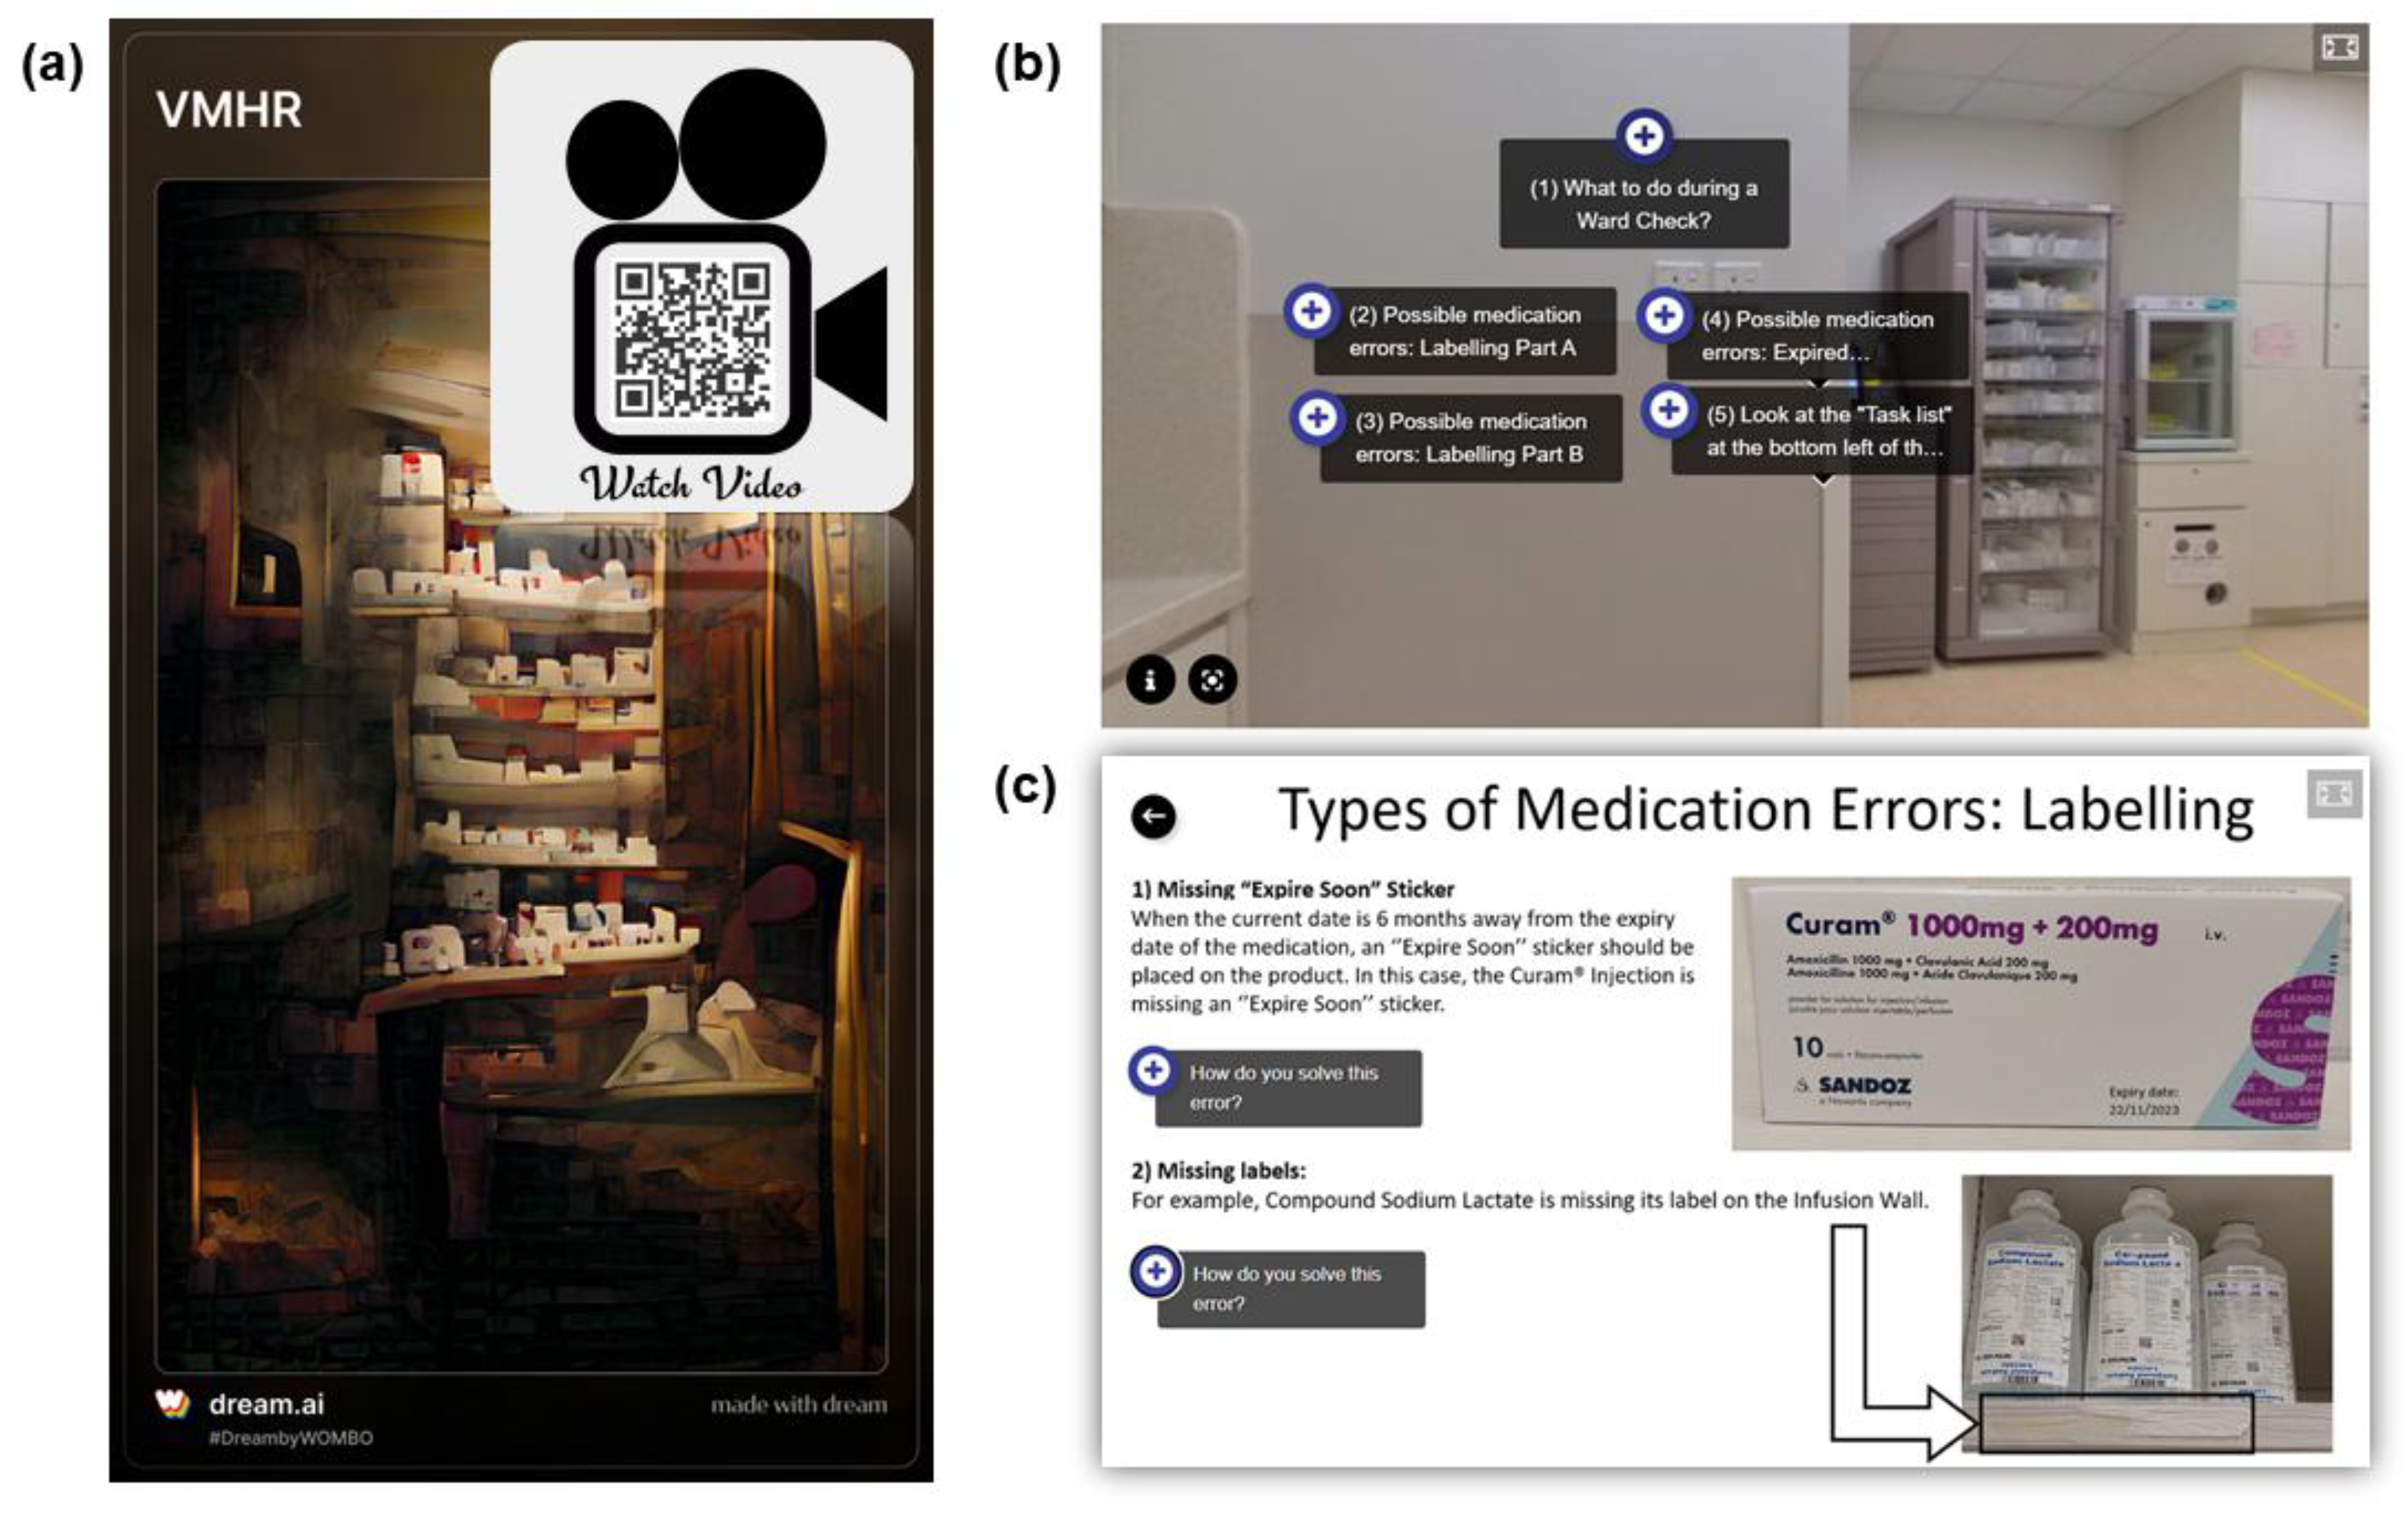

Table 1.
Demographics of participants in pilot user experience study. (N=33).
| Demographics of Participants | Number of Participants (%) |
|---|---|
| Gender: | |
| Male | 10 (30.3) |
| Female | 23 (69.7) |
| Age ranges: | |
| 30 years old or younger | 27 (81.8) |
| Older than 30 years old | 6 (18.2) |
| Designation: | |
| Pharmacist | 5 (15.2) |
| Pre-registration pharmacist | 16 (48.5) |
| Pharmacy technician | 10 (30.3) |
| Pharmacy assistant | 2 (6.1) |
| Field of study: | |
| Pharmacy | 26 (78.8) |
| Pharmaceutical science | 4 (12.1) |
| Others | 3 (9.1) |
| Highest education level: | |
| Pre-university | 9 (27.3) |
| University | 24 (72.7) |
| Workplace: | |
| Inpatient | 17 (51.5) |
| Outpatient & retail | 16 (48.5) |
| Working experience: | |
| No working experience | 6 (18.2) |
| Less than 1 year | 10 (30.3) |
| 1 year or more | 17 (51.5) |
| Type of practice experience: | |
| Local practice | 29 (87.9) |
| Overseas practice | 4 (12.1) |
| Types of immersive technologies used prior to VMHR training a | |
| Augmented reality | 13 (39.4) |
| Augmented virtuality | 7 (21.2) |
| Virtual reality | 14 (42.4) |
| Mirror worlds | 12 (36.4) |
| 360-degree video/image applications | 12 (36.4) |
| Frequency of using extended reality applications: | |
| Never used before | 15 (45.5) |
| Not used in the past 6 months | 12 (36.4) |
| Used at least once in the past 6 months | 6 (18.2) |
| Frequency of using 360-degree video/image applications: | |
| Never used before | 14 (42.4) |
| Not used in the past 6 months | 15 (45.5) |
| Used at least once in the past 6 months | 4 (12.1) |
a Numbers do not add up to 100% due to multiple selections by participants.
Table 2.
Participants’ medication safety knowledge in terms of pre-quiz and post-quiz scores.
| Quiz Categories | Pre-quiz Scores (%) Mean ± SD (Median, IQR) |
Post-quiz Scores (%) Mean ± SD (Median, IQR) |
P-values a |
|---|---|---|---|
| Emergency kit errors | 48.5 ± 22.2 (33.3, 33.3 – 66.7) |
65.7 ± 22.8 (66.7, 50.0 – 66.7) |
0.003* |
| Expired medications | 78.8 ± 24.0 (80.0, 60.0 – 100.0) |
87.9 ± 15.8 (100.0, 80.0 – 100.0) |
0.022* |
| High-risk medications | 77.3 ± 30.8 (100.0, 50.0 – 100.0) |
77.3 ± 25.3 (100.0, 50.0 – 100.0) |
1.000 |
| Inspection process inconsistencies | 37.9 ± 25.1 (50.0, 0.0 – 50.0) |
48.5 ± 29.3 (50.0, 50.0 – 50.0) |
0.071 |
| Labeling errors | 48.0 ± 16.5 (50.0, 33.3 – 66.7) |
61.6 ± 18.4 (66.7, 50.0 – 83.3) |
0.013* |
| Medication storage hazards | 58.4 ± 16.1 (57.1, 42.9 – 71.4) |
65.4 ± 16.8 (71.4, 57.1 – 78.6) |
0.027* |
| Total quiz scores | 58.7 ± 9.0 (60.0, 52.0 – 68.0) |
68.6 ± 10.3 (68.0, 60.0 – 76.0) |
<0.001* |
SD: Standard deviation, IQR: Interquartile range. a Statistical significance of the quiz categories and the total quiz scores were calculated using Wilcoxon signed-rank tests, but means and SDs are included for ease of interpretation. * Statistical significance was defined as p<0.05.
Table 3.
Participants’ ratings of the content in VMHR. (N=33).
| Content in VMHR | Number of Participants (%) |
|---|---|
| Sections that are useful in improving medication safety knowledge: | |
| 360-degree virtual tour | 19 (57.6) |
| Interactive assessment book | 16 (48.5) |
| “Find-the-Errors” spots quiz | 12 (36.4) |
| Rating of Content in VMHR: a | |
| Understanding types of medication storage errors: | |
| Informative b | 30 (90.9) |
| Not very informative c | 3 (9.1) |
| Understanding how to mitigate medication storage hazards: | |
| Informative b | 29 (87.9) |
| Not very informative c | 4 (12.1) |
| Understanding the equipment and tools needed to perform ward/clinic checks: | |
| Informative b | 26 (78.8) |
| Not very informative c | 7 (21.2) |
| Interest in using extended reality and/or 360-degree video/image technologies for training: | |
| Interested d | 21 (63.6) |
| Not very interested e | 12 (36.4) |
a None of the respondents rated “Not informative at all”. b Informative (Informative, Very informative). c Not Very Informative (Not informative at all, Not very informative, Somewhat informative). d Interested (Interested, Very interested). e Not Very Interested (Not interested at all, Not very interested, Neutral).
Table 4.
Score improvements/differences of participants from pre-quiz to post-quiz.
| Demographics of Participants | Score Improvements/differences from Pre-quiz to Post-quiz (%) (Median, IQR) |
||||||
|---|---|---|---|---|---|---|---|
| Emergency kit errors | Expired medications | High-risk medications | Inspection process inconsistencies | Labeling errors | Medication storage hazards | Total quiz scores | |
| Gender: | |||||||
| Male | 33.3 (25.0, 33.3) |
0.0 (0.0, 0.0) |
0.0 (0.0, 0.0) |
0.0 (0.0, 12.5) |
16.7 (0.0, 33.3) |
7.1 (-3.6, 14.3) |
10.0 (4.0, 12.0) |
| Female | 0.0 (0.0, 33.3) |
0.0 (0.0, 20.0) |
0.0 (0.0, 0.0) |
0.0 (0.0, 50.0) |
16.7 (0.0, 33.3) |
14.3 (0.0, 14.3) |
12.0 (0.0, 16.0) |
| P-value a | 0.049* | 0.106 | 1.000 | 0.456 | 0.856 | 0.609 | 0.619 |
| Age ranges: | |||||||
| 30 years old or younger | 33.3 (0.0, 33.3) |
0.0 (0.0, 20.0) |
0.0 (0.0, 0.0) |
0.0 (0.0, 50.0) |
16.7 (0.0, 33.3) |
14.3 (0.0, 14.3) |
12.0 (4.0, 16.0) |
| Older than 30 years old | 16.7 (0.0, 33.3) |
20.0 (-5.0, 40.0) |
0.0 (0.0, 12.5) |
25.0 (-12.5, 50.0) |
16.7 (-8.3, 20.8) |
0.0 (-14.3, 17.9) |
8.0 (3.0, 16.0) |
| P-value a | 0.878 | 0.196 | 0.367 | 0.548 | 0.647 | 0.367 | 0.868 |
| Designation: | |||||||
| Pharmacists | 0.0 (0.0, 33.0) |
0.0 (-20.0, 0.0) |
0.0 (-25.0, 0.0) |
0.0 (-25.0, 50.0) |
16.7 (-8.3, 33.3) |
14.3 (-14.3, 21.4) |
4.0 (-4.0, 14.0) |
| Pre-registration pharmacists | 33.0 (0.0, 33.0) |
0.0 (0.0, 15.0) |
0.0 (0.0, 0.0) |
0.0 (0.0, 0.0) |
16.7 (0.0, 33.3) |
14.3 (0.0, 14.3) |
12.0 (4.0, 22.0) |
| Pharmacy technicians & Pharmacy assistants | 16.7 (0.0, 33.3) |
20.0 (0.0, 20.0) |
0.0 (0.0, 37.5) |
25.0 (0.0, 50.0) |
8.3 (-12.5, 16.7) |
0.0 (-14.3, 14.3) |
10.0 (1.0, 15.0) |
| P-value a | 0.655 | 0.028*,b | 0.091 | 0.319 | 0.321 | 0.270 | 0.408 |
| Field of study: | |||||||
| Pharmacy | 33.3 (0.0, 33.3) |
0.0 (0.0, 20.0) |
0.0 (0.0, 0.0) |
0.0 (0.0, 50.0) |
16.7 (0.0, 33.3) |
14.3 (0.0, 14.3) |
12.0 (4.0, 16.0) |
| Pharmaceutical science | 0.0 (-25.0, 25.0) |
0.0 (-15.0, 15.0) |
0.0 (0.0, 37.5) |
25.0 (0.0, 50.0) |
-8.3 (-16.7, 12.5) |
-7.1 (-25.0, 21.4) |
2.0 (-6.0, 7.0) |
| P-value a | 0.210 | 0.520 | 0.216 | 0.343 | 0.078 | 0.239 | 0.063 |
| Highest education level: | |||||||
| Pre-university | 33.3 (0.0, 33.3) |
20.0 (0.0, 20.0) |
0.0 (0.0, 25.0) |
0.0 (-25.0, 50.0) |
16.7 (-16.7, 16.7) |
0.0 (-14.3, 14.3) |
8.0 (2.0, 14.0) |
| University | 16.7 (0.0, 33.3) |
0.0 (0.0, 20.0) |
0.0 (0.0, 0.0) |
0.0 (0.0, 50.0) |
16.7 (0.0, 33.3) |
14.3 (0.0, 14.3) |
12.0 (4.0, 16.0) |
| P-value a | 0.427 | 0.482 | 0.118 | 0.839 | 0.162 | 0.311 | 0.498 |
| Workplace: | |||||||
| Inpatient | 33.3 (0.0, 33.3) |
0.0 (0.0, 0.0) |
0.0 (0.0, 0.0) |
0.0 (0.0, 50.0) |
16.7 (0.0, 25.0) |
14.3 (-14.3, 14.3) |
4.0 (0.0, 12.0) |
| Outpatient & retail | 33.3 (0.0, 33.3) |
20.0 (0.0, 35.0) |
0.0 (0.0, 0.0) |
0.0 (0.0, 50.0) |
16.7 (0.0, 33.3) |
14.3 (0.0, 14.3) |
12.0 (5.0, 19.0) |
| P-value a | 1.000 | 0.015* | 0.164 | 0.825 | 0.838 | 0.611 | 0.060 |
| Working experience: | |||||||
| No working experience | 33.3 (25.0, 66.7) |
0.0 (-5.0, 15.0) |
0.0 (-12.5, 0.0) |
0.0 (-12.5, 12.5) |
16.7 (12.5, 41.7) |
7.1 (-3.6, 14.3) |
12.0 (5.0, 24.0) |
| Less than 1 year | 16.7 (-33.3, 33.3) |
0.0 (0.0, 20.0) |
0.0 (-12.5, 12.5) |
0.0 (0.0, 0.0) |
8.3 (-4.2, 33.3) |
14.3 (0.0, 17.9) |
8.0 (3.0, 18.0) |
| 1 year or more | 0.0 (0.0, 33.3) |
0.0 (0.0, 20.0) |
0.0 (0.0, 0.0) |
50.0 (0.0, 50.0) |
16.7 (0.0, 25.0) |
0.0 (-7.1, 14.3) |
12.0 (2.0, 14.0) |
| P-value a | 0.079 | 0.734 | 0.637 | 0.142 | 0.590 | 0.469 | 0.757 |
| Type of practice experience: | |||||||
| Local practice | 33.3 (0.0, 33.3) |
0.0 (0.0, 20.0) |
0.0 (0.0, 0.0) |
0.0 (0.0, 50.0) |
16.7 (0.0, 33.3) |
14.3 (0.0, 14.3) |
12.0 (4.0, 16.0) |
| Overseas practice | 33.3 (8.3, 33.3) |
20.0 (-10.0, 20.0) |
25.0 (-37.5, 50.0) |
-25.0 (-50.0, 37.5) |
8.3 (-25.0, 16.7) |
7.1 (-10.7, 25.0) |
8.0 (1.0, 12.0) |
| P-value a | 0.470 | 0.510 | 0.286 | 0.185 | 0.232 | 1.000 | 0.502 |
| Rating of Content in VMHR: a | |||||||
| Understanding types of medication storage errors: | |||||||
| Informative | 33.3 (0.0, 33.3) |
0.0 (0.0, 20.0) |
0.0 (0.0, 0.0) |
0.0 (0.0, 50.0) |
16.7 (0.0, 33.3) |
14.3 (0.0, 14.3) |
12.0 (4.0, 16.0) |
| Not very informative c | 33.3 (0.0, --) |
20.0 (0.0, --) |
0.0 (0.0, 0.0) |
0.0 (-50.0, --) |
0.0 (0.0, --) |
0.0 (-28.6, --) |
4.0 (0.0, --) |
| P-value a | 0.707 | 0.185 | 1.000 | 0.624 | 0.722 | 0.280 | 0.751 |
| Understanding how to mitigate medication storage hazards: | |||||||
| Informative | 33.3 (0.0, 33.3) |
0.0 (0.0, 20.0) |
0.0 (0.0, 0.0) |
0.0 (0.0, 50.0) |
16.7 (0.0, 33.3) |
14.3 (0.0, 14.3) |
12.0 (4.0, 16.0) |
| Not very informative | 33.3 (8.3, 33.3) |
0.0 (0.0, 15.0) |
0.0 (-37.5, 0.0) |
25.0 (0.0, 50.0) |
0.0 (-12.5, 12.5) |
0.0 (-25.0, 25.0) |
6.0 (1.0, 8.0) |
| P-value a | 0.470 | 0.834 | 0.286 | 0.355 | 0.117 | 0.584 | 0.198 |
| Understanding the equipment and tools needed to perform ward/clinic checks: | |||||||
| Informative | 33.3 (0.0, 33.3) |
0.0 (0.0, 20.0) |
0.0 (0.0, 0.0) |
0.0 (0.0, 12.5) |
16.7 (0.0, 33.3) |
14.3 (0.0, 14.3) |
12.0 (3.0, 13.0) |
| Not very informative | 0.0 (0.0, 33.3) |
0.0 (0.0, 20.0) |
0.0 (-50.0, 0.0) |
50.0 (0.0, 50.0) |
16.7 (0.0, 33.3) |
14.3 (0.0, 14.3) |
12.0 (4.0, 24.0) |
| P-value a | 0.613 | 0.738 | 0.089 | 0.018* | 0.307 | 0.872 | 0.461 |
IQR: Interquartile range. a Statistical significance of the quiz categories and the total quiz scores were calculated using Mann-Whitney U tests (2 groups) and Kruskal Wallis tests (>2 groups). b Post-hoc pairwise comparisons with Bonferroni correction showed a statistically significant difference between Pharmacists and Pharmacy Technicians & Pharmacy Assistants (p=0.025). c Third quartiles (75th percentiles) could not be calculated due to the small number of participants who rated content as “Not very informative”, resulting in insufficient data points for calculation. * Statistical significance was defined as p<0.05.
Table 5.
Cronbach’s alpha for the TAM scale.
| TAM Measures | Number of Items/ Statements | Cronbach’s Alpha (α) |
|---|---|---|
| Perceived Knowledge (PK) | 2 | 0.969 |
| Perceived Trust (PT) | 3 | 0.928 |
| Perceived Usefulness (PU) | 3 | 0.796 |
| Perceived Playfulness (PP) | 4 | 0.722 |
| Perceived Enjoyment (PE) | 2 | 0.844 |
| Perceived Compatibility (PC) | 3 | 0.750 |
| Social Norm (SN) a | 3 | 0.499 |
| Perceived Image (PI) | 3 | 0.871 |
| Perceived Ease of Use (PEU) b | 4 | 0.638 |
| Attitude Towards Use (ATU) | 3 | 0.919 |
| Behavioral Intention (BI) | 3 | 0.856 |
| Overall Total | 33 | 0.951 |
a Cronbach’s alpha value for social norm (SN) was lower than 0.6, hence it was removed from all other analyses except for descriptive statistics. b Statement on requiring mental effort to play the VMHR was converted to a reverse scale (1=Totally Agree to 7=Totally Disagree) for analysis of PEU measure.
Table 6.
Participants’ perceptions and experience of the VMHR based on the Technology Acceptance Model (TAM).
Table 6.
Participants’ perceptions and experience of the VMHR based on the Technology Acceptance Model (TAM).
| TAM Measures | TAM Items/Statements | Scores for TAM Statements (Mean ± SD) |
No. of Participants who agreed with statement (%), N=33 a | Scores for TAM Measures (Mean ± SD) |
|---|---|---|---|---|
| Perceived Knowledge (PK) |
|
5.64 ± 1.41 | 28 (84.8) | 5.58 ± 1.37 |
|
5.52 ± 1.37 | 28 (84.8) | ||
| Perceived Trust (PT) |
|
5.61 ± 0.93 | 28 (84.8) | 5.55 ± 0.81 |
|
5.48 ± 0.87 | 28 (84.8) | ||
|
5.55 ± 0.79 | 29 (87.9) | ||
| Perceived Usefulness (PU) |
|
5.67 ± 0.92 | 31 (93.9) | 5.44 ± 0.87 |
|
5.33 ± 1.14 | 27 (81.8) | ||
|
5.33 ± 1.02 | 26 (78.8) | ||
| Perceived Playfulness (PP) |
|
5.52 ± 1.00 | 29 (87.9) | 5.35 ± 0.86 |
|
4.85 ± 1.56 | 24 (72.7) | ||
|
5.79 ± 0.86 | 31 (93.9) | ||
|
5.24 ± 1.12 | 23 (69.7) | ||
| Perceived Enjoyment (PE) |
|
5.27 ± 1.26 | 27 (81.8) | 5.32 ± 1.07 |
|
5.36 ± 1.03 | 28 (84.8) | ||
| Perceived Compatibility (PC) |
|
4.97 ± 1.40 | 24 (72.7) | 5.25 ± 1.00 |
|
4.94 ± 1.39 | 22 (66.7) | ||
|
5.85 ± 0.76 | 31 (93.9) | ||
| Social Norm (SN) |
|
5.73 ± 0.88 | 29 (87.9) | 5.24 ± 0.89 |
|
5.30 ± 1.05 | 26 (78.8) | ||
|
4.70 ± 1.70 | 22 (66.7) | ||
| Perceived Image (PI) |
|
5.12 ± 1.02 | 22 (66.7) | 5.09 ± 1.03 |
|
4.82 ± 1.33 | 21 (63.6) | ||
|
5.33 ± 1.08 | 23 (69.7) | ||
| Perceived Ease of Use (PEU) |
|
5.73 ± 1.01 | 31 (93.9) | 4.65 ± 0.83 |
|
4.82 ± 1.38 | 23 (69.7) | ||
|
2.76 ± 1.17 | 25 (75.8) | ||
|
5.30 ± 1.19 | 27 (81.8) | ||
| Attitude Towards Use (ATU) |
|
4.30 ± 1.36 | 14 (42.4) | 4.23 ± 1.21 |
|
4.30 ± 1.29 | 15 (45.5) | ||
|
4.09 ± 1.28 | 11 (33.3) | ||
| Behavioral Intention to Use (BI) |
|
5.61 ± 0.86 | 29 (87.9) | 5.34 ± 0.87 |
|
5.09 ± 1.10 | 25 (75.8) | ||
|
5.33 ± 0.99 | 26 (78.8) |
SD: Standard deviation. a Number of participants who agreed with the TAM statements included those who rated 5, 6 and 7 on the TAM scale. b Statement was analyzed based on a reverse scale (1=Totally Agree to 7=Totally Disagree).
Table 7.
Participants’ prior experience and interest in immersive technologies, and usefulness of VMHR content with TAM measures.
Table 7.
Participants’ prior experience and interest in immersive technologies, and usefulness of VMHR content with TAM measures.
| Prior Experience and Interest in Immersive Technologies | Ratings of TAM Measures (Median, IQR) | |||||||||
|---|---|---|---|---|---|---|---|---|---|---|
| PK | PT | PU | PP | PE | PC | PI | PEU | ATU | BI | |
| Prior experiences with: | ||||||||||
| Augmented reality | ||||||||||
| Yes | 6.0 (5.3, 7.0) |
6.0 (4.7, 6.0) |
5.7 (4.8, 6.0) |
5.0 (4.6, 6.0) |
5.5 (5.0, 6.0) |
5.7 (4.2, 5.8) |
5.0 (4.0, 6.0) |
4.5 (4.4, 5.0) |
3.7 (3.0, 5.0) |
5.7 (4.2, 6.0) |
| No | 6.0 (5.5, 6.0) |
6.0 (5.1, 6.0) |
6.0 (5.0, 6.0) |
5.9 (4.8, 6.0) |
6.0 (5.0, 6.0) |
5.7 (5.0, 6.0) |
5.2 (4.2, 6.0) |
5.0 (4.5, 5.2) |
4.2 (3.1, 5.3) |
5.7 (5.0, 6.0) |
| P-value a | 0.404 | 0.624 | 0.437 | 0.452 | 0.508 | 0.277 | 0.641 | 0.340 | 0.458 | 0.297 |
| Augmented virtuality | ||||||||||
| Yes | 6.0 (6.0, 7.0) |
6.0 (4.3, 6.0) |
6.0 (5.7, 6.0) |
5.0 (4.5, 6.0) |
6.0 (5.0, 6.0) |
5.7 (5.0, 6.0) |
5.7 (4.0, 6.0) |
4.5 (4.0, 5.0) |
3.3 (3.0, 5.0) |
5.7 (5.3, 6.0) |
| No | 6.0 (5.4, 6.0) |
6.0 (5.0, 6.0) |
5.7 (5.0, 6.0) |
5.8 (4.8, 6.0) |
5.5 (4.9, 6.0) |
5.7 (4.6, 6.0) |
5.0 (4.0, 6.0) |
5.0 (4.5, 5.1) |
4.2 (3.3, 5.1) |
5.7 (4.7, 6.0) |
| P-value a | 0.264 | 0.425 | 0.227 | 0.857 | 0.530 | 0.840 | 0.947 | 0.434 | 0.478 | 0.700 |
| Virtual reality | ||||||||||
| Yes | 6.0 (5.4, 7.0) |
5.0 (4.0, 6.0) |
5.3 (4.0, 5.8) |
4.9 (4.3, 5.8) |
5.3 (4.0, 6.0) |
5.0 (3.7, 5.7) |
4.0 (3.9, 5.7) |
4.5 (3.4, 5.0) |
4.3 (3.6, 5.1) |
5.2 (4.3, 5.7) |
| No | 6.0 (6.0, 6.0) |
6.0 (5.3, 6.0) |
6.0 (5.7, 6.0) |
6.0 (5.0, 6.0) |
6.0 (5.5, 6.0) |
6.0 (5.0, 6.0) |
5.7 (5.0, 6.0) |
5.0 (4.5, 5.3) |
4.0 (3.0, 5.0) |
6.0 (5.3, 6.0) |
| P-value a | 0.953 | 0.026* | 0.006* | 0.006* | 0.068 | 0.003* | 0.006* | 0.059 | 0.279 | 0.008* |
| Mirror worlds | ||||||||||
| Yes | 6.0 (5.3, 6.8) |
6.0 (5.0, 6.0) |
6.0 (5.8, 6.0) |
5.4 (4.8, 6.0) |
5.8 (5.0, 6.0) |
5.7 (5.0, 6.0) |
5.7 (4.1, 6.0) |
4.9 (4.3, 5.4) |
4.5 (3.0, 5.5) |
5.7 (5.1, 6.0) |
| No | 6.0 (5.5, 6.0) |
6.0 (5.0, 6.0) |
5.7 (4.8, 6.0) |
5.8 (4.5, 6.0) |
5.5 (5.0, 6.0) |
5.7 (4.0, 6.0) |
5.0 (4.0, 6.0) |
4.8 (4.5, 5.0) |
4.0 (3.2, 5.0) |
5.7 (4.7, 6.0) |
| P-value a | 0.493 | 0.690 | 0.058 | 0.894 | 0.953 | 0.518 | 0.495 | 0.531 | 0.806 | 0.700 |
| 360-degree video/image applications | ||||||||||
| Yes | 6.0 (5.5, 6.8) |
5.7 (4.3, 6.0) |
5.7 (5.0, 6.0) |
5.8 (5.0, 6.0) |
5.5 (5.0, 6.0) |
5.7 (5.0, 5.9) |
5.2 (4.0, 5.9) |
4.9 (4.5, 5.0) |
4.2 (3.4, 5.0) |
5.7 (4.8, 6.0) |
| No | 6.0 (5.3, 6.0) |
6.0 (5.0, 6.0) |
6.0 (4.8, 6.0) |
5.5 (4.5, 6.0) |
6.0 (5.0, 6.0) |
5.7 (4.3, 6.0) |
5.0 (4.0, 6.0) |
4.8 (4.4, 5.3) |
4.0 (3.0, 5.3) |
5.3 (4.8, 6.0) |
| P-value a | 0.600 | 0.175 | 0.407 | 0.804 | 0.782 | 0.954 | 0.663 | 0.924 | 0.985 | 0.863 |
| Interest in using extended reality and/or 360-degree video/image technologies for training: | ||||||||||
| Interested | 6.0 (6.0, 6.3) |
6.0 (5.2, 6.0) |
6.0 (5.7, 6.0) |
6.0 (5.4, 6.0) |
6.0 (5.5, 6.0) |
6.0 (5.7, 6.0) |
5.7 (4.5, 6.0) |
5.0 (4.8, 5.4) |
4.3 (3.2, 5.2) |
6.0 (5.5, 6.0) |
| Not very interested | 5.3 (3.3, 6.0) |
5.7 (5.0, 6.0) |
5.0 (4.0, 5.7) |
4.9 (4.3, 5.2) |
5.0 (3.3, 5.5) |
4.5 (3.7, 5.0) |
4.5 (3.8, 5.0) |
4.5 (3.3, 4.7) |
3.8 (3.0, 5.0) |
4.8 (4.1, 5.3) |
| P-value a | 0.009* | 0.661 | <0.001* | 0.002* | 0.001* | <0.001* | 0.018* | <0.001* | 0.365 | >0.001* |
| Sections that participants found useful in improving medication safety knowledge: | ||||||||||
| 360-degree virtual tour | ||||||||||
| Yes | 6.0 (6.0, 6.0) |
6.0 (5.3, 6.0) |
6.0 (5.7, 6.0) |
6.0 (5.0, 6.0) |
6.0 (5.5, 6.0) |
5.7 (5.7, 6.0) |
5.7 (4.7, 6.0) |
5.0 (4.5, 5.0) |
4.0 (3.3, 5.0) |
6.0 (5.3, 6.0) |
| No | 5.8 (3.8, 6.0) |
6.0 (5.0, 6.1) |
5.0 (4.5, 6.0) |
4.8 (4.4, 6.0) |
5.0 (3.8, 5.6) |
4.8 (4.0, 5.8) |
4.7 (4.0, 5.8) |
4.6 (4.4, 5.1) |
4.3 (2.9, 5.1) |
5.0 (4.3, 5.8) |
| P-value a | 0.057 | 0.861 | 0.030* | 0.032* | 0.009* | 0.040* | 0.347 | 0.530 | 0.797 | 0.059 |
| Interactive assessment book | ||||||||||
| Yes | 6.0 (6.0, 6.0) |
6.0 (5.3, 6.0) |
5.8 (5.0, 6.0) |
5.8 (4.6, 6.0) |
5.5 (5.0, 6.0) |
5.7 (4.8, 6.0) |
5.2 (4.0, 5.9) |
4.9 (4.5, 5.3) |
5.0 (3.8, 5.3) |
5.7 (4.8, 6.0) |
| No | 6.0 (4.5, 6.0) |
6.0 (4.7, 6.0) |
5.7 (5.0, 6.0) |
5.8 (4.9, 6.0) |
6.0 (5.0, 6.0) |
5.7 (4.3, 6.0) |
5.0 (4.0, 6.0) |
4.8 (4.1, 5.0) |
3.7 (3.0, 4.7) |
5.3 (4.7, 6.0) |
| P-value a | 0.322 | 0.145 | 0.775 | 0.912 | 0.955 | 0.453 | 0.675 | 0.315 | 0.067 | 0.553 |
| “Find-the-Errors” spots quiz | ||||||||||
| Yes | 5.3 (3.3, 6.0) |
5.7 (5.0, 6.0) |
5.7 (4.2, 6.0) |
5.0 (4.6, 6.0) |
5.0 (3.4, 6.0) |
5.3 (4.1, 5.9) |
5.0 (4.0, 5.9) |
4.5 (4.3, 4.9) |
4.0 (2.8, 4.8) |
5.3 (4.3, 5.7) |
| No | 6.0 (6.0, 6.0) |
6.0 (5.0, 6.0) |
6.0 (5.0, 6.0) |
5.8 (4.9, 6.0) |
6.0 (5.5, 6.0) |
5.7 (5.0, 6.0) |
5.7 (4.0, 6.0) |
5.0 (4.5, 5.1) |
4.3 (3.2, 5.3) |
6.0 (5.2, 6.0) |
| P-value a | 0.025* | 0.675 | 0.213 | 0.554 | 0.093 | 0.371 | 0.970 | 0.134 | 0.258 | 0.172 |
PK: Perceived knowledge, PT: Perceived trust, PU: Perceived usefulness, PP: Perceived playfulness, PE: Perceived enjoyment, PC: Perceived compatibility, PI: Perceived image, PEU: Perceived ease of use, ATU: Attitude towards use, BI: Behavioral intention to use. a Statistical significance of the TAM measures were calculated using Mann-Whitney U tests. * Statistical significance was defined as p<0.05.
Table 8.
Correlation of TAM measures with behavioral intention to use.
| TAM Measures a | Spearman’s Correlation Coefficient (rs) b | P-value | 95% Confidence Interval | Exploratory Factor Analysis | |||
|---|---|---|---|---|---|---|---|
| Factor 1 Loadings | Factor 2 Loadings | Factor 3 Loadings | Extraction Communalities c | ||||
| Perceived Knowledge (PK) | 0.582 | <0.001* | 0.288, 0.775 | 0.950 | 0.068 | 0.179 | 0.995 |
| Perceived Trust (PT) | 0.387 | 0.026* | 0.039, 0.651 | 0.068 | 0.230 | 0.014 | 1.000 |
| Perceived Usefulness (PU) | 0.743 | <0.001* | 0.529, 0.868 | 0.610 | 0.458 | 0.320 | 0.997 |
| Perceived Playfulness (PP) | 0.828 | <0.001* | 0.672, 0.914 | 0.565 | 0.555 | 0.155 | 0.986 |
| Perceived Enjoyment (PE) | 0.775 | <0.001* | 0.582, 0.886 | 0.840 | 0.191 | 0.231 | 0.964 |
| Perceived Compatibility (PC) | 0.835 | <0.001* | 0.683, 0.917 | 0.532 | 0.516 | 0.444 | 0.937 |
| Perceived Image (PI) | 0.651 | <0.001* | 0.387, 0.816 | 0.119 | 0.911 | 0.154 | 0.992 |
| Perceived Ease of Use (PEU) | 0.560 | <0.001* | 0.258, 0.762 | 0.299 | 0.187 | 0.896 | 0.997 |
| Attitude Towards Use (ATU) | 0.241 | 0.177 | -0.122, 0.547 | 0.207 | -0.042 | 0.148 | 1.000 |
| Behavioral Intention to Use (BI) | -- | -- | -- | 0.260 | 0.465 | 0.330 | 0.997 |
a Social Norm (SN) is not reported due to poor Cronbach’s alpha. b Spearman’s correlation coefficient (rs) is calculated in relation to participants’ behavioral intention to use VMHR. c A higher extraction communality value indicates that a larger part of the variance in the TAM measure is represented by the factors. A lower value indicates that the factors do not adequately represent the variable. * Statistical significance was defined as p<0.05.
Disclaimer/Publisher’s Note: The statements, opinions and data contained in all publications are solely those of the individual author(s) and contributor(s) and not of MDPI and/or the editor(s). MDPI and/or the editor(s) disclaim responsibility for any injury to people or property resulting from any ideas, methods, instructions or products referred to in the content. |
© 2025 by the authors. Licensee MDPI, Basel, Switzerland. This article is an open access article distributed under the terms and conditions of the Creative Commons Attribution (CC BY) license (http://creativecommons.org/licenses/by/4.0/).
Copyright: This open access article is published under a Creative Commons CC BY 4.0 license, which permit the free download, distribution, and reuse, provided that the author and preprint are cited in any reuse.


