Submitted:
27 April 2025
Posted:
28 April 2025
You are already at the latest version
Abstract
Identifying pollution sources and quantifying their contributions are essential for water environment management in mountainous watershed. This study used PCA-APCS-MLR receptor modeling to analyze monthly water quality indicators in the Longxi River basin. Results showed no significant difference between the water quality of the main stream and tributaries. The water quality of the upstream and downstream was better than the middle reaches. Significant differences were found in wet and dry seasons. In the wet season, agricultural non-point source pollution was the main driver of water quality, contributing 42.9%, followed by watershed background levels and surface runoff. In the dry season, rural domestic wastewater (39.3%) was the leading pollution source. For CODMn exceedance, basin background and agricultural non-point sources in the wet season were the main contributors (46.8% and 44.7%, respectively). For NH3-N, agricultural non-point sources in the wet season and rural domestic pollution in the dry season were the key contributors (44.4% and 71.8%, respectively). Agricultural non-point sources were the dominant pollution source for TN in the wet season (84.2%). Effective measures for improving water quality in the Longxi River Basin may include optimizing fertilization strategies and enhancing the collection and treatment of domestic sewage to control the agricultural non-point sources and rural domestic sewage. This study deepens the distribution and quantitative analysis of water pollution sources in mountainous watersheds, and also provides an important reference for water environment management.
Keywords:
Mountainous basin
; PCA-APCS-MLR
; Water quality
; Pollution sources
; Yangtze River
; Wet and dry season
Research Background
As a primary source(Mir and Gani 2019) of freshwater on the Earth’s surface, rivers play an irreplaceable role in human survival and social development. In recent years, with the rapid urbanization and growth of national economy, water pollution has become a global threat to freshwater resources, including rivers(Xu, Xu et al. 2019, Pak, Chuah et al. 2021, Reitz, Hemric et al. 2021, Ali and Muhammad 2022). Studies have shown that river water quality is mainly affected by natural and anthropogenic factors. Natural factors include soil erosion and weathering, mineral oxidation of rocks, extreme weather such as droughts and heavy rainfalls(Tasdighi, Arabi et al. 2017, Isiyaka, Mustapha et al. 2019, Mir and Gani 2019). Anthropogenic factors mainly involve rural and urban domestic sewage discharge, pollution from agriculture, livestock and aquaculture, industrial wastewater discharge, etc.(Gholizadeh, Melesse et al. 2016, Huang, Zhang et al. 2021, Postigo, Ginebreda et al. 2021, Yotova, Varbanov et al. 2021). Particularly in developing countries, anthropogenic activities have significantly contributed to deterioration of surface water quality (Abbaspour 2011, Xu, Xu et al. 2019, Olmstead and Zheng 2021, Weng 2021). According to the Bulletin of Ecological and Environmental Conditions in China 2022, The water quality of the main stream in the Yangtze River basin in 2022 has improved compared with previous years, but some tributaries are still slightly polluted. Rivers are integral components of the water cycle, and when rivers are polluted, it has a significant impact on the quality of surrounding water bodies. The water environment problems in small basins are prominent, and the improvement is needed. Clarifying the spatial-temporal pattern of water quality, identifying the pollution sources, are crucial for the assessment and protection of water environments(Hou, Zhang et al. 2021).
At present, many scholars have used statistic methods to investigate the spatiotemporal pattern of water quality and the pollution sources. Pillsbury et al. studied the spatiotemporal variation of water quality of Hillsborough and used regression analysis to investigate the impact of natural and man-made pollution sources on water quality(Pillsbury and Byrne 2007). Liu et al. used multivariate statistics to characterize the spatiotemporal pattern of water quality in the Yangtze River Basin from 2008 to 2020, and identified the main driving factors of CODMn, NH3-N and TP concentrations(Liu, Fu et al. 2022). Zhu et al. used principal component analysis and thermal distribution of water quality to examine the spatiotemporal variation of water quality in the Wushui River Basin, and identify the main pollutant factors(Zhu, Wang et al. 2018). However, these studies lack quantitative analysis of the source contribution of river pollution.
On the other hand, researchers also used mechanism models to carry out quantitative analysis. Li (2018) used mechanistic modeling to quantify nitrogen output from different types of agricultural land in a subtropical watershed, clarifying the spatial variability of N sources within the watershed(Li, Zhai et al. 2018). Bai et al. proposed a method to analyze the contribution rate of water pollution sources based on a one-dimensional model, and calculated the contribution rate of a typical transboundary river section in the Yangtze River Basin at different periods(Bai, Chen et al. 2021). Although the mechanism model can help to obtain the river entry coefficients, it requires abundant indoor experimental information.
In recent years, with the establishment of automatic water quality monitoring stations and the continuous progress of monitoring technology, the management department obtained a large amount of accurate water quality monitoring data in a relatively fast and efficient way. It provides an important data basis for reverse tracing analysis based on multivariate statistical techniques. Many scholars have used multivariate statistical techniques to identify and quantify the pollution sources of different river basins around the world, such as the rivers of South Florida(Gholizadeh, Melesse et al. 2016), the Tuo River Basin in China(Hou, Zhang et al. 2021), the Imjin River in South Korea(Cho, Choi et al. 2022), the Zhangweinan Canal in China(Xu, Xu et al. 2012), the coastal waters of Hong Kong(Liu, Tang et al. 2019), Danjiangkou Reservoir(Chen, Li et al. 2015), the Laizhou Bay(Su, Qiu et al. 2021), the Songhua River in Harbin(Zheng, Liu et al. 2018) the Karasu River in Turkey(Varol 2020), the upper reach of the Yangtze River in China(Cheng, Wang et al. 2020). These studies mainly focus on coastal, plain, and more industrially developed watersheds.
However, the dynamics and drivers of pollution in agricultural-dominated mountain watersheds during wet and dry seasons have yet been studied. Rivers in mountainous watersheds faced with significant variations in water quantity due to factors such as large channel slopes, small-scale reservoirs, and levee construction (Ding, Jiang et al. 2015, Biswas and Mosley 2019). Water quality fluctuates in mountainous watersheds due to changes in topography, climate and other factors, especially after heavy rainfall, which accelerates water flow and leads to rapid migration of pollutants(Park, JH et al. 2010, Ai, Shi et al. 2015, Chernos, Macdonald et al. 2022). With the improvement of pollution management and treatment, the problem of point-source pollution has been effectively controlled in China, but the problem of non-point source pollution has gradually become prominent, especially in mountainous area during wet season(Qiu, Luo et al. 2011, Liu, Huang et al. 2020, Haisheng, Queping et al. 2022).
Therefore, the purpose of this study is to understand the spatial and temporal variations of water quality and potential sources of water pollution in mountainous watersheds during wet and dry seasons, and to quantitatively evaluate the contribution of water pollution sources. Our study focus on the Longxi River Basin, which is a first-class tributary of the Yangtze River, located in China’s typical mountainous city of Chongqing, with a relatively large number of rain-fed rivers and developed agricultural land in the basin. In order to provide direction and recommendations for environmental management and governance measures in mountain watersheds.
Materials and Methods
Study Area
The Longxi River basin(LRB) is located in the upper reaches of the Yangtze River and the hinterland of the Three Gorges Reservoir Area, between longitude 107°12′-107°24′E and latitude 29°56′-30°12′N, with a main stream length of 238 km. The Longxi River originates from Liangping District, Chongqing Municipality, and flows through Dianjiang County and Changshou District from the north to the south, and injects itself into the Yangtze River at Fengcheng Street of Changshou District, with a watershed area of 3,248 km2. The water system is well developed and the tributaries are densely distributed, with about 300 tributaries of different sizes forming a plume-like water system. The terrain of the watershed slopes from northeast to southwest, with the highest watershed ridge at an elevation of 1209 m and an outlet elevation of 33 m, making it a typical mountainous watershed. The average annual precipitation in the study area is 1150-1197 mm, with most of the precipitation occurring from May to September. The average annual flow in the estuary is 49 m3 /s, and the annual runoff is 1.55 billion m3.
The Longxi River basin has a long history of hydropower station development. At present, there are 16 hydropower stations distributed in the main stream and 17 in the tributaries, contributing to flow within the runoff. There are 49 urban domestic sewage treatment plants in the basin, with a total design capacity of 211,400 m3/d and an actual capacity of 198,800 m3/d. The water-related enterprises in the basin are mainly agricultural and food processing industry, accounting for 40.74% of the total number of water-related enterprises. The existing rural resident population in the basin is about 1.3 million, accounting for more than 50% of the total population. Agriculture along the basin is well developed, with a focus on rice cultivation, and there are large orchards and vegetable bases distributed throughout the area.
Data Sources and Pre-Processing
This study analyzed the water quality characteristics of the Longxi River basin from 2019 to 2022 using data from six monitoring sites: US, MS, LS, TR1, TR2 and TR3 (Figure 1). Among them, US, MS, LS can reflect the water quality characteristics of the upper, middle and lower reaches of the main stream of the Longxi River. TR1, TR2 and TR3 reflect the water quality characteristics of the main tributaries in the basin. The water quality data were obtained from the Chongqing Ecological Environment Data Center. According to the official website of Chongqing Meteorological Bureau, it designates May-September as the wet season and the other months as the dry season. The analysis of the indicators was carried out followed the standard of GB 3838-2002. All the indicator data below or near the detection limit were deleted in this study.
The selected water quality parameters for investigation in this study include Water temperature(WT), pH, Dissolved oxygen(DO), Permanganate index (CODMn), Chemical oxygen demand(COD), Five-day BOD(BOD5), Ammonium nitrogen (NH3-N), Total phosphorus (TP), Total nitrogen (TN), Electric conductivity(EC), Fluoride(F-), and Arsenic(As). These parameters were analyzed to understand the spatial and temporal variation analysis of water quality, and to quantitatively assess the potential pollution sources in the Longxi River basin.
Methods of Analysis
Multivariate statistical analysis, as an important data processing analysis tool, commonly employs analytical methods such as principal component analysis, APCS-MLR model, and positive definite matrix factorization (PMF). Initially widely used in the analysis of air and soil pollution sources(Karagulian, Belis et al. 2015, Zhang, Cai et al. 2017), these methods have gradually been applied to groundwater and some specific pollution indicators(Meng, Zuo et al. 2018, Chen, Zhou et al. 2023). Some scholars also used methods to characterize water quality changes in rivers and to analyze pollution sources(Gholizadeh, Melesse et al. 2016, Cheng, Wang et al. 2020, Hou, Zhang et al. 2021, Shen, Huang et al. 2021). Gholizadeh, M.H. used the APCS-MLR model and the PMF model to obtain the pollution source characteristics of three rivers in South Florida. The results indicated that the APCS-MLR receptor modeling method exhibited better fitting for river water bodies, especially during high-flow periods (Gholizadeh, Melesse et al. 2016).
In summary, this study constructed a PCA-APCS-MLR model based on principal component analysis and multiple linear regression to realize the pollution source analysis of Longxi River Basin. We used Origin 2021 software to graph the trends of LRB water quality indicators on spatial and temporal scales. SPSS 26.0 and R language were used to realize PCA-APCS-MLR model construction.
Principal Component Analysis
The first step in constructing the PCA-APCS-MLR model is to extract the principal components, eigenvectors and factor score coefficients of the water quality data using Principal Component Analysis(PCA). PCA is a mathematical transformation method that utilizes dimensionality reduction techniques to convert the original multiple variables with certain correlations into a new set of composite variables that retain as much information as possible the information from the original variables.(Helena, Pardo et al. 2000, López-Alonso, Rey-Crespo et al. 2017). These new composite variables are called principal components, and they can represent the main pollution information exhibited in all monitoring data, facilitating the analysis of pollutants sources. The principal component score calculation formula is expressed as:
where is the j principal component score for k samples, is the factor coefficient of pollutant i relative to principal component j,is the standardized value of the concentration of pollutant i for k samples, is the measured concentration of pollutant i for sample k, mg/L, is the arithmetic mean of pollutant i, mg/L, is the standard deviation of pollutant i.
The main calculation steps include: 1) Standardize the original data using the z-score method; 2) Assess the suitability of the data using KMO (Kaiser-Meyer-Olkin) and Bartlett tests; 3) Calculate the correlation coefficient matrix of the standardized data, and the characteristic root and eigenvectors of the correlation coefficient matrix; 4) Determine the number of principal components based on the ratio of the respective characteristic root; and 5)Compute the composite score value of the principal components.
APCS-MLR Model
Receptor modeling of water quality pollutant source apportionment include two statistical techniques, absolute principal components (APCS) and multiple linear regression (MLR).The model is developed based on the assumption that all possible pollution sources contribute linearly to the final concentration of the contaminant of interest at the receptor site(Gholizadeh, Melesse et al. 2016). Singh proposed APCS for estimating the contribution of possible sources to each variable(Singh, Malik et al. 2008). PCA is performed on z-transformed normalized variables. These normalized factor scores should be converted to APCS values before quantifying source contributions. The receptor model APCS values were described in detail by Thurston and Spengler(Thurston and Spengler 1985).The second step of PCA-APCS-MLR model is to obtain the Absolute Principal Component Score (APCS) based on the standardized data, eigenvectors and factor score coefficients obtained in the process of Principal Component Analysis (PCA) after the corresponding calculations. The APCS is calculated as (3)~(5):
where is the j absolute principal component score for the k samples; is the j principal component score at a value of 0; and is the normalized value when the concentration of the i pollutant factor is set to zero.
The third step in constructing the PCA-APCS-MLR model is to conduct a multiple linear regression, using the measured concentrations of the pollution factors as the dependent variable and the absolute principal component APCS as the independent variable. The regression coefficients are used to calculate the contribution of the pollution sources corresponding to each principal factor.
where is the measured value of the concentration of pollutant factor i in k samples; is the regression coefficient of pollutant source j on pollutant factor I; is the value of the absolute principal component score of j for pollutant factor i in k samples; and is the constant term in the multivariate linear regression equation for pollutant factor i, which is generally considered to be the contribution of the unidentified source. The proportionate contribution of source j to pollutant i can be calculated using the following equation.
The contribution of the identified sources is:
The contribution of unidentified sources is:
where is the mean of the j absolute principal component factor scores for pollutant i.
In this study, principal component analysis was conducted for 10 water quality indicators in 6 sites from 2019 to 2022, and the raw data were divided into 2 groups according to the wet and dry seasons. The principal components were extracted for the wet and dry seasons, respectively. In this study, we used the diagnostic covariance matrix and the resulting eigenvalues as criteria, and considered eigenvalues greater than 1 as the main contaminating factors identified, which explain the main information of the raw data. Principal component analysis can identify the main pollutants, but in terms of the actual sources and processes controlled, such an interpretation is subjective and has some generalization limitations(Samsudin, Azid et al. 2017).
Therefore, in this study, before extracting the principal components, the basic statistics of the data were determined by descriptive statistical analysis. We standardized the raw data using the z-score method. To determine the applicability of the Principal Component Analysis (PCA) method, we then conducted Keizer-Meyer-Olkin (KMO) and Bartlett’s test of sphericity to examine the correlation of the variables during wet and dry seasons. The results show that the Bartlett’s spherical test statistic for wet and dry season are 367.635 and 422.144, respectively, with a significance of 0.000. So the correlation coefficient matrix can be considered as significantly different from the unit array. Meanwhile, the KMO values for the wet and dry season were 0.673 and 0.714, respectively. It indicated that the original variables were suitable for factor analysis according to the KMO metrics given by Kaiser. After extracting the factors by PCA, in order to better interpret the public factors, we conducted orthogonal transformation of the factor loading matrix. That is, projecting in the corresponding coordinate system, so that the structure of the rotated factor loading matrix is simplified, and a new set of variables is generated, which is called variance factors (VFs). Clarify the factor structure based on the correlation coefficients between factors and variables. Scholars such as Liu and Karroum, L.A. consider that VFs are categorized as "strong," "moderate," and "weak" if the absolute load is greater than 0.75, between 0.75 and 0.50, or between 0.50 and 0.30, respectively(Liu, Lin et al. 2003, Karroum, El Baghdadi et al. 2019).
Model Validation
To examine the composition and spatial distribution characteristics of the main pollution sources in the study area, the APCS-MLR model was used to establish the relationship between each pollution source with the concentration of the indicators of water quality (CODMn, COD, BOD5, NH3-N, TP, and TN) and the water quality conditions. We carried out the multiple linear regression using the SPSS 26. In order to verify the reliability of the model, we compared the measured values of each water quality indicator with the predicted results (Figure 2). According to the results, the R2 of the model’s calculated and measured concentrations of most of the water quality indicators in the wet and dry seasons is greater than 0.5, indicating that the predicted and measured concentrations are in good agreement(Simeonov, Stratis et al. 2003, Gholizadeh, Melesse et al. 2016). The ratio of the predicted value to the measured value is close to 1, indicating that the model is reliable and can be used to analyze pollution sources in the Longxi River Basin.
Results and Discussion
Spatial and Temporal Characterization of Water Quality
The overall water quality of the six monitoring sites in the LRB in 2019-2022 meets the standards. BOD5, COD, F- showed a yearly decreasing trend. There are exceedances of CODMn, TP, NH3-N and other indicators in specific periods (Figure 3). According to the China Environmental Quality Standards for Surface Water, the critical values for CODMn, TP, NH3-N exceedances are 6mg/L,0.2mg/L,1mg/L. The number of exceedances for CODMn was 7% of the total number of monitors, and CODMn concentration exceeding 5.5mg/L up to 20%. TP exceeded the standard by 8%, with the highest concentration reaching 0.41mg/L. NH3-N exceedances accounted for 2% of the total number of monitoring events.
In terms of water period distribution(Table 1), the indicator values of WT, CODMn, TP and Se were significantly higher in the wet season than in the dry season. DO, NH3-N and Ec were higher in the dry season than in the wet season. BOD5, COD and F- showed a yearly decreasing trend, but water period change were not obvious. WT showed the most largest change, with an average WT of 26.2℃ in wet season, and 14.65℃ in dry season, wet season was 78.84% higher than dry season. Se, TP, and CODMn concentrations were 61.04%, 25%, and 12.5%respectively. These three indicators were higher during wet season than dry season. Se concentrations were 0.00124mg/L and 0.00077mg/L during wet and dry season, TP were 0.15 mg/L and 0.12 mg/L, CODMn 4.78 mg/L and 4.25 mg/L, respectively. DO and WT were negatively correlated (r=0.5118, p<0.01), and the concentration was higher in dry season than wet season, with an average concentration of 8.72 mg/L and 7.1mg/L. NH3-N was higher in dry season than wet season, with an average concentration of 0.28 mg/L and 0.2mg/L. The maximum value of NH3-N during the dry season amounted to 1.43, and exceedances often occured during dry season. BOD5, COD and F- varied little between wet and dry season, the concentrations in wet and dry season were 2.19mg/L and 2.01mg/L,14.77mg/L and 14.37mg/L,0.296mg/L and 0.28mg/L, respectively.
Spatially, the water quality of the upper and lower reaches is better than that of the middle reaches. For different water quality indicators, their values varied in stream and tributaries. The WT of the main stream of Longxi River is slightly higher than the tributaries. The pH value of the tributaries is slightly higher than the main stream. DO, CODMn, COD, NH3-N and TP are lower in the tributaries than in the main stream. BOD5, TN, F-, As, EC in the main stream are lower than that of the tributaries. The water quality of LS is better than that of other tributaries because of the influence of the backwater of the Yangtze River. At LS site, the site where Longxi River joins the main stream of the Yangtze River, the water quality of the main stream of the Yangtze River in the period of "13th Five-Year Plan" is excellent, and the proportion of GB 3838-2002 Ⅰ ~ Ⅱ class water quality sections is 100%(Chen, He et al. 2020). Tributary site LR1, located in Huilong River. according to the Second National Pollution Source Census and the comprehensive assessment of the water ecological health of Longxi River, there are fewer sewage discharging enterprises around Huilong River in Liangping District. The pollution discharges from rural domestic and plantation surface source discharges are less than those in other areas, so the water quality is better than that of other tributary sections. MS and LR2 are in the middle reaches of the Longxi River Basin in Dianjiang County, with poor water quality, and exceedances of CODMn, COD, and TP occurred during the monitoring period, with BOD5 exceeding the standard in March 2019 for section MS, and NH3-N exceeding the standard in March 2020 for section LR.
Potential Pollution Sources in Dry and Wet Season
The principal component loading matrices and total variance for both wet and dry water periods are shown in Table 2 and Figure 4.
During the wet season, the first principal component, VF1 explained 30.869% of the water quality variation, reflecting the largest amount of information. The main loading variables strongly associated with VF1 were CODMn and TN (Table 2 and Figure 4). CODMn and TN can originate from point sources such as domestic wastewater, chemicals, and other pollutants, as well as from nitrogen nutrient salts entering surface water through runoff due to the excessive use of fertilizers in agricultural processes in the watershed(Zhang, Li et al. 2020, Hou, Zhang et al. 2021, Cho, Choi et al. 2022). For VF1, CODMn and TN changed from strong loading in wet season to weak loading in dry season. Therefore, the first principal component in the wet season can be categorized as agricultural non-point sources. The second principal component (VF2) contributed of 19.701%, with pH and TW as the main loadings.PH reflects the acidity and alkalinity of the water body, which plays a role in controlling the redox reaction of the water body. Lake and reservoir type surface water pH is mainly affected by aquatic plants and animals. The river type of surface water pH is mainly affected by the river bottom sand minerals and other background factors. Water temperature is affected by the regional temperature and geothermal heat. Therefore, the second principal component is categorized as watershed background. VF3 explained 13.109% of the water quality variation, with the main loading variable being EC. EC is affected by the concentration of metal ions and the corresponding anions in the water. High salt content increases the conductivity, indicating a great influence by surface runoff. In this study, the VF3 of EC changed from a positive and strong correlation of 0.784 during wet season to a negative and moderate correlation of -0.6 during dry season, suggesting a significant influence by wet deposition of precipitation. So VF3 is categorized as surface runoff and wet deposition.
During dry season, VF1 explained 29.62% of the water quality variation, with strong loadings for NH3-N and TP factors. NH3-N and TP were high in farmland runoff, livestock and poultry wastewater and rural domestic sewage(Chen, Wang et al. 2021, Liu, Fu et al. 2022, Wang, Zhang et al. 2022).In general, agricultural runoff and livestock wastewater flow into the river with surface runoff in the wet season. But in this study, NH3-N and TP were positively and strongly correlated in the dry season, and moderately and weakly correlated in the wet season. The study area, being a commercial grain base area of China, has a large number of rural residential population, with relatively backward domestic sewage treatment facilities, resulting in untreated sewage being directly discharged into nearby rivers, increasing nitrogen and phosphorus loads.. Hence, VF1 in the dry season is categorized as rural domestic sewage.The second principal component (VF2) contributes 21.079% of the water quality variation, an with strong loadings for DO and WT. DO is the best indicator of environmental quality as all aquatic organisms depend on DO to metabolize food to produce energy for life and growth. As WT increase, aquatic organisms become more biologically active, consuming more DO. Therefore, VF2 is categorized as physicochemical and biological non-point source pollution.(Gholizadeh, Melesse et al. 2016).
The third principal component of VF3 explained 10.004% of the variation in water quality, and the main loading variables were CODMn and COD factors. Both of CODMn and COD are pollution indicators of organic matter. Therefore, it suggests that the third main component is related to industrial and domestic wastewater in the basin (Duan, He et al. 2016, Varol 2020). Along the watershed, there are many agricultural and sideline product processing enterprises with most enterprises treating sewage through centralized industrial sewage treatment plants or urban sewage treatment plants. However, some industrial enterprises with incomplete wastewater treatment facilities directly discharge into natural water bodies. Therefore, the VF3 is categorized as an industrial source.
In the wet season, due to the mountainous characteristics of the region, the pollutants mainly originate from agricultural non-point sources. In the dry season, pollutants mainly originate from rural domestic sources. Another pollutants were mainly represented by the river bottom sand mineral and other physical and chemical characteristics of the basin both in wet and dry season. According to the National Economic and Social Development Statistics Bulletin of Chongqing Municipality and three districts and counties, the rural population in the Longxi River Basin in 2022 was 41.93%, significantly higher than the overall rural population in Chongqing Municipality, which was 29.04%. The area of Longxi River Basin accounted for 3.94% of of Chongqing Municipality, but its annual sown area of grain accounted for 9.49% of Chongqing Municipality. This indicates that the mountainous watershed is significantly influenced by the agricultural and rural and topographic and geomorphic background characteristics.
Contribution of Potential Pollution Sources in to Water Quality Wet and Dry Season
The results based on the constructed PCA-APCS-MLR model and the pollution source contribution model are shown in Table 3 and Figure 5.
During the wet season, the average contribution of each source to the water quality indicators shows that the study area is most affected by agricultural sources (42.9%), followed by the basin background (27.11%). For the main exceeding factors, CODMn, the main sources are natural factors and agricultural sources, with contribution rates of 46.75% and 44.71% respectively. COD mainly comes from uncertain factors and agricultural sources. Agricultural sources are also the main sources of BOD5, NH3-N and TN. The contribution rate of agricultural sources to TN reaches 84.16%. TP was greatly affected by the watershed background and surface runoff, the contribution rate is 40.02%.
During the dry season, the study area is most influenced by rural domestic (39.26%), followed by uncertainty, physicochemical and biological nonpoint sources, with contributions of 29.78% and 21.52% contribution, respectively. Industrial sources accounted for a smaller share of 9.44%. Rural domestic sewage are the main sources of NH3-N, TP, BOD5 and COD, with contributions of 71.81%, 45.57%, 40.34% and 30.75%. For CODMn, contributions from rural domestic sewage, physicochemical and biological non-point sources, and industrial sources all account for about 20%. For TN, the unidentified sources account for 34.73%, followed by physicochemical and biological nonpoint sources and rural domestic sources, with contributions of 31.07% and 26.20%.
The main sources of NH3-N pollution in both wet and dry season are agricultural non-point sources and rural domestic sewage, with contribution rates is significantly higher than that of other sources. The contribution rate of agricultural sources to TN in the wet season is as high as 84.16%, indicating that the nitrogen pollution in the Longxi River Basin is mainly originated from agricultural and rural pollution, especially the use of nitrogen fertilizers.
Recommendation
Based on the above studies and discussions, the water-period and spatial variations of water quality in the Longxi River Basin were analyzed. The main sources of pollution in the LRB were preliminarily identified, providing a scientific basis for the local government to manage the water environment. However, there are unidentified pollution sources in all extracted public factors, especially in the dry season, when COD and TN uncertainty sources accounted for more than other pollution source. The results are subject to environmental pressure changes, indicating significant variability. It is necessary to use multivariate statistical methods for qualitative identification of pollution sources alongside regular source surveys(Su, Zhi et al. 2011). The source of river pollution can be analyzed by multi-model coupling methods, such as forward accounting of pollution sources, to corroborate statistical and mechanistic model, thereby improving the credibility of the findings.
Conclusions
In our study, multivariate statistical methods combined with PCA-APCS-MLR techniques were used to evaluate the water-period and spatial variations of water quality in the Longxi River Basin, a first-order tributary of the Yangtze River in a mountainous watershed. Contributions of different pollutant sources to each water quality parameter in the wet and dry seasons were analyzed. Six sampling points were selected, and 12 parameters were analyzed for each sampling point to evaluate the surface water quality of the main stream and tributaries of the Longxi River. According to the results of the water-period and spatial variation water quality evaluation, the overall water quality of the basin meets the standard, and there are exceedances of CODMn, TP, NH3-N and other indexes in individual time periods. WT, CODMn, TP and Se were significantly higher in the wet season than in the dry season. DO, NH3-N and EC were higher in the dry season than in the wet season. BOD5, COD and F- showed a yearly decreasing trend, and but water period change were not obvious. There is no consistent patten of water quality in the main stream and tributaries. The quality of the water in the upstream and the downstream is better than that in the middle reaches.
Three principal components each were extracted during the wet and dry seasons by principal component analysis, and potential pollution sources were identified according to the strength of the correlation of the main loading variables. The PCA-APCS-MLR model quantitatively revealed the differences in the contribution of each pollution source to the six water quality parameters of major concern. During the wet season, agricultural non-point pollution was the most dominant factor influencing water quality in the Longxi River basin (42.9% contribution), followed by the basin background (27.11%). Whereas, in the dry season, rural domestic sewage was the most dominant influencing factor in the watershed (39.26% contribution), followed by physicochemical biological nonpoint sources and industrial sources (21.52% and 9.44%), respectively.
The results of the study showed that multivariate statistical techniques based on the PCA-APCS-MLR model are an effective tool for understanding water-period and spatial variations in water quality in mountainous watersheds, identifying sources of pollution and providing suggests for water environment management. The quality of water environment in the mountainous watershed is greatly influenced by human activities and surface runoff, with the direct discharge of agricultural non-point sources and rural domestic sewage being the main reason for exceeding the water quality standard of the river. To achieve overall improvement of the water quality, multiple measures should be taken for comprehensive management of the water environment in the watershed.
The study helps managers and policy makers gain insight into the major sources of pollution during different water periods and identify priorities for improving water quality. Therefore, for the Longxi River Basin, the priority pollution control focuses on (1) optimizing the fertilization strategy, improving the efficiency of nitrogen and phosphorus fertilizer use, reducing the amount of pesticide use, and improving pesticide utilization.(2)Strengthening the control of surface runoff and soil erosion, especially in the middle reaches of the Longxi River (in the territory of Dianjiang County).(3)Improving the capacity of domestic wastewater collection and treatment, and developing advanced technologies to reduce pollutants in septic tanks and domestic wastewater from decentralized villages.
Further investigations are needed to accurately evaluate changes in unidentified pollution sources and water quality parameters not measured in this study. The results of the study provide useful reference data for water quality management in mountain watersheds.
Author Contributions
Conceptualization, Wenting Qiu; Methodology, Baiyin Liu; Software, Zehua Xu; Validation, Wei Wang; Formal analysis, Wenting Qiu and Zhimiao Zhang; Investigation, Zehua Xu; Resources, Baiyin Liu; Data curation, Xingyue Tu and Biao Wang; Writing – original draft, Wenting Qiu; Writing – review & editing, Xingyue Tu; Visualization, Biao Wang.; Zhimiao Zhang: Investigation.
Funding
This work was supported by the Yangtze River Ecological Environment Protection and Restoration Joint Research Project (2022-LHYJ-02-0602).
Data Availability Statement
The original contributions presented in this study are included in the article/supplementary material. Further inquiries can be directed to the corresponding author(s).
Conflicts of Interest
The authors declare that they have no known competing financial interests or personal relationships that could have appeared to influence the work reported in this paper.
References
- Abbaspour, S. (2011). "Water quality in developing countries, south Asia, South Africa, water quality management and activities that cause water pollution." IPCBEE 15(94): e102.
- Ai, L. , et al. (2015). "Spatial and seasonal patterns in stream water contamination across mountainous watersheds: Linkage with landscape characteristics." Journal of Hydrology 523: 398-408. [CrossRef]
- Ali, W. and S. Muhammad (2022). "Spatial distribution of contaminants and water quality assessment using an indexical approach, Astore River basin, Western Himalayas, Northern Pakistan." Geocarto International 37(26): 14005-14026.
- Bai, H. , et al. (2021). "Contribution rates analysis for sources apportionment to special river sections in Yangtze River Basin." Journal of Hydrology 600: 126519. [CrossRef]
- Biswas, T. K. and L. M. Mosley (2019). "From mountain ranges to sweeping plains, in droughts and flooding rains; River Murray water quality over the last four decades." Water Resources Management 33: 1087-1101. [CrossRef]
- Chen, P. , et al. (2015). "Spatio-temporal variations and source apportionment of water pollution in Danjiangkou Reservoir Basin, Central China." Water 7(6): 2591-2611. [CrossRef]
- Chen, S. , et al. (2020). "Change trends of surface water quality in the mainstream of the Yangtze River during the past four decades." Res. Environ. Sci 33: 1119-1128.
- Chen, S. , et al. (2021). "Temporal trends and source apportionment of water pollution in Honghu Lake, China." Environmental Science and Pollution Research 28(42): 60130-60144. [CrossRef]
- Chen, Z. , et al. (2023). "Assessment of Groundwater Quality Using APCS-MLR Model: A Case Study in the Pilot Promoter Region of Yangtze River Delta Integration Demonstration Zone, China." Water 15(2): 225. [CrossRef]
- Cheng, G. , et al. (2020). "Source apportionment of water pollutants in the upstream of Yangtze River using APCS–MLR." Environmental Geochemistry and Health 42: 3795-3810. [CrossRef]
- Chernos, M. , et al. (2022). "Simulating the cumulative effects of potential open-pit mining and climate change on streamflow and water quality in a mountainous watershed." Science of the Total Environment 806: 150394-. [CrossRef]
- Cho, Y.-C. , et al. (2022). "Identification and Apportionment of Potential Pollution Sources Using Multivariate Statistical Techniques and APCS-MLR Model to Assess Surface Water Quality in Imjin River Watershed, South Korea." Water 14(5): 793. [CrossRef]
- Ding, J. , et al. (2015). "Impacts of land use on surface water quality in a subtropical River Basin: a case study of the Dongjiang River Basin, Southeastern China." Water 7(8): 4427-4445. [CrossRef]
- Duan, W. , et al. (2016). "Water quality assessment and pollution source identification of the eastern Poyang Lake Basin using multivariate statistical methods." Sustainability 8(2): 133. [CrossRef]
- Gholizadeh, M. H. , et al. (2016). "Water quality assessment and apportionment of pollution sources using APCS-MLR and PMF receptor modeling techniques in three major rivers of South Florida." Science of the Total Environment 566: 1552-1567. [CrossRef]
- Haisheng, L. , et al. (2022). "Focusing on water eco-environment problems and sustainably promoting ecological conservation and restoration of the Yangtze River." Journal of Environmental Engineering and Technology 12(2): 336-347.
- Helena, B. , et al. (2000). "Temporal evolution of groundwater composition in an alluvial aquifer (Pisuerga River, Spain) by principal component analysis." Water research 34(3): 807-816.
- Hou, X. , et al. (2021). "Pollution source apportionment of Tuohe river based on absolute Principal component score-multiple linear regression." Research of Environmental Sciences 34(10): 2350-2357.
- Huang, J. , et al. (2021). "Characterizing the river water quality in China: Recent progress and on-going challenges." Water research 201: 117309. [CrossRef]
- Isiyaka, H. A. , et al. (2019). "Water quality modelling using artificial neural network and multivariate statistical techniques." Modeling Earth Systems and Environment 5: 583-593. [CrossRef]
- Karagulian, F. , et al. (2015). "Contributions to cities’ ambient particulate matter (PM): A systematic review of local source contributions at global level." Atmospheric environment 120: 475-483. [CrossRef]
- Karroum, L. , et al. (2019). "Assessment of surface water quality using multivariate statistical techniques: EL Abid River, Middle Atlas, Morocco as a case study." Desalin. Water Treat 143: 118-125.
- Li, W. , et al. (2018). "Influences of agricultural land use composition and distribution on nitrogen export from a subtropical watershed in China." Science of the Total Environment 642: 21-32. [CrossRef]
- Liu, C.-W. , et al. (2003). "Application of factor analysis in the assessment of groundwater quality in a blackfoot disease area in Taiwan." Science of the Total Environment 313(1-3): 77-89. [CrossRef]
- Liu, L. , et al. (2020). "Main problems, situation and countermeasures of water eco-environment security in the Yangtze River Basin." Research of Environmental Sciences 33(5): 1081-1090.
- Liu, L. , et al. (2019). "Tracing the potential pollution sources of the coastal water in Hong Kong with statistical models combining APCS-MLR." Journal of Environmental Management 245: 143-150. [CrossRef]
- Liu, S. , et al. (2022). "Spatiotemporal variations of water quality and their driving forces in the Yangtze River Basin, China, from 2008 to 2020 based on multi-statistical analyses." Environmental Science and Pollution Research 29(46): 69388-69401.
- López-Alonso, M. , et al. (2017). "Identifying sources of metal exposure in organic and conventional dairy farming." Chemosphere 185: 1048-1055. [CrossRef]
- Meng, L. , et al. (2018). "Apportionment and evolution of pollution sources in a typical riverside groundwater resource area using PCA-APCS-MLR model." Journal of contaminant hydrology 218: 70-83. [CrossRef]
- Mir, R. A. and K. M. Gani (2019). "Water quality evaluation of the upper stretch of the river Jhelum using multivariate statistical techniques." Arabian Journal of Geosciences 12: 1-19. [CrossRef]
- Olmstead, S. and J. Zheng (2021). "Water pollution control in developing countries: Policy instruments and empirical evidence." Review of Environmental Economics and Policy 15(2): 261-280. [CrossRef]
- Pak, H. Y. , et al. (2021). "A framework for assessing the adequacy of Water Quality Index–Quantifying parameter sensitivity and uncertainties in missing values distribution." Science of the Total Environment 751: 141982. [CrossRef]
- Park, et al. (2010). "Potential effects of climate change and variability on watershed biogeochemical processes and water quality in Northeast Asia." ENVIRON INT 2010,36(2)(-): 212-225.
- Pillsbury, L. A. and R. H. Byrne (2007). "Spatial and temporal chemical variability in the Hillsborough River system." Marine Chemistry 104(1-2): 4-16. [CrossRef]
- Postigo, C. , et al. (2021). "Investigative monitoring of pesticide and nitrogen pollution sources in a complex multi-stressed catchment: The lower Llobregat River basin case study (Barcelona, Spain)." Science of the Total Environment 755: 142377. [CrossRef]
- Qiu, L. , et al. (2011). "Research on large-scaled spatial non-point source pollution load of the Yangtze River Basin." Yangtze River 18: 81-84.
- Reitz, A. , et al. (2021). "Evaluation of a multivariate analysis modeling approach identifying sources and patterns of nonpoint fecal pollution in a mixed use watershed." Journal of Environmental Management 277: 111413. [CrossRef]
- Samsudin, M. S. , et al. (2017). "River water quality assessment using APCS-MLR and statistical process control in Johor River Basin, Malaysia." International Journal of Advanced and Applied Sciences 4(8): 84-97.
- Shen, D. , et al. (2021). "The source apportionment of N and P pollution in the surface waters of lowland urban area based on EEM-PARAFAC and PCA-APCS-MLR." Environmental Research 197: 111022. [CrossRef]
- Simeonov, V. , et al. (2003). "Assessment of the surface water quality in Northern Greece." Water research 37(17): 4119-4124. [CrossRef]
- Singh, K. P. , et al. (2008). "Receptor modeling for source apportionment of polycyclic aromatic hydrocarbons in urban atmosphere." Environmental monitoring and assessment 136: 183-196. [CrossRef]
- Su, J. , et al. (2021). "Use of multivariate statistical techniques to study spatial variability and sources apportionment of pollution in rivers flowing into the laizhou bay in dongying district." Water 13(6): 772. [CrossRef]
- Su, S. , et al. (2011). "Spatio-temporal patterns and source apportionment of pollution in Qiantang River (China) using neural-based modeling and multivariate statistical techniques." Physics and Chemistry of the Earth, Parts A/B/C 36(9-11): 379-386. [CrossRef]
- Tasdighi, A. , et al. (2017). "The relationship between land use and vulnerability to nitrogen and phosphorus pollution in an urban watershed." Journal of Environmental Quality 46(1): 113-122. [CrossRef]
- Thurston, G. D. and J. D. Spengler (1985). "A quantitative assessment of source contributions to inhalable particulate matter pollution in metropolitan Boston." Atmospheric Environment (1967) 19(1): 9-25. [CrossRef]
- Varol, M. (2020). "Spatio-temporal changes in surface water quality and sediment phosphorus content of a large reservoir in Turkey." Environmental Pollution 259: 113860. [CrossRef]
- Wang, X. , et al. (2022). "Using EEM-PARAFAC to identify and trace the pollution sources of surface water with receptor models in Taihu Lake Basin, China." Journal of Environmental Management 321: 115925. [CrossRef]
- Weng, C.-H. (2021). Environmental concerns and pollution control in the context of developing countries, Springer. 28: 46085-46088. [CrossRef]
- Xu, H.-S. , et al. (2012). "Spatiotemporal variation analysis and identification of water pollution sources in the Zhangweinan River basin." Huan Jing ke Xue= Huanjing Kexue 33(2): 359-369.
- Xu, Z. , et al. (2019). "Urban river pollution control in developing countries." Nature Sustainability 2(3): 158-160. [CrossRef]
- Yotova, G. , et al. (2021). "Water quality assessment of a river catchment by the composite water quality index and self-organizing maps." Ecological indicators 120: 106872. [CrossRef]
- Zhang, H. , et al. (2020). "Water quality assessment and pollution source apportionment using multi-statistic and APCS-MLR modeling techniques in Min River Basin, China." Environmental Science and Pollution Research 27: 41987-42000. [CrossRef]
- Zhang, Y. , et al. (2017). "Review of receptor-based source apportionment research of fine particulate matter and its challenges in China." Science of the Total Environment 586: 917-929. [CrossRef]
- Zheng, Q. , et al. (2018). "Water environmental quality assessment and source apportionment in Harbin section of Songhua River." Res. Environ. Sci 31: 507-513.
- Zhu, L. , et al. (2018). "Spatio-temporal distribution of water quality and source identification of pollution in Wushui River Basin." Acta Scientiae Circumstantiae 38(6): 2150-2156.
Figure 1.
Locations of study area and sampling stations in the Longxi River Basin(LRB), China. Stations: Longxi River (US,MS and LS) of the main streams of the LRB; Huilong River (TR1), Wolong River (TR2), Dasha River (TR3) of the main tributaries of the LRB.
Figure 1.
Locations of study area and sampling stations in the Longxi River Basin(LRB), China. Stations: Longxi River (US,MS and LS) of the main streams of the LRB; Huilong River (TR1), Wolong River (TR2), Dasha River (TR3) of the main tributaries of the LRB.
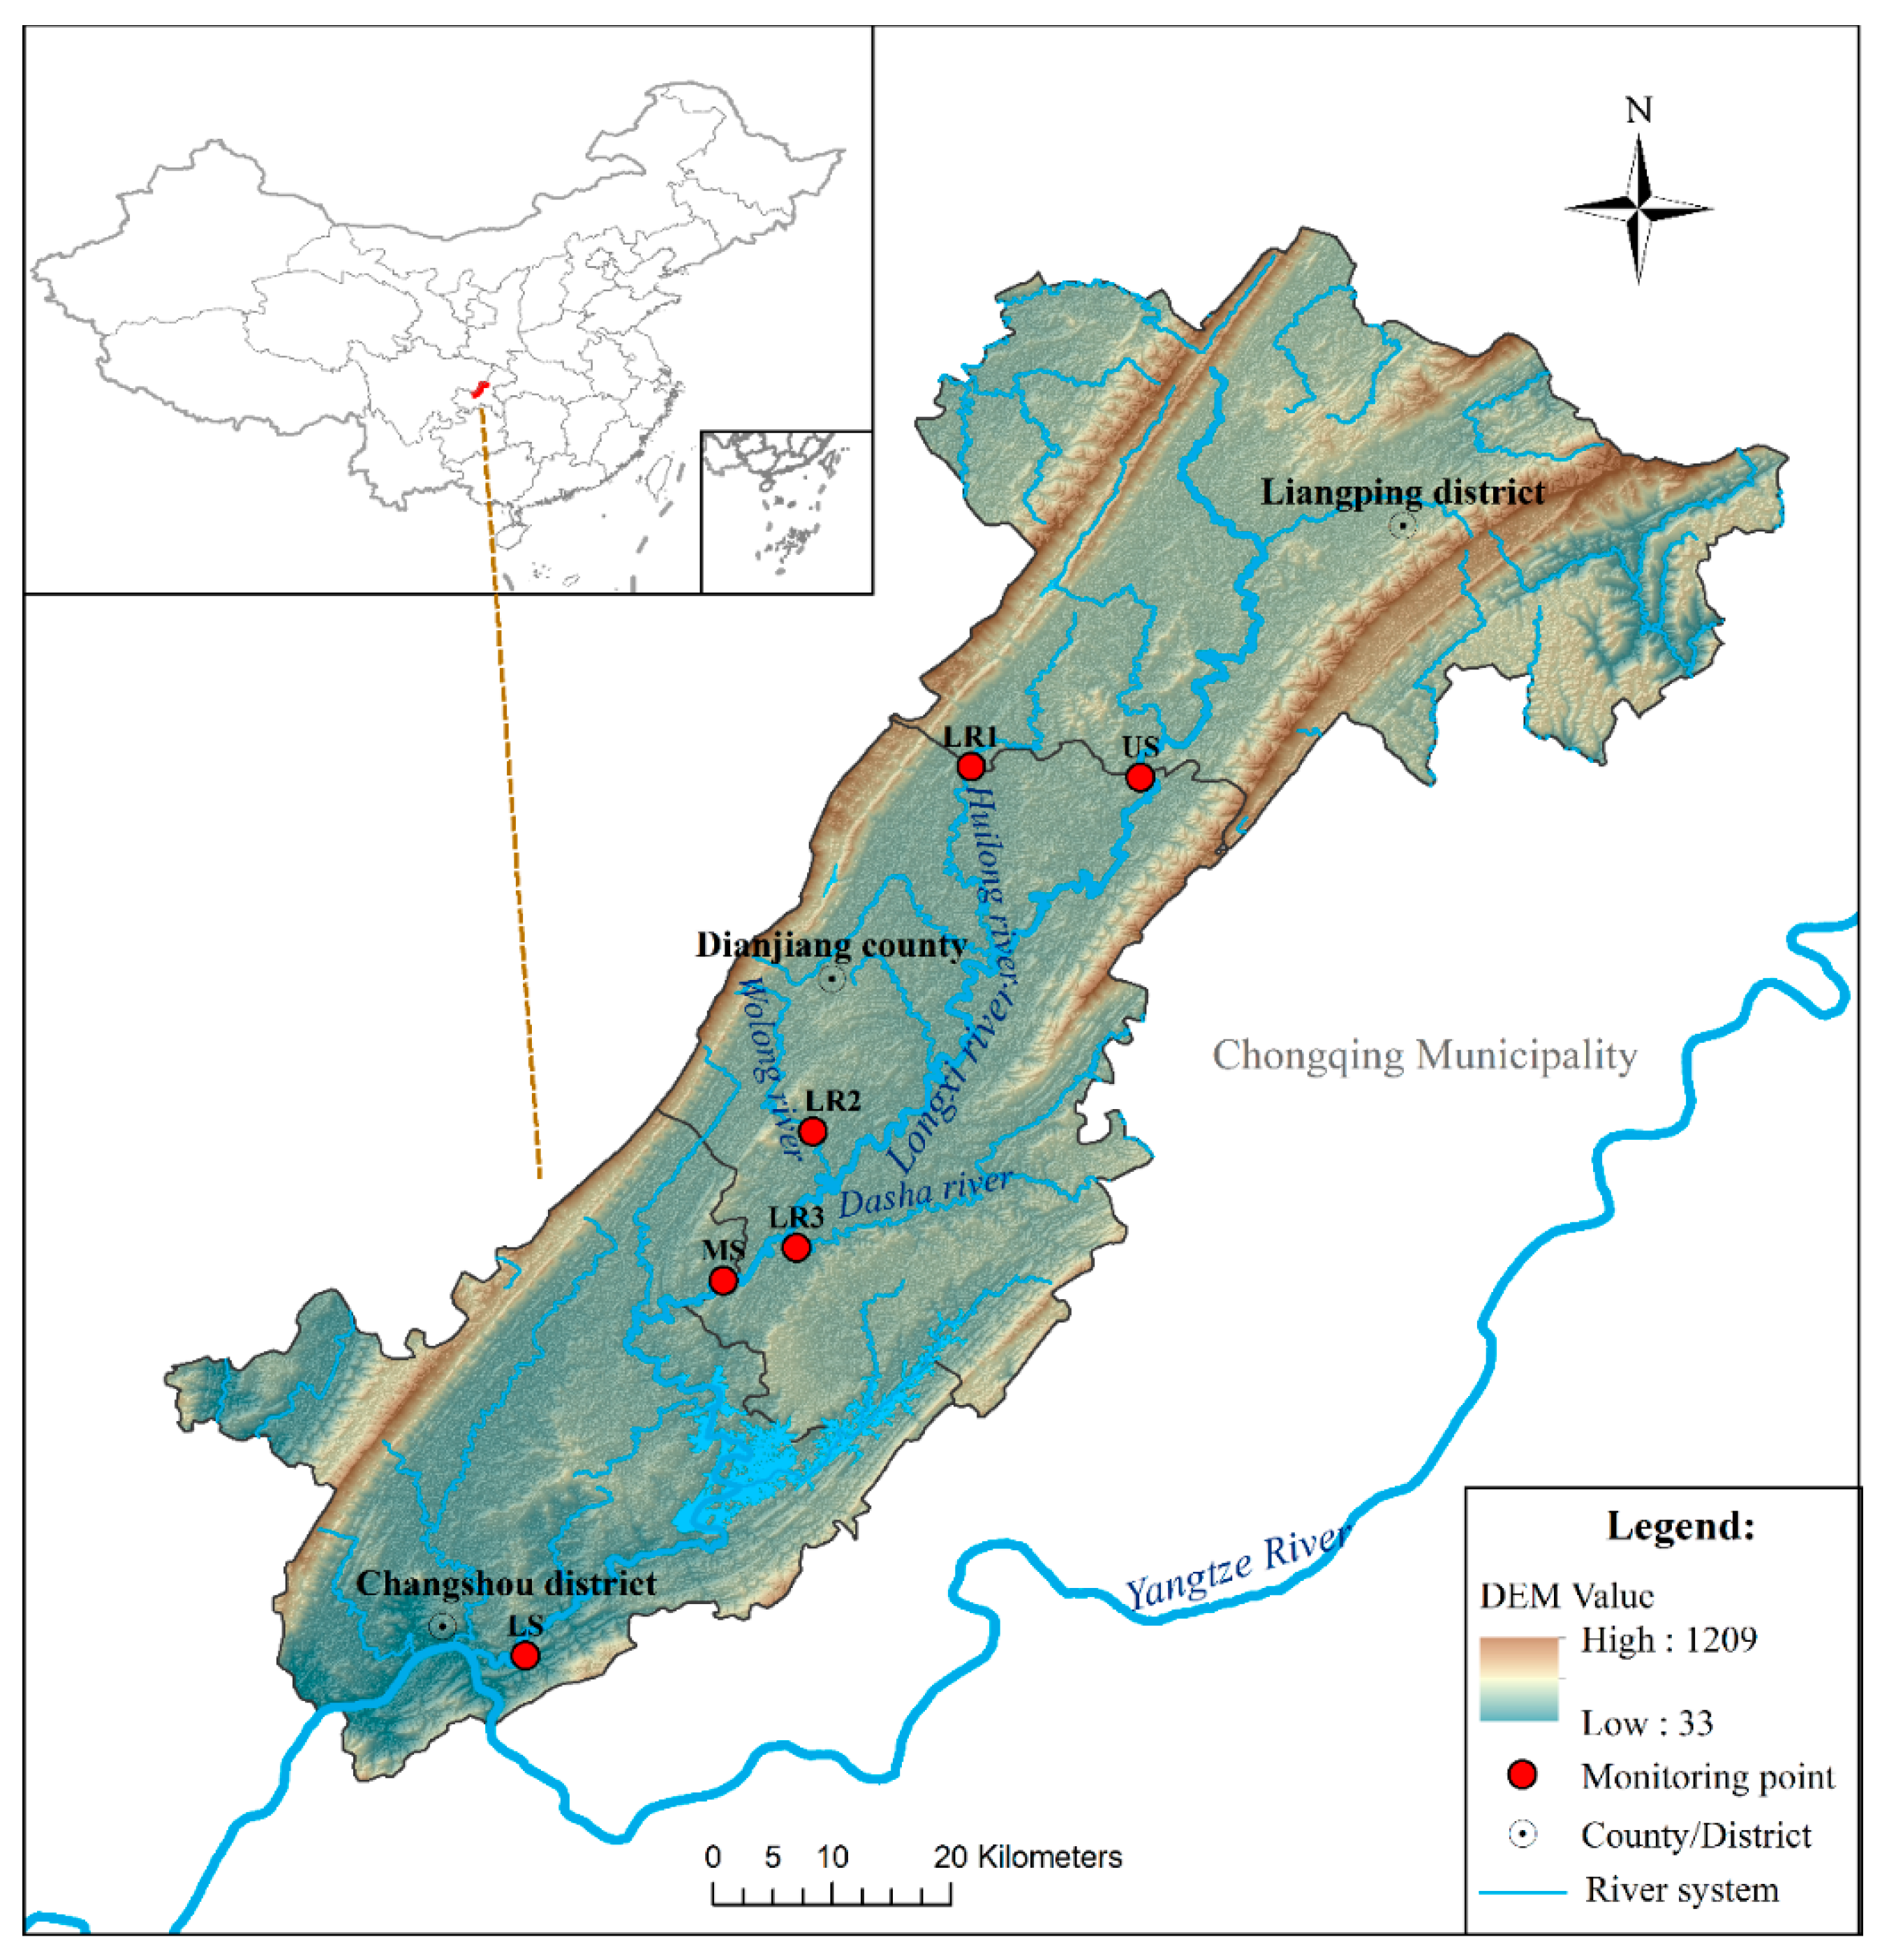
Figure 2.
Comparison of observed and predicted concentrations of key pollutants for wet season and dry season in LRB.
Figure 2.
Comparison of observed and predicted concentrations of key pollutants for wet season and dry season in LRB.
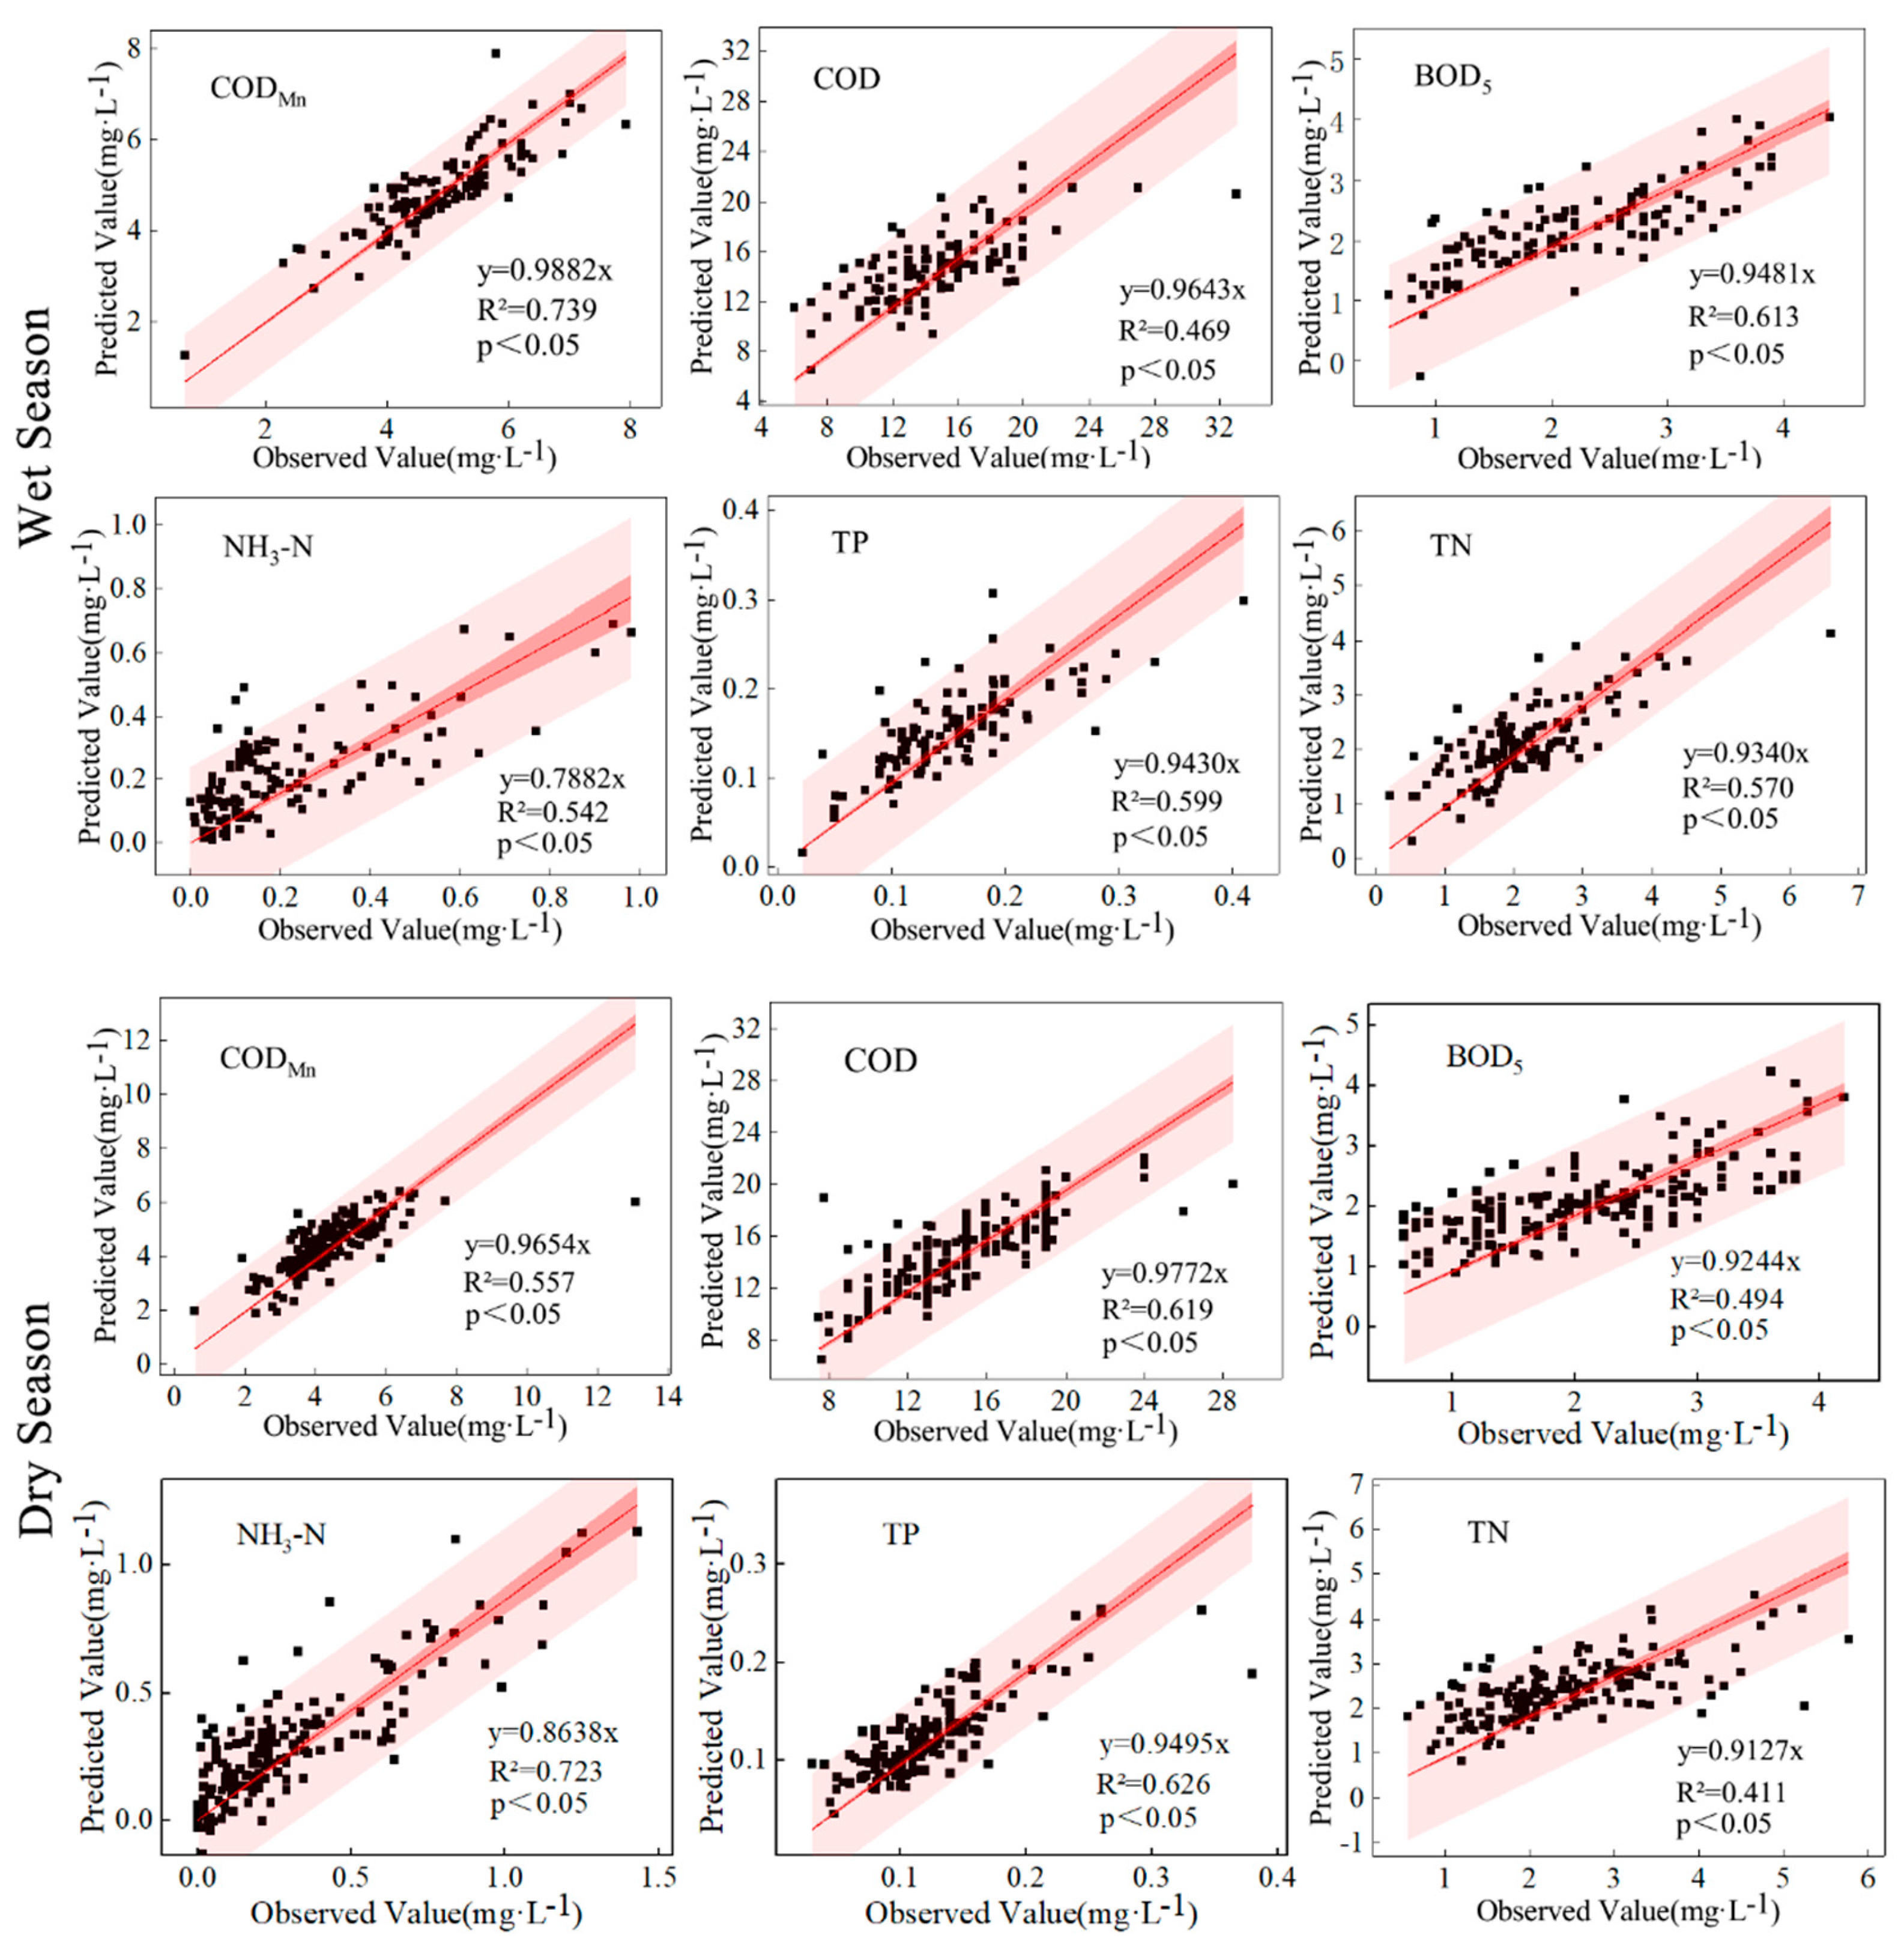
Figure 3.
Spatial-temporal variations of water quality concentration in LRB(US,MS,LS,LR1,LR2,LR3).
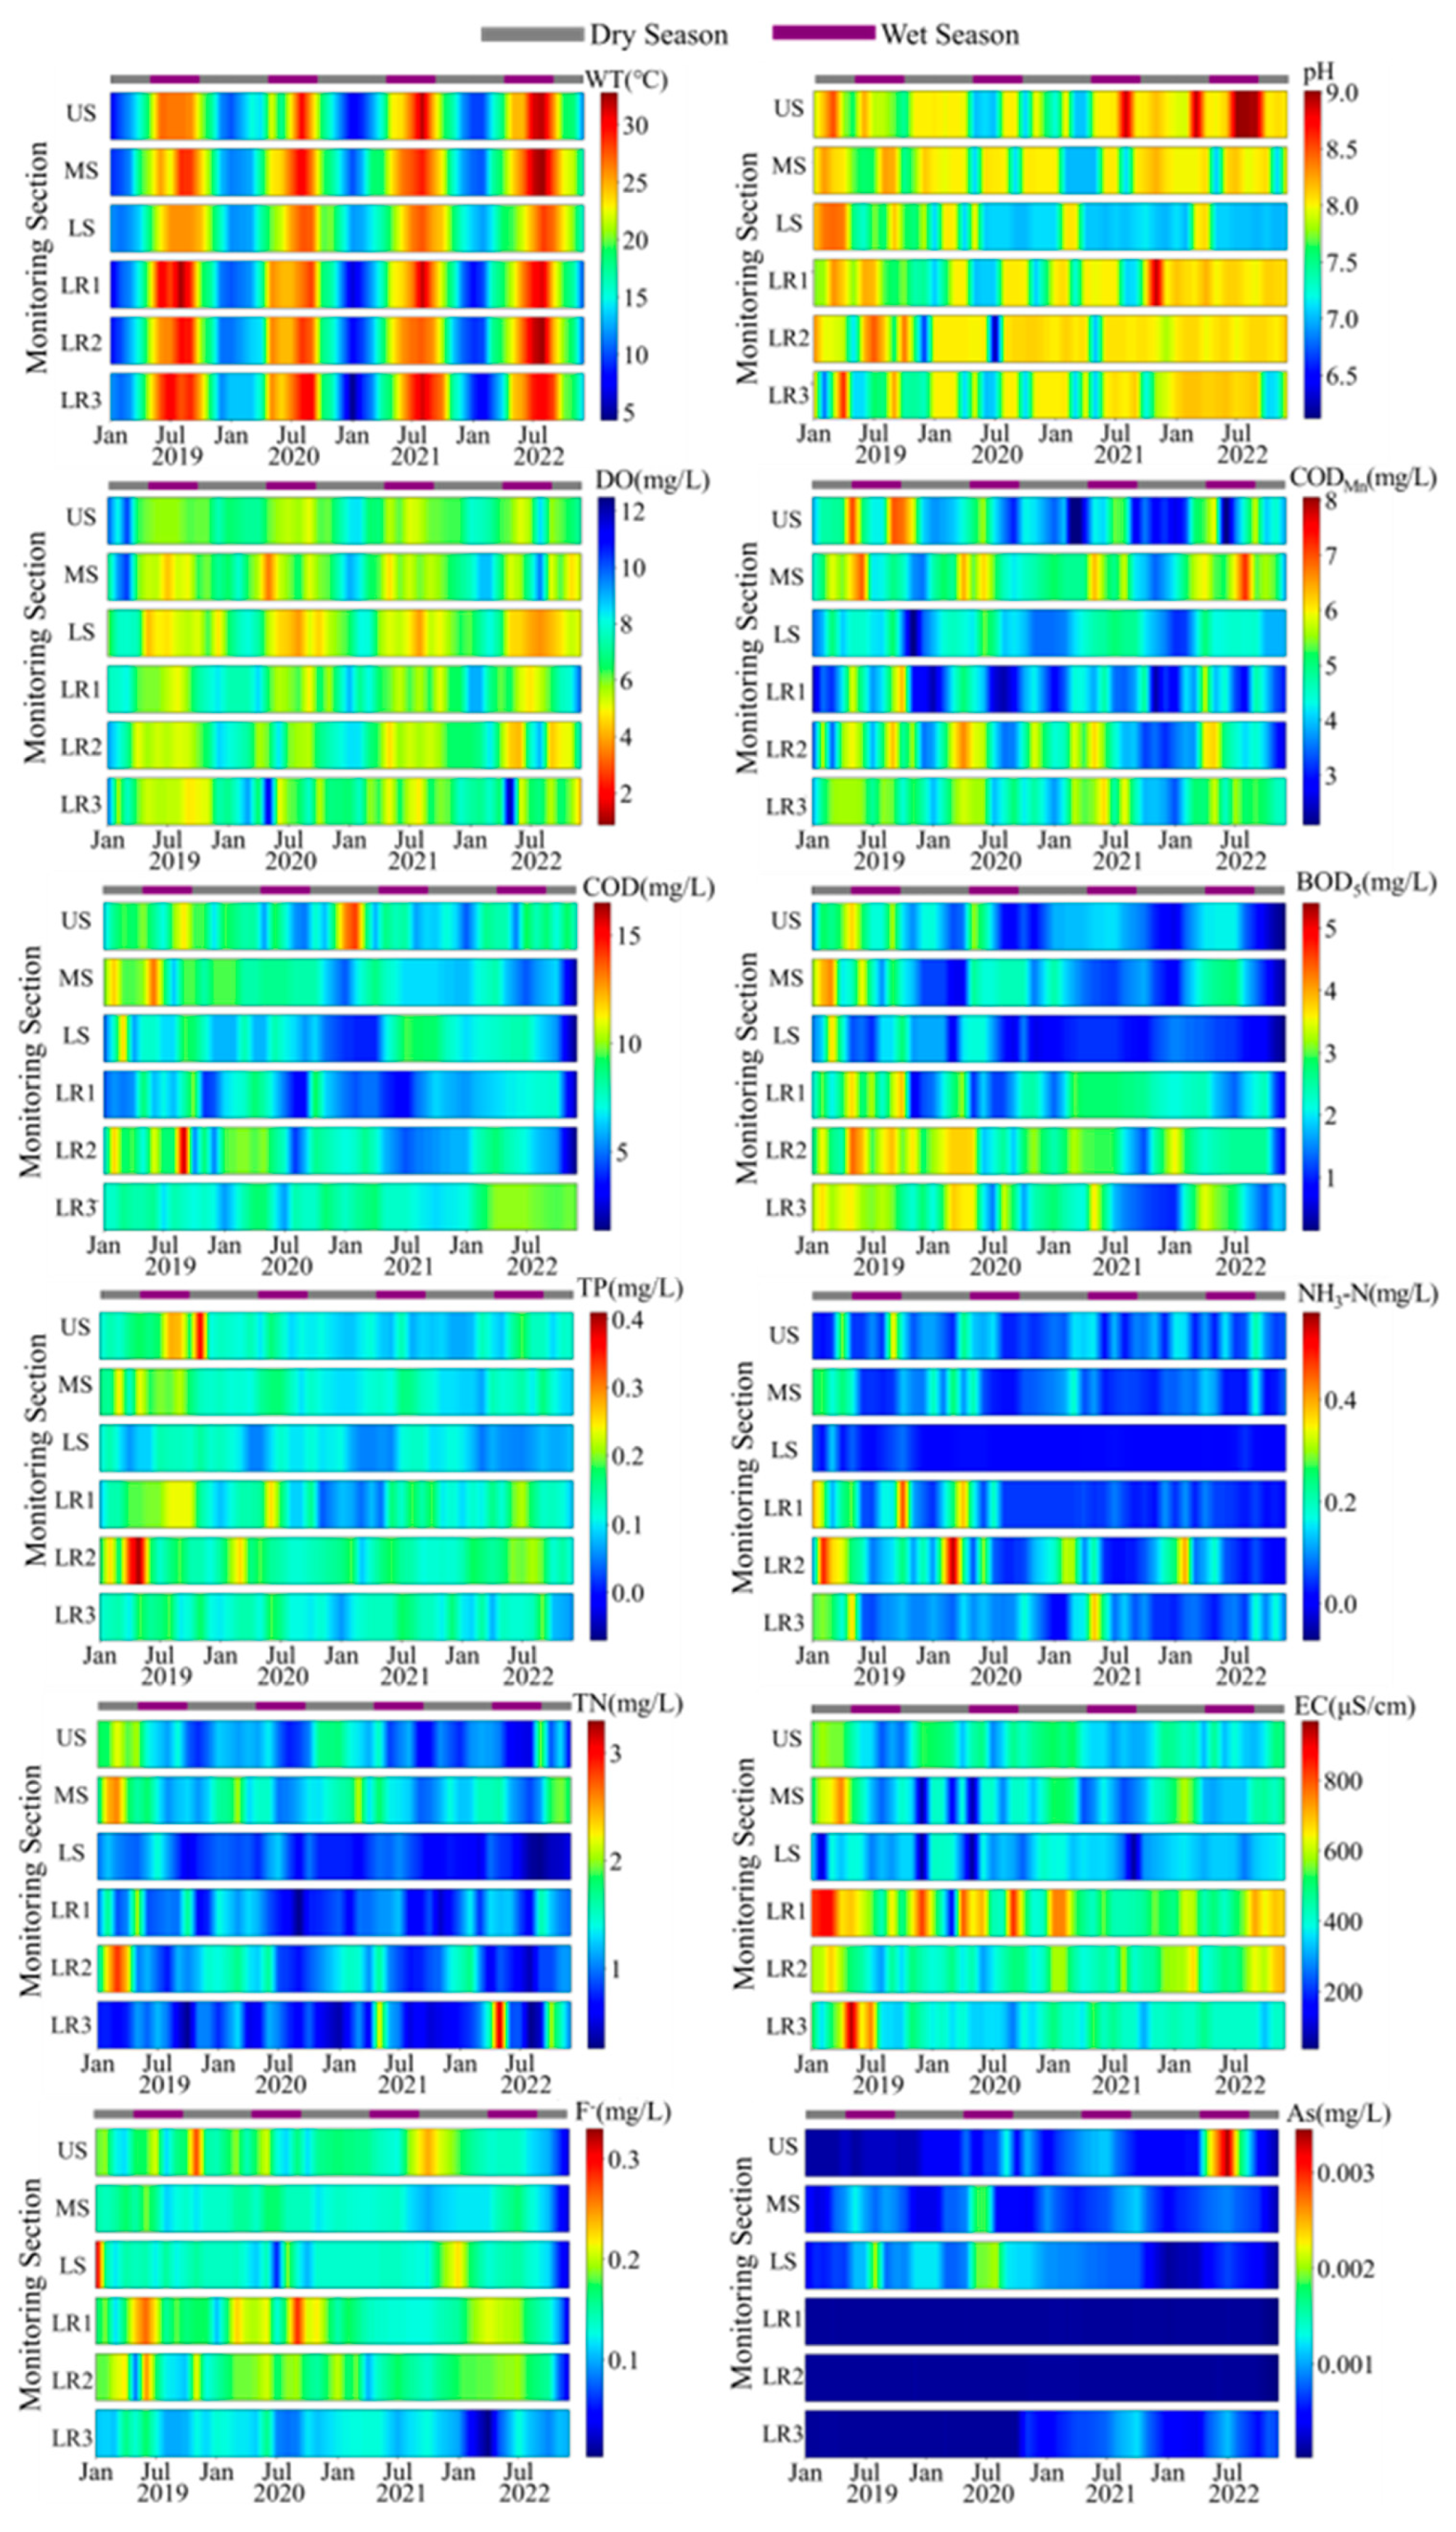
Figure 4.
Scatter plot of loadings for the three VFs for wet season and dry season in LRB.
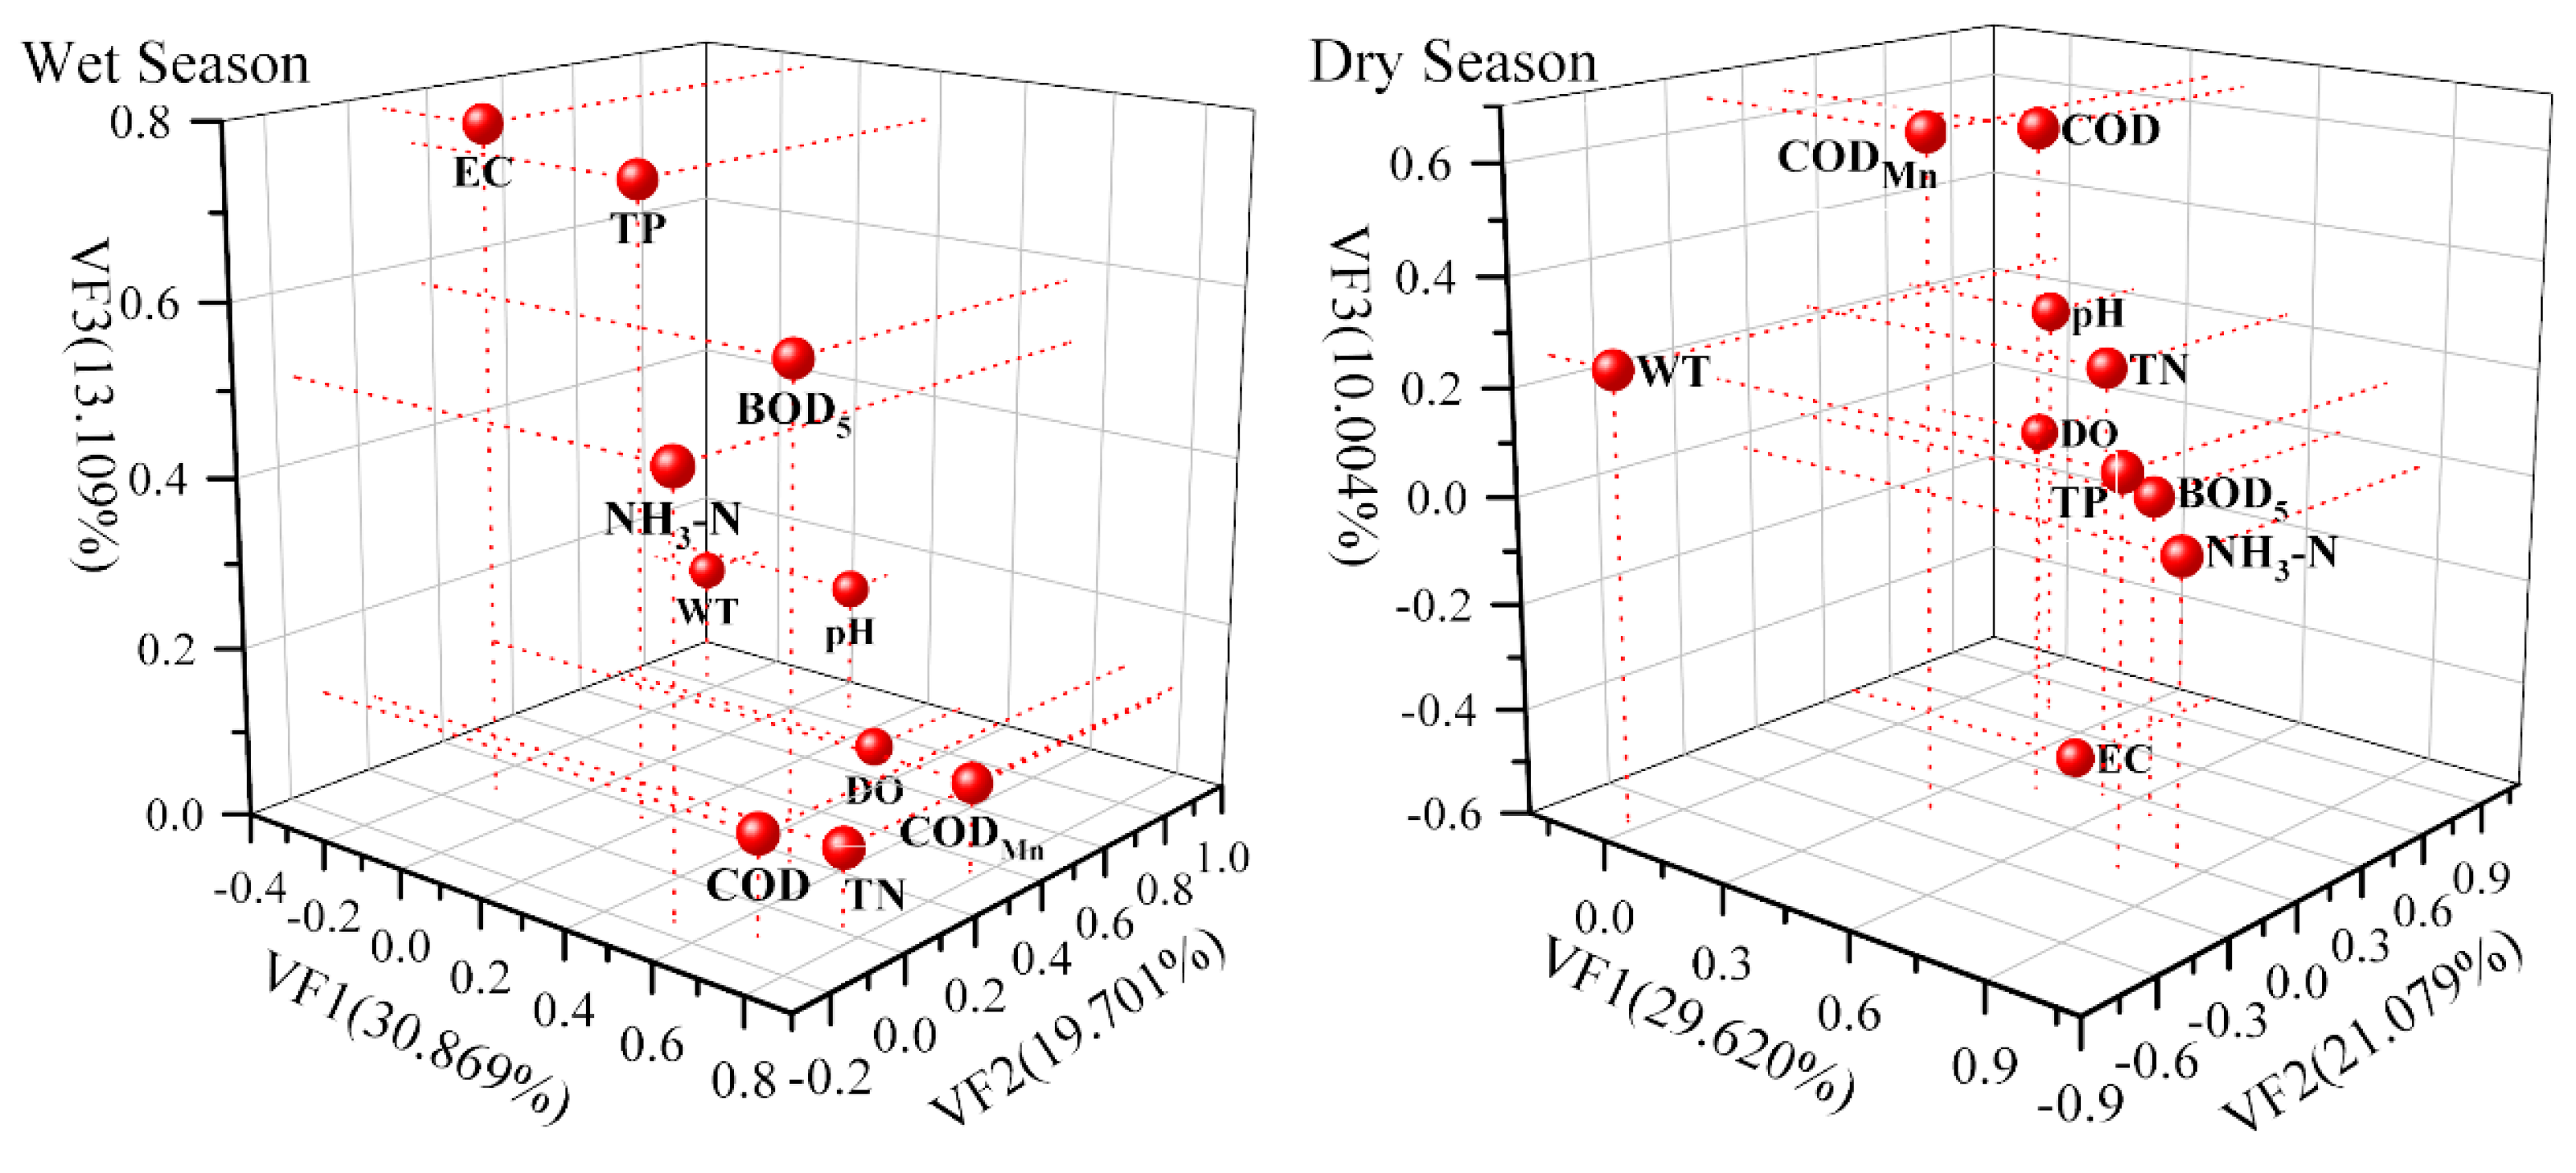
Figure 5.
Contribution of different pollution sources to portion variable (a) and the mean contributions in the river (b) using PCA-APCS-MLR receptor model.
Figure 5.
Contribution of different pollution sources to portion variable (a) and the mean contributions in the river (b) using PCA-APCS-MLR receptor model.
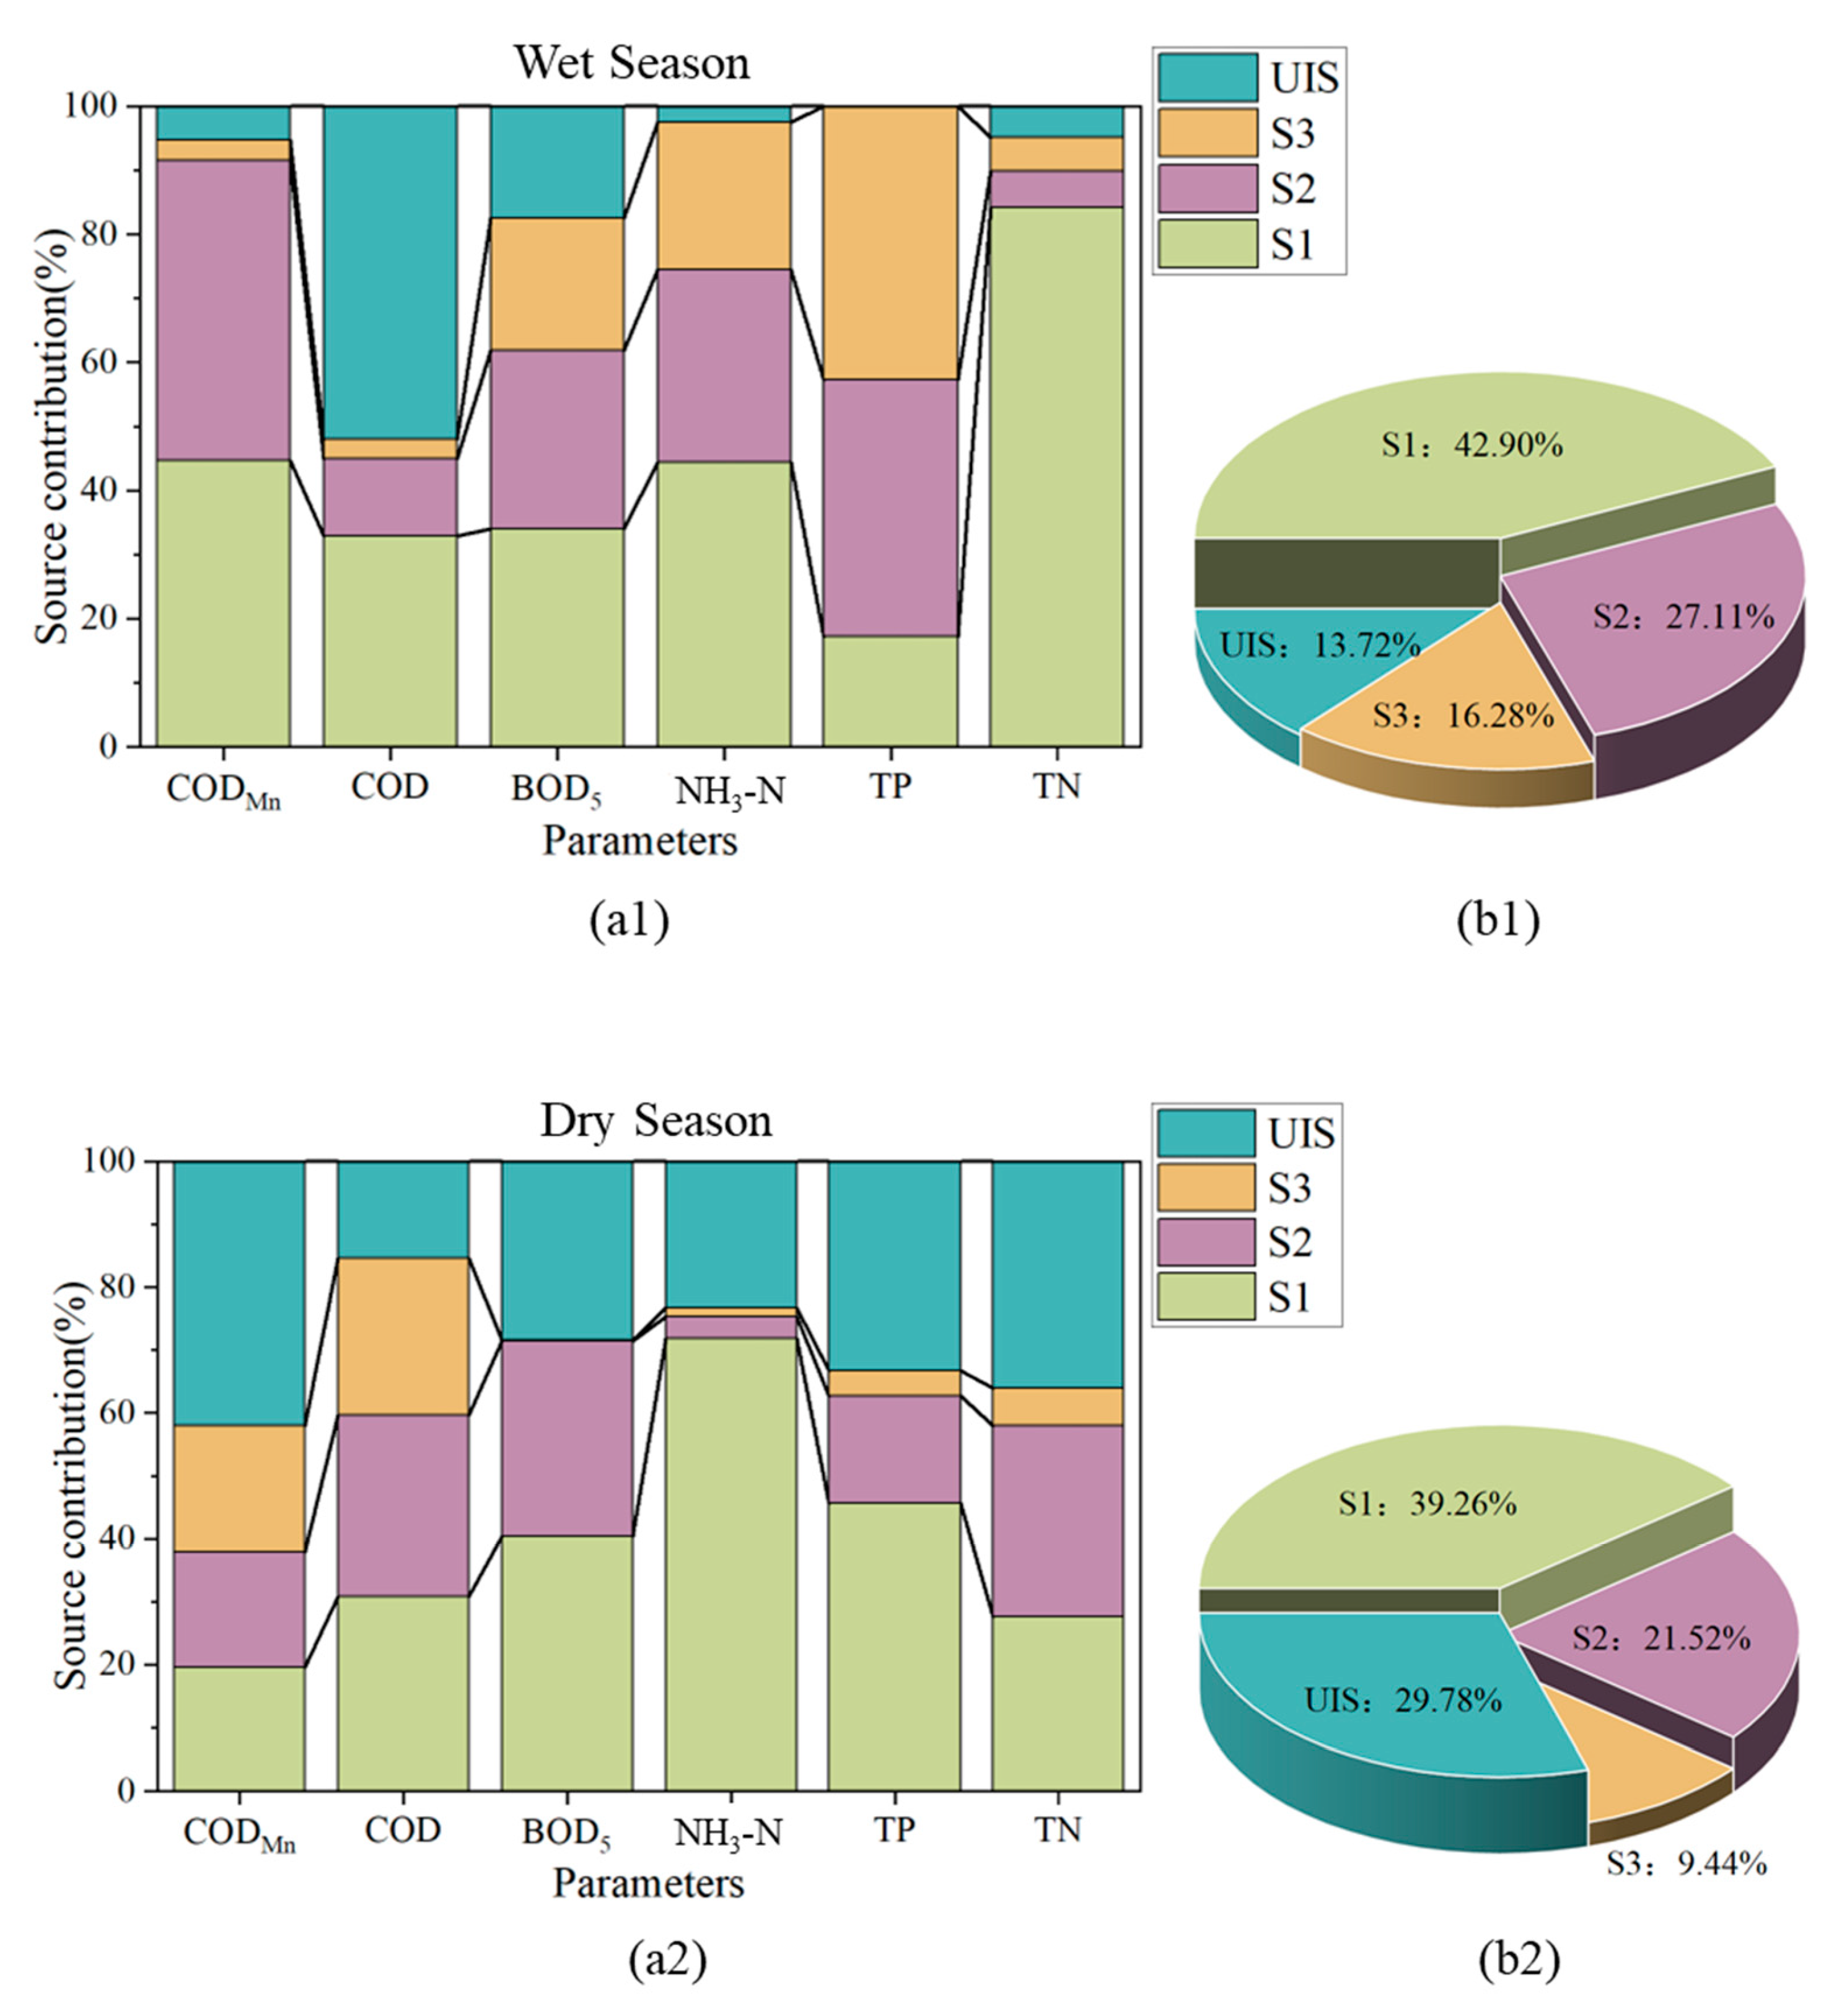

Table 1.
Mean and Maximum water quality concentrations during wet and dry seasons.
| Parameters | Wet season | Dry season | ||
|---|---|---|---|---|
| Mean | Maximum | Mean | Maximum | |
| WT/℃ | 26.20 | 32.80 | 14.65 | 26.50 |
| pH | 7.73 | 9.01 | 7.81 | 8.98 |
| ρ(DO)/(mg/L) | 7.10 | 15.60 | 8.72 | 13.00 |
| ρ(CODMn)/(mg/L) | 4.78 | 7.30 | 4.25 | 5.28 |
| ρ(COD)/(mg/L) | 14.77 | 33.00 | 14.37 | 28.50 |
| ρ(BOD5)/(mg/L) | 2.19 | 4.40 | 2.01 | 4.20 |
| ρ(NH3-N)/(mg/L) | 0.20 | 0.98 | 0.2773 | 1.43 |
| ρ(TP)/(mg/L) | 0.15 | 0.41 | 0.12 | 0.38 |
| ρ(TN)/(mg/L) | 2.07 | 6.60 | 2.29 | 5.77 |
| ρ(F-)/(mg/L) | 0.296 | 0.579 | 0.28 | 0.66 |
| ρ(Se)/(mg/L) | 0.00124 | 0.0069 | 0.00077 | 0.0025 |
| EC(μS/cm) | 408.18 | 969.00 | 458.92 | 875.00 |
Table 2.
Matrix of rotated factor loadings in spatial analysis during wet and dry seasons.
| Parameters | Wet Season | Dry Season | ||||
|---|---|---|---|---|---|---|
| VF1 | VF2 | VF3 | VF1 | VF2 | VF3 | |
| WT/℃ | -0.258 | 0.838 | 0.142 | -0.035 | -0.762 | 0.243 |
| pH | 0.086 | 0.882 | 0.155 | 0.164 | 0.708 | 0.209 |
| ρ(DO)/(mg·L-1) | 0.277 | 0.720 | 0.004 | 0.055 | 0.860 | -0.072 |
| ρ(CODMn)/(mg·L-1) | 0.778 | 0.352 | 0.104 | 0.338 | -0.137 | 0.651 |
| ρ(COD)/(mg·L-1) | 0.667 | -0.106 | 0.115 | 0.423 | 0.172 | 0.641 |
| ρ(BOD5)/(mg·L-1) | 0.504 | 0.179 | 0.572 | 0.667 | 0.222 | 0.005 |
| ρ(NH3-N)/(mg·L-1) | 0.519 | -0.152 | 0.499 | 0.850 | -0.019 | -0.030 |
| ρ(TP)/(mg·L-1) | 0.162 | 0.162 | 0.739 | 0.772 | -0.123 | 0.119 |
| ρ(TN)/(mg·L-1) | 0.750 | 0.022 | 0.088 | 0.539 | 0.256 | 0.215 |
| EC(μS·cm-1) | -0.146 | 0.091 | 0.784 | 0.381 | 0.429 | -0.600 |
| Eigenvalue | 3.087 | 1.970 | 1.311 | 2.962 | 2.108 | 1.000 |
| Total variance/% | 30.869 | 19.701 | 13.109 | 29.620 | 21.079 | 10.004 |
| Cumulative variance /% | 30.869 | 50.571 | 63.679 | 29.620 | 50.699 | 60.703 |
Table 3.
Mean source contributions to different variables concentrations in wet and dry seasons.
| Variable | Source contribution in wet season | Source contribution in dry season | ||||||
|---|---|---|---|---|---|---|---|---|
| S1 | S2 | S3 | UIS | S1 | S2 | S3 | UIS | |
| CODMn | 44.71% | 46.75% | 3.19% | 5.35% | 19.52% | 18.31% | 20.18% | 41.99% |
| COD | 32.85% | 12.14% | 3.02% | 51.99% | 30.75% | 28.88% | 25.01% | 15.37% |
| BOD5 | 33.97% | 27.90% | 20.63% | 17.50% | 40.34% | 31.03% | 0.15% | 28.49% |
| NH3-N | 44.43% | 30.09% | 22.92% | 2.56% | 71.81% | 3.42% | 1.43% | 23.34% |
| TP | 17.28% | 40.02% | 42.63% | 0.07% | 45.57% | 17.11% | 3.96% | 33.36% |
| TN | 84.16% | 5.75% | 5.26% | 4.83% | 27.57% | 30.37% | 5.93% | 36.13% |
| Mean | 42.90% | 27.11% | 16.28% | 13.72% | 39.26% | 21.52% | 9.44% | 29.78% |
Notes*: In wet season S1 represents agricultural non-point sources, S2 represents watershed background, S3 represents surface runoff and wet deposition; In dry season, S1 represents rural domestic sewage, S2 represents physicochemical and biological nonpoint source pollution, S3 represents industrial source; UIS is Unidentified Influence Source.
Disclaimer/Publisher’s Note: The statements, opinions and data contained in all publications are solely those of the individual author(s) and contributor(s) and not of MDPI and/or the editor(s). MDPI and/or the editor(s) disclaim responsibility for any injury to people or property resulting from any ideas, methods, instructions or products referred to in the content. |
© 2025 by the authors. Licensee MDPI, Basel, Switzerland. This article is an open access article distributed under the terms and conditions of the Creative Commons Attribution (CC BY) license (http://creativecommons.org/licenses/by/4.0/).
Copyright: This open access article is published under a Creative Commons CC BY 4.0 license, which permit the free download, distribution, and reuse, provided that the author and preprint are cited in any reuse.


