
Submitted:
27 April 2025
Posted:
29 April 2025
You are already at the latest version
Abstract
Students’ retention rates (RR), students’ progression rates (PR), and students’ graduation rates (GR) are statistical figures commonly used in higher education to monitor the performance of higher education institutions (HEI), academic degree programs, or their students. These rates can be demanded for internal quality assurance, third-party accreditation, or institutional ranking. Due to the lack of a universal definition of these quantitative metrics for quality assessment within higher education, their values should be interpreted carefully with a clear understanding of how they were computed to avoid misleading judgments and unfair comparisons. In the current study, we develop clearly defined benchmarking retention, progression, and graduation rates. In addition to developing overall benchmarking rates, we also derive discipline-specific retention and progression rates for nine broad academic specializations. This study contributes to policy or practice in higher education by (1) providing a large collection of benchmarking matrices customized for different time windows and different disciplines; (2) discussing the variability in defining these metrics, and how this can cause mistakes in their use or interpretation; and (3) proposing formulas for computing the students’ progression rates, and the student’s graduation rates such that they become robust metrics of efficiency, strictly bounded between 0% and 100%.
Keywords:
statistical
; extrapolation
; relaxation
; benchmarking
; rates
1. Introduction
1.1. Quality Assurance and Benchmarking in Higher Education
Quality Education is the fourth goal among the 17
Sustainable Development Goals (SDGs), or the Global Goals, adopted by the
United Nations in 2015 with the broad aim to address the three dimensions of
sustainable development (namely; environment dimension, economic dimension, and
social dimension) [1].
These integrated Global Goals were designed to end poverty, to protect the
Earth's planet, and to reach a universal state of prosperity by 2030 [2,3].
Undergraduate higher education (postsecondary or tertiary education), is an
important stage of the qualifications framework, where many students are being
prepared for starting their career and professional life, rather than for a
subsequent stage of formal education [4–7]. Quality assurance in this stage
involves a continuous improvement process, where several performance elements
(qualitative indicators and quantitative metrics) are regularly evaluated and
monitored against target levels or benchmarked with local peers, international
peers, or reference standards [8–11].
By “benchmarking”, we mean that a higher education
institution compares its metric value or indicator situation with either the
metric value or the indicator situation at another peer higher education
institution (local, regional, or international), or specified norms (such as
aspirational targets suggested by national authorities). Such benchmarking
process guides in deciding the relative position of the higher education
institution when compared to outside points of reference. By “benchmarking”, we
do not mean comparing the institutions’ own targets with the current
situations, because such internally set targets are intended to be reached.
Failure to achieve these targets is a sign of unsatisfactory performance and a
need for corrective actions. On the other hand, benchmarking is less strict,
and being below peers does not necessarily demand a corrective action. For
example, a higher education institution may set (based on self-assessment) a
target of being ranked nationally in the 3rd place in the next ranking edition
according to their selected university ranking service. If that institution is
ranked in the 4th place when the ranking edition is released, it is clear that
the institution failed to achieve its target. This is a regular internal
strategic planning process, rather than a benchmarking process. On the other
hand, if that institution finds that its peer institution in the same state or
municipality is ranked in the 5th place within the released national ranking
edition, then comparing the two received raking positions shows that the
intuition is actually performing relatively well in terms of this educational
quality element (the national ranking). This is a benchmarking process. It is
an additional process of receiving inputs from outside the institution with
regard to the institution’s performance.
Examples of quality assurance monitoring metrics in
higher education are listed in Table 1.
1.2. Student Tracking Rates
The last four quality assurance metrics that appear
in the previous list are the focus of the current study. Namely, these are the
students’ retention rates (RR), students’ progression rates (PR), and students’
graduation rates (GR). The students’ attrition rates (AR) are the complementary
value of the retention rates (RR); and due to their one-to-one relationship, we
do not need to consider them separately as a fourth quality assurance metric.
Instead, we utilize the retention rates (RR) here in lieu of the attrition
rates (AR) or the non-continuation rates (NCR), while admitting that the
attrition rates remain a valid candidate to be used instead of the retention
rates. The reason for preferring the attrition rates over the attrition rates
in the current study is that while the attrition rates are optimized through
minimization (lower values are better than higher values), retention rates are
optimized through maximization (higher values are better than lower values);
which is the same behavior of the progression rates and the graduation rates.
Thus, by selecting the retention rates instead of the attrition rates to
express the same quality assurance aspect, we ensure that all three quality
assurance metrics covered in the current study have coherent behavior. All
these quantitative metrics are expressed in a percentage form, and they serve
as three quantitative quality metrics for tracking students and assessing their
success from the entry/admission point until the completion/graduation point,
or for compliance with accreditation requirements. In the current article,
these three rates are collectively referred to as students’ tracking rates” or
TR.
1.3. Student Retention Rates
Retention rates express the ability of an HEI to
retain its students; such that after a specified duration (one year for
example), if a student remains enrolled (maintaining their active ID number) in
the same HEI or program or earns a credential from it, then that student is
retained. They show the attractiveness of the HEI or program, its stability,
reputation, financial well-being, and a healthy relationship with its students
that suggests a sense of belonging and an atmosphere of inclusion [88–91].
Mathematically
If all initial students are retained, RR reaches
its upper limit of 100%. With this expression, RR is guaranteed to lie exactly
within the normalized range from 0% to 100% as an inclusive interval of all
possibilities, making it straightforward to interpret as any efficiency figure
adopted for convenient performance characterization in energy systems or
industrial processes [92–97].
1.4. Student Attrition Rates (Dropout Rates)
The opposite (or complement) of retention is
attrition (also called dropout, drop-out, or non-continuation), which refers to
students who do not remain in their HEI or academic program, because of
transferring out, withdrawal, or dismissal [98–101]. Thus, AR or DR is 100% minus
RR as expressed in Equation (2). For example, a retention rate of 60%
corresponds to an attrition rate (or a dropout rate) of 40%.
or
1.5. Student Progression Rates (Persistence Rates)
Progression rates (or persistence rates or progress
rates) commonly refer to the ability of the students to advance through their
academic program with a satisfactory rate that enables them to graduate within
the normal duration of study (such as four years in a bachelor’s degree
program) [102–105].
The portion of students who maintain a satisfactory pace of passing courses or
earning credit hours over a specified period gives the progression rate (PR).
Mathematically, the progression rate can be described as
The circumflex (hat) notation is intentionally
added to the above acronym of the progression (persistence) rate to emphasize
that it is just one form of multiple forms according to how this rate is
defined in the literature.
There is an alternative way to define the
progression (persistence) rate, making it the result of augmenting the
retention rate by including those students who transfer out to other
institutions or complete a credential there (in this definition, a student is
persistent or progressing if she or he continues studying, regardless of
where). Mathematically, this alternative definition of the progression
(persistence) rate can be expressed as
In fact, this alternative definition was adopted by
the source of raw progression (persistence) rates we used here. This
alternative definition of the progression (persistence) rate makes it less
interesting to an individual higher education institution or academic program
(it remains interesting at a country level), and such a rate in this case does
not qualify for institutional-level or program-level benchmarking and quality
assessment, while the definition we expressed is much more useful and practicable.
In addition, this definition requires a data collection process that extends
beyond the institution’s records, because the actual destination of the student
who left the institution should be monitored, even if this student has
transferred to an institution in another country. Despite this, all the
progression (persistence) rates in our study refer to the alternative
definition of being an “expanded retention rate” as per Equation (5), rather
than being a “within-institution/program study advancement” as per Equation (4).
We imagine here a situation where a two-year degree
(associate degree or diploma) student transfers out to continue their study in
another four-year institution (as an upgraded bachelor’s degree) without
completing their original associate degree. According to the above alternative
definition of the progression rate, this is an instance where a desirable
outcome is achieved (the student is classified as progressing) although this
instance does not directly yield the measurable attainment of an associate degree.
We also notice that some sources use the term
“persistence rate” or “progression rate” with a similar meaning to what we call
“retention rate” but for the purpose of this study, these terms are different [106–108]. One
study defined the progression rate during a college study in a different way as
the duration of time to graduate following an anticipated progression pattern
until graduation (for example, being a sophomore "second-year"
student, then a junior "third-year" student, and then a senior
"fourth-year" student) [109]. We understand that the term
“progression” is easier to delineate in a school system with uniformly set
sequential grades as compared to a college system where students have more
freedom in deciding the sequence of courses they complete [110–113]. We
also notice that there are higher education institutions or academic programs
that do not monitor progression rates, but monitor retention rates and
graduation rates; considering them sufficient for the tracking process [114–116].
1.6. Student Graduation Rates (Completion Rates)
Graduation rates (GR) or completion rates (CR)
represent the portion of those students who successfully complete their
graduation requirements within a specified period of time, which is commonly
taken as 150% (one and a half) times the nominal program’s completion period
(normal or expected period for graduation); and this extension in the
graduation window allows accommodating for students who have responsibilities
beyond their education. This intentional time extension allows for
accommodating such cases that otherwise penalize the HEI or program through low
graduation rates [117–120].
Thus, for a four-year bachelor’s degree program, the graduation rate is the
portion of students who complete the program within six years. On the other
hand, for a three-year undergraduate advanced diploma program, the graduation
rate is the portion of students who complete the program within 54 months. For
a two-year diploma (associate degree) program, the graduation rate is the
portion of students who complete the program within three years. For a one-year
undergraduate certificate program, the graduation rate is the portion of
students who complete the program within 18 months. Other students who fail to
graduate within that extended graduation window represent “non-completion”
cases, and their portion is the complementary non-completion rate (NCR),
defined as [121–126]
Mathematically, the graduation (completion) rate
can be expressed as
where the term “extended period” refers here to
150% of the nominal period for completion.
Several approaches can improve students’ retention,
progression, or graduation rates; such as advising and mentorship, customized
educational environment, and student-centered learning [127–133]. For
example, one study suggested innovative teaching techniques; such as
project-based learning, peer teaching, and retrieval practice (which improves
memory retention through 'active' recall of information in response to a
question, as compared to 'passive' review methods); and such active learning
strategies through systemic educational reforms boost an equitable and
inclusive learner-centered environment and address learning barriers [134]. Another
study found, through empirical research and hypotheses testing, that disparity
in graduation rates among different higher education institutions is linked to
the variations in institutional resources; and suggested that policy
interventions can be adopted to remedy this issue where many higher education
students are unable to earn a degree after enrolling in a four-year college [135]. In
another study, offering a for-credit course titled “Psychology of Success”
about positive psychology to academically-warned students after their first
semester was found to foster retention, progression, and graduation; based on
results analyzed after four years of implementing this methodology [136].
1.7. Study Objective
This study is partly made as a result of a lack of
a broadly applicable lookup database for retention, progression, and graduation
rates in undergraduate higher education. By “broadly applicable”, we mean the
definitions and data behind the database are clearly explained, and the
reported rates are customized to different ways for defining how these rates
can be interpreted by different higher education institutions. These three
students’ tracking rates (for retention, progression, and graduation rates) can
be mandatory to compute or report regularly for a particular degree program or
a higher education institution, in order to comply with accreditation or
ranking requirements. While the computing of these rates can be automated
through digital information systems, the evaluation of these rates remains a
source of subjectiveness and perplexity if no clear targets or benchmarking
standards exist.
For example, the Organisation for Economic
Co-operation and Development (OECD) book/report series “Education at a Glance”
does not address undergraduate retention rates or undergraduate progression
rates [137].
The OECD graduation rate there was defined as “First-time graduation rate
represents the expected probability of graduating for the first time at a given
level of education before the age threshold (25 for upper secondary education
and 30 for post-secondary non-tertiary education) if current patterns are
maintained.” This definition concerns a conditional probability given a level
of education and an age threshold, and it is very different from how higher
education institutions may interpret the term “graduation rate”, as being a
portion of a particular cohort that graduates from the institution within a
certain period. OECD also publishes values for its “tertiary graduation rate”,
which is defined as “the expected probability of graduating for the first time
from tertiary education before the age threshold if current patterns are
maintained” [138].
Again, this probabilistic metric is not suitable for higher education
institutions or academic programs for benchmarking how fast their students
complete their degree study. For example, the published OECD tertiary
graduation rate for (Doctoral or equivalent level, women, Percentage, 2020)
ranges from 1.5% in Germany to 0.07% in Chile. Such percentages are not
relevant to the context of students’ tracking within a higher education
institution. As another example, the “Higher Education Global Data Report” of
UNESCO (United Nations Educational, Scientific and Cultural Organization) does
not include these students’ tracking rates [139]. UNESCO’s “Higher education:
figures at a glance” document includes several education metrics (such as
gender parity and international student mobility), but none of the three
students’ tracking rates investigated in this study are included [140]. As
another example, the Higher Education Statistics Agency in the United Kingdom
(UK) provides statistical data about non-continuation (a term that is
equivalent to “attrition” in our study) for undergraduate students in each
higher education provider (HEP) [141]. This “non-continuation” refers to
undergraduate full-time students who do not continue their higher education
study following one year of entry (following two years of entry in the case of
part-time students). While these are useful and comprehensive data, they
include two types of non-continuation rates; namely, (1) regarding students who
transfer to another HEP in the UK, (2) regarding students no longer in higher
education. Thus, the term “non-continuation rate” or NCR by itself is not
uniquely specified, and care is needed when interpreting or reporting such a
rate to avoid confusion or misuse of one form in place of the other.
Furthermore, for higher education institutions that compute their attrition
rate over a larger time window (for example, four years from entry to degree
completion of a four-year bachelor’s degree program), the published HESA rates
become in need for extrapolation, which is proposed in our study.
When attempting to compare the obtained students’
tracking rates (retention, progression, and graduation) with peer values, one
can get highly misleading outcomes due to the variability in how these rates
are computed. The problem becomes more pronounced in a higher education system
that is based on credits (credit hours or credit points), rather than
sequential semesters; because terms like “first year of study” and “second year
of study” become not uniquely defined [142–145]. A student may be taking a
course from the third year of the nominal study plan at the same time as taking
a course from the second or even the third year, as long as the prerequisites
are satisfied. Furthermore, undergraduate programs that involve a non-credit
preparatory year (to be called here a ‘foundation year’) as a transition stage
(a bridging step) between high school (secondary school) and the degree program
in colleges need careful treatment when the student’s tracking rates are either
computed or interpreted [146–149].
In the current study, we primarily aim at
presenting general benchmarking value for the three students’ tracking rates
(retention, progression, and graduation) based on selected and processed
values, such that they may suit a wide range of higher education institutions
as benchmarking standards for their particular situation.
The research gap that this study aims to address is
a lack of a comprehensive database of the retention, progression, and
graduation rates in undergraduate education that can be used conveniently as
external benchmarking reference points (without a single geographic or
institutional focus) while catering for diverse definitions of these rates by
different institutions. By being external (not local), these benchmarking
values target higher education institutions in any part of the world (except
the United States), which aim to compare their performance with other external
(overseas) higher education institutions. For higher education institutions in
the United States, the benchmarking values provided here are useful local
“national” levels. The use of the provided quantitative benchmarking values
here is similar to when a higher education institution performs benchmarking
with another higher education institution in a different country or the same
country when developing a new academic program or revising an existing one.
This analogous program-to-program benchmarking (such as by comparing the
courses “subjects” offered or the student outcomes “program learning outcomes”)
does not mean that exact equality is the optimum condition and should be
strictly achieved. Instead, such program-to-program benchmarking provides
general guidelines about favorable similarity and lack of extreme divergence.
For example, a higher education institution may have multiple options regarding
the internship “work placement” component in a degree program, such as being
compulsory or elective. Through the external or local program-to-program
benchmarking process, the higher education institution can be able to make an
informed decision based on identifying what the norm is. Similarly, in the lack
of a universal threshold for student tracking rates (retention rates,
progression rates, and graduation rates), external or local benchmarking serves
as a valuable guide.
The current study provides a large set of
synthesized student tracking rates corresponding to (1) different time windows
and calculations, (2) whether or not a non-credit foundation program exists,
and (3) different disciplines.
The methodology of the current study and how it
achieves its goal are outlined in the following section (3 Research
Methodology).
1.8. Research Questions
The following research questions are addressed in
the current study:
- What are common examples of quality assurance elements in higher education?
- Is there a wide agreement on the definition of the retention rate?
- Is there a wide agreement on the definition of the progression rate?
- Is there a wide agreement on the definition of the graduation rate?
- What is a representative overall (not discipline-specific) undergraduate benchmarking retention rate?
- What is a representative discipline-specific undergraduate benchmarking retention rate?
- What is a representative overall (not discipline-specific) undergraduate progression rate?
- What is a representative discipline-specific undergraduate progression rate?
- What is a representative overall (not discipline-specific) undergraduate graduation rate?
- How can the progression rate be defined to ensure that it meaningfully lies within the normalized range of 0-100%?
- How can the graduation rate be defined to ensure that it meaningfully lies within the normalized range of 0-100%?
Overall student tracking rates in the current study
may be used at the institution level, rather than at the program level. They
may also be used at the program level when viewed as an approximation when no
better program-specific rates are available.
2. Research Methodology
2.1. Data Sources
The present study is based on descriptive
statistical analysis. All the raw data used here are from open-access databases
with anonymized records. No sensitive data were collected. No human or animal
subjects were involved. No biohazardous materials were handled. These
conditions eliminate potential and ethical considerations.
The data are from NCES (National Center for
Education Statistics), and NSC-RC (National Student Clearinghouse – Research
Center).
NCES is one of the four centers belonging to the
IES (Institute of Education Sciences) of ED (U.S. Department of Education) [150,151]. The
other three centers are NCSER (National Center for Special Education Research),
NCER (National Center for Education Research), and NCEE (National Center for
Education Evaluation and Regional Assistance) [152,153]. NCES is the main federal
entity in the USA for collecting and analyzing data related to higher
education. This data system is IPEDS (Integrated Postsecondary Education Data
System) [154–156].
College Navigator is a free online portal by NCES [157,158].
NSC-RC (National Student Clearinghouse – Research
Center) is the branch of NSC (National Student Clearinghouse) in the United
States of America [159,160].
Table 2 lists the data we curated in the
current study and their sources.
2.2. Selected Disciplines and CIP Classification
The nine disciplines selected here for additional discipline-specific analysis are not exhaustive. These selected disciplines allow diversity in the coverage (rather than being focused only on STEM “Science, Technology, Engineering, and Mathematics”, health care, or humanities), with less priority given to disciplines with smaller numbers of enrolled students (like Theology). Examples of additional available disciplines in the NSC-RC data are Agriculture, Biological/Biomedical Sciences, Communication/Journalism, English Language, History, Liberal Arts, Mathematics/Statistics, Military Technologies, Parks/Recreation/Leisure/Fitness Studies, Philosophy and Religious Studies, Physical Sciences, Psychology, and Public Administration.
The CIP (Classification of Institutional Programs) is a US-based classifying code for academic disciplines, The CIP codes for the selected nine disciplines are listed in Table 3.
2.3. Retention and Progression Extrapolation
The reported retention rates in both sources and the progression rates by NSC-RC are based on the first year of college study. HEIs adopting larger time windows should not compare their retention or progression rates with those reported by NSC-RC or NCES. We suggest a nonlinear extrapolation where the first-year retention rate or progression rate is penalized when estimated for a multi-year period with a multiplicative discount factor () that is the average of the square roots of the first-year retention rates (or the first-year progression rates) in the last four years. The rationale for our choice of this extrapolation mechanism combines both simplicity and reasonableness. Thus, instead of multiplying with the first-year rate, taking the square root increases the multiplicative factor toward 1.0, thereby weakening the expected decline. Then, taking an average over 4 years smoothens the computation and reduces the likelihood of short-term irregularity due to exceptional rates in a particular year, such as COVID-19 [173,174,175,176,177].
Mathematically, if the first-year retention rates for the last four consecutive cohorts are RR1 (oldest: corresponding to Fall 2019-20 in our study), RR2, RR3, and RR4 (latest: corresponding to Fall 2022-23 in our study); then the discount factor for extrapolating the retention rate () is
If the mean retention rate is
then, the first-year retention rate is extrapolated as
Similarly, if the first-year progression rates for the last four consecutive cohorts are PR1, PR2, PR3, and PR4 (latest); then the discount factor () is
and the mean progression rate is
The extrapolation of the first-year progression rate is
2.4. Progression Adjustment for Foundation Year
If the progression rate () is a measure of the satisfactory pace of students’ advancement in their study, then when it is computed for an academic program that offers a non-credit foundation year, the computation becomes difficult because to the college is not necessarily happening concurrently at a single point [178,179]. A foundation year does not impact the retention rates. However, it worsens the progression rates. We propose an adjustment for proper benchmarking by scaling down reference progression rates using a penalty factor between 0 and 1 (taken as 0.5) in the first-year progression rate. Thus, if the foundation-free benchmarking value or target for the first-year progression rate is 70%, the program may expect to achieve 35%. Because this foundation year is not considered when the progression in the degree program is quantified, the penalty factor of 0.5 appears reasonable. We suggest that this penalty factor (is relaxed if the first-year progression rates are extrapolated, with a relaxation factor of (=1/0.9). This relaxation is the decay of the interruption by the foundation year. This numerical relaxation technique (also called the successive relaxation technique) is borrowed from a numerical method for iteratively solving a system of coupled equations that can arise when describing certain problems in physics or engineering [180,181,182,183,184,185,186,187,188,189,190,191,192,193,194,195,196]. A relaxation factor (also called an under-relaxation factor) of 0.9 is a representative value that is used to progressively reach a final solution that combines the solutions belonging to two sequential iterations [197,198,199,200,201,202,203,204,205,206].
If the progression rate adjustment factor is , and the adjusted progression rate is , the following expression describes our correction:
Figure 1 visualizes this adjustment factor.
3. Results
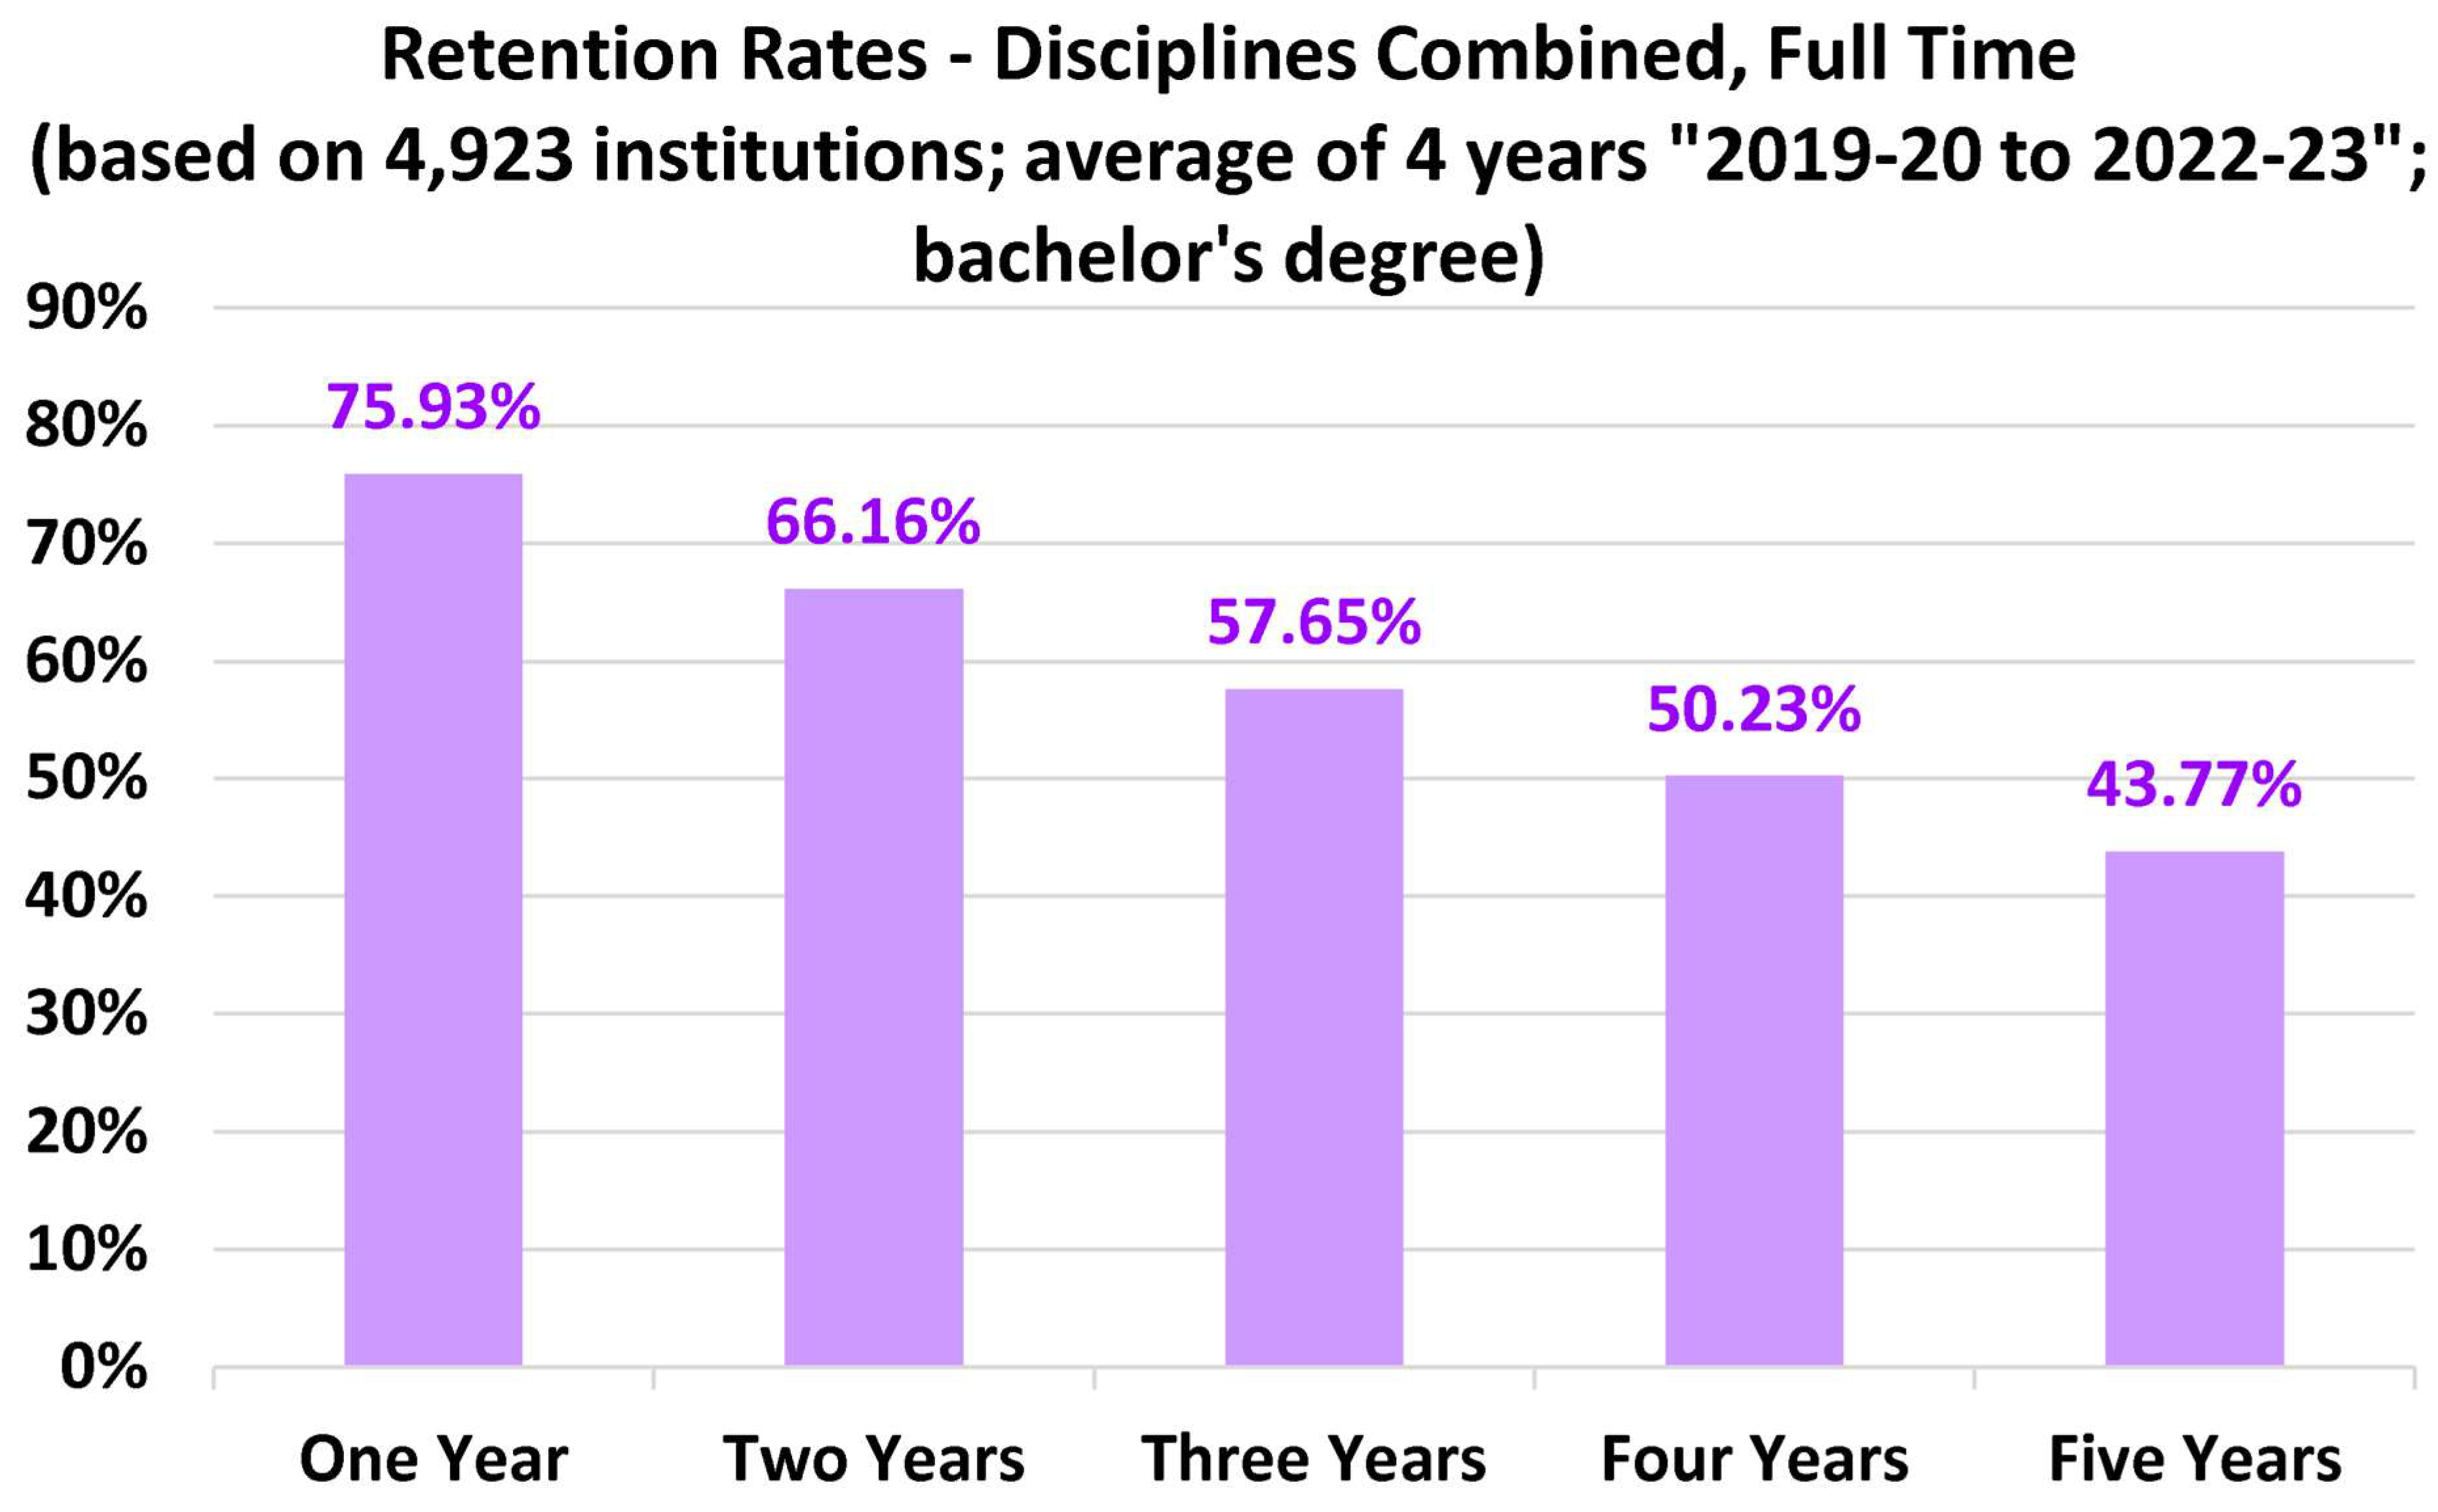
3.1. Overall Full-Time Bachelor’s Degree Retention Rates
Our results start with the overall retention rates for bachelor’s degree students. These estimates are based on NCES data. The average first-year retention rate is 75.93%. Programs report their retention rates over an entire study period should note that the extrapolated benchmarking retention rate becomes 50.23%.
Figure 2.
Overall retention rates.
3.2. Discipline-Specific Retention Rates
3.3. Overall Progression Rates
Figure 12 shows the overall undergraduate graduation rates. These are based on NSC-RC data.
The mean first-year progression rate non-foundation-year is 75.22%. The value of 75.22% for is computed according to Equation (16) as , where the raw first-year progression rates (directly from the NSC-RC database) for the four consecutive cohorts (Fall admission) of 2019-20, 2020-21, 2021-22, and 2022-23 are = 0.738072192, = 0.748297756, = 0.757355268, and = 0.765102937; respectively. Then, our proposed discount factor for extrapolating the progression rate () is computed according to Equation (15) as , which gives = 0.86728. Finally, the extrapolated progression rate (for institutions that adopt this time window for defining their progression rate) is computed according to Equation (20) as , which gives the value of 49.07% displayed in the figure.
For higher education institutions or academic programs that adopt a non-credit bridging foundation program, if this progression rate is of the “within-institution/program study advancement” type (this is ), then its adjusted average first-year value is 37.61%. This is , which in our model is approximated according to Equation (21) as ; where is 75.22%, and its value is computed following the same method as .
3.4. Discipline-Specific Progression Rates
3.5. General Full-Time Bachelor’s Degree Graduation Rates
Our estimation for the benchmarking graduation rates (or completion rates) is shown in Figure 22. The graduation rate has been consistently from 63.4% to 64.6%.
3.6. Retention-Progression Correlation
The observed matching of the disciplines having extremum retention rates and progression rates stimulates further investigation of the correlation between the retention rates and progression rates for the nine disciplines covered here. Through Figure 23, we show that there is nearly a linear correlation between the two tracking rates (the figure is based on the rates with a one-year time window, without extrapolation); where we obtained the following reduced-order model, with the coefficient of determination (or R-squared) being 0.9765, and its adjusted R-squared value being 0.9731; and both values are favorably close to 1.0, suggesting strong linear dependence [207,208,209,210,211]:
Further statistical analysis (hypothesis testing) shows that this linear dependence is statistically significant, with a p-value of only 5.86×10⁻⁷, which is much less than the typical threshold significance level of 0.05 [212,213,214,215,216]. Furthermore, the 95% confidence interval for the regression coefficient (0.9918) is (0.8480-1.1211), and the 99% confidence interval for it is (0.7825-1.1866); and both intervals are relatively far from the trivial zero value; therefore, that the null hypothesis that retention rates are not dependent on the progression rates can be rejected. The inferential statistical tool used here is the Analysis ToolPak’s Regression tool of Microsoft Excel [217].
It should be noted that the linear correlation obtained here is partly attributed to the inherent coupling mentioned earlier between the retention rate and progression rate, according to the way both are defined.
4. Further Remarks
In this section, we make seven supplementary comments, which are aimed primarily at providing brief standalone elements that extend the scope and value of the main part of this study.
4.1. Proposed Progression and Graduation Rate Formulas
First, it should be noted that according to the defining expression in Equation (4) for the “within-institution/program” progression rate (), this progression rate is actually influenced by the retention rate, where cannot reach 100% if RR is below 100%. This feature mandates that should not be interpreted independently of RR, due to the coupling between them. A preferred expression for a scaled “within-institution/program” progression rate (′) that is magnified for properly becoming an efficiency-like figure or a nondimensionalized (dimensionless) variable that lies exactly between 0 and 1.0 or 100% (as commonly done for describing or solving problems in physics and engineering), is [218,219,220,221,222,223,224,225,226,227,228,229,230,231,232]
Similarly, according to the defining expression in Equation (7) for the graduation rate (GR) or completion rate (CR), this graduation rate is actually influenced by the retention rate, where GR cannot reach 100% if RR is below 100%. This feature mandates that GR should not be interpreted independently of RR, due to the coupling between them. A preferred expression for a scaled graduation rate (GR′) or a scaled completion rate (CR′) that is magnified for properly becoming an efficiency figure (exactly bounded between 0% and 100%) [233,234,235,236,237,238,239] is
4.2. Proposed Performance-Based Progression Rate
Second, all the students’ tracking rates analyzed in the current study (retention, progression, and graduation) are not affected by the grades of the students. While this might not be a problem for the retention rate and the graduation rate; it can be viewed as a shortcoming in the progression rate, because it does not allow distinguishing between students who advance toward graduation while maintaining higher grades and those also advancing at the same rate while receiving only the passing marks. Thus, an additional metric may be devised for monitoring this aspect, such as the portion of students with a cumulative grade point average (CGPA) above a set threshold. Alternatively, a performance-based “within-institution/program” progression rate (′′) may be introduced, rather than being merely based on passing courses regardless of the level of academic performance. Such a performance-based progression rate may be expressed as
4.3. Proposed Discipline Classification for STEM Programs
Third, we point out here that some STEM (Science, Technology, Engineering, and Mathematics) programs may have ambiguity in terms of their classification into one of the nine broad disciplines covered in this study, such as being possibly considered an “engineering” program while also possibly viewed as a “computer/information science” program. In such as case, we propose that the official title of the program is used as a criterion for the classification [240,241,242,243]. If the program title has the word “Engineering”, then our suggested engineering retention and progression benchmarking rates can be used for that program. This proposed method for resolving any classification conflict is aligned with the program eligibility requirement for accreditation by the leading accreditation body [244,245,246] ABET (by the Accreditation Board for Engineering and Technology, Inc.), where the word “engineering” in the program's name is necessary to be accredited according to the Engineering criteria of ABET, whereas the phrase “engineering technology” in the program's name is necessary to be accredited according to the Engineering Technology criteria of ABET [247,248,249]. For example, we prefer that a “Computer Engineering” undergraduate program utilizes our suggested benchmarking rates for the (engineering) discipline, whereas we prefer that a “Computer Science” program utilizes our suggested benchmarking rates for the (computer/information science) discipline. Similarly, we prefer that an “Architectural Engineering” undergraduate program utilizes our suggested benchmarking rates for the (engineering) discipline, whereas we prefer that an “Interior Architecture” program utilizes our suggested benchmarking rates for the (architecture) discipline.
4.4. Logical Condition on the Retention-Progression Ratio
Fourth, the way how the raw progression (persistence) rates were obtained explains why the progression rate here is always larger than the retention rate for the same discipline; because each retained student is automatically progressing (persistent), while not each progressing (persistent) student is necessarily retained. If these raw progression (persistence) rates were obtained based on the study advancement within the same institution or program, then the progression rate is always less than or equal to the retention rate; because each progressing (persistent) student is automatically retained in this case, while not each retained student is necessarily progressing (persistent).
4.5. Limitations of the Current Study
Fifth, the limitations of this study include the assumed value of the penalty factor and the model for the discount factor, which are not based on empirical data. However, logical justification was provided for these parameters. Also, the set of nine disciplines selected for further retention and progression analysis can be outside the interest of a reader from other disciplines. However, those readers interested in other disciplines can apply our proposed model to the raw data and obtain their own discipline-specific rates. In addition, the study was based on US datasets. However, the large data size and the reporting robustness make it attractive to higher education institutions outside the USA, especially when these rates are viewed as external (non-local) points of reference to be augmented with national rates.
We also acknowledge the limitation implied by our proposed classification method for programs that may appear to fit in two of the nine broad disciplines for which we provided discipline-specific tracking rates. The proposed classification method was entirely based on the official title of the program, and this neglects several important components of the programs, such as the program objectives (PO), the program learning outcomes (PLO) – also called student outcomes (SO) [250], and the program description. Despite these limitations, using the program title per se for inferring the broad discipline of the program has an advantage of sustainability, because the program title can remain the same for an extended period of time while the program objectives, program learning outcomes, and program description change as a result of a periodic program review or as a result of an update in the criteria set by an accreditation body by which the program is accredited. Also, using the program title alone for classifying the program makes the classification process quick and easy to implement without the need to refer to more details about the program.
We admit that our study is largely descriptive with regard to its results, particularly the discipline-specific rates. For example; while our study’s findings show that the student’s retention rates in (Engineering) and (Architecture) are relatively high, the study does not provide an interpretation for this phenomenon. However, it should be noted that such a deeper evaluative analysis is beyond the scope of our study, and it warrants a separate research work to address these important aspects and extend our work.
4.6. Example of Real-World Application
Sixth, our discussed remark here is a demonstration of a real-world situation where the availability and comprehensiveness of our benchmarking of students’ tracking rates become very useful. This example corresponds to the new (second version of 2024) national institutional accreditation system within the Sultanate of Oman. This Omani system, called Institutional Standards Assessment (ISA), for higher educational institutions in Oman is divided into sections called “Standards”, and each Standard is further divided into subsections called “Criteria”. There is a total of six standards and 45 criteria in the second version of the Institutional Standards Assessment (ISA) in the Sultanate of Oman [251]. In the second standard (Standard 2: Academic Provision and Resources), the last (10th) criterion is (Criterion 2.10: Student Performance and Graduate Outcomes). This criterion stipulates that “Student retention, progression, attrition and completion data is routinely collected, reported and effectively utilised to inform planning and resource allocation, and enhance student support services”. Through our proposed benchmarking retention rates (the complement of which are the proposed benchmarking attrition rates), progression rates, and graduation rates (same as “completion rates” in version 2 of ISA) presented in this study; higher education institutions in Oman can claim with evidence their fulfillment of this national accreditation component to the Panel Assessor Members, who typically include members from outside Oman. With the benchmarking values reported here in our study, the collected students’ tracking rates at Omani higher education institutions can be then interpreted as being low (corrective actions are needed) or high (no corrective actions are needed). Such comparison and subsequent action taken afterward (if applicable) shows a systematic and robust process to effectively utilize the collected students’ tracking rates for the purpose of informing the institution-level planning and resource allocation. The benchmarking values reported in our study also serve as a valuable way for managers of Omani institutions to respond to inquiries from ISA Panel Assessor Members (either during the on-campus investigative visit or during submitting self-assessment reports before the visit) regarding how they can judge the adequacy of their students’ tracking rates, and what benchmarking levels they have for that. Because our study synthesizes the retention and progression rates at multiple time windows, and also takes into account the factor of the foundation year with regard to the progression rates; our benchmarking values can suit a wide spectrum of higher education institutions in Oman, regardless of how they define their own tracking time window and regardless of having a foundation year or not. The comprehensiveness of our benchmarking data which are pre-customized for many educational settings makes them widely applicable in this real-world example.
4.7. Comparison with Other Studies
Seventh, the last remark is a comparison with some of the rates reported here with those reported in external sources. For example, we reported a benchmarking graduation rate of 64.2% for full-time bachelor's degree students (within 150% of the study duration). Comparing this to the average for the 23 countries of the OECD (Organisation for Economic Co-operation and Development), the graduation rate was 67% within three years after the nominal study duration for bachelor’s programs [252]. The two rates are close to each other, and this can lead to a statement that the OECD countries (collectively) are on a bar with other institutions in terms of this higher education quality metric. We reported a benchmarking one-year overall retention rate of 75.93% for full-time bachelor's degree students. The American University of Ras Al Khaimah (AURAK), located in Ras Al Khaimah in the United Arab Emirates (UAE), reported a value of 77% (average of seven historical records between the cohort of Fall 2016 and the cohort of Fall 2022) [253]. The similarity of the two values also indicates a satisfactory quality metric for AURAK. In Australia, a study showed that by age 23 years, 21% of the additional students had dropped out from their university without receiving a qualification [254]. If this is taken as equivalent to a retention rate of 79% (attrition rate of 21%), then this value is also comparable to our benchmarking value.
5. Conclusions
We developed benchmarking rates for undergraduate students. The overall benchmarking retention rate is 76%. The benchmarking progression without a foundation year is 75%. The overall graduation rate is 64%. This study can be extended in future work in multiple ways, such as making it a periodic source of external benchmarking retention, progression, or graduation rates; through updating the results based on new releases of the underlying datasets. In addition, future comparative studies are proposed with datasets from other geographic regions if deemed to be comprehensive, longitudinal, robust, and well-documented. Also, the use of empirical analysis to verify or modify our assumed modeling parameters (penalty factor and relaxation factor) is another proposed extension of this work.
6. Recommendations
Actionable recommendations from this study include
- We recommend that new higher education institutions (or those established ones but not yet adopted a definition for their retention, progression, or graduation rates) define their retention, progression, or graduation rates such that they meaningfully serve as a proper normalized metric, bounded between 0 and 1, according to the mathematical formulas we provided for this purpose.
- We recommend that academic accreditation bodies or academic ranking services should clearly define the retention, progression, or graduation rates if they ask higher education institutions or academic programs to report them. A good example of this is the UK-based universities ranking service QS (Quacquarelli Symonds), which defines it “Retention rate” as “The percentage of first-year undergraduate students who continue to their second year of study.” Thus, it is clear that the tracking window for this rate is one year from admission (or a Fall-to-Fall retention year) [255].
- We recommend that new higher education institutions pay a lot of attention before comparing their retention, progression, or graduation rates with those reported by another agency since mismatching definitions lead to wrong comparisons and interpretations.
Data Availability Statement
The main quantitative outcomes of this study are contained within this manuscript.
Conflicts of Interest
Not applicable (no competing interests).
Nomenclature
| ABET | Originally an acronym for (Accreditation Board for Engineering and Technology) |
| AR | Attrition rate (the complement of the retention rate; their sum is always 100%) |
| AURAK | American University of Ras Al Khaimah |
| CIP | Classification of Institutional Programs |
| HEP | Higher education provider (similar to HEI) |
| IES | Institute of Education Sciences (part of ED) |
| ISA | Institutional Standards Assessment of the Sultanate of Oman |
| NCR | Non-continuation rate (same as the attrition rate) |
| OECD | Organisation for Economic Co-operation and Development |
| PLO | Program Learning Outcome |
| PO | Program Objective |
| pp | Percentage point |
| SO | Student outcome |
| STEM | Science, Technology, Engineering, and Mathematics |
| TR | Tracking rate (a generic name for the retention rate, progression rate, and graduation rate) |
| UAE | United Arab Emirates |
| UNESCO | United Nations Educational, Scientific and Cultural Organization |
References
- Zickafoose, O. Ilesanmi, M. Diaz-Manrique, A.E. Adeyemi, B. Walumbe, R. Strong, G. Wingenbach, M.T. Rodriguez, K. Dooley, Barriers and Challenges Affecting Quality Education (Sustainable Development Goal #4) in Sub-Saharan Africa by 2030, Sustainability 16 (2024) 2657. [CrossRef]
- [United Nations Development Programme] UNDP, UNDP │ Sustainable Development Goals (SDGs), (2025). https://www.undp.org/sustainable-development-goals (accessed February 2, 2025).
- Marzouk, Chronologically-Ordered Quantitative Global Targets for the Energy-Emissions-Climate Nexus, from 2021 to 2050, in: 2022 International Conference on Environmental Science and Green Energy (ICESGE), IEEE [Institute of Electrical and Electronics Engineers], Virtual, 2022: pp. 1–6. [CrossRef]
- [Oman Authority for Academic Accreditation and Quality Assurance of Education] OAAAQA, Oman Qualifications Framework (OQF) Document, Version 3, Muscat, Sultanate of Oman, 2023. https://oaaaqa.gov.om/getattachment/5b4dda1a-c892-48bc-afb9-7b39d1d8611f/OQF%20Document.aspx (accessed October 8, 2024).
- L. Wheelahan, From old to new: the Australian qualifications framework, Journal of Education and Work 24 (2011) 323–342. [CrossRef]
- M. Young, Qualifications Frameworks: some conceptual issues, European Journal of Education 42 (2007) 445–457. [CrossRef]
- M.F.D. Young, National Qualifications Frameworks as a Global Phenomenon: A comparative perspective, Journal of Education and Work (2003). [CrossRef]
- W.E. Donald, Merit beyond metrics: Redefining the value of higher education, Industry and Higher Education (2024) 09504222241264506. [CrossRef]
- R. Clemons, M. Jance, Defining Quality in Higher Education and Identifying Opportunities for Improvement, Sage Open 14 (2024) 21582440241271155. [CrossRef]
- P. Chaudhary, R.K. Singh, Quality of teaching & learning in higher education: a bibliometric review & future research agenda, On the Horizon: The International Journal of Learning Futures ahead-of-print (2024). [CrossRef]
- A.M. Dima, R. Argatu, M. Rădoi, Performance Evaluation in Higher Education – A Comparative Approach, Proceedings of the International Conference on Business Excellence 18 (2024) 2453–2471. [CrossRef]
- Marzouk, Benchmarks for the Omani higher education students-faculty ratio (SFR) based on World Bank data, QS rankings, and THE rankings, Cogent Education 11 (2024) 2317117. [CrossRef]
- Marzouk, Accrediting Artificial Intelligence Programs from the Omani and the International ABET Perspectives, in: K. Arai (Ed.), Intelligent Computing, Springer International Publishing, Cham, Switzerland, 2021: pp. 462–474. [CrossRef]
- Marzouk, Status of ABET Accreditation in the Arab World, Global Journal of Educational Studies 5 (2019) 1–10. [CrossRef]
- Supriyanto, R.B. Sumarsono, A. Sunandar, Rochmawati, Z.A. Dami, D.K. Ratri, N.L. Ardian, Partnership Quality, Student’s Satisfaction, and Loyalty: A Study at Higher Education Legal Entities in Indonesia, Open Education Studies 6 (2024). [CrossRef]
- H. Ngounhort, T. Chanthuch, S. Veasna, Key Perspectives of Student Alumni’s Career Satisfaction: A Tracer Study of National Vocational Institute of Battambang and Battambang Institute of Technology, Cambodia, Creative Education 15 (2024) 1930–1959. [CrossRef]
- Marzouk, Utilizing Co-Curricular Programs to Develop Student Civic Engagement and Leadership, The Journal of the World Universities Forum 1 (2008) 87–100. [CrossRef]
- Marzouk, University Role in Promoting Leadership and Commitment to the Community, in: Inaugural International Forum on World Universities, Davos, Switzerland (and Virtual), 2008. [CrossRef]
- S. Gupta, S. Sushil, K. Gulati, Transformation of national ranking score for positioning higher education institutions in international ranking – a case on India, International Journal of Productivity and Performance Management ahead-of-print (2025). [CrossRef]
- Marzouk, Compilation of Smart Cities Attributes and Quantitative Identification of Mismatch in Rankings, Journal of Engineering 2022 (2022) 5981551. [CrossRef]
- H. Hottenrott, C. Lawson, What is behind multiple institutional affiliations in academia?, Science and Public Policy 49 (2022) 382–402. [CrossRef]
- H. Hottenrott, M.E. Rose, C. Lawson, The rise of multiple institutional affiliations in academia, Journal of the Association for Information Science and Technology 72 (2021) 1039–1058. [CrossRef]
- T. Zhuang, M. Oh, K. Kimura, Modernizing higher education with industrial forces in Asia: a comparative study of discourse of university-industry collaboration in China, Japan and Singapore, Asia Pacific Educ. Rev. (2025). [CrossRef]
- H. Gordon, J. Banks, H. Chetan-Welsh, Accreditation/professional registration for technicians and the role of professional bodies in supporting the technician community, in: Technicians in Higher Education and Research, Routledge, 2024.
- Innab, M.M. Almotairy, N. Alqahtani, A. Nahari, R. Alghamdi, H. Moafa, D. Alshael, The impact of comprehensive licensure review on nursing students’ clinical competence, self-efficacy, and work readiness, Heliyon 10 (2024). [CrossRef]
- D.T. Jefferys, S. Hodges, M.S. Trueman, A Strategy for Success on the National Council Licensure Examination for At-Risk Nursing Students in Historically Black Colleges and Universities: A Pilot Study, International Journal of Caring Sciences 10 (2017) 1705–1709.
- Z. Ma, Explore The Impact of Standardized Testing on Students’ Learning Potential in Higher Education, in: Y. Chen, C. Shen, J. Rak (Eds.), Proceedings of the 3rd International Conference on Culture, Design and Social Development (CDSD 2023), Atlantis Press SARL, Paris, 2024: pp. 76–87. [CrossRef]
- M. Gadola, D. Chindamo, Experiential learning in engineering education: The role of student design competitions and a case study, International Journal of Mechanical Engineering Education 47 (2019) 3–22. [CrossRef]
- C.N. Lippard, C.D. Vallotton, M. Fusaro, R. Chazan-Cohen, C.A. Peterson, L. Kim, G.A. Cook, Practice matters: how practicum experiences change student beliefs, Journal of Early Childhood Teacher Education 45 (2024) 371–395. [CrossRef]
- G. Nabi, F. Liñán, A. Fayolle, N. Krueger, A. Walmsley, The Impact of Entrepreneurship Education in Higher Education: A Systematic Review and Research Agenda, AMLE 16 (2017) 277–299. [CrossRef]
- R.T. Syed, D. Singh, D. Spicer, Entrepreneurial higher education institutions: Development of the research and future directions, Higher Education Quarterly 77 (2023) 158–183. [CrossRef]
- R. Herrera-Limones, J. Rey-Pérez, M. Hernández-Valencia, J. Roa-Fernández, Student Competitions as a Learning Method with a Sustainable Focus in Higher Education: The University of Seville “Aura Projects” in the “Solar Decathlon 2019,” Sustainability 12 (2020) 1634. [CrossRef]
- P.C. Wankat, Undergraduate Student Competitions, Journal of Engineering Education 94 (2005) 343–347. [CrossRef]
- Marzouk, A.A. Al Kamzari, T.K. Al-Hatmi, O.S. Al Alawi, H.A. Al-Zadjali, M.A. Al Haseed, K.H. Al Daqaq, A.R. Al-Aliyani, A.N. Al-Aliyani, A.A. Al Balushi, M.H. Al Shamsi, Energy Analyses for a Steam Power Plant Operating under the Rankine Cycle, in: A.S. Al Kalbani, R. Kanna, L.B. EP Rabai, S. Ahmad, S. Valsala (Eds.), First International Conference on Engineering, Applied Sciences and Management (UoB-IEASMA 2021), IEASMA Consultants LLP, Virtual, 2021: pp. 11–22. [CrossRef]
- U. Teichler, Internationalisation Trends in Higher Education and the Changing Role of International Student Mobility, Journal of International Mobility 5 (2017) 177–216. [CrossRef]
- Marzouk, Urban air mobility and flying cars: Overview, examples, prospects, drawbacks, and solutions, Open Engineering 12 (2022) 662–679. [CrossRef]
- Marzouk, Growth in the Worldwide Stock of E-Mobility Vehicles (by Technology and by Transport Mode) and the Worldwide Stock of Hydrogen Refueling Stations and Electric Charging Points between 2020 and 2022, in: Construction Materials and Their Processing, Trans Tech Publications Ltd, 2023: pp. 89–96. [CrossRef]
- Marzouk, Recommended LEED-Compliant Cars, SUVs, Vans, Pickup Trucks, Station Wagons, and Two Seaters for Smart Cities Based on the Environmental Damage Index (EDX) and Green Score, in: M. Ben Ahmed, A.A. Boudhir, R. El Meouche, İ.R. Karaș (Eds.), Innovations in Smart Cities Applications Volume 7, Springer Nature Switzerland, Cham, Switzerland, 2024: pp. 123–135. [CrossRef]
- Marzouk, Toward More Sustainable Transportation: Green Vehicle Metrics for 2023 and 2024 Model Years, in: A.K. Nagar, D.S. Jat, D.K. Mishra, A. Joshi (Eds.), Intelligent Sustainable Systems, Springer Nature Singapore, Singapore, 2024: pp. 261–272. [CrossRef]
- Marzouk, Aerial e-mobility perspective: Anticipated designs and operational capabilities of eVTOL urban air mobility (UAM) aircraft, Edelweiss Applied Science and Technology 9 (2025) 413–442. [CrossRef]
- Marzouk, Benchmarking the Trends of Urbanization in the Gulf Cooperation Council: Outlook to 2050, in: 1st National Symposium on Emerging Trends in Engineering and Management (NSETEM’2017), WCAS [Waljat College of Applied Sciences], Muscat, Oman, 2017: pp. 1–9. [CrossRef]
- Marzouk, Globalization and diversity requirement in higher education, in: WMSCI 2007 / ISAS 2007, International Institute of Informatics and Systemics (IIIS), Orlando, Florida, USA, 2007: pp. 101–106.
- Marzouk, English Programs for non-English Speaking College Students, in: 1st Knowledge Globalization Conference 2008 (KGLOBAL 2008), Sawyer Business School, Suffolk University, Boston, Massachusetts, USA, 2008: pp. 1–8. [CrossRef]
- M. Kosior-Kazberuk, W. Pawlowski, The Role of Student Initiatives in the Process of Improving the Quality of Higher Education, in: Seville, Spain, 2019: pp. 3432–3440. [CrossRef]
- Žalėnienė, P. Pereira, Higher Education For Sustainability: A Global Perspective, Geography and Sustainability 2 (2021) 99–106. [CrossRef]
- Marzouk, Zero Carbon Ready Metrics for a Single-Family Home in the Sultanate of Oman Based on EDGE Certification System for Green Buildings, Sustainability 15 (2023) 13856. [CrossRef]
- Marzouk, Assessment of global warming in Al Buraimi, sultanate of Oman based on statistical analysis of NASA POWER data over 39 years, and testing the reliability of NASA POWER against meteorological measurements, Heliyon 7 (2021) e06625. [CrossRef]
- Marzouk, Expectations for the Role of Hydrogen and Its Derivatives in Different Sectors through Analysis of the Four Energy Scenarios: IEA-STEPS, IEA-NZE, IRENA-PES, and IRENA-1.5°C, Energies 17 (2024) 646. [CrossRef]
- Marzouk, Levelized cost of green hydrogen (LCOH) in the Sultanate of Oman using H2A-Lite with polymer electrolyte membrane (PEM) electrolyzers powered by solar photovoltaic (PV) electricity, E3S Web of Conferences 469 (2023) 00101. [CrossRef]
- Marzouk, Energy Generation Intensity (EGI) for Parabolic Dish/Engine Concentrated Solar Power in Muscat, Sultanate of Oman, IOP Conference Series: Earth and Environmental Science 1008 (2022) 012013. [CrossRef]
- Marzouk, 2030 Ambitions for Hydrogen, Clean Hydrogen, and Green Hydrogen, Engineering Proceedings 56 (2023) 14. [CrossRef]
- Marzouk, Facilitating Digital Analysis and Exploration in Solar Energy Science and Technology through Free Computer Applications, Engineering Proceedings 31 (2022) 75. [CrossRef]
- Marzouk, Evolution of the (Energy and Atmosphere) credit category in the LEED green buildings rating system for (Building Design and Construction: New Construction), from version 4.0 to version 4.1, Journal of Infrastructure, Policy and Development 8 (2024) 5306. [CrossRef]
- Marzouk, Summary of the 2023 (1st edition) Report of TCEP (Tracking Clean Energy Progress) by the International Energy Agency (IEA), and Proposed Process for Computing a Single Aggregate Rating, E3S Web of Conferences 601 (2025) 00048. [CrossRef]
- Marzouk, Hydrogen Utilization as a Plasma Source for Magnetohydrodynamic Direct Power Extraction (MHD-DPE), IEEE Access 12 (2024) 167088–167107. [CrossRef]
- Marzouk, Estimated electric conductivities of thermal plasma for air-fuel combustion and oxy-fuel combustion with potassium or cesium seeding, Heliyon 10 (2024) e31697. [CrossRef]
- Marzouk, Temperature-Dependent Functions of the Electron–Neutral Momentum Transfer Collision Cross Sections of Selected Combustion Plasma Species, Applied Sciences 13 (2023) 11282. [CrossRef]
- Marzouk, Evolutionary Computing Applied to Design Optimization, in: ASME 2007 International Design Engineering Technical Conferences and Computers and Information in Engineering Conference (IDETC-CIE 2007), ASME [American Society of Mechanical Engineers], Las Vegas, Nevada, USA, 2009: pp. 995–1003. [CrossRef]
- Marzouk, Thermoelectric generators versus photovoltaic solar panels: Power and cost analysis, Edelweiss Applied Science and Technology 8 (2024) 406–428. [CrossRef]
- Marzouk, Multi-Physics Mathematical Model of Weakly-Ionized Plasma Flows, American Journal of Modern Physics 7 (2018) 87–102. [CrossRef]
- Marzouk, Thermo Physical Chemical Properties of Fluids Using the Free NIST Chemistry WebBook Database, Fluid Mechanics Research International Journal 1 (2017). [CrossRef]
- Marzouk, Airfoil Design Using Genetic Algorithms, in: The 2007 International Conference on Scientific Computing (CSC’07), The 2007 World Congress in Computer Science, Computer Engineering, and Applied Computing (WORLDCOMP’07), CSREA Press, Las Vegas, Nevada, USA, 2007: pp. 127–132. [CrossRef]
- Marzouk, A Flight-Mechanics Solver for Aircraft Inverse Simulations and Application to 3D Mirage-III Maneuver, Global Journal of Control Engineering and Technology 1 (2015) 14–26. [CrossRef]
- Marzouk, A.H. Nayfeh, Control of ship roll using passive and active anti-roll tanks, Ocean Engineering 36 (2009) 661–671. [CrossRef]
- Marzouk, Combined Oxy-fuel Magnetohydrodynamic Power Cycle, in: Conference on Energy Challenges in Oman (ECO’2015), DU [Dhofar University], Salalah, Dhofar, Oman, 2015. [CrossRef]
- Marzouk, Jatropha Curcas as Marginal Land Development Crop in the Sultanate of Oman for Producing Biodiesel, Biogas, Biobriquettes, Animal Feed, and Organic Fertilizer, Reviews in Agricultural Science 8 (2020) 109–123. [CrossRef]
- Marzouk, A Nonlinear ODE System for the Unsteady Hydrodynamic Force - A New Approach, World Academy of Science, Engineering and Technology 39 (2009) 948–962. [CrossRef]
- Marzouk, E.D. Huckaby, Nongray EWB and WSGG Radiation Modeling in Oxy-Fuel Environments, in: J. Zhu (Ed.), Computational Simulations and Applications, IntechOpen, 2011: pp. 493–512. [CrossRef]
- Marzouk, Condenser Pressure Influence on Ideal Steam Rankine Power Vapor Cycle using the Python Extension Package Cantera for Thermodynamics, Engineering, Technology & Applied Science Research 14 (2024) 14069–14078. [CrossRef]
- Marzouk, A.H. Nayfeh, Loads on a Harmonically Oscillating Cylinder, in: ASME 2007 International Design Engineering Technical Conferences and Computers and Information in Engineering Conference (IDETC-CIE 2007), ASME [American Society of Mechanical Engineers], Las Vegas, Nevada, USA, 2009: pp. 1755–1774. [CrossRef]
- Marzouk, A.H. Nayfeh, Mitigation of Ship Motion Using Passive and Active Anti-Roll Tanks, in: ASME 2007 International Design Engineering Technical Conferences and Computers and Information in Engineering Conference (IDETC-CIE 2007), ASME [American Society of Mechanical Engineers], Las Vegas, Nevada, USA, 2009: pp. 215–229. [CrossRef]
- Marzouk, A.H. Nayfeh, Hydrodynamic Forces on a Moving Cylinder with Time-Dependent Frequency Variations, in: 46th AIAA Aerospace Sciences Meeting and Exhibit, AIAA [American Institute of Aeronautics and Astronautics], Reno, Nevada, USA, 2008: p. AIAA 2008-680. [CrossRef]
- Marzouk, Portrait of the Decarbonization and Renewables Penetration in Oman’s Energy Mix, Motivated by Oman’s National Green Hydrogen Plan, Energies 17 (2024) 4769. [CrossRef]
- Marzouk, O.R.H. Al Badi, M.H.S. Al Rashdi, H.M.E. Al Balushi, Proposed 2MW Wind Turbine for Use in the Governorate of Dhofar at the Sultanate of Oman, Science Journal of Energy Engineering 7 (2019) 20–28. [CrossRef]
- Marzouk, W.A.M.H.R. Jul, A.M.K. Al Jabri, H.A.M.A. Al-ghaithi, Construction of a Small-Scale Vacuum Generation System and Using It as an Educational Device to Demonstrate Features of the Vacuum, International Journal of Contemporary Education 1 (2018) 1–11. [CrossRef]
- Marzouk, Dataset of total emissivity for CO2, H2O, and H2O-CO2 mixtures; over a temperature range of 300-2900 K and a pressure-pathlength range of 0.01-50 atm.m, Data in Brief (2025) 111428. [CrossRef]
- Marzouk, Technical review of radiative-property modeling approaches for gray and nongray radiation, and a recommended optimized WSGGM for CO2/H2O-enriched gases, Results in Engineering 25 (2025) 103923. [CrossRef]
- Marzouk, Wind Speed Weibull Model Identification in Oman, and Computed Normalized Annual Energy Production (NAEP) From Wind Turbines Based on Data From Weather Stations, Engineering Reports 7 (2025) e70089. [CrossRef]
- Marzouk, In the Aftermath of Oil Prices Fall of 2014/2015–Socioeconomic Facts and Changes in the Public Policies in the Sultanate of Oman, International Journal of Management and Economics Invention 3 (2017) 1463–1479. [CrossRef]
- Y. Hunter-Johnson, B. Farquharson, R. Edgecombe, J. Munnings, N. Bandelier, N. Swann, F. Butler, T. McDonald, N. Newton, L. McDiarmid, Design and Development of Virtual Teaching Practicum Models: Embracing Change During COVID 19, International Journal of Multidisciplinary Perspectives in Higher Education 8 (2023) 1–29. [CrossRef]
- Khairiah, Digitalization, Webometrics, and Its Impact on Higher Education Quality During the COVID-19 Pandemic, Esiculture (2024) 802–815. [CrossRef]
- Spitzig, B.J. Renner, Student Engagement and Retention of Adult Learners at Community Colleges, Journal of College Student Retention: Research, Theory & Practice 26 (2025) 1010–1027. [CrossRef]
- Feng, E.W. Close, C.J. Luxford, J.A. Pierson, A. Olmstead, J. Shim, V.S. Koka, H.C. Galloway, Transforming Undergraduate STEM Education: The Learning Assistant Model and Student Retention and Graduation Rates, Res High Educ 66 (2024) 4. [CrossRef]
- Georgieva, C. Henshall, I. Scott, C. Merriman, Evaluation of an intervention package developed to reduce pre-registration nursing student attrition rates: A mixed method study, Nurse Education Today 146 (2025) 106531. [CrossRef]
- Sapkota, S. Kaur, Enhancing Student Success: Predictive Modeling of Graduation and Dropout Rates in University Management Using Machine Learning, in: P.J.S. Gonçalves, P.K. Singh, S. Tanwar, G. Epiphaniou (Eds.), Proceedings of Fifth International Conference on Computing, Communications, and Cyber-Security, Springer Nature Singapore, Singapore, 2025: pp. 309–319. [CrossRef]
- M.S. Andrade, Student Persistence in Higher Education: What is the Role of Learning?, College Teaching 73 (2025) 66–72. [CrossRef]
- C.A. Paul, D.J. Webb, Examining equity and graduation rates at two institutions using a course deficit model and the collaborative learning through active sense-making in physics curriculum, Phys. Rev. Phys. Educ. Res. 21 (2025) 010107. [CrossRef]
- S.A. Barbera, S.D. Berkshire, C.B. Boronat, M.H. Kennedy, Review of Undergraduate Student Retention and Graduation Since 2010: Patterns, Predictions, and Recommendations for 2020, Journal of College Student Retention: Research, Theory & Practice 22 (2020) 227–250. [CrossRef]
- J. Salmi, A. D’Addio, Policies for achieving inclusion in higher education, Policy Reviews in Higher Education 5 (2021) 47–72. [CrossRef]
- J.M. Ortiz-Lozano, A. Rua-Vieites, P. Bilbao-Calabuig, M. Casadesús-Fa, University student retention: Best time and data to identify undergraduate students at risk of dropout, Innovations in Education and Teaching International 57 (2020) 74–85. [CrossRef]
- C.A. Palacios, J.A. Reyes-Suárez, L.A. Bearzotti, V. Leiva, C. Marchant, Knowledge Discovery for Higher Education Student Retention Based on Data Mining: Machine Learning Algorithms and Case Study in Chile, Entropy 23 (2021) 485. [CrossRef]
- E. Tatem, J.L. Payne, The impact of a College of Nursing Retention Program on the graduation rates of nursing students, ABNF J 11 (2000) 59–63.
- Marzouk, Subcritical and supercritical Rankine steam cycles, under elevated temperatures up to 900°C and absolute pressures up to 400 bara, Advances in Mechanical Engineering 16 (2024) 1–18. [CrossRef]
- F.O. Ifeanyieze, K.R. Ede, E.C. Isiwu, Effect of Career Counseling on Students’ Interest, Academic Performance and Retention Rate in Agricultural Education Programme in Universities in South East Nigeria, Interdisciplinary Journal of Educational Practice (IJEP) 10 (2023) 64–77. [CrossRef]
- Marzouk, Adiabatic Flame Temperatures for Oxy-Methane, Oxy-Hydrogen, Air-Methane, and Air-Hydrogen Stoichiometric Combustion using the NASA CEARUN Tool, GRI-Mech 3.0 Reaction Mechanism, and Cantera Python Package, Engineering, Technology & Applied Science Research 13 (2023) 11437–11444. [CrossRef]
- T. Bruckner, I.A. Bashmakov, Y. Mulugetta, H. Chum, A. De la Vega Navarro, J. Edmonds, A. Faaij, B. Fungtammasan, A. Garg, E. Hertwich, D. Honnery, D. Infield, M. Kainuma, S. Khennas, S. Kim, H.B. Nimir, K. Riahi, N. Strachan, R. Wiser, X. Zhang, Chapter 7 - Energy systems, in: Cambridge University Press, 2014. http://www.ipcc.ch/pdf/assessment-report/ar5/wg3/ipcc_wg3_ar5_chapter7.pdf (accessed October 8, 2024).
- Marzouk, E.D. Huckaby, A Comparative Study of Eight Finite-Rate Chemistry Kinetics for CO/H2 Combustion, Engineering Applications of Computational Fluid Mechanics 4 (2010) 331–356. [CrossRef]
- G.G. Smith, D. Ferguson, Student attrition in mathematics e-learning, Australasian Journal of Educational Technology 21 (2005). [CrossRef]
- Beer, C. Lawson, The problem of student attrition in higher education: An alternative perspective, Journal of Further and Higher Education 41 (2017) 773–784. [CrossRef]
- R.C. Harris, L. Rosenberg, O.M.E. Grace, Addressing the Challenges of Nursing Student Attrition, Journal of Nursing Education 53 (2014) 31–37. [CrossRef]
- L. Grebennikov, M. Shah, Investigating attrition trendsin order to improvestudent retention, Quality Assurance in Education 20 (2012) 223–236. [CrossRef]
- S. Stewart, D.H. Lim, J. Kim, Factors Influencing College Persistence for First-Time Students, Journal of Developmental Education 38 (2015) 12–20.
- S.E. Childs, R. Finnie, F. Martinello, Postsecondary Student Persistence and Pathways: Evidence From the YITS-A in Canada, Res High Educ 58 (2017) 270–294. [CrossRef]
- J. Su, M.L. Waugh, Online Student Persistence or Attrition: Observations Related to Expectations, Preferences, and Outcomes, Journal of Interactive Online Learning 16 (2018) 63–79.
- Newlane University, How We Calculate Progress, Rentention, and Completion Rates, (2024). https://newlane.edu/how-we-calculate-progress-rentention-and-completion-rates (accessed September 28, 2024).
- [Irish Higher Education Authority] HEA, Non Progression and Completion Dashboard, (n.d.). https://hea.ie/statistics/data-for-download-and-visualisations/students/progression/non-progression-and-completion-dashboard (accessed September 27, 2024).
- [Rock Valley College - Office of Institutional Research and Effectiveness] RVC-OIRE, Persistence and Retention Rates, Rock Valley College, Rockford, Illinois, USA, 2023. https://rockvalleycollege.edu/_resources/files/institutional-research/reports/BoT-Persistence-Retention-Jan-2023.pdf (accessed October 15, 2024).
- L.N. Williams, Grit and Academic Performance of First- and Second-Year Students Majoring in Education, Doctor of Philosophy, Curriculum and Instruction with an emphasis in Higher Education Administration, University of South Florida, 2017. https://www.proquest.com/openview/bc1ff37842b340f8c4b0efc4eaa07ff1/1 (accessed October 15, 2024).
- E.J. Gosman, B.A. Dandridge, M.T. Nettles, A.R. Thoeny, Predicting student progression: The influence of race and other student and institutional characteristics on college student performance, Res High Educ 18 (1983) 209–236. [CrossRef]
- X. Hu, X. Zhang, S. McGeown, Foreign language anxiety and achievement: A study of primary school students learning English in China, Language Teaching Research (2021). [CrossRef]
- R.C.P. Silveira, M.L.C.C. Robazzi, Impacts of work in children’s and adolescents school performance: a reality report, Injury Prevention 16 (2010) A150–A150. [CrossRef]
- Coxhead, N.D.T. Vuong, P. Nguyen, Getting to Grade 10 in Vietnam: does an employment boom discourage schooling?, Education Economics 31 (2023) 353–375. [CrossRef]
- J. Smith, S. Paquin, J. St-Amand, C. Singh, D. Moreau, J. Bergeron, M. Leroux, A remediation measure as an alternative to grade retention: A study on achievement motivation, Psychology in the Schools 59 (2022) 1209–1221. [CrossRef]
- [University of Sharjah] UoSh, Retention and Graduation Rates (College of Communication) │ UoSh, [University of Sharjah, Sharjah, UAE, 2023. https://www.sharjah.ac.ae/en/academics/Colleges/Communication/Documents/Retention_Graduation_Rates_2023.pdf (accessed October 16, 2024).
- [New York University Abu Dhabi] NYUAD, Facts and Figures (Retention and Graduation Rates) │ NYUAD, New York University Abu Dhabi (2024). https://nyuad.nyu.edu/en/about/facts-and-figures.html (accessed October 16, 2024).
- [Zayed University] ZU, Graduation & Retention Rates │ ZU, (2024). https://www.zu.ac.ae/main/en/colleges/colleges/__college_of_comm_media_sciences/accreditation/graduation-and-retention-rates (accessed October 16, 2024).
- [United States National Center for Education Statistics] NCES, College Navigator │ NCES - California Institute of Technology, (2024). https://nces.ed.gov/collegenavigator/?q=california+institute&s=all&id=110404 (accessed October 8, 2024).
- S. Boumi, A.E. Vela, Improving Graduation Rate Estimates Using Regularly Updating Multi-Level Absorbing Markov Chains, Education Sciences 10 (2020) 377. [CrossRef]
- R. Larocca, D. Carr, The Effect of Higher Education Performance Funding on Graduation Rates, Journal of Education Finance 45 (2020) 493–526.
- B.B. Gresham, M. Thompson, K. Luedtke-Hoffmann, M. Tietze, Institutional and Program Factors Predict Physical Therapist Assistant Program Graduation Rate and Licensure Examination Pass Rate, Journal of Physical Therapy Education 29 (2015) 27.
- L.E.C. Delnoij, K.J.H. Dirkx, J.P.W. Janssen, R.L. Martens, Predicting and resolving non-completion in higher (online) education – A literature review, Educational Research Review 29 (2020) 100313. [CrossRef]
- [Oman Authority for Academic Accreditation and Quality Assurance of Education] OAAAQA, Requirements for Oman’s System of Quality Assurance (ROSQA), Muscat, Sultanate of Oman, 2013. https://oaaaqa.gov.om/getattachment/66516266-7fe6-43bd-8fd0-8b0e38b83441/ROSQA%20-%20Requirements%20for%20Oman%60s%20System%20of%20Quality%20Assurance.aspx (accessed October 25, 2018).
- Skolnik, The Origin and Evolution of an Anomalous Academic Credential: The Ontario College Advanced Diploma, Canadian Journal of Higher Education 53 (2023) 1–15. [CrossRef]
- S. Nasser, Current status, challenges, and future career pathways of diploma-prepared nurses from the stakeholders’ perspective: a qualitative study, BMC Nurs 23 (2024) 542. [CrossRef]
- S. Hussain, F.U. Zaman, S. Muhammad, A. Hafeez, Analysis of the Initiatives taken by HEC to Implement Associate Degree Program: Opportunities and Challenges, International Research Journal of Management and Social Sciences 4 (2023) 193–210.
- [United States National Center for Education Statistics] NCES, Trend Generator - Graduation rate within 150% of normal time at 4-year postsecondary institutions, (2024). https://nces.ed.gov/ipeds/TrendGenerator/app/answer/7/19 (accessed September 28, 2024).
- A.D. Young-Jones, T.D. Burt, S. Dixon, M.J. Hawthorne, Academic advising: does it really impact student success?, Quality Assurance in Education 21 (2013) 7–19. [CrossRef]
- V.N. Gordon, W.R. Habley, T.J. Grites, Academic Advising: A Comprehensive Handbook, 2nd, reprint ed., John Wiley & Sons, Manhattan, Kansas, USA, 2011. https://books.google.com.om/books?id=Jdm0kIDjCO8C.
- S. Hoidn, M. Klemenčič, eds., The Routledge International Handbook of Student-Centered Learning and Teaching in Higher Education, Routledge, Abingdon, England, UK, 2021. [CrossRef]
- K.H.D. Tang, Student-centered Approach in Teaching and Learning: What Does It Really Mean?, Acta Pedagogia Asia 2 (2023) 72–83. [CrossRef]
- S.B. Merriam, G. Ntseane, Transformational Learning in Botswana: How Culture Shapes the Process, Adult Education Quarterly 58 (2008) 183–197. [CrossRef]
- S. Choy, Transformational Learning in the Workplace, Journal of Transformative Education 7 (2009) 65–84. [CrossRef]
- F. Boyle, J. Kwon, C. Ross, O. Simpson, Student–student mentoring for retention and engagement in distance education, Open Learning: The Journal of Open, Distance and e-Learning 25 (2010) 115–130. [CrossRef]
- Gunter, G. Polidori, STEM Graduation Trends and Educational Reforms: Analyzing Factors and Enhancing Support, American Journal of STEM Education 1 (2024). https://ojed.org/STEM/article/view/7026 (accessed October 10, 2024).
- Tesfamariam, C. Alamo-Pastrana, E.H. Bradley, Four-Year College Completion Rates: What Accounts for the Variation?, Journal of Education 204 (2024) 527–535. [CrossRef]
- M.L. Breyfogle, K.A. Daubman, Increasing Undergraduate Student Retention with “Psychology of Success”: A Course for First-Year Students on Academic Warning, Student Success 15 (2024) 86–91. [CrossRef]
- [Organisation for Economic Co-operation and Development] OECD, Education at a Glance 2024: OECD Indicators, OECD [Organisation for Economic Co-operation and Development], Paris, France, 2024. [CrossRef]
- [Organisation for Economic Co-operation and Development] OECD, OECD │Tertiary graduation rate, OECD (2025). https://www.oecd.org/en/data/indicators/tertiary-graduation-rate.html (accessed February 4, 2025).
- [United Nations Educational UNESCO Scientific and Cultural Organization], Higher education global data report (Summary), UNESCO [United Nations Educational, Scientific and Cultural Organization], Paris, France, 2022. https://www.right-to-education.org/sites/right-to-education.org/files/resource-attachments/UNESCO_Higher%20Education%20Global%20Data%20Report_Working%20document_May2022_EN_0.pdf (accessed February 4, 2025).
- [United Nations Educational UNESCO Scientific and Cultural Organization], Higher education: figures at a glance, UNESCO [United Nations Educational, Scientific and Cultural Organization], Paris, France, 2024. https://unesdoc.unesco.org/ark:/48223/pf0000389069 (accessed February 4, 2025).
- [United Kingdom Higher Education Statistics Agency] HESA, HESA │Non-continuation: UK Performance Indicators, (n.d.). https://www.hesa.ac.uk/data-and-analysis/performance-indicators/non-continuation (accessed March 11, 2025).
- J. Gu, X. Li, L. Wang, Undergraduate Education, in: J. Gu, X. Li, L. Wang (Eds.), Higher Education in China, Springer, Singapore, 2018: pp. 117–144. [CrossRef]
- D.P.K. Tripathi, Attitude Of Under- Graduate Students Towards Choice Based Credit System (Cbcs) In Relation To Their Academic Achievements- A Case Study., Journal of Survey in Fisheries Sciences (2021) 153–158. [CrossRef]
- T. Hotta, The Development of “Asian Academic Credits” as an Aligned Credit Transfer System in Asian Higher Education, Journal of Studies in International Education 24 (2020) 167–189. [CrossRef]
- T.C. Mason, R.F. Arnove, M. Sutton, Credits, curriculum, and control in higher education: Cross-national perspectives, Higher Education 42 (2001) 107–137. [CrossRef]
- K. Thomas Baby, Integrating Content-Based Instruction in a Foundation Program for Omani Nursing Students, in: R. Al-Mahrooqi, C. Denman (Eds.), English Education in Oman: Current Scenarios and Future Trajectories, Springer, Singapore, 2018: pp. 247–257. [CrossRef]
- E. Davison, R. Sanderson, T. Hobson, J. Hopkins, Skills for Success? Supporting transition into higher education for students from diverse backgrounds., Widening Participation and Lifelong Learning 24 (2022) 165–186. [CrossRef]
- R. Khalil, A Re-evaluation of Academics’ Expectations of Preparatory Year Egyptian Students: A Reconstructed Understanding, The International Journal of Interdisciplinary Educational Studies 7 (2013) 55–72. [CrossRef]
- H.B. Khoshaim, A.B. Khoshaim, T. Ali, Preparatory Year: The Filter for Mathematically Intensive Programs, International Interdisciplinary Journal of Education 7 (2018) 127–136. [CrossRef]
- [United States National Center for Education Statistics] NCES, About Us │ NCES, (2024). https://nces.ed.gov/about (accessed October 12, 2024).
- [United States National Center for Education Statistics] NCES, History │ NCES, (2024). https://nces.ed.gov/about/?sec=nceshistory (accessed October 12, 2024).
- [United States Institute of Education Sciences] IES, About Us │ IES, (2024). https://ies.ed.gov/aboutus (accessed October 12, 2024).
- C.S. Chhin, K.A. Taylor, W.S. Wei, Supporting a Culture of Replication: An Examination of Education and Special Education Research Grants Funded by the Institute of Education Sciences, Educational Researcher 47 (2018) 594–605. [CrossRef]
- [United States National Center for Education Statistics] NCES, IPEDS (Integrated Postsecondary Education Data System) - Use The Data, (2024). https://nces.ed.gov/ipeds/use-the-data (accessed September 28, 2024).
- [United States National Center for Education Statistics] NCES, IPEDS (Integrated Postsecondary Education Data System) - Glossary, (2024). https://surveys.nces.ed.gov/ipeds/public/glossary (accessed September 28, 2024).
- Zong, A. Davis, Modeling University Retention and Graduation Rates Using IPEDS, Journal of College Student Retention: Research, Theory & Practice 26 (2024) 311–333. [CrossRef]
- [United States National Center for Education Statistics] NCES, IPEDS (Integrated Postsecondary Education Data System) - Trend Generator User Guide, Institute of Education Sciences (IES) at the U.S. Department of Education, Washington, DC, USA, 2018. https://nces.ed.gov/ipeds/TrendGenerator/Sources/IPEDS_Trend_Generator_User_Guide.pdf (accessed September 28, 2024).
- [United States National Center for Education Statistics] NCES, College Navigator │ NCES, (2024). https://nces.ed.gov/collegenavigator (accessed September 28, 2024).
- [National Student Clearinghouse Research Center] NSC-RC, About Us │ NSC-RC, (2024). https://nscresearchcenter.org/aboutus (accessed September 28, 2024).
- [National Student Clearinghouse Research Center] NSC-RC, Publications │ NSC-RC, (2024). https://nscresearchcenter.org/publications (accessed September 28, 2024).
- [United States National Center for Education Statistics] NCES, Trend Generator - Graduation rate within 150% of normal time for bachelor’s or equivalent degree-seeking undergraduate students who received a bachelor’s or equivalent degree at 4-year postsecondary institutions, (2024). https://nces.ed.gov/ipeds/trendgenerator/app/answer/7/20 (accessed October 4, 2024).
- [United States National Center for Education Statistics] NCES, Trend Generator - Full-time retention rate in postsecondary institutions, (2024). https://nces.ed.gov/ipeds/trendgenerator/app/answer/7/32 (accessed September 28, 2024).
- [National Student Clearinghouse Research Center] NSC-RC, Persistence and Retention: Fall 2022 Beginning Postecondary Student Cohort, 2024. https://nscresearchcenter.org/wp-content/uploads/PersistenceandRetention2024_Appendix.xlsx.
- [United States National Center for Education Statistics] NCES, Detail for CIP Code 04, (2025). https://nces.ed.gov/ipeds/cipcode/cipdetail.aspx?y=55&cip=04 (accessed February 2, 2025).
- [United States National Center for Education Statistics] NCES, Detail for CIP Code 52, (2025). https://nces.ed.gov/ipeds/cipcode/cipdetail.aspx?y=55&cip=52 (accessed February 2, 2025).
- [United States National Center for Education Statistics] NCES, Detail for CIP Code 11, (2025). https://nces.ed.gov/ipeds/cipcode/cipdetail.aspx?y=55&cip=11 (accessed February 2, 2025).
- [United States National Center for Education Statistics] NCES, Detail for CIP Code 13, (2025). https://nces.ed.gov/ipeds/cipcode/cipdetail.aspx?y=56&cip=13 (accessed February 4, 2025).
- [United States National Center for Education Statistics] NCES, Detail for CIP Code 14, (2025). https://nces.ed.gov/ipeds/cipcode/cipdetail.aspx?y=55&cip=14 (accessed February 2, 2025).
- [United States National Center for Education Statistics] NCES, Detail for CIP Code 15, (2025). https://nces.ed.gov/ipeds/cipcode/cipdetail.aspx?y=56&cip=15 (accessed February 2, 2025).
- [United States National Center for Education Statistics] NCES, Detail for CIP Code 51, (2025). https://nces.ed.gov/ipeds/cipcode/cipdetail.aspx?y=56&cip=51 (accessed February 2, 2025).
- [United States National Center for Education Statistics] NCES, Detail for CIP Code 24, (2025). https://nces.ed.gov/ipeds/cipcode/cipdetail.aspx?y=56&cip=24 (accessed February 4, 2025).
- [United States National Center for Education Statistics] NCES, Detail for CIP Code 22, (2025). https://nces.ed.gov/ipeds/cipcode/cipdetail.aspx?y=56&cip=22 (accessed February 2, 2025).
- S.J. Daniel, Education and the COVID-19 pandemic, Prospects 49 (2020) 91–96. [CrossRef]
- S. Pokhrel, R. Chhetri, A Literature Review on Impact of COVID-19 Pandemic on Teaching and Learning, Higher Education for the Future 8 (2021) 133–141. [CrossRef]
- M. Ciotti, M. Ciccozzi, A. Terrinoni, W.-C. Jiang, C.-B. Wang, S. Bernardini, The COVID-19 pandemic, Critical Reviews in Clinical Laboratory Sciences 57 (2020) 365–388. [CrossRef]
- C.H. Liu, S. Pinder-Amaker, H. “Chris” Hahm, J.A. Chen, Priorities for addressing the impact of the COVID-19 pandemic on college student mental health, Journal of American College Health 70 (2022) 1356–1358. [CrossRef]
- A.M. Lederer, M.T. Hoban, S.K. Lipson, S. Zhou, D. Eisenberg, More Than Inconvenienced: The Unique Needs of U.S. College Students During the COVID-19 Pandemic, Health Educ Behav 48 (2021) 14–19. [CrossRef]
- [Oman Authority for Academic Accreditation and Quality Assurance of Education] OAAAQA, Oman Academic Standards for General Foundation Programs (GFP), Muscat, Sultanate of Oman, 2008. https://oaaaqa.gov.om/getattachment/54ac4e6a-0d27-4dd9-b4a2-ba8759979c25/GFP%20Standards%20FINAL.aspx (accessed October 16, 2024).
- [Gulf College] GC, General Foundation Programme (GFP) │ GC, Gulf College (2024). https://gulfcollege.edu.om/programmes/general-foundation-programme/ (accessed October 16, 2024).
- Black, S. Moore, E.W. Weisstein, Successive Overrelaxation Method, (2025). https://mathworld.wolfram.com/SuccessiveOverrelaxationMethod.html (accessed March 11, 2025).
- Marzouk, Direct Numerical Simulations of the Flow Past a Cylinder Moving With Sinusoidal and Nonsinusoidal Profiles, Journal of Fluids Engineering 131 (2009) 121201. [CrossRef]
- Marzouk, Radiant Heat Transfer in Nitrogen-Free Combustion Environments, International Journal of Nonlinear Sciences and Numerical Simulation 19 (2018) 175–188. [CrossRef]
- Marzouk, The Sod gasdynamics problem as a tool for benchmarking face flux construction in the finite volume method, Scientific African 10 (2020) e00573. [CrossRef]
- Marzouk, E.D. Huckaby, Modeling Confined Jets with Particles and Swril, in: S.-I. Ao, B. Rieger, M.A. Amouzegar (Eds.), Machine Learning and Systems Engineering, Springer Netherlands, Dordrecht, Netherlands, 2010: pp. 243–256. [CrossRef]
- Marzouk, Changes in fluctuation waves in coherent airflow structures with input perturbation, WSEAS Transactions on Signal Processing 4 (2008) 604–614. [CrossRef]
- Marzouk, Directivity and Noise Propagation for Supersonic Free Jets, in: 46th AIAA Aerospace Sciences Meeting and Exhibit, AIAA [American Institute of Aeronautics and Astronautics], Reno, Nevada, USA, 2008: p. AIAA 2008-23. [CrossRef]
- Marzouk, Investigation of Strouhal number effect on acoustic fields, in: 22nd National Conference on Noise Control Engineering (NOISE-CON 2007), INCE [Institute of Noise Control Engineering], Reno, Nevada, USA, 2007: pp. 1056–1067. [CrossRef]
- Marzouk, Noise emissions from excited jets, in: 22nd National Conference on Noise Control Engineering (NOISE-CON 2007), INCE [Institute of Noise Control Engineering], Reno, Nevada, USA, 2007: pp. 1034–1045. [CrossRef]
- Marzouk, Validating a Model for Bluff-Body Burners Using the HM1 Turbulent Nonpremixed Flame, Journal of Advanced Thermal Science Research 3 (2016) 12–23. [CrossRef]
- Marzouk, A.H. Nayfeh, Detailed Characteristics of the Resonating and Non-Resonating Flows Past a Moving Cylinder, in: 49th AIAA/ASME/ASCE/AHS/ASC Structures, Structural Dynamics, and Materials Conference, AIAA [American Institute of Aeronautics and Astronautics], Schaumburg, Illinois, USA, 2008: p. AIAA 2008-2311. [CrossRef]
- Marzouk, E.D. Huckaby, Assessment of syngas kinetic models for the prediction of a turbulent nonpremixed flame, in: Fall Meeting of the Eastern States Section of the Combustion Institute 2009, College Park, Maryland, USA, 2009: pp. 726–751. [CrossRef]
- Marzouk, A.H. Nayfeh, Fluid Forces and Structure-Induced Damping of Obliquely-Oscillating Offshore Structures, in: The Eighteenth (2008) International Offshore and Polar Engineering Conference (ISOPE-2008), ISOPE [International Society of Offshore and Polar Engineers], Vancouver, British Columbia, Canada, 2008: pp. 460–468. https://onepetro.org/ISOPEIOPEC/proceedings-abstract/ISOPE08/All-ISOPE08/ISOPE-I-08-328/11052 (accessed September 21, 2024).
- Marzouk, Cantera-Based Python Computer Program for Solving Steam Power Cycles with Superheating, International Journal of Emerging Technology and Advanced Engineering 13 (2023) 63–73. [CrossRef]
- Marzouk, A.H. Nayfeh, A Parametric Study and Optimization of Ship-Stabilization Systems, in: 1st WSEAS International Conference on Maritime and Naval Science and Engineering (MN’08), WSEAS [World Scientific and Engineering Academy and Society], Malta, 2008: pp. 169–174. https://www.worldses.org/books/2008/malta/finite_differences_finite_elements_finite_volumes_and_boundary_elements.pdf (accessed September 21, 2024).
- Marzouk, A. Nayfeh, Physical Interpretation of the Nonlinear Phenomena in Excited Wakes, in: 46th AIAA Aerospace Sciences Meeting and Exhibit, AIAA [American Institute of Aeronautics and Astronautics], Reno, Nevada, USA, 2008: p. AIAA 2008-1304. [CrossRef]
- Marzouk, Simulation, Modeling, and Characterization of the Wakes of Fixed and Moving Cylinders, PhD in Engineering Mechanics, Virginia Polytechnic Institute and State University (Virginia Tech), 2009. http://hdl.handle.net/10919/26316 (accessed November 26, 2024).
- K.J. Vachaparambil, K.E. Einarsrud, Comparison of Surface Tension Models for the Volume of Fluid Method, Processes 7 (2019) 542. [CrossRef]
- Marzouk, Performance analysis of shell-and-tube dehydrogenation module, International Journal of Energy Research 41 (2017) 604–610. [CrossRef]
- Z. Song, J. Li, L. Xu, M. Ouyang, Traction Control System for EV Based on Modified Maximum Transmissible Torque Estimation, in: 2013 IEEE Vehicle Power and Propulsion Conference (VPPC), 2013: pp. 1–7. [CrossRef]
- Marzouk, Coupled differential-algebraic equations framework for modeling six-degree-of-freedom flight dynamics of asymmetric fixed-wing aircraft, International Journal of Applied and Advanced Sciences 12 (2025) 30–51. [CrossRef]
- W. You, Z.-Y. Li, W.-Q. Tao, A general self-adaptive under-relaxation strategy for fast and robust convergence of iterative calculation of incompressible flow, Numerical Heat Transfer, Part B: Fundamentals 77 (2020) 299–310. [CrossRef]
- Marzouk, A.H. Nayfeh, A Study of the Forces on an Oscillating Cylinder, in: ASME 2007 26th International Conference on Offshore Mechanics and Arctic Engineering (OMAE 2007), ASME [American Society of Mechanical Engineers], San Diego, California, USA, 2009: pp. 741–752. [CrossRef]
- OpenCFD, Documentation │ 6.3 Solution and algorithm control, (2025). https://www.openfoam.com/documentation/user-guide/6-solving/6.3-solution-and-algorithm-control (accessed February 4, 2025).
- Marzouk, A.H. Nayfeh, Simulation, Analysis, and Explanation of the Lift Suppression and Break of 2:1 Force Coupling Due to in-Line Structural Vibration, in: 49th AIAA/ASME/ASCE/AHS/ASC Structures, Structural Dynamics, and Materials Conference, AIAA [American Institute of Aeronautics and Astronautics], Schaumburg, Illinois, USA, 2008: p. AIAA 2008-2309. [CrossRef]
- Marzouk, Accurate Prediction of Noise Generation and Propagation, in: 18th Engineering Mechanics Division Conference of the American Society of Civil Engineers (ASCE-EMD), Zenodo, Blacksburg, Virginia, USA, 2007: pp. 1–6. [CrossRef]
- Marzouk, A. Nayfeh, Differential/Algebraic Wake Model Based on the Total Fluid Force and Its Direction, and the Effect of Oblique Immersed-Body Motion on `Type-1’ and `Type-2’ Lock-in, in: 47th AIAA Aerospace Sciences Meeting Including The New Horizons Forum and Aerospace Exposition, AIAA [American Institute of Aeronautics and Astronautics], Orlando, Florida, USA, 2009: p. AIAA 2009-1112. [CrossRef]
- R. Ravid, Practical Statistics for Educators, 7th ed., Rowman & Littlefield, Lanham, Maryland, USA, 2024. https://books.google.com.om/books/about/Practical_Statistics_for_Educators.html?id=0E8JEQAAQBAJ.
- G. Casella, R. Berger, Statistical Inference, 2nd ed., CRC Press, Boca Raton, Florida, USA, 2024. https://www.routledge.com/Statistical-Inference/Casella-Berger/p/book/9781032593036.
- Marzouk, A.H. Nayfeh, New Wake Models With Capability of Capturing Nonlinear Physics, in: American Society of Mechanical Engineers Digital Collection, 2009: pp. 901–912. [CrossRef]
- J. Karch, Improving on Adjusted R-Squared, Collabra: Psychology 6 (2020) 45. [CrossRef]
- Khalismatov, R. Zakirov, S. Shomurodov, R. Isanova, F. Joraev, Y. Ergashev, Correlation analysis of geological factors with the coefficient of gas transfer of organizations, E3S Web Conf. 497 (2024) 01018. [CrossRef]
- M. Fiandini, A.B.D. Nandiyanto, D.F.A. Husaeni, D.N.A. Husaeni, M. Mushiban, How to Calculate Statistics for Significant Difference Test Using SPSS: Understanding Students Comprehension on the Concept of Steam Engines as Power Plant, Indonesian Journal of Science and Technology 9 (2024) 45–108.
- Fryzlewicz, Robust Narrowest Significance Pursuit: Inference for Multiple Change-Points in the Median, Journal of Business & Economic Statistics 42 (2024) 1389–1402. [CrossRef]
- M. Moland, A. Michailidou, Testing Causal Inference Between Social Media News Reliance and (Dis)trust of EU Institutions with an Instrumental Variable Approach: Lessons From a Null-Hypothesis Case, Political Studies Review 22 (2024) 412–426. [CrossRef]
- Olawale, The impact of capital market on the economic growth of Nigeria, GSC Advanced Research and Reviews 21 (2024) 013–026. [CrossRef]
- Salih, L. Alsalhi, A. Abou-Moghli, Entrepreneurial orientation and digital transformation as drivers of high organizational performance: Evidence from Iraqi private bank, Uncertain Supply Chain Management 12 (2024) 9–18. [CrossRef]
- Microsoft Corporation, Perform a regression analysis, (2025). https://support.microsoft.com/en-us/office/perform-a-regression-analysis-54f5c00e-0f51-4274-a4a7-ae46b418a23e (accessed February 3, 2025).
- Marzouk, Contrasting the Cartesian and polar forms of the shedding-induced force vector in response to 12 subharmonic and superharmonic mechanical excitations, Fluid Dynamics Research 42 (2010) 035507. [CrossRef]
- Uragun, R. Rajan, Developing an Appropriate Data Normalization Method, in: 2011 10th International Conference on Machine Learning and Applications and Workshops, 2011: pp. 195–199. [CrossRef]
- Marzouk, One-way and two-way couplings of CFD and structural models and application to the wake-body interaction, Applied Mathematical Modelling 35 (2011) 1036–1053. [CrossRef]
- Källback, M. Shariatgorji, A. Nilsson, P.E. Andrén, Novel mass spectrometry imaging software assisting labeled normalization and quantitation of drugs and neuropeptides directly in tissue sections, Journal of Proteomics 75 (2012) 4941–4951. [CrossRef]
- Marzouk, A two-step computational aeroacoustics method applied to high-speed flows, Noise Control Engineering Journal 56 (2008) 396. [CrossRef]
- L. Bornmann, L. Leydesdorff, J. Wang, Which percentile-based approach should be preferred for calculating normalized citation impact values? An empirical comparison of five approaches including a newly developed citation-rank approach (P100), Journal of Informetrics 7 (2013) 933–944. [CrossRef]
- Marzouk, Characteristics of the Flow-Induced Vibration and Forces With 1- and 2-DOF Vibrations and Limiting Solid-to-Fluid Density Ratios, Journal of Vibration and Acoustics 132 (2010) 041013. [CrossRef]
- Marzouk, E.D. Huckaby, Effects of Turbulence Modeling and Parcel Approach on Dispersed Two-Phase Swirling Flow, in: World Congress on Engineering and Computer Science 2009 (WCECS 2009), IAENG [International Association of Engineers], San Francisco, California, USA, 2009: pp. 1–11. https://www.iaeng.org/publication/WCECS2009/WCECS2009_pp972-982.pdf (accessed September 21, 2024).
- Marzouk, Detailed and simplified plasma models in combined-cycle magnetohydrodynamic power systems, International Journal of Advanced and Applied Sciences 10 (2023) 96–108. [CrossRef]
- Marzouk, Assessment of Three Databases for the NASA Seven-Coefficient Polynomial Fits for Calculating Thermodynamic Properties of Individual Species, International Journal of Aeronautical Science & Aerospace Research 5 (2018) 150–163. [CrossRef]
- Marzouk, Land-Use competitiveness of photovoltaic and concentrated solar power technologies near the Tropic of Cancer, Solar Energy 243 (2022) 103–119. [CrossRef]
- Marzouk, A.H. Nayfeh, Reduction of the loads on a cylinder undergoing harmonic in-line motion, Physics of Fluids 21 (2009) 083103. [CrossRef]
- Marzouk, A.H. Nayfeh, Characterization of the flow over a cylinder moving harmonically in the cross-flow direction, International Journal of Non-Linear Mechanics 45 (2010) 821–833. [CrossRef]
- Marzouk, E.D. Huckaby, Simulation of a Swirling Gas-Particle Flow Using Different k-epsilon Models and Particle-Parcel Relationships, Engineering Letters 18 (2010) 7. [CrossRef]
- Marzouk, E.D. Huckaby, New Weighted Sum of Gray Gases (WSGG) Models for Radiation Calculation in Carbon Capture Simulations: Evaluation and Different Implementation Techniques, in: 7th U.S. National Technical Meeting of the Combustion Institute, Atlanta, Georgia, USA, 2011: pp. 2483–2496. [CrossRef]
- Marzouk, Flow control using bifrequency motion, Theoretical and Computational Fluid Dynamics 25 (2011) 381–405. [CrossRef]
- M.K. Burns, Test-retest reliability of individual student acquisition and retention rates as measured by instructional assessment, Doctor of Philosophy, School of Education, Andrews University, 1999. https://digitalcommons.andrews.edu/cgi/viewcontent.cgi?article=1254&context=dissertations (accessed October 8, 2024).
- Marzouk, Tilt sensitivity for a scalable one-hectare photovoltaic power plant composed of parallel racks in Muscat, Cogent Engineering 9 (2022) 2029243. [CrossRef]
- A.E.M. van den Oever, D. Costa, G. Cardellini, M. Messagie, Systematic review on the energy conversion efficiency of biomass-based Fischer-Tropsch plants, Fuel 324 (2022) 124478. [CrossRef]
- Marzouk, Lookup Tables for Power Generation Performance of Photovoltaic Systems Covering 40 Geographic Locations (Wilayats) in the Sultanate of Oman, with and without Solar Tracking, and General Perspectives about Solar Irradiation, Sustainability 13 (2021) 13209. [CrossRef]
- Singh, B. Singh, Investigating the impact of data normalization on classification performance, Applied Soft Computing 97 (2020) 105524. [CrossRef]
- Marzouk, Energy Generation Intensity (EGI) of Solar Updraft Tower (SUT) Power Plants Relative to CSP Plants and PV Power Plants Using the New Energy Simulator “Aladdin,” Energies 17 (2024) 405. [CrossRef]
- D.P. Bills, R.L. Canosa, Sharing introductory programming curriculum across disciplines, in: Proceedings of the 8th ACM SIGITE Conference on Information Technology Education, Association for Computing Machinery, New York, NY, USA, 2007: pp. 99–106. [CrossRef]
- Anthony, Computing education in academia: toward differentiating the disciplines, in: Proceedings of the 4th Conference on Information Technology Curriculum, Association for Computing Machinery, New York, NY, USA, 2003: pp. 1–8. [CrossRef]
- F.-M.E. Uzoka, R. Connolly, M. Schroeder, N. Khemka, J. Miller, Computing is not a rock band: student understanding of the computing disciplines, in: Proceedings of the 14th Annual ACM SIGITE Conference on Information Technology Education, Association for Computing Machinery, New York, NY, USA, 2013: pp. 115–120. [CrossRef]
- Courte, C. Bishop-Clark, Do students differentiate between computing disciplines?, SIGCSE Bull. 41 (2009) 29–33. [CrossRef]
- Gouia-Zarrad, R. Gharbi, A. Amdouni, Lessons Learned from a Successful First Time ABET Accreditation of Three Engineering Programs, in: 2024 IEEE World Engineering Education Conference (EDUNINE), 2024: pp. 1–6. [CrossRef]
- N. Juneam, R. Greenlaw, Spawning Four-Year, ABET-Accreditable Programs in Cybersecurity from Existing Computer Science Programs in Thailand, International Journal of Computing Sciences Research 8 (2024) 2612–2634.
- DeBello, P. Ghazizadeh, F. Keshtkar, Special Topics Courses in ABET Accredited Computer Science Degree Curriculum: Benefits and Challenges, in: Valencia, Spain, 2024: pp. 7535–7535. [CrossRef]
- [Accreditation Board for Engineering and Technology] ABET, Program Eligibility Requirements │ ABET, ABET (2024). https://www.abet.org/accreditation/what-is-accreditation/eligibility-requirements (accessed October 15, 2024).
- [Accreditation Board for Engineering and Technology] ABET, Bylaws, Constitution and Rules of Procedure │ ABET, (2024). https://www.abet.org/about-abet/governance/bylaws-constitution-and-rules-of-procedure (accessed October 15, 2024).
- [Accreditation Board for Engineering and Technology] ABET, ABET Constitution, 2015. https://www.abet.org/wp-content/uploads/2020/02/Ratified-ABET-Constitution-2015-Public.pdf (accessed October 15, 2024).
- [Accreditation Board for Engineering and Technology] ABET, EAC [Engineering Accreditation Commission] - 2023-2024 Criteria for Accrediting Engineering Programs, ABET [Accreditation Board for Engineering and Technology], Baltimore, Maryland, USA, 2022. https://www.abet.org/wp-content/uploads/2023/01/23-24-EAC-Criteria_FINAL.pdf (accessed March 11, 2025).
- [Oman Authority for Academic Accreditation and Quality Assurance of Education] OAAAQA, Institutional Standards Assessment Manual (ISAM) - Institutional Accreditation: Version 2, Muscat, Sultanate of Oman, 2024. https://www.oaaaqa.gov.om/getattachment/ffe91bb3-f000-4067-aab0-3d3bed52d28a/Institutional%20Standards%20Assessment%20Manual%20V2.aspx (accessed March 11, 2025).
- Iannelli, P. McMullin, E. Smyth, Higher education retention in Ireland and Scotland: the role of admissions policies, High Educ (2024). [CrossRef]
- [Quality Assurance Agency for Higher Education] QAA, International Quality Review of American University of Ras Al Khaima, QAA [Quality Assurance Agency for Higher Education], Gloucester, England, UK, 2021. https://www.qaa.ac.uk/docs/qaa/reports/american-university-of-ras-al-khaimah-iqr-21.pdf (accessed April 1, 2025).
- I.W. Li, D. Jackson, Influence of entry pathway and equity group status on retention and the student experience in higher education, High Educ 87 (2024) 1411–1431. [CrossRef]
- [Quacquarelli Symonds] QS, Data Appendix, (2025). https://support.qs.com/hc/en-gb/articles/4405027974290-Data-Appendix (accessed February 3, 2025).
Figure 1.
Profile
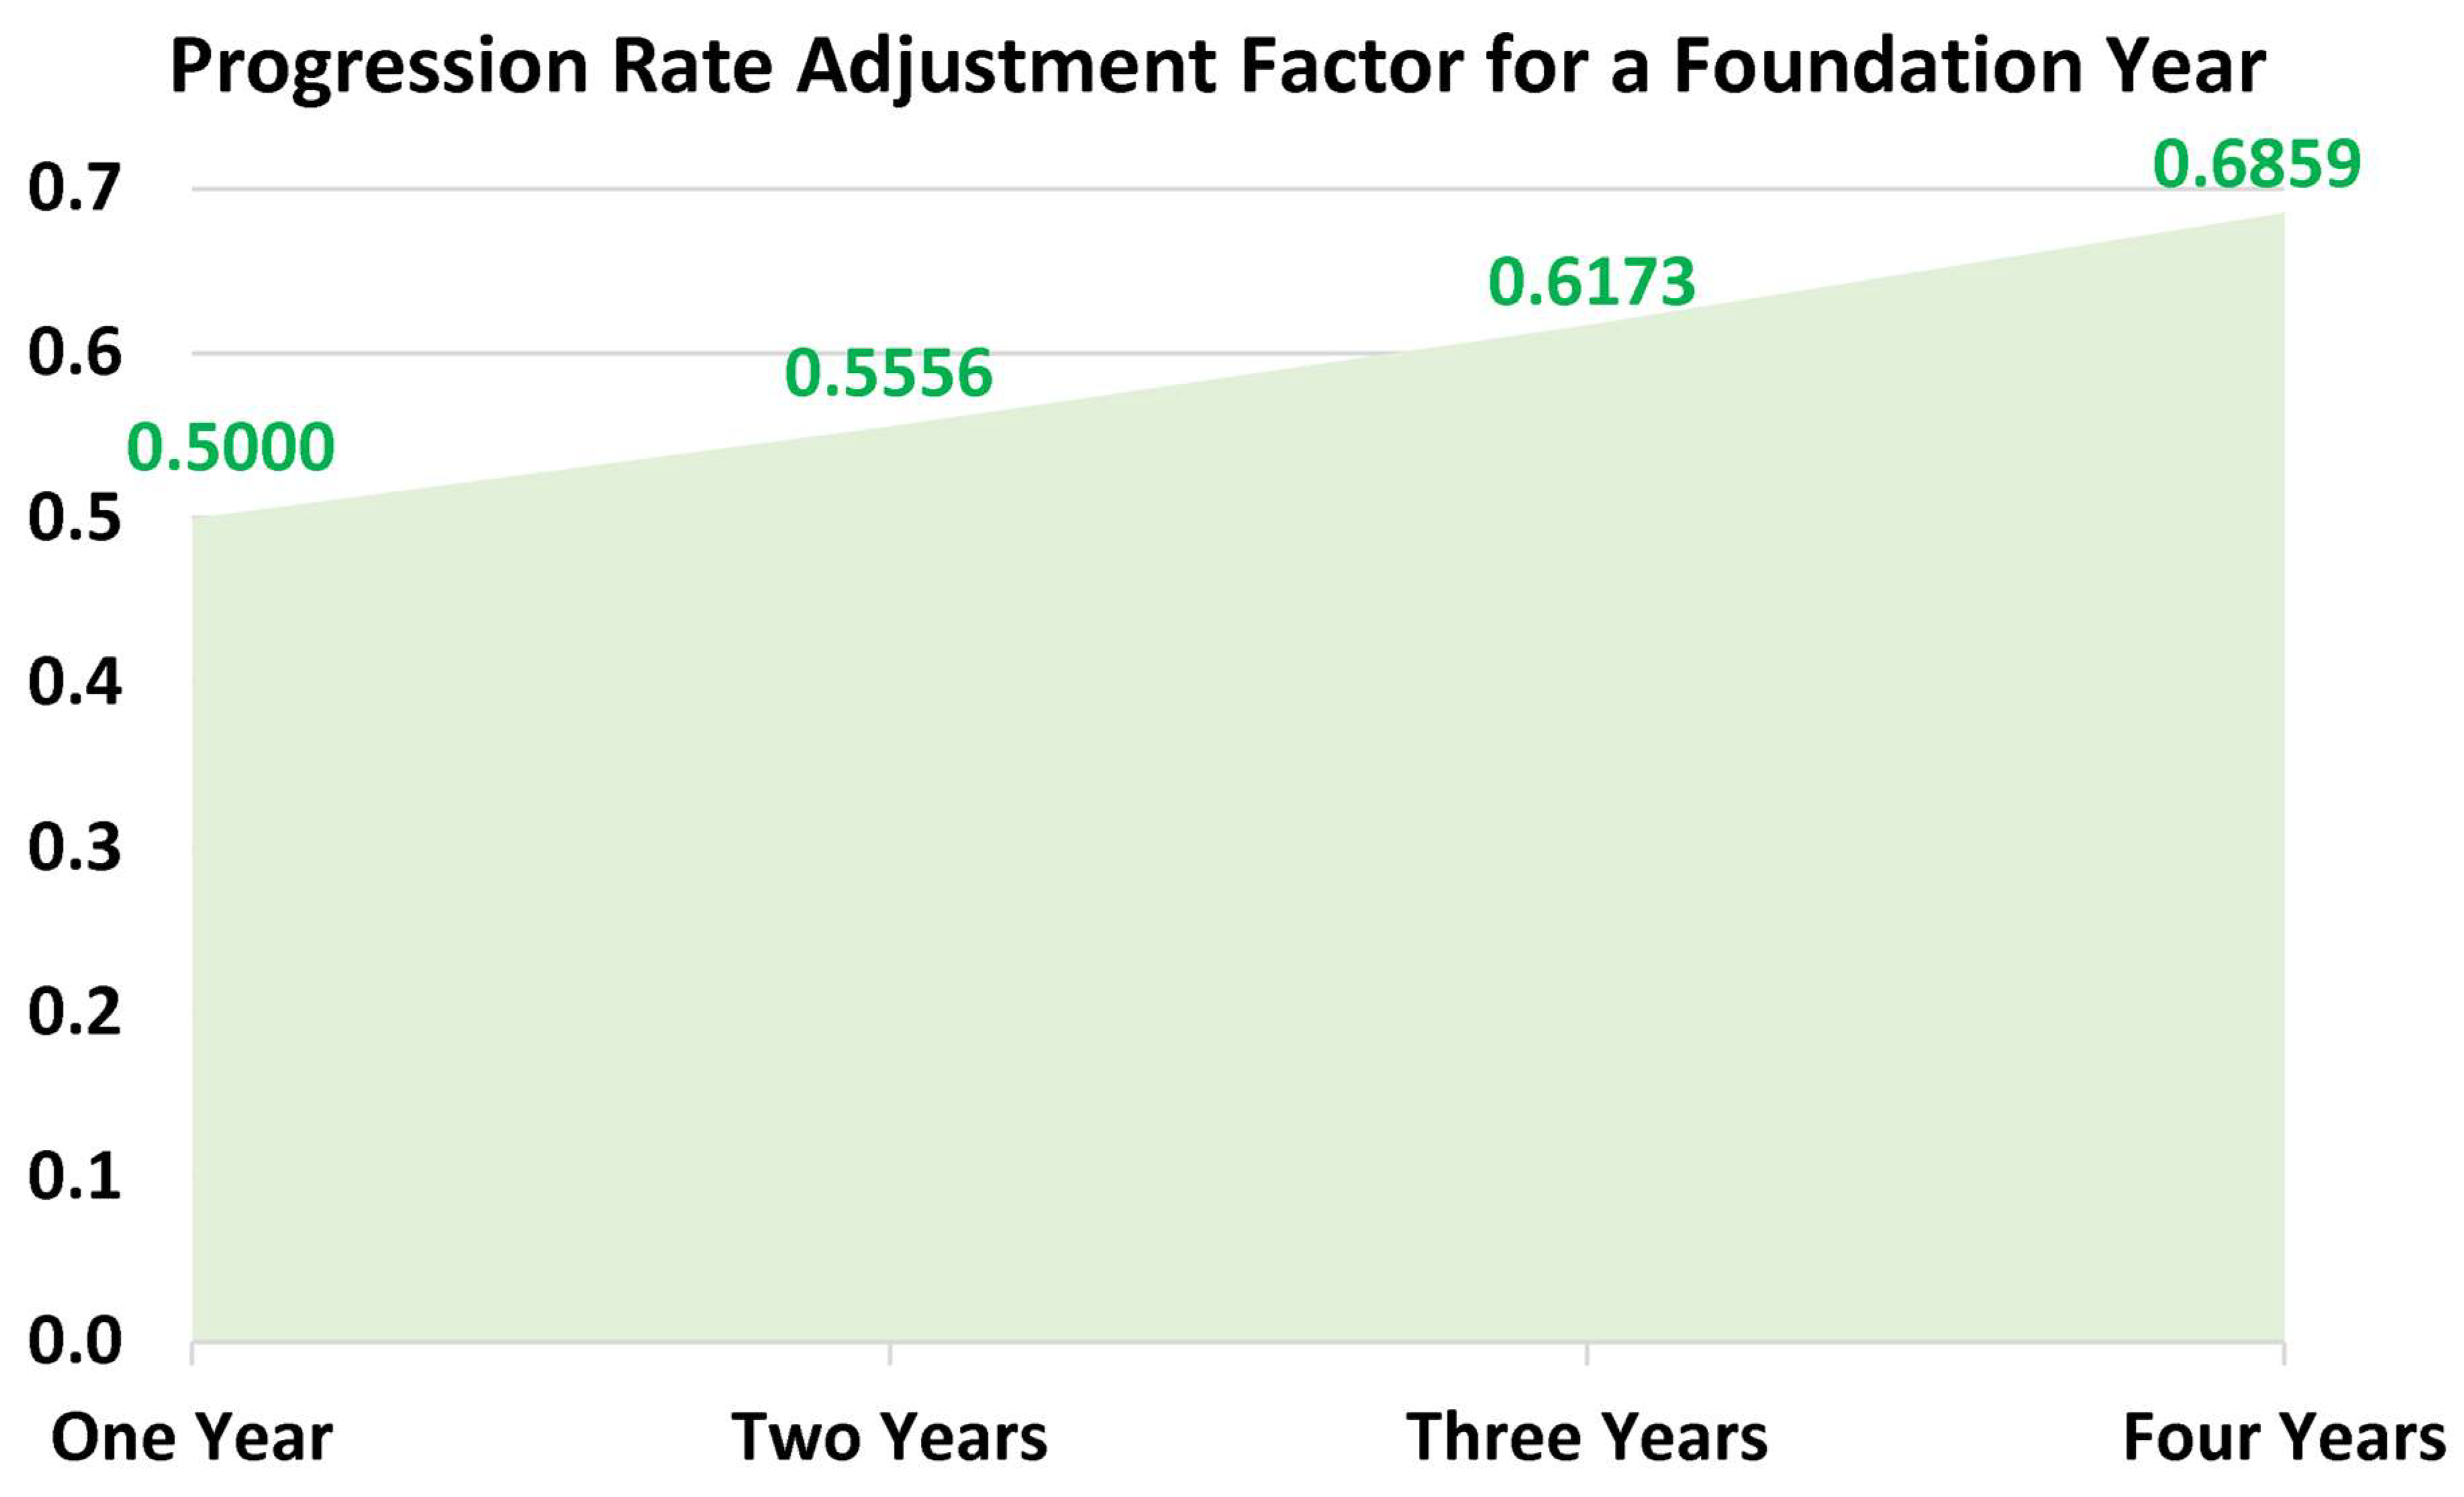
Figure 3.
Architecture retention rates.
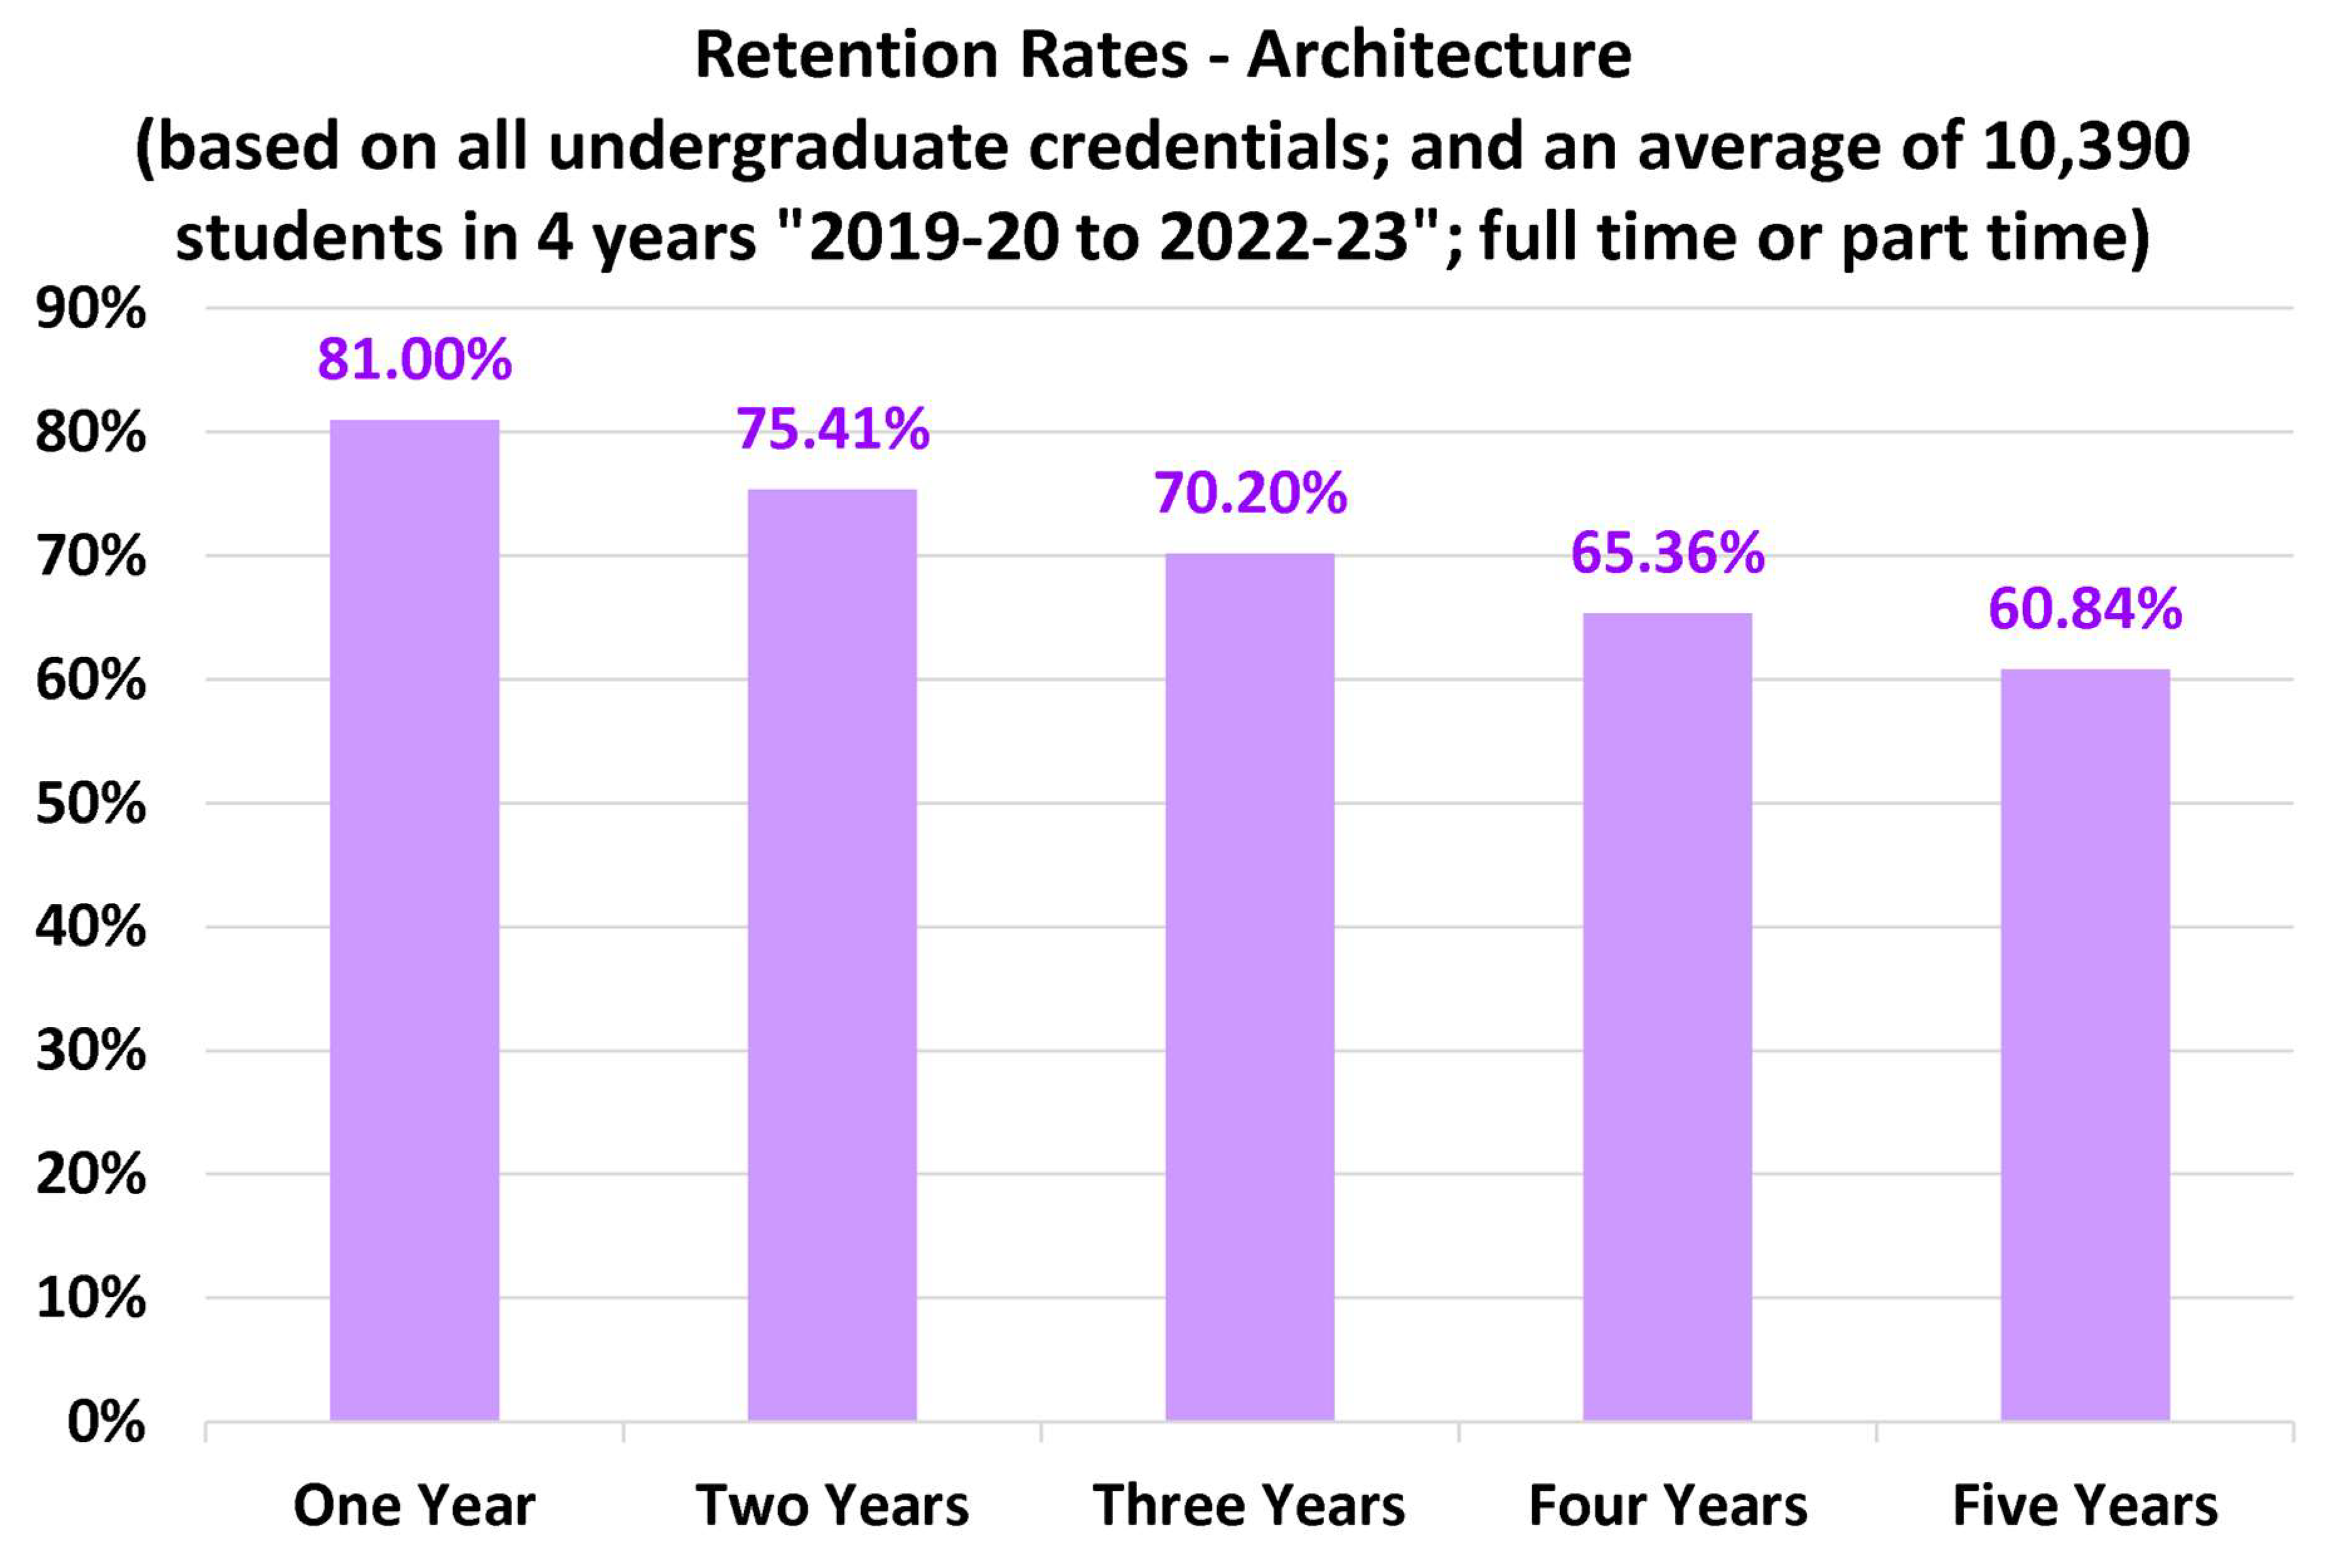
Figure 4.
Business/Management retention rates.
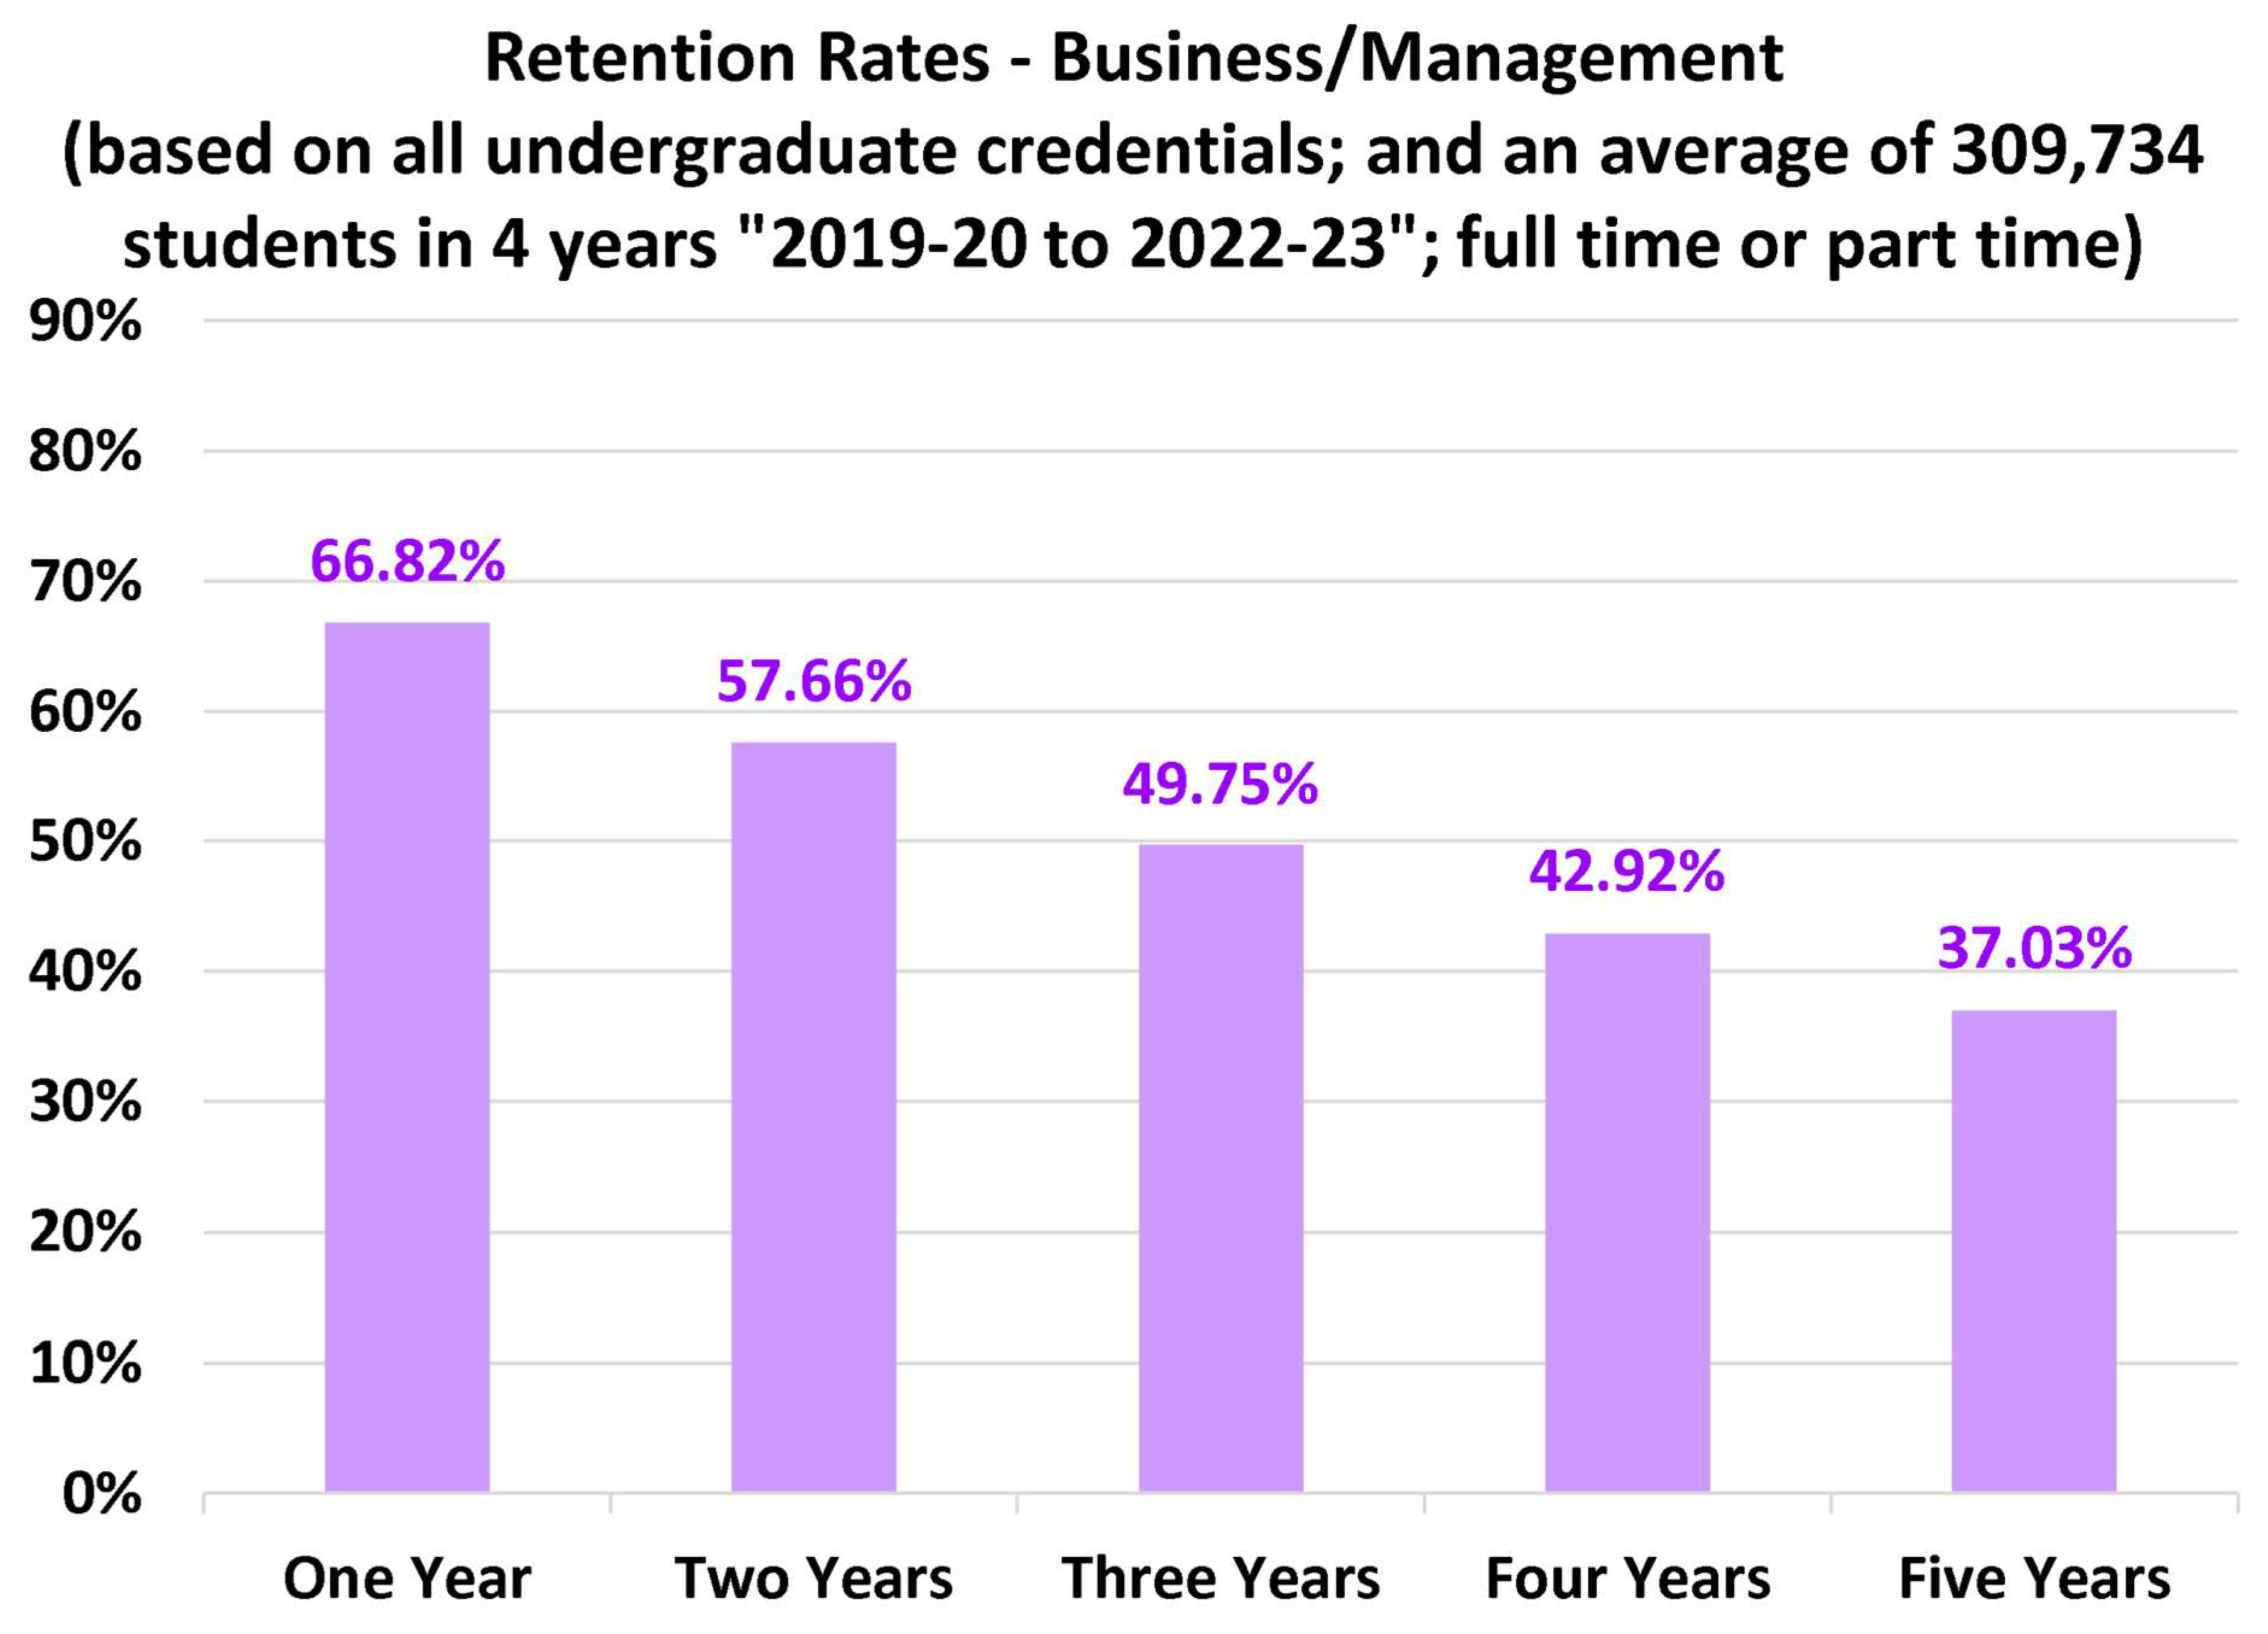
Figure 5.
Suggested “Computer/Information Science” benchmarking retention rates at five durations (from one year to five years after admission).
Figure 5.
Suggested “Computer/Information Science” benchmarking retention rates at five durations (from one year to five years after admission).
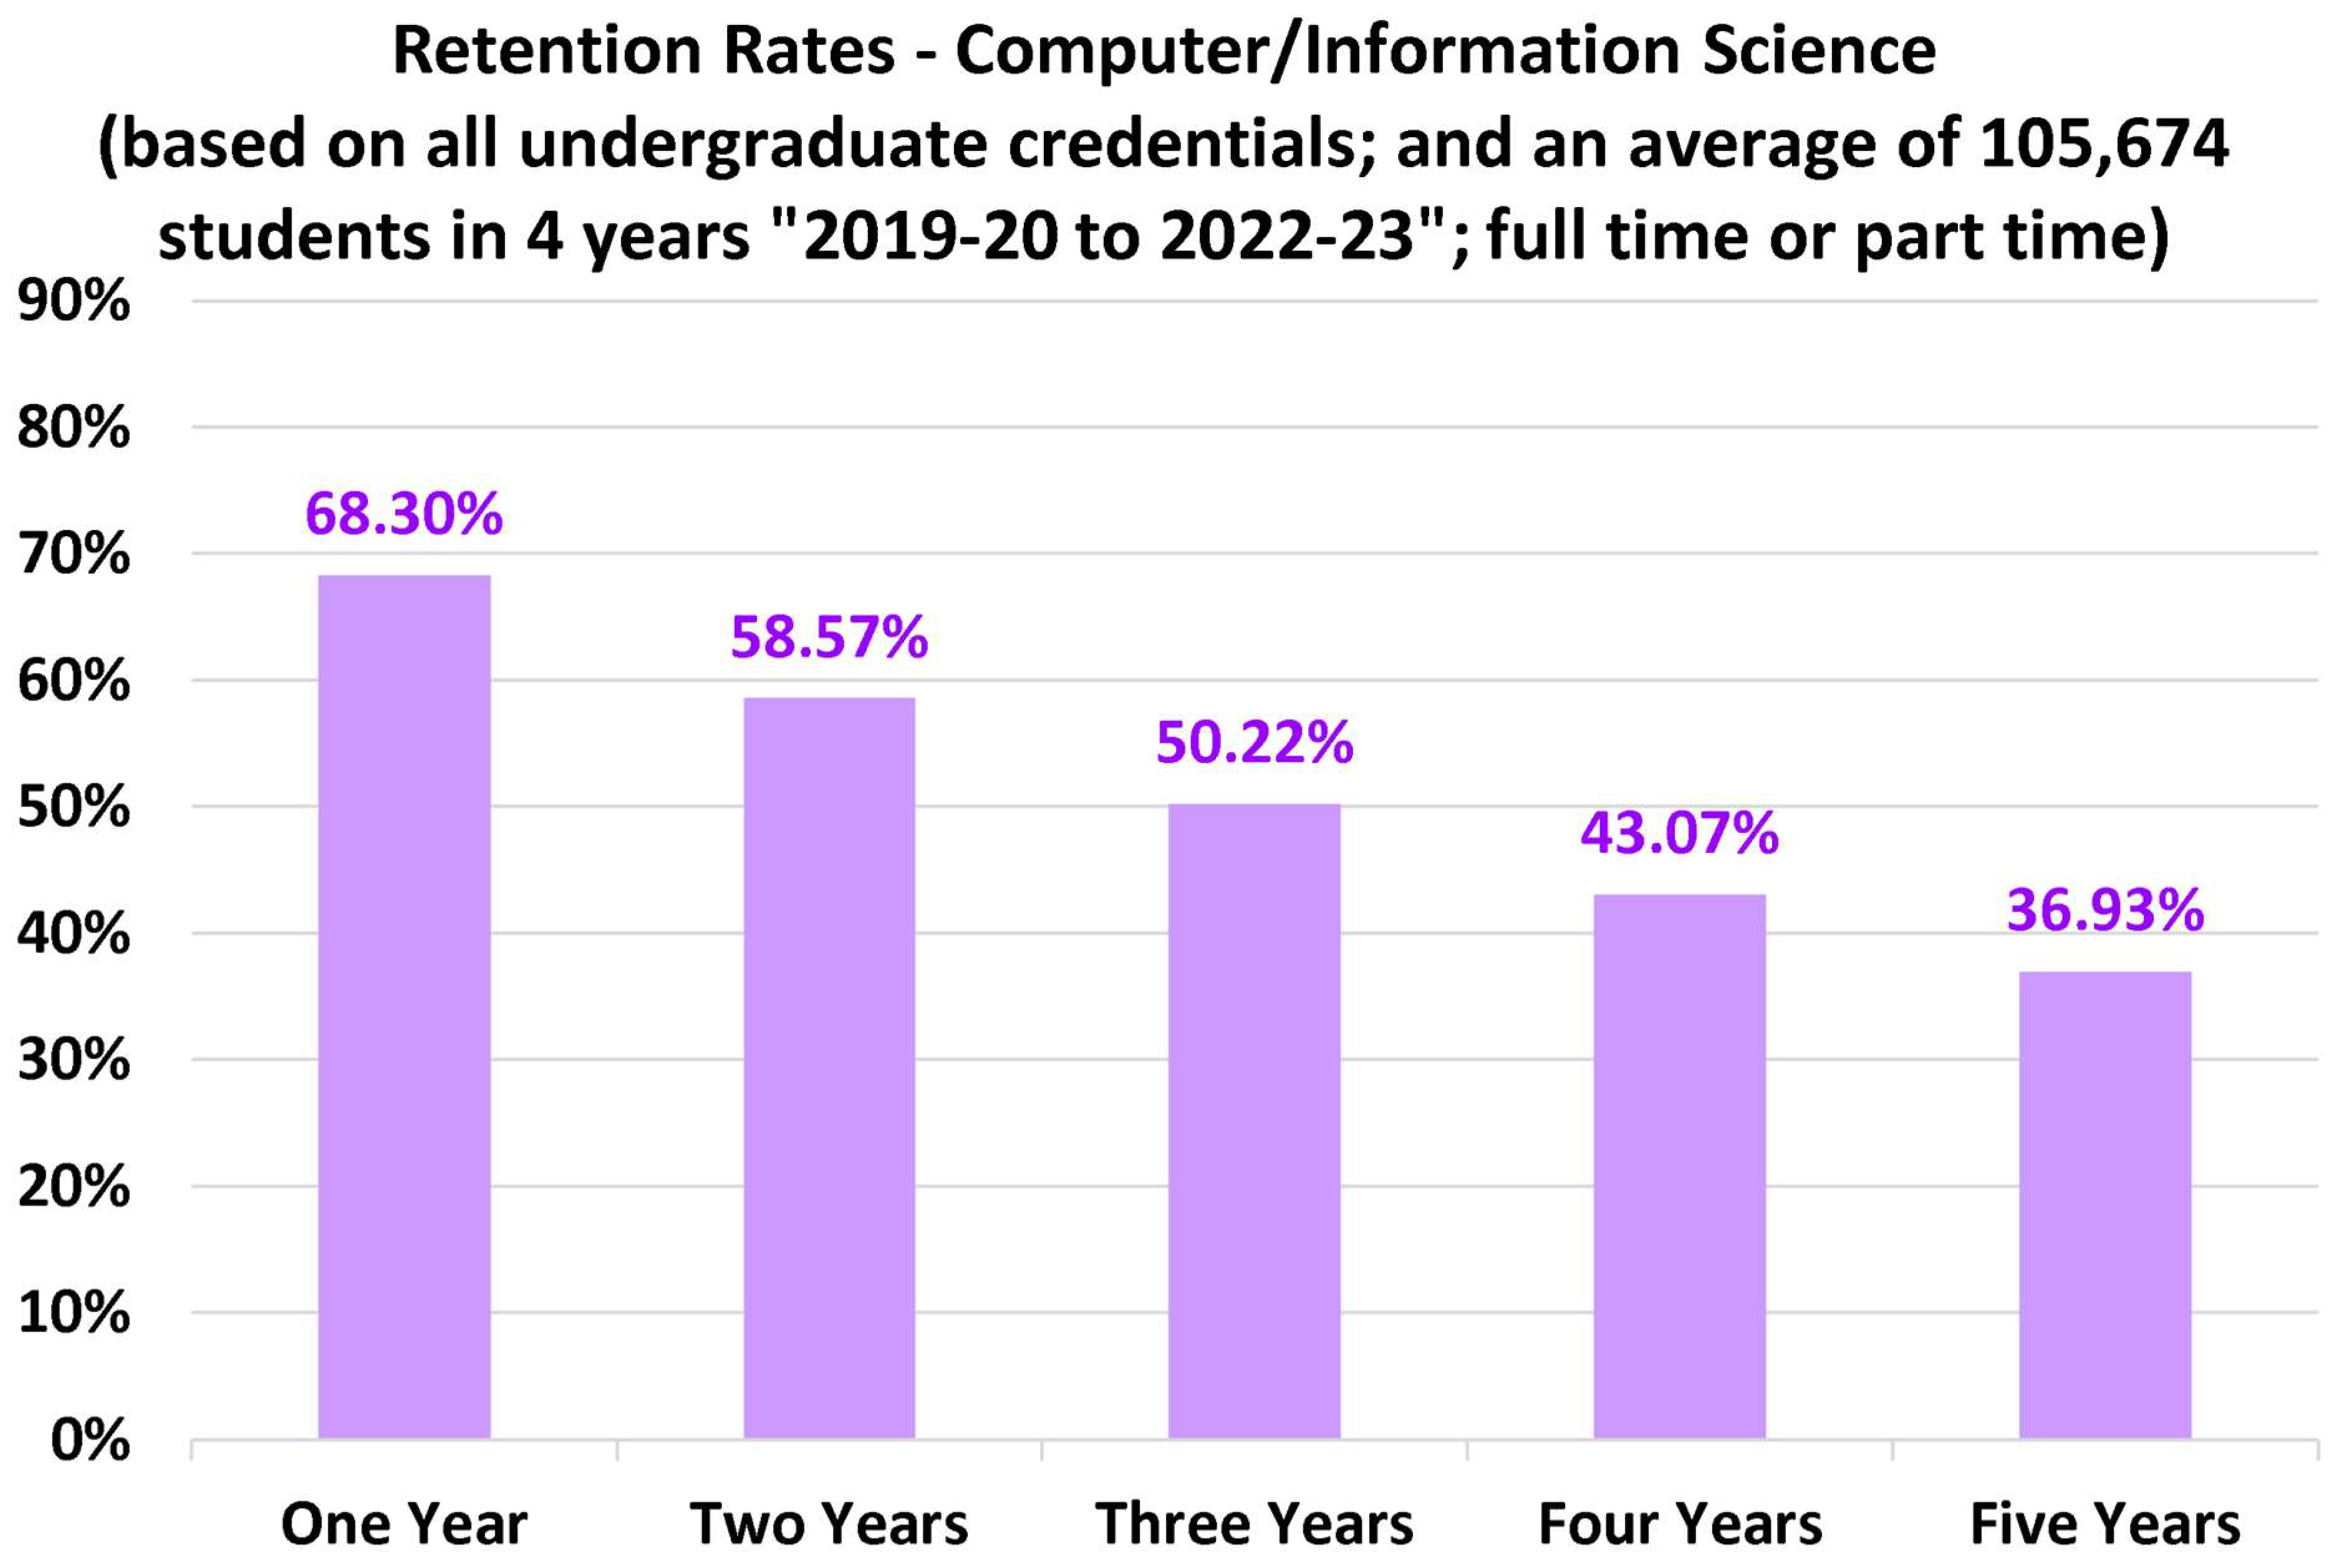
Figure 6.
Education retention rates.
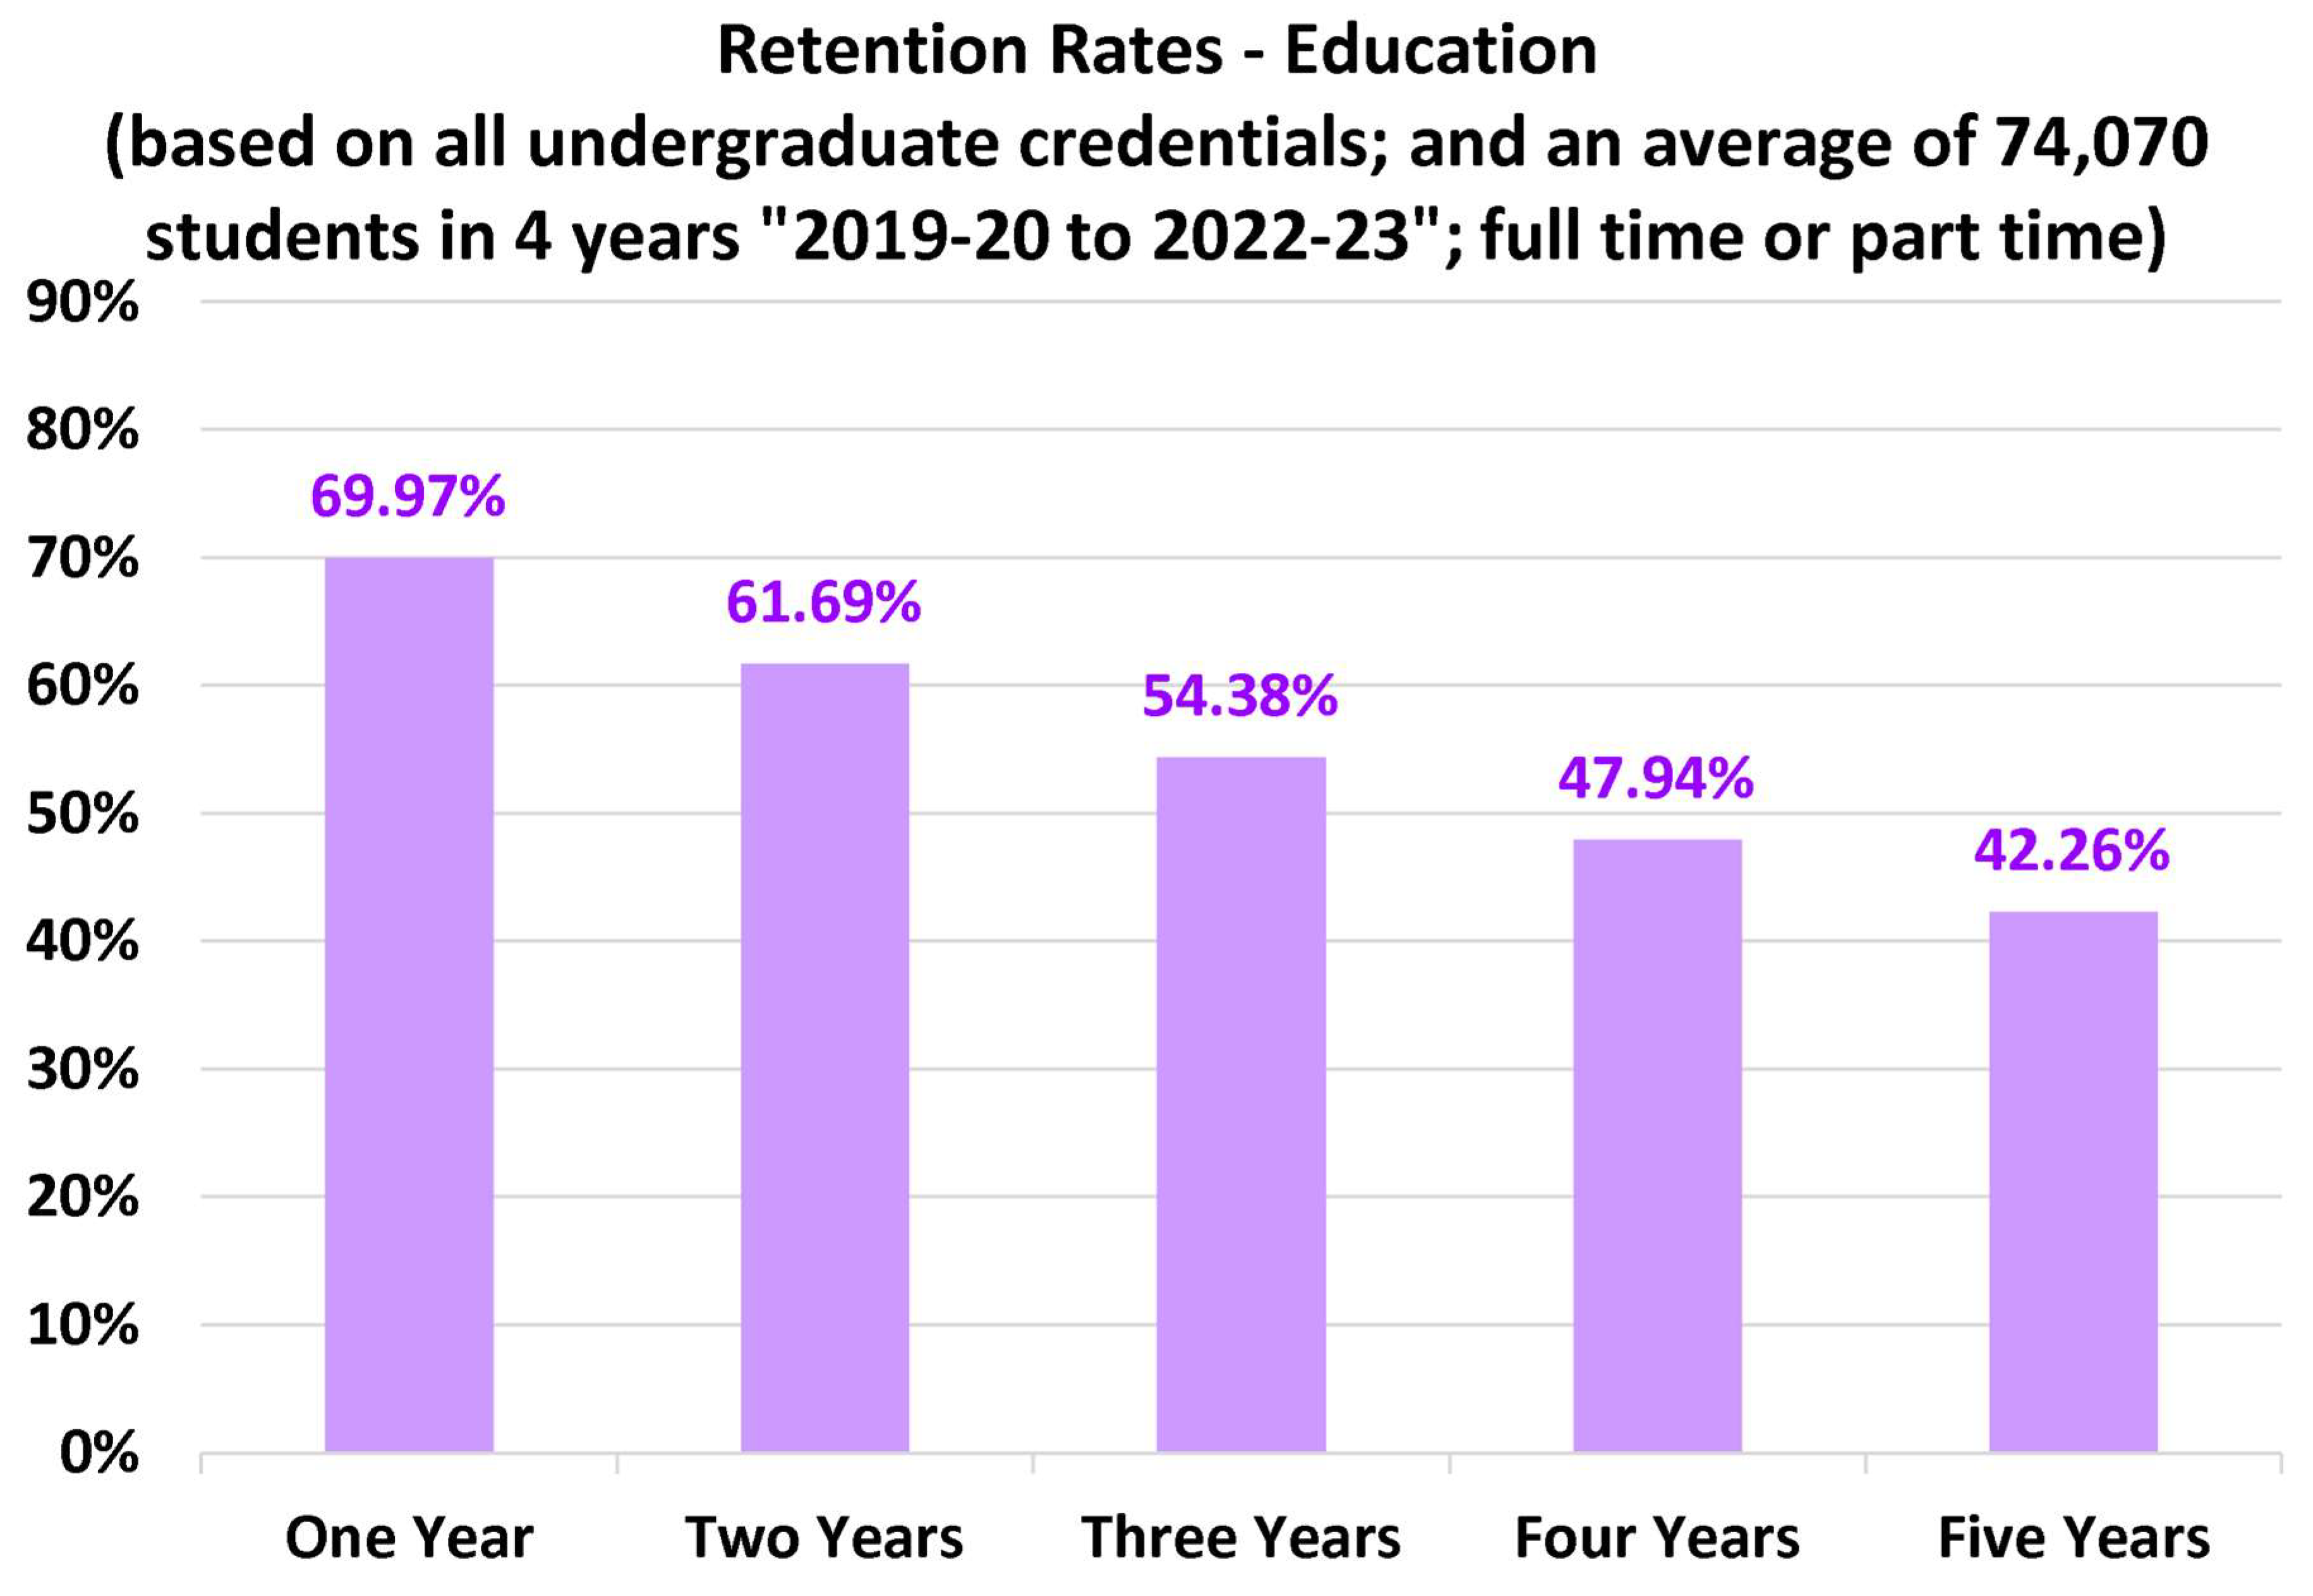
Figure 7.
Engineering retention rates.
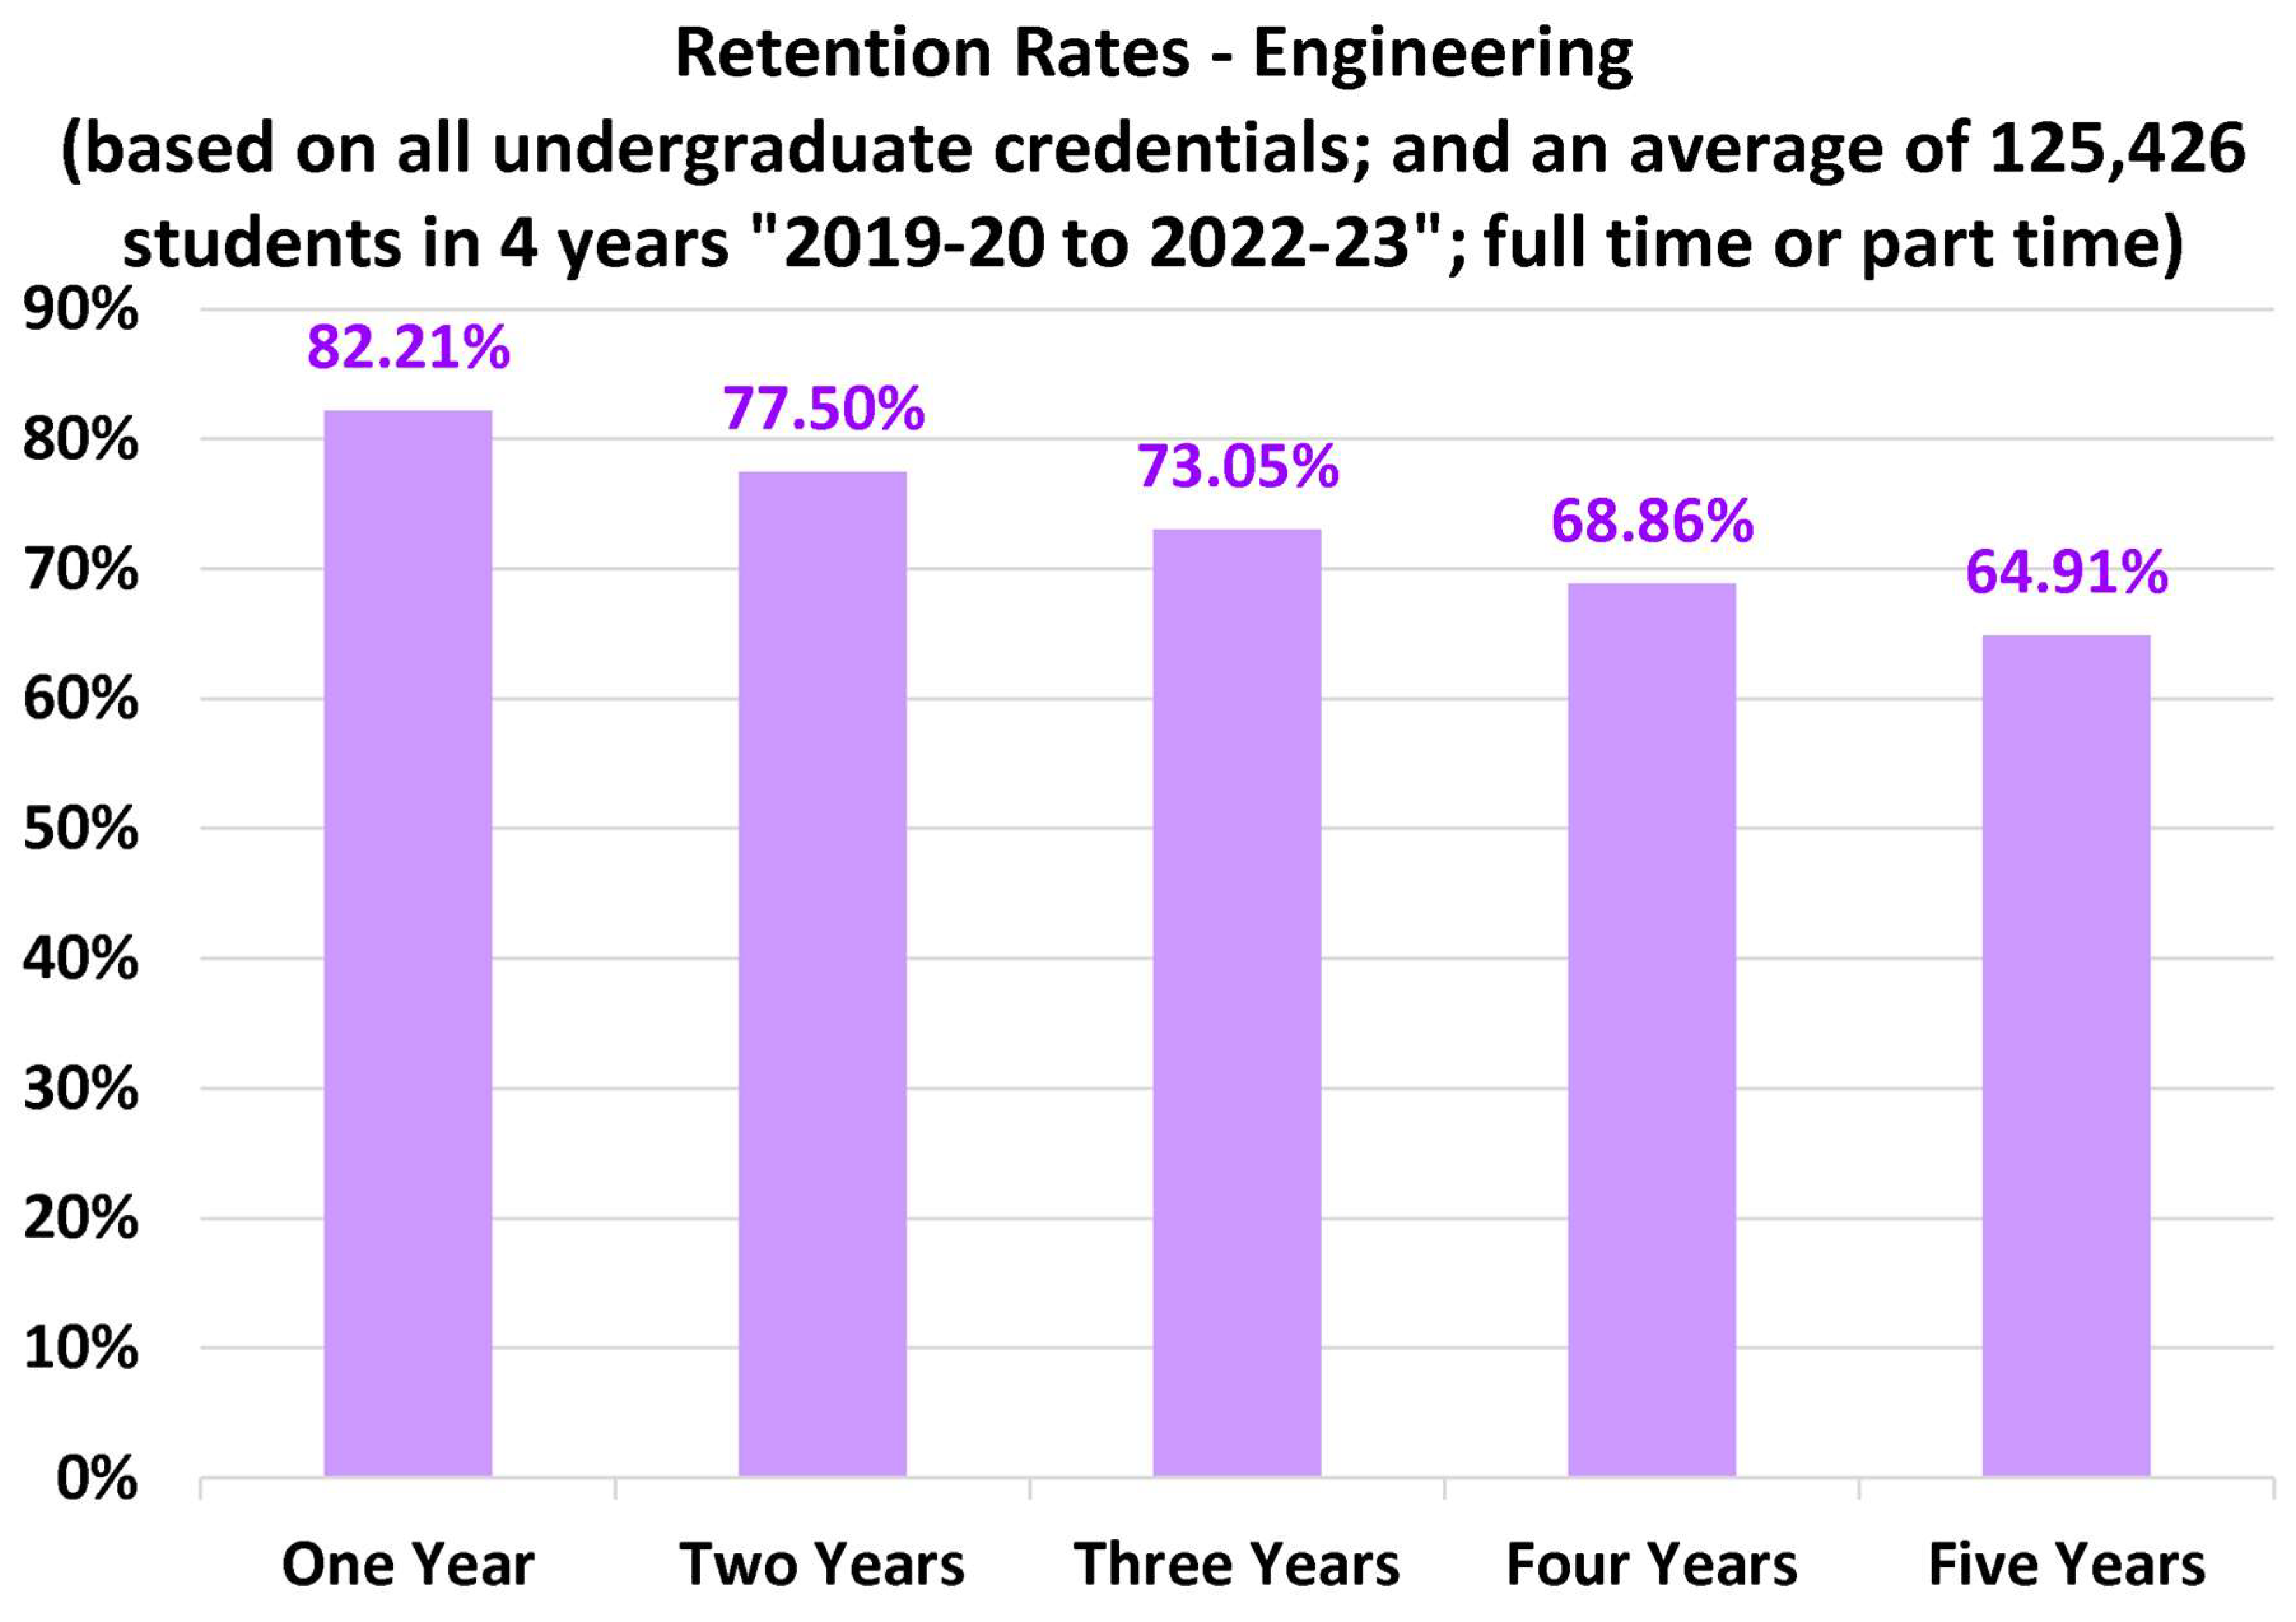
Figure 8.
Engineering Technology retention rates.
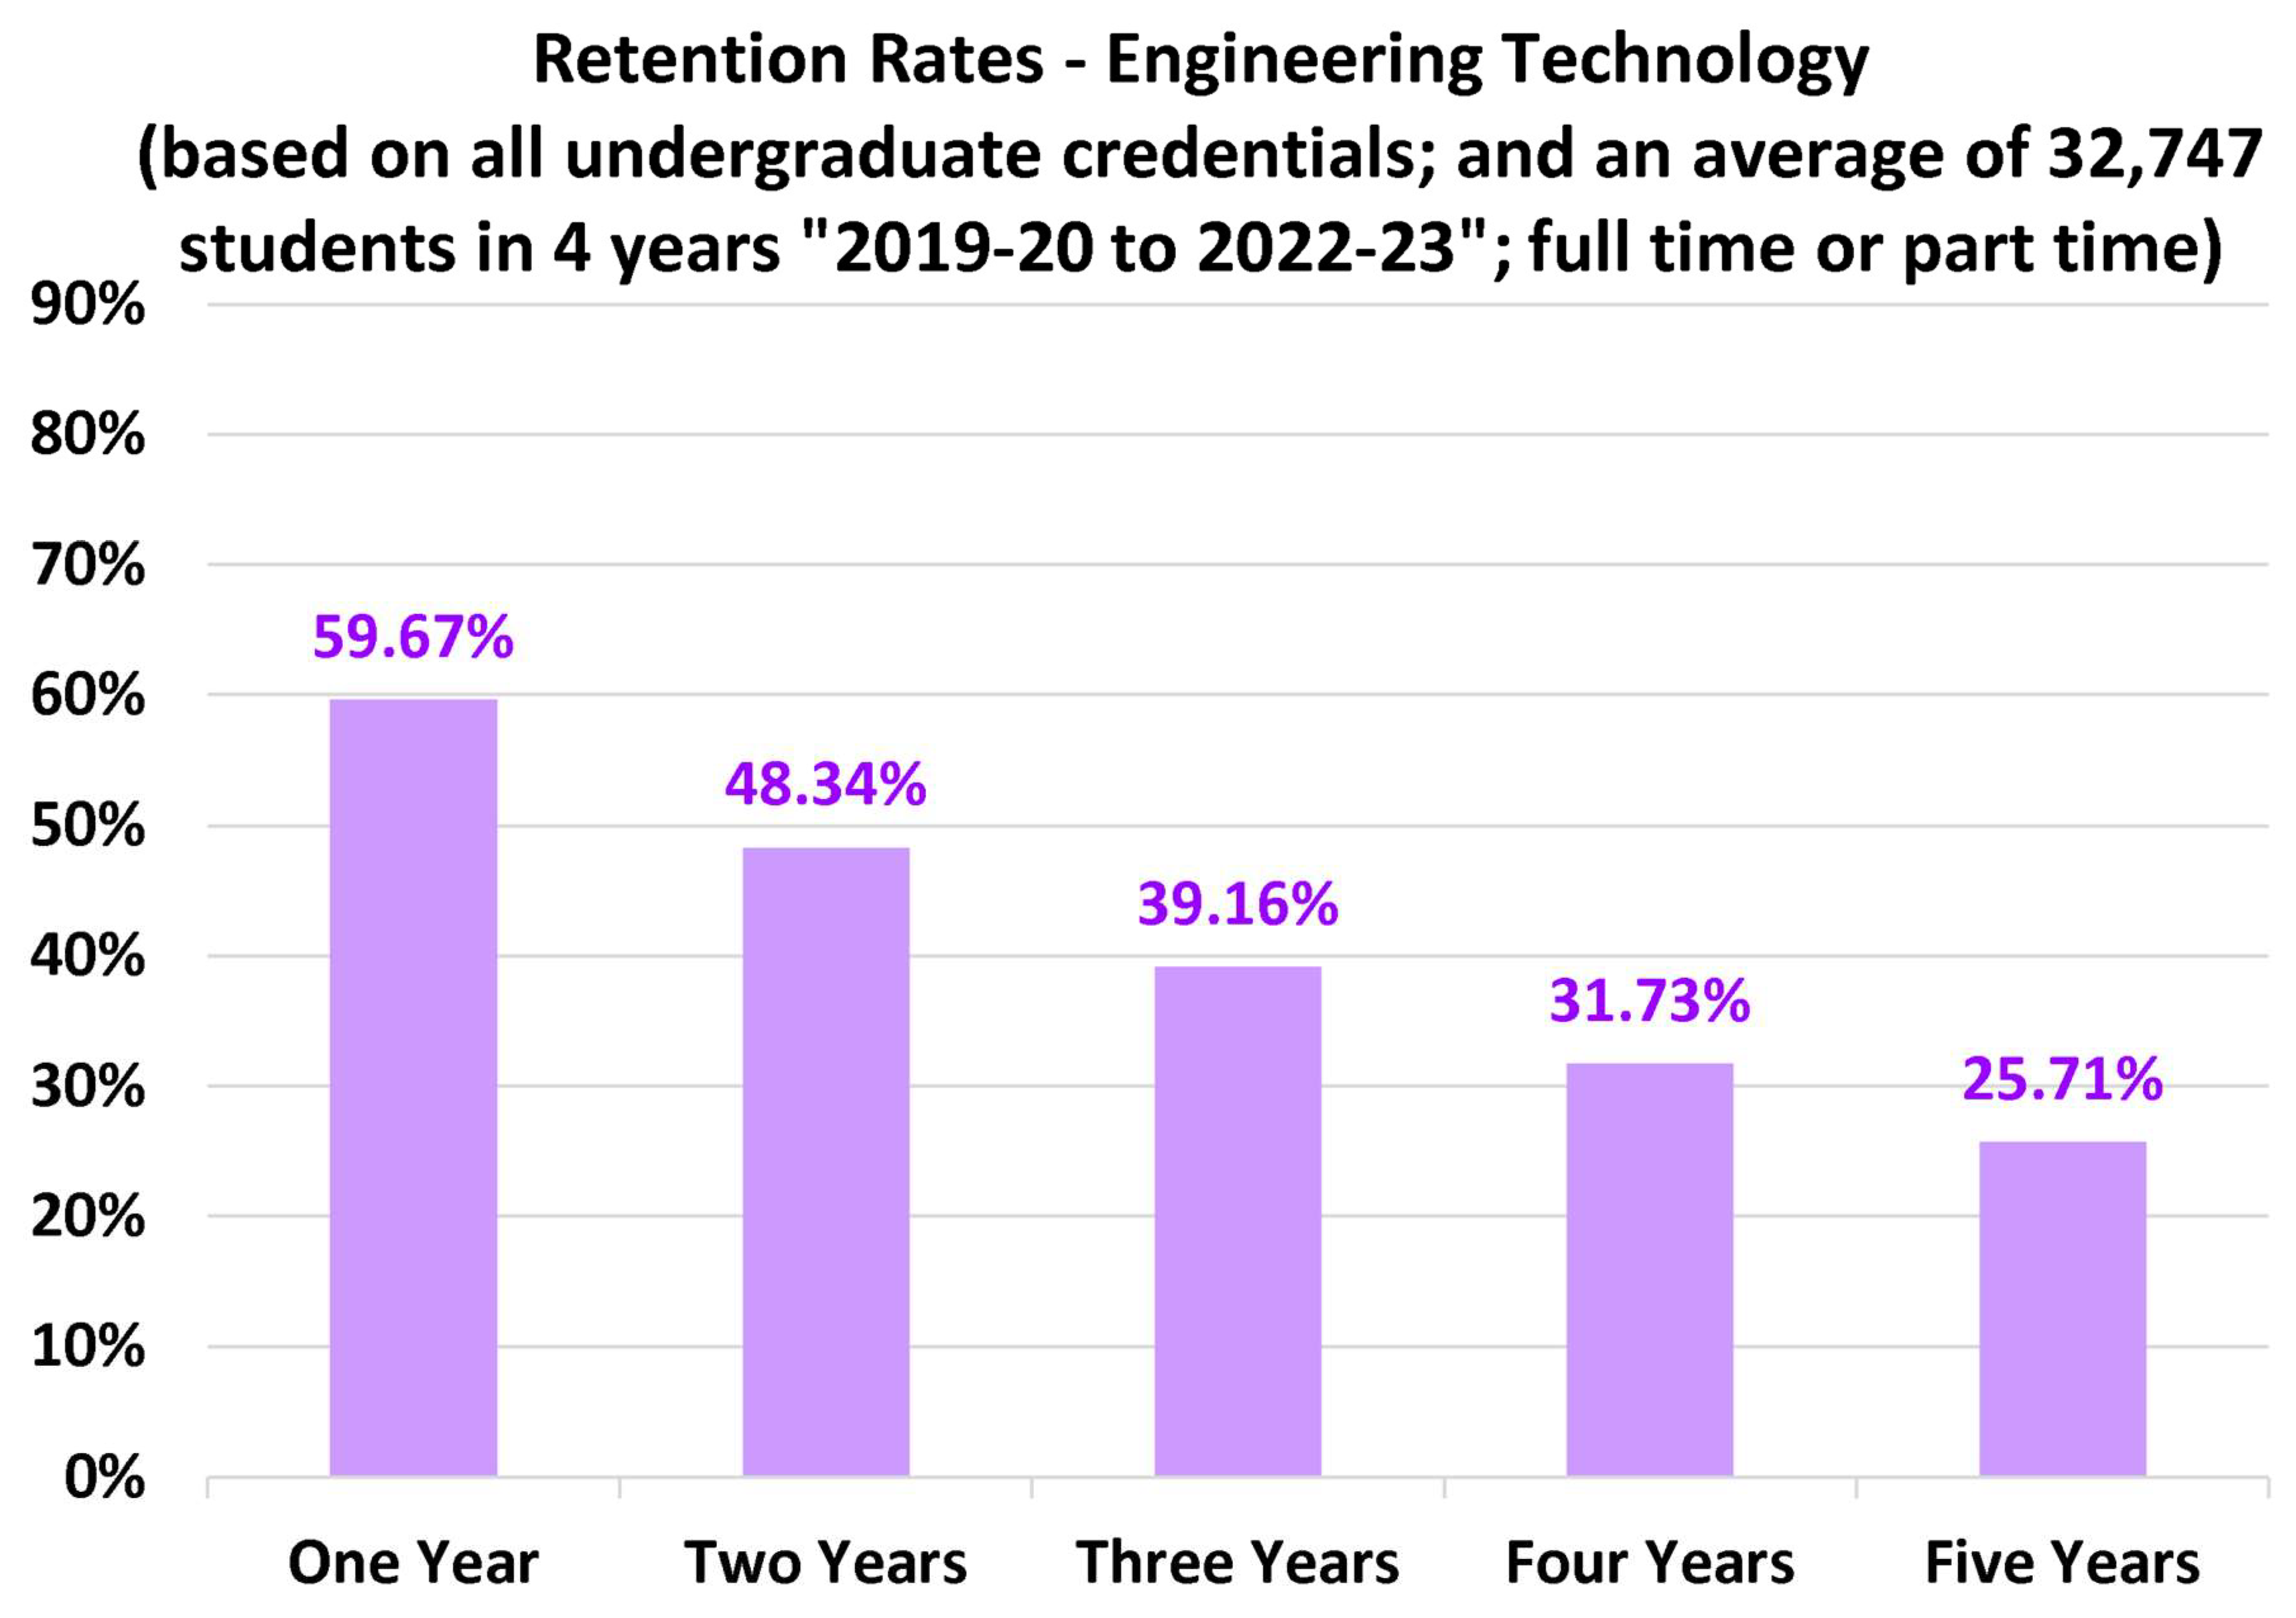
Figure 9.
Health/Clinical retention rates.
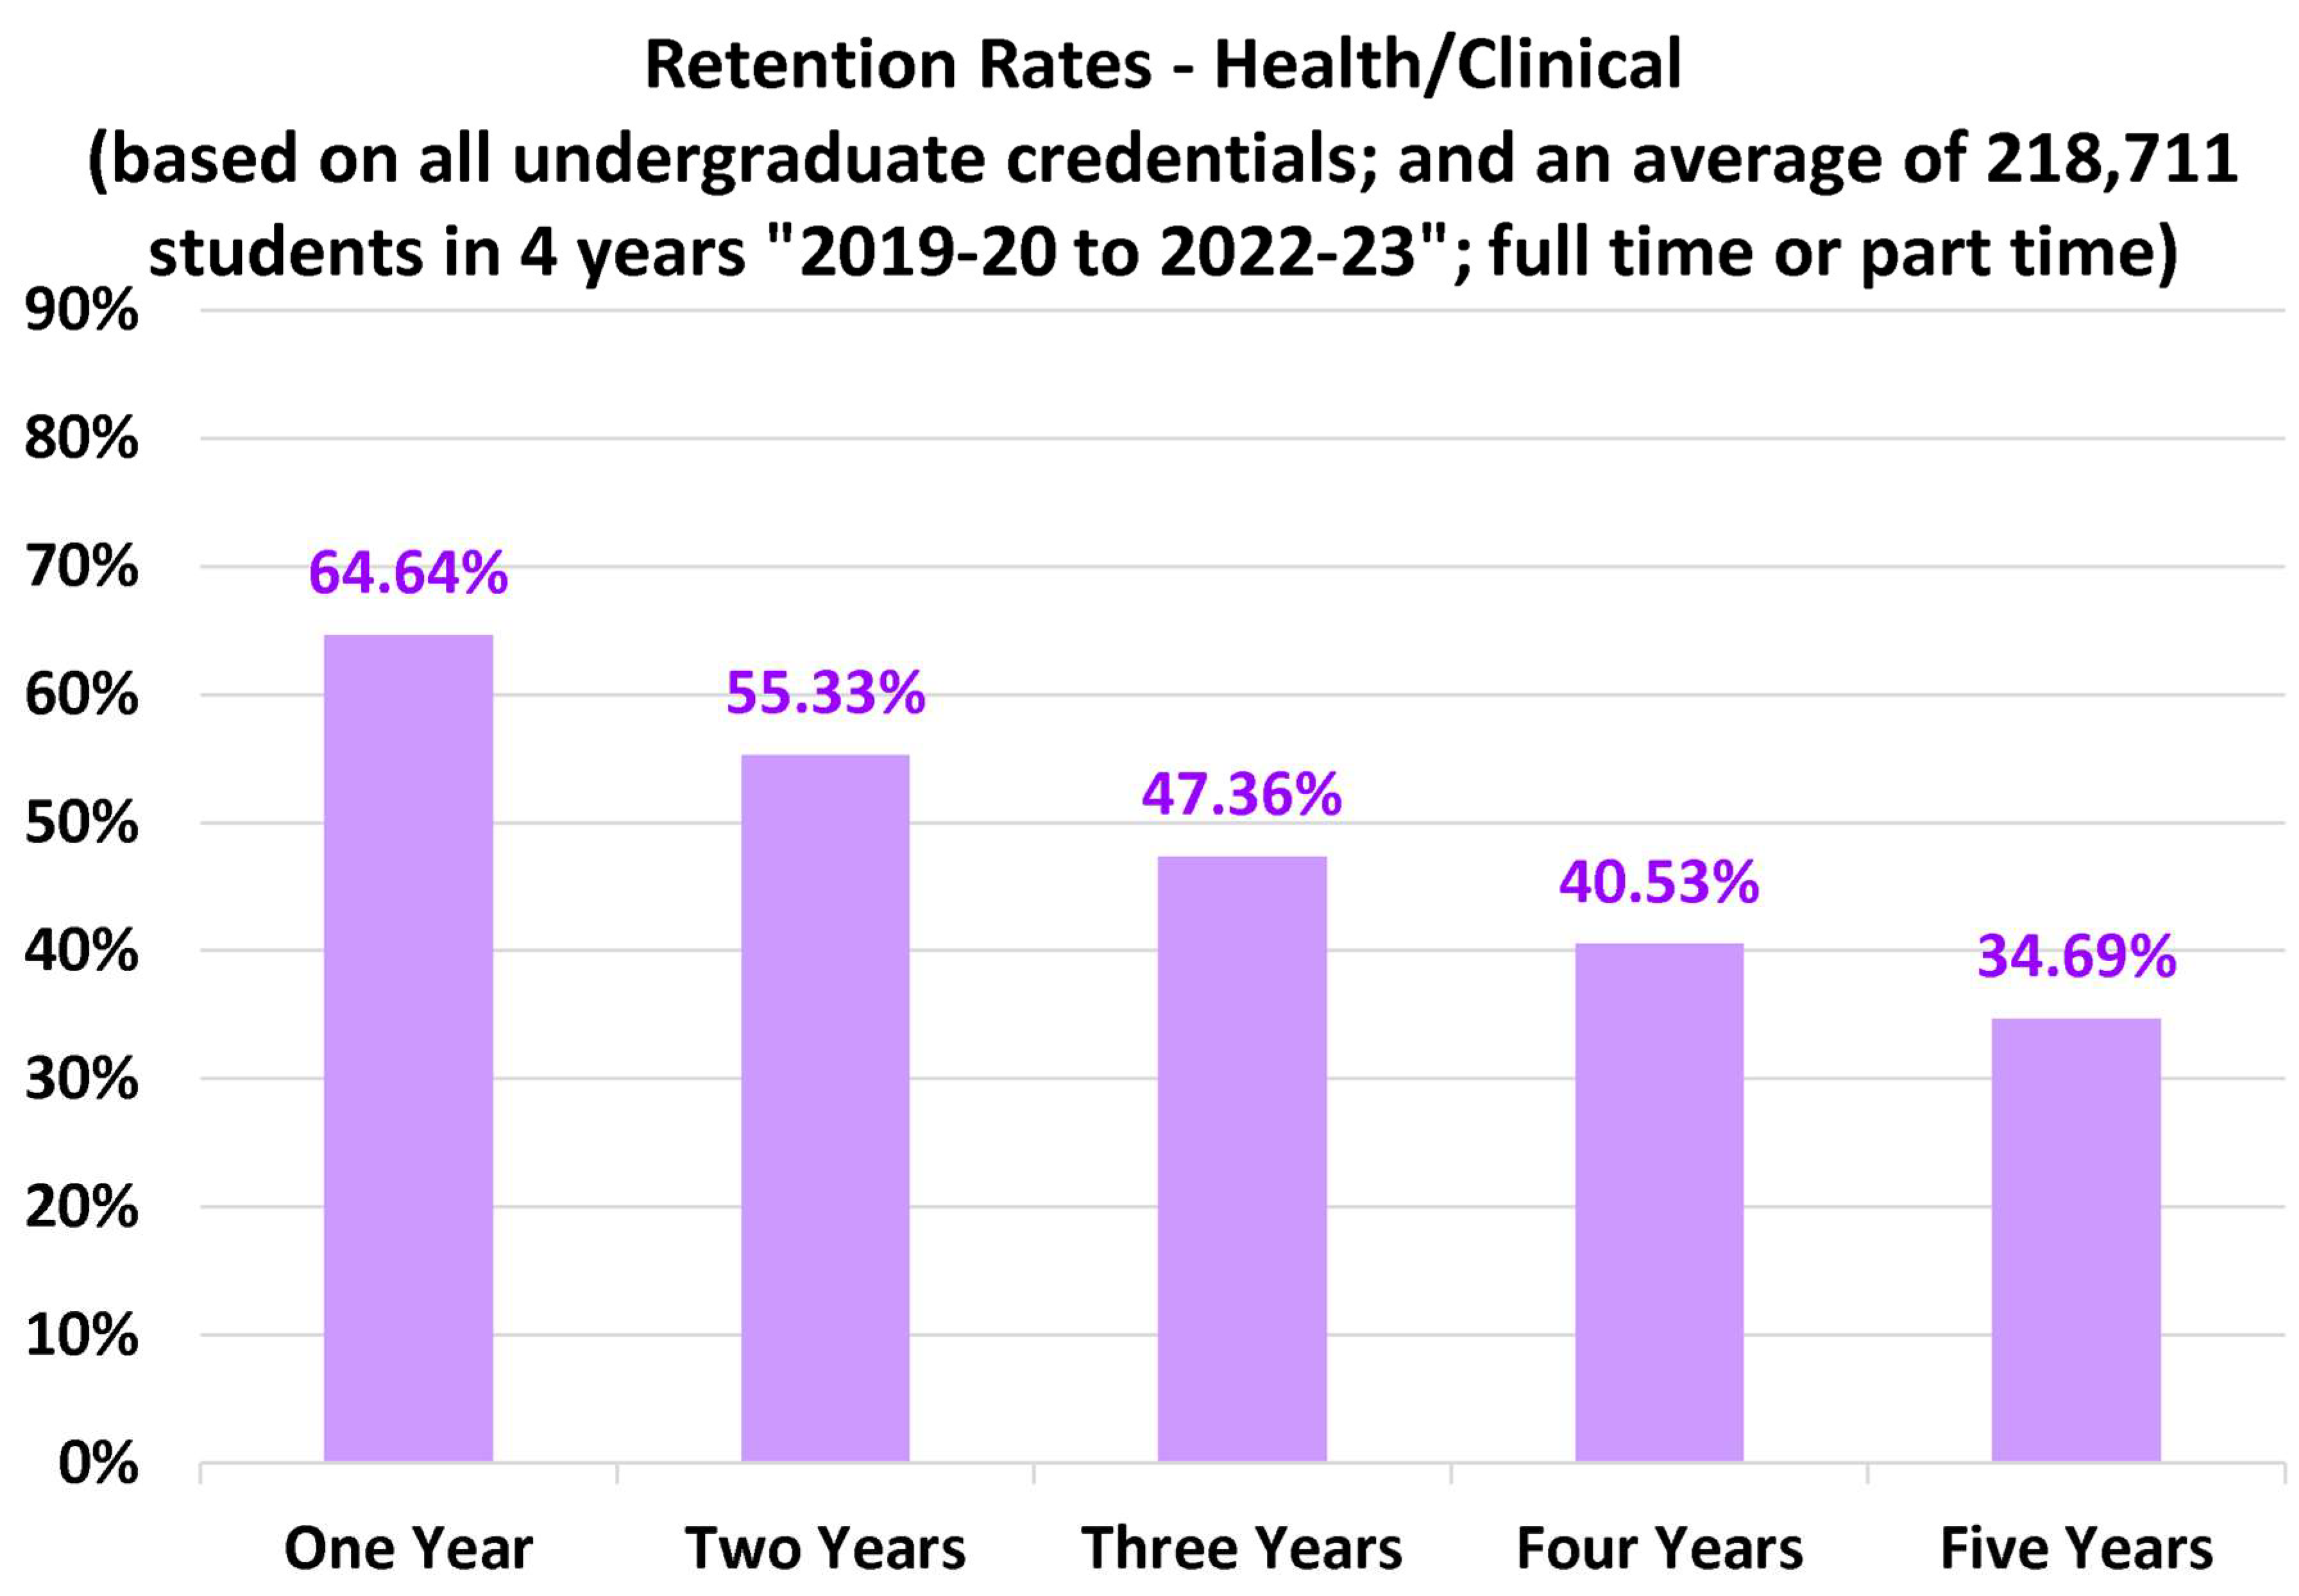
Figure 10.
Humanities retention rates.
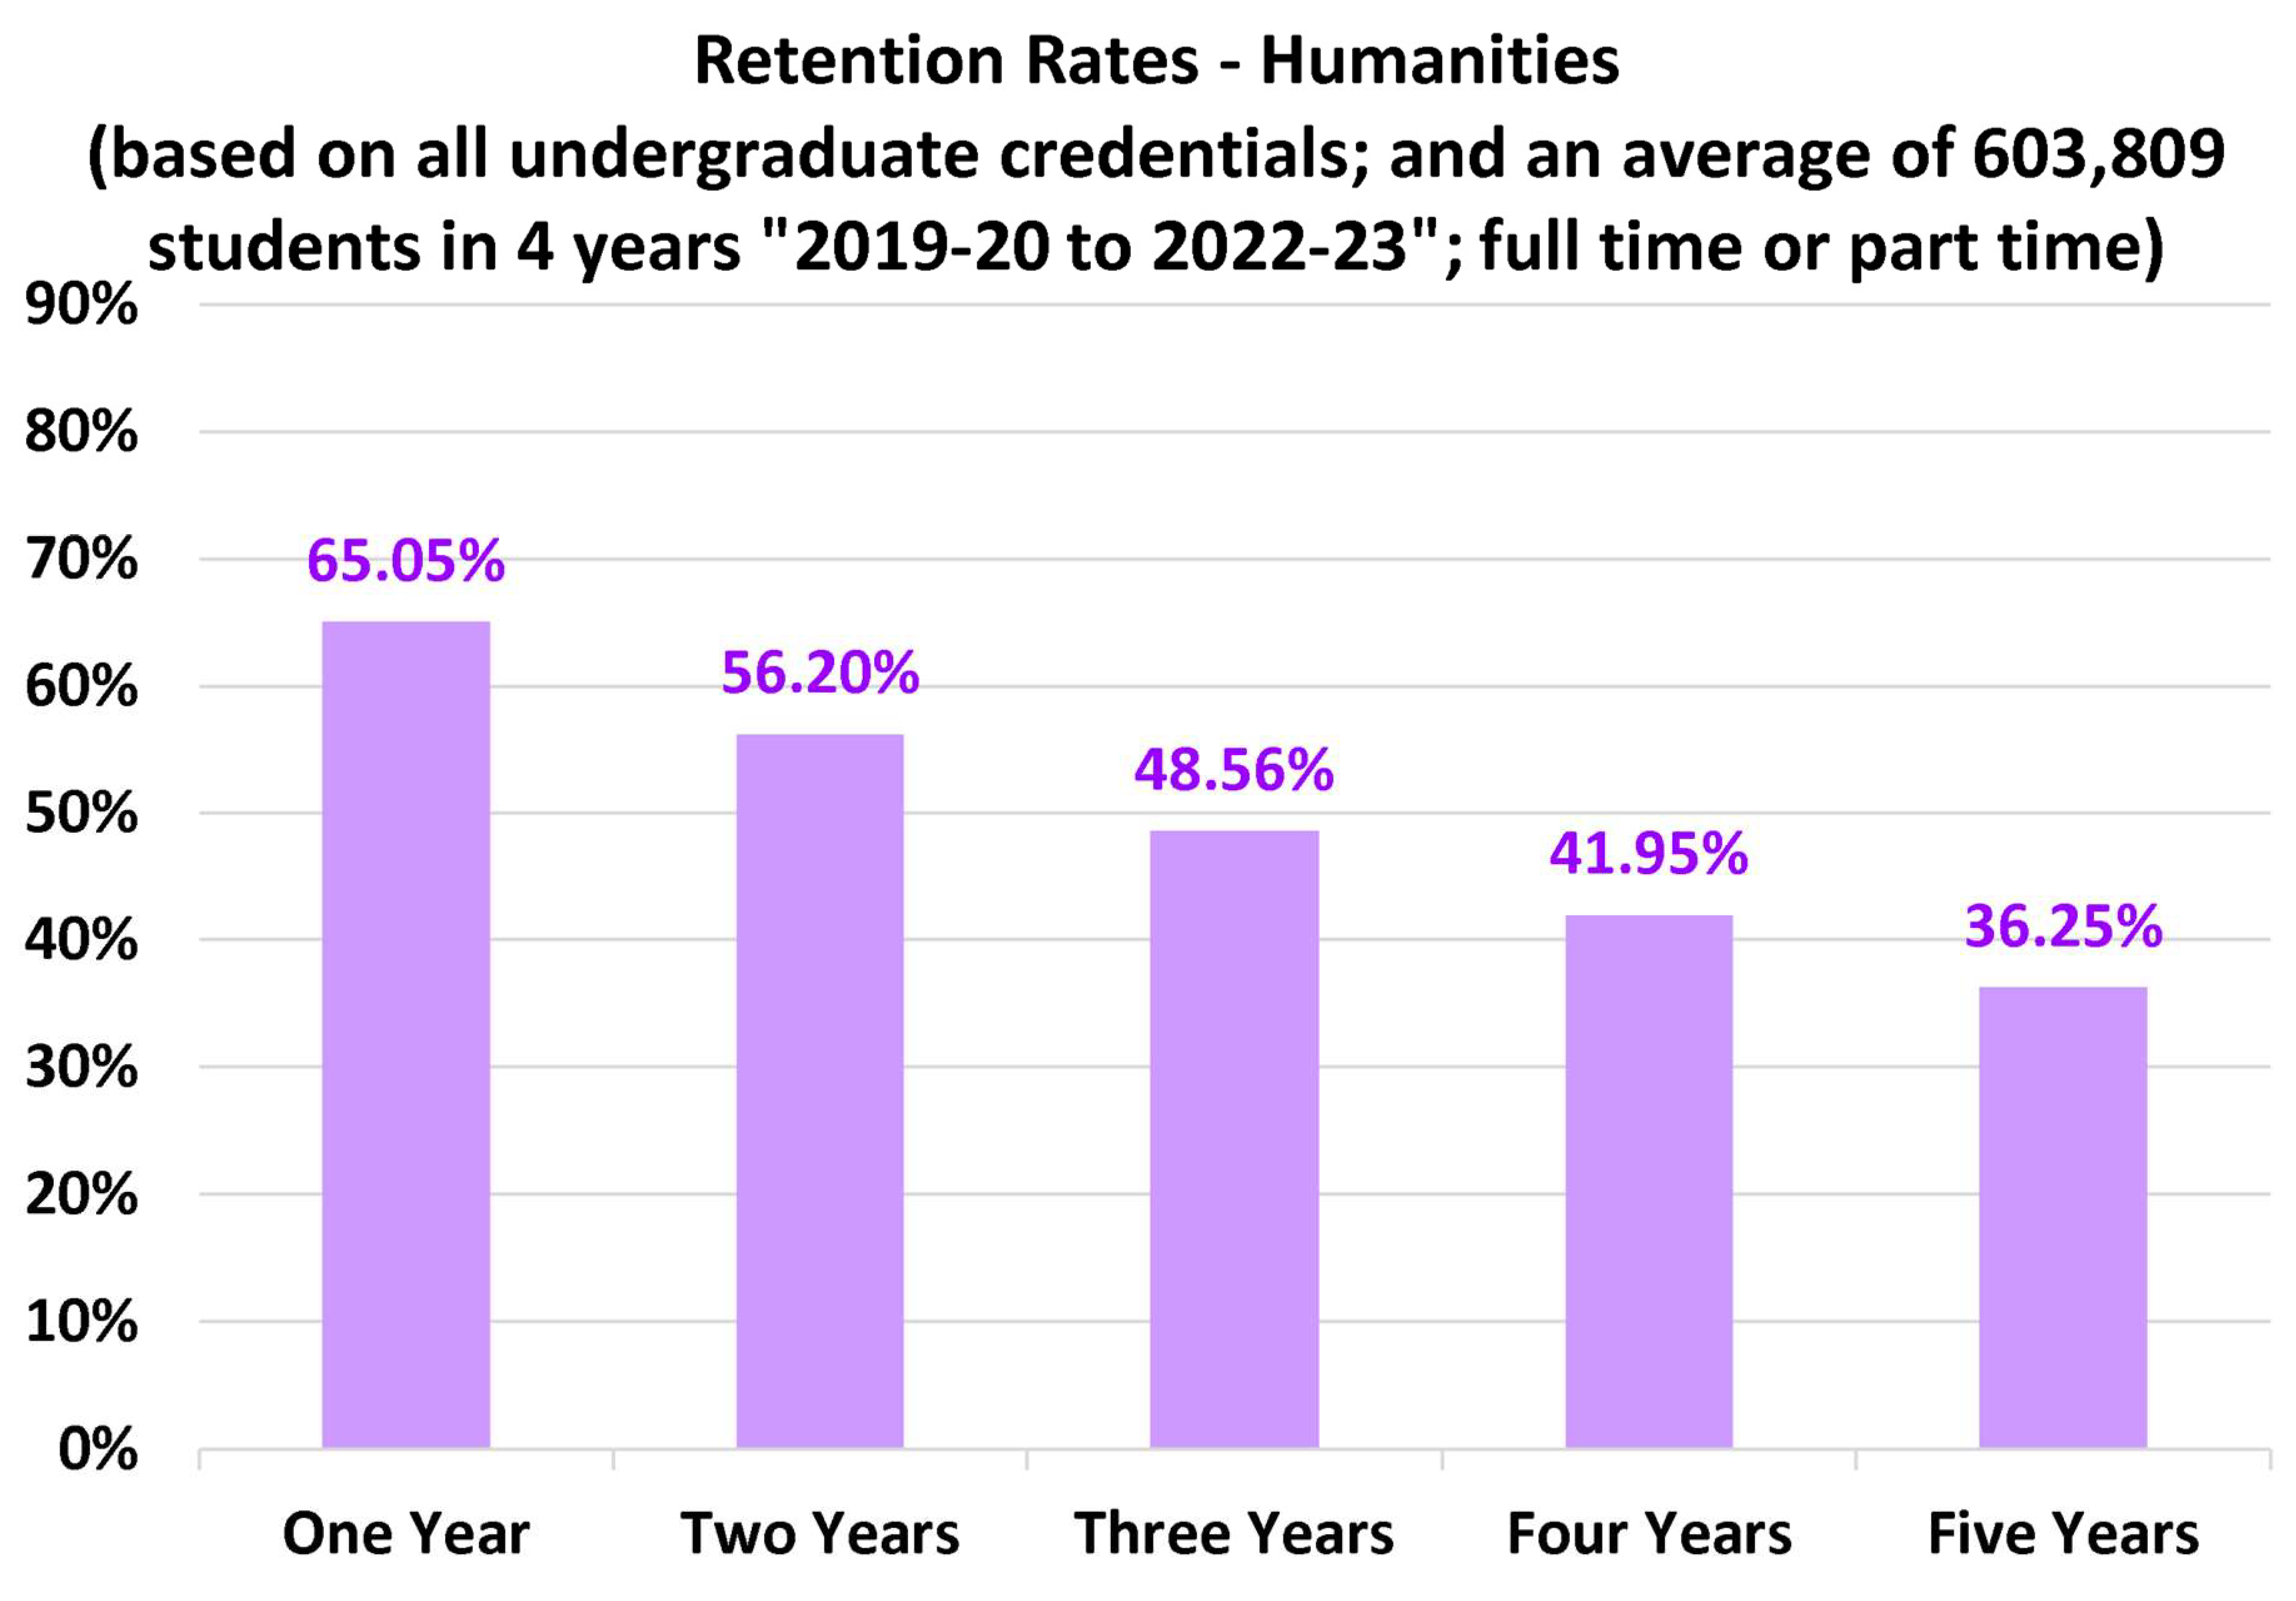
Figure 11.
Law retention rates.
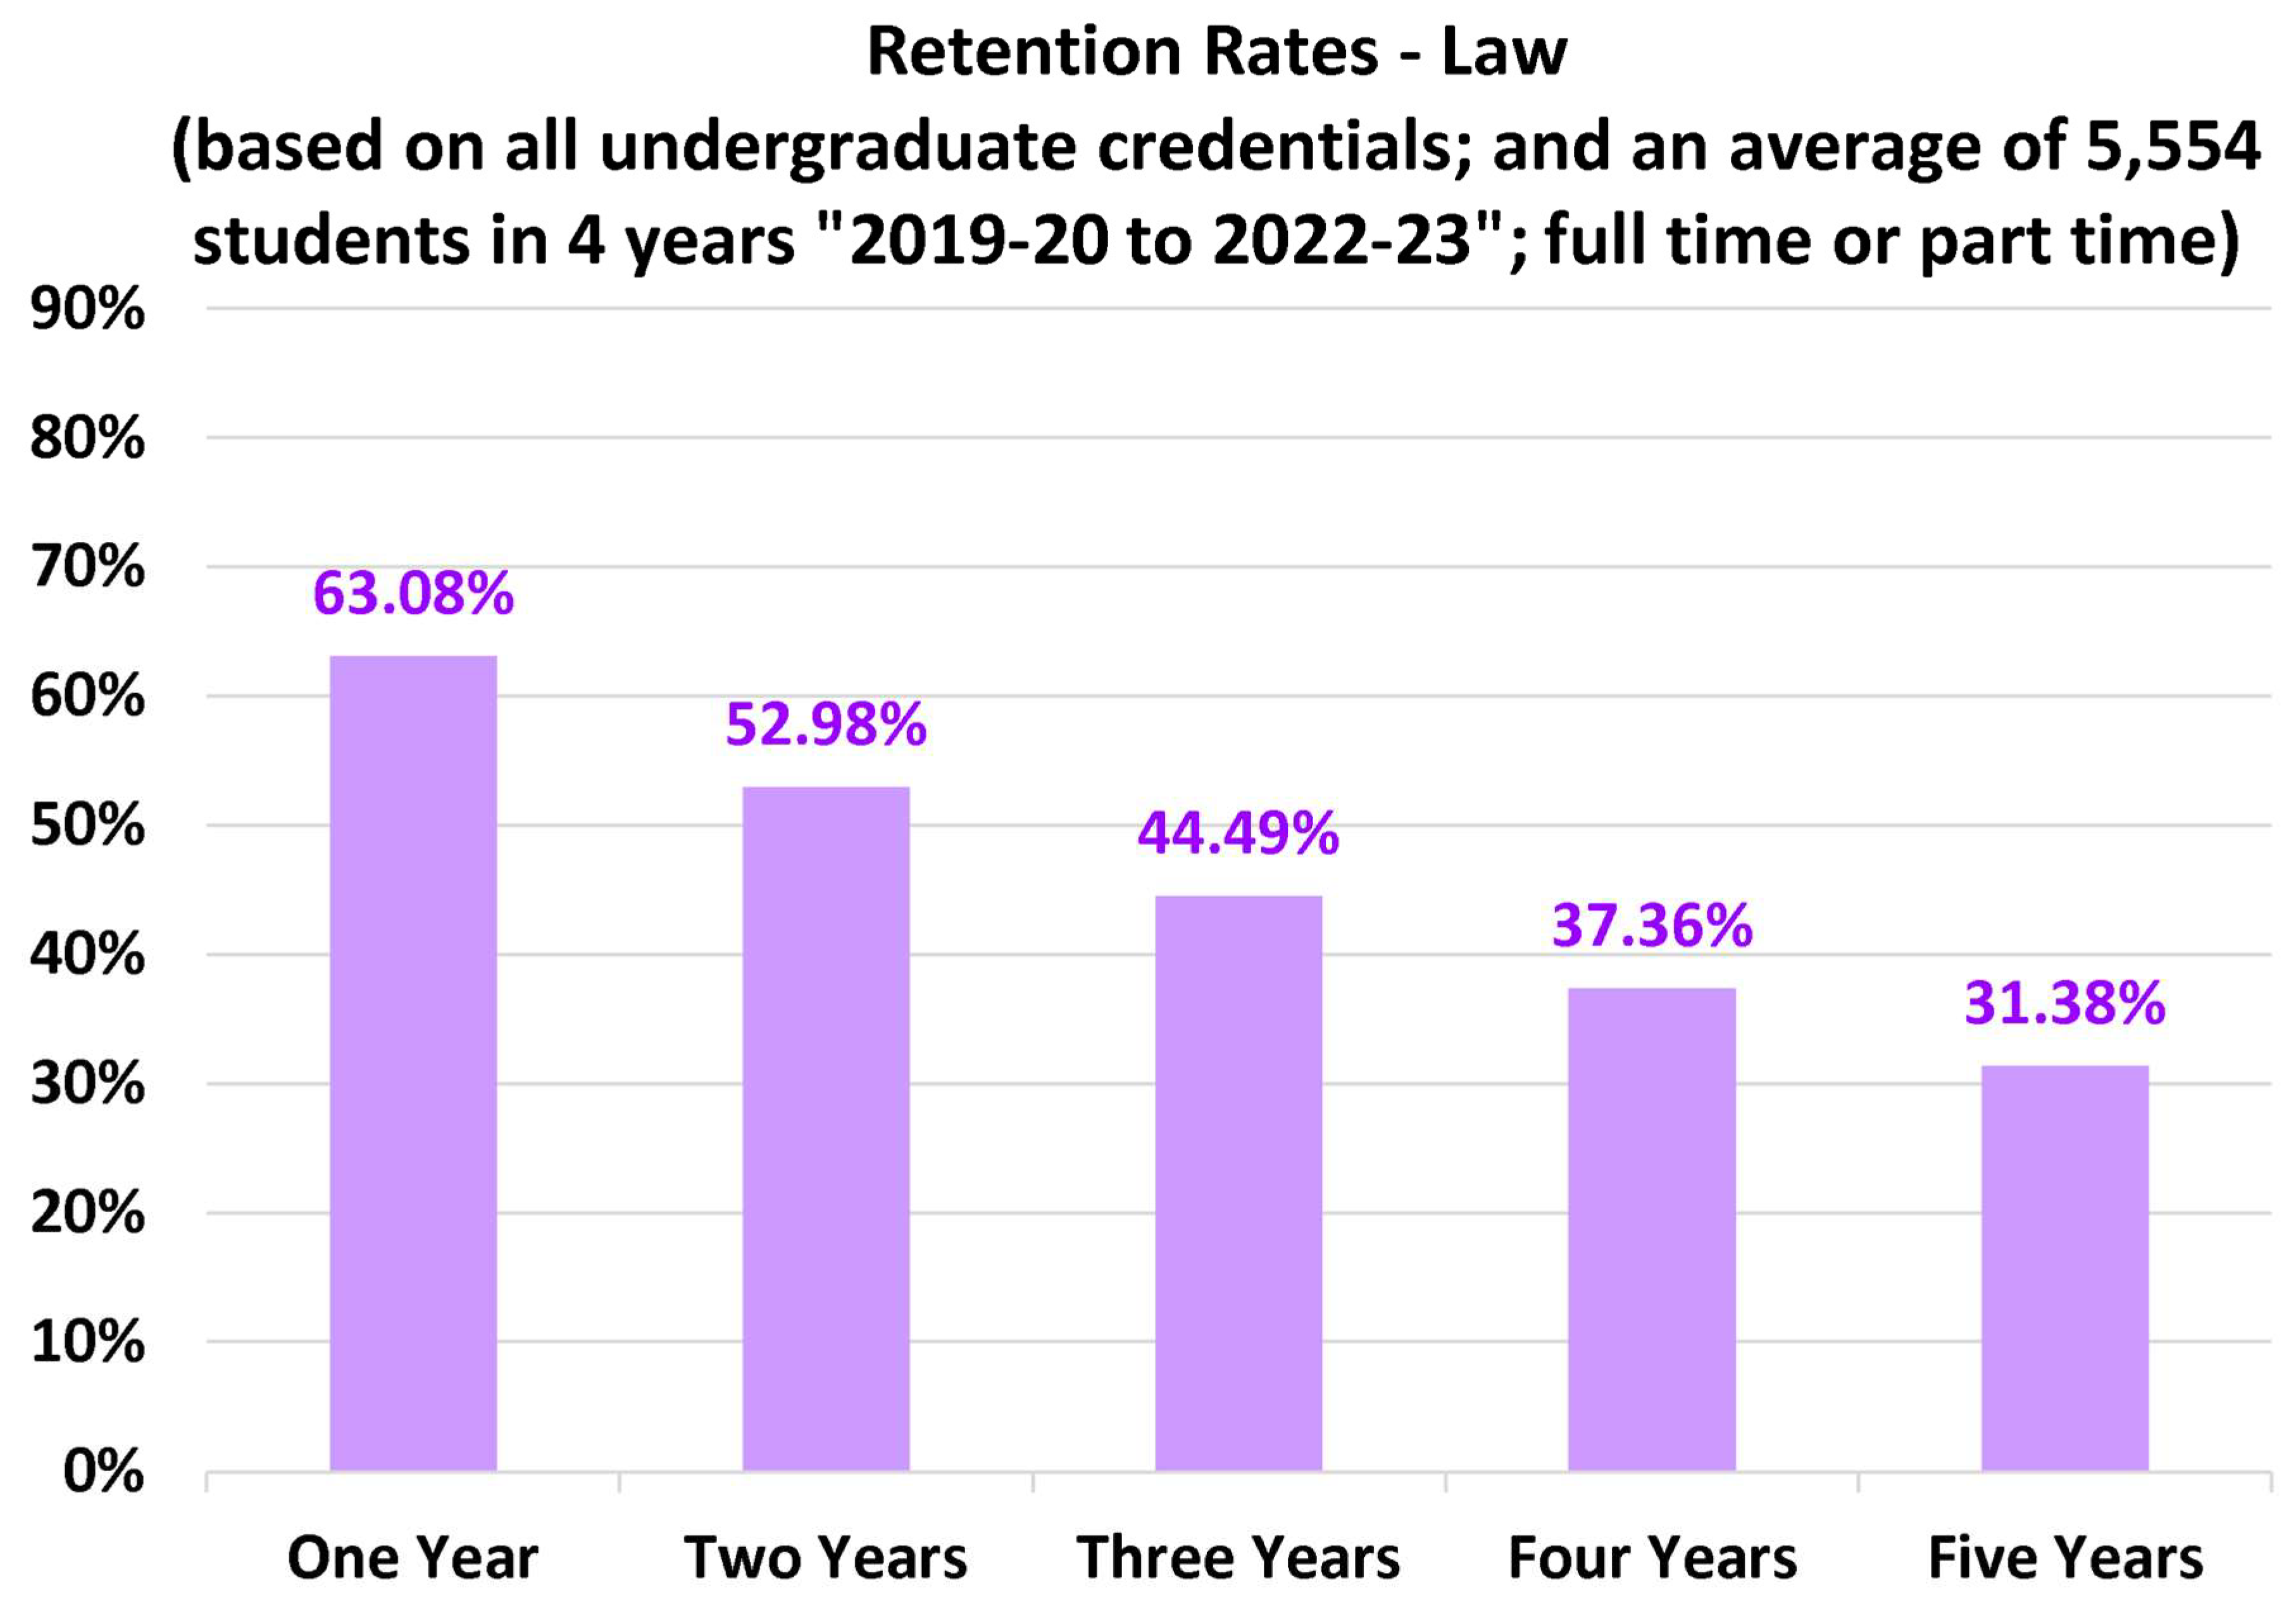
Figure 12.
Overall progression rates.
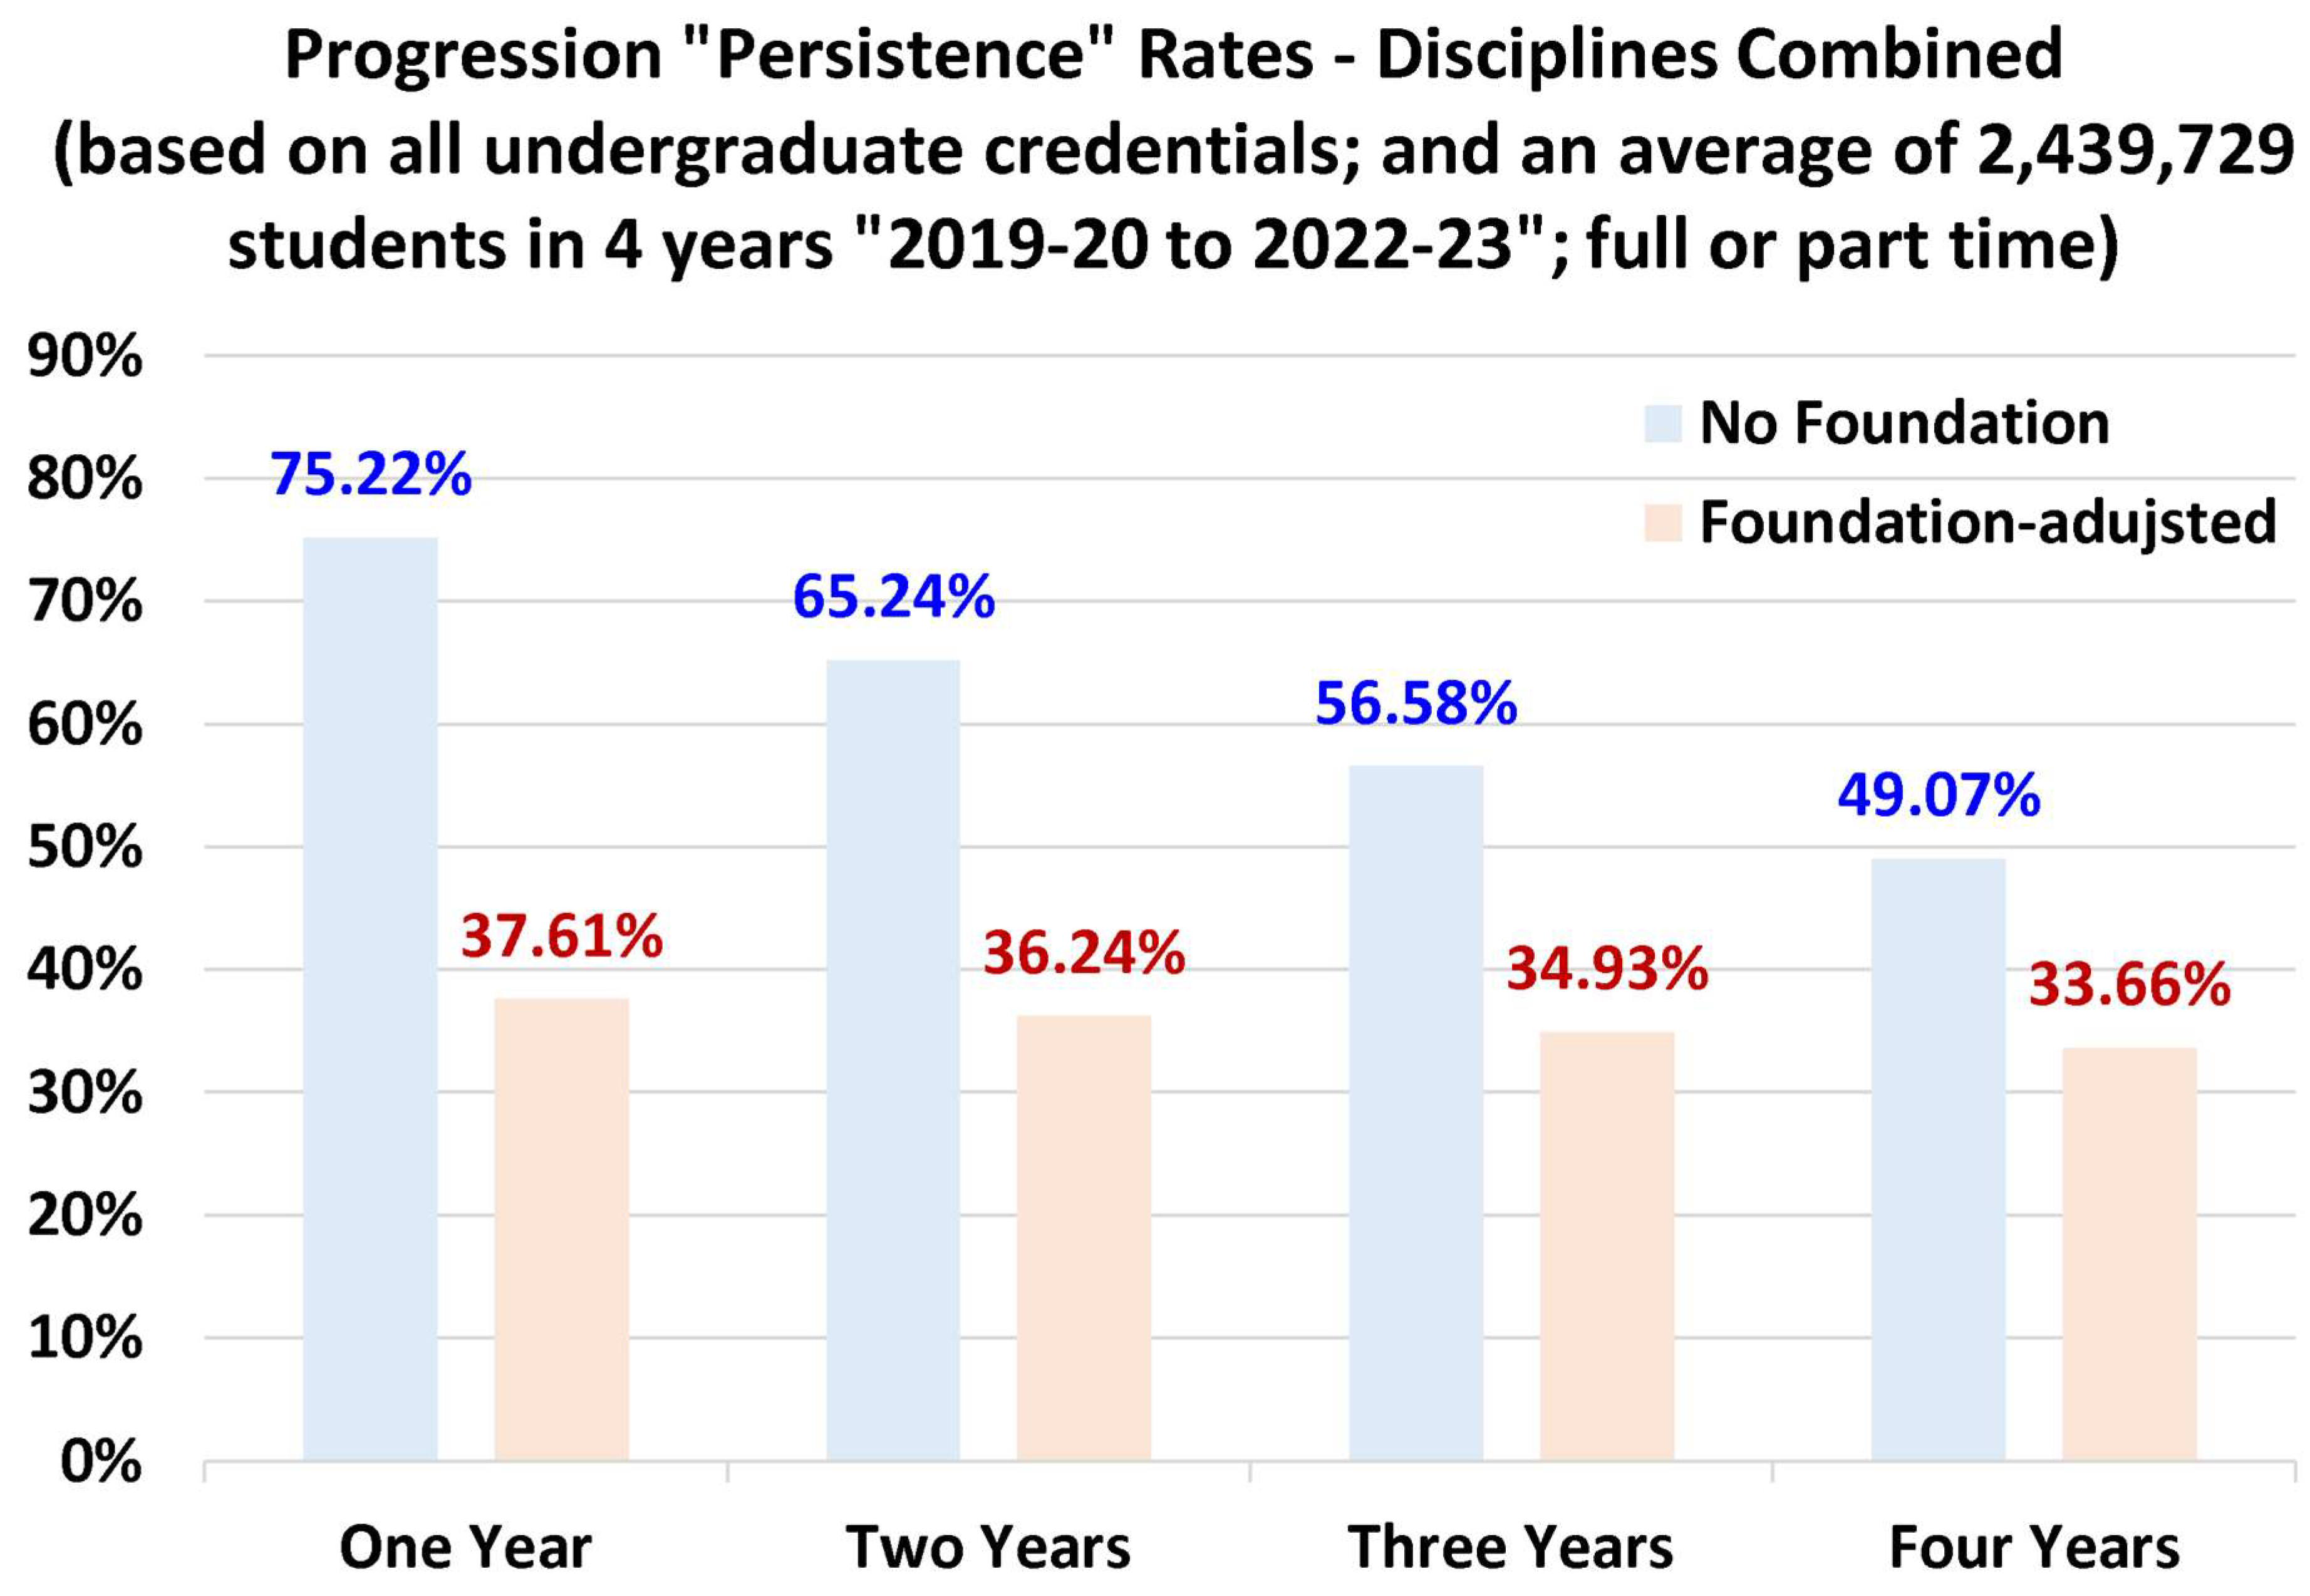
Figure 13.
Architecture progression rates.
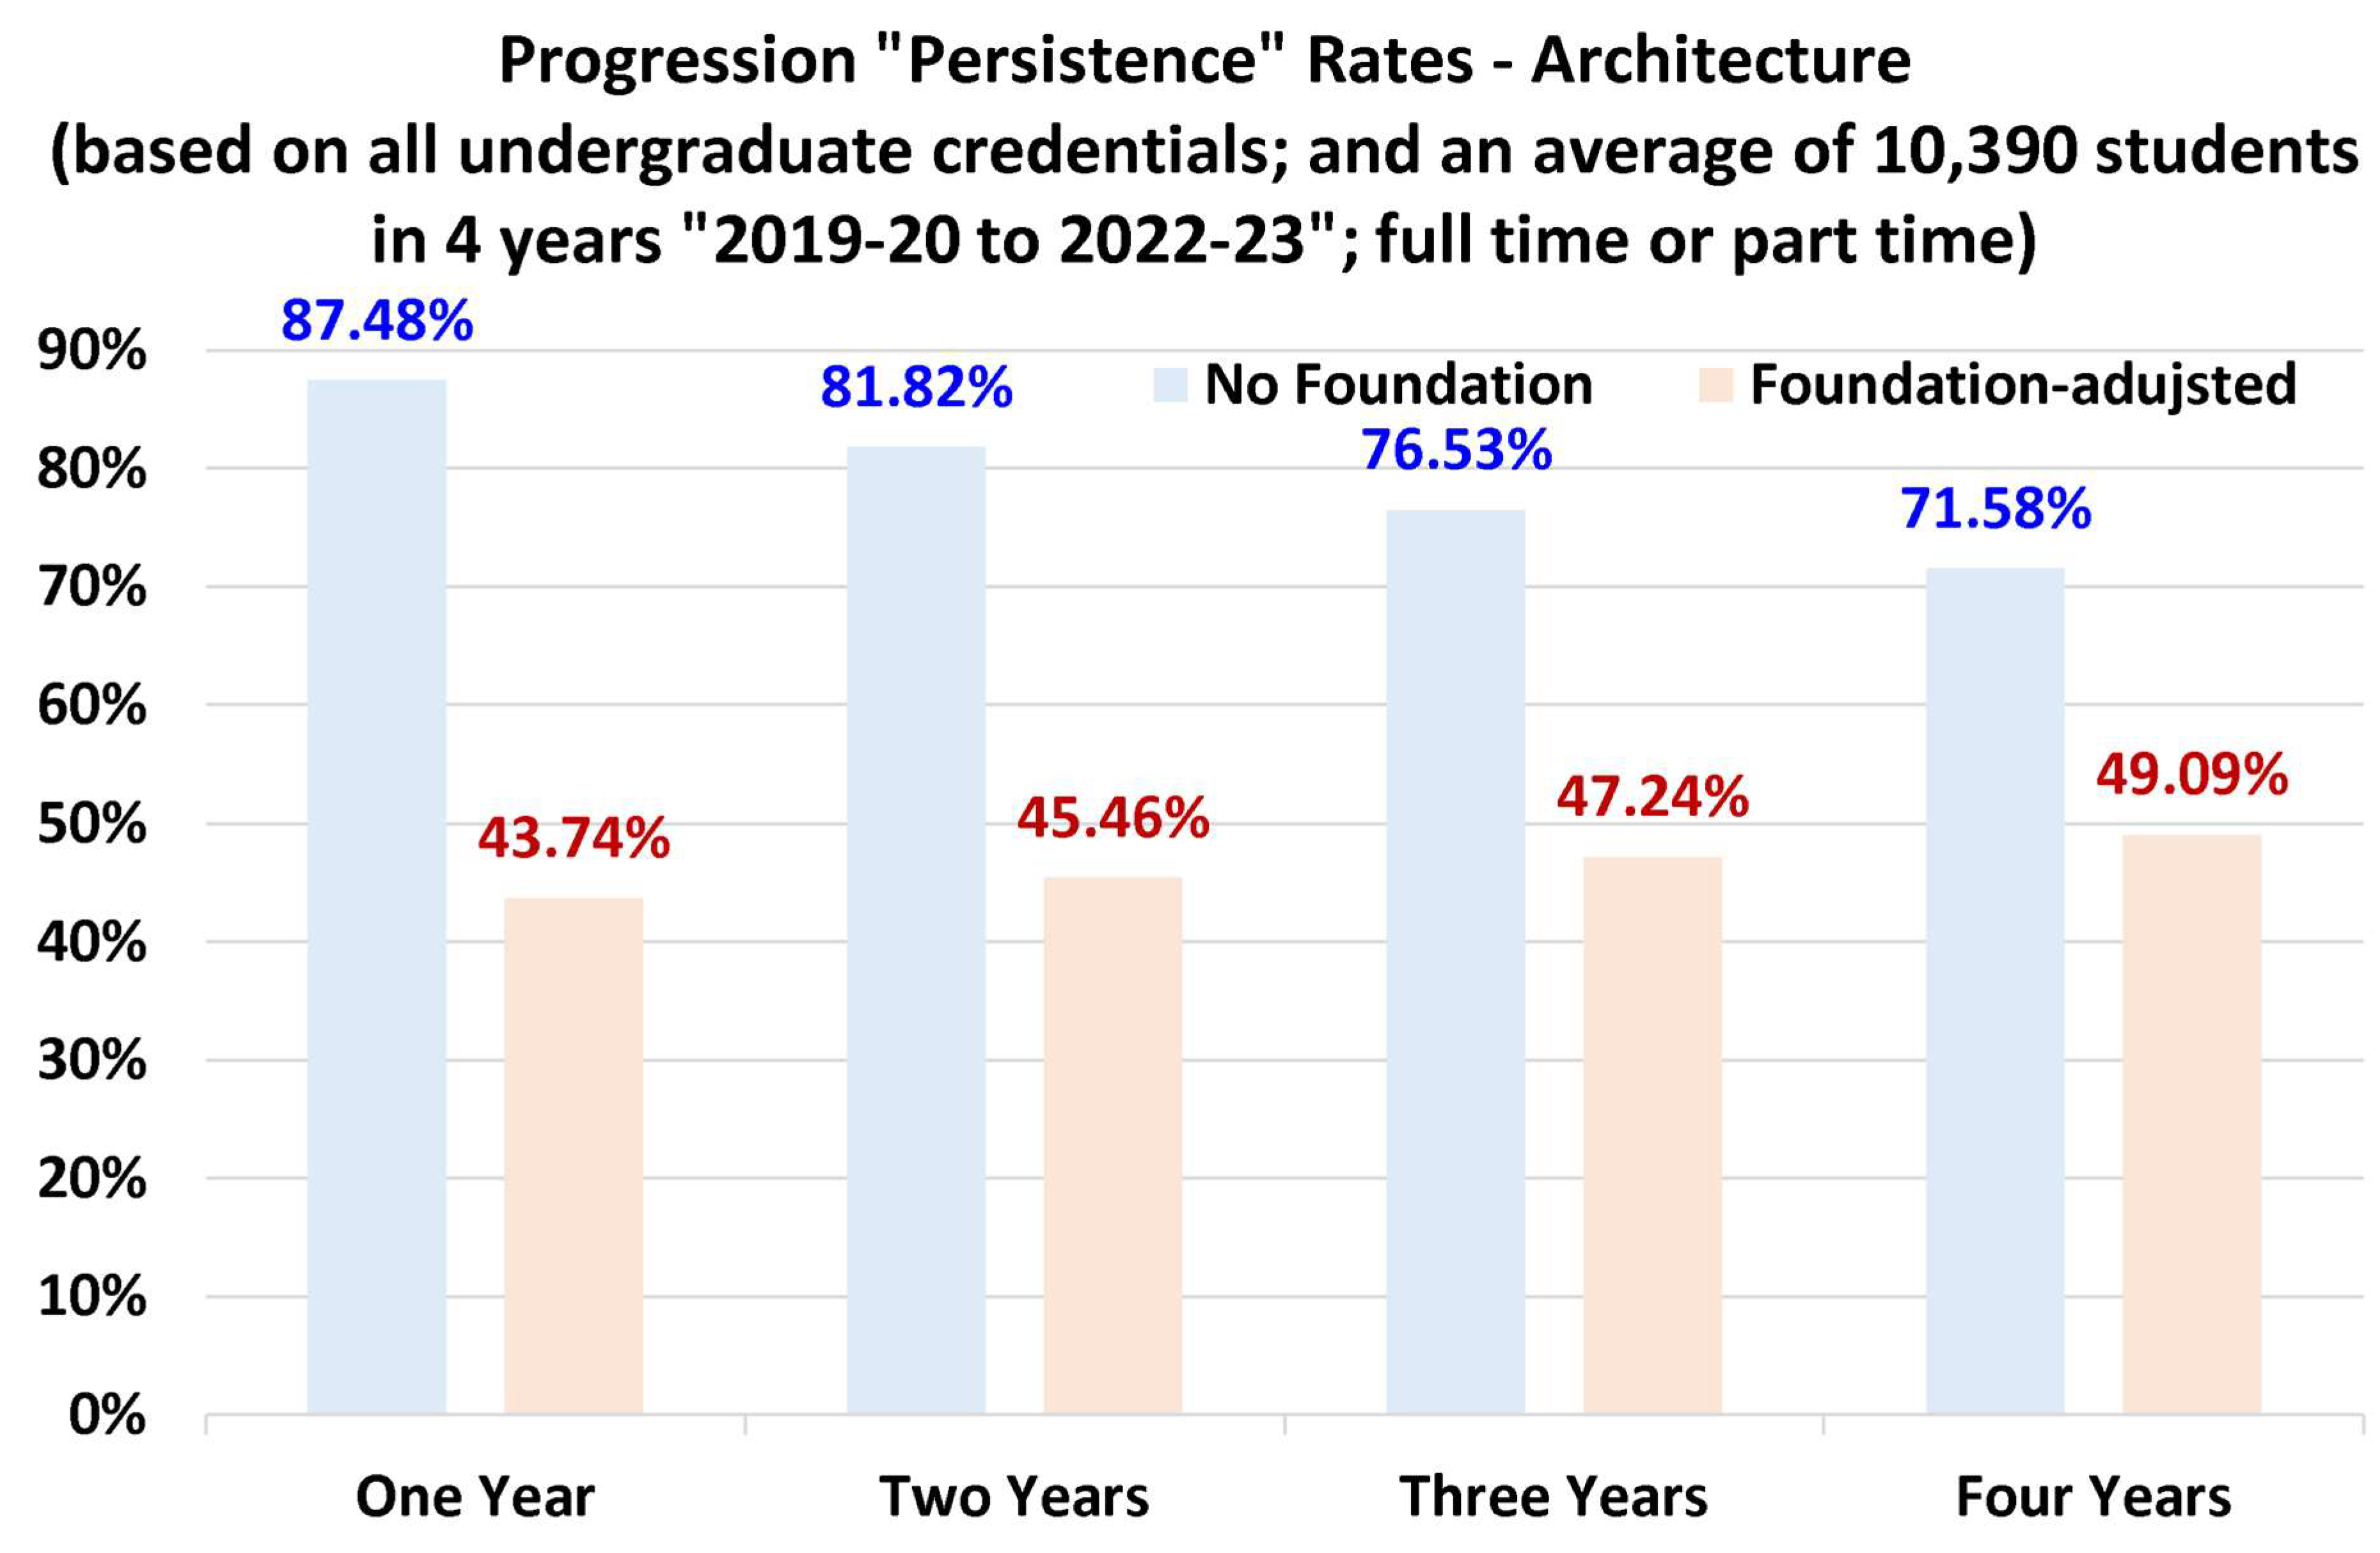
Figure 14.
Business/Management progression rates.
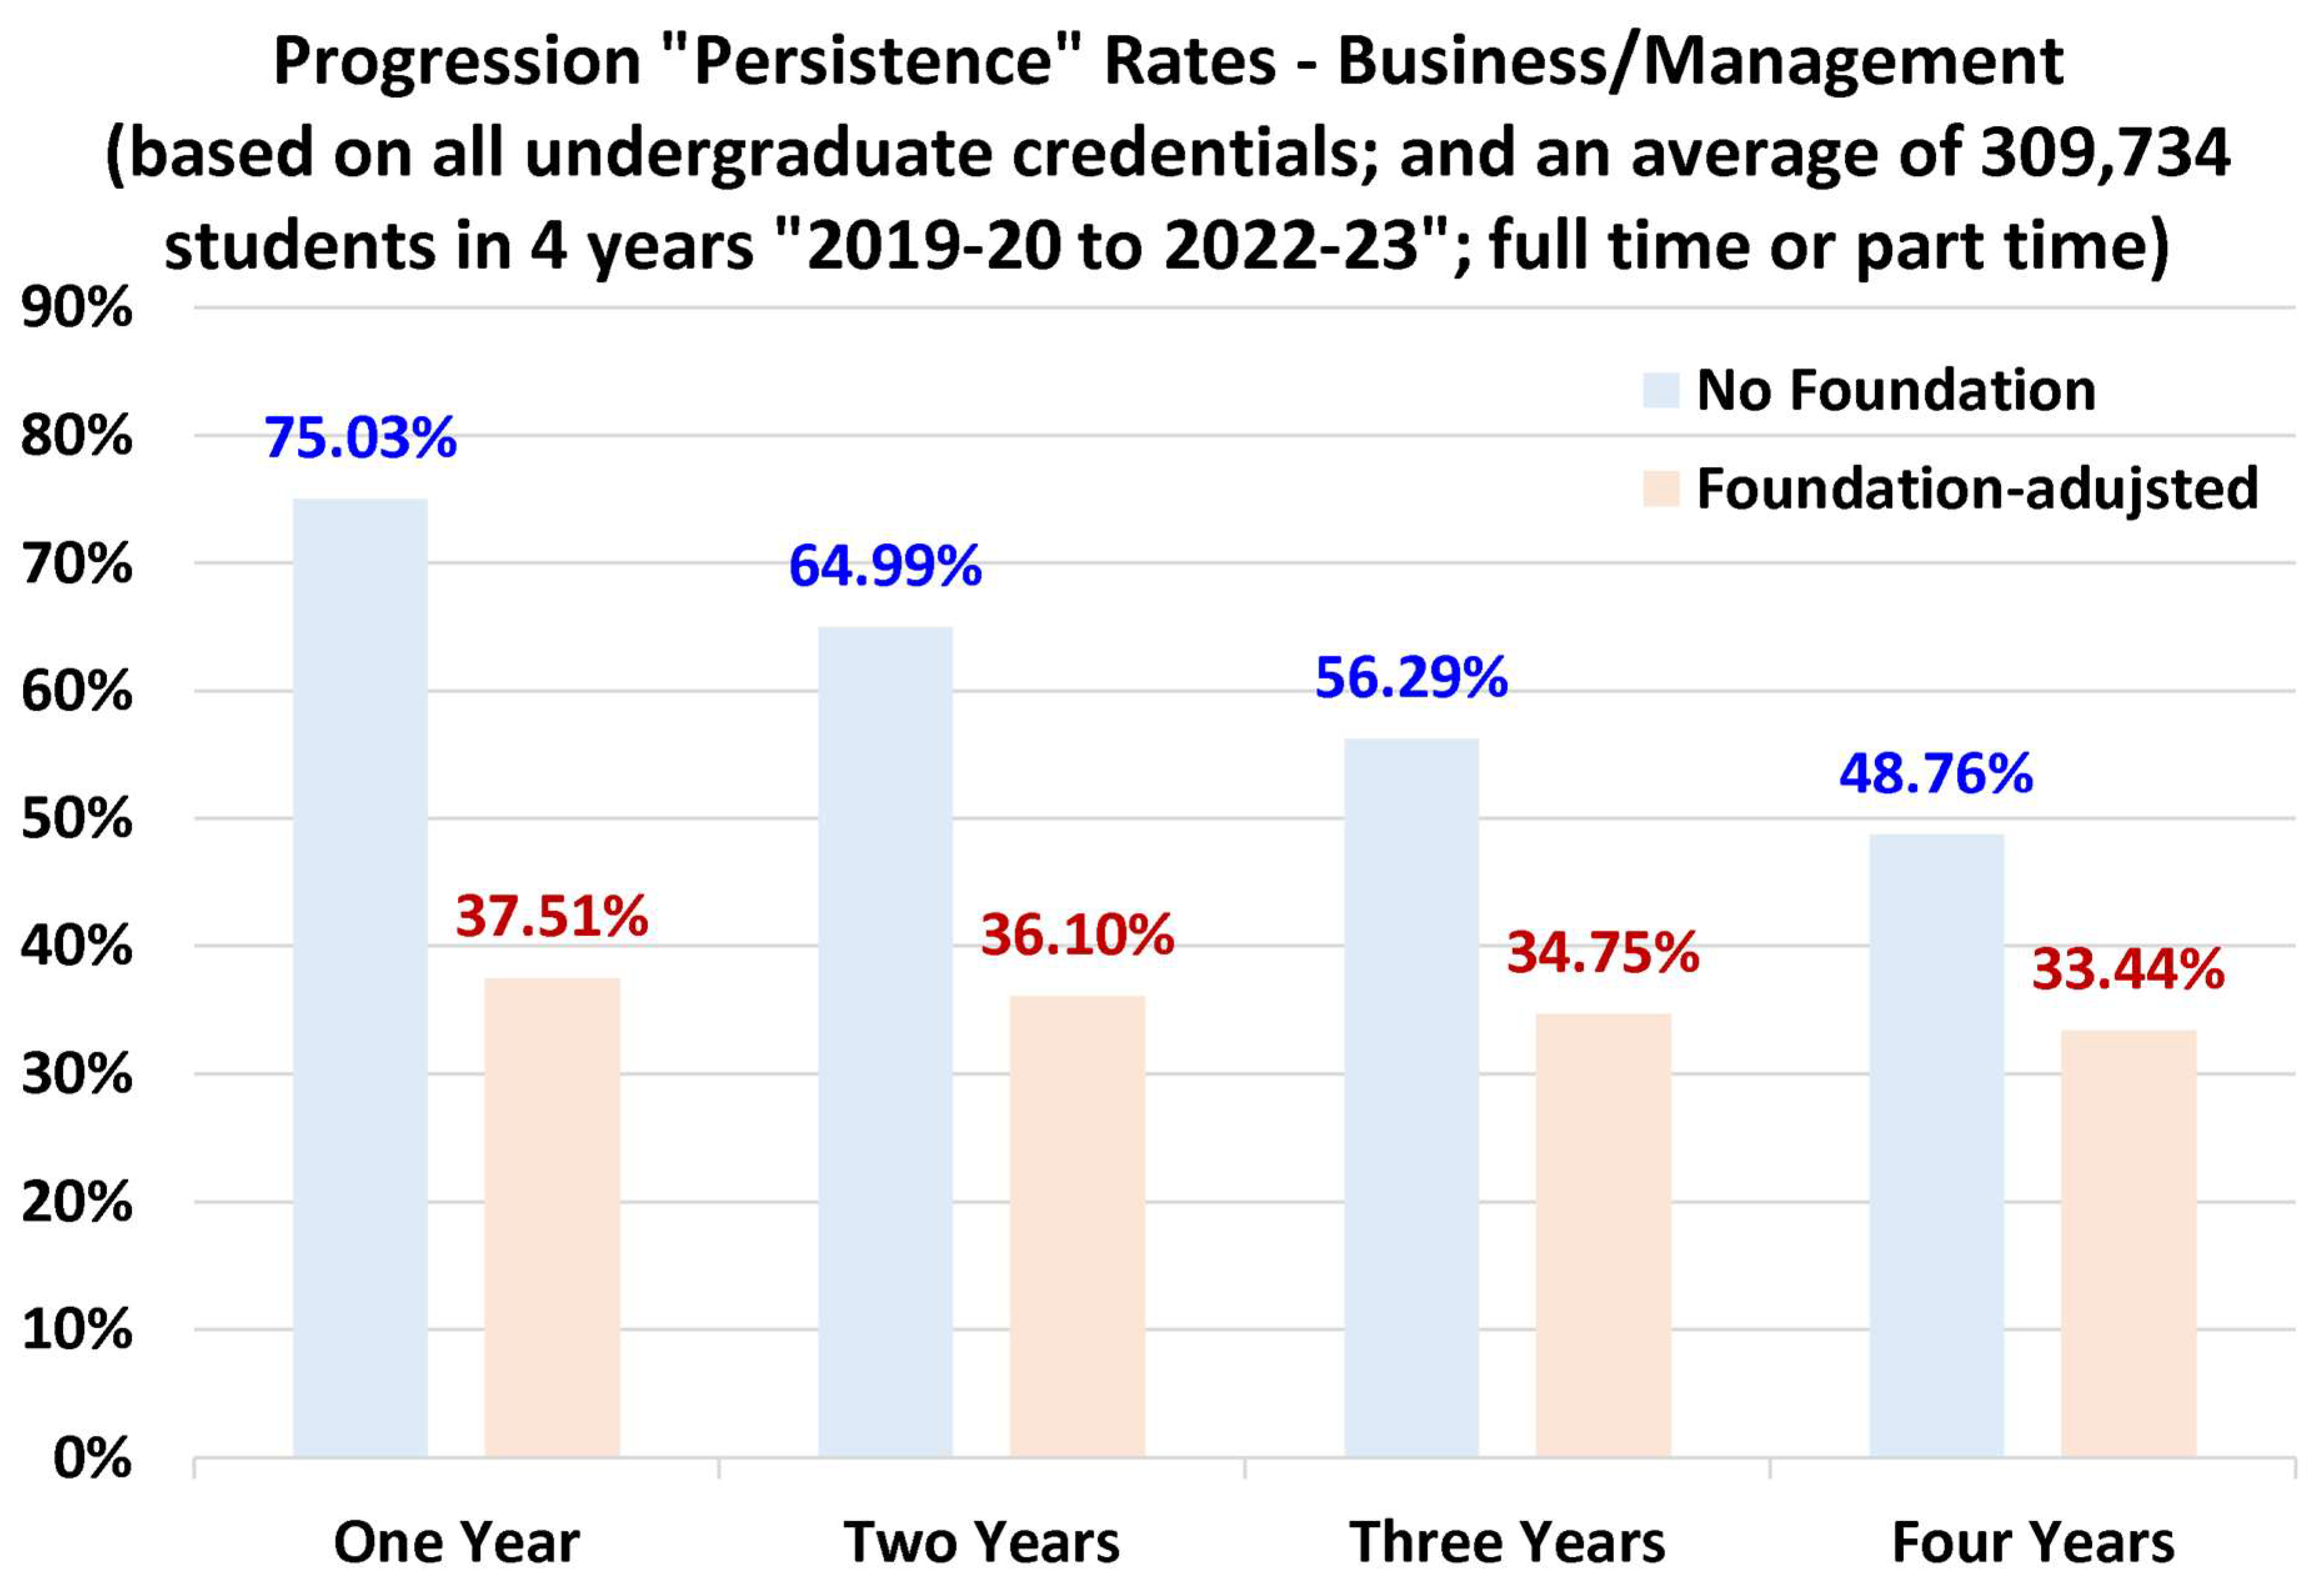
Figure 15.
Computer/Information progression rates.
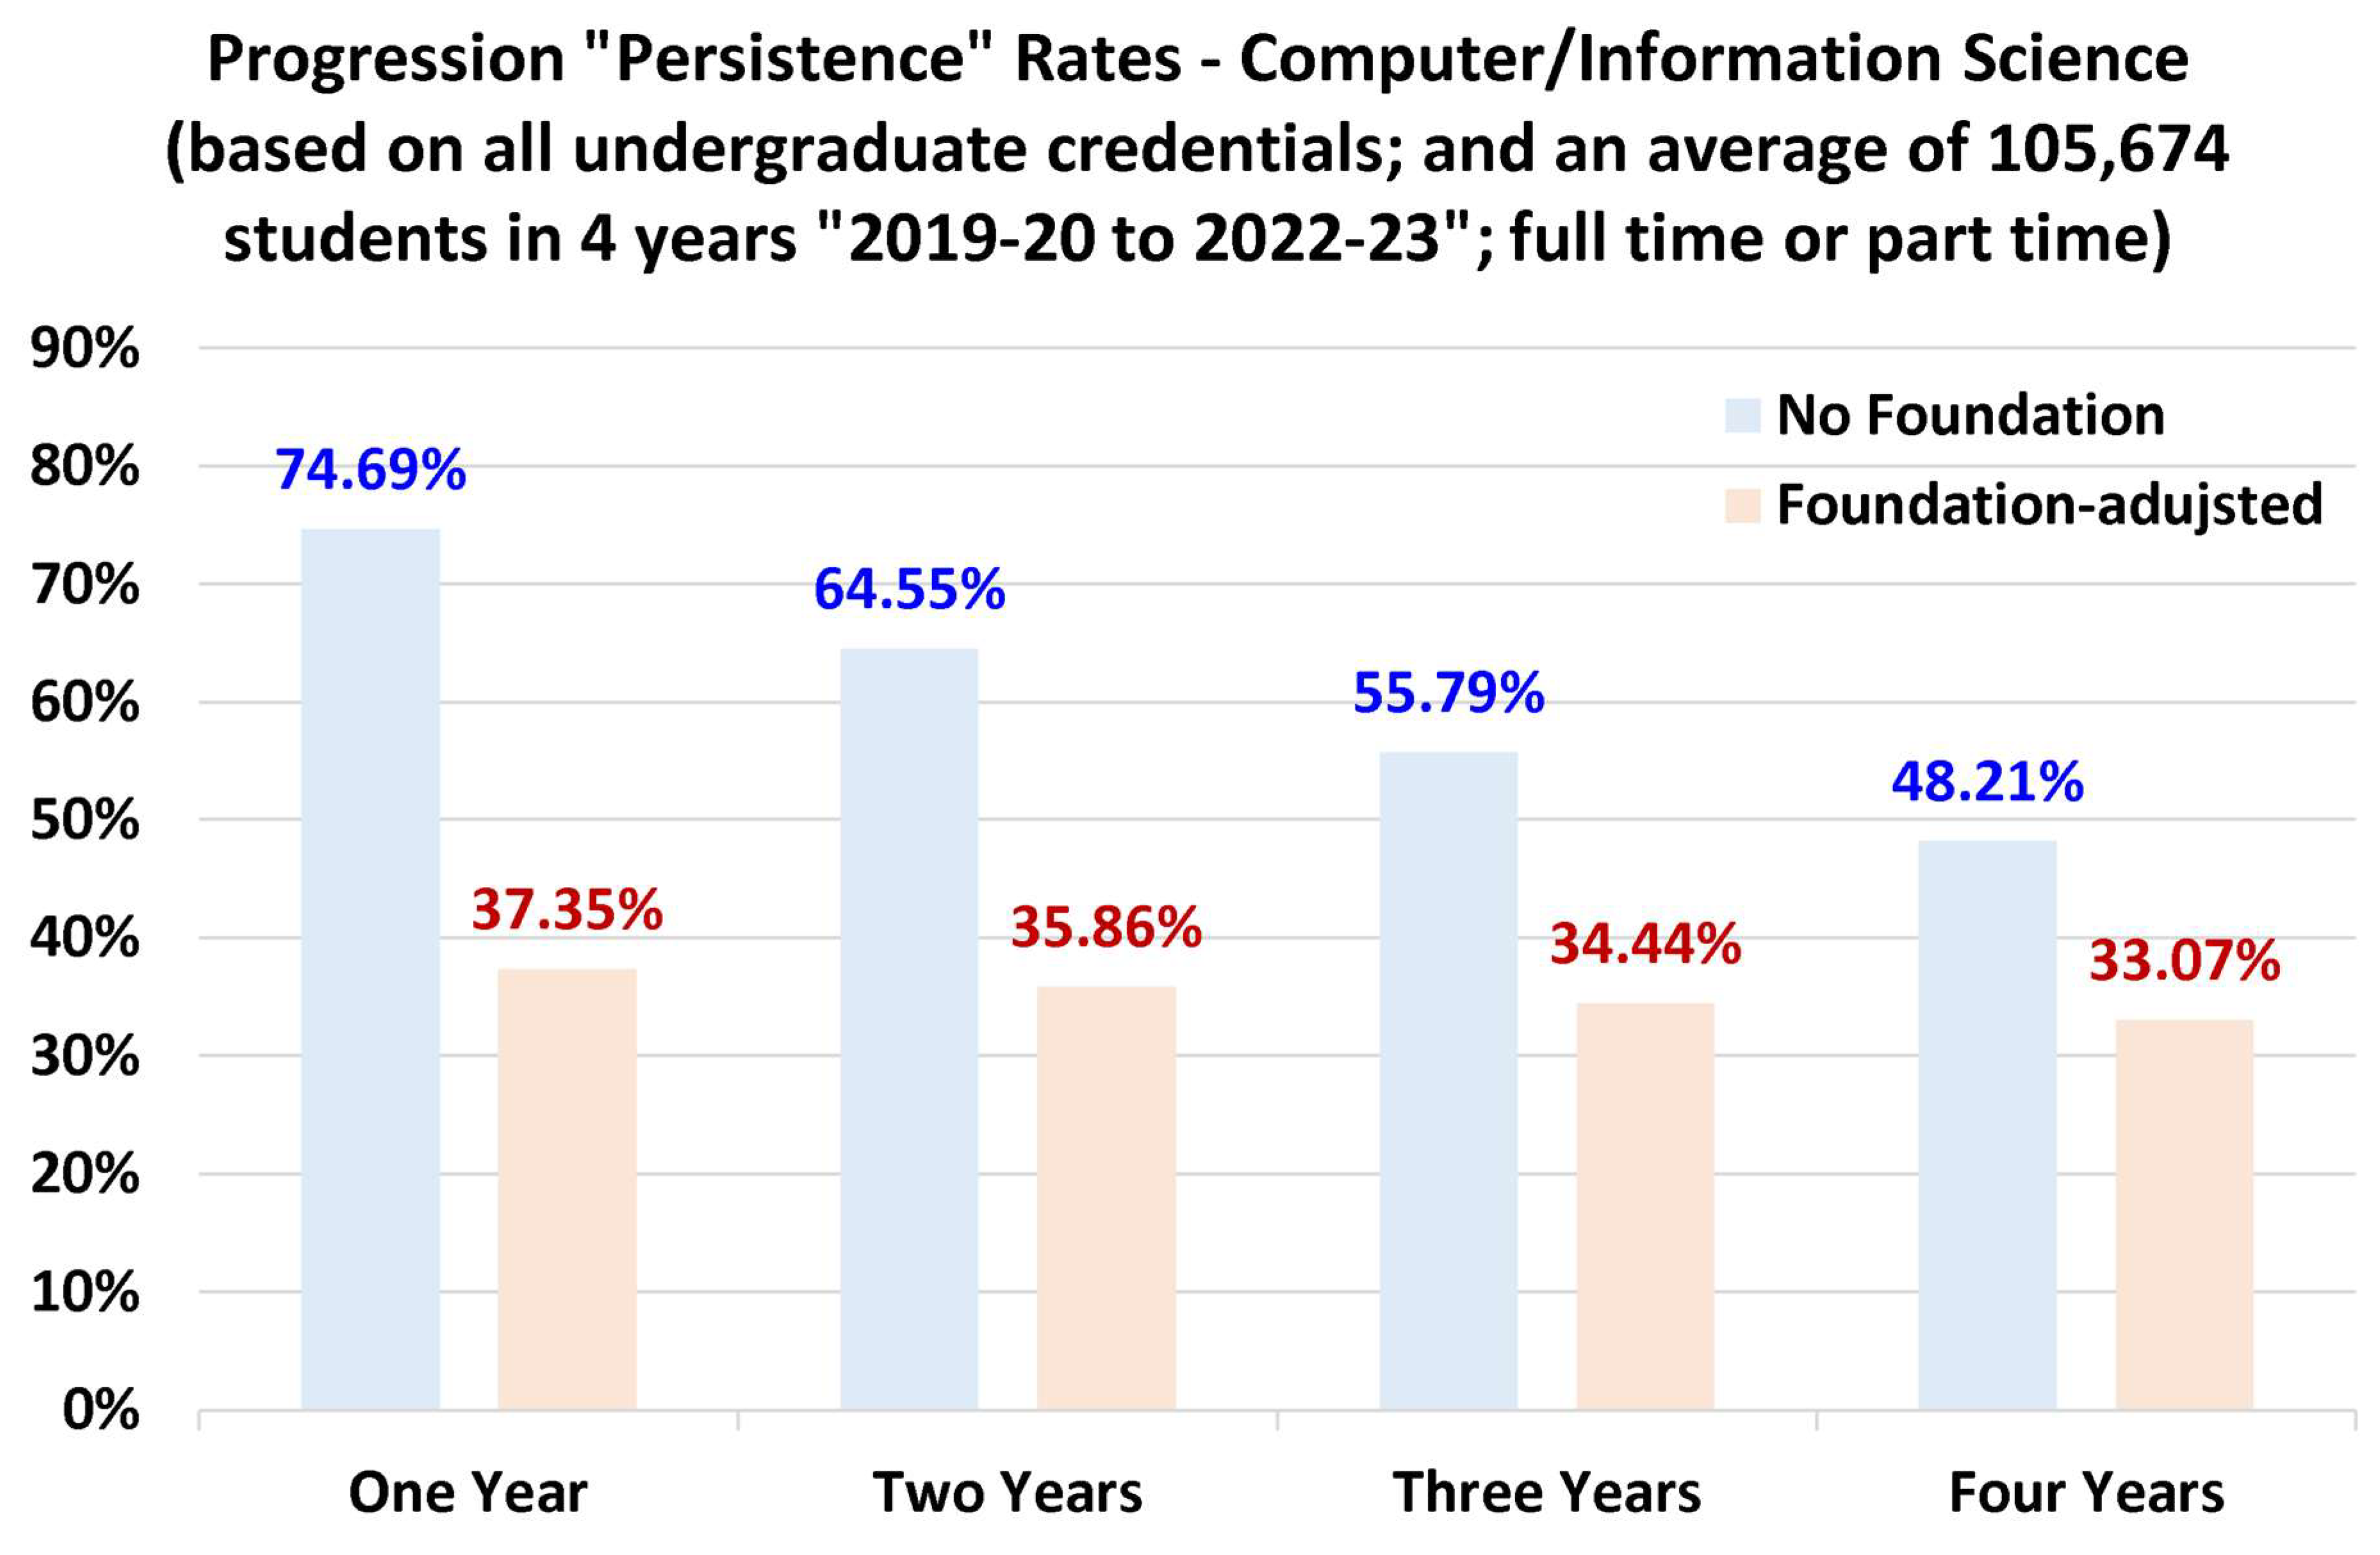
Figure 16.
Education progression rates.
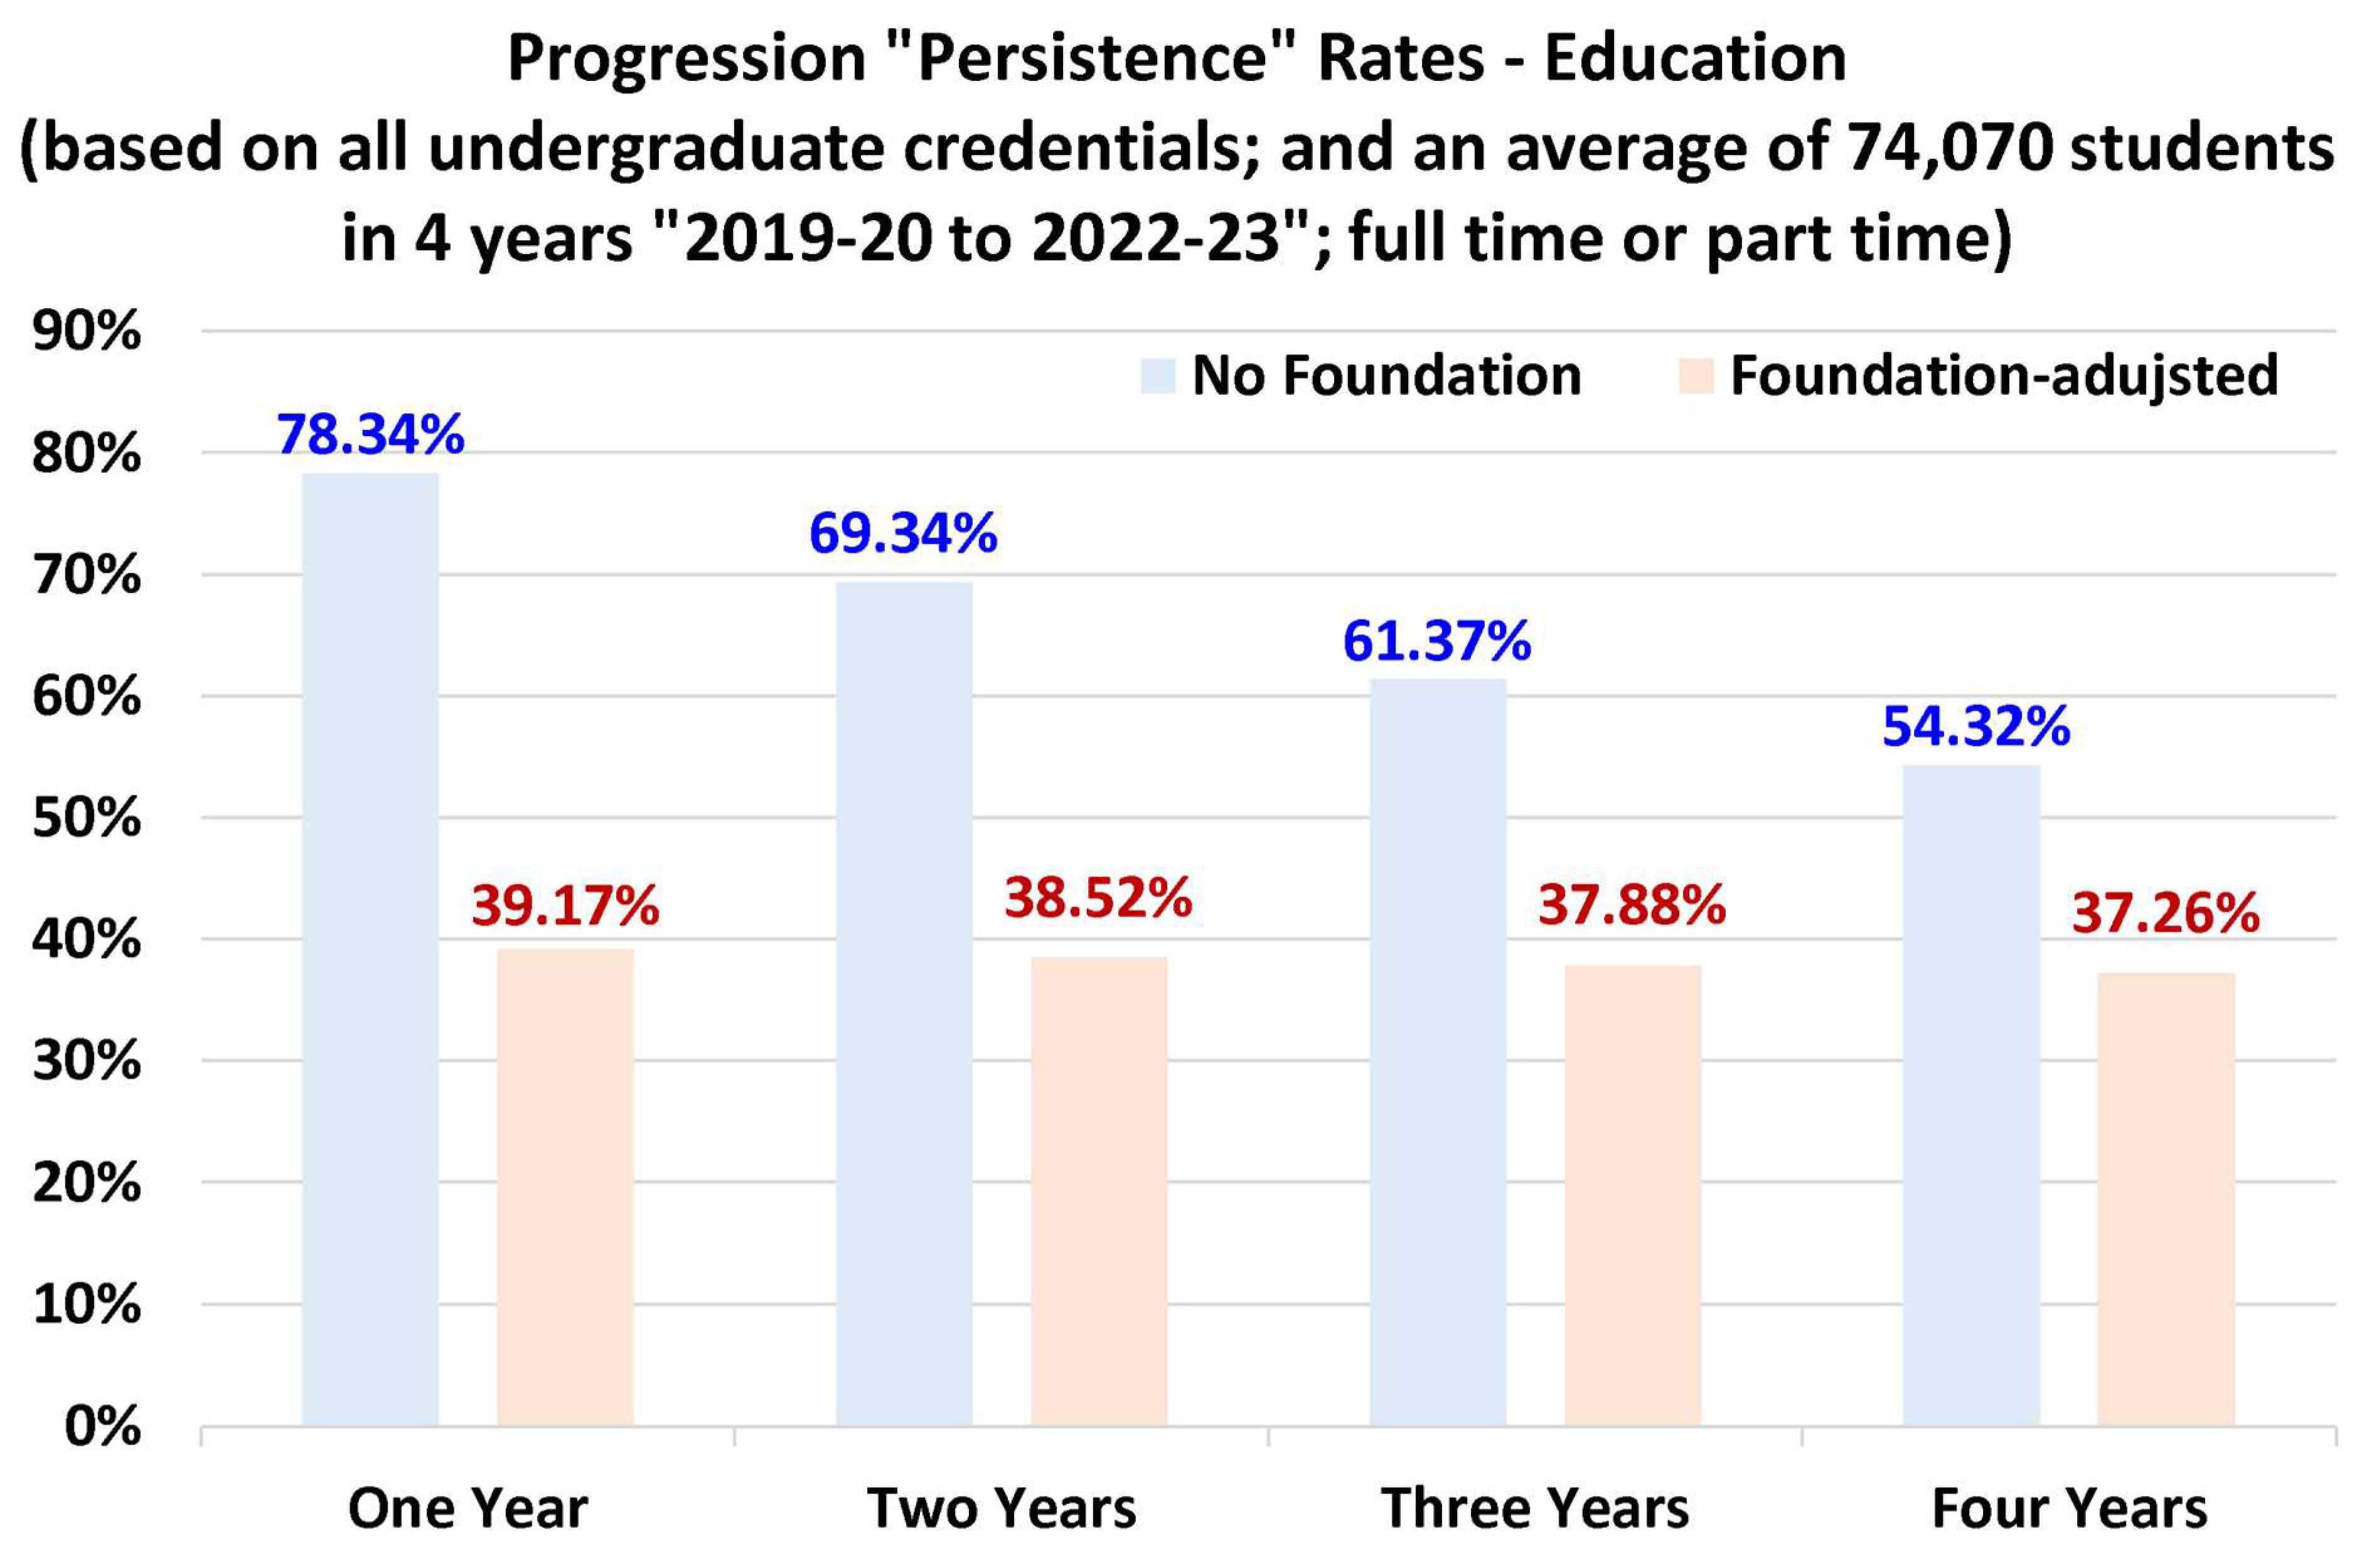
Figure 17.
Engineering progression rates.
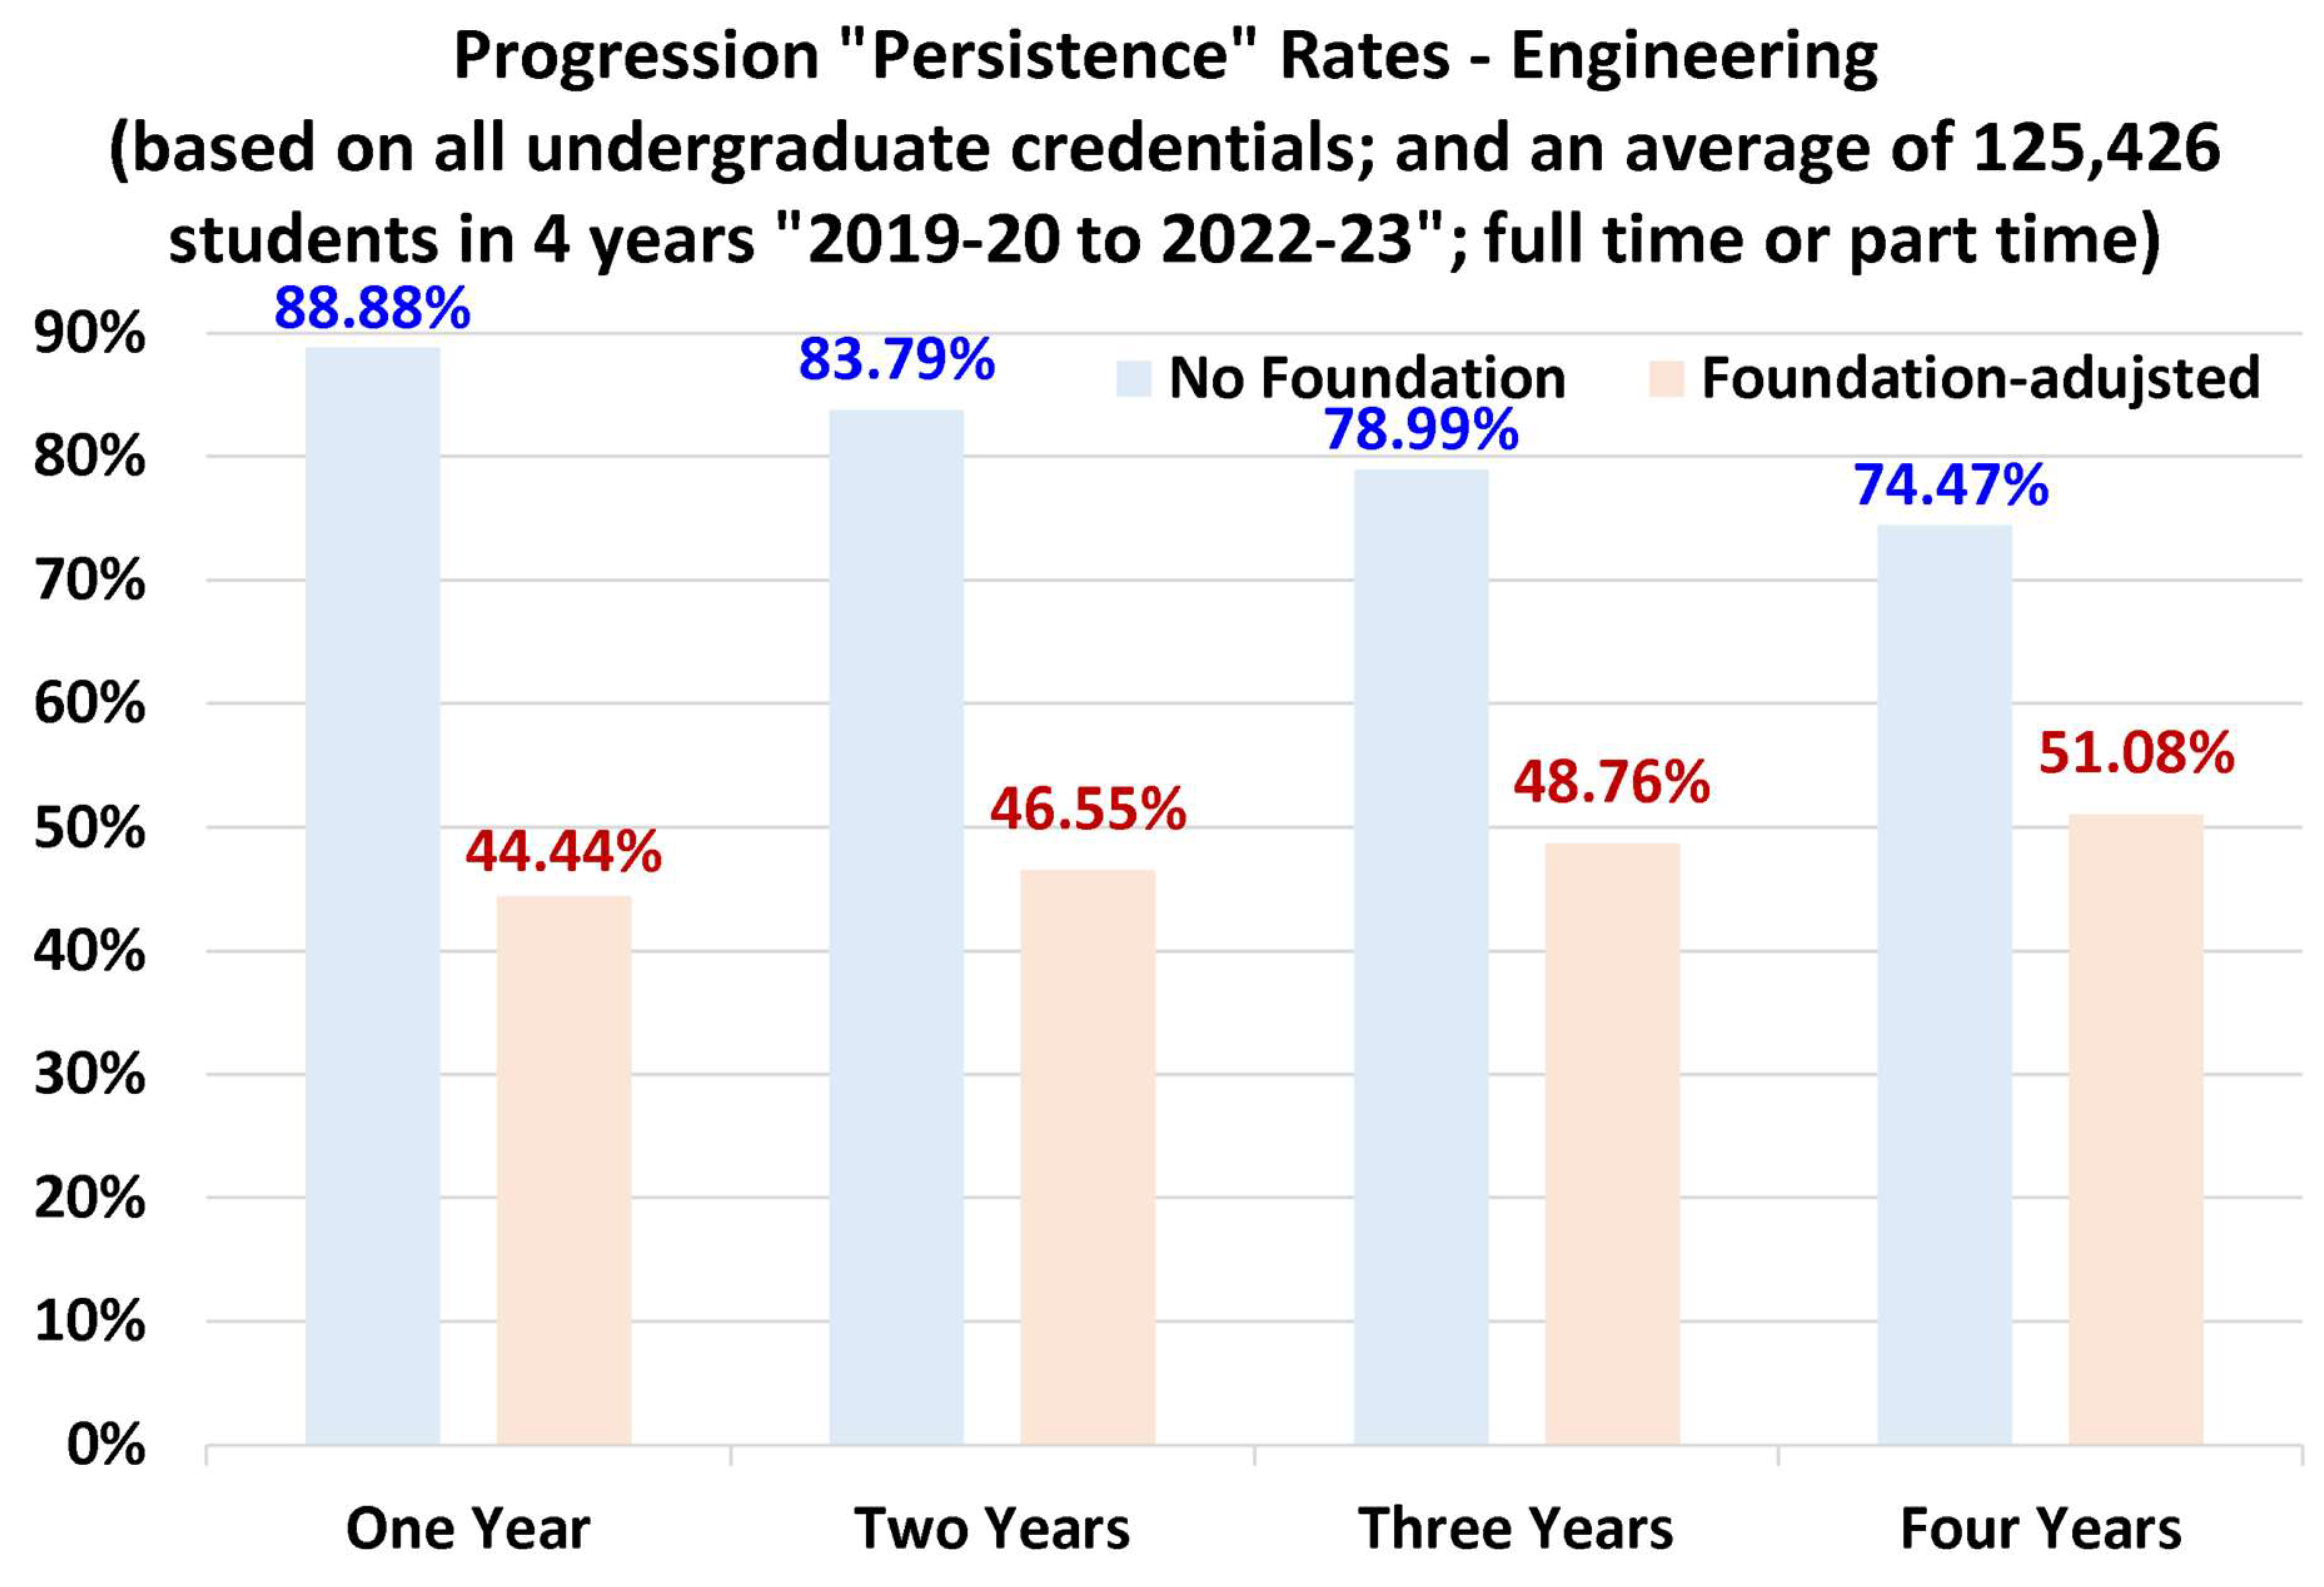
Figure 18.
Engineering Technology progression rates.
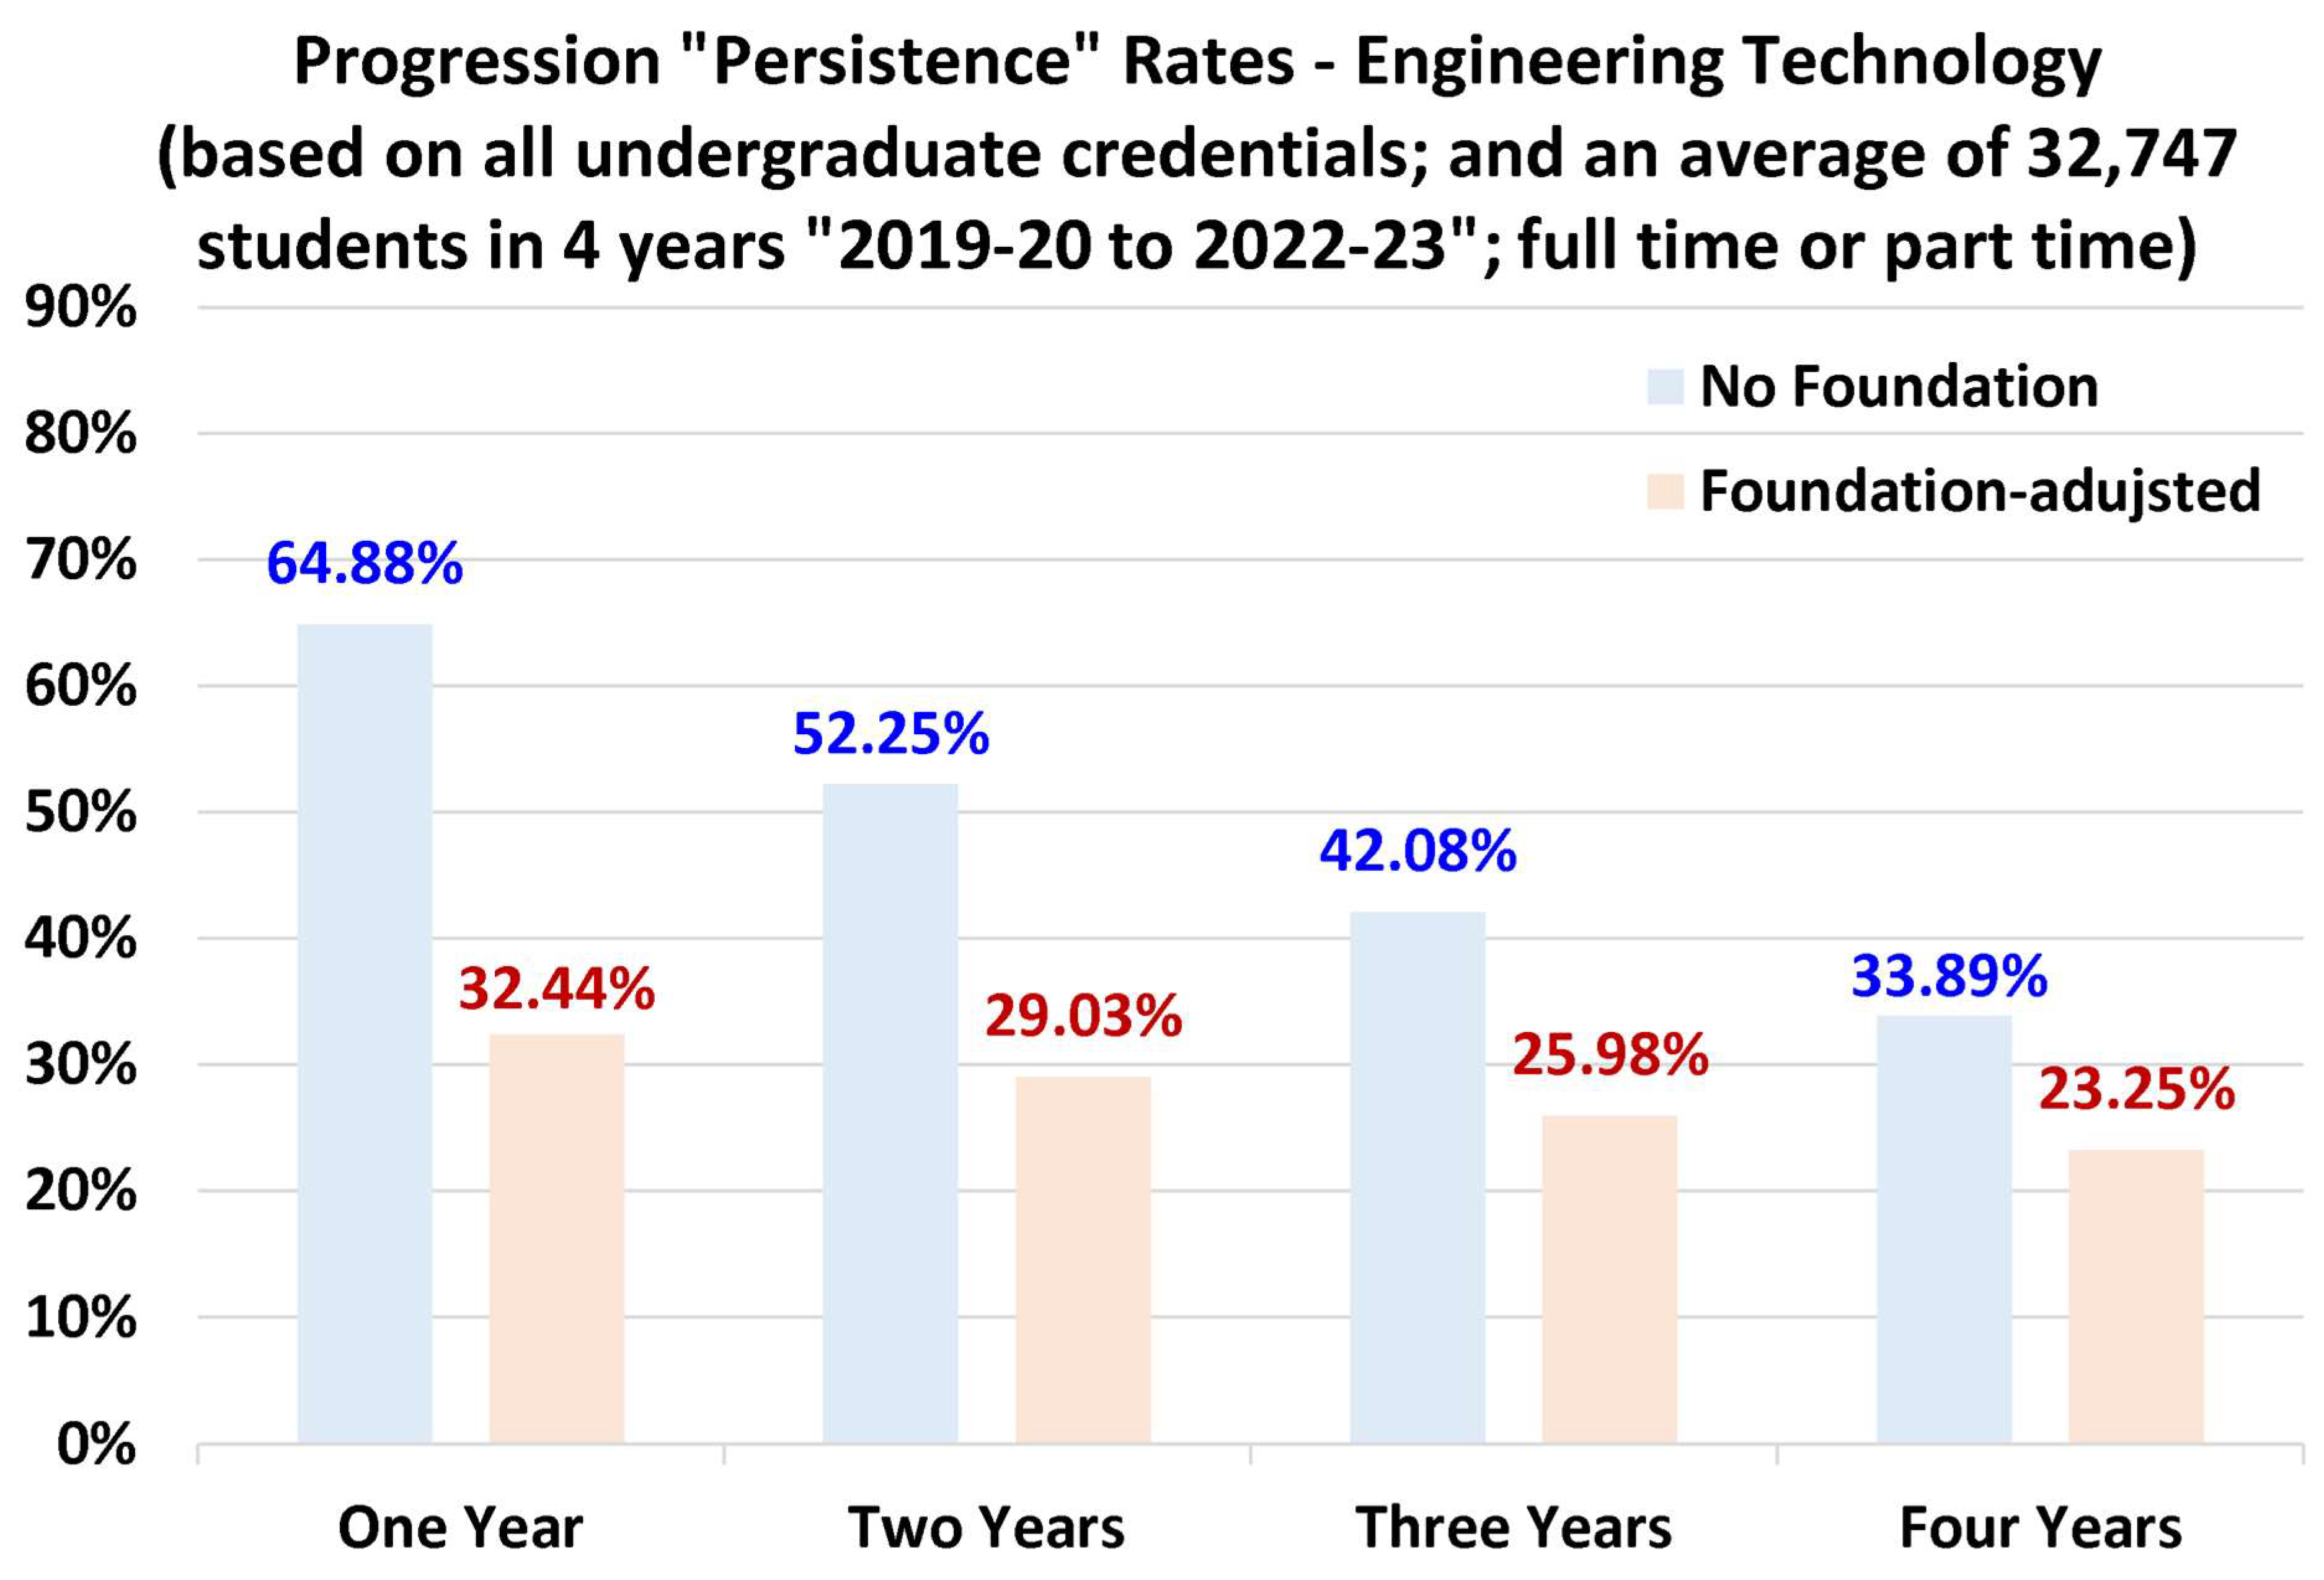
Figure 19.
Health/Clinical progression rates.
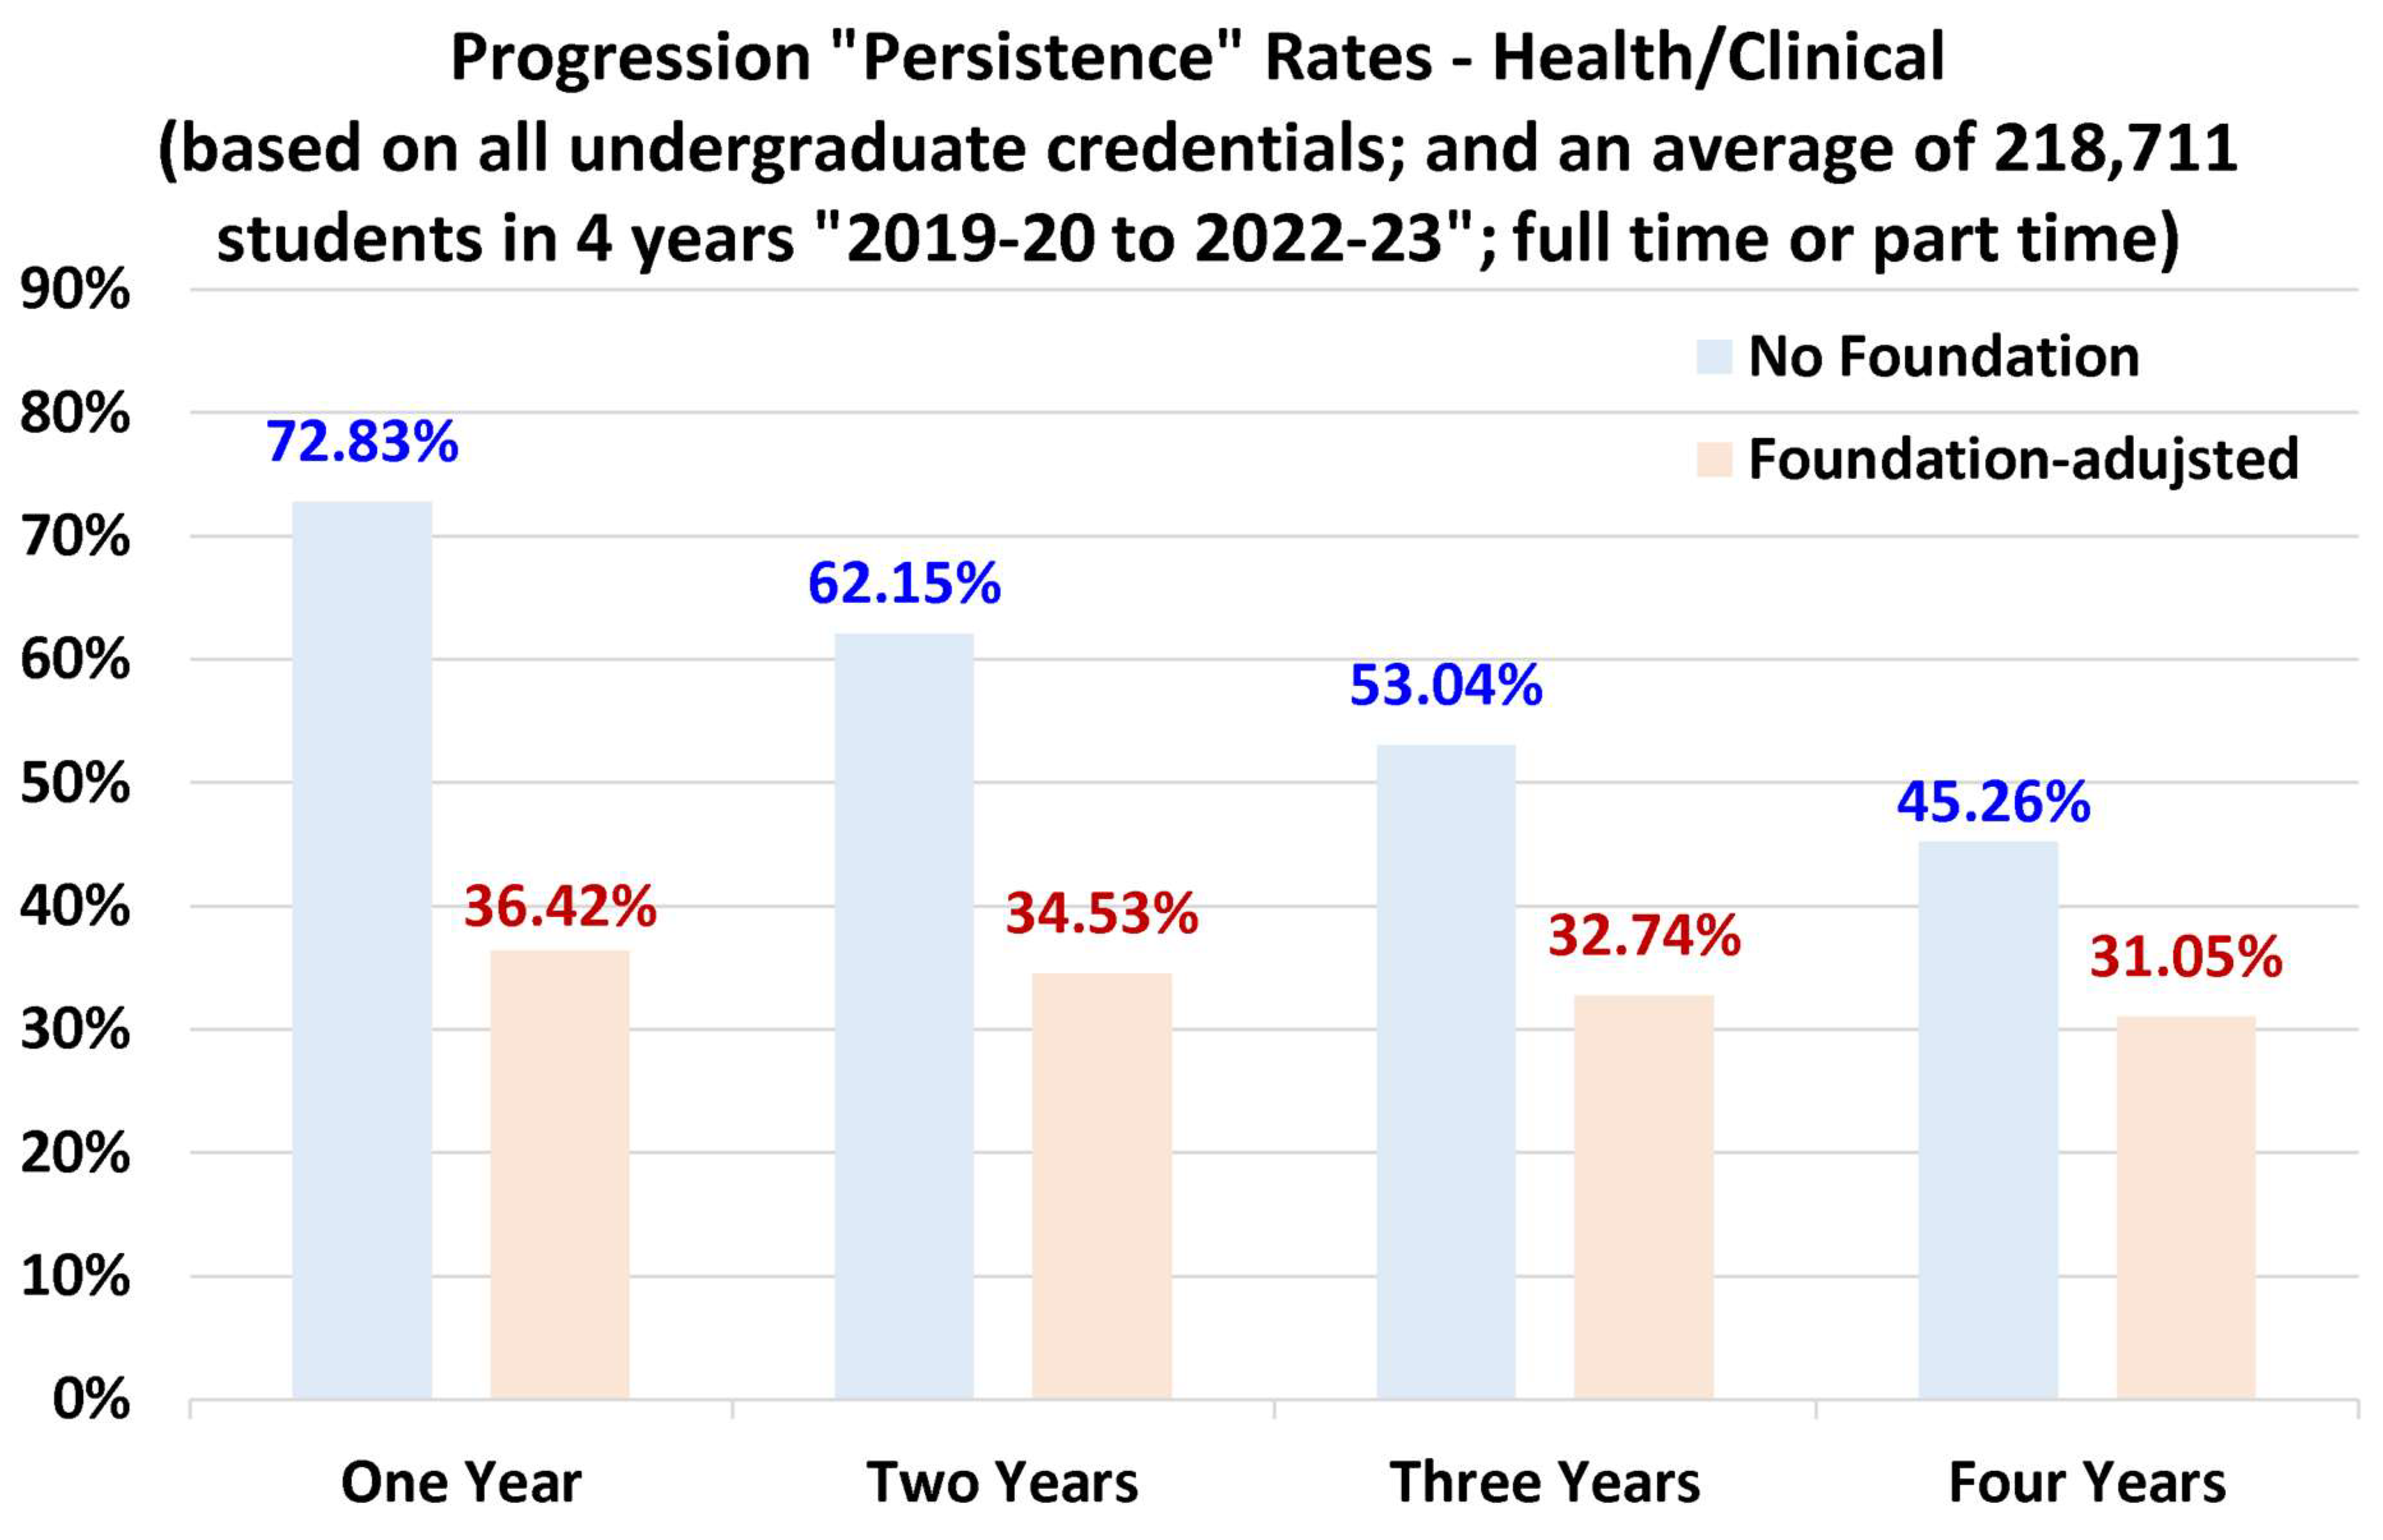
Figure 20.
Humanities progression rates.
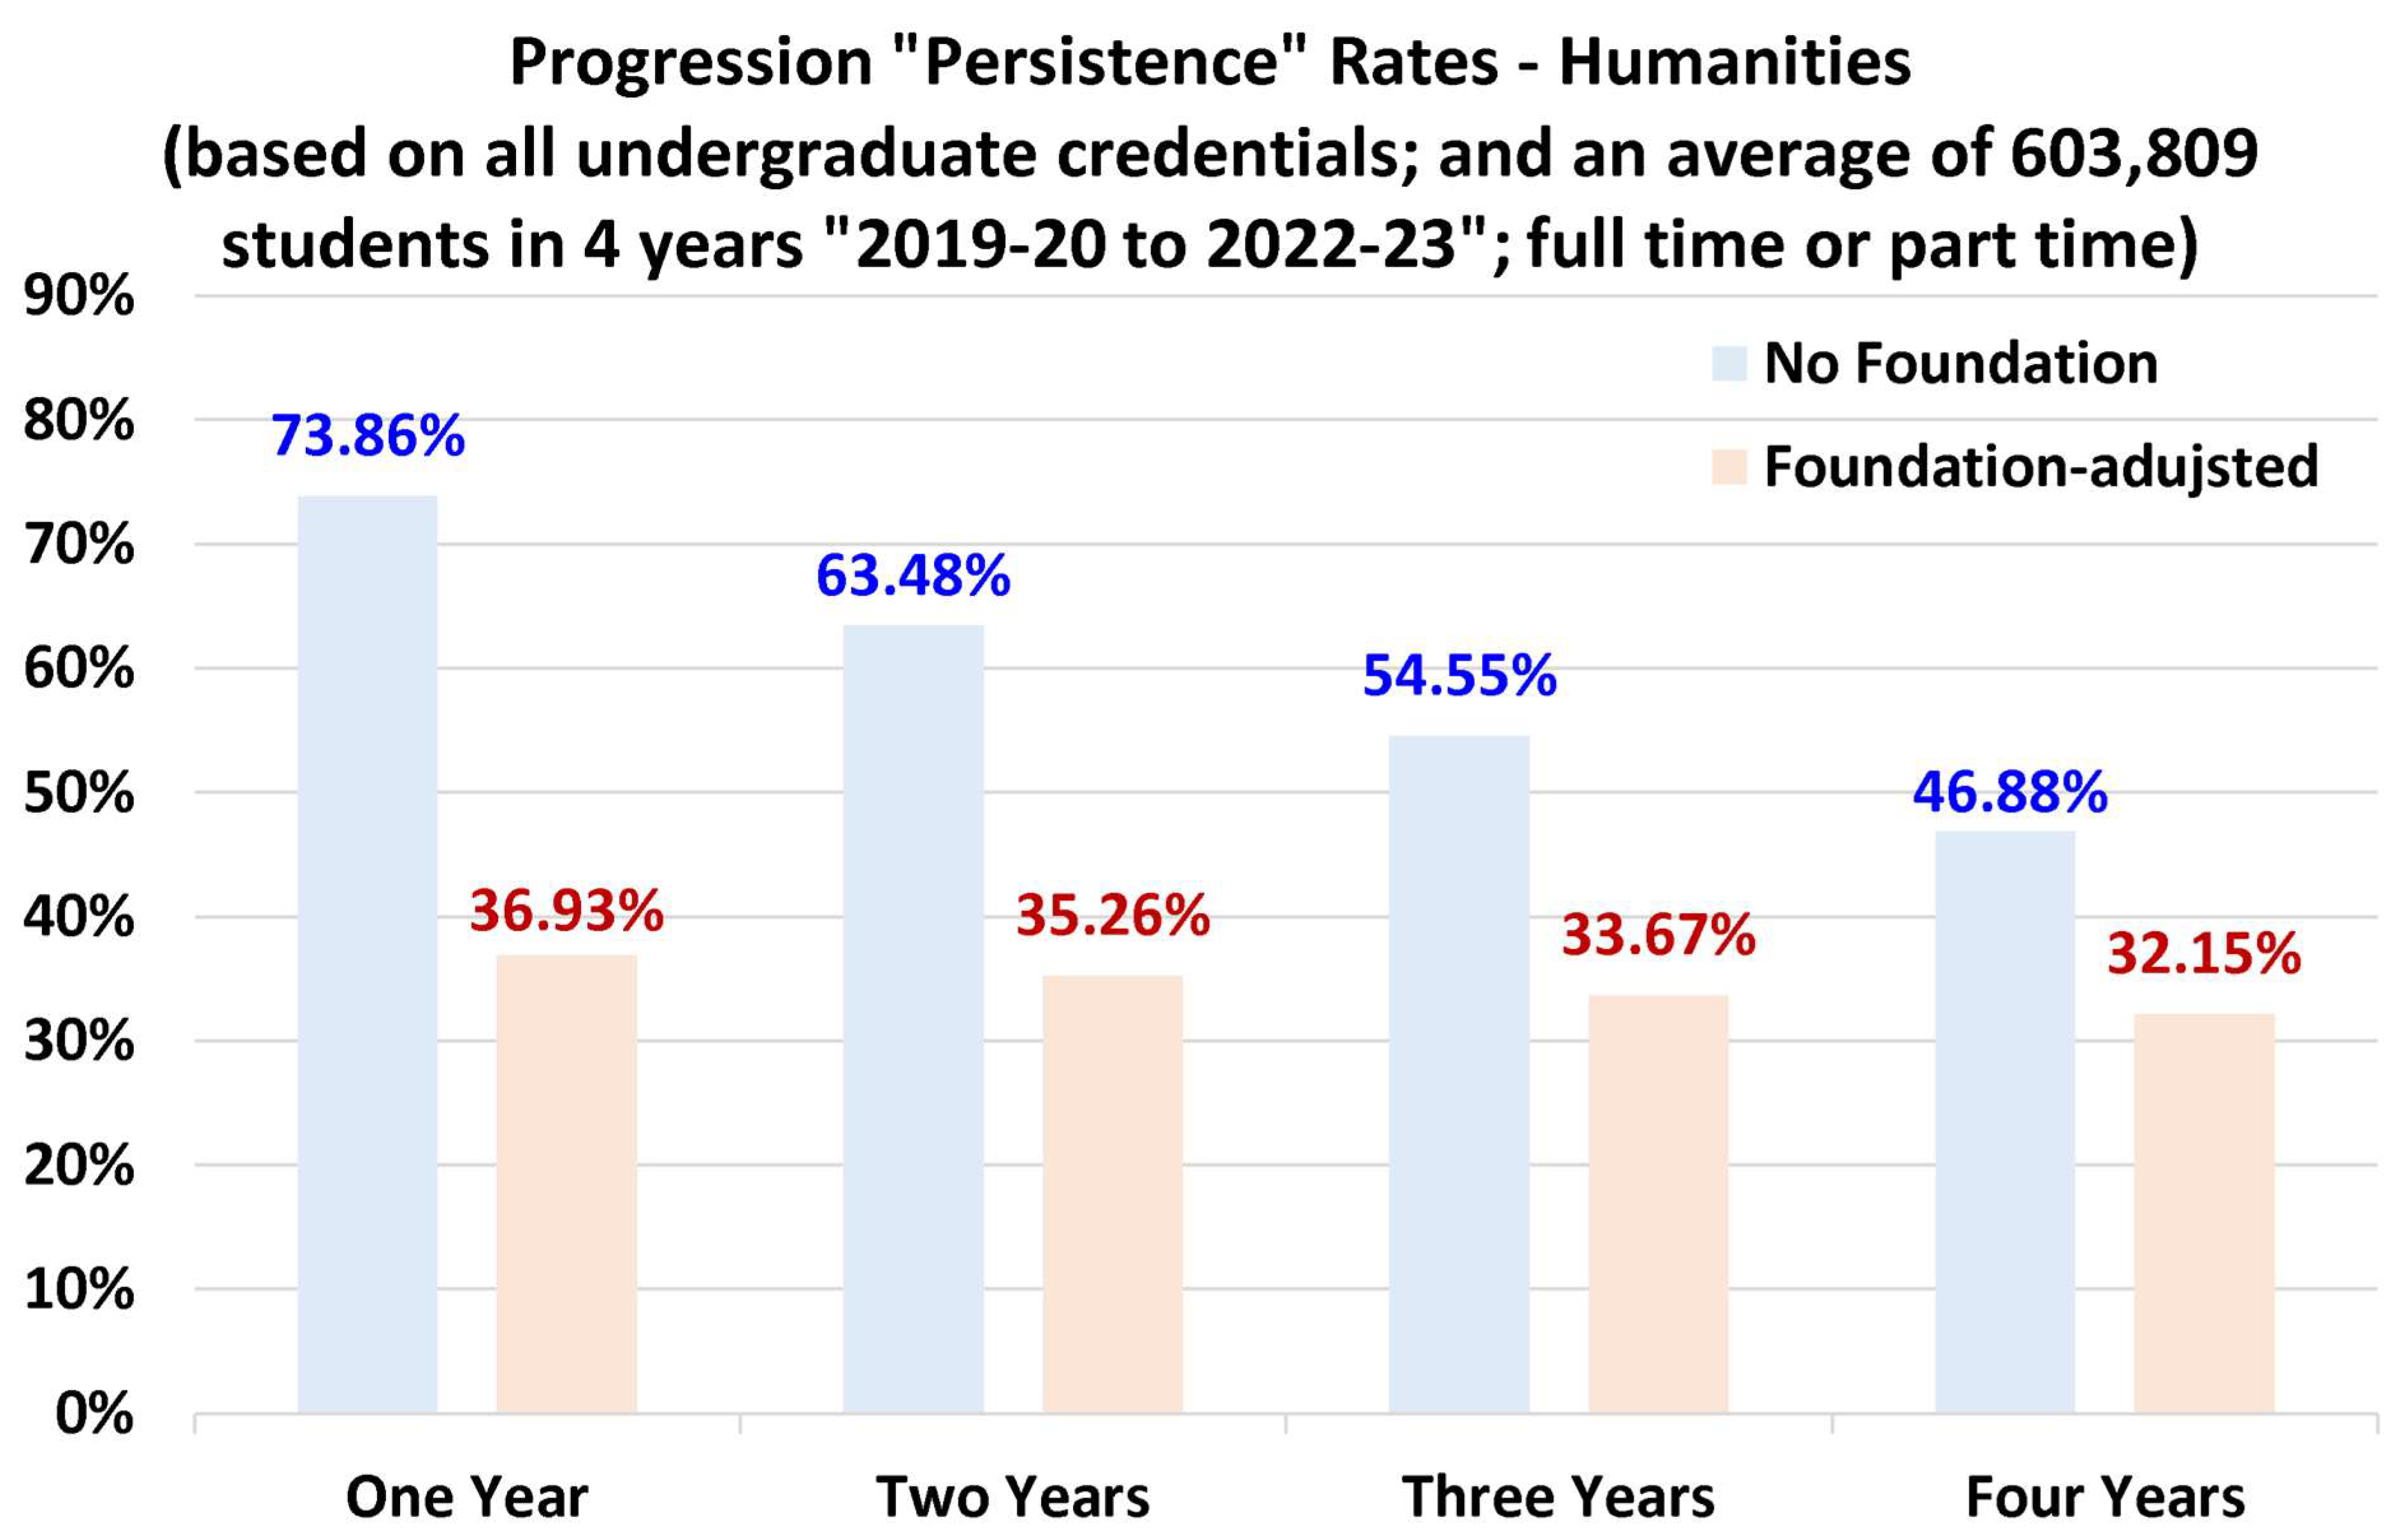
Figure 21.
Law progression rates.
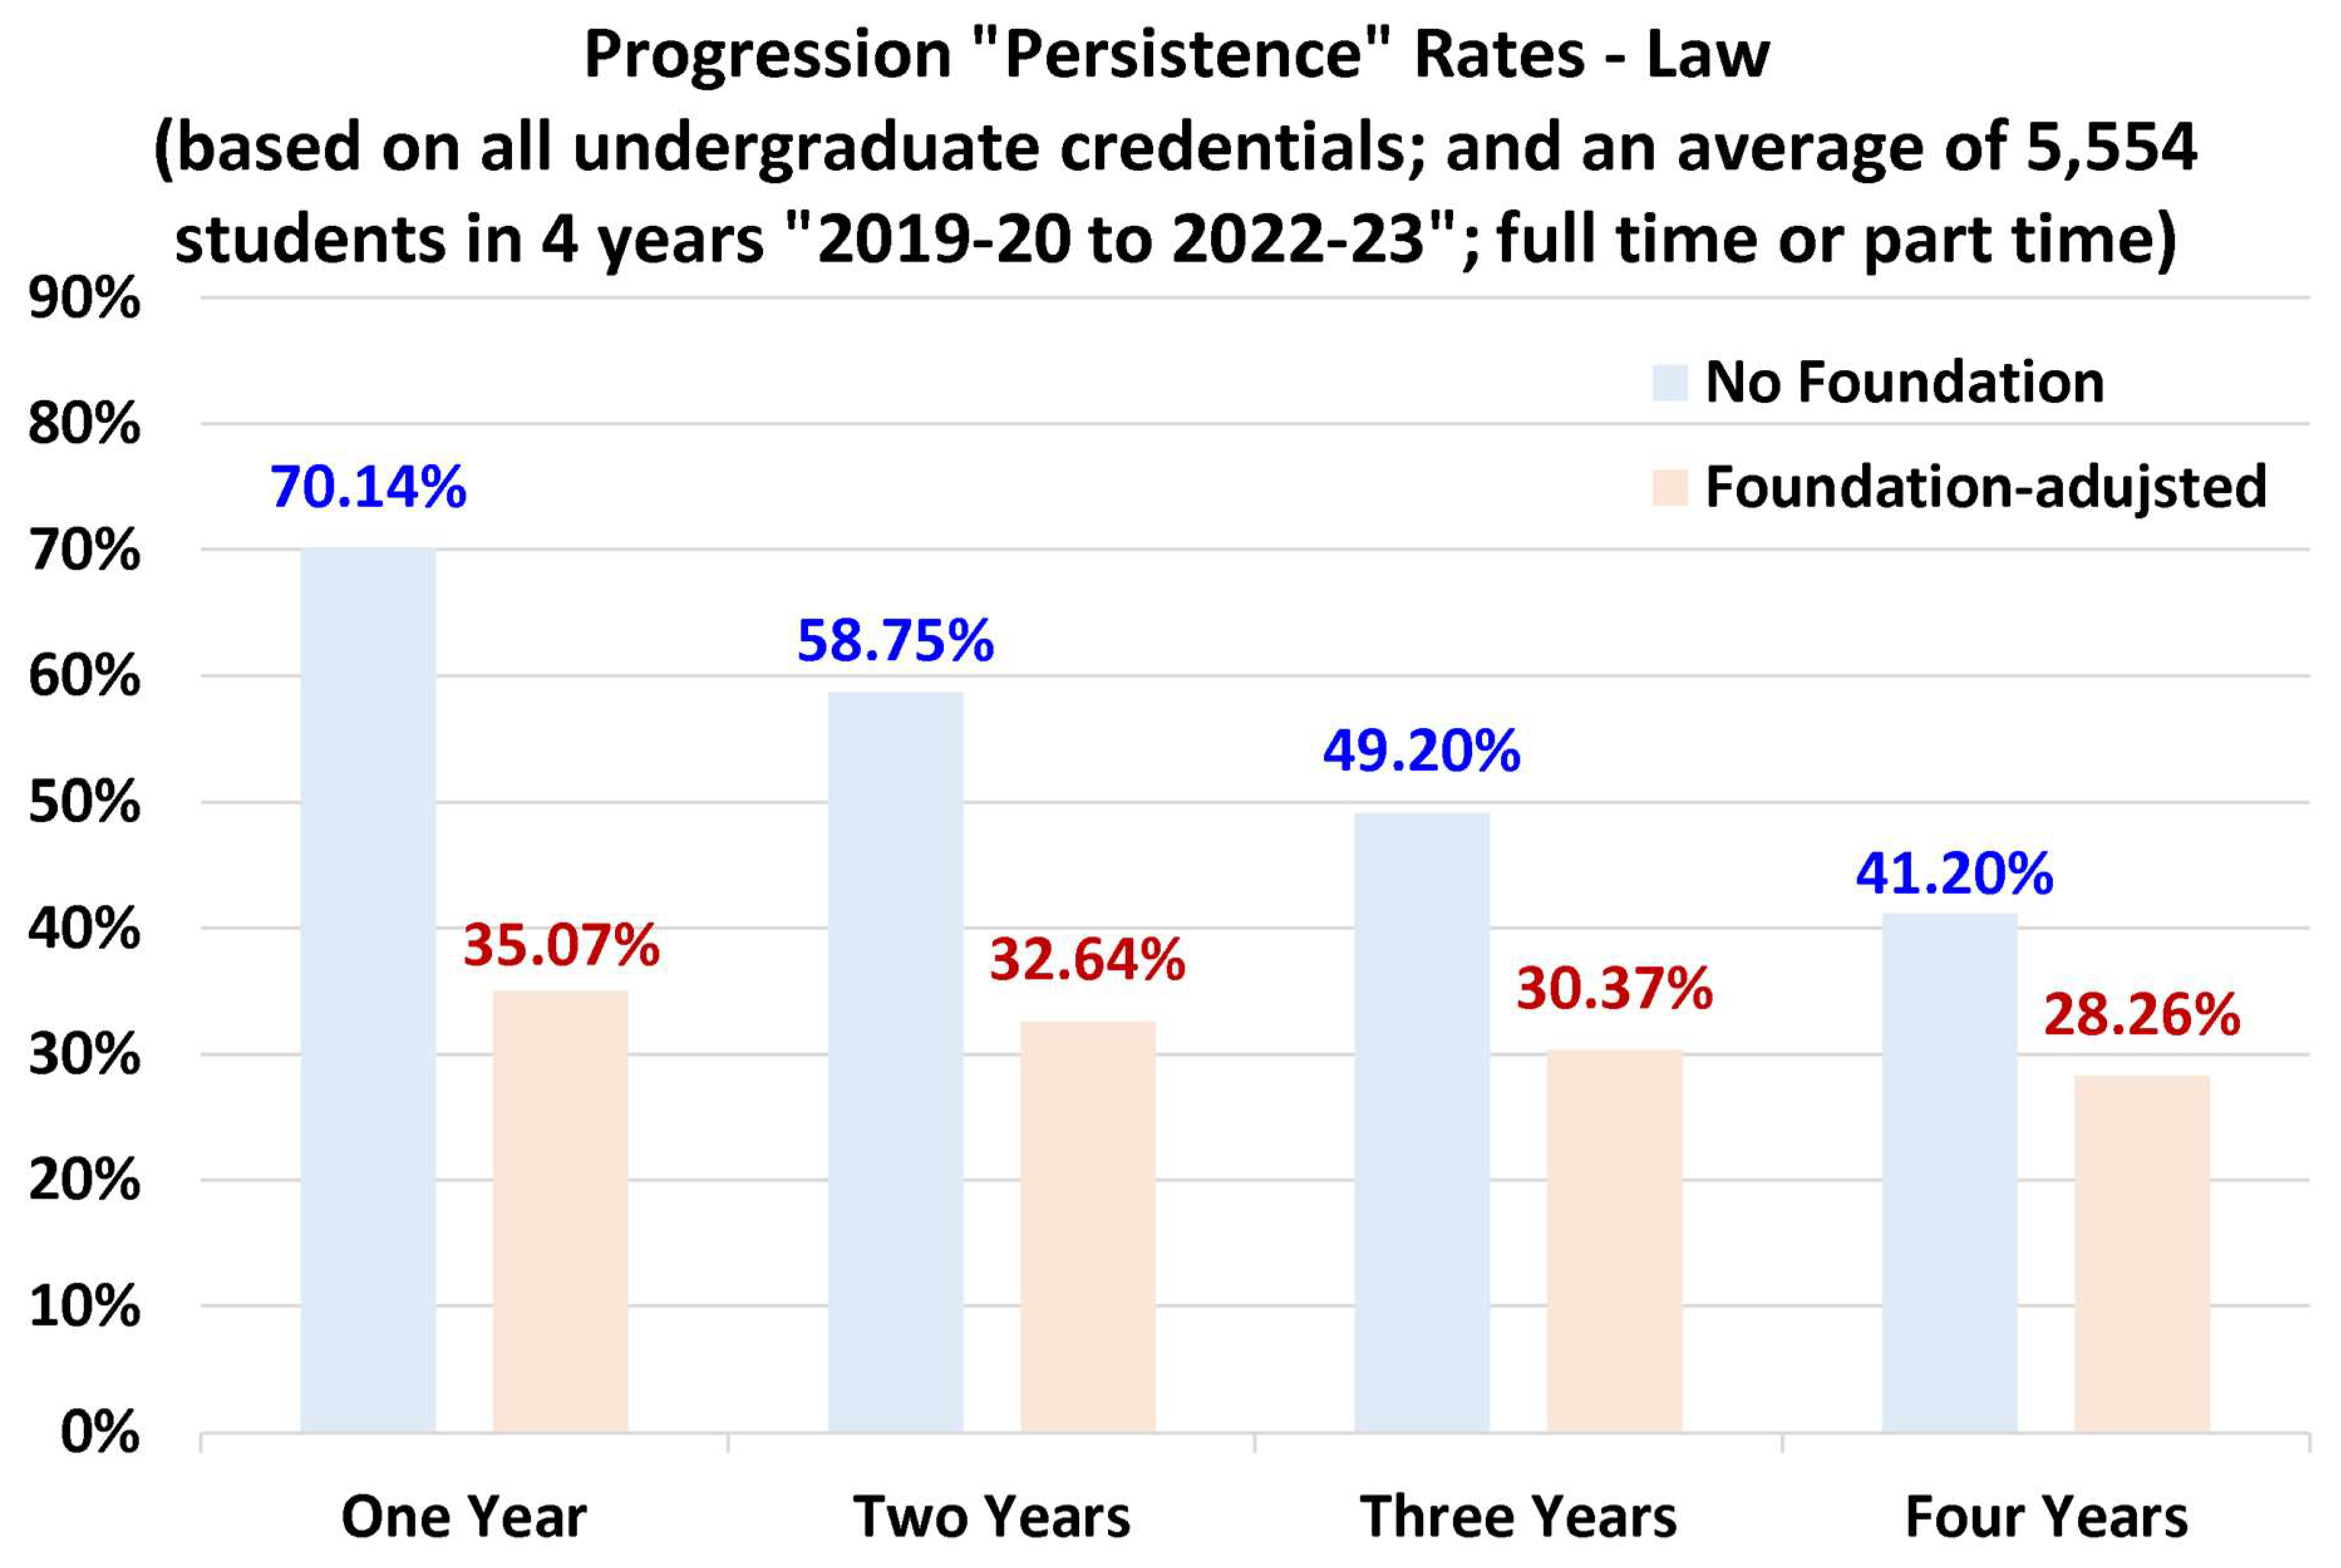
Figure 22.
Overall graduation rates.
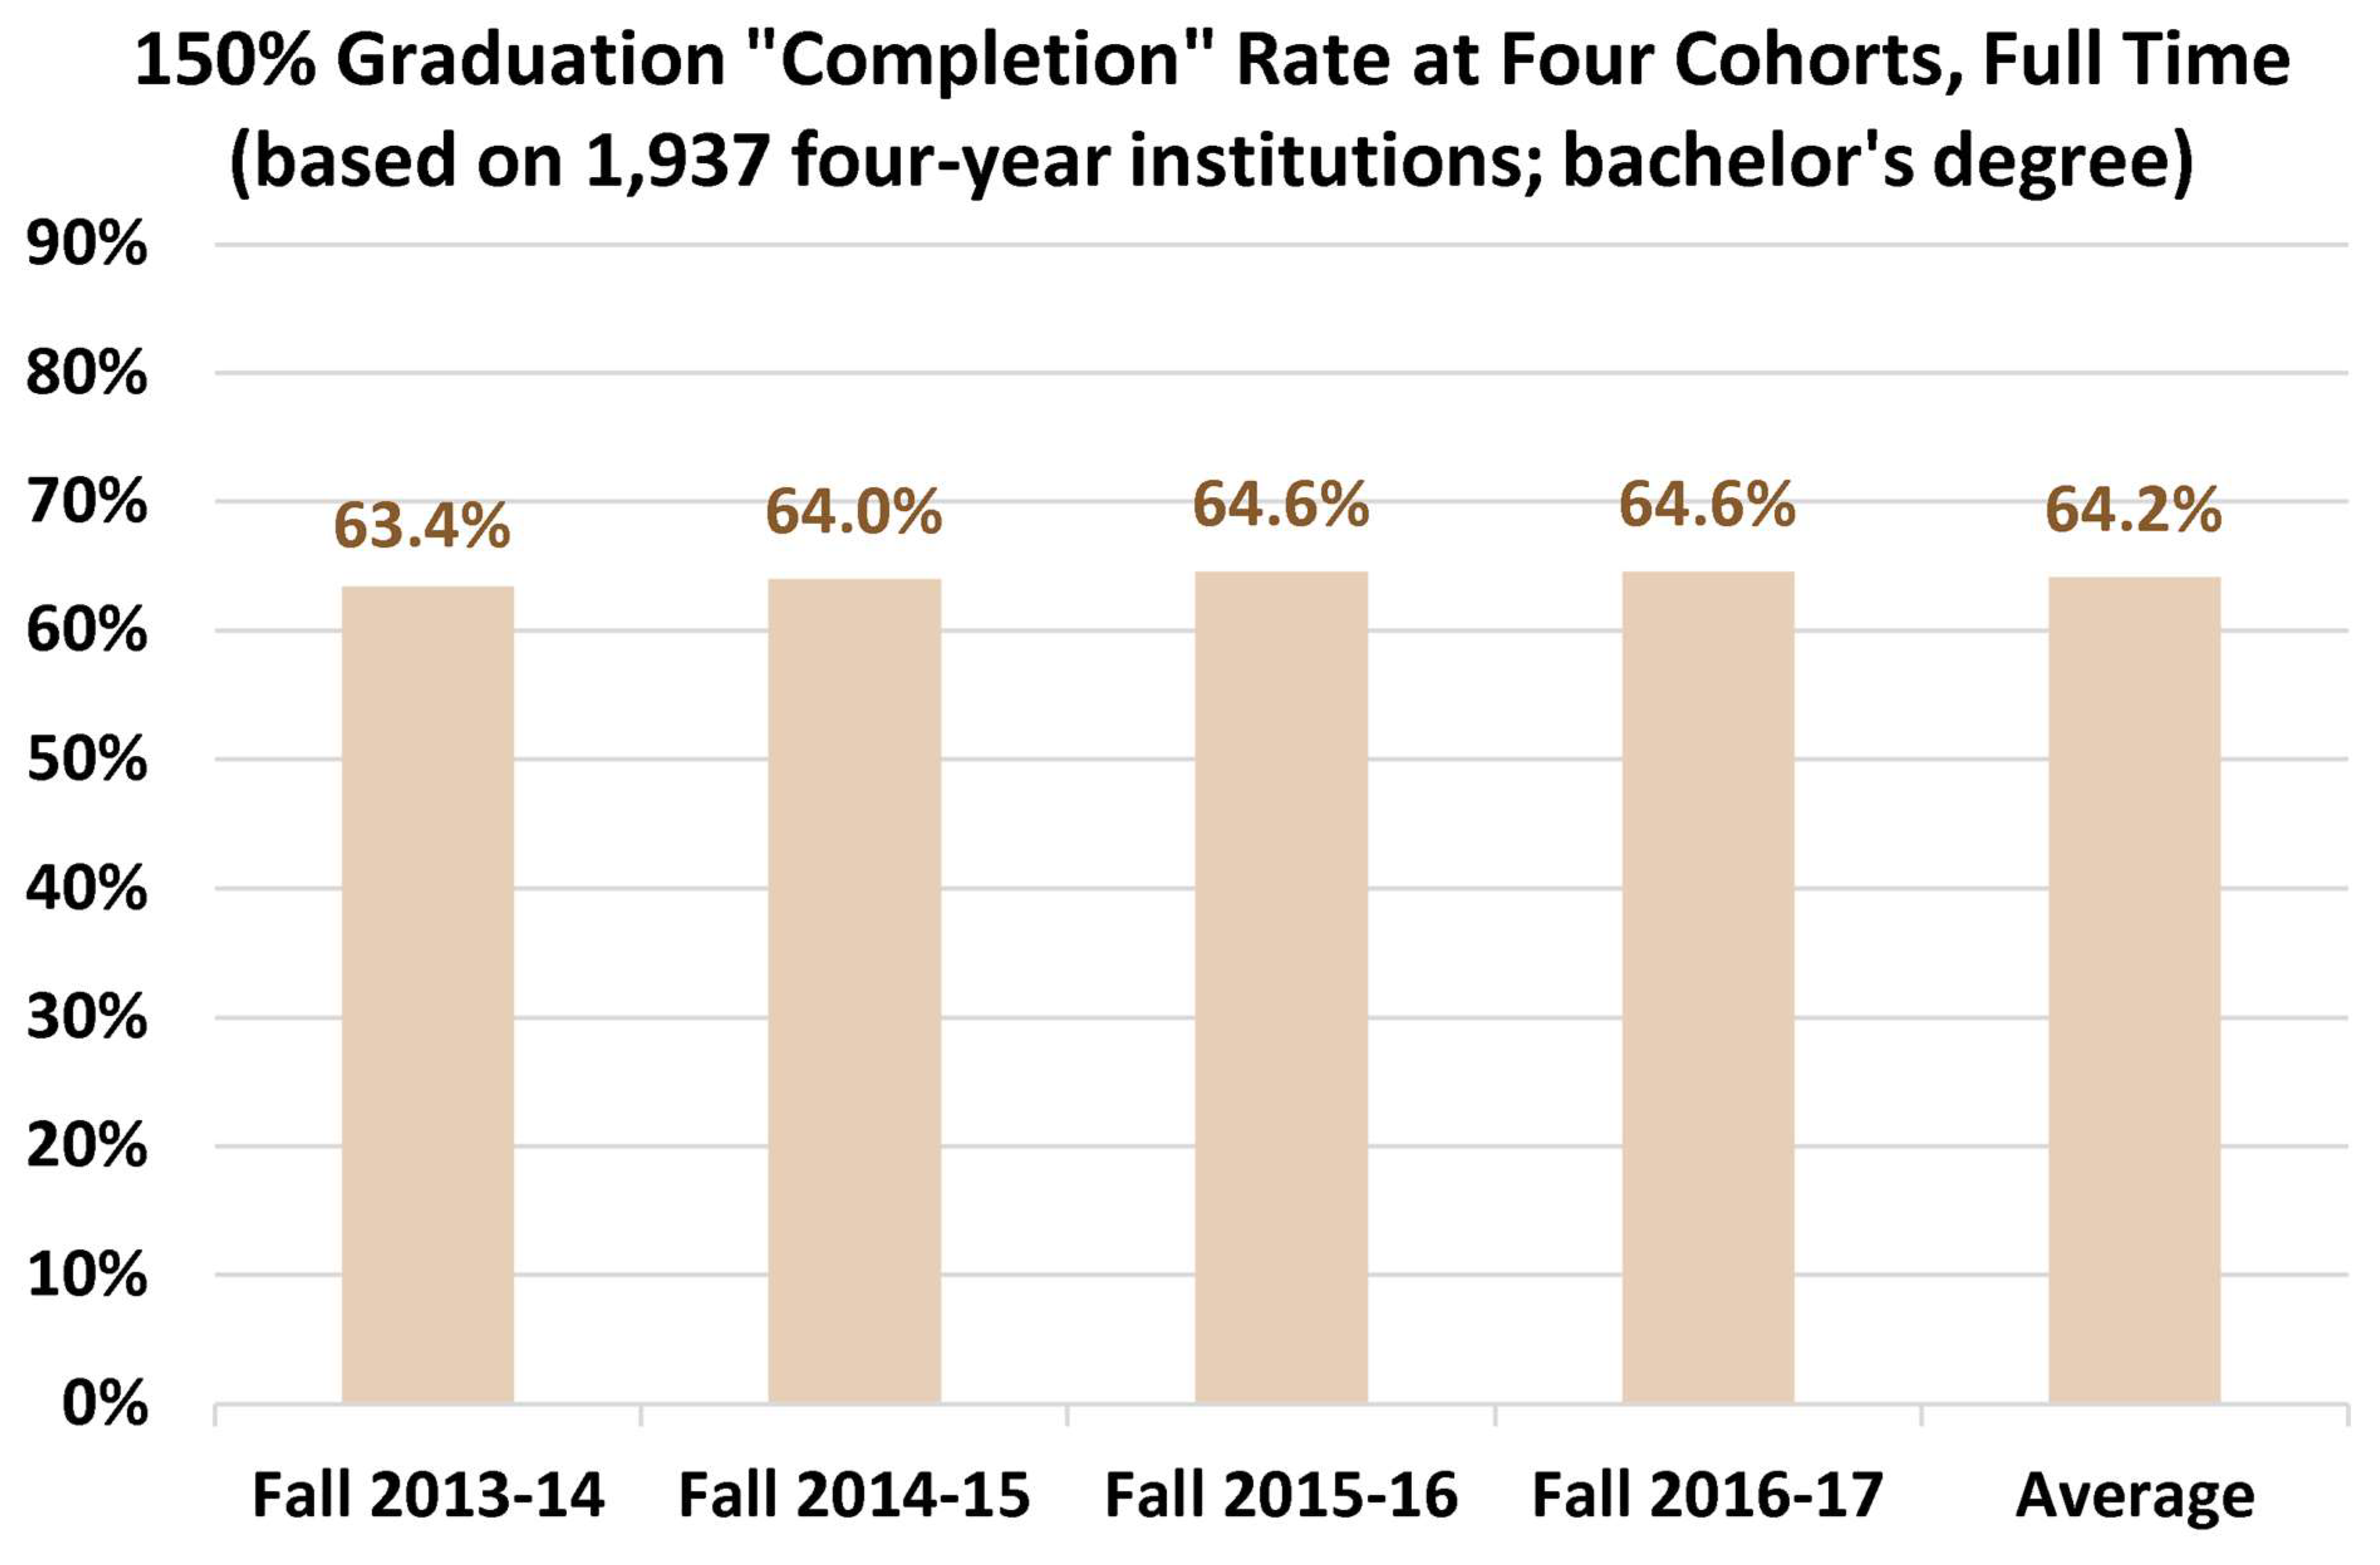
Figure 23.
Relation between retention rates and progression rates for the nine selected disciplines.
Figure 23.
Relation between retention rates and progression rates for the nine selected disciplines.
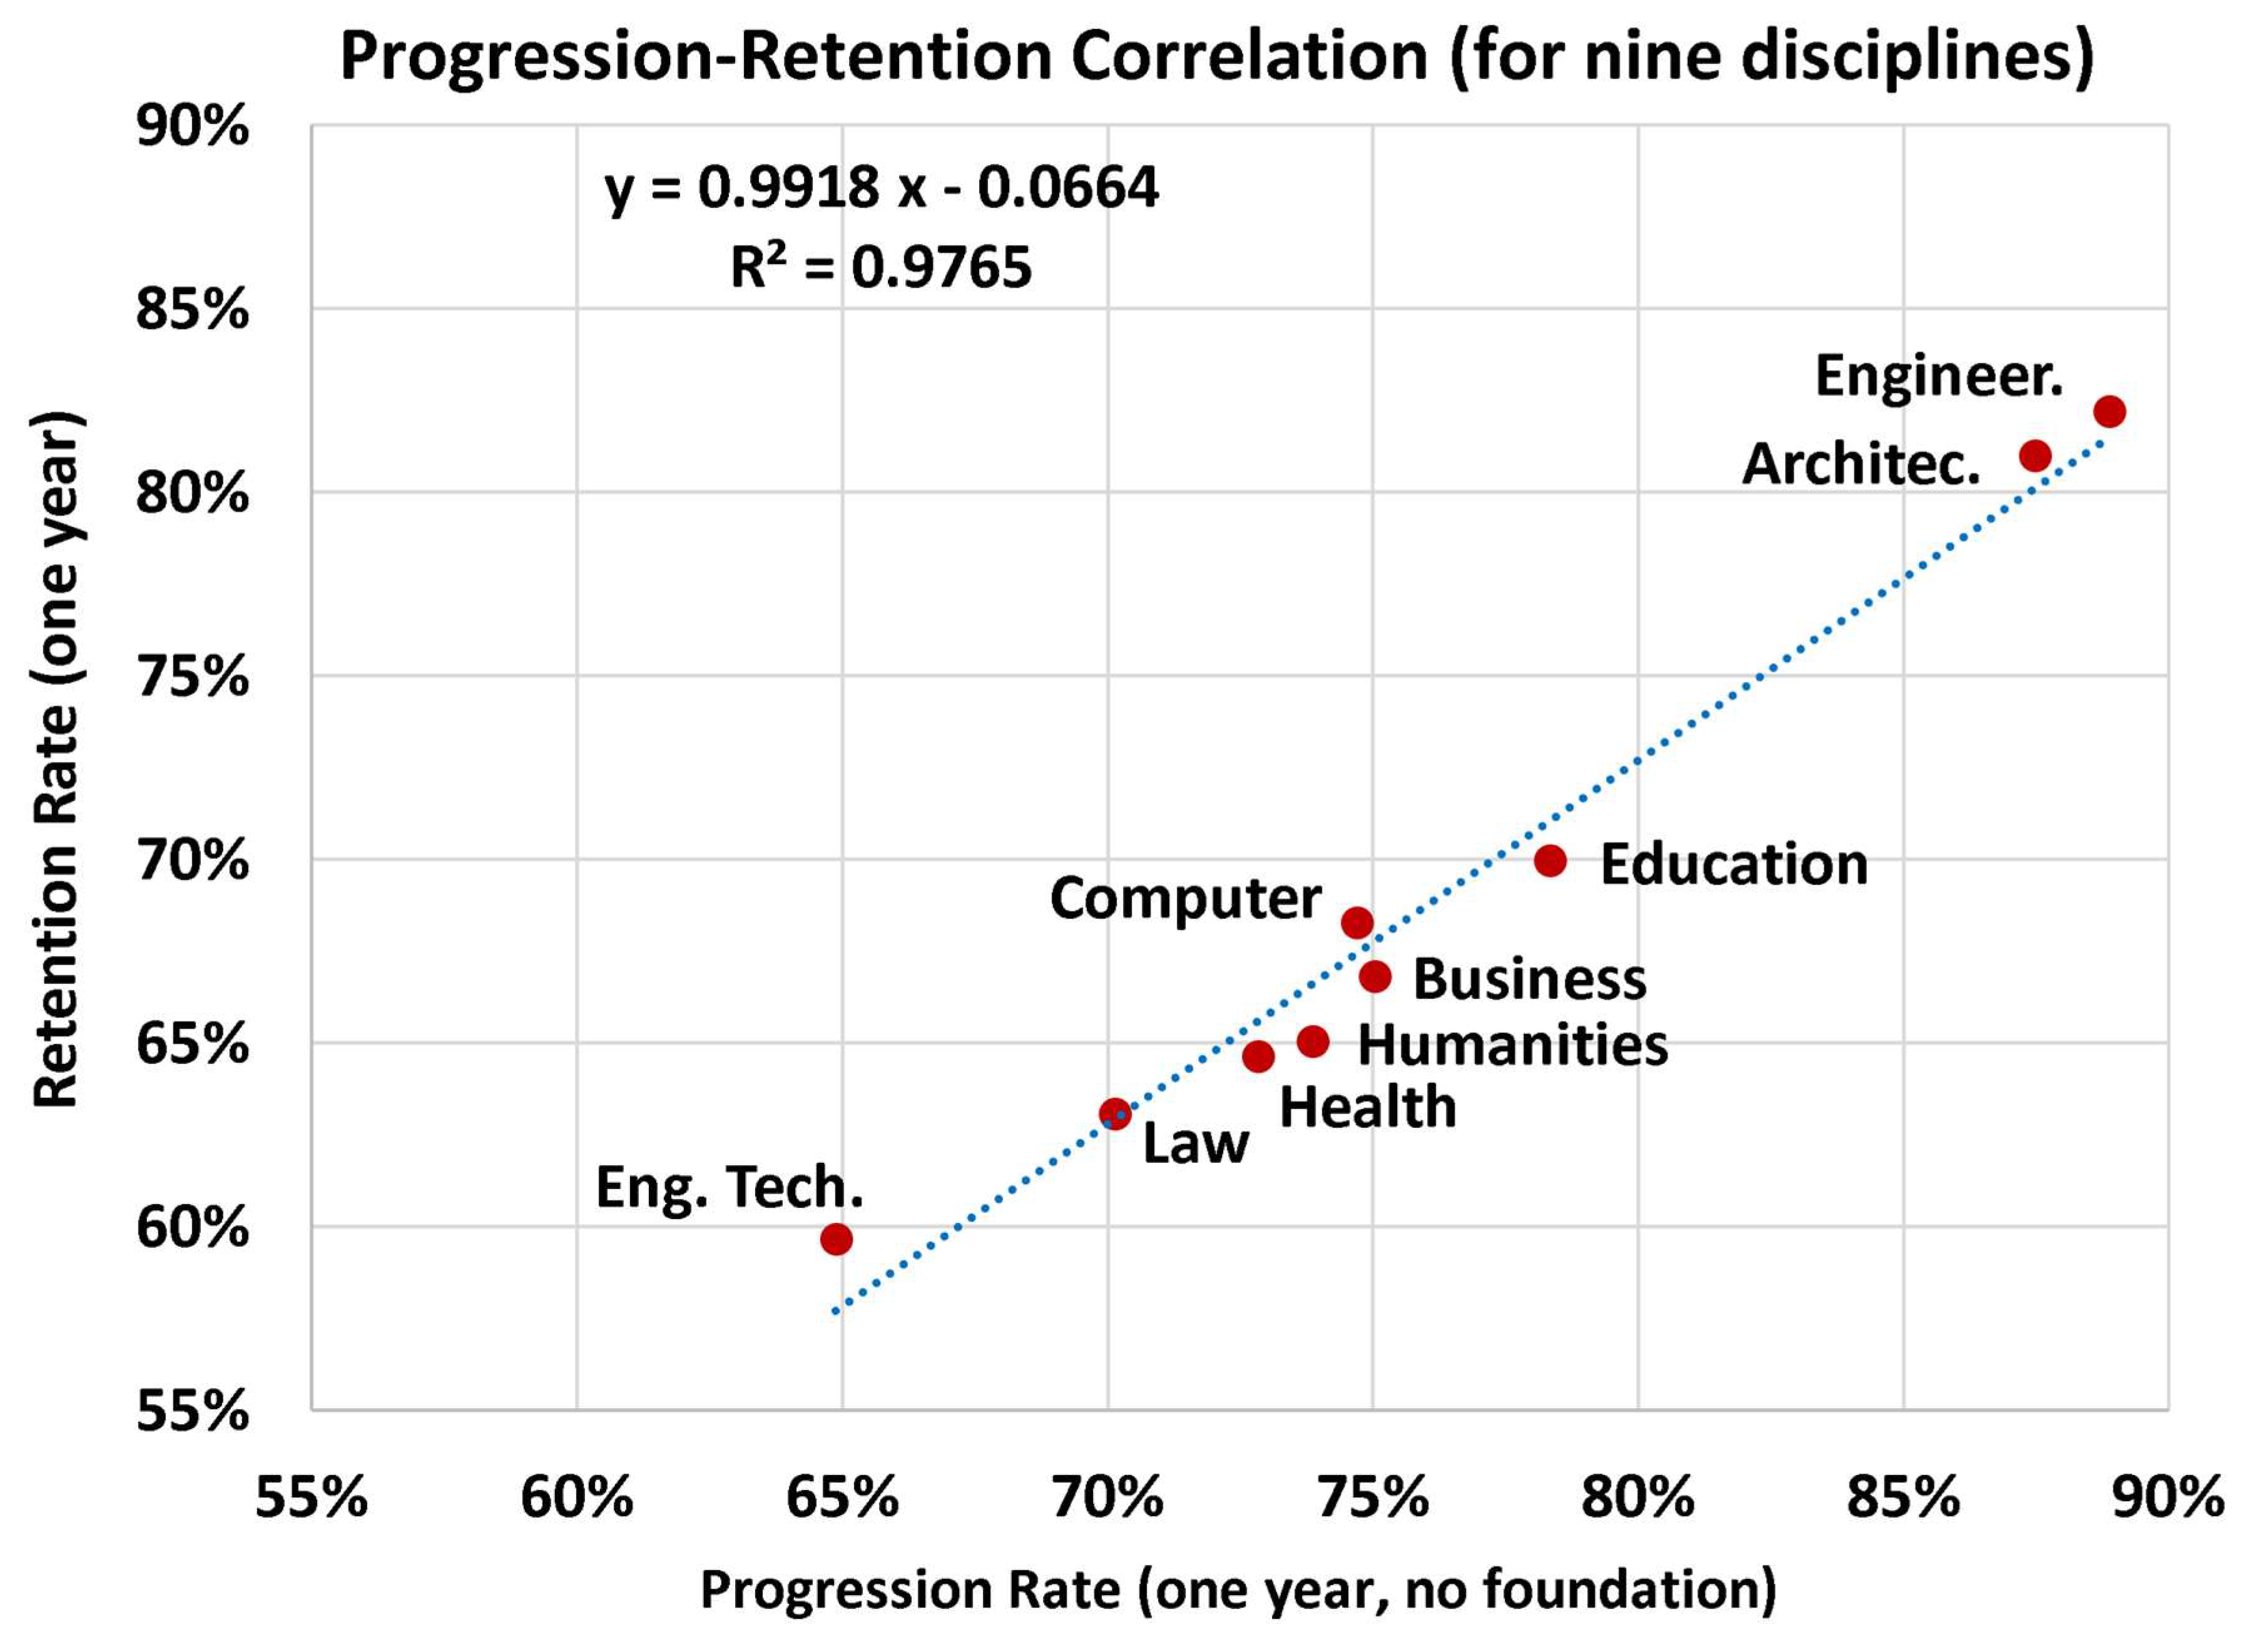

Table 1.
Some quality assurance performance elements in higher education.
| Performance element | Supporting references |
|---|---|
| Students-faculty ratio (SFR) | [12] |
| Academic accreditation (institutional or programmatic) | [13,14] |
| Students’ satisfaction (with either academic elements or non-academic elements) | [15] |
| Post-graduation job satisfaction (satisfaction of either working alumni or their employers) | [16] |
| Community engagement | [17,18] |
| Institutional ranking | [19,20] |
| Institutional or programmatic affiliations | [21,22] |
| Industrial collaboration | [23] |
| Interaction with professional bodies | [24] |
| Alignment with professional licensure | [25,26] |
| Students’ scores on third-party standardized tests | [27] |
| Practicum/fieldwork and other experiential learning modes | [28,29] |
| Entrepreneurial support | [30,31] |
| Participation in competitions or innovation exhibitions | [32,33,34] |
| Internationalization and student’s academic mobility | [35,36,37,38,39,40,41] |
| Diversity and students’ support | [42,43] |
| Attractive students’ activities and campus life | [44] |
| Focus on sustainability | [45,46,47,48,49,50,51,52,53,54] |
| Innovation | [55,56,57,58,59,60,61,62,63,64,65] |
| Addressing global and real challenges | [66,67,68,69,70,71,72,73,74,75,76,77,78,79] |
| Digitalization and inclusive educational technology | [80,81] |
| Retention rates (RR) | [82,83] |
| Attrition rates (AR) – also known as dropout rates (DR) or non-continuation rates (NCR) | [84,85] |
| Progression rates (PR) – also known as persistence rates | [86] |
| Graduation rates (GR) – also known as completion rates (CR) | [87] |
Table 2.
Curated raw data used in the current study.
| Data type | Source | Reference |
|---|---|---|
| Graduation | NCES | [161] |
| Retention | NCES | [162] |
| Progression* * The name of this metric in the source is “Persistence Rate”. Progression rates* (discipline-specific: Architecture, Business/Management, Computer/Information Science, Education, Engineering, Engineering Technology, Health/Clinical, Humanities, Law) * The name of this metric in the source is “Persistence Rate”. Retention rates (all undergraduate degrees combined) Retention rates (discipline-specific: Architecture, Business/Management, Computer/Information Science, Education, Engineering, Engineering Technology, Health/Clinical, Humanities, Law) |
NSC-RC | [163] |
Table 3.
CIP classification of disciplines selected for further discipline-specific analysis.
| Broad academic discipline | CIP (for USA use) | Reference | |
|---|---|---|---|
| Our assigned brief title | Full (official) title | ||
| Architecture | Architecture and Related Services | 04 | [164] |
| Business/Management | Business, Management, Marketing, and Related Support Services | 52 | [165] |
| Computer/Information Science | Computer and Information Sciences and Support Services | 11 | [166] |
| Education | Education | 13 | [167] |
| Engineering | Engineering | 14 | [168] |
| Engineering Technology | Engineering/Engineering-Related Technologies/Technicians | 15 | [169] |
| Health/Clinical | Health Professions and Related Programs | 51 | [170] |
| Humanities | Liberal Arts and Sciences, General Studies and Humanities | 24 | [171] |
| Law | Legal Professions and Studies | 22 | [172] |
Disclaimer/Publisher’s Note: The statements, opinions and data contained in all publications are solely those of the individual author(s) and contributor(s) and not of MDPI and/or the editor(s). MDPI and/or the editor(s) disclaim responsibility for any injury to people or property resulting from any ideas, methods, instructions or products referred to in the content. |
© 2025 by the authors. Licensee MDPI, Basel, Switzerland. This article is an open access article distributed under the terms and conditions of the Creative Commons Attribution (CC BY) license (http://creativecommons.org/licenses/by/4.0/).
Copyright: This open access article is published under a Creative Commons CC BY 4.0 license, which permit the free download, distribution, and reuse, provided that the author and preprint are cited in any reuse.


