
Submitted:
24 April 2025
Posted:
25 April 2025
You are already at the latest version
Abstract
Type 2 diabetes Mellitus (T2DM) is a growing global health concern, particularly in regions where rice is a dietary staple. Parboiled rice (PBR) has been proposed as a lower glycemic index alternative to white rice (WR), potentially improving postprandial glucose control. However, the effects of PBR on insulin sensitivity, β-cell function, and incretin hormone response remain unclear. This pilot study aimed to evaluate the effects of PBR compared to WR on postprandial glucose, insulin sensitivity, and incretin hormone responses in both healthy individuals and those with T2DM. Twenty subjects (n = 10 / group) participated in a randomized, crossover study. Blood samples were collected at fasting and postprandial time points after rice consumption to measure glucose, insulin, and GLP-1 levels. Insulin resistance / sensitivity and β-cell function were assessed using HOMA-IR, Matsuda Index (MI), and Disposition Index (DI). Fasting glucose and insulin levels were significantly higher in T2DM subjects compared to healthy individuals. PBR resulted in significantly lower glucose levels in healthy participants compared to WR. In T2DM subjects, PBR substantially reduced glucose levels but did not reach statistical significance. Insulin responses followed a similar pattern. GLP-1 responses were lower in T2DM subjects. MI and DI were significantly higher after PBR in healthy individuals compared to T2DM subjects suggesting improved insulin sensitivity. PBR demonstrated potential benefits in lowering postprandial glucose levels and improving insulin sensitivity. Further research with a larger sample size is needed to confirm these findings and explore the mechanisms underlying PBR’s effects in T2DM management. This study was supported by the Kuwait University research grant, Project # YF03/18.
Keywords:
White rice
; Parboiled rice
; Glycemic response
; insulin sensitivity
; Insulin resistance
; GLP-1
; Healthy individuals
; Type 2 Diabetic individuals
1. Introduction
Insulin resistance is a hallmark of Type 2 Diabetes Mellitus (T2DM), a debilitating metabolic disorder that is rapidly increasing worldwide, particularly in developing countries. In Kuwait, the prevalence of T2D is 23.1%, the second highest globally after Saudi Arabia (23.9%) [1]. According to the American Diabetes Association (ADA), maintaining blood glucose levels within the normal range is a key goal in diabetes management. This is primarily achieved through lifestyle modifications, including diet and medication [2,3]. Also, frequent elevated blood glucose excursions in healthy individuals lead to increased HbA1c level, which is a known risk factor of developing type 2 diabetes [4].
Blood glucose regulation relies on a dynamic balance between insulin secretion from pancreatic β-cells and glucose uptake by peripheral tissues. Hyperglycemia can result from either reduced insulin secretion due to β-cell dysfunction or insulin resistance (IR), which impairs glucose uptake [5]. If left uncontrolled, chronic hyperglycemia can lead to macrovascular and microvascular complications, including retinopathy, nephropathy, and neuropathy [6]. Despite receiving hypoglycemic treatment, many individuals with T2DM struggle to maintain normal blood glucose levels. This may be due to the inability of these medications to specifically target either insulin resistance or β-cell dysfunction.
Insulin resistance is commonly assessed using the Homeostasis Model of Assessment for Insulin Resistance (HOMA-IR), calculated from fasting glucose and insulin levels [7]. While HOMA-IR is widely used, it primarily reflects hepatic insulin resistance and may underestimate IR at the peripheral tissue level [8]. In contrast, β-cell function is assessed using HOMA-B, which evaluates the pancreatic β-cells’ ability to compensate for IR [9]. Another key metric for β-cell function is the disposition index (DI), which reflects both insulin secretion and glucose uptake efficiency [10]. A lower DI indicates reduced β-cell function and an inability to compensate for IR [11]. The Matsuda Index (MI) is a tool that measures insulin sensitivity, incorporating both fasting and postprandial glucose and insulin levels following an oral glucose challenge [12]. Unlike HOMA-IR, MI provides a more comprehensive measure of whole-body insulin sensitivity by accounting for both hepatic glucose production and peripheral glucose uptake.
Diet plays a crucial role in postprandial glucose regulation. The incretin hormones, glucose-dependent insulinotropic polypeptide (GIP) and glucagon-like peptide-1 (GLP-1), enhance insulin secretion in response to carbohydrate intake [13,14]. GIP is primarily secreted by enteroendocrine K-cells in the duodenum and jejunum, while GLP-1 is released from L-cells in the ileum [13]. These hormones bind to receptors on pancreatic β-cells, amplifying insulin secretion in a glucose-dependent manner [13,15]. In healthy individuals, incretin hormones contribute to 50-70% of postprandial insulin secretion [16]. However, individuals with T2DM often exhibit a diminished incretin response, contributing to hyperglycemia [14,17], though the exact mechanisms remain unclear.
The rising prevalence of T2DM is particularly concerning in populations where rice is a dietary staple. A meta-analysis by Hu et al., [18] found that high white rice (WR) consumption was associated with an increased risk of T2DM, particularly in Asian populations. WR, commonly known as polished rice, consists primarily of starch and significantly contributes to dietary glycemic load [19]. Parboiling rice is a pre-milling process in which paddy rice is soaked in hot water, steamed, and dried before milling. This process reduces the glycemic index by inducing starch gelatinization and retrogradation [20]. As a result, parboiled rice (PBR) has a lower glycemic index and glycemic load due to its higher fibre content and increased resistant starch [21].
A previous study by Hamad et al. [22] demonstrated that PBR helped reduce postprandial blood glucose spikes compared to WR in both healthy individuals and those with T2D. However, the underlying mechanisms were not explored, as insulin and incretin hormone responses were not assessed.
The current study aimed to determine whether hyperglycemia following rice consumption results from insulin deficiency or insulin resistance. Specifically, it investigates whether PBR enhances insulin sensitivity by improving β-cell function, increasing glucose uptake by peripheral tissues, or stimulating GLP-1 secretion in individuals with and without T2D.
A secondary objective was to assess whether venous and capillary blood glucose concentrations differ between healthy individuals and those with T2DM and whether rice type influences these glucose homeostasis parameters.
2. Materials and Methods
2.1. Study Design and Test Rice
This study employed a crossover, single-blinded experimental design. Two types of rice were tested: traditional long-grain white rice (Daawat, LT Foods Ltd., New Delhi, India) and parboiled rice (Uncle Ben’s, Mars, Inc., Houston, TX), both purchased from a local market. Participants consumed either parboiled rice or white rice, ensuring an equal amount of available carbohydrates, following an overnight fast of 8 to 10 hours, with a washout period of at least one week between test days. The rice was consumed within 10–12 minutes along with 250 mL of water to facilitate swallowing. Physical activity was restricted during the 120-minute postprandial period.
Rice samples were prepared in accordance with international guidelines for food safety and handling [23]. A weighed amount of rice, corresponding to 50 g of available carbohydrates (total carbohydrates minus dietary fiber), was used for testing. This was equivalent to 62 g of uncooked white rice cooked with 120 mL of water and 64 g of uncooked parboiled rice cooked with 210 mL of water. The rice was prepared using a rice cooker (Westinghouse Rice Cooker WST3007 ZE, Columbia, MO), purchased from a local market, following the manufacturer’s cooking instructions. To enhance palatability, each serving included 2.5 g of butter and ½ teaspoon of salt. The study was approved by the Ethics Committee of the Health Science Center, Kuwait, Reference #: VDR/EC 13454, dated 18/04/2018, and the Ministry of Health, Kuwait, Reference #: MOH 4090, dated 12/07/2018. Written informed consent was obtained from all participants.
2.2. Recruitment of Subjects
Participants who met the eligibility criteria were recruited from Ahmadi Hospital, Kuwait. The sample size was determined based on prior blood GLP-1 measurements, with an α-error of 0.05 and a β-error of 0.20, resulting in a required minimum of seven subjects per group [24].
Inclusion and exclusion criteria:
- Healthy group: Participants aged ≥ 21 years with a body mass index (BMI) within the normal range (18.5–24.9 kg/m²) were included. Exclusion criteria included pregnancy, chronic disorders, use of hypoglycemic agents, smoking, and participation in high-intensity athletic activities.
- T2DM group: Participants aged ≥ 21 years with stable renal function for at least six months and a stable dose of oral hypoglycemic agents for at least three months were included. Exclusion criteria included pregnancy, end-stage diabetes complications, multiple insulin dosages, recent T2DM diagnosis, and the use of GLP-1-based oral hypoglycemic medications (specifically DPP-IV inhibitors, such as sitagliptin, saxagliptin, linagliptin, and others, which prolong endogenous GLP-1 activity by preventing its degradation).
2.3. Measurements
Anthropometric and physiological measurements, including height, weight, blood pressure, and HbA1c, were recorded for all participants. Weight and height were measured using a scale with 0.1 kg accuracy (SECA 284, GmbH & Co., Hamburg, Germany) and a stadiometer (Seca) with 0.1 cm accuracy, respectively. Brachial blood pressure (BP) was measured in duplicate using a Dinamap V100 BP monitor. Venous catheters were placed by a phlebotomist for blood sample collection from the forearm using specific vacutainers (Becton-Dickinson, B-D).
Serum insulin and plasma total GLP-1 concentrations were measured at fasting and at 15, 30, 60, and 120 minutes postprandially. Venous blood glucose was assessed at the same time points, with additional measurements at 45 and 90 minutes. Capillary blood glucose was measured via finger-prick using a handheld glucometer (OneTouch Ultra, LifeScan, Inc., Milpitas, CA) and a Monojector Lancet Device (Covidien, Dublin, Ireland) at fasting (time 0) and at 15, 30, 45, 60, 90, and 120 minutes postprandially, following previously reported procedures [22].
2.4. Sample Analysis
At all time points, blood samples were kept on ice and centrifuged immediately. The separated serum was aliquoted into three 1.5 ml tubes and stored at -80°C until analysis. For GLP-1 analysis, blood samples were collected in BD P800 Blood Collection Tubes (Becton-Dickinson), containing a dipeptidyl peptidase-4 inhibitor to prevent GLP-1 degradation.
- Insulin analysis: Performed using the Diametra Insulin ELISA kit (DCM076-8 – Ed 09/2018, REF DKO076).
- GLP-1 analysis: Conducted in duplicate using the GLP-1 Total ELISA kit (96-well plate assay, Cat.# EZGLP1T-36K, EZGLP1T-36BK).
- Plasma glucose: Assessed using the Beckman Coulter Oxygen Electrode, a SYNCHRON system in the biochemical analytical lab of the Kuwait Ministry of Health. A certified technician, blinded to participant identities, conducted the analysis.
-
Insulin resistance (HOMA-IR) and β-cell function (HOMA-B) were calculated using the homeostatic model assessment (HOMA):
-
Matsuda Index (MI), which assesses insulin sensitivity during an oral glucose tolerance test (OGTT), was calculated using glucose and insulin data at 0, 30, 60, and 120 minutes:
- o
- MI = 10,000 / √(fasting glucose × fasting insulin × mean glucose × mean insulin) [12].
-
The Disposition Index (DI), which evaluates β-cell compensation for insulin resistance, was computed as:
- o
- DI = [(postprandial insulin - basal insulin) / (postprandial glucose - basal glucose) × 18] × MI [10].
-
Body Mass Index (BMI) was calculated as:
- o
- BMI = weight (kg) / height (m²)
- HbA1c was measured using a Tosoh Automated Glycohemoglobin Analyzer HLC-723G8.
- Incremental areas under the curve (IAUC) for glucose, insulin, and GLP-1 were calculated using the trapezoidal rule, excluding areas below baseline [25].
2.5. Statistical Analysis
Statistical analyses were performed using SPSS v27 and GraphPad Prism 9. Data were analyzed using analysis of variance (ANOVA) to assess the effects of time and treatment (rice type) on postprandial blood glucose, insulin, and GLP-1 concentrations in both healthy individuals and those with T2D.
Due to unequal sample sizes and variances between groups, non-parametric tests were applied. When comparisons involved more than two groups (e.g., HOMA-B, DI, MI, AUCs for insulin, and GLP-1), the Kruskal-Wallis test of significance was used. Non-parametric tests were used for comparing fasting glucose, insulin, and HOMA-IR between the two groups before rice consumption. Also, postprandial glucose responses and AUCs (0–120 min) were compared between rice types using the Mann-Whitney U test. Statistical significance was set at P ≤ 0.05.
3. Results
3.1. Subjects
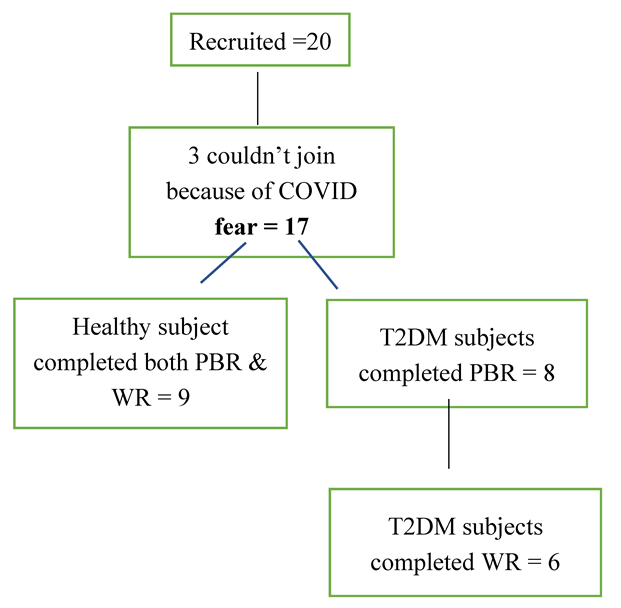
Due to the COVID-19 pandemic, among the total 20 subjects (n = 10 per group) recruited, 9 healthy participants completed both sessions, parboiled rice (PBH) and white rice (WRH), while in the T2DM group, 8 participants completed the PBR (PBD) session, and 6 completed the WR (WRD) session. Detailed information is provided in the flow chart.
Flow Chart: Subjects’ Recruitment and Completion of the Study
3.2. Demographic Characteristics
The demographic characteristics of the study groups are summarized in Table 1. Healthy volunteers were younger and had BMI values within the normal range, whereas participants with T2DM were older and had BMI values in the overweight to obese range. As expected, HbA1c levels differed between the groups, while blood pressure remained within the normal range for both.
3.3. Biochemical Parameters Between the Two Groups after Consumption of the Test Rice
Fasting values
Fasting glucose and fasting insulin were significantly higher among the subjects with T2DM than healthy volunteers. The HOMA-IR calculated from the fasting glucose and insulin produced was also significantly higher in T2DM, as shown in Figure 1.
Postprandial Glucose Responses
Blood Glucose Concentrations After WR and PBR (Venous and FP Methods)
The mean fasting capillary blood glucose level was significantly lower in healthy subjects (4.91 ± 0.41 mmol/L) compared to T2DM subjects (9.01 ± 1.75 mmol/L). In healthy participants, blood glucose peaked at 30 minutes and gradually declined over 120 minutes. There was no difference in glucose concentrations between WR and PBR at 15 and 30 minutes during the absorptive phase. However, in the disposal phase, where glucose is taken up by peripheral tissues, PBR exhibited a faster glucose clearance rate than WR, resulting in lower glucose levels at 60, 90, and 120 minutes in both groups.
Among healthy subjects, the greater glucose disposal rate after PBR decreased glucose concentrations of 0.6, 0.6, 0.82, 0.82, and 0.92 mmol/L at 30, 45, 60, 90, and 120 minutes, respectively. The differences were significant only at 60, 90, and 120 minutes. The AUC for PBR (177.86 ± 50.02 mmol/Lmin) was significantly lower than for WR (245.56 ± 87.78 mmol/Lmin, p = 0.047). In T2DM subjects, the glucose concentration curves followed a similar trend, but a higher reduction in glucose concentration of 1.19, 1.48, 0.48, 1.12, and 1.55 mmol/L at 30, 45, 60, 90, and 120 minutes, respectively, after PBR compared to WR. However, the differences did not reach statistical significance at any time point. The glucose AUC for PBR (187.38 ± 75.87 mmol/Lmin) was lower than for WR (278.83 ± 84.28 mmol/Lmin), with a trend in statistical significance (p = 0.051).
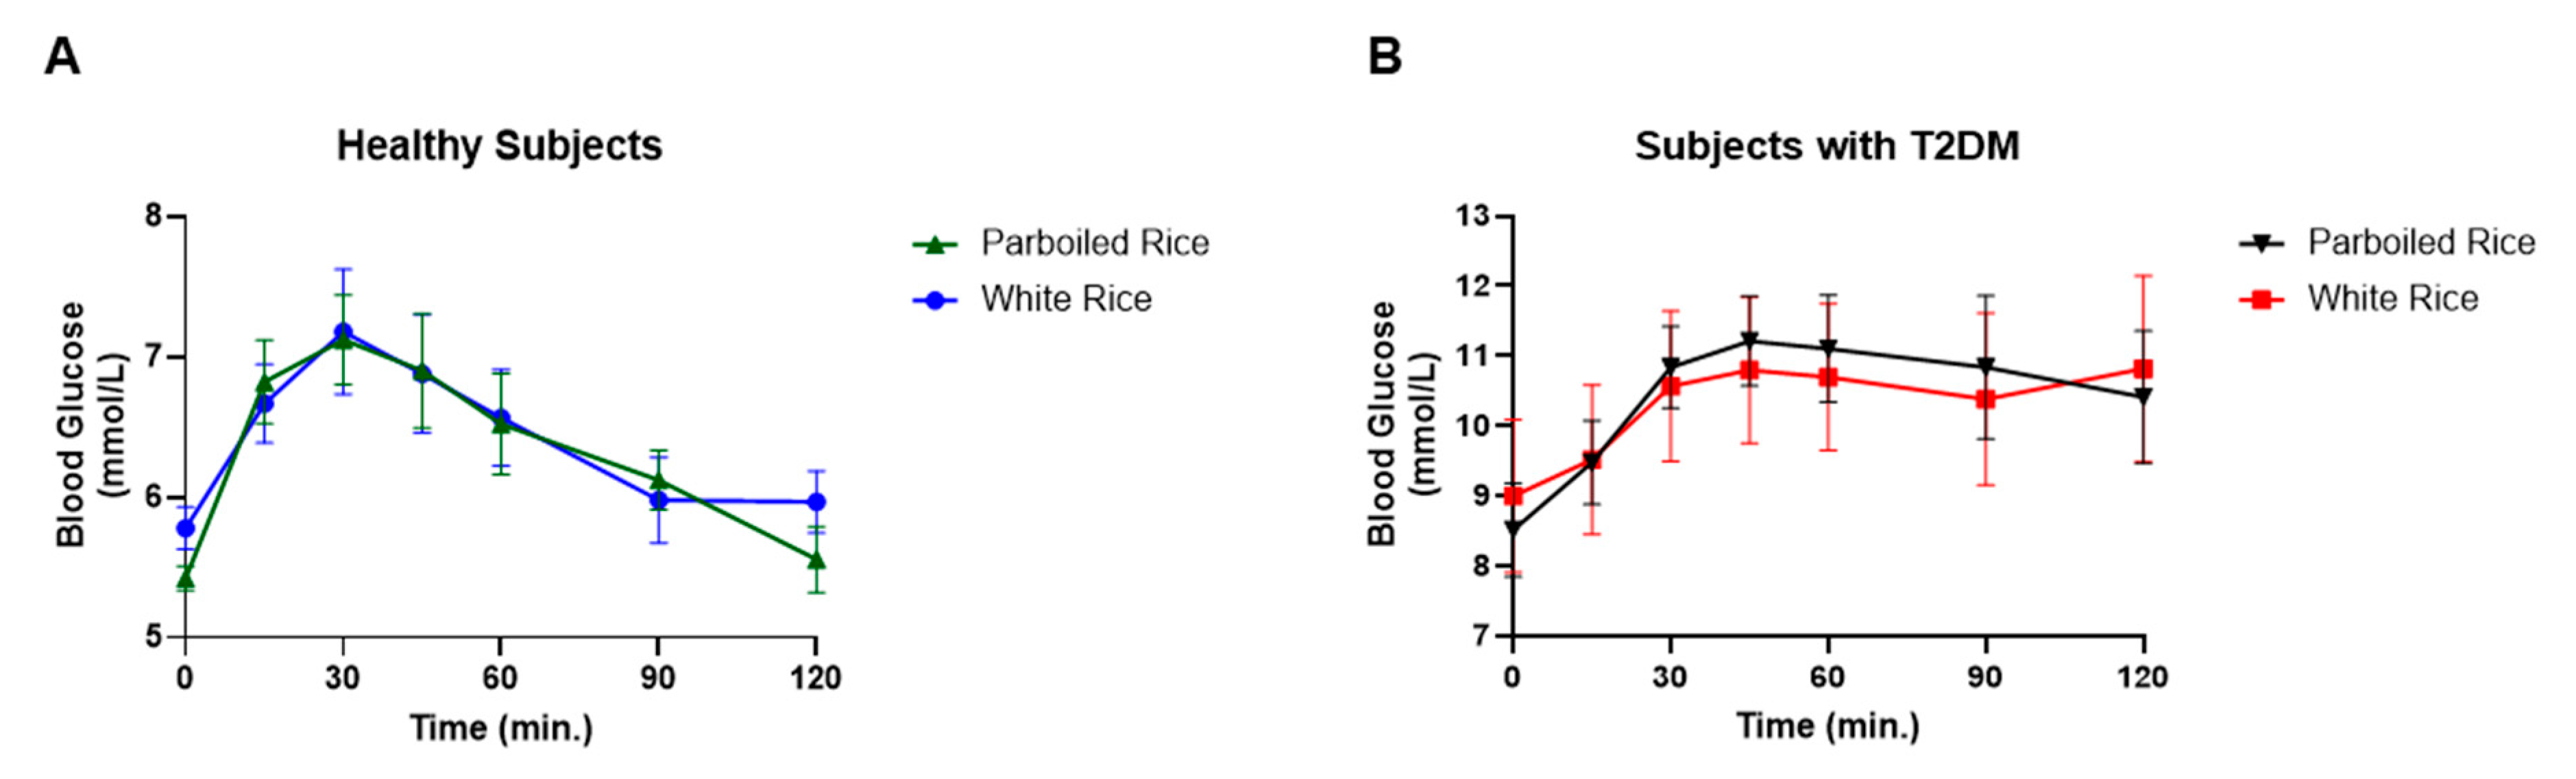
Fasting venous glucose levels differed between the two study groups. The glucose peak occurred at 30 minutes in healthy subjects but was delayed to 45 minutes in T2DM participants. No significant differences were observed between the rice types at any time point during the absorption or disposal phases. However, the overall glucose response patterns differed between groups. In healthy subjects, glucose levels returned to baseline after consuming both rice types, whereas in T2DM subjects, glucose remained elevated until the study's end at 120 minutes. The AUCs for venous glucose did not show significant differences between the two rice types in either group (data not shown).
Figure 2.
Capillary blood glucose response curves and AUC in healthy subjects and subjects with T2DM to parboiled rice and white rice. * Represents significant difference at P<0.05, $ represents a trend in significance at p=0.051.
Figure 2.
Capillary blood glucose response curves and AUC in healthy subjects and subjects with T2DM to parboiled rice and white rice. * Represents significant difference at P<0.05, $ represents a trend in significance at p=0.051.
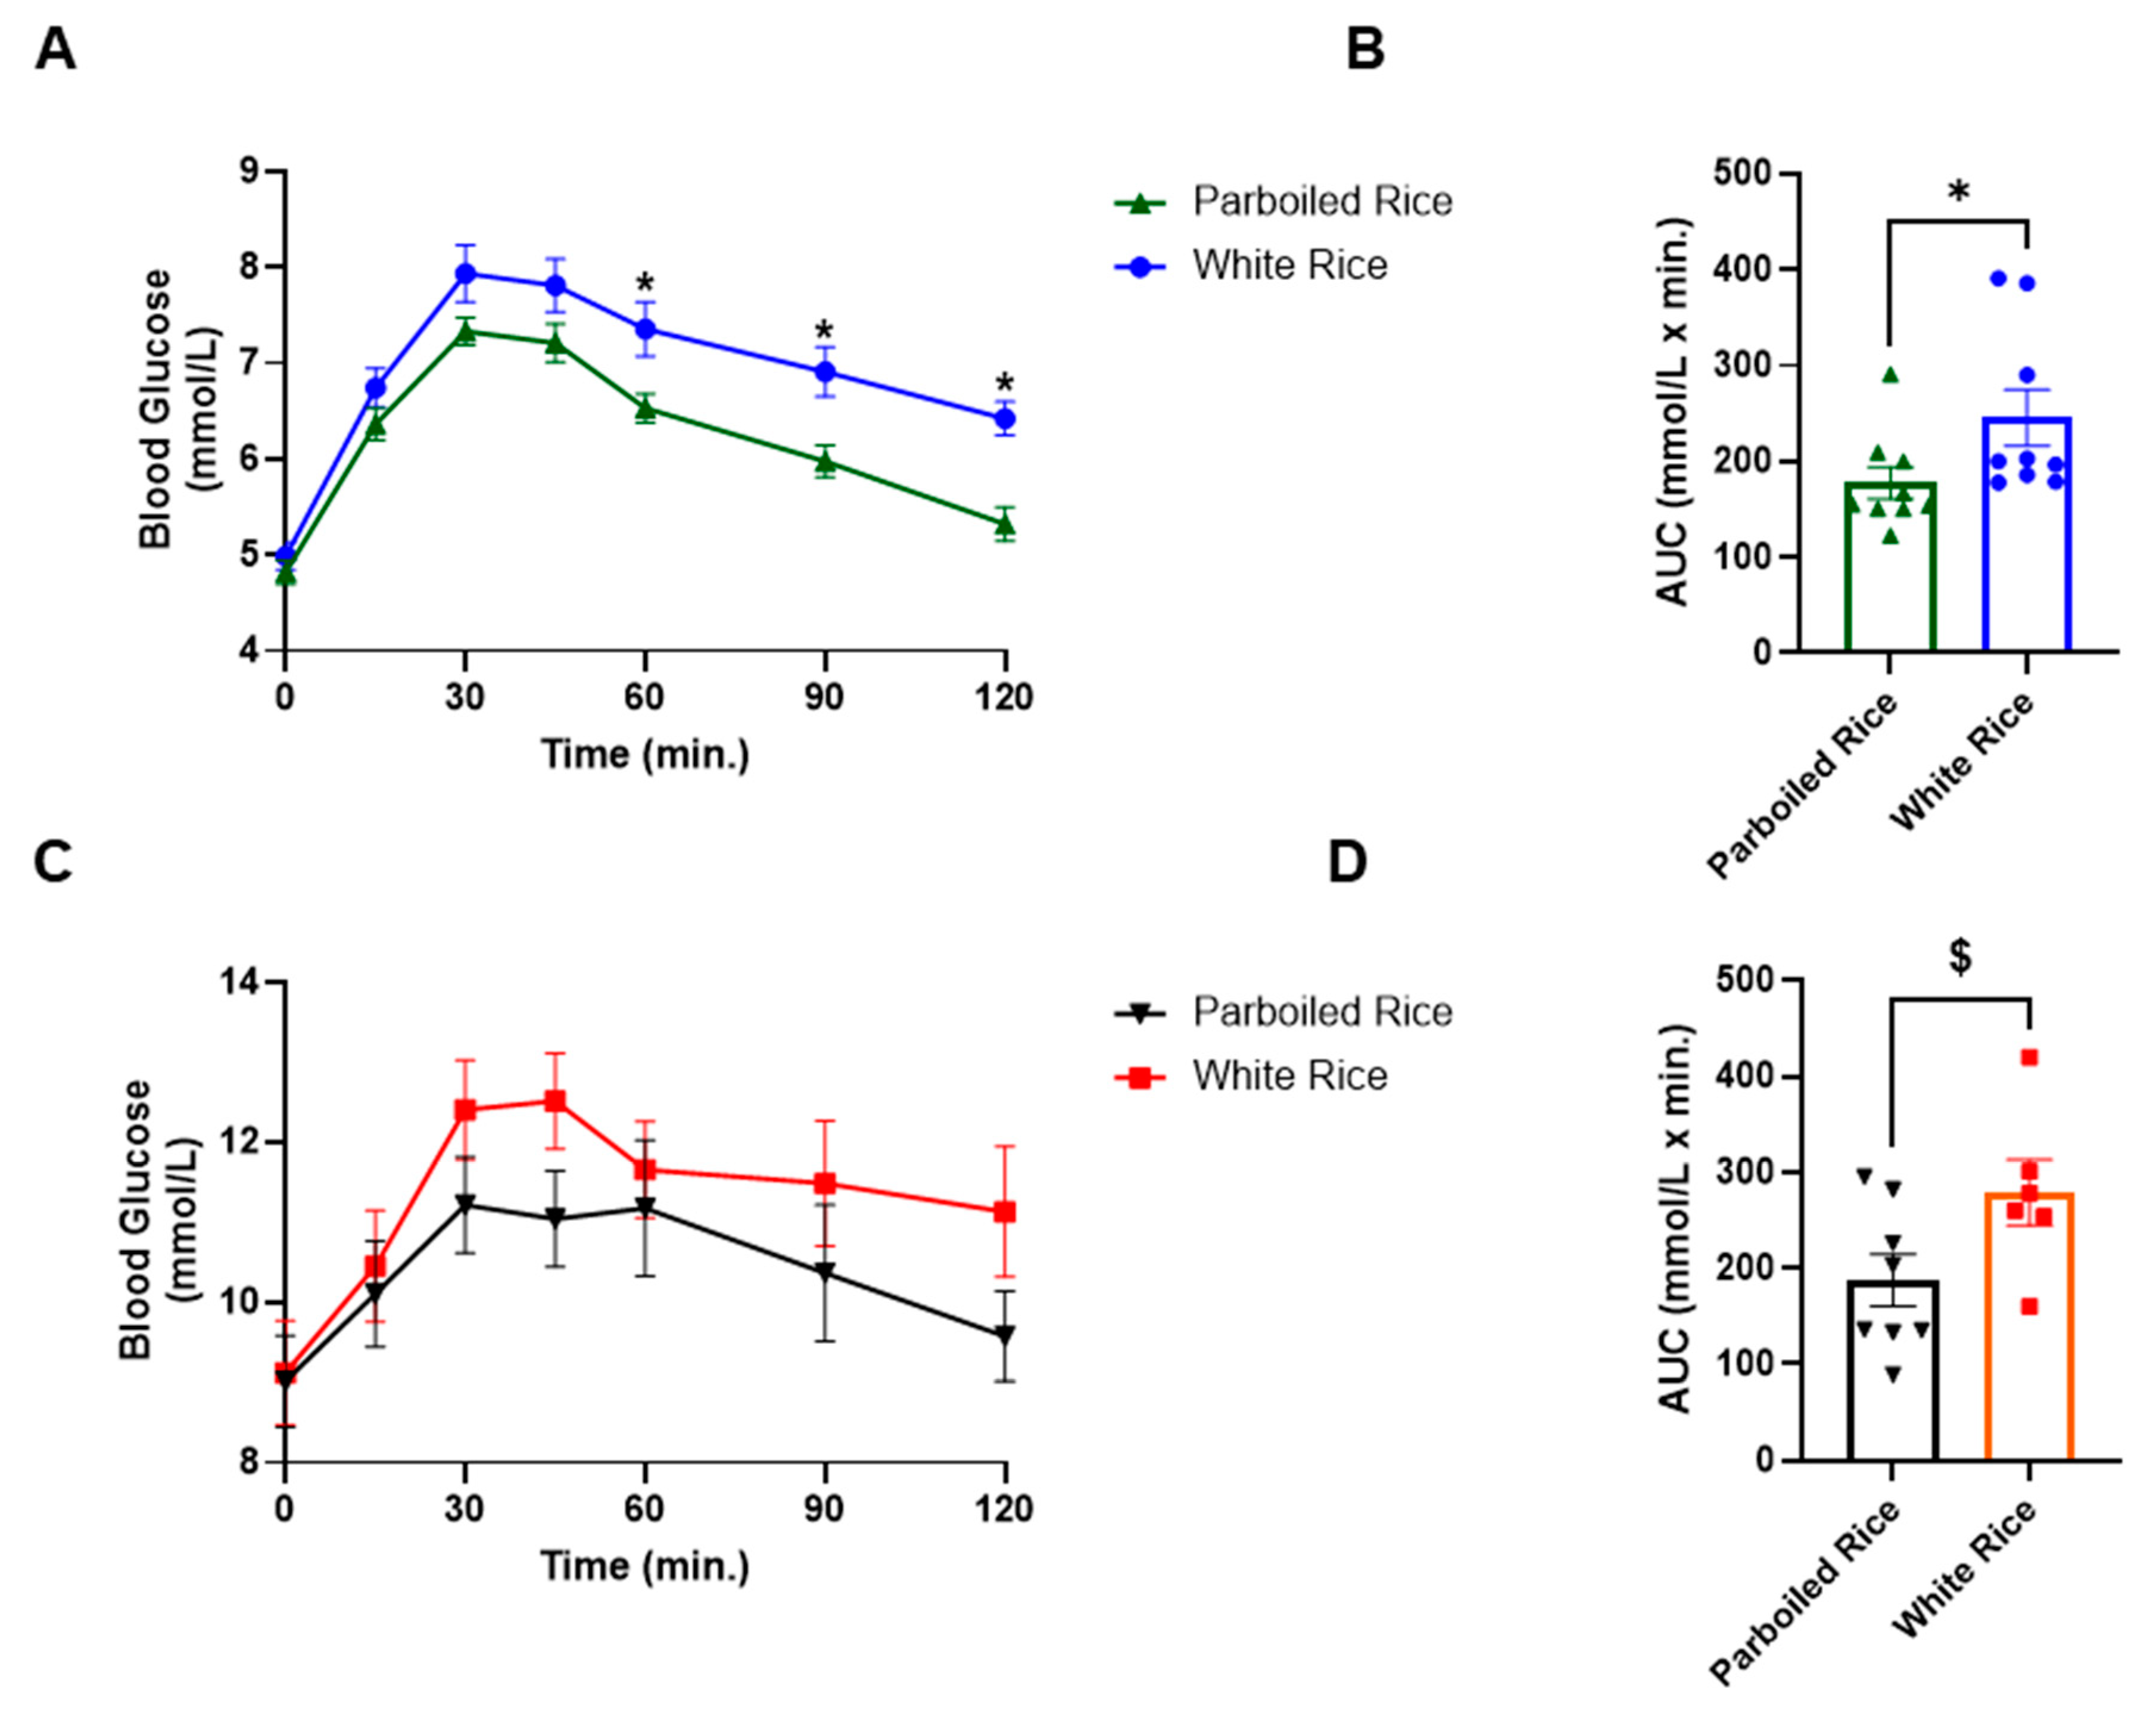
Figure 3.
Venous blood glucose response in healthy and subjects with T2DM to parboiled rice and white rice.
Figure 3.
Venous blood glucose response in healthy and subjects with T2DM to parboiled rice and white rice.
Insulin Response
Fasting insulin levels were significantly different between the two study groups, with T2DM subjects exhibiting nearly twice the insulin levels of healthy subjects (p = 0.01, Figure 1).
Postprandial insulin responses did not differ significantly between the test rice types or between the two groups. In healthy subjects, insulin concentration peaked at 15 minutes and gradually declined to baseline levels for both rice types. The decline was more pronounced after PBR than WR, though the difference was not statistically significant.
In contrast, T2DM subjects experienced a delayed insulin peak at 30 minutes, and insulin levels remained elevated until the end of the study. Insulin concentrations were slightly higher after PBR compared to WR, but this difference was not significant. However, at 120 minutes, insulin concentrations differed significantly between healthy and T2DM subjects after PBR consumption (p = 0.002, Figure 4).
No significant differences were observed in the insulin area under the curve (AUC) between PBR and WR in either group. However, PBR appeared to have a lower insulin effect than WR in healthy subjects, whereas in T2DM subjects, PBR resulted in a higher insulin response compared to WR, though neither trend reached statistical significance.
4. GLP-1 Responses
No significant differences were observed in either subject group's GLP-1 responses to PBR or WR (data not shown). The AUCs of GLP-1 concentration were approximately twice as high in healthy subjects compared to T2DM subjects after both rice types (WRH=1002±428 vs. WRD=507±150 and PBH=1515±697 vs. PBD=804±501); however, GLP-1 levels were significantly higher only after PBR in healthy subjects compared to WR in T2DM subjects (p < 0.05, Figure 5).
HOMA-IR, Matsuda Index, HOMA-B, and Disposition Index
The homeostatic model assessment for insulin resistance (HOMA-IR) was significantly higher in T2DM subjects compared to healthy subjects (p < 0.05, Figure 1). Since HOMA-IR is derived from fasting insulin and glucose values, it effectively reflects the difference between diabetic and non-diabetic states without any postprandial influences. HOMA-B values are also assessed by fasting insulin and glucose concentrations. There were no significant differences in HOMA-B values recorded between the two groups (Figure 5).
The Matsuda Index (MI), which considers both fasting and postprandial values, was significantly higher after PBR in healthy subjects compared to both PBR and WR in T2DM subjects. MI between WRH was also significantly higher than the PBR in T2DM individuals (p < 0.050). MI did not differ significantly between PBR and WR in either group (Figure 5).
The Disposition Index (DI) was significantly higher after PBR in healthy subjects compared to both PBR and WR in T2DM subjects (p< 0.05). No significant differences were observed in DI between PBR and WR within either group (Figure 5).
5. Discussion
Insulin resistance, characterized by hyperglycemia and hyperinsulinemia, is a well-established risk factor for type 2 diabetes [26]. In this study, T2DM subjects, despite being on oral hypoglycemic medications exhibited higher fasting glucose levels than healthy controls. The aim of the study was to determine whether hyperglycemia and hyperinsulinemia resulted from insulin deficiency due to β-cell dysfunction, impaired insulin action at the peripheral tissue levels or increased insulin secretion to compensation for the hyperglycemia. Additionally, it assessed whether PBR could mitigate hyperglycemia by enhancing insulin secretion or improving insulin sensitivity through increased glucose uptake in peripheral tissues. We also compared glycemic responses to WR and PBR using venous and capillary blood measurements in both T2DM and healthy subjects.
Handheld glucometers are widely used for at-home blood glucose monitoring, but limited research directly compares capillary (finger-prick) and venous glucose concentrations. In this study, fasting glucose values from both methods reflected expected differences between healthy and T2DM subjects. Postprandially, T2DM subjects exhibited a delayed peak blood glucose rise compared to healthy individuals, regardless of the measurement method.
Notably, capillary blood glucose after PBR consumption was lower than WR in both groups, with significant reductions at 60, 90, and 120 minutes in healthy subjects, leading to a significantly lower AUC. In T2DM subjects, the reduction in capillary glucose after PBR was more pronounced but not statistically significant, likely due to more variation as well as the small sample size, which was designed for GLP-1 measurement rather than blood glucose concentration [24]. The previous study from our lab, using a bigger sample size showed statistical significance at each time point between PBR and WR in healthy subjects and at 60 to 120 minutes in T2DM subjects [22]. Despite the lack of statistical significance in the current study, PBR led to a 36% drop in glucose AUC in T2DM subjects compared to a 28% drop in healthy subjects indicating a substantial reduction in postprandial glucose. These results align with prior research reporting a 35% [22] and 30% [27] reduction of glucose AUC in T2DM subjects and a 38% reduction in healthy subjects [22] after consuming PBR compared to WR. This substantial reduction in blood glucose concentration is biologically vital for its impact on glycemic control in people with or without diabetes.
Venous glucose measurements did not show significant differences between PBR and WR in either group. In healthy subjects, venous glucose levels returned to baseline more quickly, whereas in T2DM subjects, they remained elevated until the end of the study after both rice samples. This suggests that the physiologic state (diabetic and non-diabetic) of the subjects and the type of assessment method (capillary versus venous) influence the glycemic responses. While PBR improved capillary glucose clearance in people with and without T2D, it did not significantly affect venous glucose levels.
Prior research has shown that arterial glucose concentrations are approximately 7% higher than venous glucose in healthy individuals [28,29]. Similarly, patients with T2DM [30,31] as well as type 1 diabetes exhibited higher capillary than venous glucose levels [32]. This difference is likely due to glucose diffusion from capillaries into peripheral tissues before returning to the veins [33]. Given that the World Health Organization (WHO) uses venous plasma glucose for diabetes diagnosis [34], while the Food and Agriculture Organization (FAO) and WHO recognize both capillary and venous glucose for glycemic index testing [35], our findings emphasize the importance of considering measurement variability in clinical assessments of insulin sensitivity and resistance.
The delayed peak in blood glucose in T2DM subjects (45 min) vs. (30 min in healthy subjects) was mirrored by postprandial insulin responses. Insulin levels returned to baseline by 120 minutes in healthy subjects but remained elevated in T2DM subjects. Insulin secretion AUC over 120 minutes was lower for PBR than WR in healthy subjects (a difference of ~500 mU/L × min), whereas in T2DM subjects, it was higher for PBR than WR (a difference of ~360 mU/L × min). PBR stimulated a notably higher insulin response in T2DM subjects (3199 ± 1273 mU/L × min) compared to healthy subjects (1980 ± 568 mU/L × min). Conversely, WR elicited insulin AUCs of 2838 ± 1524 mU/L × min in T2DM and 2478 ± 786 mU/L × min in healthy individuals. While these differences were not statistically significant, they suggest that PBR may enhance insulin secretion in response to hyperglycemia in T2DM subjects.
Regarding the pancreatic β-cell function (HOMA-B), there was no significant differences between T2DM subjects and healthy subjects. This may suggest that there was still intact ability of insulin production in T2DM subjects, or it was due to medication-induced pancreatic function restoration. These results are supported by other studies that confirm that the T2DM patients can exhibit HOMA-B values comparable to healthy individuals because of their β-cells retaining the capacity to produce insulin, due to either the preservation of residual β-cell function or because of medications that enhance insulin secretion [36]. However, despite normal HOMA-B function, which may result in normal fasting insulin levels (typically <25 mIU/L) [37], T2DM patients often experience inadequate insulin action, leading to persistent hyperglycemia. This scenario points to peripheral insulin resistance, where tissues such as muscle and liver exhibit diminished responsiveness to insulin. Consequently, even with sufficient insulin production, glucose uptake by these tissues remains impaired, contributing to elevated blood sugar levels. This hyperglycemia leads to excessive stimulation of the B-cells causing hyperinsulinemia [38]. In the current study, despite normal HOMA-B values, T2DM subjects exhibited fasting hyperglycemia and thus hyperinsulinemia resulting in high HOMA-IR values. Persistent hyperglycemia in individuals with T2DM, despite glucose-lowering medications, underscores the complex interplay between insulin production, β-cell function, and insulin resistance.
The Disposition Index (DI) provides a more nuanced assessment of β-cell function relative to insulin sensitivity. Calculated as the product of insulin secretion and insulin sensitivity, a reduced DI in T2DM patients indicates compromised β-cell adaptability in the face of insulin resistance [10]. PBR consumption had led to a significantly higher DI values compared to WR but only in healthy individuals. These lower values of DI underscores the inability of β-cells to adequately compensate for decreased insulin sensitivity, highlighting the progressive nature of T2D. Although, the PBR consumption had increased the secretion of insulin, it did not reach statistical significance, partly because of the small sample size and may be the acute feeding nature of this study. A long-term study where a very low carbohydrate diet was fed to 57 subjects with T2DM for 12 weeks showed an overall two-fold increase in C-peptide response and a 32% to 48% increase in DI compared to the high carbohydrate diet [39]. These findings highlight the potential of dietary strategies in restoring β-cell function and improving glycemic control.
HOMA-IR was significantly higher in T2DM subjects compared to the healthy subjects (5.4 vs 1.81), respectively (p < 0.001). A normal or optimal HOMA-IR score is below 2.5, and a value above 2.5 typically indicates insulin resistance [26,40]. Insulin resistance and progressive pancreatic β-cell dysfunction are identified as key components in the pathogenesis of T2DM [41]. HOMA-IR score helps determine the efficiency of the body’s insulin response and its ability to manage glucose levels effectively. The HOMA-IR provides a valuable indicator of insulin sensitivity and resistance, essential for assessing metabolic health, and managing metabolic disorders.
Peripheral insulin resistance or postprandial insulin sensitivity was assessed by MI, which was found to be lower in T2DM subjects, confirming the dysregulation of glucose uptake by the peripheral tissues in these subjects. MI values below 4.3 predict insulin resistance [26] and correlate well with insulin sensitivity measured by the euglycemic-hyperinsulinemic clamp, considered the gold standard for insulin sensitivity assessment [10,42].
In contrast, MI in healthy subjects was twice as high after WR and tripled after PBR consumption, indicating enhanced insulin sensitivity in the current study. Notably, PBR required less insulin to clear glucose from circulation compared to WR not only in healthy but also T2DM subjects, reinforcing its potential benefits for glycemic control by PBR. Our results are corroborated with others who also demonstrated the consumption of PBR’s association with enhanced insulin sensitivity relative to WR. [27,43].
It is important to assess whether this benefit of PBR in increasing clearance of circulatory glucose in the study subject was due to the stimulation of increased GLP-1 secretion. GLP-1, an incretin hormone that is recognized to plays a pivotal role in glucose homeostasis by enhancing glucose-stimulated insulin secretion [44,45]. In individuals with T2D, GLP-1 secretion is often impaired, contributing to reduced plasma insulin levels and compromised glycemic control compared to people without diabetes [46,47,48,49]. A recent systemic review and meta-analysis of studies comparing GLP-1 between people with and without diabetes found small and inconsistent differences [50]. In our study, we found GLP-1 AUC as 2.0 times higher in healthy subjects than those with T2DM after WR consumption (1002 ± 428 vs. 507 ± 150 pM × min), respectively. GLP-1 secretion increased after consuming PBR in both groups, about ~500 units in healthy individuals, and ~300 units in T2DM subjects relative to the WR. Research on the effects of parboiled rice consumption on GLP-1 secretion in humans is scarce. Our study is the first to assess the PBR on GLP-1 secretion in both healthy individuals and people with T2D.
Research suggests the reduced incretin effect in patients with T2DM is due to a decrease in the β-cell responsiveness to GLP-1 or a decrease in GLP secretion [51]. However, the results regarding postprandial GLP-1 secretion and fasting GLP-1 between individuals with versus without T2DM are inconsistent and further investigation is warranted [50]. Given the therapeutic role of GLP-1 receptor agonists in T2DM treatment [45,52,53], dietary modifications, such as substituting WR with PBR may serve as a non-pharmacological strategy for improving postprandial glucose control.
The mechanism by which PBR enhances GLP-1 and insulin secretion remains under investigation but is suggested to involve resistant starch (RS). RS is recognized as a functional dietary fiber with potential to prevent hyperglycemia and support T2DM treatment [54,55,57]. Its benefits are primarily attributed to the production of short-chain fatty acids through fermentation by colonic microbiota, which improve insulin sensitivity and reduce systemic inflammation [56,58,59,60,61]. While these mechanisms have yet to be fully validated, some studies have shown that RS can exert metabolic benefits even in the absence of gut microbiota, possibly via alterations in bile acid metabolism or immune modulation in adipose tissue [62].
Despite a general consensus on the hypoglycemic benefits of RS, findings vary. Some studies show improved glycemic responses with RS intakes ranging from 2% to 30% [63,64,65], while others report no significant effects after consuming 25–30 g of RS [66,67]. In our study, the type and amount of PBR used (1.5% RS) were consistent with a previous study that showed substantial improvement in glucose clearance [22]. Another study using a high-resistant starch rice demonstrated reduced glucose and insulin responses, but paradoxically also showed reduced GLP-1 secretion. The authors attributed the lowered glycemic response to decreased starch digestibility rather than enhanced GLP-1 secretion [68].
It is well-established that increased dietary fiber or RS reduces blood glucose by slowing glucose absorption. However, the relationship between RS and GLP-1 secretion remains complex and inconsistent. While some studies have reported increased GLP-1 secretion following RS intake [69,70], others found no significant effect [71]. These discrepancies may stem from variations in study design, RS types, or individual genetic differences. In particular, polymorphisms in the GCG gene, which encodes GLP-1, may influence GLP-1 production and function, affecting incretin responses and glucose metabolism [72].
The parboiling process imparts PBR with unique structural and physiological properties [73] that may enhance insulin sensitivity by promoting GLP-1 secretion and improving glucose clearance. Whether these benefits stem from RS, other structural changes, or unknown bioactive compounds in PBR, its consumption significantly reduced postprandial hyperglycemia in healthy and T2DM individuals. In T2DM subjects, the glucose-lowering effect of PBR was particularly marked, such as differences in blood glucose between PBR and WR exceeded 1 mmol/L from 30 to 120 minutes post-meal, resulting in a 36% reduction in glucose AUC compared to WR. In healthy individuals, the reduction was 28%. These findings align with previous reports showing similar effects [22,43].
The American Diabetes Association recommends lifestyle changes, such as healthier diets, increased physical activity, and weight management, for individuals with prediabetes to delay or prevent diabetes onset [74]. Preventing or reversing the progressive loss of insulin sensitivity and β-cell function is key to effective diabetes prevention [75].
In this context, PBR represents a promising dietary alternative to WR, with evidence suggesting that it can stimulate insulin secretion, enhance glucose uptake, and reduce postprandial glycemia. These effects may be mediated by molecular or structural features of PBR that stimulate intestinal GLP-1 secretion, subsequently enhancing insulin release. In summary, GLP-1 plays a critical role in glucose-stimulated insulin secretion, and its impaired secretion is closely associated with T2DM. Incorporating PBR into the diet may enhance GLP-1 secretion, improve insulin sensitivity, and support better glycemic control. However, further research is needed to clarify the underlying mechanisms and the role of genetic factors.
6. Conclusion
T2DM subjects in this study exhibited higher fasting glucose, HOMA-IR, lower GLP-1 levels, reduced insulin sensitivity (MI), and impaired β-cell function (DI) compared to healthy controls. PBR consumption resulted in significant reductions in postprandial glucose in healthy subjects and modest improvements in T2DM subjects. Capillary glucose measurements were more sensitive to dietary intervention than venous glucose. Future research should explore the long-term effects of PBR on glycemic control in a larger cohort.
7. Strengths & Limitations
This study has several strengths. First, it employed a crossover design, which is particularly effective in controlling for individual variability among participants. Second, it included comprehensive metabolic assessments, encompassing insulin secretion, β-cell function, the Matsuda Index, the Disposition Index, and GLP-1 secretion, providing a thorough evaluation of glycemic and hormonal responses. Third, the study compared capillary glucose concentrations with venous glucose concentrations, offering a more nuanced understanding of glucose dynamics.
However, there are also limitations to consider. The sample size was relatively small, based on power calculations for GLP-1 assessment, and was further reduced due to challenges during the COVID-19 pandemic. Many initially recruited participants were unable to complete the study, as healthcare facilities were largely closed except for urgent care, leading to the premature termination of data collection. Additionally, this was an acute feeding pilot study; therefore, long-term studies are needed to confirm and expand upon these findings.
Author Contributions
S.Alkandari, T.A.Zafar and S.Al-Sabah: Conceptualization study idea, designing methodology; S.Alkandari: executing, data collection, entering data and running initial statistics; S.Alkandari, S.Al-Sabah, M.A.Farha, J.Abubakr: Analysing blood samples, S.Alkandari: Writing the first manuscript draft; T.A.Zafar, S.Al-Sabah: Supervising the project execution, revising analyses, interpreting results, making tables and figures; T.A.Zafar, S.Al-Sabah: Reviewing and Editing; F.Al-Mulla: Visualization.
Funding
This research was funded by the School of Graduate Studies and Research Sector of Kuwait University, Project # YF03/18.
Institutional Review Board Statement
The Ethics Committees of the Health Science Center, Kuwait and the Ministry of Health, Kuwait approved the study, Reference #: VDR/EC 13454, dated 18/04/2018, and MOH 4090, dated 12/07/2018, respectively.
Informed Consent Statement
Written informed consent was obtained from all participants.
Data Availability Statement
The original data is presented in the article. There is supplementary data with this manuscript. Further inquiries may be directed to the corresponding author.
Conflicts of Interest
The authors declare no conflicts of interest.
References
- Guariguata, L.; Whiting, D.; Hambleton, I.; Beagley, J.; Linnenkamp, U.; Shaw, J. Global Estimates of Diabetes Prevalence for 2013 and Projections for 2035. Diabet. Res. Clin. Pract. 2014, 103, 137–149.
- International Diabetes Federation (IDF). Available online: http://www.idf.org (accessed on 2 February 2025).
- Ceriello, A.; Colagiuri, S. International Diabetes Federation Guideline for Management of Postmeal Glucose: A Review of Recommendations. Diabetes Med. 2008, 25, 1151–1156. [CrossRef]
- Litwak L, Goh SY, Hussein Z, Malek R, Prusty V, Khamseh ME. Prevalence of diabetes complications in people with type 2 diabetes mellitus and its association with baseline characteristics in the multinational A1chieve study. Diabetol Metab Syndr 2013;5:57.
- Cantley, J.; Ashcroft, F.M. Q&A: Insulin Secretion and Type 2 Diabetes: Why Do β-Cells Fail? BMC Biol. 2015, 13, 33.
- Centers for Disease Control and Prevention (CDC). Diabetes Symptoms. 15 August 2022. Available online: https://www.cdc.gov/diabetes (accessed on 2 February 2025).
- Matthews, D.R.; Hosker, J.P.; Rudenski, A.S.; Naylor, B.A.; Treacher, D.F.; Turner, R.C. Homeostasis model assessment: Insulin resistance and beta-cell function from fasting plasma glucose and insulin concentrations in man. Diabetologia 1985, 28, 412–419.
- Furugen, M.; Saitoh, S.; Ohnishi, H.; Akasaka, H.; Mitsumata, M.; Chiba, M.; Miura, T. Matsuda–DeFronzo Insulin Sensitivity Index is a Better Predictor than HOMA-IR of Hypertension in Japanese: The Tanno–Sobetsu Study. J. Hum. Hypertens. 2012, 26, 325–333.
- Basila, A.M.; Hernández, J.M.; Alarcón, M.L. Diagnostic Methods of Insulin Resistance in a Pediatric Population. Bol. Med. Hosp. Infant Mex. 2011, 68, 367–373.
- Richard, N.; Bergman, R.N.; Marilyn, A.K.; Gregg, V.C. Accurate assessment of β-cell function: The hyperbolic correction. Diabetes 2002, 51 (Suppl 1), S212–S220. [CrossRef]
- Lorenzo, C.; Wagenknecht, L.E.; Rewers, M.; Karter, A.J.; Bergman, R.N.; Hanley, A.J.; Haffner, S.M. Disposition index, glucose effectiveness, and conversion to type 2 diabetes: The Insulin Resistance Atherosclerosis Study (IRAS). Diabetes Care 2011, 33, 2098–2103.
- Matsuda, M.; DeFronzo, R.A. Insulin sensitivity indices obtained from oral glucose tolerance testing: Comparison with the euglycemic insulin clamp. Diabetes Care 1999, 22, 1462–1470.
- Seino, Y.; Fukushima, M.; Yabe, D. GIP and GLP-1, the two incretin hormones: Similarities and differences. J. Diabetes Investig. 2010, 1, 8–23.
- Nauck, M.A., Müller, T.D. Incretin hormones and type 2 diabetes. Diabetologia. 2023, 66, 1780–1795. [CrossRef]
- Al-Sabah, S.; Alasfar, F.; Al-Khaledi, G.; et al. Incretin Response to a Standard Test Meal in a Rat Model of Sleeve Gastrectomy with Diet-Induced Obesity. Obes. Surg. 2014, 24, 95–101. [CrossRef]
- Kim, W.; Egan, J.M. The role of incretins in glucose homeostasis and diabetes treatment. Pharmacol. Rev. 2008, 60, 470–512. [CrossRef]
- Koopman, A.D.; Rutters, F.; Rauh, S.P.; Nijpels, G.; Holst, J.J.; Beulens, J.W.; et al. Incretin responses to oral glucose and mixed meal tests and changes in fasting glucose levels during 7 years of follow-up: The Hoorn Meal Study. PLoS ONE 2018, 13, e0191114.
- Hu, F.B. Diet and Risk of Type II Diabetes: The Role of Types of Fat and Carbohydrate. Diabetologia 2001, 44, 805–817.
- Nanri, A.; Mizoue, T.; Noda, M.; Takahashi, Y.; Kato, M.; Inoue, M.; et al. Rice Intake and Type 2 Diabetes in Japanese Men and Women: The Japan Public Health Center-based Prospective Study. Am. J. Clin. Nutr. 2010, 92, 1348–1354.
- Oli, P.; Ward, R.; Adhikari, B.; Torley, P. Parboiled Rice: Understanding from a Materials Science Approach. J. Food Eng. 2014, 124, 173–183.
- Mohan, V.; Spiegelman, D.; Sudha, V.; Gayathri, R.; Hong, B.; Praseena, K.; et al. Effect of Brown Rice, White Rice, and Brown Rice with Legumes on Blood Glucose and Insulin Responses in Overweight Asian Indians: A Randomized Controlled Trial. Diabetes Technol. Ther. 2014, 16, 317–325.
- Hamad, S.; Zafar, T.; Sidhu, J. Parboiled Rice Metabolism Differs in Healthy and Diabetic Individuals with Similar Improvement in Glycemic Response. Nutr. 2018, 47, 43–49.
- International Organization for Standardization (ISO). In Vitro Diagnostic Test Systems—Requirements for Blood-Glucose Monitoring Systems for Self-Testing in Managing Diabetes Mellitus; ISO 15197:2013; ISO: Geneva, Switzerland, 2013.
- Kameyama, N.; Maruyama, C.; Matsui, S.; Araki, R.; Yamada, Y.; Maruyama, T. Effects of Consumption of Main and Side Dishes with White Rice on Postprandial Glucose, Insulin, Glucose-Dependent Insulinotropic Polypeptide, and Glucagon-Like Peptide-1 Responses in Healthy Japanese Men. Br. J. Nutr. 2014, 111, 1632–1640. [CrossRef]
- Brouns, F.; Bjorck, I. Glycemic Index Methodology. Nutr. Res. Rev. 2005, 18, 145–171.
- Gutch, M.; Kumar, S.; Razi, S.; Gupta, K.; Gupta, A. Assessment of Insulin Sensitivity/Resistance. Indian J. Endocrinol. Metab. 2015, 19, 1. [CrossRef]
- Lu, L.W.; Venn, B.; Lu, J.; Monro, J.; Rush, E. Effect of Cold Storage and Reheating of Parboiled Rice on Postprandial Glycaemic Response, Satiety, Palatability, and Chewed Particle Size Distribution. Nutrients 2017, 9, 475.
- Rasaiah, B. Self-Monitoring of the Blood Glucose Level: Potential Sources of Inaccuracy. Can. Med. Assoc. J. 1985, 132, 1357–1361.
- Patel, N.; Patel, K. A Comparative Study of Venous and Capillary Blood Glucose Levels by Different Methods. GCSMC J. Med. Sci. 2015, IV, 1.
- Adnan, M.; Imamb, F.; Shabbira, I.; Alia, Z.; Rahata, T. Correlation Between Capillary and Venous Blood Glucose Levels in Diabetic Patients. Asian Biomed. 2015, 9, 55–59. [CrossRef]
- Sirohi, R.; Singh, R.P.; Chauhan, K. A Comparative Study of Venous and Capillary Blood Glucose in a Tertiary Care Hospital. Indian J. Public Health Res. Dev. 2020, 11, 7, 673-677.
- Andelin, M.; Kropff, J.; Matuleviciene, V.; Joseph, J.I.; Attvall, S.; Theodorsson, E.; Hirsch, I.B.; Imberg, H.; Dahlqvist, S.; Klonoff, D.; et al. Assessing the Accuracy of Continuous Glucose Monitoring (CGM) Calibrated With Capillary Values Using Capillary or Venous Glucose Levels as a Reference. J. Diabetes Sci. Technol. 2016, 10, 876–884. [Google Scholar] [CrossRef]
- Yang, C.; Chang, C.; Lin, J. A Comparison Between Venous and Finger-Prick Blood Sampling on Values of Blood Glucose. IPCBEE 2012, 39, 206–210.
- Longo, Casper, Fauci. Hauser, Jameson, Loscalzo, Harrison principles of Medicine. Diabetes Mellitus. 18th ed. Mcgrow Hill 2011; (2), 2970-71.
- Food and Agriculture Organization/World Health Organization (FAO/WHO). Carbohydrates in Human Nutrition: Report of a Joint FAO/WHO Expert Consultation; FAO Food and Nutrition Paper No. 66; FAO: Rome, Italy, 1997.
- DeFronzo, R. From the Triumvirate to the Ominous Octet: A New Paradigm for the Treatment of Type 2 Diabetes Mellitus. Diabetes 2009, 58, 773–795. [CrossRef]
- Melmed, S.; Polonsky, K.S.; Larsen, P.R.; Kronenberg, H.M. Williams Textbook of Endocrinology, 13th ed.; Elsevier: Philadelphia, PA, USA, 2015. [CrossRef]
- Abdul-Ghani, M.A.; Jenkinson, C.P.; Richardson, D.K.; Tripathy, D.; DeFronzo, RA. Insulin Secretion and Action In Subjects with Impaired Fasting Glucose and Impaired Glucose Tolerance: Results from the Veterans Administration Genetic Epidemiology Study. Diabetes. 2006, 55(5):1430-5. [CrossRef]
- Gower, B. A., Goss, A. M., Yurchishin, M. L., Deemer, S. E., Sunil, B., & Garvey, W. T. Effects of a Carbohydrate-Restricted Diet on β-Cell Response in Adults with Type 2 Diabetes. The Journal of Clinical Endocrinology & Metabolism. 2024. [CrossRef]
- Wallace, T.M.; Levy, J.C.; Matthews, D.R. Use and abuse of HOMA modeling. Diabetes Care. 2004;27(6):1487–1495. [CrossRef]
- DeFronzo, R.A. Pathogenesis of type 2 diabetes mellitus. Med Clin North Am. 2004;88(4):787–835, ix. [CrossRef]
- Lorenzo, C.; Haffner, S.M.; Stančáková, A.; Kuusisto, J.; Laakso, M. Fasting and OGTT-Derived Measures of Insulin Resistance as Compared with the Euglycemic-Hyperinsulinemic Clamp in Nondiabetic Finnish Offspring of Type 2 Diabetic Individuals. J. Clin. Endocrinol. Metab. 2015, 100, 544–550. [CrossRef]
- Larsen, H., Rasmussen, O., Rasmussen, P. et al. Glycaemic index of parboiled rice depends on the severity of processing: study in type 2 diabetic subjects. Eur J Clin Nutr. 2000, 54, 380–385. [CrossRef]
- Kahn, S.E.; Cooper, M.E.; Del Prato, S. Pathophysiology and Treatment of Type 2 Diabetes: Perspectives on the Past, Present, and Future. Lancet 2014, 383, 1068–1083.
- Al-Sabah, S. Molecular Pharmacology of the Incretin Receptors. Med Princ Pract. 2016, 25, 15–21. [CrossRef]
- Nauck, M.A.; Homberger, E.; Siegel, E.G.; Allen, R.C.; Eaton, R.P.; Ebert, R.; et al. Incretin Effects of Increasing Glucose Loads in Man Calculated from Venous Insulin and C-Peptide Responses. J. Clin. Endocrinol. Metab. 1986, 63, 492–498.
- Nauck, M.A.; Meier, J.J. Incretin Hormones: Their Role in Health and Disease. Diabetes Obes. Metab. 2018, 20, 5–21.
- Wang, X.L.; Ye, F.; Li, J.; et al. Impaired Secretion of Glucagon-Like Peptide 1 During Oral Glucose Tolerance Test in Patients with Newly Diagnosed Type 2 Diabetes Mellitus. Saudi Med. J. 2016, 37, 48–53.
- Grespan, E.; Giorgino, T.; Natali, A.; Ferrannini, E.; Mari, A. Different mechanisms of GIP and GLP-1 action explain their different therapeutic efficacy in type 2 diabetes. Metabolism. 2021,114:154415.
- Watkins, J.D.; Carter, S.; Atkinson, G.; Koumanov, F.; Betts, J.A.; Holst, J.J.;, et al. Glucagon-like peptide-1 secretion in people with versus without type 2 diabetes: a systematic review and meta-analysis of cross-sectional studies. Metabolism. 2023,1(140): 155375. [CrossRef]
- Xu, G.; Kaneto, H.; Laybutt, D.R.; Duvivier-Kali, V.F.; Trivedi, N.; Suzuma, K.; et al. Downregulation of GLP-1 and GIP receptor expression by hyperglycemia possible contribution to impaired incretin effects in diabetes. Diabetes. 2007, 56(6):1551–8. [CrossRef]
- Oh, T.J. In Vivo Models for Incretin Research: From the Intestine to the Whole Body. Endocrinol. Metab. (Seoul) 2016, 31, 45–51.
- Movahednasab, M.; Dianat-Moghadam, H.; Khodadad, S. et al. GLP-1-based therapies for type 2 diabetes: from single, dual and triple agonists to endogenous GLP-1 production and L-cell differentiation. Diabetol Metab Syndr. 2025, 17, 60. [CrossRef]
- Zafar, T. A. High amylose cornstarch preloads stabilized postprandial blood glucose but failed to reduce appetite or food intake in healthy women. Appetite. 2018, 131 (1), 1-6. [CrossRef]
- Liu, J., Lu, W., Liang, Y., Wang, L., Jin, N., Zhao, H., Fan, B., & Wang, F. Research Progress on Hypoglycemic Mechanisms of Resistant Starch: A Review. Molecules, 2022, 27(20), 7111. [CrossRef]
- Xu, J.; Ma, Z.; Li, X.; Liu, L.; Hu, X. A More Pronounced Effect of Type III Resistant Starch vs. Type II Resistant Starch on Ameliorating Hyperlipidemia in High Fat Diet-Fed Mice Is Associated with Its Supramolecular Structural Characteristics. Food Funct. 2020, 11:1982–1995. [CrossRef]
- Portincasa, P.; Bonfrate L.; Vacca, M.; De Angelis, M.; Farella, I.; Lanza, E.; Khalil, M.; Wang, D.Q.H.; Sperandio, M.; Di Ciaula, A. Gut Microbiota and Short Chain Fatty Acids: Implications in Glucose Homeostasis. Int. J. Mol. Sci. 2022, 23:1105. [CrossRef]
- Zhang, C.; Ma, S.; Wu, J.; Luo, L.; Qiao, S.; Li, R.; Xu, W.; Wang, N.; Zhao, B.; Wang, X.; et al. A Specific Gut Microbiota and Metabolomic Profiles Shifts Related to Antidiabetic Action: The Similar and Complementary Antidiabetic Properties of Type 3 Resistant Starch from Canna Edulis and Metformin. Pharmacol. Res. 2020, 159:104985. [CrossRef]
- Arias-Córdova, Y.; Ble-Castillo, J.L.; García-Vázquez, C.; Olvera-Hernández, V.; Ramos-García, M.; Navarrete-Cortes, A.; Jiménez-Domínguez, G.; Juárez-Rojop, I.E.; Tovilla-Zárate, C.A.; Martínez-López, M.C.; et al. Resistant Starch Consumption Effects on Glycemic Control and Glycemic Variability in Patients with Type 2 Diabetes: A Randomized Crossover Study. Nutrients. 2021, 13:52. [CrossRef]
- Zhou, J.; Martin, R.J.; Tulley, R.T.; et al. Dietary Resistant Starch Upregulates Total GLP-1 and PYY in a Sustained Day-Long Manner through Fermentation in Rodents. Am. J. Physiol. Endocrinol. Metab. 2008, 295, E1160–E1166.
- Yong, W.; Jing, C.; Ying-Han, S.; et al. Effects of Resistant Starch on Glucose, Insulin, Insulin Resistance, and Lipid Parameters in Overweight or Obese Adults: A Systematic Review and Meta-Analysis. Nutr. Diabetes 2019, 9, 1–9.
- Bindels, L. B.; Segura Munoz, R. R.; Gomes-Neto, J. C.; Mutemberezi, V.; Martínez, I.; Salazar, N.; Cody, E. A.; Quintero-Villegas, M. I.; Kittana, H.; Schmaltz, R. J.; Muccioli, G. G.; Walter, J.; & Ramer-Tait, A. E. Resistant starch can improve insulin sensitivity independently of the gut microbiota. Microbiome, 2017, 5, 12. [CrossRef]
- Behall, K.M.; Scholfield, D.; Yuhaniak, I.; Canary, J. Diets containing high amylose vs amylopectin starch: Effects on metabolic variables in human subjects. Am J Clin Nutr 1989, 49,337–44.
- Behall, K.; Hallfrisch, J. Plasma glucose and insulin reduction after consumption of breads varying in amylose content. Eur J Clin Nutr, 2002, 56, 913–20.
- Behall, K.M.; Howe, J.C. Effect of long-term consumption of amylose vs amylopectin starch on metabolic variables in human subjects. Am J Clin Nutr, 1995, 61,334–40.
- Kendall, C.W.; Esfahani, A.; Sanders, L.M.; Potter, S.M.; Vidgen, E. The Effect of a Pre-Load Meal Containing Resistant Starch on Spontaneous Food Intake and Glucose and Insulin Responses. J. Food Technol. 2010, 8, 67–73.
- Jenkins, D.J.; Vuksan, V.; Kendall, C.W.; Würsch, P.; Jeffcoat, R.; Waring, S.; et al. Physiological Effects of Resistant Starches on Fecal Bulk, Short Chain Fatty Acids, Blood Lipids and Glycemic Index. J. Am. Coll. Nutr. 1998, 17, 609–616.
- Takahashi, K.; Fujita, H.; Fujita, N.; Takahashi, Y.; Kato, S.; Shimizu, T.; Suganuma, Y.; Sato, T.; Waki, H.; Yamada, Y. A Pilot Study to Assess Glucose, Insulin, and Incretin Responses Following Novel High Resistant Starch Rice Ingestion in Healthy Men. Diabetes Ther. 2022, 13, 1383. [CrossRef]
- Bodinham, C.; Smith, L.; Thomas, E.; Bell, J.; Swann, J.; Costabile, A.; et al. Efficacy of Increased Resistant Starch Consumption in Human Type 2 Diabetes. Endocr. Connect. 2014, 3, 75–84.
- Regmi, P.; van Kempen, T.; Matte, J.J.; Zijlstra, R.T. Starch with High Amylose and Low In Vitro Digestibility Increases Short-Chain Fatty Acid Absorption, Reduces Peak Insulin Secretion, and Modulates Incretin Secretion in Pigs. J. Nutr. 2011, 141, 398–405.
- Pugh, J.E.; Cai, M.; Altieri, N.; Frost, G. A Comparison of the Effects of Resistant Starch Types on Glycemic Response in Individuals with Type 2 Diabetes or Prediabetes: A Systematic Review and Meta-Analysis. Front. Nutr. 2023, 10, 1118229. [CrossRef]
- Jin, T. The WNT Signalling Pathway and Diabetes Mellitus. Diabetologia 2008, 51, 1771–1780.
- Muchlisyiyah, J.; Shamsudin, R.; Kadir Basha, R.; Shukri, R.; How, S.; Niranjan, K.; Onwude, D. Parboiled Rice Processing Method, Rice Quality, Health Benefits, Environment, and Future Perspectives: A Review. Agriculture 2023, 13, 1390. [CrossRef]
- American Diabetes Association. Standards of Medical Care in Diabetes—2017 Abridged for Primary Care Providers. Clin. Diabetes 2017, 35, 5–26. [CrossRef]
- Vajje, J.; Khan, S.; Kaur, A.; et al. Comparison of the Efficacy of Metformin and Lifestyle Modification for the Primary Prevention of Type 2 Diabetes: A Meta-Analysis of Randomized Controlled Trials. Cureus 2023, 15, e47105. [CrossRef]
Figure 1.
Fasting physiologic parameters between the two groups. *The superscript asterisk suggests significant difference between the groups at P< 0.05.
Figure 1.
Fasting physiologic parameters between the two groups. *The superscript asterisk suggests significant difference between the groups at P< 0.05.
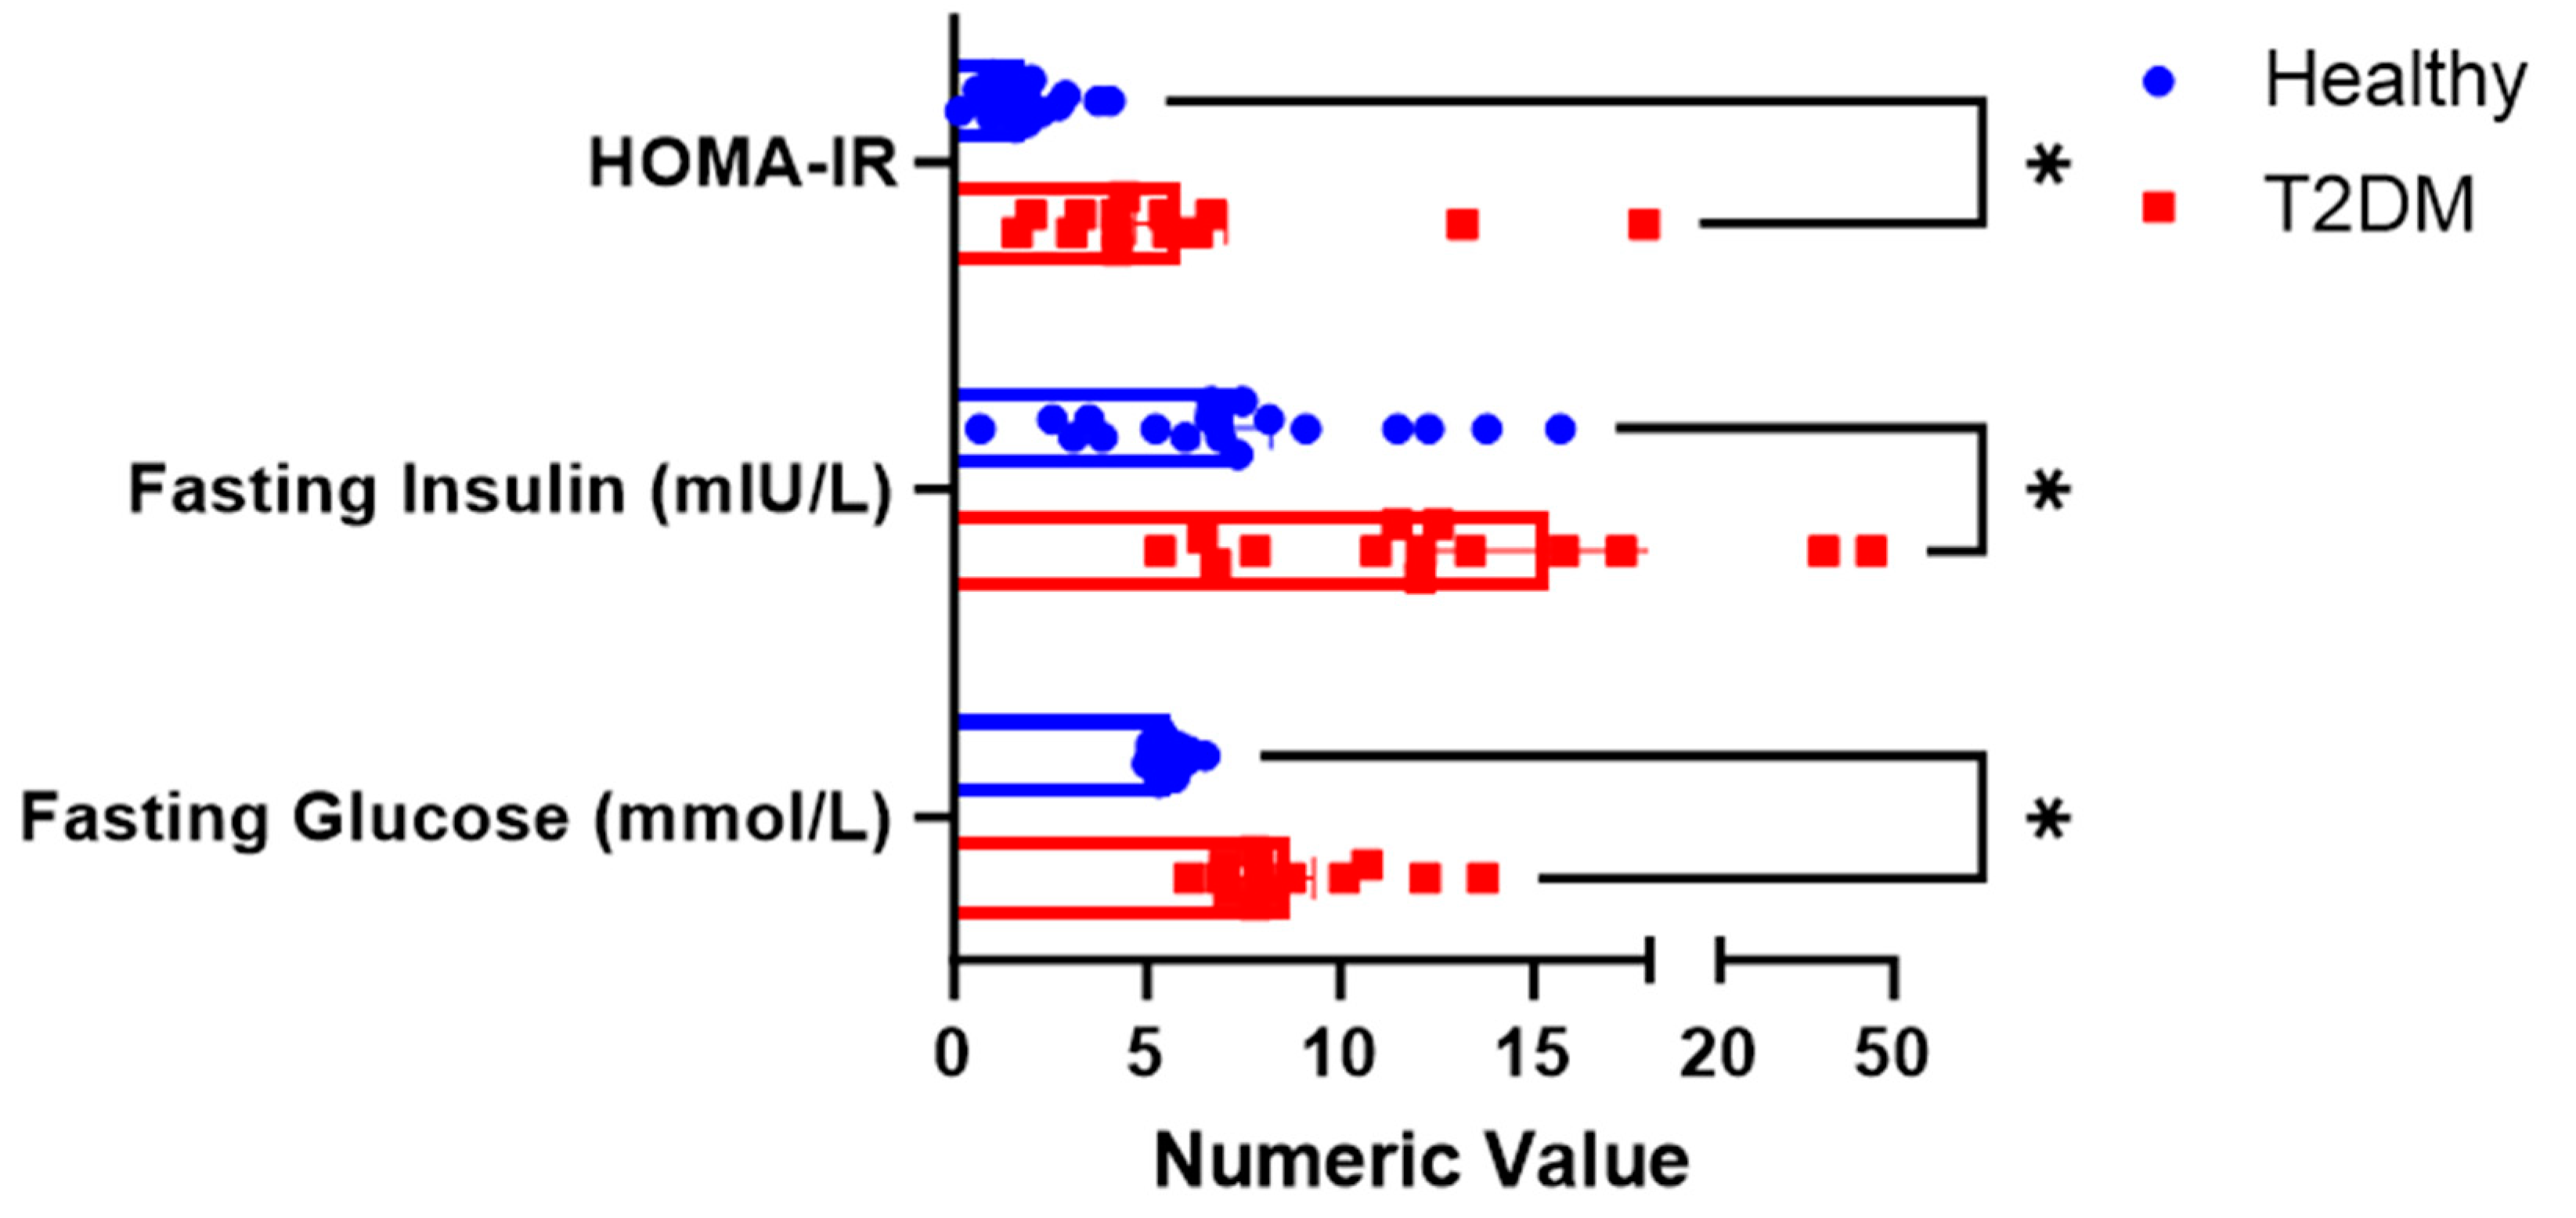
Figure 4.
Changes in postprandial insulin after consumption of parboiled rice and white rice. Each point represents mean ± SEM. *Insulin concentration significantly different between PBH and PBD at 120 minutes at p<0.05. Note: PBH=parboiled rice in healthy subjects; WRH=white rice in healthy subjects; PBD=parboiled rice in diabetics; WRD= white rice in diabetics.
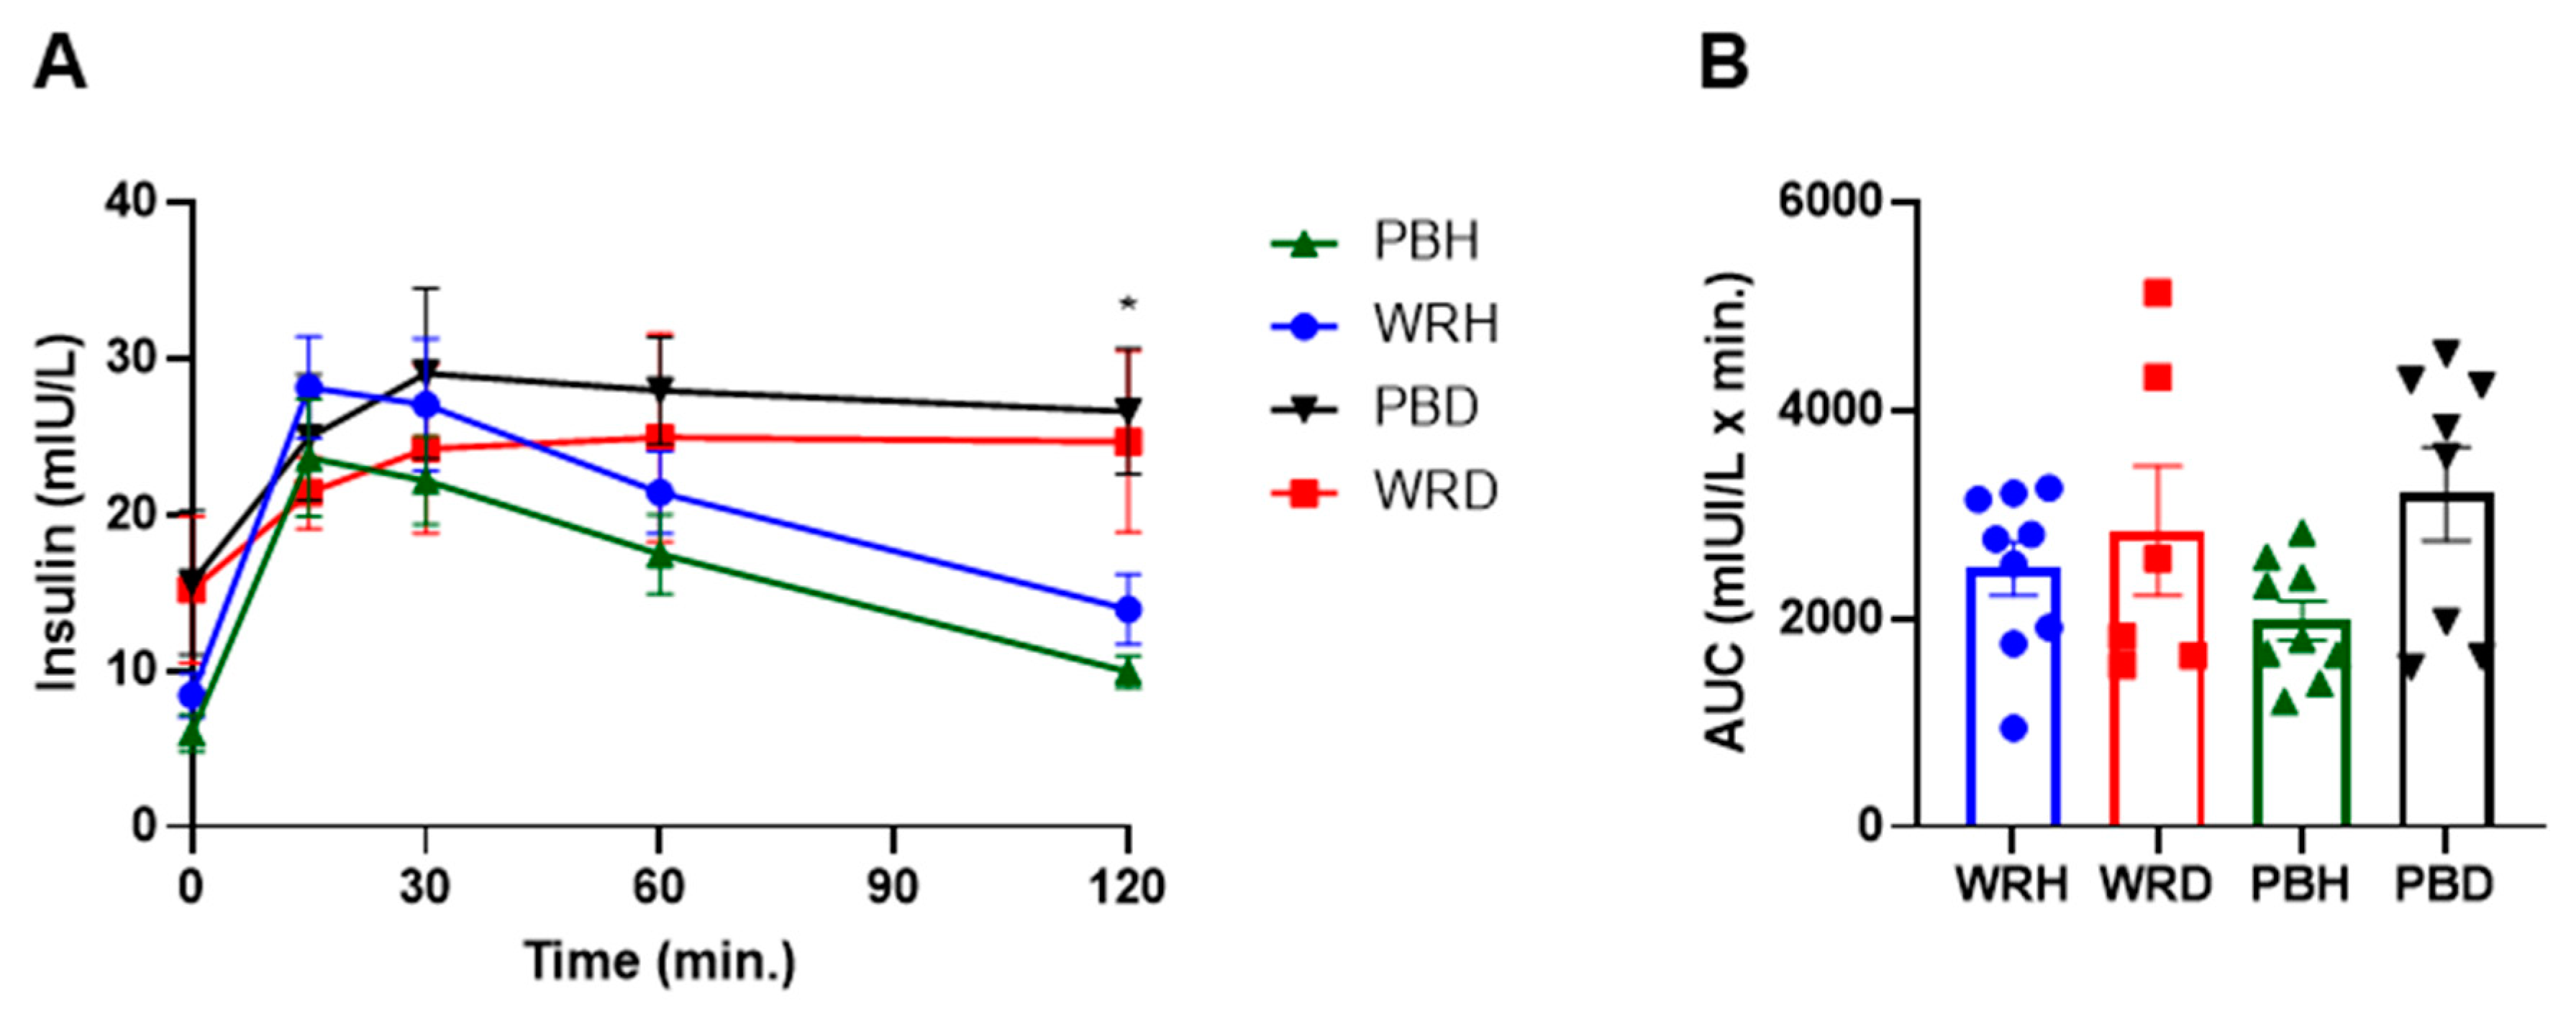
Figure 5.
Total GLP-1 AUC, HOMAR-B, Matsuda Index and Disposition Index generated from the responses to either WR or PBR in healthy subjects or those with T2DM. Data is presented as Mean ± SEM; Different superscript letters represent significant difference among the columns at P< 0.05. Note: PBH=parboiled rice in healthy subjects; WRH=white rice in healthy subjects; PBD=parboiled rice in diabetics; WRD= white rice in diabetics.
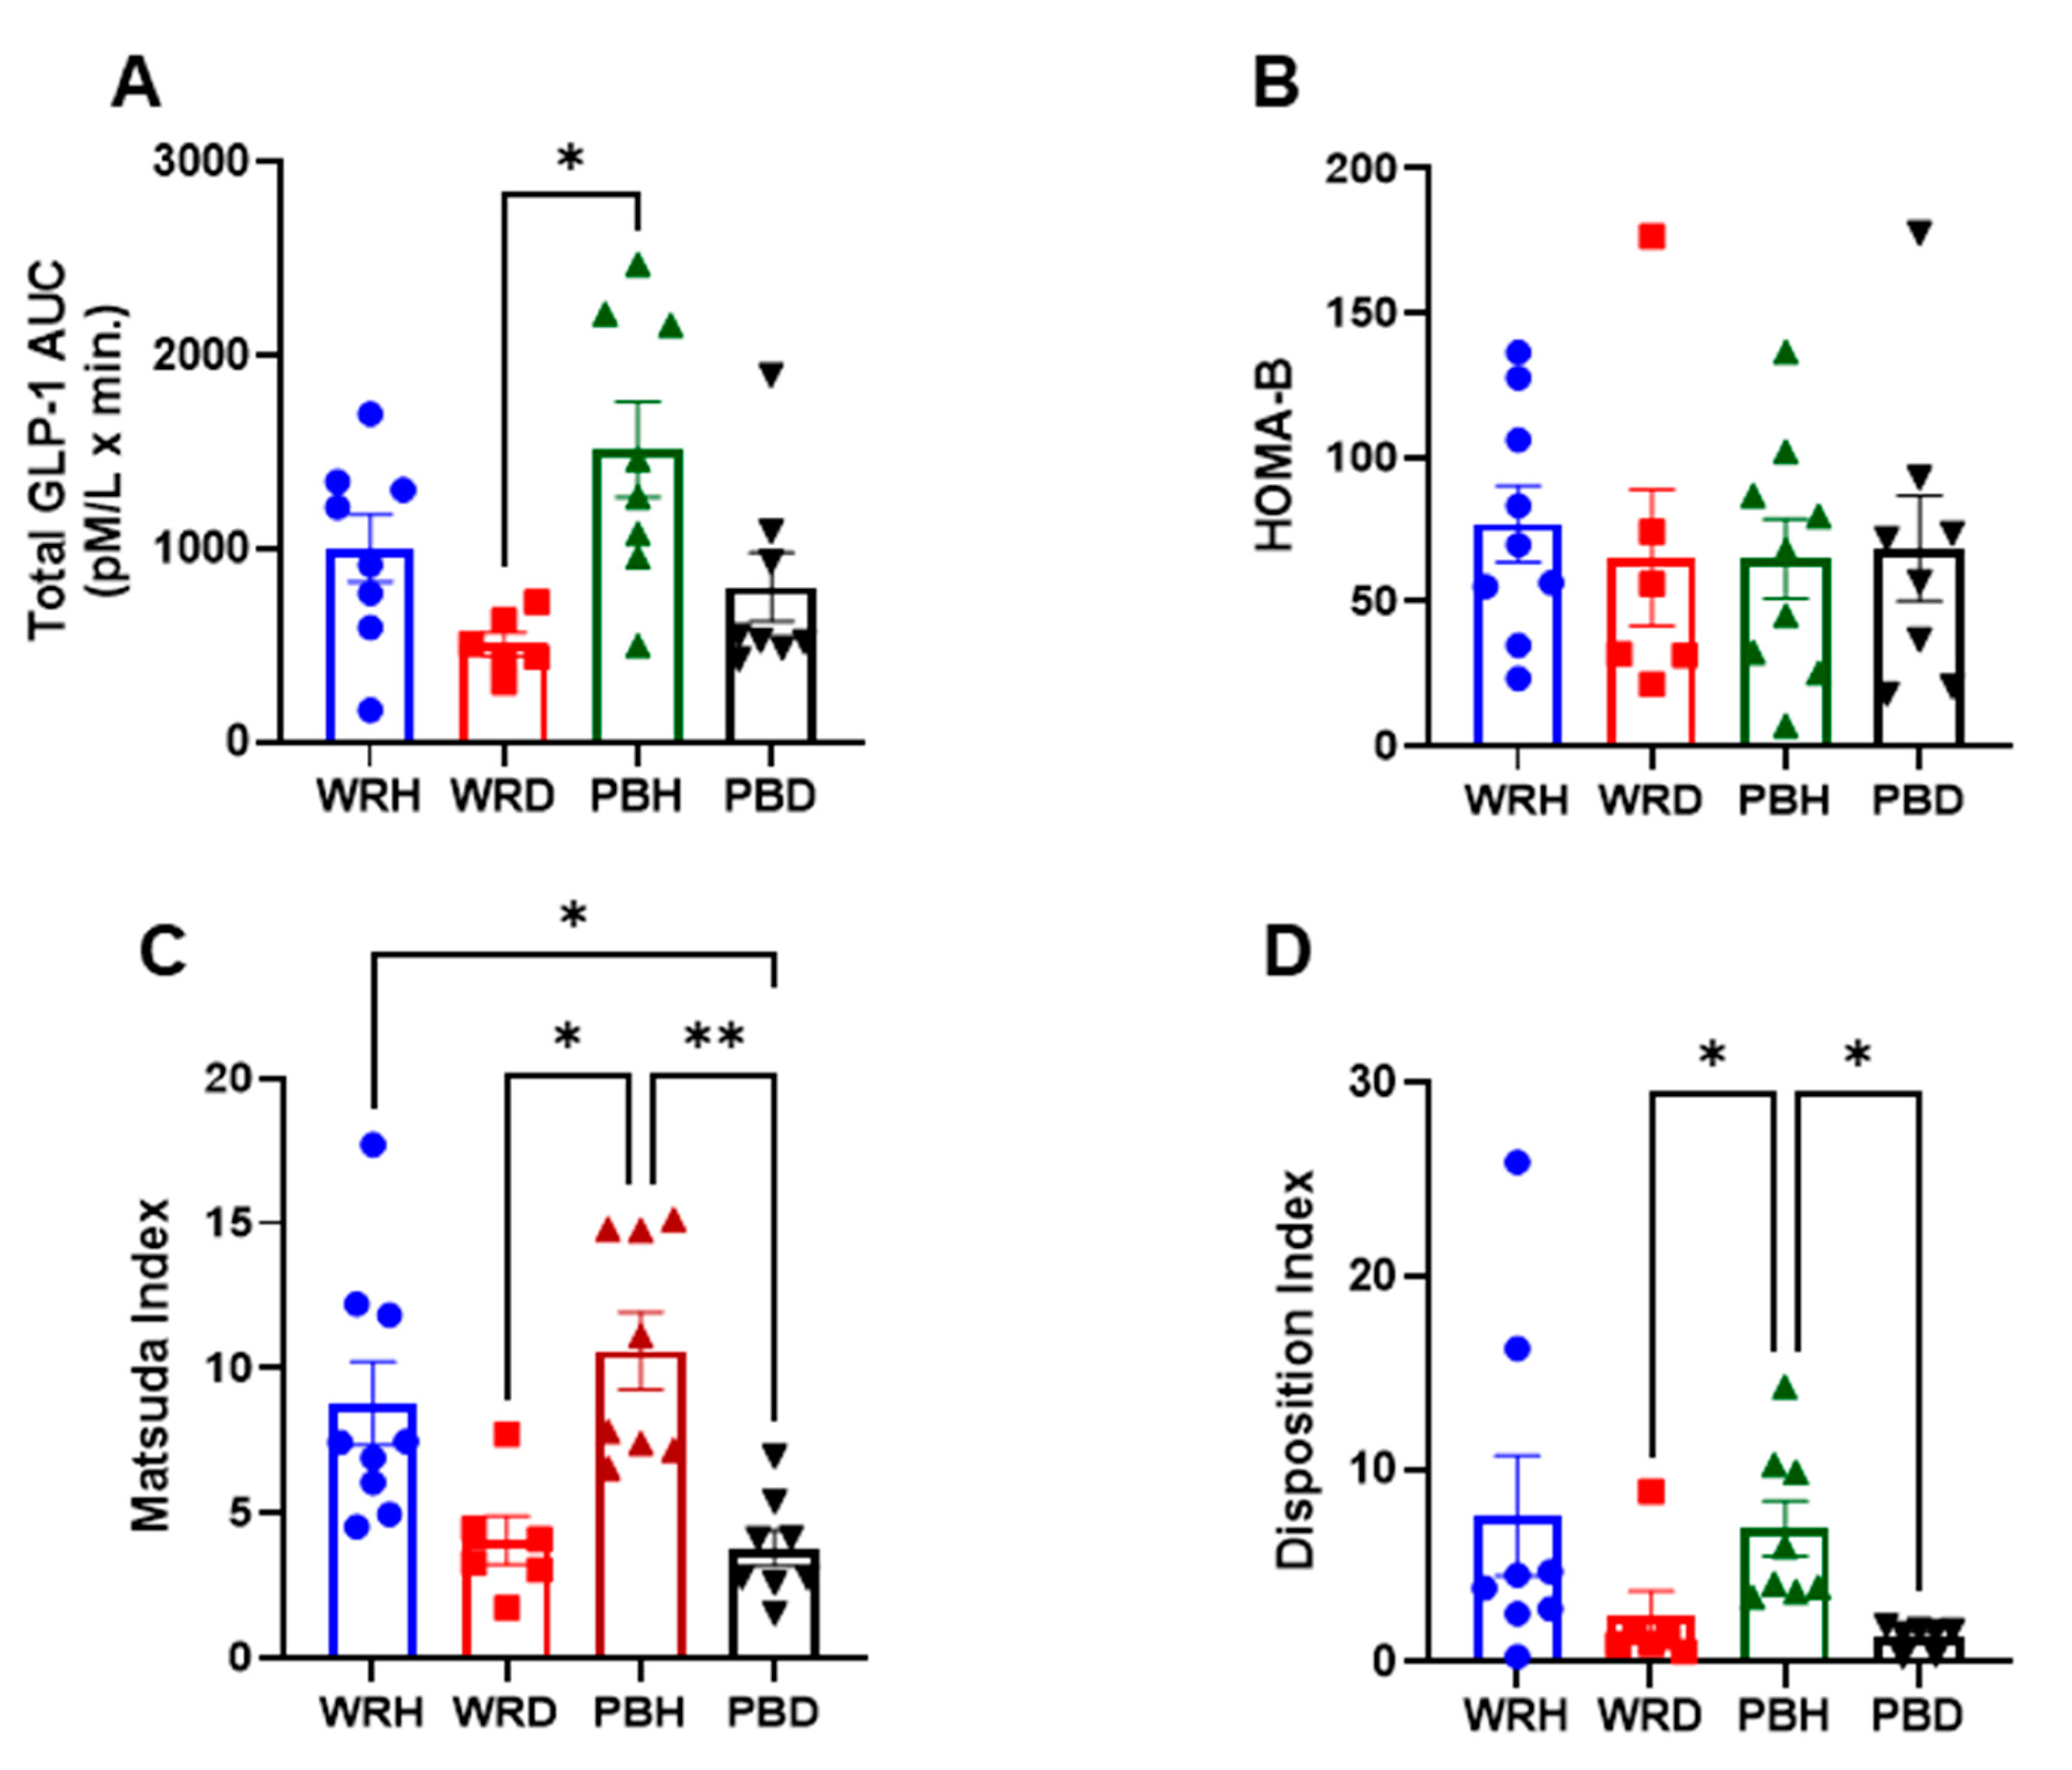

Table 1.
Demographic and Clinical Characteristics of Study Groups.
| Variable | Diabetic (n = 8) | Healthy (n = 9) |
| Gender Male / Female (n) |
3 / 5 |
4 / 5 |
| Age (years) Mean ± SD | 45.96 ± 11.34 | 32.9 ± 2.64 |
| BMI (kg/m²) Mean ± SD | 31.23 ± 4.50 | 23.54 ± 0.74 |
| Blood Pressure (mm Hg) Mean ± SD Systolic Diastolic |
117.33 ±11.82 79.33 ± 7.07 |
112.5 ± 9.99 80 ± 3.53 |
| HbA1c (%) | 6.75 ± 0.67 | 4.96 ± 0.28 |
Disclaimer/Publisher’s Note: The statements, opinions and data contained in all publications are solely those of the individual author(s) and contributor(s) and not of MDPI and/or the editor(s). MDPI and/or the editor(s) disclaim responsibility for any injury to people or property resulting from any ideas, methods, instructions or products referred to in the content. |
© 2025 by the authors. Licensee MDPI, Basel, Switzerland. This article is an open access article distributed under the terms and conditions of the Creative Commons Attribution (CC BY) license (http://creativecommons.org/licenses/by/4.0/).
Copyright: This open access article is published under a Creative Commons CC BY 4.0 license, which permit the free download, distribution, and reuse, provided that the author and preprint are cited in any reuse.


