Submitted:
23 April 2025
Posted:
24 April 2025
You are already at the latest version
Abstract
Objective: This study aimed to evaluate the prognostic utility of systemic inflammatory markers, such as the Systemic Immune-Inflammation Index (SII), Systemic Inflammatory Response Index (SIRI), Neutrophil-Lymphocyte Ratio (NLR), Monocyte-Lymphocyte Ratio (MLR), and Platelet-Lymphocyte Ratio (PLR), to identify patients at risk of developing surgically treated Dressler syndrome. Methods: A total of 150 patients were retrospectively analyzed. 75 patients who developed Dressler syndrome requiring surgical drainage constituted the Dressler group, whereas 75 age-and surgically matched non-Dressler patients served as the control group. Blood samples were collected at four time points: preoperative (T1), 24 h postoperative (T2), postoperative day 7 (T3), and 24 h before secondary intervention in the Dressler group and the closest matched outpatient follow-up (T4) in the control group. Inflammatory marker values were compared within and between the groups at the four defined time points. Logistic regression and receiver operating characteristic (ROC) analyses were used to determine the diagnostic and predictive accuracy of each marker. Results: Significant increases in SIRI, MLR, and CRP levels were observed in patients who developed DS and required surgical intervention. MLR on postoperative day 7 showed the highest sensitivity (84%) with a cutoff of 0.575, whereas SIRI demonstrated the highest specificity (81.3%) at a cutoff of 3.34. The SII increased significantly only in the late stage, indicating disease progression. The NLR lacked predictive power across all time points.
Conclusion: SIRI and MLR are promising early stage biomarkers for identifying patients at a high risk of developing DS. Their integration into routine postoperative follow-up could facilitate earlier diagnosis and reduce surgical burden. A multimarker approach may enhance the diagnostic precision of DS beyond that of traditional inflammatory measures.
Keywords:
Pericarditis
; Postoperative Complications
; Biomarkers
; Post pericardiotomy syndrome
; Cardiac Surgery
1. Introduction
Dressler syndrome (DS), a subtype of post-cardiac injury syndrome, is characterized by autoimmune pericarditis that typically develops weeks to months after myocardial infarction, cardiac surgery, or cardiac trauma[1]. Although the clinical picture is well-characterized, the underlying pathophysiological mechanisms remain unclear. It is thought to result from an autoimmune response triggered by myocardial or pericardial injury[2]. These autoantibodies accelerate the inflammatory cascade, resulting in pericardial and pleural inflammations.
The clinical presentation of DS ranges from mild self-limiting pericarditis to severe pericardial effusion, which requires invasive intervention[3]. Clinically, pericarditis presents with pleuritis, fever, and chest pain[2]. Typically, the median time to resolution of DS after cardiac surgery is 2-3 weeks [4,5]. Possible recurrences tend to occur within 2-11 weeks of the initial onset [6].
Despite significant advances in cardiac surgery and perioperative care, it remains a clinical challenge, and its incidence varies widely depending on surgical technique and patient characteristics[7]. While current guidelines emphasize NSAIDs, colchicine, and corticosteroids for treatment [8], a proportion of patients remain at risk for persistent inflammation and recurrent effusions requiring surgical drainage[9].
Currently, no specific biomarker or standardized diagnostic criteria can reliably predict the development or severity of DS at an early stage. In addition, the lack of an objective distinction between mild and severe forms of DS makes the early prediction of high-risk cases difficult. Predictive factors for DS, especially in differentiating patients who require invasive intervention from those who do not, have not been adequately investigated in the literature. Although traditional inflammatory markers such as C-reactive protein (CRP) and erythrocyte sedimentation rate (ESR) are usually elevated in DS, they lack specificity and predictive accuracy in the postoperative period[10].
The Systemic Inflammatory Response Index (SIRI) and Systemic Inflammation Index (SII) are novel biomarkers that reflect the interplay between the immune and inflammatory processes. They have been used to determine the degree of inflammation in many clinical conditions, especially in oncology, cardiovascular diseases, and autoimmune diseases[9]. However, their application in the context of DS has yet to be explored. Given that DS is a putative inflammatory condition with an autoimmune component, these markers may provide information on the onset, progression, and severity of the disease. This study provides a novel analysis to understand the dynamics and potential of the systemic inflammatory response by integrating novel biomarkers such as SIRI and SII into the clinical evaluation of DS. By evaluating the dynamic changes in these biomarkers from the preoperative to the postoperative phase, we aimed to identify reliable markers that can facilitate early diagnosis and intervention and to identify factors leading to the need for repeat surgical drainage. Thus, we hope to contribute to the development of predictive models for early diagnosis and individualized therapeutic approaches.
2. Materials and Methods
2.1. Study Design and Patient Selection
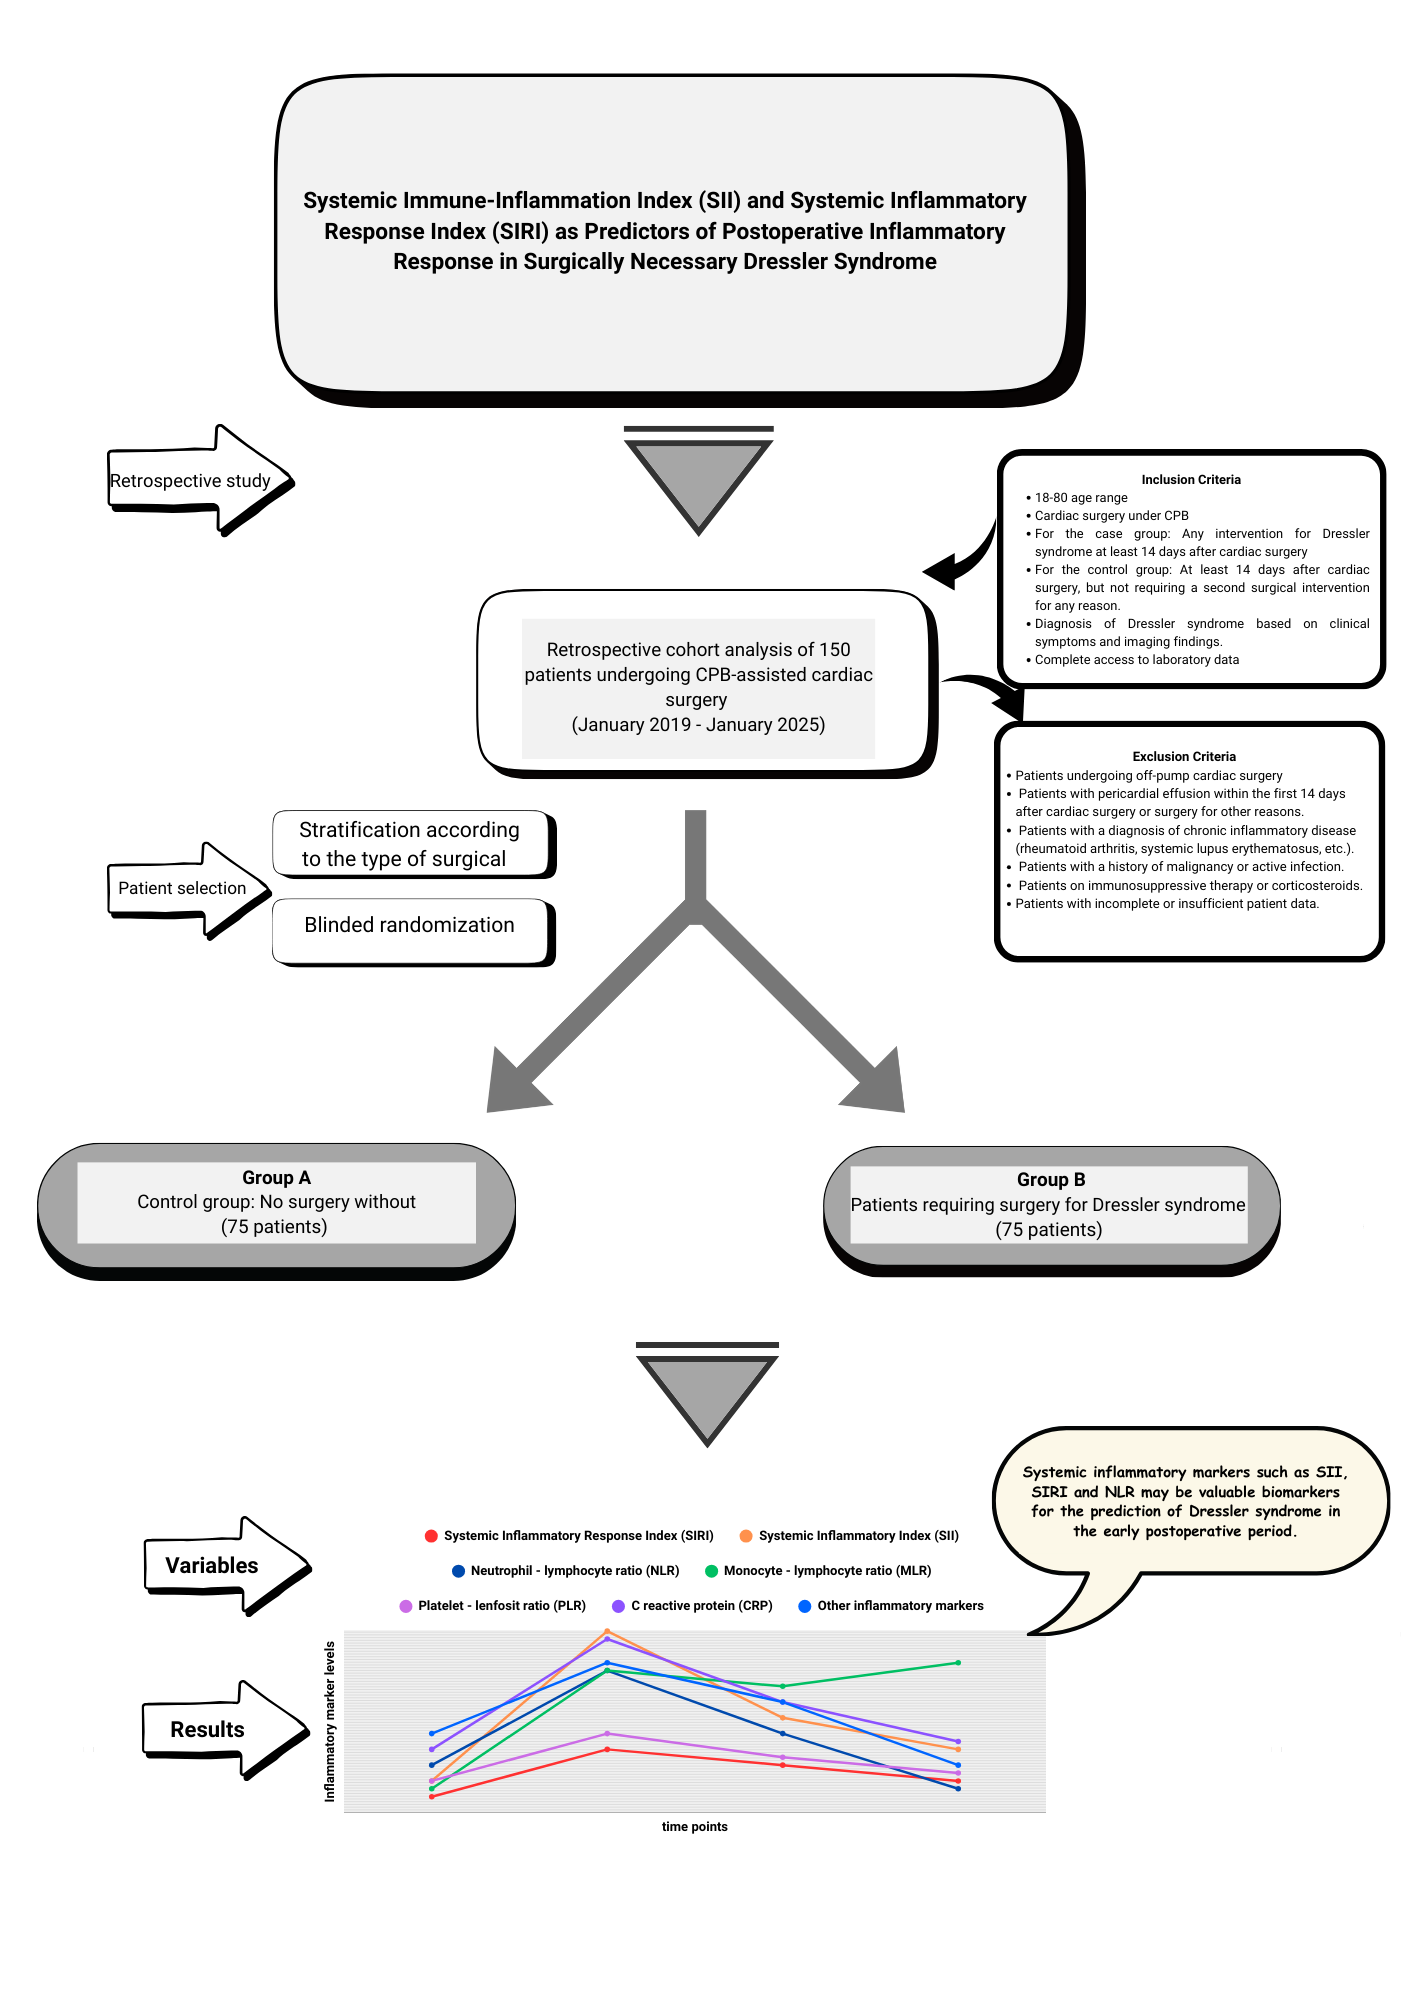
This retrospective observational cohort study was conducted at our center between January 2019 and January 2025. The study population consisted of patients aged 18–80 years who underwent cardiopulmonary bypass (CPB)-assisted cardiac surgery. As the majority of patients requiring surgical intervention for DS underwent on-pump cardiac surgery, only those who underwent CPB were included to ensure homogeneity and rule out the heterogeneous effects of on-pump and off-pump techniques on systemic inflammation. Informed consent was not obtained due to the retrospective nature of the study
In total, 150 patients were included in this study. The study population was divided into two groups. The first group was defined as the control group (n=75) consisting of patients who did not receive medical treatment for pericardial or pleural effusion after cardiac surgery and did not require inflammatory complications or additional surgical intervention, and the second group was defined as the Dressler group (n=75) consisting of patients who underwent a second invasive intervention (subxiphoid drainage, thoracotomy, median sternotomy, pericardiocentesis) with a diagnosis of DS that occurred on or after the 14th day after surgery. When forming the control group, stratification was applied based on the type of surgical intervention to reduce possible selection bias. The control group patients were divided into subgroups according to the surgical procedures performed, and in each surgical subgroup, patients with a similar surgical profile to those in the Dressler group but who were not diagnosed with DS were identified. Then, one-to-one (1:1) patient file matching was performed by a random selection method by non-clinical personnel (floor secretary) without any clinician intervention or guidance among these files. Randomization was performed without knowledge of inflammation, development of complications, or prognosis information in the patient file. This approach aimed to minimize surgical heterogeneity between the case and control groups and reduce the risk of selection bias.
The inclusion and exclusion criteria for the study design are shown in Figure 1. Patient identification was performed by reviewing the medical records, operative notes, and hospital information system (HIS) data. The study was approved by the Ethics Committee of Ankara Bilkent City Hospital, No. 1 (Approval No: 652, 23-10-2024). All the procedures were conducted in accordance with the principles of the Declaration of Helsinki. Confidentiality of personal data was meticulously protected, and patient identities were anonymized
2.2. Diagnosis of Dressler Syndrome
In accordance with the available literature and ESC guidelines, only patients who developed DS–14-90 days after cardiac surgery were included in this study [4,5,6,11]. Pericardial effusion and inflammatory responses that develop in the first two weeks following surgery are generally considered to be associated with acute postoperative inflammation or surgical complications (e.g., bleeding, tamponade, and infection), and these patients were excluded.
Diagnosis of DS is based on a combination of clinical symptoms, electrocardiographic changes, laboratory findings, and imaging modalities. Clinical symptoms included fever, pericardial pain, and pericardial friction. Elevated levels of inflammatory markers, such as CRP, ESR sedimentation rate, and electrocardiographic findings indicating pericarditis were key components of the diagnosis. Telecardiography was routinely performed. However, transthoracic echocardiography (TTE) and/or computed tomography (CT) of the thorax is used in cases of clinical suspicion. Significant pericardial effusion was defined as pericardial fluid depth of > 10 mm surrounding the heart, especially in the right and left ventricular regions, and signs of cardiac compression. Indications for invasive intervention in patients with DS were determined using a standardized clinical protocol and evaluation. Medical treatment (nonsteroidal anti-inflammatory drugs and colchicine) was initiated at the time of DS diagnosis. The decision for an invasive procedure was made in the progression of the amount of effusion confirmed by TTE or thoracic CT and cardiac tamponade impairing hemodynamic stability. Cardiac tamponade was diagnosed based on the presence of clinical signs (heart rate >100/min or pulsus paradoxus (>10 mmHg decrease in systolic blood pressure on inspiration] ) and the observation of right ventricular compression in diastole by echocardiography[12]. In contrast, dyspnea, refractory fever, and persistently elevated inflammatory markers such as CRP and WBC were the main determinants of the decision to perform surgical drainage.
2.3. Data Collection and Measurements
Peripheral blood samples were collected at four different time points to evaluate temporal changes in inflammatory markers in both groups. These points were defined as T1: preoperative period, T2: first 24 hours postoperatively, T3: 7th postoperative day, T4: 24 hours before the intervention for DS in the Dressler group and the closest matched outpatient clinic follow-up day in the control group.
The SII, SIRI, Neutrophil/Lymphocyte Ratio (NLR), Monocyte/Lymphocyte Ratio (MLR), Platelet/Lymphocyte Ratio (PLR), CRP level, and leukocyte (WBC) count were analyzed in both groups. Inflammatory indices were calculated using the following formula:
- Systemic Immune-Inflammation Index (SII) = (Platelet count × Neutrophil count) / Lymphocyte count
- Systemic Inflammatory Response Index (SIRI) = (Neutrophil count × Monocyte count) / Lymphocyte count
Comparisons were made within and between the groups at four time points. Blood samples were collected preoperatively, in the first 24 h postoperatively, and on postoperative day 7 according to standardized and temporally constant protocols. However, in the group of patients who underwent surgery for DS, biomarkers for the fourth time point (preoperative) were collected at heterogeneous time intervals between weeks 2 and 11 before surgery, when the disease was clinically indicative of surgery. This restricts the temporal matching of the fourth time-point data of the Dressler and control groups. However, in the routine follow-up protocol applied in our clinic, all cardiac surgery patients were referred for outpatient clinic visits on an average on the 10th day, 4th week, and 8th week after discharge. This allowed access to biomarker data for patients in the control group at intervals similar to the time distribution in the Dressler group. Therefore, although the measurements at time point 4 did not show absolute temporal correspondence, they were considered to represent clinically similar postoperative periods, and methodological agreement was achieved owing to the standardized regular follow-up protocol over time.
Inflammatory markers from T3 were used in the analyses to predict DS. This time point was chosen because the acute postoperative inflammatory response is largely due to systemic surgical trauma, whereas inflammatory profiles emerging around day 7 are more specific and likely to reflect pathological processes.
2.4. Operative Management and Drainage Procedure
All the patients diagnosed with pericardial tamponade were transferred to the operating room. The choice of incision for pericardial fluid drainage was determined by the surgical team based on echocardiography (model and brand) and/or CT findings. All patients underwent general anesthesia. Routine surgical antibiotic prophylaxis was administered preoperatively and during tube drainage in accordance with the clinical procedures. The decision to open a pericardiopleural window (PPW) was made by the same surgical team.
At the end of the procedure, a closed tube drainage system was placed in the pericardial or thoracic region to drain pericardial fluid. The drainage tube remained in the pericardial or thoracic cavity for at least 72 hours, and the drainage volume was closely monitored. The drain was removed when the daily drainage volume fell below 100 cc or when follow-up echocardiography showed that the remaining fluid volume was less than 5 mm in both the anterior and posterior regions. Repeat echocardiography or CT evaluations were performed for suspected tamponade or hemodynamic instability.
2.5. Statistical Analysis
In the power analysis performed using the G*Power software, when a medium effect size (Cohen's f = 0.25), alpha = 0.05, and power = 0.80, at least 64 patients were required for each group. However, 75 patients were included in each group to obtain more reliable results. Continuous variables are expressed as mean ± standard deviation, and categorical data are reported as frequencies and percentages. An independent sample t-test was used to compare the differences between the two groups for normally distributed data, and the Mann-Whitney U test was used for non-normally distributed data. The chi-square test was used to compare categorical data. To examine longitudinal changes over time, repeated-measures analysis of variance (ANOVA) was used for normally distributed variables, while the Friedman test was used for non-normally distributed variables. The Wilcoxon Signed-Rank Test was applied as a post-hoc analysis to determine the differences over time.
Univariate logistic regression analysis was used to evaluate the association between inflammatory markers and DS development and to analyze risk factors a priori. Statistically significant variables (p<0.05) were included in the multivariate regression analysis to determine the independent risk factors. For multivariate analyses, a stepwise model was created using the Forward: Likelihood Ratio (LR) method. Odds ratios (OR) with 95% confidence intervals (CI) were calculated using a logistic regression analysis. The overall fit and validity of the model were assessed using the Hosmer-Lemeshow fit test. Receiver Operating Characteristic (ROC) curve analysis was performed to evaluate the effectiveness of the inflammatory markers in predicting the development of DS. The results are presented as the area under the curve (AUC). Inflammatory markers that predicted DS occurrence and corresponded to the maximum value of the Youden index were used to determine the optimal cut-off values. A p value <0.05 was considered significant in all statistical analyses
The Statistical Package for the Social Sciences) version 27.0, was used for the statistical analysis of the data obtained. Microsoft® Excel® MSO for Microsoft 365 (Version 2503 Build 16.0.18623.20116), 64 bits for tables, Microsoft Visio Professional 2019 for graphics and images, and the Canva pro program for flow charts were used.
3. Results
Demographic and preoperative characteristics of the study population are presented in Table 1. The mean age was significantly lower in the Dressler group than in the control group (54.88 ± 14.33 vs. 60.00 ± 10.89 years, p = 0.025). There was no statistically significant difference in the sex distribution between the groups (p = 0.473), with males constituting 73.33% of the control group and 68% of the Dressler group. The mean body weight and body mass index (BMI) were also significantly lower in the Dressler group compared to the control group (75.41 ± 11.54 vs. 80.88 ± 11.92 kg, p = 0.010; and 26.43 ± 4.57 vs. 28.26 ± 4.39 kg/m², p = 0.004, respectively). The preoperative left ventricular ejection fraction (LVEF) did not significantly differ between the two groups (55.79 ± 7.91 vs. 54.95 ± 8.77, p = 0.666).The chronic disease and comorbidity profiles of patients in both groups were similar. Analysis of the blood group distribution showed that Rh-positive A was the most prevalent blood group in both groups, followed by Rh-positive. However, no significant differences in the ABO and Rh group distributions were detected between the groups (p = 0.977).
The mean time from primary cardiac surgery to the second surgical intervention for DS was 29.05 ± 17.48 days (median: 21 days). The operative characteristics of the study cohort are summarized in Table 2. Cardiopulmonary bypass (CPB) and aortic cross-clamp (ACC) times were comparable between the two groups, with no statistically significant differences.
However, the distribution of the primary surgical procedures differed significantly. Aortic valve replacement (AVR) was the most frequently performed procedure in the control group (n = 14, 18.7%), whereas aortic surgery was the most prevalent in the Dressler group (n = 29, 38.7%) (p = 0.003). Sternotomy was the most common surgical approach in both groups, with no significant difference in frequency (p = 0.620).
Regarding postoperative drainage, mediastinal chest tube placement alone was the most common approach in both the groups (control: n = 35, 46.7%; Dressler: n = 30, 40%). Multicompartmental drainage, defined as the insertion of tubes into the mediastinum, left thorax, and right thorax, was more frequently used in the Dressler group (n = 11, 14.7%) than in the control group (n = 6, 8.0%), although the difference was not statistically significant (p = 0.518).
The early postoperative outcomes in both the groups are summarized in Table 3. There were no statistically significant differences between the Dressler and control groups in terms of intensive care unit (ICU) stay, duration of intubation, or total postoperative drainage volume. Similarly, the number of transfused blood products and incidence of early postoperative complications did not differ significantly between the two groups (p > 0.05).
However, patients in the Dressler group had a significantly longer total hospital stay compared to the control group (p < 0.05). Additionally, the rehospitalization rate was significantly higher in the Dressler group, suggesting a greater burden of postoperative morbidity. Although the 30-day mortality rate was higher in the Dressler group (n = 6, 8%), the difference was not statistically significant (p = 0.058).
A comparison of postoperative anticoagulant and antiplatelet strategies as well as mean international normalized ratio (INR) values between the study groups is presented in Table 4. INR levels reflect spot measurements obtained preoperatively and before corrective intervention in the Dressler group. In the control group, INR values were retrieved during routine outpatient follow-up visits. Among patients receiving warfarin therapy, the mean INR was higher in the Dressler group (2.87 ± 0.93) than in the control group (2.52 ± 0.48); however, this difference was not statistically significant (p = 0.114).
There were no statistically significant differences between the two groups in terms of anticoagulant or antiplatelet use. Warfarin was the most commonly used agent in both groups (59.5% in the control group vs. 47.7% in the Dressler group, p = 0.32). The use of acetylsalicylic acid (ASA), clopidogrel, dual antiplatelet therapy (DAPT; ASA + clopidogrel), triple therapy (TT; DAPT + anticoagulant), and direct oral anticoagulants (DOACs) was also comparable between the groups (p > 0.05).
The surgical drainage methods used in the patients requiring invasive intervention for DS are summarized in Table 5. Four different surgical approaches were used in this cohort, with a statistically significant variation in their distribution (p < 0.001). Thoracotomy (either right or left) was the most frequently performed technique (37 patients, 49.3%), followed by median sternotomy (26 patients, 34.7%). Pericardiocentesis under echocardiographic guidance was applied in seven patients (9.3%), while subxiphoid incision was used in only five patients (6.7%).
In addition, 33 of 75 patients (44.0%) underwent a pericardiopleural window (PPW) procedure in addition to thoracotomy or sternotomy according to intraoperative findings and effusion characteristics.
Telecardiography was routinely used to image all patients with DS (n=75). In the diagnostic and invasive intervention decision-making process, the combined use of CT and echocardiography was preferred over other methods (n=35, 46.67%), followed by echocardiography alone (n=24, 32%), and CT alone (n=16, 21.33%). When the agreement of the effusion amounts obtained from CT and echocardiography imaging methods was analyzed with the intraclass correlation coefficient (ICC) coefficient, no agreement was found between the two methods (ICC= 0.155, CI :95% (-0.170;0.449 and p=0.173)
Table 6 shows the temporal changes in systemic inflammatory markers (SII, SIRI, NLR, PLR, MLR, CRP, and WBC) at four predefined time points (T1 to T4) in both the control and DS groups. Significant between-group differences over time were observed for all markers, except NLR (p < 0.001 for all other markers). A significant increase in SII, SIRI, PLR, CRP, and WBC count was noted in the Dressler group, especially at T4, the time point before surgery. These levels were significantly higher in the Dressler group than in the control group at the same time points (p < 0.05).
In the Dressler group, SII, PLR, and CRP were significantly elevated at T4, but not at earlier time points. In contrast, SIRI and WBC count started to increase at T3 and peaked at T4, indicating a progressive systemic inflammatory response. Furthermore, while the MLR was significantly higher in the Dressler group at T3, this difference was no longer significant at T4. There was no significant difference in the NLR at any time point in either group. Dynamic changes in inflammatory markers at four different time points are shown as a line graph in Figure 2.

Table 7.
summarizes the temporal changes in standard biochemical parameters, including urea, creatinine, lactate dehydrogenase (LDH), aspartate aminotransferase (AST), alanine aminotransferase (ALT), and albumin, measured at four time points. LDH levels were significantly higher at T4 in the Dressler group (p = 0.020), whereas no significant difference was found between the groups for the other markers. The within-group differences over time were not statistically significant. Table 6. Temporal Variation in Inflammatory Marker Levels at Four Postoperative Time Points in Patients With and Without Dressler Syndrome.
| Control group | Dressler group | P | |||||||||||||||
| Mean± Sd | Median | Min | ― | Max | Mean± Sd | Median | Min | ― | Max | ||||||||
| SII (Systemic inflammation index) | Preoperative (T1) | 520.89 | ± | 173.49 | 481.14 | 306.84 | - | 1254.40 | 608.89 | ± | 270.03 | 562.67 | 230.88 | - | 1738.09 | 0.073 | |
| postoperative 1 th day (T2) | 1482.56 | ± | 1051.41 | 1131.58 | 523.33 | - | 7605.53 | 1468.86 | ± | 1207.35 | 1240.80 | 385.55 | - | 7093.41 | 0.759 | ||
| postoperative 7th day (T3) | 1017.93 | ± | 655.65 | 887.03 | 61.71 | - | 3884.51 | 1187.23 | ± | 947.14 | 931.30 | 178.07 | - | 4637.39 | 0.551 | ||
| Before Dressler surgery (T4) | 654.17 | ± | 275.13 | 583.63 | 314.72 | - | 1550.71 | 771.17 | ± | 364.30 | 672.10 | 272.37 | - | 2216.86 | 0.020 | ||
| p (in-group) | <0,001 | <0,001 | |||||||||||||||
| SIRI (Systemic Inflammation Response Index) | Preoperative (T1) | 1.07 | ± | 0.35 | 1.01 | 0.59 | - | 2.91 | 1.19 | ± | 0.66 | 1.00 | 0.49 | - | 3.90 | 0.762 | |
| postoperative 1 th day (T2) | 4.97 | ± | 2.17 | 4.32 | 2.03 | - | 13.81 | 4.78 | ± | 2.36 | 4.15 | 1.35 | - | 13.81 | 0.327 | ||
| postoperative 7th day (T3) | 2.78 | ± | 2.09 | 2.40 | 0.93 | - | 14.80 | 3.12 | ± | 1.63 | 2.68 | 0.87 | - | 8.32 | 0.036 | ||
| Before Dressler surgery (T4) | 1.82 | ± | 0.78 | 1.57 | 0.97 | - | 4.57 | 2.00 | ± | 0.89 | 1.76 | 1.06 | - | 6.67 | 0.064 | ||
| p (in-group) | <0,001 | <0,001 | |||||||||||||||
| NLR (Neutrophil to Lymphocyte Ratio | Preoperative (T1) | 2.32 | ± | 0.65 | 2.22 | 1.28 | - | 5.60 | 2.67 | ± | 1.14 | 2.26 | 1.41 | - | 7.79 | 0.194 | |
| postoperative 1 th day (T2) | 7.67 | ± | 2.74 | 7.05 | 4.29 | - | 18.50 | 7.48 | ± | 2.76 | 6.93 | 3.47 | - | 18.50 | 0.693 | ||
| postoperative 7th day (T3) | 5.26 | ± | 2.87 | 4.57 | 1.90 | - | 20.55 | 5.04 | ± | 2.20 | 4.78 | 1.90 | - | 12.24 | 0.845 | ||
| Before Dressler surgery (T4) | 2.68 | ± | 1.02 | 2.38 | 1.11 | - | 6.01 | 2.87 | ± | 1.22 | 2.63 | 1.28 | - | 9.01 | 0.195 | ||
| p (in-group) | <0,001 | <0,001 | |||||||||||||||
| PLR (Platelet-to-lymphocyte ratio) | Preoperative (T1) | 139.87 | ± | 40.52 | 129.71 | 83.11 | - | 320.00 | 144.31 | ± | 43.29 | 139.11 | 45.27 | - | 265.22 | 0.397 | |
| postoperative 1 th day (T2) | 140.18 | ± | 70.37 | 121.80 | 50.56 | - | 461.17 | 135.02 | ± | 61.06 | 122.13 | 53.62 | - | 372.36 | 0.888 | ||
| postoperative 7th day (T3) | 138.38 | ± | 74.82 | 123.20 | 10.71 | - | 400.76 | 159.65 | ± | 94.27 | 135.22 | 40.95 | - | 428.43 | 0.322 | ||
| Before Dressler surgery (T4) | 165.97 | ± | 49.57 | 162.94 | 86.10 | - | 308.79 | 191.25 | ± | 60.86 | 177.21 | 61.62 | - | 490.74 | 0.002 | ||
| p (in-group) | <0,001 | - | <0,001 | - | |||||||||||||
| MLR (Monocyte-to-lymphocyte ratio | Preoperative (T1) | 0.29 | ± | 0.09 | 0.26 | 0.15 | - | 0.58 | 0.27 | ± | 0.09 | 0.25 | 0.16 | - | 0.56 | 0.231 | |
| postoperative 1 th day (T2) | 0.48 | ± | 0.12 | 0.44 | 0.27 | - | 0.78 | 0.46 | ± | 0.13 | 0.44 | 0.18 | - | 0.78 | 0.391 | ||
| postoperative 7th day (T3) | 0.36 | ± | 0.12 | 0.33 | 0.19 | - | 0.85 | 0.43 | ± | 0.14 | 0.40 | 0.18 | - | 0.85 | 0.001 | ||
| Before Dressler surgery (T4) | 0.46 | ± | 0.12 | 0.44 | 0.26 | - | 0.73 | 0.51 | ± | 0.16 | 0.47 | 0.29 | - | 1.15 | 0.106 | ||
| p (in-group) | <0,001 | <0,001 | |||||||||||||||
| - | - | ||||||||||||||||
| CRP (C-reactive protein) | Preoperative (T1) | 5.82 | ± | 2.93 | 5.90 | 1.00 | - | 11.10 | 6.35 | ± | 2.79 | 6.30 | 0.90 | - | 11.40 | 0.278 | |
| postoperative 1 th day (T2) | 93.75 | ± | 76.83 | 57.26 | 23.15 | - | 321.00 | 100.69 | ± | 79.97 | 57.29 | 23.15 | - | 381.00 | 0.381 | ||
| postoperative 7th day (T3) | 20.50 | ± | 19.83 | 15.00 | 1.00 | - | 122.00 | 30.82 | ± | 31.07 | 18.31 | 1.25 | - | 123.00 | 0.093 | ||
| Before Dressler surgery (T4) | 17.74 | ± | 15.46 | 12.50 | 4.00 | - | 78.70 | 32.49 | ± | 21.72 | 31.90 | 3.00 | - | 94.00 | 0.000 | ||
| p (in-group) | <0,001 | <0,001 | |||||||||||||||
| WBC (White blood cell) | Preoperative | 7.98 | ± | 3.43 | 6.96 | 3.70 | - | 21.95 | 7.29 | ± | 3.32 | 6.43 | 3.45 | - | 21.70 | 0.087 | |
| postoperative 1 th day | 14.39 | ± | 4.15 | 13.72 | 5.11 | - | 29.44 | 15.11 | ± | 5.32 | 14.70 | 5.97 | - | 35.97 | 0.501 | ||
| postoperative 7th day | 11.28 | ± | 4.52 | 9.94 | 4.80 | - | 26.67 | 12.24 | ± | 4.02 | 12.22 | 4.98 | - | 25.65 | 0.040 | ||
| Before Dressler surgery | 7.63 | ± | 3.66 | 7.11 | 2.33 | - | 25.85 | 9.97 | ± | 4.07 | 9.25 | 5.08 | - | 29.64 | 0.000 | ||
| p (in-group) | <0,001 | <0,001 | |||||||||||||||
SII, Systemic inflammation index; SIRI ,Systemic Inflammation Response Index; PLR ,Platelet-to-lymphocyte ratio; MLR, Monocyte-to-lymphocyte ratio; CRP ,C-reactive protein ; WBC, White blood cell.
Table 7.
Changes in Routine Biochemical Markers Across Time Points in Patients With and Without Dressler Syndrome.
Table 7.
Changes in Routine Biochemical Markers Across Time Points in Patients With and Without Dressler Syndrome.
| Control group | Dressler group | ||||||||||
| Mean±Sd | Median | Mean±Sd | Median | ||||||||
| Preoperative (T1) | Urea (mg/dl) | 40.87 | ± | 23.57 | 35.00 | 42.29 | ± | 26.04 | 35.00 | 0.914 | |
| Creatinine (mg/dl) | 1.10 | ± | 0.99 | 0.88 | 1.08 | ± | 0.81 | 0.88 | 0.571 | ||
| LDH (U/Lt) | 234.64 | ± | 87.84 | 228.00 | 235.07 | ± | 85.97 | 216.00 | 0.697 | ||
| AST (U/Lt) | 29.45 | ± | 24.41 | 22.00 | 27.07 | ± | 21.80 | 22.00 | 0.589 | ||
| ALT (U/Lt) | 34.23 | ± | 49.04 | 20.00 | 28.68 | ± | 38.81 | 20.00 | 0.763 | ||
| Albumin | 38.07 | ± | 8.59 | 42.00 | 37.11 | ± | 8.61 | 40.00 | 0.457 | ||
| Postoperative 1th day(T2) | Urea (mg/dl) | 58.48 | ± | 30.38 | 49.00 | 55.08 | ± | 28.11 | 49.00 | 0.453 | |
| Creatinine (mg/dl) | 1.14 | ± | 0.71 | 0.90 | 1.07 | ± | 0.65 | 0.88 | 0.517 | ||
| LDH (U/Lt) | 453.25 | ± | 159.81 | 434.00 | 450.93 | ± | 160.21 | 438.00 | 0.998 | ||
| AST (U/Lt) | 104.21 | ± | 103.27 | 70.00 | 100.33 | ± | 97.31 | 73.00 | 0.886 | ||
| ALT (U/lt) | 51.55 | ± | 75.01 | 32.00 | 58.31 | ± | 85.31 | 32.00 | 0.645 | ||
| Albumin | 31.19 | ± | 4.56 | 31.00 | 31.45 | ± | 4.35 | 31.00 | 0.710 | ||
| Postoperative 7 th day (T3) | Urea (mg/dl) | 51.28 | ± | 36.82 | 41.00 | 51.77 | ± | 40.29 | 41.00 | 0.979 | |
| Creatinine (mg/dl) | 1.23 | ± | 0.88 | 0.98 | 1.25 | ± | 0.89 | 0.98 | 0.722 | ||
| LDH (U/Lt) | 376.44 | ± | 181.57 | 357.00 | 399.87 | ± | 166.63 | 384.00 | 0.333 | ||
| AST (U/Lt) | 63.64 | ± | 131.05 | 35.00 | 64.67 | ± | 178.60 | 38.00 | 0.665 | ||
| ALT (U/Lt) | 50.67 | ± | 57.07 | 38.00 | 53.52 | ± | 56.66 | 40.00 | 0.462 | ||
| Albumin | 33.08 | ± | 4.53 | 32.00 | 32.49 | ± | 4.34 | 32.00 | 0.455 | ||
| Pre-intervention for Dressler syndrome (T4) | Urea (mg/dl) | 55.08 | ± | 47.32 | 44.00 | 53.97 | ± | 47.52 | 41.00 | 0.769 | |
| Creatinine (mg/dl) | 1.31 | ± | 1.25 | 0.89 | 1.25 | ± | 1.16 | 0.89 | 0.816 | ||
| LDH (U/Lt) | 283.09 | ± | 147.65 | 256.00 | 317.71 | ± | 132.29 | 313.00 | 0.020 | ||
| AST (U/Lt) | 44.72 | ± | 77.36 | 30.00 | 45.63 | ± | 77.50 | 30.00 | 0.961 | ||
| ALT (U/Lt) | 47.03 | ± | 45.41 | 36.00 | 46.17 | ± | 44.48 | 35.00 | 0.955 | ||
| Albumin | 34.24 | ± | 5.44 | 36.00 | 34.27 | ± | 5.22 | 36.00 | 0.904 | ||
LDH, Lactate Dehydrogenase; AST, aspartate aminotransferase; ALT, alanine aminotransferase.
Univariate and multivariate logistic regression analyses were performed to determine the independent variables that were effective in predicting the development of DS requiring invasive intervention. Table 8 presents the results of the analysis. Univariate logistic regression analysis revealed a significant differential effect of age, BMI, monocyte count, MLR, and CRP level in the blood collected on postoperative day 7 (p<0.05). Parameters estimated to be significant in the univariate analysis were included in multivariate analysis. In multivariate analysis, age, monocyte count at T3, and CRP level were statistically significant predictors in the reduced model using the Forward: Likelihood Ratio (LR) method (p<0.05). Age alone was found to have a statistically significant effect on predicting DS in both univariate and multivariate analyses, independent of the other variables.
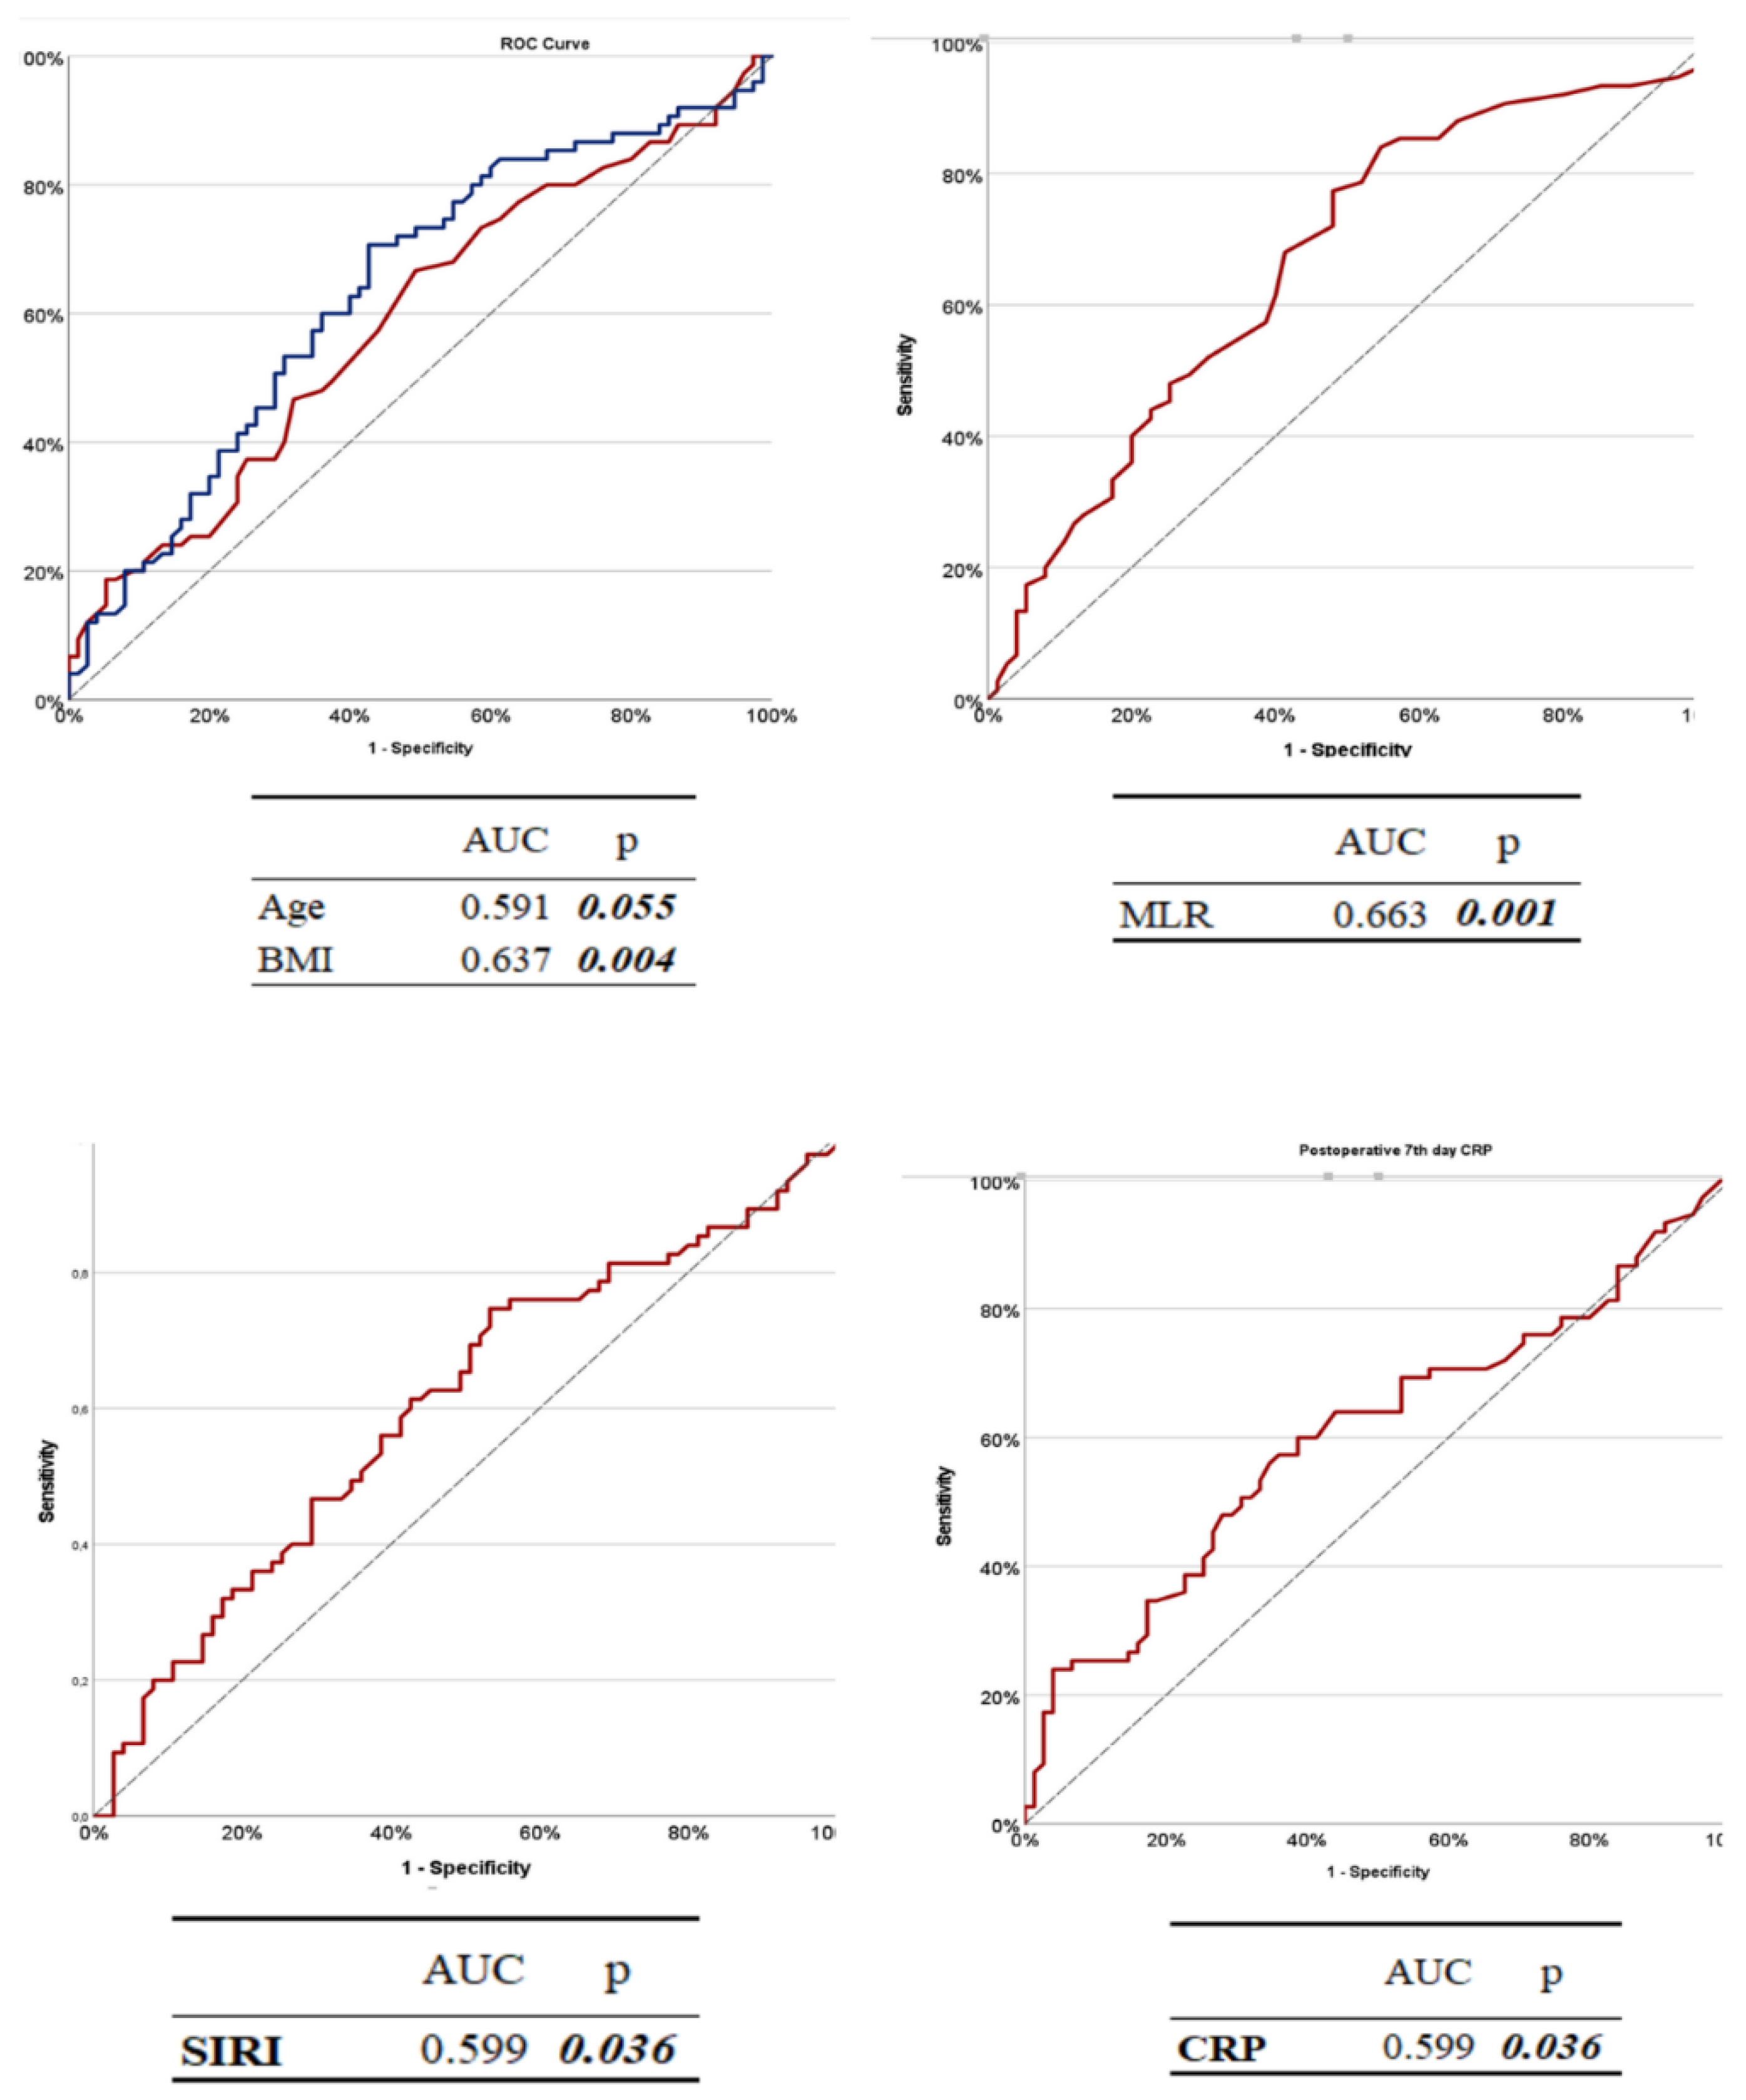
To evaluate the diagnostic performance of selected variables in predicting the development of DS (DS) requiring invasive intervention, receiver operating characteristic (ROC) analyses were performed for age, SIRI, CRP, and MLR using data collected at T3 (postoperative day 7). The results are summarized in Table 9 and the corresponding ROC curves are shown in Fig. 3.Among the evaluated variables, MLR demonstrated the highest discriminatory power with an AUC of 0.663 (p = 0.001). A cutoff value of 0.310 yielded a sensitivity of 84.00% and a specificity of 45.33%. CRP levels also showed a statistically significant predictive value (AUC = 0.604, p = 0.028), with a sensitivity of 60.00% and specificity of 61.33% at a threshold of 16.47 mg/L. The SIRI provided modest but statistically significant discriminatory ability (AUC = 0.599, p = 0.036), with a cut-off value of 3.34, yielding a sensitivity of 32.00% and a relatively high specificity of 81.33%. In contrast, age had a poor predictive performance (AUC = 0.460, p = 0.055), indicating limited utility in isolation. The best cutoff for age was 57 years, with 48.00% sensitivity and 64.00% specificity.
Figure 3.
ROC Curves of Age, BMI, SIRI, MLR, and CRP at Postoperative Day 7 (T3). The diagnostic accuracy of each parameter was evaluated using ROC analysis, and the area under the curve (AUC) values are indicated on the image. ROC curves are presented on the specificity and sensitivity axes to show the discriminative power of the parameters.
4. Discussion
DS has long been recognized as a delayed-onset autoimmune or inflammatory complication following cardiac surgery. The reported incidence of DS varies widely between the past and the present. Previous studies have reported an incidence of 10%–30% in adult cardiac surgery patients [13,14]. In recent studies, the incidence was reported to range from 21% to 29%[15]. However, considering the non-specificity of inflammatory parameters in the diagnostic process in these studies and the physiologic variability of the postoperative period, it can be said that the current criteria are insufficient to adequately differentiate true clinical cases of DS[16]. Currently, both the diagnostic criteria and clinical management remain controversial. To date, there have been no comprehensive studies in the literature regarding the progression of DS and the dynamic changes in inflammatory indices. Despite advances in perioperative care and surgical techniques, the pathophysiological mechanisms underlying DS progression, especially those requiring invasive drainage, have not been adequately elucidated[9]. This suggests that the current diagnostic criteria should be revised to better align with clinical realities. Our study aimed to analyze the temporal changes in systemic inflammatory indices in DS cases requiring surgical intervention, perform risk stratification with these values in the early period, and create predictive models for the development of DS requiring invasive procedures. In addition, by measuring the time-dependent dynamic changes in these indices at four different times, we created a biochemical projection of the DS from an early period. In particular, on postoperative day 7, acute postoperative inflammation was replaced by a more specific immunological process. Our study provides clinically applicable data for early risk stratification of DS by determining the critical thresholds of inflammatory markers during this period. Thus, high-risk patients can be identified in advance and closely followed up. Immunomodulatory therapies, such as colchicine, can be initiated early in patients with elevated inflammatory markers, reducing the progression of DS and the need for surgery. However, this may contribute to the development of more refined algorithms for DS in the future.
Multiple risk factors have been associated with the development of DS, including younger age [17] and female sex [18]. frequently cited in the literature. Female gender are known to be more prone to autoimmune inflammatory diseases. This is thought to be related to hormonal, genetic, and environmental factors[19]. However, some large-scale epidemiological studies have reported conflicting results regarding the effect of sex, which may be due to differences in patient selection and surgical procedures [18]. In our study, no statistically significant association was found between sex and the occurrence of DS (P = 0.473), supporting the view that sex alone may not be a reliable predictor in this population.
In contrast, age appears to be a more consistently observed risk factor. In a large prospective study, the incidence of DS was 18% among adults aged 21 years and older but declined to 10% in individuals over 70 years of age [20]. Similar trends were reported by Miller et al., with DS incidence decreasing progressively from 24% in patients aged < 54 years to 11% in those aged than 65[21]. It has also been reported that autoimmune responses are more active in young individuals; therefore, immune hyperactivity may lead to exaggerated inflammatory responses [22,23].Although the general incidence of autoimmune diseases increases with age [24], it is known that some autoimmune processes are activated more in younger age groups[22]. Therefore, young age may be a more susceptible period for the development of DS. In contrast, changes in the immune system with age, especially a decrease in T and B lymphocyte activity, may cause an inadequate immune response[25].In our study, the fact that the mean age was significantly lower in patients who developed DS is consistent with these findings. However, in the ROC analyses, the discriminative power of the age variable was weak (0.055), the most appropriate cut-off value was determined to be 57, and the sensitivity and specificity were calculated as 48% and 64%, respectively.
The typical onset time of DS is often reported to be 2–3 weeks [5]. It usually occurs within the first month following cardiac surgery, and its occurrence after six months is extremely rare[16]. In our study, the time to drainage matching due to DS after primary surgery was similar to that in existing studies.
Our study found an inverse correlation between body mass index (BMI) and the development of DS, suggesting a potential protective effect of high BMI. This is in line with previous observations by Miller et al., who suggested that obesity-associated immunomodulatory effects, including elevated anti-inflammatory cytokines such as IL-4 and IL-13, may reduce systemic inflammation[17].However, studies have reported a significant association between high BMI and DS [26]. Although our findings support the potential protective effect of BMI in the development of DS, the precise mechanisms driving this association remain unclear and require further investigation of metabolic and immune pathways.
The type and extent of cardiac surgery are also important factors affecting the incidence of DS. In a large epidemiological study by Lehto et al., aortic surgery was found to be one of the interventions with the highest risk of DS [28].Similarly, valve surgery has been reported to carry a higher risk of DS than CABG[29].The observed association between the type of surgery and a higher incidence of DS seems to be mediated by pericardial rather than myocardial damage. Because studies have not found any association between biomarkers of myocardial damage and DS occurrence.[30]. In our study, DS development was significantly higher in the patients who underwent aortic and valvular surgery. This finding is consistent with the pathophysiological mechanism in the literature that pericardial trauma is more common in aortic and valvular surgeries, and this triggers an autoimmune response and predisposes patients to DS development [27,28]. On the other hand, although a lower risk has been reported in the literature for patients undergoing mitral valve replacement [17],no comparison was made between subgroups in our study because mitral and aortic valve operations were evaluated together. This may explain the partial discordance between our study and the previous findings. In addition, previous studies have emphasized that more complex surgeries often require longer cardiopulmonary bypass (CPB) times, and that factors such as prolonged exposure of the pericardial cavity to air activate immune mechanisms and predispose patients to PPS [31]. Although the durations of CPB and ACC were similar between the groups in our study, it may be considered that this duration was longer, especially in patients who underwent aortic surgery, which may have contributed to the observed association.
In a substudy of the COPPS study evaluating risk factors for DS, pleural incision was also found to be an independent predisposing factor for the syndrome [32]. However, in our cohort, chest tube placement, used as a surrogate for pleural manipulation, showed no significant difference between the groups. This suggests that pleural incision alone may be insufficient to provoke DS in the absence of other contributors such as pericardial trauma or complex surgery.
Current guidelines recommend the use of non-steroidal anti-inflammatory drugs (NSAIDs) in combination with colchicine for the treatment of DS[11]. However, in severe cases, invasive drainage of pericardial or pleural effusion may be required. In the literature, such invasive interventions have been associated with increased morbidity [16], prolonged hospitalization, and repeated hospitalizations [26,32]. As expected, the length of hospital stay and readmission rate were significantly higher in the Dressler group. The mortality risk was higher in the Dressler group. However, this difference was not statistically significant. These findings clearly demonstrate the clinical burden and morbidity of DS. This finding is consistent with those reported in the literature. In addition, the fact that INR levels and frequency of anticoagulant use did not show a significant difference in the DS group (Table 4) supports the idea that inflammatory processes are the dominant pathophysiological mechanism instead of bleeding tendency.
The autoimmune nature of DS underscores the need for reliable biomarkers for this disease. While CRP and ESR are commonly elevated, their diagnostic utility is limited by their poor specificity in the postoperative setting [26]. In our study, we aimed to fill this gap using more complex biomarkers (SII, SIRI, NLR, and MLR). These indices may offer superior specificity for identifying high-risk patients because they integrate the multiple cellular components of the immune response. Specific studies examining the SII and SIRI values in DS are limited. In general, these indices are elevated when the inflammatory processes are active. Since DS is characterized by inflammation of the pericardium and a systemic inflammatory response, increased SII and SIRI values are expected in these patients. Both SII and SIRI are based on neutrophil and lymphocyte ratios and are associated with inflammation. SII is related to the balance between inflammatory cells (neutrophils and platelets) and immune cells (lymphocytes). The SIRI provides a broader perspective on inflammatory processes, considering that there are more monocytes [33]. Both indices can be used to determine the inflammatory burden. However, the SIRI may be significantly increased in autoimmune and chronic inflammatory diseases owing to the role of monocytes in chronic inflammatory processes. The SII is a biomarker that reflects both thrombotic and systemic inflammation. In this study, both the SII and SIRI were significantly elevated in patients with DS requiring invasive intervention. In particular, SII showed a significant increase only at T4, suggesting that systemic inflammation increases with disease progression, better reflecting the inflammatory process that occurs in the advanced phase of the disease and requires intervention. However, the fact that this increase was detected only in the T4 time interval limits the use of SII as a predictive marker in earlier stages and limits its prognostic power. This might be related to the delayed role of platelets in immune modulation. Therefore, while the SII may be a robust marker of advanced DS, it is less suitable for early prediction. However, the increase in the SIRI value at T3 and the persistence of this increase at T4 suggest that this marker may indicate early stage inflammation and is advantageous for early diagnosis. ROC analysis showed that an SIRI cut-off of 3.34 yielded 81.3% specificity, supporting its use in early risk assessment. These findings suggest that the SII may be a more sensitive biomarker and that the SIRI may be a more specific biomarker. As a matter of fact, a similar result was reported in a prospective study of 440 0000 participants on the relationship between cancer cases and systemic inflammatory[34].
The MLR was the most sensitive marker in our analysis. Elevated MLR is another marker that reflects inflammatory activity, with increased monocyte and decreased lymphocyte counts. Monocytes are involved in the late inflammatory response and tissue repair processes. MLR elevation has been reported to be prominent in processes such as pericardial inflammation, cardiac fibrosis and autoimmunity[35]. In addition, many studies in the literature have shown that MLR better reflects inflammation with autoimmune characteristics and that the sensitivity of these markers is high in late pericarditis, such as DS[35,36]. Our findings showed that high MLR levels, especially on postoperative day 7, were significantly associated with the development of DS that required surgical intervention. ROC analysis revealed 84% sensitivity with a cut-off value of 0.575, supporting its role as a practical screening tool in early postoperative follow-up. This index not only peaked before the second surgical procedure but also continued to increase in a statistically significant manner compared to control patients, indicating a sustained systemic inflammatory response.
In this study, NLR did not change significantly at any time point, consistent with its known association with acute infection and trauma.[37]. Since DS is not an acute infection but the result of a delayed autoimmune process, it is consistent with the literature that NLR is not as discriminative as other markers. Furthermore, since neutrophil predominance is common in all patients in the first few days after surgery, the specificity of NLR may be reduced. In our study, CRP and WBC levels, two nonspecific inflammatory markers, were significantly higher in the Dressler group at T4. These markers are useful for confirming late-stage inflammation but lack specificity [38]. However, this elevation in the late stage (T4) may reflect persistent inflammation or pericardial effusion associated with immune response. Nevertheless, it should be noted that CRP and WBC counts alone have limited prognostic value in clinical decision-making. Their utility may increase when they are used alongside other indices. Based on our findings, a multi-marker approach consisting of high CRP, MLR, and SIRI levels may improve prognostic accuracy and support clinical decision-making.
5. Study Limitations
This study has several limitations that should be considered when interpreting the results. First, its retrospective design inherently restricts the ability to establish causal relationships and increases susceptibility to selection bias. Second, the study was conducted in a single tertiary center, and although institutional guidelines ensured procedural consistency, variations in surgical techniques across different surgical teams may have influenced postoperative outcomes. Similarly, echocardiographic assessments were performed by multiple clinicians, introducing the possibility of interobserver variability in imaging interpretation.
Another key limitation is the clinical heterogeneity of the study population. The inclusion of patients with different underlying cardiac pathologies, such as ischemic heart disease and structural valve disorders, may have contributed to the variability in systemic inflammatory responses. Additionally, no formal statistical matching techniques (e.g., propensity score matching) have been employed to balance baseline characteristics. Instead, blinded randomization and stratification based on the surgery type were used to mitigate confounding factors.
Another limitation relates to the inclusion of patients who had already received medical treatment with colchicine and/or indomethacin at the time of suspected DS. Although these patients ultimately required surgical intervention due to disease progression, the prior use of anti-inflammatory therapy may have modulated biomarker levels, potentially confounding the interpretation of inflammatory trends.
While inflammatory biomarkers were collected at standardized intervals, the T4 time point, defined as the period immediately preceding surgical intervention, was inherently variable among the patients, ranging from postoperative week 2 to week 11. This heterogeneity may limit the ability to precisely capture the dynamic changes in systemic inflammation across all stages of DS. More frequent sampling and prospective monitoring could provide a more granular understanding of the inflammatory fluctuations over time.
Finally, the generalizability of our findings may be limited due to the single-center nature of the study and the absence of external validation. Multicenter prospective studies with larger sample sizes and matched controls are warranted to confirm the predictive utility of systemic inflammatory indices for DS.
6. Conclusions
This study demonstrated that systemic inflammatory indices, particularly SIRI, MLR, and CRP, hold significant promise as predictive biomarkers for the development and severity of DS requiring surgical intervention. Among these, MLR emerged as the most sensitive marker, whereas SIRI provided strong early diagnostic specificity. These findings underscore the clinical utility of integrating such indices into routine postoperative monitoring, particularly around the first week following surgery when classical inflammatory markers lose their discriminatory power. The observed dynamic elevation patterns, especially the early rise in SIRI and MLR, may allow for the timely identification of high-risk patients and the early initiation of anti-inflammatory therapies, potentially reducing the need for invasive intervention. Incorporating SIRI, MLR, and CRP into post-cardiac surgery surveillance protocols may represent a meaningful advancement in risk stratification and personalized management of DS.
Author Contributions
Conceptualization, MY. and A.A.; Methodology, M.Y. and EU.; Software, F.S.; Validation, M.F.S. and S.A.K..; Formal analysis, E.U.,A.A. and M.Y.; Investigation, S.A.K., E.U., M.H. and A.A.; Resources, E.U.,A.A.and K.E.E.; Data curation, M.H.; Writing—original draft preparation, E.U. and M.Y.; Writing—review and editing, S.A.K. and M.H.; Visualization, K.E.E.; Supervision, S.A.K. and M.Y.; Project administration, S.A.K. and M.Y. All the authors have read and agreed to the published version of the manuscript.
Funding
This study received no external funding.
Institutional Review Board Statement
This study was reviewed by the Scientific and Ethical Review Board for Medical Research of Ankara Bilkent City Hospital No. 1 and was found to be ethically appropriate (Ethics Committee of Ankara Bilkent City Hospital, No. 1 (Approval No: 652, 23-10-2024). This study was conducted in accordance with the Declaration of Helsinki, and the confidentiality of patient data was fully protected.
Informed Consent Statement
Informed consent was obtained from all the subjects involved in this study.
Data Availability Statement
Raw data supporting the conclusions of this article will be made available by the authors upon request.
Conflicts of Interest
The authors declare no conflicts of interest.
References
- López, D.E.S.; Ynostroza, S.I.M.; Mendoza, A.A.S.; Sáenz, C.P.C.; Alcalá, N.V.; Rivera, M.F.R. Considerations for Dressler Syndrome: A Comprehensive Review. INTERNATIONAL JOURNAL OF MEDICAL SCIENCE AND CLINICAL RESEARCH STUDIES 2024. [Google Scholar] [CrossRef]
- Imazio, M. The post-pericardiotomy syndrome. Current Opinion in Pulmonary Medicine 2012, 18, 366–374. [Google Scholar] [CrossRef] [PubMed]
- Honorato, P.F.; De Lacerda, D.A.; De Oliveira, A.V.L.; Cunha, M.E.B.; Santana, Y.T.; Da Silva, B.V.P.; De Maria, G.C.; Montenegro, A.K.T.; De Meneses Costa, M.; Lima, J.V.G.; et al. Post-myocardial infarction pericarditis: Dressler syndrome and its clinical implications. III Seven International Medical and Nursing Congress 2024. [Google Scholar] [CrossRef]
- Imazio, M.; Trinchero, R.; Brucato, A.; Rovere, M.E.; Gandino, A.; Cemin, R.; Ferrua, S.; Maestroni, S.; Zingarelli, E.; Barosi, A.; et al. COlchicine for the Prevention of the Post-pericardiotomy Syndrome (COPPS): a multicentre, randomized, double-blind, placebo-controlled trial. Eur Heart J 2010, 31, 2749–2754. [Google Scholar] [CrossRef]
- Nishimura, R.A.; Fuster, V.; Burgert, S.L.; Puga, F.J. Clinical features and long-term natural history of the postpericardiotomy syndrome. Int J Cardiol 1983, 4, 443–454. [Google Scholar] [CrossRef]
- McGuinness, J.B.; Taussig, H.B. The Postpericardiotomy Syndrome. Journal of Occupational and Environmental Medicine 1963, 5, 226. [Google Scholar] [CrossRef]
- Campos, I.D.; Salgado, A.; Azevedo, P.; Vieira, C. Dressler's syndrome: are we underdiagnosing what we think to be rare? BMJ Case Rep 2019, 12. [Google Scholar] [CrossRef] [PubMed]
- van Osch, D.; Nathoe, H.M.; Jacob, K.A.; Doevendans, P.A.; van Dijk, D.; Suyker, W.J.; Dieleman, J.M. Determinants of the postpericardiotomy syndrome: a systematic review. Eur J Clin Invest 2017, 47, 456–467. [Google Scholar] [CrossRef]
- Lai, R.; Xu, T. Update for diagnosis and treatment of syndrome after cardiac injury: a mini-review. Front Cardiovasc Med 2025, 12, 1526671. [Google Scholar] [CrossRef]
- Malik, J.; Zaidi, S.M.J.; Rana, A.S.; Haider, A.; Tahir, S. Post-cardiac injury syndrome: An evidence-based approach to diagnosis and treatment. Am Heart J Plus 2021, 12, 100068. [Google Scholar] [CrossRef]
- Adler, Y.; Charron, P.; Imazio, M.; Badano, L.; Barón-Esquivias, G.; Bogaert, J.; Brucato, A.; Gueret, P.; Klingel, K.; Lionis, C.; et al. 2015 ESC Guidelines for the diagnosis and management of pericardial diseases: The Task Force for the Diagnosis and Management of Pericardial Diseases of the European Society of Cardiology (ESC)Endorsed by: The European Association for Cardio-Thoracic Surgery (EACTS). European Heart Journal 2015, 36, 2921–2964. [Google Scholar] [CrossRef]
- Fowler, N.O. Cardiac tamponade. A clinical or an echocardiographic diagnosis? Circulation 1993, 87, 1738–1741. [Google Scholar] [CrossRef] [PubMed]
- Janton, O.H.; Glover, R.P.; O'Neill, T.J.; Gregory, J.E.; Froio, G.F. Results of the surgical treatment for mitral stenosis; analysis of one hundred consecutive cases. Circulation 1952, 6, 321–333. [Google Scholar] [CrossRef]
- Soloff, L.A.; Zatuchni, J.; Janton, O.H.; O'Neill, T.J.; Glover, R.P. Reactivation of rheumatic fever following mitral commissurotomy. Circulation 1953, 8, 481–497. [Google Scholar] [CrossRef]
- Lehto, J.; Kiviniemi, T. Postpericardiotomy syndrome after cardiac surgery. Annals of Medicine 2020, 52, 243–264. [Google Scholar] [CrossRef] [PubMed]
- Lehto, J.; Gunn, J.; Björn, R.; Malmberg, M.; Airaksinen, K.; Kytö, V.; Kytö, V.; Nieminen, T.; Hartikainen, J.; Biancari, F.; et al. Adverse events and survival with postpericardiotomy syndrome after surgical aortic valve replacement. The Journal of thoracic and cardiovascular surgery 2020. [Google Scholar] [CrossRef] [PubMed]
- Miller, R.; Horneffer, P.; Gardner, T.; Rykiel, M.; Pearson, T. The epidemiology of the postpericardiotomy syndrome: a common complication of cardiac surgery. American heart journal 1988, 116 5 Pt 1, 1323–1329. [Google Scholar] [CrossRef]
- Lehto, J.; Kiviniemi, T.O.; Gunn, J.; Mustonen, P.; Airaksinen, J.; Biancari, F.; Rautava, P.; Sipilä, J.; Kytö, V. Occurrence of postpericardiotomy syndrome admissions: A population-based registry study. Ann Med 2016, 48, 28–33. [Google Scholar] [CrossRef]
- Voskuhl, R. Sex differences in autoimmune diseases. Biol Sex Differ 2011, 2, 1. [Google Scholar] [CrossRef]
- Allen Engle, M. Humoral immunity and heart disease: Postpericardiotomy syndrome. Clinical Immunology Newsletter 1982, 3, 155–157. [Google Scholar] [CrossRef]
- Miller, R.H.; Horneffer, P.J.; Gardner, T.J.; Rykiel, M.F.; Pearson, T.A. The epidemiology of the postpericardiotomy syndrome: A common complication of cardiac surgery. American Heart Journal 1988, 116, 1323–1329. [Google Scholar] [CrossRef] [PubMed]
- Bahar, M.A.; Prasetya, I. Inflammatory Cascade Unveiled: Exploring Complications and Therapeutic Strategies for Post-Myocardial Infarction Inflammation (A Literature Review). Heart Science Journal 2024. [Google Scholar] [CrossRef]
- Ye, J.-J.; Hu, X.; Wang, Z.; Li, R.; Gan, L.; Zhang, M.; Wang, T. The role of mtDAMPs in the trauma-induced systemic inflammatory response syndrome. Frontiers in Immunology 2023, 14. [Google Scholar] [CrossRef] [PubMed]
- Gubbels Bupp, M.R. Sex, the aging immune system, and chronic disease. Cell Immunol 2015, 294, 102–110. [Google Scholar] [CrossRef] [PubMed]
- Engle, M.A. Humoral immunity and heart disease: postpericardiotomy syndrome. Clinical Immunology Newsletter 1982, 3, 155–157. [Google Scholar] [CrossRef]
- Lehto, J.; Gunn, J.; Karjalainen, P.; Airaksinen, J.; Kiviniemi, T. Incidence and risk factors of postpericardiotomy syndrome requiring medical attention: The Finland postpericardiotomy syndrome study. J Thorac Cardiovasc Surg 2015, 149, 1324–1329. [Google Scholar] [CrossRef]
- Gabaldo, K.; Sutlić, Ž.; Mišković, D.; Praveček, M.K.; Prvulović, Đ.; Vujeva, B.; Lukenda, K.C.; Hadžibegović, I. Postpericardiotomy syndrome incidence, diagnostic and treatment strategies: experience AT two collaborative centers. Acta Clinica Croatica 2019, 58, 57–62. [Google Scholar] [CrossRef]
- Lehto, J.; Kiviniemi, T.; Gunn, J.; Airaksinen, J.; Rautava, P.; Kytö, V. Occurrence of Postpericardiotomy Syndrome: Association With Operation Type and Postoperative Mortality After Open-Heart Operations. J Am Heart Assoc 2018, 7, e010269. [Google Scholar] [CrossRef]
- De Scheerder, I.; Wulfrank, D.; Van Renterghem, L.; Sabbe, L.; Robbrecht, D.; Clement, D.; Derom, F.; Plum, J.; Verdonk, G. Association of anti-heart antibodies and circulating immune complexes in the post-pericardiotomy syndrome. Clin Exp Immunol 1984, 57, 423–428. [Google Scholar]
- Nomura, Y.; Yoshinaga, M.; Haraguchi, T.; Oku, S.; Noda, T.; Miyata, K.; Umebayashi, Y.; Taira, A. Relationship between the degree of injury at operation and the change in antimyosin antibody titer in the postpericardiotomy syndrome. Pediatr Cardiol 1994, 15, 116–120. [Google Scholar] [CrossRef]
- Salis, S.; Mazzanti, V.V.; Merli, G.; Salvi, L.; Tedesco, C.C.; Veglia, F.; Sisillo, E. Cardiopulmonary bypass duration is an independent predictor of morbidity and mortality after cardiac surgery. J Cardiothorac Vasc Anesth 2008, 22, 814–822. [Google Scholar] [CrossRef] [PubMed]
- Imazio, M.; Brucato, A.; Rovere, M.; Gandino, A.; Cemin, R.; Ferrua, S.; Maestroni, S.; Barosi, A.; Simon, C.; Ferrazzi, P.; et al. Contemporary features, risk factors, and prognosis of the post-pericardiotomy syndrome. The American journal of cardiology 2011, 108 8, 1183–1187. [Google Scholar] [CrossRef]
- Jin, Z.; Wu, Q.; Chen, S.; Gao, J.; Li, X.; Zhang, X.-H.; Zhou, Y.; He, D.; Cheng, Z.; Zhu, Y.; et al. The Associations of Two Novel Inflammation Indexes, SII and SIRI with the Risks for Cardiovascular Diseases and All-Cause Mortality: A Ten-Year Follow-Up Study in 85,154 Individuals. Journal of Inflammation Research 2021, 14, 131–140. [Google Scholar] [CrossRef] [PubMed]
- Nøst, T.; Alcala, K.; Urbarova, I.; Byrne, K.; Guida, F.; Sandanger, T.; Johansson, M. Systemic inflammation markers and cancer incidence in the UK Biobank. European Journal of Epidemiology 2021, 36, 841–848. [Google Scholar] [CrossRef]
- Liu, Z.; Li, Y.; Wang, Y.; Zhang, H.; Lian, Y.; Cheng, X. The Neutrophil-to-Lymphocyte and Monocyte-to-Lymphocyte Ratios Are Independently Associated With the Severity of Autoimmune Encephalitis. Frontiers in Immunology 2022, 13. [Google Scholar] [CrossRef]
- Silva Lopez, D.E.; Ynostroza, S.; Mendoza, A.; Sáenz, C.; Alcalá, N.; Rivera, M. Considerations for Dressler Syndrome: A Comprehensive Review. INTERNATIONAL JOURNAL OF MEDICAL SCIENCE AND CLINICAL RESEARCH STUDIES 2024, 04. [Google Scholar] [CrossRef]
- Buonacera, A.; Stancanelli, B.; Colaci, M.; Malatino, L. Neutrophil to Lymphocyte Ratio: An Emerging Marker of the Relationships between the Immune System and Diseases. International Journal of Molecular Sciences 2022, 23. [Google Scholar] [CrossRef]
- Köhler, I.; Saraiva, P.J.; Wender, O.B.; Zago, A.J. Behavior of inflammatory markers of myocardial injury in cardiac surgery: laboratory correlation with the clinical picture of postpericardiotomy syndrome. Arq Bras Cardiol 2003, 81, 279–290. [Google Scholar] [CrossRef]
Figure 1.
Flow diagram showing the study design, patient selection, and matching process.
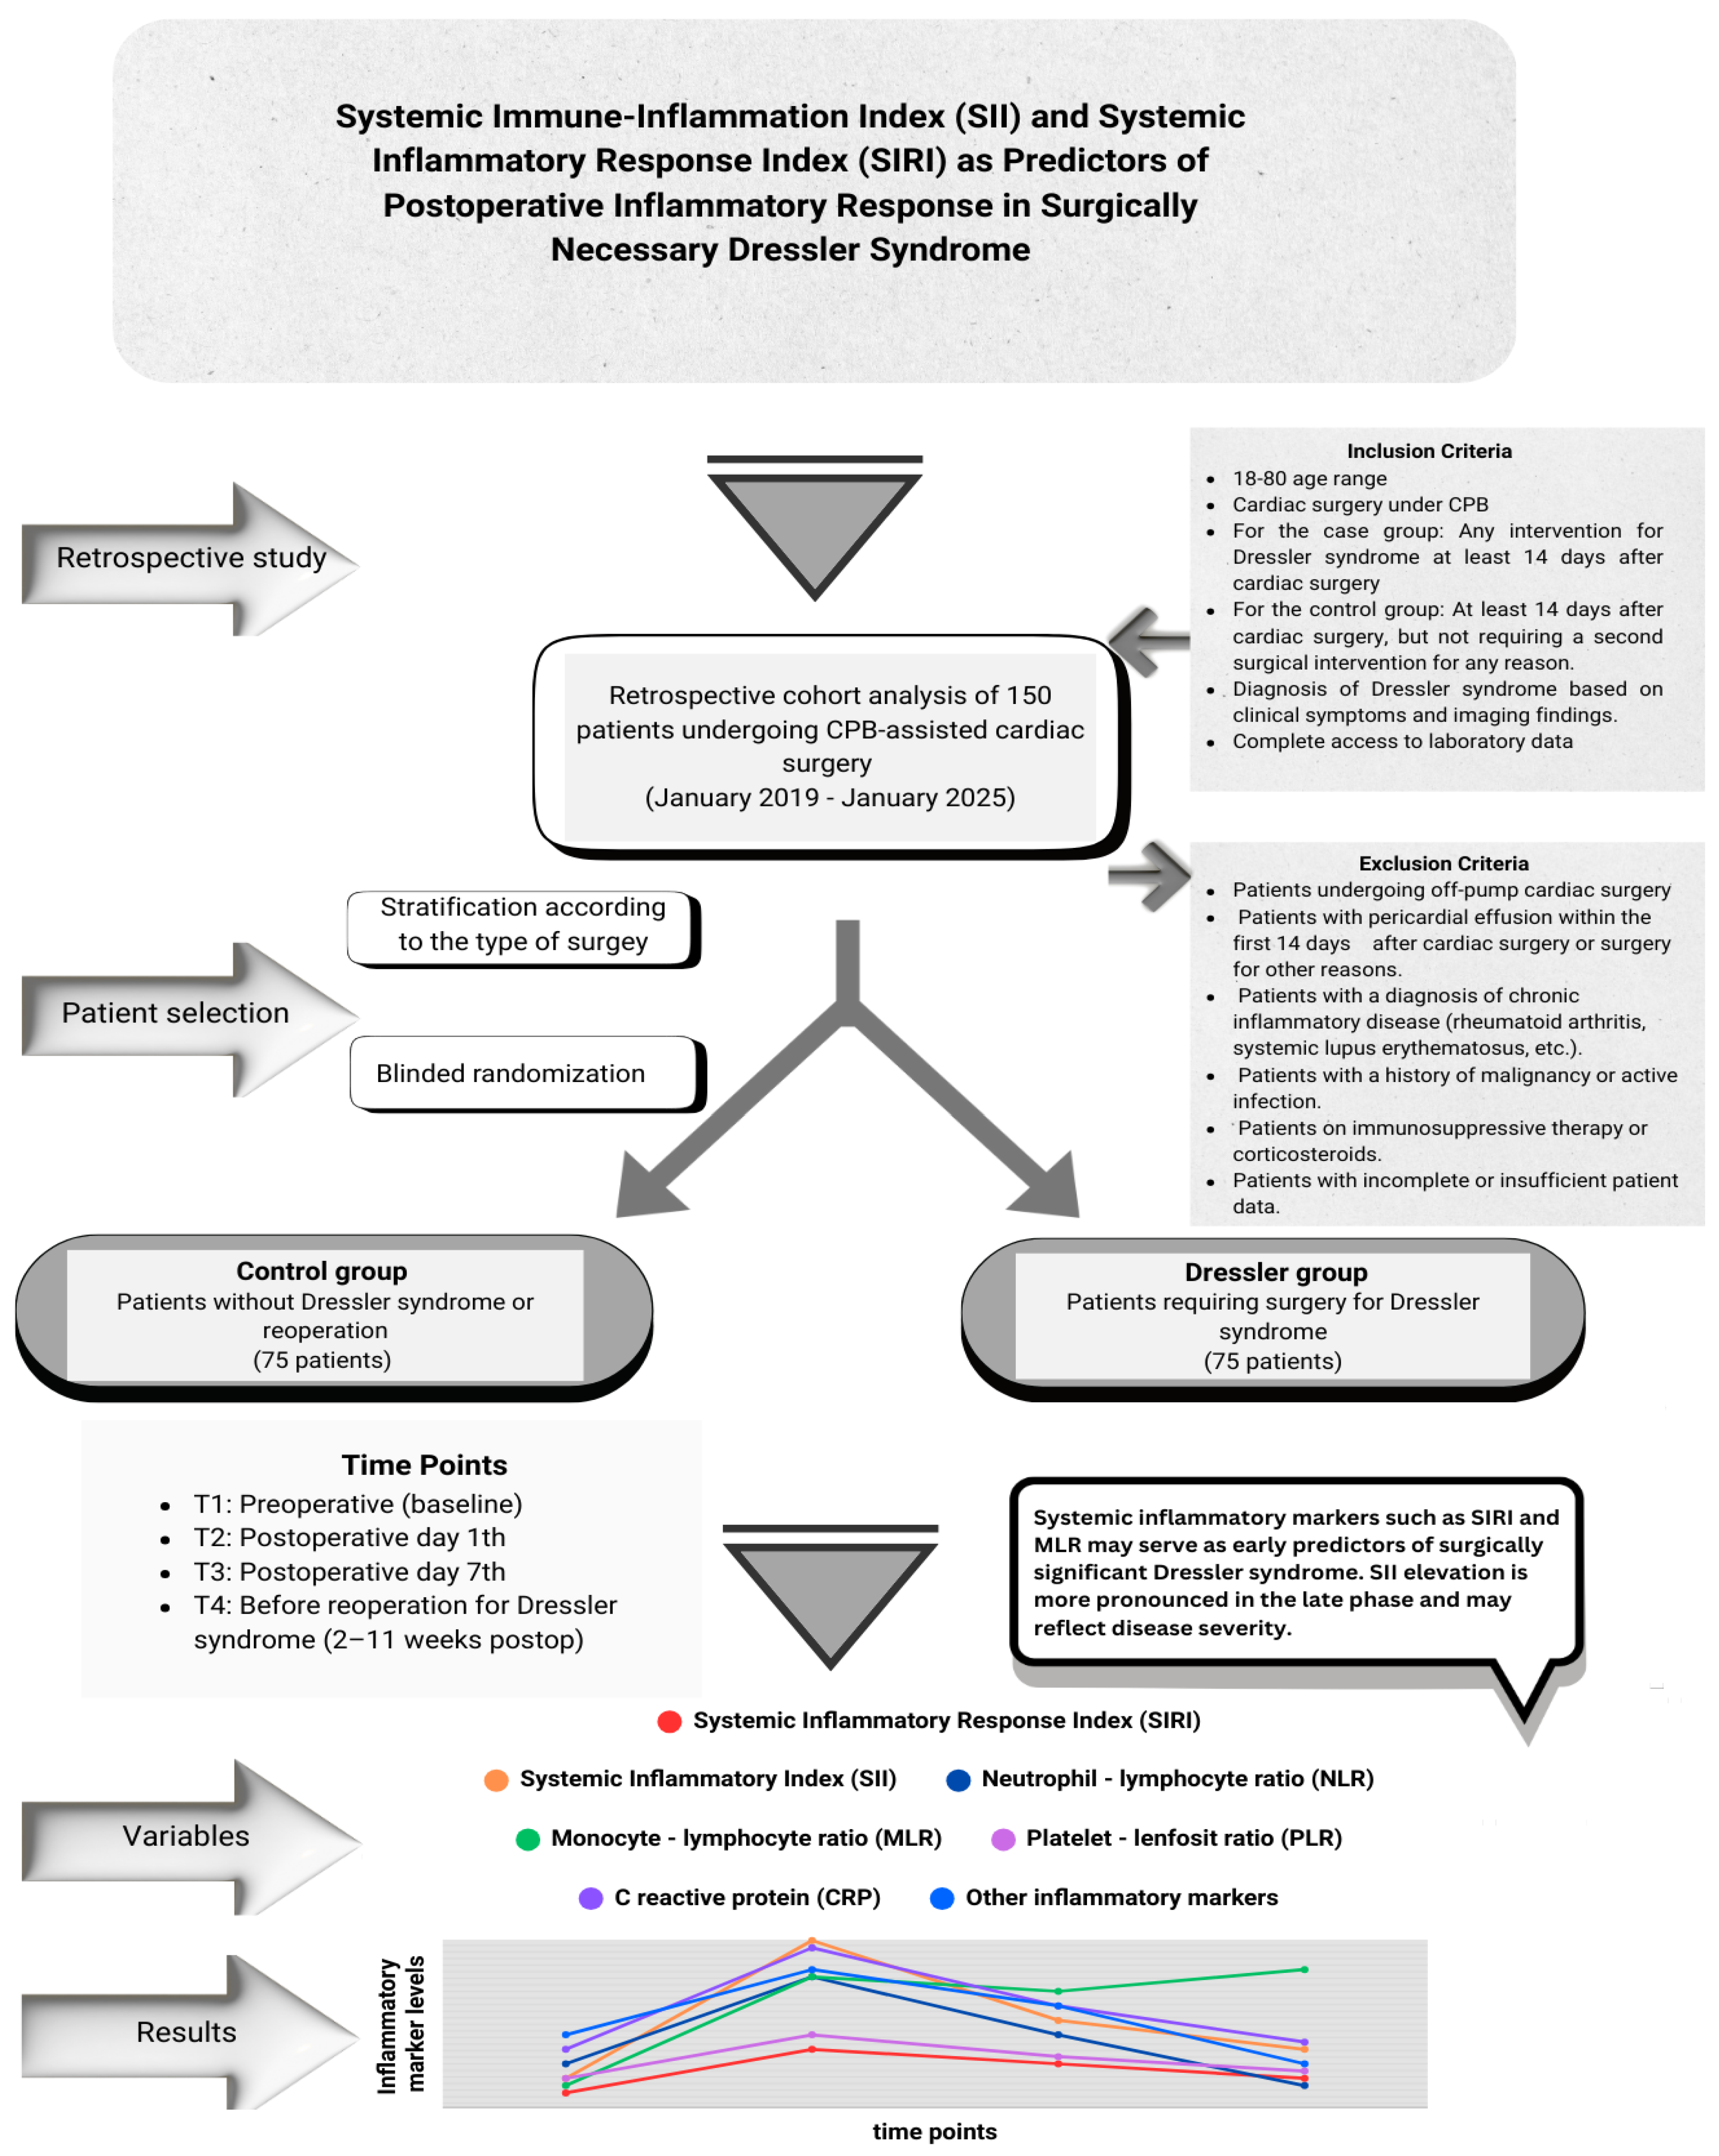
Figure 2.
Changes in systemic inflammation markers over time. In the graphs, (a) Systemic Immune-Inflammation Index (SII), (b) Systemic Inflammation Response Index (SIRI), (c) Monocyte/Lymphocyte Ratio (MLR) and (d) C-Reactive Protein (CRP) values are presented comparatively for the control and Dressler groups at time points T1, T2, T3 and T4, respectively.
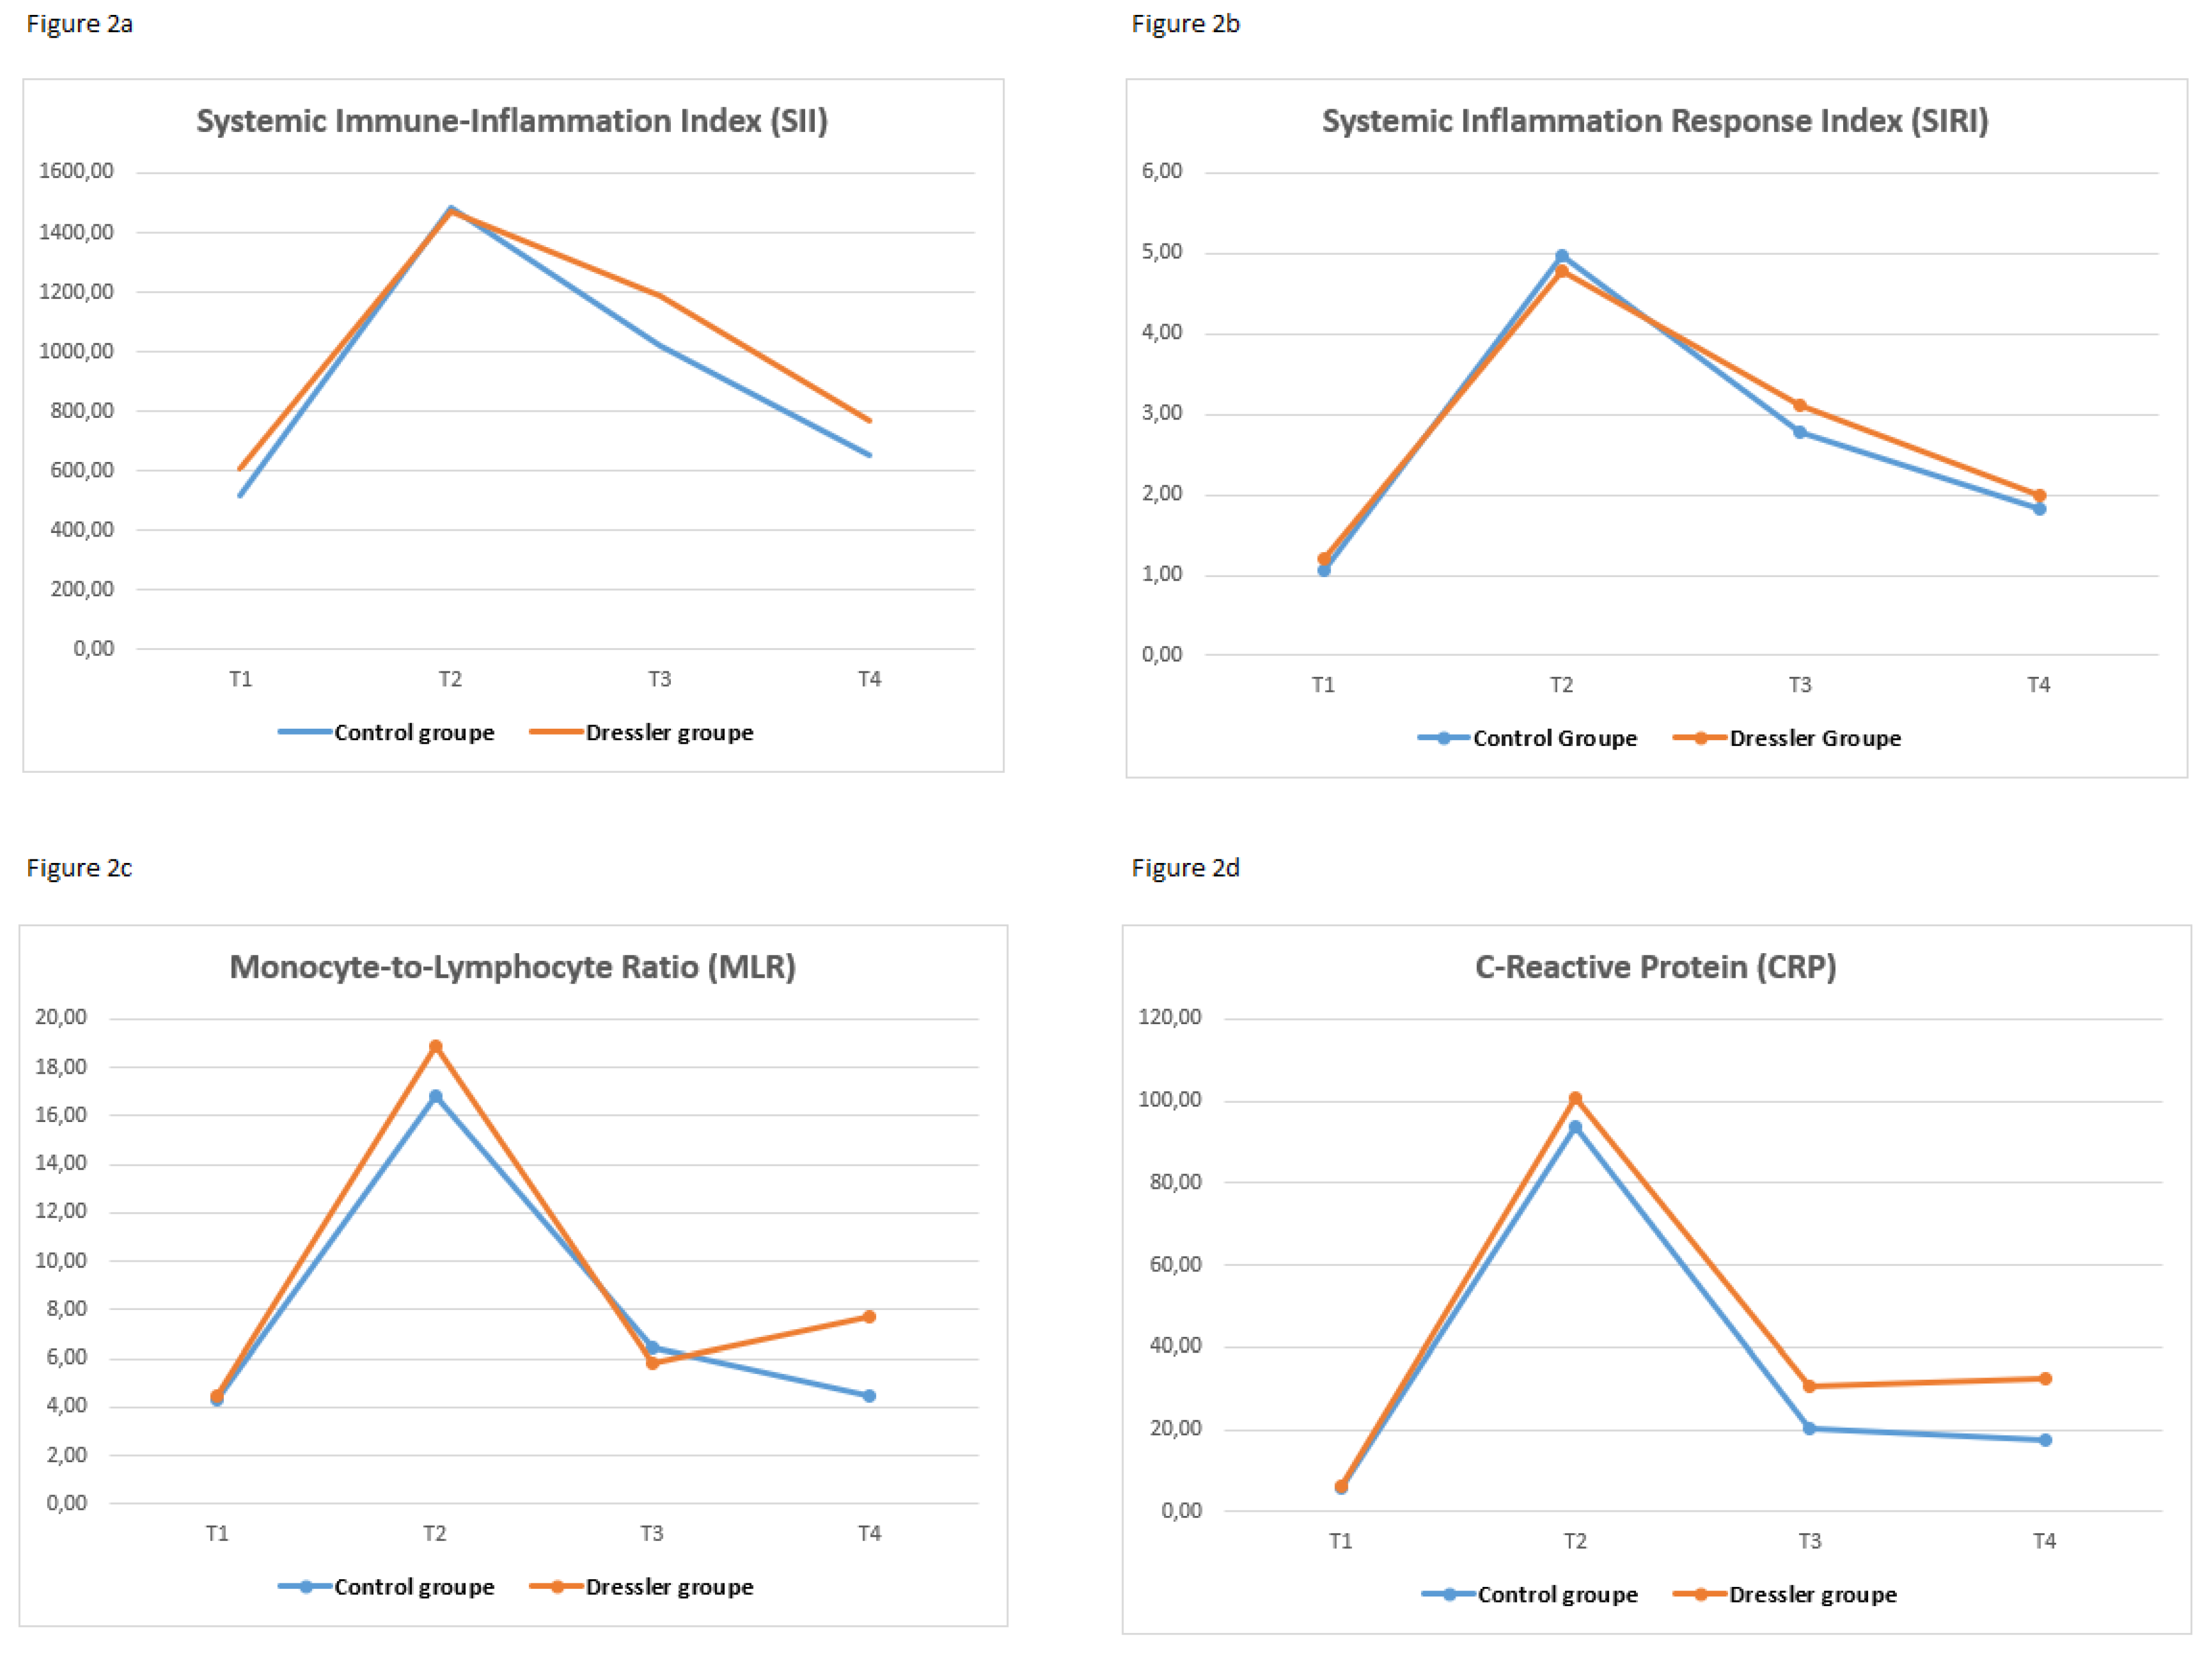
Table 1.
Preoperative Patient characteristics.
| Control group | Dressler group | p | ||||||||||
| Mean± Sd | Median | Mean± Sd | Median | |||||||||
| Age | 60.00 | ± | 10.89 | 61.00 | 54.88 | ± | 14.33 | 59.00 | 0.025 | |||
| Sex | ||||||||||||
| Male | n / % | 55 | 73.33% | 51 | 68.00% | 0.473 | ||||||
| Female | n / % | 20 | 26.67% | 24 | 32.00% | |||||||
| Weight (kg) | 80.88 | ± | 11.92 | 79.00 | 75.41 | ± | 11.54 | 76.00 | 0.010 | |||
| BMI | 28.26 | ± | 4.39 | 27.94 | 26.43 | ± | 4.57 | 25.34 | 0.004 | |||
| EF (preoperative) | 54.95 | ± | 8.77 | 58.00 | 55.79 | ± | 7.91 | 60.00 | 0.666 | |||
| HT | 22 | 29.33% | 19 | 25.33% | 0.444 | |||||||
| DM | 13 | 17.33% | 16 | 21.33% | 0.535 | |||||||
| HL | 16 | 21.33% | 20 | 26.67% | 0.444 | |||||||
| PAD | 8 | 10.67% | 10 | 13.33% | 0.615 | |||||||
| CRI | 4 | 5.33% | 6 | 8.00% | 0.513 | |||||||
| COPD | 8 | 10.67% | 4 | 5.33% | 0.229 | |||||||
| Smoking | 12 | 16.00% | 9 | 12.00% | 0.48 | |||||||
| Redo Surgery | 4 | 5.33% | 5 | 6.67% | 0.731 | |||||||
| ABO group | 0.977* | |||||||||||
| A Rh+ | 28 | 37.33% | 32 | 42.67% | ||||||||
| A Rh(-) | 4 | 5.33% | 2 | 2.67% | ||||||||
| B Rh (+) | 7 | 9.33% | 7 | 9.33% | ||||||||
| B Rh (-) | 3 | 4.00% | 3 | 4.00% | ||||||||
| AB Rh (+) | 4 | 5.33% | 2 | 2.67% | ||||||||
| AB Rh (-) | 1 | 1.33% | 1 | 1.33% | ||||||||
| 0 Rh (+) | 24 | 32.00% | 23 | 30.67% | ||||||||
| 0 Rh (-) | 4 | 5.33% | 5 | 6.67% | ||||||||
BMI, body mass index; HT, hypertension; EF, ejection fraction ; DM, diabetes mellitus; HL, hyperlipidemia; PAD, Peripheral arterial disease; COPD, chronic obstructive pulmonary disease; CRI, Chronic Renal Injury Statistical tests: b: Kruskal-Wallis Walli’s; d: one-way Analysis of Variance (ANOVA); c: chi-square test/Fisher’s exact test. Statistically significant values at the 95% confidence level (P = 0.05).
Table 2.
Intraoperative Variables and Surgical Characteristics of the Study Population.
| Control group | Dressler group | |||||||||||||
| Intraoperative data | Mean | ± | Sd | Median | Mean | ± | Sd | Median | p | |||||
| Total CPB time (min) | 117.18 | ± | 22.72 | 115.00 | 121.89 | ± | 25.27 | 125.00 | 0.141 | |||||
| ACC time (min) | 84.97 | ± | 17.15 | 85.00 | 80.72 | ± | 20.51 | 80.00 | 0.130 | |||||
| n | % | n | % | |||||||||||
| Surgical procedure | ||||||||||||||
| CABG | 7 | 9.33% | 6 | 8.00% | 0.045 | |||||||||
| AVR | 14 | 18.67% | 10 | 13.33% | ||||||||||
| MVR | 11 | 14.67% | 10 | 13.33% | ||||||||||
| AVR+MVR+TVR (or ring annuloplasty) | 6 | 8.00% | 3 | 4.00% | ||||||||||
| AVR+MVR | 6 | 8.00% | 9 | 12.00% | ||||||||||
| MVR+TVR (or ring annuloplasty) | 7 | 9.33% | 3 | 4.00% | ||||||||||
| MVR+CABG | 8 | 10.67% | 3 | 4.00% | ||||||||||
| Aortic surgery | 11 | 14.67% | 29 | 38.67% | ||||||||||
| AVR+CABG | 5 | 6.67% | 2 | 2.67% | ||||||||||
| Cardiac surgical procedure | 0.620 | |||||||||||||
| Thoracotomy | 1 | 1.33% | 3 | 4.00% | ||||||||||
| Sternotomy | 74 | 98.67% | 72 | 96.00% | ||||||||||
| Chest tube localization | 0.518 | |||||||||||||
| Mediastinum | 35 | 46.67% | 30 | 40.00% | ||||||||||
| Mediastinum + left thorax | 20 | 26.67% | 18 | 24.00% | ||||||||||
| Mediastinum + right thorax | 14 | 18.67% | 16 | 21.33% | ||||||||||
| Mediastinum + left thorax + right thorax | 6 | 8.00% | 11 | 14.67% | ||||||||||
CABG, coronary artery bypass graft; AVR, aortic valve replacement; MVR, mitral valve replacement, tricuspid valve replacement.
Table 3.
Early Postoperative Outcomes and In-Hospital Course of Patients in the Control and Dressler Groups.
Table 3.
Early Postoperative Outcomes and In-Hospital Course of Patients in the Control and Dressler Groups.
| Control group | Dressler group | p | ||||||||||
| Mean±Sd | Median | Mean±Sd | Median | |||||||||
| Postoperative variables | ||||||||||||
| Mean ICU stay (hr) | 37.60 | ± | 23.45 | 24.00 | 44.32 | ± | 32.95 | 24.00 | 0.397 | |||
| Intubation time (hr) | 11.73 | ± | 15.46 | 7.00 | 14.12 | ± | 17.89 | 8.00 | 0.108 | |||
| Mean Hospital Stay | 8.68 | ± | 2.74 | 8.00 | 10.32 | ± | 3.14 | 10.00 | 0.001 | |||
| Drainage(ml) | 626.00 | ± | 254.07 | 550.00 | 686.00 | ± | 246.81 | 650.00 | 0.062 | |||
| EF (postoperative) | 50.72 | ± | 7.52 | 50.00 | 50.39 | ± | 7.91 | 50.00 | 0.667 | |||
| Blood products | ||||||||||||
| Transfused ES (unit) | 1.99 | ± | 1.13 | 2.00 | 2.16 | ± | 0.96 | 2.00 | 0.201 | |||
| Transfused FFP (unit) | 2.81 | ± | 1.00 | 3.00 | 2.67 | ± | 1.13 | 3.00 | 0.425 | |||
| Transfused TS (unit) | 0.61 | ± | 1.47 | 0.00 | 0.67 | ± | 1.53 | 0.00 | 0.828 | |||
| Postoperative Complications | n | % | n | % | ||||||||
| Renal injury | 10 | 13.33% | 8 | 10.67% | 0.615 | |||||||
| Dialysis | 2 | 2.67% | 1 | 1.33% | 0.500* | |||||||
| Liver injury | 5 | 6.67% | 7 | 9.33% | 0.547 | |||||||
| Stroke | 2 | 2.67% | 4 | 5.33% | 0.681* | |||||||
| MODS | 2 | 2.67% | 5 | 6.67% | 0.442 | |||||||
| Pneumonia | 4 | 5.33% | 9 | 12.00% | 0.147 | |||||||
| LCOS | 4 | 5.33% | 6 | 8.00% | 0.513 | |||||||
| Re-hospitalization | 4 | 5.33% | 17 | 22.67% | 0.002 | |||||||
| Mortality | 1 | 1.33% | 6 | 8.00% | 0.058 | |||||||
EF, Ejection fraction; ICU, intensive care unit; ES, erythrocyte suspension; FFP, fresh frozen plasma; TS, thrombocyte suspension; MODS, multiple organ dysfunction syndrome; LCOS, low cardiac output syndrome.
Table 4.
Comparison of anticoagulation /antiplatelet strategies and mean INR levels prior to Dressler surgery.
Table 4.
Comparison of anticoagulation /antiplatelet strategies and mean INR levels prior to Dressler surgery.
| Control group | Dressler group | p | |||||||||||
| Mean±Sd | Median | Mean±Sd | Median | ||||||||||
| Mean INR before Dressler surgery | 2.52 | ± | 0.48 | 2.40 | 2.87 | ± | 0.93 | 2.60 | 0.114 | ||||
| Postoperative anticoagulant/antiplatelet use | |||||||||||||
| Warfarin | n / % | 47 | 59.49% | 41 | 47.67% | 0.32 | |||||||
| ASA | n / % | 11 | 13.92% | 16 | 18.60% | 0.288 | |||||||
| Klopidogrel | n / % | 7 | 8.86% | 3 | 3.49% | 0.190 | |||||||
| DAPT | n / % | 6 | 7.59% | 12 | 13.95% | 0.132 | |||||||
| TT | n / % | 4 | 5.06% | 9 | 10.47% | 0.147 | |||||||
| DOAC | n / % | 4 | 5.06% | 5 | 5.81% | 0.731 | |||||||
ASA, Acetyl salicylic acid; DAPT, dual antiplatelet (ASA+Klopidogrel) ; TT, triple therapy; DOAC, direct oral anticoagulant.
Table 5.
Comparison of Surgical Techniques for DS: Drainage Methods and frequency of pericardiopleural window.
Table 5.
Comparison of Surgical Techniques for DS: Drainage Methods and frequency of pericardiopleural window.
| Drainage Methods | n | % | p | |
| Median sternotomy | 26 | 34.67% | <0,001 | |
| Thoracotomy (right/left) | 37 | 49.33% | ||
| Subxiphoid incision | 5 | 6.67% | ||
| Pericardiocentesis (ECHO-guided) | 7 | 9.33% | ||
| PPW in DS | ||||
| PPW | 33 | 44.00% | ||
PPW, Pericardiopleural Window.
Table 8.
Univariate and Multivariate Logistic Regression Analyses of Postoperative Biomarkers Predicting the Development of Dressler Syndrome.
Table 8.
Univariate and Multivariate Logistic Regression Analyses of Postoperative Biomarkers Predicting the Development of Dressler Syndrome.
| Univariate Model | Multivariate Model* | ||||||||
| OR | 95% C. I | p | OR | 95% C. I | p | ||||
| Age | 0.968 | 0.940 | 0.994 | 0.017 | 0.967 | 0.940 | 0.995 | 0.012 | |
| BMI | 0.911 | 0.845 | 0.983 | 0.016 | |||||
| Postoperative 7 th day | |||||||||
| Monocyte | 290.820 | 18.500 | 4570.940 | <0.001 | 340.315 | 18.995 | 6100.153 | 0.00 | |
| SII | 1.000 | 1.000 | 1.001 | 0.209 | |||||
| SIRI | 1.106 | 0.921 | 1.329 | 0.280 | |||||
| Monocyte / /lymphocyte (MLR) | 59.036 | 3.985 | 874.601 | 0.003 | |||||
| CRP | 1.018 | 1.003 | 1.032 | 0.015 | 1.016 | 1.001 | 1.031 | 0.04 | |
SII, Systemic inflammation index; SIRI, Systemic Inflammation Response Index; MLR, Monocyte-to-lymphocyte ratio; CRP ,C-reactive protein. * In multivariate analysis, variables were reduced using the Forward: Likelihood Ratio (LR) method.
Table 9.
Diagnostic performance of selected biomarkers in predicting surgically significant Dressler syndrome, based on ROC curve analysis.( (Postoperative day 7th).
Table 9.
Diagnostic performance of selected biomarkers in predicting surgically significant Dressler syndrome, based on ROC curve analysis.( (Postoperative day 7th).
| Variables | AUC | p | 95% CI | Cut-off | Sensitivity | Specificity | Positive Predictive Value | Negative Predictive Value | |
| Age | 0.591 | 0.055 | 0.5 | 0.68 | 57 | 48.00% | 64.00% | 57.14% | %55.17 |
| SIRI | 0.599 | 0.036 | 0.51 | 0.69 | 3.34 | 32.00% | 81.33% | 63.16% | %54.46 |
| CRP | 0.604 | 0.028 | 0.513 | 0.695 | 16.470 | 60.00% | 61.33% | 60.81% | %60.53 |
| MLR | 0.663 | 0.001 | 0.575 | 0.750 | 0.310 | 84.00% | 45.33% | 60.58% | %73.91 |
AUC: Area Under the Curve; CI: Confidence Interval; SIRI: Systemic Inflammatory Response Index; MLR: Monocyte-to-Lymphocyte Ratio; CRP: C-Reactive Protein.
Disclaimer/Publisher’s Note: The statements, opinions and data contained in all publications are solely those of the individual author(s) and contributor(s) and not of MDPI and/or the editor(s). MDPI and/or the editor(s) disclaim responsibility for any injury to people or property resulting from any ideas, methods, instructions or products referred to in the content. |
© 2025 by the authors. Licensee MDPI, Basel, Switzerland. This article is an open access article distributed under the terms and conditions of the Creative Commons Attribution (CC BY) license (http://creativecommons.org/licenses/by/4.0/).
Copyright: This open access article is published under a Creative Commons CC BY 4.0 license, which permit the free download, distribution, and reuse, provided that the author and preprint are cited in any reuse.


