Submitted:
21 April 2025
Posted:
21 April 2025
You are already at the latest version
Abstract
The utilization of empirical correlations for the estimation of thermodynamic functions is a valuable approach for reducing experimental effort and for validating existing data. Established correlations and group contribution methods provide reliable heat capacity estimates for simple organic compounds. The present work assesses the extent of deviations introduced by employing conventional heat capacity correlations for diols. For this purpose, heat capacity differences between the solid, liquid, and gas phases are evaluated based on experimentally determined vapor pressures, enthalpies of vaporisation, heat capacities in the solid and liquid phases, and quantum chemical calculations. It is demonstrated that the structural characteristics of diols result in a significant overestimation of heat capacities when conventional empirical methods are applied. Deviations in the range of 30 – 50 J.K-1.mol-1were observed when compared to consistent experimental data. As part of the evaluation, new group contribution parameters were developed for calculating heat capacities in the solid and liquid phases. Based on these improved data, inconsistencies in literature values for enthalpies of vaporisation (on the order of 10 – 15 kJ·mol-1) could be resolved. Furthermore, a new correlation was derived that allows for the reliable prediction of enthalpies of vaporisation for α,ω-alkanediols from pentanediol to decanediol. The resulting data provide significant advantages for the design of technical processes involving diols as renewable sources and for the accurate modeling of their phase behavior.
Keywords:
structure-property relationships
; diols
; enthalpies of phase transitions
; vapor pressure
; quantum-chemical calculations
1. Introduction
Diols are important chemical intermediates that are used in a wide range of industrial applications, e.g., in the production of polyesters, polyurethanes, adhesives and coatings. Their functional hydroxyl groups make them valuable for polymer synthesis, as solvents and pharmaceuticals. The production of diols from renewable sources, such as biomass, is becoming increasingly important for reasons of sustainability. The short-chain diols (C2 - C5) are liquid at ambient temperatures. The diols with the longer chains are usually solid. The development of industrial technologies involving diols requires knowledge of the reliable energetics of phase transitions for these chemicals.
The phase transition enthalpies - liquid to gas (vaporisation), solid to gas (sublimation) and solid to liquid (fusion) - are of crucial importance for both practical applications and theoretical studies. The standard molar enthalpy of vaporisation, , is essential for industrial processes such as distillation and cooling, determines the energy requirement for boiling and condensation processes in power plants and cooling systems and determines the volatilisation of organic compounds from the soil into the environment. The standard molar sublimation enthalpy, , is important for materials science, e.g., for fractional sublimation for purification, freeze-drying of pharmaceuticals and food preservation. The standard molar enthalpy of fusion, , determines the melting and solidification processes in materials technology and is of interest for energy storage systems. A special example in this regard are phase change materials. In this technic, enthalpy of a phase change, particularly melting, is utilized for storing thermal energy. Organic phase change materials enable application for heat regulation in domestic environments (e.g., keeping temperature at a constant level during day-night cycles).
The theoretical significance of liquid-gas, solid-gas and solid-liquid phase transitions extends to numerous areas. For example, they quantify the intensity of molecular interactions and provide information on the strength of intermolecular forces (including hydrogen bonds). They help to define phase criteria for equilibria in the thermodynamics of phase diagrams. These enthalpies are used in statistical mechanics and computational chemistry to model phase behaviour and validate the theoretical predictions of molecular dynamics simulations. In materials science, the energetics of the phase transition is a very good aid in the development of substances with tailored thermal properties for technical applications. Therefore, the understanding and reliable quantification of these enthalpies is of crucial importance in fields ranging from engineering and environmental sciences to fundamental physics and chemistry. The actual temperatures of the and measurements depend on the sensitivity of the instrument or device and the properties of the substance under study. In common practice, the experimental enthalpies for low volatile compounds are measured at elevated temperatures. Since enthalpy changes are always temperature dependent, they must be adjusted to any temperature of interest to ensure consistency and comparability. The comparison is conventionally carried out at the so-called reference temperature T = 298.15 K, but other temperatures, e.g., the melting temperature, may also be of practical interest. The adjustment is made according to Kirchhoff’s equation (e.g., for the enthalpy of vaporisation process from Tav to T = 298.15 K):
This ensures that enthalpies can be directly compared under different measurement conditions at the desired temperature. Adjusting the experimental phase transition enthalpies to 298.15 K ensures that data from different sources can be compared and used consistently in technical applications, thermodynamic modeling, and phase equilibrium calculations. The term Tav in Equation (1) stands either for the measurement temperature in calorimetric experiments or for the average measurement temperature in experiments carried out in particular temperature ranges. Experimental heat capacities, (298.15 K), for numerous liquids are available in the literature [1] or can be estimated using empirical methods. Experimental gas-phase heat capacities, (298.15 K), are only available for a very limited number of volatile compounds and need to be estimated in general. Nowadays, the heat capacities of the gas phase can be estimated using group additivity methods [2] or quantum chemical methods [3].
Numerous group-additive (GA) methods have been developed to estimate the heat capacities in the liquid phase [2,4] and in the gas phase [5]. It is beyond the scope of this article to compare and evaluate the advantages and disadvantages of the available methods, as a simple and straightforward system of group-contributions and empirical equations suitable for the temperature adjustments for all three types of phase transitions has been developed by Chickos et al. [6]. This system is practically predominant in the current literature and successfully complements and validates the experimental methods for the and the modern QC calculations for the . Essentially, the following three basic empirical equations were developed by Chickos et al. [7] and proposed for the temperature adjustments of the vaporisation, sublimation and fusion enthalpies:
where is the standard molar vaporisation enthalpy, is the standard molar sublimation enthalpy, and is the standard molar enthalpy of fusion. The differences between the molar isobaric heat capacities of the phases are empirically related to (liq or cr) as follows [7]:
where the heat capacities (liq) and (cr) are referenced to 298.15 K.
It is assumed that the heat capacity differences calculated according to Equations (5) to (7) do not depend on the structures of the organic molecules, provided that reliable data on (cr) and (liq) are available. These equations are widely used in the current literature for the temperature adjustments of the phase transition enthalpies [8]. In our recent work [9], however, we have already questioned the general validity of Equation (5) for long-chain aliphatic esters, since for this family of compounds the relationship between and (liq) still shows a linear correlation, but with parameters that differ significantly from those originally described by Chickos et al. [7] in Equation (5).
This experience provided the motivation for the present study, since the diols are even more predisposed to certain special features than the long-chain esters due to two oxygen functionalities that are bound to the long alkyl chain. Furthermore, it has been found that the liquid-phase heat capacities and the crystal-phase heat capacities of the α,ω-alkanediols (see Table S1) calculated by Chickos’ group are systematically overestimated by 30–50 J.K-1.mol-1 compared to the consistent experimental data from the recent literature (see Tables S2 and S3). What is also worrying is that the differences increase with chain length. Even if the uncertainties associated with the heat capacity differences in Equations (5) to (7) were set at 15 J.K-1.mol-1 (the standard deviation) [7], the systematic nature of the deviations has an impact on the temperature adjustments of the phase transitions carried out according to Equations (5) to (7). The consequences are particularly dramatic for the enthalpies of vaporisation derived from the ebulliometric vapor pressure measurements, where the experimental temperature ranges are typically close to the normal boiling point of a diol. For example (see Table 1), the very accurate experimental vapor pressures available for 1,6-hexanediol in the temperature range 422.2–559.5 K [10] were used to derive the enthalpy of vaporisation values, , and this result was used to calculate the enthalpy of vaporisation using various heat capacity differences available in the literature or according to Equation (5).
From Table 1, it is clear that the final values depend crucially on the -value used for the adjustment. The fluctuation of the values from 82.4 to 96.3 kJ mol-1 is unacceptable, even if the vapor pressure measurements were of impeccable quality. Similar calculations performed for 1,10-decanediol showed that the variations of the values from 97.0 to 105.8 kJ mol-1 are comparable to those of 1,6-hexanediol (see Table 1). It is obvious that the main reason for the unacceptably large scatter of the values is the [(298.15 K – Tav)]-term in Equation (5), which drastically increased even small fluctuations in the values derived using different methods.
The experimental data on vaporisation thermodynamics of other α,ω-alkanediols found in the literature show that most results were measured at elevated temperatures. Therefore, the correct evaluation of the heat capacity differences (see Equations (4) to (6)) for each diol is essential for a correct adjustment and comparison of their phase transition enthalpies. This evaluation was the focus of this work. The available experimental data on heat capacities, vapor pressures and enthalpies of vaporisation for α,ω-alkanediols (C2 – C10) were carefully compiled from the literature in this work and the -values were derived using various methods, critically evaluated and recommended for the temperature adjustment of the phase transition enthalpies for this family of compounds. To validate and cross-check the available experimental data, the additional vapor pressure measurements were carried out on 1,6- and 1,10-alkanediols using the transpiration method. The key advantage of this method is that the measurements were carried out at temperatures not too far from the reference temperature T = 298.15 K, so that any uncertainties in the values have only a tolerable influence on the final values.
2. Experimental and Theoretical Methods
Provenance and purities of the commercial sample of 1,6-, and 1,10-alkanediols are shown in Table S4. A transpiration method [15] was used to measure the vapor pressures over the liquid samples of 1,6-, and 1,10-alkanediols. The temperature dependences of the absolute vapor pressures for each compound were used to derive the enthalpies and entropies of vaporisation of the diols (see Table S5). The general description of the experimental procedure have been published elsewhere [15]. The essential details are given in ESI.
The Gaussian 16 series software [16] was used for quantum-chemical (QC) calculations. The standard molar gas-phase heat capacities of 1,2-, 1,3-, 1,4-, 1,5-,1,6-, and 1,10-alkanediols were calculated using the B3LYP 6-31+g(d,p) method [17]. The general details of the calculation procedure can be found elsewhere [3].
3. Results and Discussion
3.1. Gas Phase Heat Capacities of α,ω-Alkanediols from Quantum-Chemical Calculations
Estimating the heat capacity for α,ω-alkanediols using quantum chemical methods is not a trivial task, since the molecules under investigation are very flexible. Conformational analysis of such molecules using quantum chemical methods is a scientific problem in its own right due to their complexity. Flexible molecules have many rotational degrees of freedom, which leads to an exponential increase in the number of possible conformations. Each of these conformations requires a separate calculation, which is extremely resource-intensive, especially at a high level of theory, and scales poorly with increasing system size.
Determining the global energy minimum is complicated by the fact that many conformers can have similar energy values and, without effective search algorithms, the most stable structure can easily be overlooked. Furthermore, the results are very sensitive to the choice of the basis set and the quantum chemical method. Since 2022 [18] there is an efficient program CREST (abbreviated from Conformer-Rotamer Ensemble Sampling Tool) developed for the automated exploration of the low-energy molecular chemical space, which considerably facilitates the search for conformers. The calculation algorithm includes efficient force field and semi-empirical quantum mechanical methods and offers a variety of options for creating and analysing structural ensembles.
To estimate the heat capacity of 1,2-, 1,3-, 1,4-, 1,5-, 1,6- and 1,10-alkanediols, a conformational analysis was carried out using the CREST software to identify the first ten most stable conformers. The heat capacity was then estimated for each of them using the B3LYP 6-31+g(d,p) method. Table S6 shows the heat capacities for each series of conformers in order of decreasing population. It has been observed that the differences in heat capacity between conformers within the given series of diols are on the order of 3–5 J.K−1.mol−1, so the of the most stable conformer is a good enough representation of the heat capacity of the mixture of conformers present. This assumption helps to significantly reduce the scope of quality control calculations in the future, e.g., for other branched diols. However, the potential difficulties in the general estimation of the thermochemical properties of flexible molecules, as described above, indicate the need for additional independent methods to verify quantum chemical results.
3.2. Are the Chain-Length Dependencies of the Heat Capacities of α,ω-Alkanediols Linear?
The dependence of the physico-chemical properties on the chain length in a homologous series is the simplest case of structure-property relationships in chemistry. In general, a monotonic increase in the property with increasing number of CH2 fragments in the growing alkyl chain is expected. Therefore, the adherence to this linear dependence serves as a criterion for data consistency within the series. The B3LYP-calculated gas-phase heat capacities, , of the most stable conformers of 1,2-, 1,3-, 1,4-, 1,5-,1,6-, and 1,10-alkanediols compiled in Table S6 were correlated with the number of carbon atoms NC in the alkyl chain. An almost perfect correlation between and the number NC was obtained (see Table S7), which is expressed by the following equation:
The good linear correlation between (liq) and NC (see Table S7) is expressed by the following equation:
however, for this correlation, the heat capacity of 1,2-ethanediol was not included in the correlation because, due to the strong intramolecular hydrogen bond specific to this molecule [19], its heat capacity is obviously irregular (see Table S7). A good linear correlation was also observed between (cr) and NC (see Table S8):
The high correlation coefficients R2 derived for the Equations (8) to (10) can be seen as evidence for sufficient internal consistency of the B3LYP-calculated or experimental heat capacities within each type of phase.
3.3. Methods for Assessing Differences in Heat Capacity, , for the Adjustment of the Enthalpies of Vaporisation of Diols from Tav to 298.15 K
3.3.1. Method A: With Quantum-Chemical Gas-Phase (g) and Liquid-Phase (liq)
This successful validation of the (g) and (liq or cr) data in Section 3.2 allows the direct calculation of the (see Table 2, difference between columns 3 and 2).
It is interesting to compare the -values derived in this way (Table 2, column 4), with the -values calculated according to the original empirical Equation (5), developed by Chickos et al. [7] and using experimental (liq) data from column 2 of Table 2. The results are shown in Table 2, column 5, and it is obvious, that the derived in this way are of 20 to 40 J.K-1.mol-1 lower. Therefore, it makes sense to re-evaluate Equation (5) by approximation of data given in columns 2 and 4 of Table 2. The following new correlation specific for diols was obtained:
and it is useful for prediction of the unknown -values of diols, when the are known. The data in bold (see Table 2, column 7) were used for further thermochemical calculations.
3.3.2. Method B: From Kirchhoff’s Equation
Analysis of the experimental data on vaporisation thermodynamics available for diols shows that the data can be divided in two sets. One set includes the vaporisation enthalpies measured directly at T = 298.15 K or with the Tav, which is close to the boiling temperatures (see Tables S9). Another set compiles the measurements of vaporisation enthalpies with Tav which are not too distant from the normal boiling points of diols. This observation conveys an idea to apply the Kirchhoff’s equation to calculate the -values as follows:
For example, the vaporisation enthalpy, = 65,6±0,6 kJ mol−1 of 1,2-ethanediol was measured by Knauth and Sabbah [20] directly at T = 298.15 K (see Table S9-1). This value can be taken as the “reference” value to perform calculations according to Equation (12). The very accurate ebulliometric measurements of 1,2-ethanediol by Markovnik et al. [21] in the range between 384.0 K and 470.9 K (with Tav = 424.5 K) provided = 57,5±0,3 kJ mol−1 (see Table 9.1). Using these experimental values and Equation (12), the heat capacity difference = −64.1 J·mol⁻¹·K⁻¹ was calculated (see Table S9-1). The same procedure was applied for all twenty two vaporisation enthalpy entries collected in Tables S9-1 to S9-6, and the results derived using the calorimetric results by Knauth and Sabbah [20] were averaged.
Even if the vaporisation enthalpy, = 65,6±0,6 kJ mol−1, from Knauth and Sabbah [20] was considered as reliable, the calculations using another reliable vaporisation enthalpy with Tav close to T = 298.15 K could certainly increase the degree of confidence for such a sensitive property as . Indeed, the vaporisation enthalpy = 64,3±0,8 kJ mol−1 (see Table S9-1) of 1,2-ethanediol was measured between 308,2 K and 336,2 K (with Tav = 319.2 K) using the transpiration method [22] can also be considered reliable. This value can be taken as the second “reference” value to repeat calculations according to Equation (12). Using the same as above data from Markovnik et al. [21], the heat capacity difference = −64.6 J·mol⁻¹·K⁻¹ was calculated (see Table S9-1). The agreement of results obtained using first and second “referenced” compound is convincend and it has motivated a further systematic calculations according Equation (12) using the transpiration “reference” value all twenty two vaporisation enthalpy entries collected in Table S9-1, and the results derived using the second “reference” were also averaged.
In the similar way the Equation (12) was applied for the data sets available for 1,3-propanediol (Table S9-2), 1,4-butnediol (Table S9-3), 1,5-pentanediol (Table S9-4), 1,6-hexanediol (Table S9-5), and 1,10-decanediol (Table S9-6). Where it was possible, a few “reference”-values were involved in order to ascertain the resulting values for each diol. The final results were averaged (see Tables S9) and given for comparison with other methods in Table 3.
3.3.3. Method C: From Approximation of Experimental Vapor Pressure Temperature Dependences
It is well known that the approximation of vapor pressures measured over a wide temperature range using the Clarke and Glew equation [23] provides a reliable estimate of the -values. One advantage of the Clarke and Glew equation is that the fitting coefficients are directly related to the thermodynamic functions of vaporisation. The Clarke and Glew equation with three adjustable parameters is as follows:
where θ = an arbitrary reference temperature (in this work we used θ = 298.15 K), = the vapor pressure at the temperature T, = an arbitrary reference pressure (po = 1 Pa in this work), R is the molar gas constant, = the difference in the standard molar Gibbs energy between the gaseous and the liquid phases, = the difference in the standard molar enthalpy between the gas and the liquid phases, and = the difference in the molar heat capacity at constant pressure between the gaseous and the liquid phase.
It is also known that the Clarke and Glew equation is very sensitive to the quality and consistency of the experimental vapor pressures. Furthermore, as an adjustable parameter of this equation, the does not provide reliable values in a relatively short experimental temperature range. Not many of the data sets collected in Table S9 fulfil this requirement. With this in mind, the available vapor pressures for each diol were fitted to Equation (13) and the corresponding values were derived (see Tables S9). The average values are given in Table 3 for comparison.
The analysis of the results derived with methods A, B and C compared in Table 3 shows that the averaged values are practically indistinguishable, taking into account the uncertainties attributed to the results of methods B and C. Therefore, with the convincing support of method A by methods B and C, the revised empirical dependency = f () according to tp Equation (11) was generally recommended for the temperature adjustment of diols. The values calculated from this equation (Table 3, column 2) were finally used in this work to adjust the enthalpies of vaporisation to T = 298.15 K (see Table S10), and the final averaged results are shown in Table 4.
3.3. Methods for Assessing Differences in Heat Capacity, , for the Adjustment of the Enthalpies of Sublimation of Diols from Tav to 298.15 K
The reliability of the experimental -values and quantum chemical -values for α,ω-alkanediols was checked for consistency in Section 3.2 and the differences were estimated based on these evaluated values (see Table 5, difference between columns 3 and 2).
Comparison of the data for of α,ω-alkanediols based on quantum chemical calculations (Table 5, column 4) and those estimated from the empirical equation developed by Chickos et al. [7] (see Equation (6)) shows a generally good agreement between the results of both methods. Nevertheless, it seems reasonable to refine Equation (6) using the data specifically for diols, whereby the data given in columns 2 and 4 of Table 5 are used. The following equation was developed specifically for diols:
The crystal-phase heat capacities derived from this equation were used for thermochemical calculations in this work.
3.4. Re-Parameterisation of the Group Additivity Method for (liq) and (cr) Designed for Diols
The compilation of the experimental heat capacities in the liquid phase (Table S2) and the experimental heat capacities in the crystal phase (Table S3) shows that both phases are systematically overestimated compared to the method of Chickos with its original parameterization [6,7]. However, the analysis of the deviations shows that in both cases the deviations generally do not increase with increasing chain length and can be considered constant. This constant behaviour makes it possible to retain the original parameterisation of Chickos (see Table S1), but the specific contributions for diols [OH]2 = -45.7 J.K−1.mol−1 (Table S2) for the liquid α,ω-alkanediols and [OH]2 = -37.0 J.K−1.mol−1 (Table S3) for the crystal diols were proposed to reconcile the experimental and estimated results. This slight modification of the empirical group additivity procedure, as developed by Chickos et al. [6], can be useful for estimating the heat capacities of diols with branched alkyl chains, for which only a few experimental data are available in the literature.
3.5. Heat Capacity Differences for the Adjusting the Fusion Enthalpies of Diols from Tfus to 298.15 K
The enthalpy of fusion (or melting enthalpy), , is usually measured at the melting (or fusion) temperature and this enthalpy and temperature are considered as constants specific for the compound. Is there any difference between notation melting and fusion? As a matter of fact, melting and fusion are closely related, but have subtle differences: melting refers specifically to the phase transition of a solid that turns into a liquid when heated to its melting point. Fusion is a broader term that can refer to melting, but also includes other processes in which materials combine, such as ‘nuclear fusion’ (in which atomic nuclei fuse to form a heavier nucleus and release energy). In physics and materials science, the term ‘fusion’ is sometimes used interchangeably with ‘melting’, but it has a broader application than just phase transitions. Melting is therefore a special type of fusion, but fusion can mean more than just melting. Nevertheless, melting and fusion can be considered equivalent in thermochemistry.
The fusion enthalpy (or melting enthalpy), , was not always adjusted to the reference temperature T = 298.15 K. However, such an adjustment is essential for thermochemical calculations, since according to the textbook, the consistency of the energetics of the phase transition can be determined using a general equation:
whereby all properties have to be adjusted to a common temperature (e.g., to the reference temperature T = 298.15 K in this work). According to the Chickos method, the temperature adjustment of the fusion enthalpy is usually carried out using Equation (4), whereby the heat capacity difference is estimated according to Equation (7). However, since the heat capacities of the liquid and crystalline phases are significantly overestimated in the original parameterisation of the Chickos’s method, the also follows this trend (see Table 6, column 6).
To eliminate the consequences of overestimates, the corrected values of from Table S7, column 7 and the corrected values of from Table S8, column 4 were used to calculate the reliable values (see Table 6, column 4), which were recommended for temperature adjustment of the fusion enthalpy of diols from Tfus to 298.15 K. For practical reasons, it is also useful to derive a correlation between and the heat capacity of the liquid phase. Using the data in columns 2 and 4 of Table 6, the following equation was developed:
This equation can be useful for a quick appraisal of values and the resulting adjustment of the fusion enthalpies to the reference temperature T = 298.15 K.
3.6. Are the Literature Experimental Data on Energetics of Phase Transition of the Long-Chained Diols Reliable?
Experimental studies on the thermochemistry of diols are very limited, especially for the long-chain species. Systematic studies on the energetics of phase transitions for α,ω-alkanediols have been described mainly in a few papers by the Sabbah group [20] and the Della Gatta group [12,13]. In the Sabbah group, the molar heat capacities in the gas phase at 298.15 K and Tav were calculated from the group increments tabulated by Benson [24]. The enthalpy differences H(T) - H(298.15 K) of the condensed phase were measured with a Tian-Calvet calorimeter using the drop method. In the Della Gatta group, the molar enthalpy functions for the gas phase were calculated using the Benson group additivity scheme [24] and for the liquid phase, the molar enthalpy functions were also estimated using the Missenard’s empirical additive method [25]. Since the approaches used in the literature for temperature adjustments of the enthalpies of vaporisation are not identical, it makes sense to apply the heat capacity differences evaluated in this work in order to obtain an appropriate comparison and analysis of the available experimental results.
Equation (15) is a generally useful tool for establishing the consistency of the energetics of the liquid-vapor, solid-vapor and solid-liquid phase transitions. Admittedly, for these three phase transitions, it is more advantageous to compare and analyse the values of the enthalpies of vaporisation, since this thermochemical property obeys the rules of group additivity and correlates successfully with boiling temperatures, the number of carbon atoms in a molecule, etc. The compilation of the enthalpies of vaporisation of the short-chained α,ω-alkanediols is given in Table 4. The compilation of the enthalpies of vaporisation of the long-chained α,ω-alkanediols is given in Table 7.
Some of the results given in this table were measured directly above the melting temperature and these enthalpies of vaporisation were adjusted from to T = 298.15 K using the –values from Table 2, column 7. Other results given in this table were measured below the melting temperature and the corresponding sublimation enthalpies were first adjusted from to T = 298.15 K (see Table S11) using the from Table 5, column 7. After that, the fusion enthalpies, , available for these diols were also adjusted to T = 298.15 K (see Table S12) using the values (Table 6, column 4). Finally, the enthalpies of vaporisation (298.15 K) available in the literature for 1,6-hexanediol, 1,8-octanediol and 1,10-decanediol [20] were calculated according to Equation (15) and given in Table 7 for comparison.
If the sufficient quantity and good consistency of the available enthalpies of vaporisation of the short-chain α,ω-alkanediols were observed in Table 4, the data for the long-chain species (with the exception of 1,6-hexanediol) are rather confusing (see Table 7). Even when the enthalpies of vaporisation were uniformly adjusted to T = 298.15 K, the unusual differences between the corresponding homologous data observed in the literature are rather questionable. In fact, the comparison of the vaporisation enthalpies in Table 7 for the sequence of 1,8-octanediol = 106.2 ± 2.0 kJ mol−1), 1,9-nonanediol = 113.6 ± 2.1 kJ mol−1) and 1,10-decanediol = 111.0±2.0 kJ mol−1, calorimetrically measured in the Sabbah group [20], make it clear that there is no reason or specific interaction that makes the enthalpy of vaporisation of 1,9-nonanediol higher than that of 1,10-decanediol.
The set of vaporisation enthalpies of α,ω-alkanedios measured by the Della Gatta group [12,13] measured using a combination of the torsion-effusion and Knudsen methods is more problematic. The results of the adjustment of the experimental enthalpies of vaporisation, , of α,ω-alkanediols [12,13] from (Tav) to the reference temperature T = 298.15 K are shown in Table 8.
This table shows that reported by Della Gatta group [12,13] for the series of diols from 1,11-undecanediol to 1,16-hexadecanediol are practically the same within the limits of experimental uncertainties. Such an anomaly cannot be meaningfully explained and could only be attributed to possible experimental problems in the investigation of the diols. The general trends of the chain length dependencies for the diol series measured in the Sabbah and Della Gatta groups are shown in Figure 1.
The following linear correlations were obtained from the numerical results compiled in Table 7, column 4:
The significantly different slopes of these correlations are further evidence of the internal inconsistencies of the experimental data sets. This inconsistency seems to have been overlooked by the Chickos group, as they used the data for the long-chain diols from [12,13,20] (see Table 7) as standards for the correlation gas chromatography (CGC) method.
The CGC method used by the Chickos group is based on measurements of the retention times tR of the series of “target” compounds, which are generally structural parent molecules [26]. In the first step, the mixture of “target“ compounds and “standards” (similarly shaped compounds with reliable enthalpies of vaporisation) are injected simultaneously into a gas chromatographic column and their retention times recorded at different temperatures.
The slope of the dependence (Tm) = f (1/T) provides the transfer enthalpy, (Tm), of the “target” from the liquid phase of the column to the gas phase. Tm is the average temperature of the GC experiment. In the second step, the transfer enthalpies, (Tm), of the standards are correlated with their known enthalpies of vaporisation, (298.15 K). The unknown enthalpies of vaporisation of the “target” substances are then derived from this correlation. The CGC has proven to be a reliable method for the evaluation of the enthalpy of vaporisation, provided that a sufficient number of suitable standards with reliable enthalpies of vaporisation are available [27].
The original values derived by Chickos et al. [26] were based primarily on the correlations with the calorimetric data reported by Sabbah et al. [20]. Consequently, their correlation with chain length does not differ significantly from those shown in Equation (17):
The most surprising thing about this correlation is that all diols from 1,2-ethanediol to 1,16-hexadecanediol lie on the flawless straight line (see Figure 1). At the same time, it is known that 1,2-ethanediol, 1,3-propanediol and 1,4-butanediol exhibit pronounced intramolecular hydrogen bonding [28], and this peculiarity should influence the vaporisation energetics and the resulting decrease in enthalpy of vaporisation, as a consequence [29].
Another unusual aspect that can be seen from Equations (17) and (19) is that the slope of both dependencies is around 7 kJ mol-1, suggesting that the contribution of the CH2 fragment to the enthalpies of vaporisation of diols is extremely high compared to the contribution of CH2 from 4.4 to 5.0 kJ mol-1 in the most homologous series of organic compounds (see Table S13) and even for the ionic liquid with CH2 = 3.9 ± 0.2 kJ mol-1 [30].
All these issues led to additional experimental work, and the liquid samples of 1,6-hexanediol and 1,10-decanediol were deliberately measured using the transpiration method in this work. The latter method has already been successfully used to measure the vapor pressure of the short-chained diols 1,2-ethanediol [22], 1,3-propanediol [31] and 1,4-butanediol [32]. These results were used in Section 3.3.3 to determine reliable values for the heat capacity differences (see Table S9). The decisive advantage of this method is that the measurements can be carried out close to T = 298.15 K. Furthermore, the residual water content typical for diols is removed from the sample in the preconditioning experiment. In addition, the sample is held in a saturator under a supply of the inert gas (nitrogen) during the transpiration experiment. In order to gain experience with long-chain diols, 1,6-hexanediol was measured (see Table S5), and the enthalpy of vaporisation from the transpiration measurements agreed very well with the results of other methods (see Table 7 and Table S10).
The results of the transpiration experiment with 1,10-decanediol are shown in Table S5 and the final value = 106.6 ± 0.9 kJ mol-1 was compared with the results of other methods in Table 7. Our new value is perfectly consistent with those derived from the very good quality ebulliometric result 106.6±6.7 kJ mol-1 [11], but it is far away from the vaporisation enthalpies determined by the Sabbah group (111.0±2.0 kJ mol-1, Table 11) and the Della Gatta group (122.6±5.0 kJ mol-1 [12]), and consequently also differs from the enthalpy of vaporisation (120.0±0.6 kJ mol-1) of the CGC method of the Chickos group [26]. In order to find possible independent support for our new or previous results, we collected numerous boiling points under reduced pressure from the literature (see Table S14). These are usually given by organic chemists as a constant value during distillation after synthesis and are necessary to characterise the compound produced. These vapor pressure data typically cover a wide range from atmospheric boiling point down to pressures attainable with rotary vane vacuum pumps commonly used in chemical laboratories. In our experience [33], these reduced pressures, when treated as a function of temperature, usually provide a rough but reasonable trend for a compound of interest (significant details are given in ESI).
The approximation of the boiling points (BP) found for 1,10-decanediol (see Table S14) yields = 106.2 ± 6.2 kJ mol-1 (see Table 7), which is in excellent agreement with our transpiration result. The approximation of the boiling points found for 1,6-hexanediol (see Table S14) yields = 89.5 ± 3.4 kJ mol-1 (see Table 7), which is in good agreement with other results collected for comparison in this table. This good performance with the BP method prompted the collection of the available boiling points for the diols with a chain length between six and ten (see Table S14) in order to evaluate the dependence on the chain length and possibly understand why the previous Eqs. (17) and (18) are so different. The treatment of the BP data yielded the following results (see Table 7): = 95.5 ± 3.9 kJ mol-1 for 1,7-heptanediol, = 98.9±4.1 kJ mol-1 for 1,8-octanediol, and = 102.5±5.2 kJ mol-1 for 1,9-nonanediol.
The BP result for 1,7-heptanediol is about 2.5 kJ mol-1 lower than previous values (see Table 7). For 1,8-octanediol and 1,9-nonanediol, the BP results are significantly (by 10 kJ mol-1) lower than the previous results obtained by the groups of Sabbah and Della Gatta. In such an ambiguous situation, we decided to reassess the CGC results reported by Chickos et al. [26] using their original transfer enthalpies. However, instead of the original standards published by Sabbah [20] and Della Gatta [12,13], which Chickos [26] used in his work, we used the evaluated from Table 4 and Table 7. The algorithm of the revision is shown in Table S15 and the final results are listed in Table 7 for comparison. It is not unexpected, but now the revised enthalpies of vaporisation derived in this way are hardly distinguishable from the carefully evaluated results in Table 4 and the results obtained in this work using the experimental transpiration method and the empirical BP method. This perfect match resolves our doubts about the selection of the “true” enthalpies of vaporisation for the long-chain α,ω-alkanediols. It is now obvious that the enthalpies of vaporisation for 1,7-heptanediol, 1,8-octanediol, 1,9-nonanediol and 1,10-decanediol, measured by the Sabbah and Della Gatta groups, should be considered questionable (they are given in brackets in Table 7).
The enthalpies of vaporisation of 1,5-pentanediol (Table 4) evaluated in this work and the values for 1,6-hexanediol, 1,7-heptanediol, 1,8-octanediol, 1,9-nonanediol and 1,10-decanediol (see Table 7) show a good linear dependence on the chain length NC (see Figure 1):
This dependence reproduces the selected for correlation values of the long-chain diols C5 – C10 within ± 1.0 kJ mol-1 (see Table 7 and Table S16) and can be recommended for calculating the values for the α,ω-alkanediols with the longer chain. It turned out that the enthalpies of vaporisation of the first three representatives of the α,ω-alkanediols are completely outside the correlation represented by Equation (20): 1,2-ethanediol with −9.5 kJ mol-1, 1,3-propanediol with −7.6 kJ mol-1 and 1,4-butanediol with −3.9 kJ mol-1 (see Table S16). These significant stabilisations of the short-chain diols are due to the relatively strong contribution of the intramolecular hydrogen bond, which is a special feature of these molecules.
4. Conclusions
In this work, the inconsistencies of the conventional heat capacity correlations for diols were uncovered and their consequences for the estimation of thermodynamic properties were analysed. The differences in heat capacity between the solid, liquid and gaseous phases were evaluated using experimentally measured vapour pressures, enthalpies of vaporisation, heat capacities in the solid and liquid phases and quantum chemical calculations. It was shown that the observed systematic and significant overestimation of the heat capacities up to 30–50 J.K-1.mol-1 led to an overestimation of the vaporisation enthalpies in the order of 10 to 15 kJ mol-1. The re-evaluation of the parameters for diols and the revision of the structure-property correlations have helped to reconcile empirical and experimental heat capacities and enthalpies of vaporisation for α,ω-alkanediols. The resulting data offer significant advantages for the design of technical processes involving diols and for the accurate modelling of their phase behaviour.
This paper is a contribution for the Special Issue “Thermodynamics of Molecular Complexation and Hydrogen Bonding in Solution Chemistry — A Themed Issue Honoring Professor Dr. Boris N. Solomonov”. Considering the excellent expertise of Boris Nikolayevich in the field of intermolecular hydrogen bonding (HB), we propose to use our analysed and consistent data of vaporisation enthalpies for short-chain diols to resolve the challenging issue of energetic quantification of competition between inter-HB and intra-HB of diols in the pure liquid phase.
Supplementary Materials
The following supporting information can be downloaded at: Preprints.org.
Acknowledgments
This project has been funded by the Free State of Bavaria through the project “Oxo-LOHC-Autotherme und ultratiefe Wasserstoff-Freisetzung aus LOHC-Systeme - Oxo-LOHC“ (grant number: 84-6665a2/201/11). AAS acknowledges gratefully the Committee on Science and Higher Education of the Government of St. Petersburg. This work was partly supported by the Ministry of Science and Higher Education of the Russian Federation (Project No. FSSE-2023-0003) un-der the state assignment of Samara State Technical University.
References
- Zabransky, M.; Ruzicka, V.; Majer, V.; Domalski, E.S. Critical Compilation of Heat Capacities of Liquids. In Physical Property Prediction in Organic Chemistry; Springer Berlin Heidelberg: Berlin, Heidelberg, 1988; pp. 523–538. [Google Scholar]
- Zábranský, M.; Růžička, V. Estimation of the Heat Capacities of Organic Liquids as a Function of Temperature Using Group Additivity: An Amendment. J. Phys. Chem. Ref. Data 2004, 33, 1071–1081. [Google Scholar] [CrossRef]
- Ghahremanpour, M.M.; van Maaren, P.J.; Ditz, J.C.; Lindh, R.; van der Spoel, D. Large-Scale Calculations of Gas Phase Thermochemistry: Enthalpy of Formation, Standard Entropy, and Heat Capacity. J. Chem. Phys. 2016, 145. [Google Scholar] [CrossRef]
- Růžička, V.; Domalski, E.S. Estimation of the Heat Capacities of Organic Liquids as a Function of Temperature Using Group Additivity. I. Hydrocarbon Compounds. J. Phys. Chem. Ref. Data 1993, 22, 597–618. [Google Scholar] [CrossRef]
- Cohen, N. Revised Group Additivity Values for Enthalpies of Formation (at 298 K) of Carbon–Hydrogen and Carbon–Hydrogen–Oxygen Compounds. J. Phys. Chem. Ref. Data 1996, 25, 1411–1481. [Google Scholar] [CrossRef]
- Chickos, J.S.; Hesse, D.G.; Liebman, J.F. A Group Additivity Approach for the Estimation of Heat Capacities of Organic Liquids and Solids at 298 K. Struct. Chem. 1993, 4, 261–269. [Google Scholar] [CrossRef]
- Chickos, J.S.; Hosseini, S.; Hesse, D.G.; Liebman, J.F. Heat Capacity Corrections to a Standard State: A Comparison of New and Some Literature Methods for Organic Liquids and Solids. Struct. Chem. 1993, 4, 271–278. [Google Scholar] [CrossRef]
- Verevkin, S.P.; Emel’yanenko, V.N.; Diky, V.; Muzny, C.D.; Chirico, R.D.; Frenkel, M. New Group-Contribution Approach to Thermochemical Properties of Organic Compounds: Hydrocarbons and Oxygen-Containing Compounds. J. Phys. Chem. Ref. Data 2013, 42, 033102. [Google Scholar] [CrossRef]
- Zaitsau, D.H.; Pimerzin, A.A.; Verevkin, S.P. Fatty Acids Methyl Esters: Complementary Measurements and Comprehensive Analysis of Vaporisation Thermodynamics. J. Chem. Thermodyn. 2019, 132, 322–340. [Google Scholar] [CrossRef]
- Steele, W.V.; Chirico, R.D.; Nguyen, A.; Hossenlopp, I.A.; Smith, N.K. DIPPR Project 871: Determination of Ideal-Gas Enthalpies of Formation for Key Compounds: The 1989 Project Results. DIPPR Data Ser. 1991, 1, 101–134. [Google Scholar]
- Steele, W.V.; Chirico, R.D.; Hossenlopp, I.A.; Knipmeyer, S.E.; Nguyen, A.; Smith, N.K. Determination of Ideal-Gas Phase Enthalpies of Formation for Key Compounds. In Exp. Results DIPPR 1990-91 Proj. Phase Equilibria Pure Compon. Prop.; Cunningham, J.R., Jones, D.K., Eds.; AICHE: New York, 1994; pp. 188–215. [Google Scholar]
- Piacente, V.; Ferro, D.; Gatta, G.D. Vaporisation Enthalpies of a Series of α, ω-Alkanediols from Vapour Pressure Measurements. Thermochim. Acta 1993, 223, 65–73. [Google Scholar] [CrossRef]
- Piacente, V.; Ferro, D.; Gatta, G. Della Vaporisation Enthalpies of Five Odd-Numbered (C7 to C15) α,ω-Alkanediols. Thermochim. Acta 1994, 232, 317–321. [Google Scholar] [CrossRef]
- Steele, W. V.; Chirico, R.D.; Knipmeyer, S.E.; Nguyen, A.; Smith, N.K. Thermodynamic Properties and Ideal-Gas Enthalpies of Formation for Butyl Vinyl Ether, 1,2-Dimethoxyethane, Methyl Glycolate, Bicyclo [2.2.1]Hept-2-Ene, 5-Vinylbicyclo [2.2.1]Hept-2-Ene, Trans -Azobenzene, Butyl Acrylate, Di- Tert -Butyl Ether, and Hexane-1. J. Chem. Eng. Data 1996, 41, 1285–1302. [Google Scholar] [CrossRef]
- Verevkin, S.P.; Emel’yanenko, V.N. Transpiration Method: Vapor Pressures and Enthalpies of Vaporisation of Some Low-Boiling Esters. Fluid Phase Equilib. 2008, 266, 64–75. [Google Scholar] [CrossRef]
- Frisch, M.J.; Trucks, G.W.; Schlegel, H.B.; Scuseria, G.E.; Robb, M.A.; Cheeseman, J.R.; Scalmani, G.; Barone, V.; Petersson, G.A.; Nakatsuji, H.; et al. Gaussian 16, Revision C.01; Gaussian, Inc.: Wallingford CT, 2016. [Google Scholar]
- Clark, T.; Chandrasekhar, J.; Spitznagel, G.W.; Schleyer, P.V.R. Efficient Diffuse Function-augmented Basis Sets for Anion Calculations. III. The 3-21+G Basis Set for First-row Elements, Li–F. J. Comput. Chem. 1983, 4, 294–301. [Google Scholar] [CrossRef]
- Pracht, P.; Grimme, S.; Bannwarth, C.; Bohle, F.; Ehlert, S.; Feldmann, G.; Gorges, J.; Müller, M.; Neudecker, T.; Plett, C.; et al. CREST—A Program for the Exploration of Low-Energy Molecular Chemical Space. J. Chem. Phys. 2024, 160. [Google Scholar] [CrossRef]
- Pimentel, G.C.; McClellan, A.L. The Hydrogen Bond; W.H. Freeman and Co.: San Francisco and London, 1960; pp. 1–475. [Google Scholar]
- Knauth, P.; Sabbah, R. Energetics of Intra- and Intermolecular Bonds in ω-Alkanediols. III. Thermochemical Study of 1,6-Hexanediol, 1,7-Heptanediol, 1,8-Octanediol, 1,9-Nonanediol, and 1,10-Decanediol at 298.15 K. Can. J. Chem. 1990, 68, 731–734. [Google Scholar] [CrossRef]
- Markovnik, V.S.; Sachek, A.I.; Peshchenko, A.D.; Shvaro, O.V.; Andreevskii, D.N. Vapor Pressure of Certain Glycols. Termodin. Org. Soedin. 1981, 54–57. [Google Scholar]
- Verevkin, S.P. Determination of Vapor Pressures and Enthalpies of Vaporisation of 1,2-Alkanediols. Fluid Phase Equilib. 2004, 224, 23–29. [Google Scholar] [CrossRef]
- Clarke, E.C.W.; Glew, D.N. Evaluation of Thermodynamic Functions from Equilibrium Constants. Trans. Faraday Soc. 1966, 62, 539. [Google Scholar] [CrossRef]
- Benson, S.W.; Golden, D.M.; Haugen, G.R.; Shaw, R.; Cruickshank, F.R.; Rodgers, A.S.; O’Neal, H.E.; Walsh, R. Additivity Rules for the Estimation of Thermochemical Properties. Chem. Rev. 1969, 69, 279–324. [Google Scholar] [CrossRef]
- Missenard, F.-A. Méthode Additive Pour La Détermination de La Chaleur Molaire de Liquides. Compt.Rend.Acad.Sci.Paris 1965, 260, 5521–5523. [Google Scholar]
- Umnahanant, P.; Kweskin, S.; Nichols, G.; Dunn, M.J.; Smart-Ebinne, H.; Chickos, J.S. Vaporisation Enthalpies of the α,ω-Alkanediols by Correlation Gas Chromatography. J. Chem. Eng. Data 2006, 51, 2246–2254. [Google Scholar] [CrossRef]
- Chickos, J.S.; Hosseini, S.; Hesse, D.G. Determination of Vaporisation Enthalpies of Simple Organic Molecules by Correlations of Changes in Gas Chromatographic Net Retention Times. Thermochim. Acta 1995, 249, 41–62. [Google Scholar] [CrossRef]
- Busfield, W.K.; Ennis, M.P.; McEwen, I.J. An Infrared Study of Intramolecular Hydrogen Bonding in α, ω Diols. Spectrochim. Acta Part A Mol. Spectrosc. 1973, 29, 1259–1264. [Google Scholar] [CrossRef]
- Siewert, R.; Ludwig, R.; Verevkin, S.P. Non-Covalent Interactions in Molecular Systems: Thermodynamic Evaluation of the Hydrogen Bond Strength in Aminoalcohols. Phys. Chem. Chem. Phys. 2021, 23, 25226–25238. [Google Scholar] [CrossRef] [PubMed]
- Verevkin, S.P.; Zaitsau, D.H.; Emel’yanenko, V.N.; Yermalayeu, A. V.; Schick, C.; Liu, H.; Maginn, E.J.; Bulut, S.; Krossing, I.; Kalb, R. Making Sense of Enthalpy of Vaporisation Trends for Ionic Liquids: New Experimental and Simulation Data Show a Simple Linear Relationship and Help Reconcile Previous Data. J. Phys. Chem. B 2013, 117, 6473–6486. [Google Scholar] [CrossRef]
- Emel’yanenko, V.N.; Verevkin, S.P. Benchmark Thermodynamic Properties of 1,3-Propanediol: Comprehensive Experimental and Theoretical Study. J. Chem. Thermodyn. 2015, 85, 111–119. [Google Scholar] [CrossRef]
- Vasiltsova, T. V.; Verevkin, S.P.; Bich, E.; Heintz, A.; Bogel-Lukasik, R.; Domanska, U. Thermodynamic Properties of Mixtures Containing Ionic Liquids. Activity Coefficients of Ethers and Alcohols in 1-Methyl-3-Ethyl-Imidazolium Bis(Trifluoromethyl-Sulfonyl) Imide Using the Transpiration Method. J. Chem. Eng. Data 2005, 50, 142–148. [Google Scholar] [CrossRef]
- Samarov, A.A.; Verevkin, S.P. Comprehensive Thermodynamic Study of Alkyl-Biphenyls as a Promising Liquid Organic Hydrogen Carriers. J. Chem. Thermodyn. 2022, 174, 106872. [Google Scholar] [CrossRef]
Figure 1.
Chain length dependence of the enthalpies of vaporisation, for the data available in the literature and results of this work: green circle - [20]; black circle - [12]; blue circle - [26]; red circle - this work (data from Table 4 and Table 7).
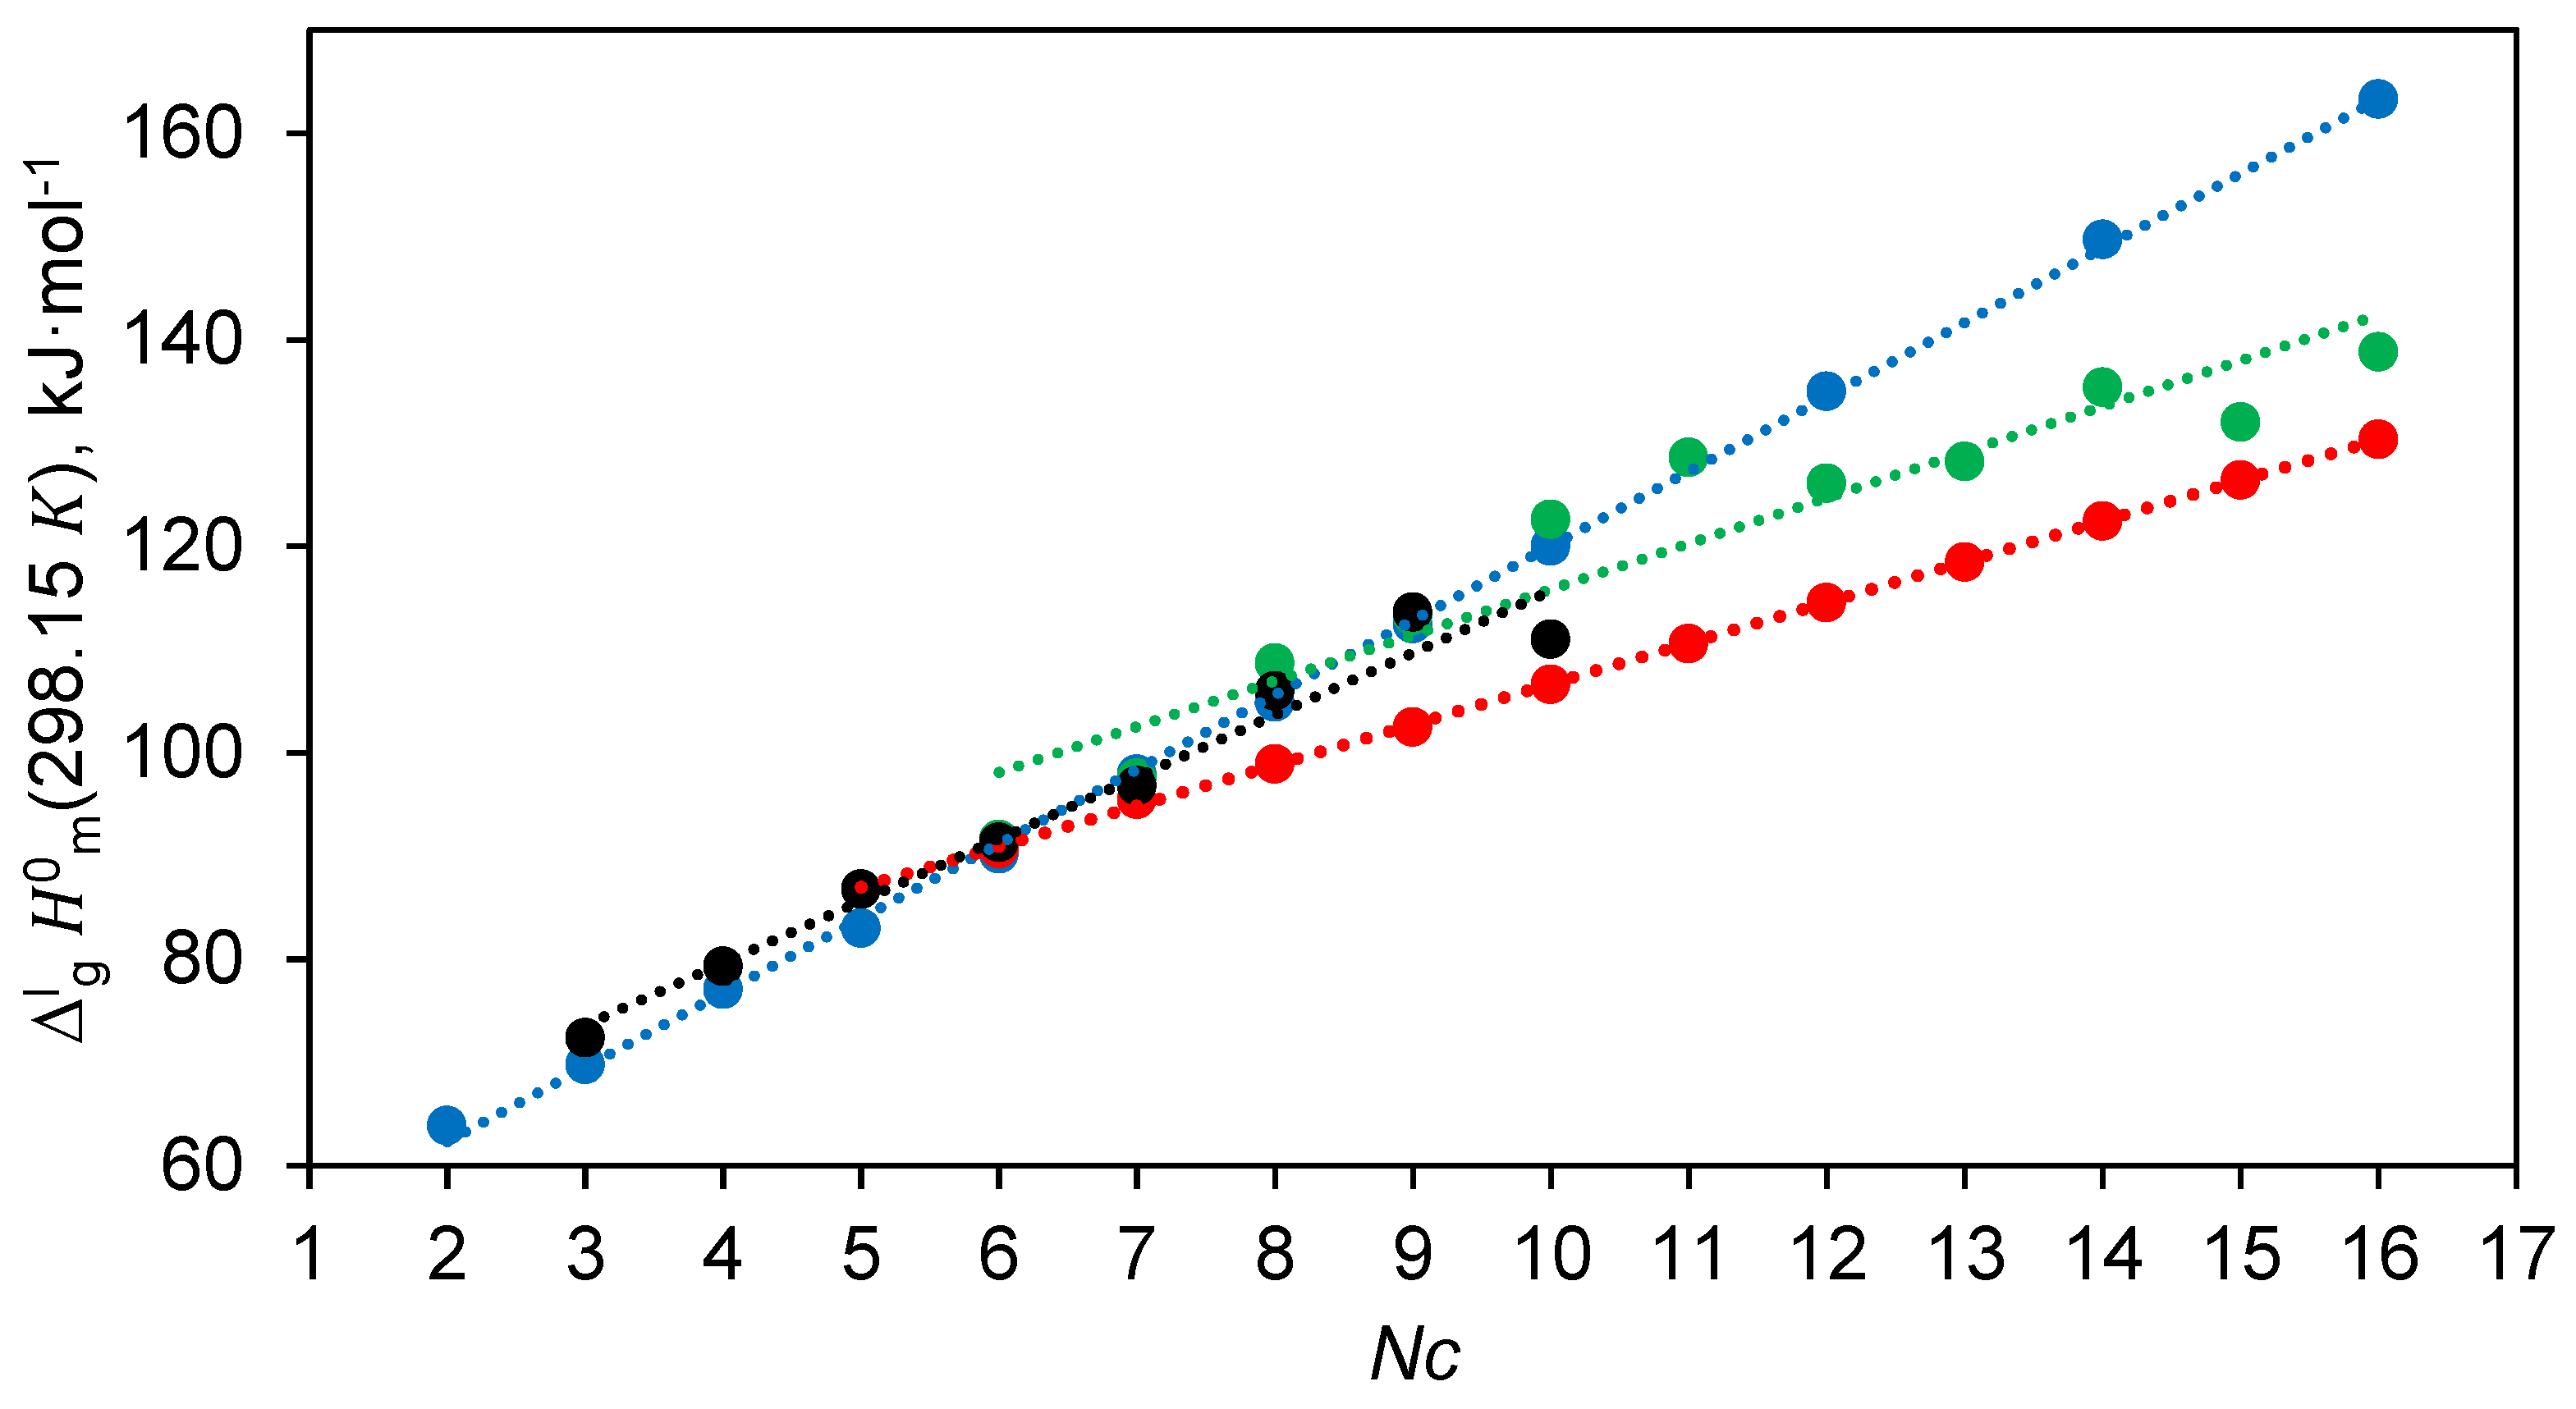

Table 1.
Temperature adjustment of experimental vaporisation enthalpies (Tav) to the reference temperature T = 298.15 K using different heat capacity differences .
Table 1.
Temperature adjustment of experimental vaporisation enthalpies (Tav) to the reference temperature T = 298.15 K using different heat capacity differences .
| Diol | T-range | (298.15 K) | ||
|---|---|---|---|---|
| K | kJ·mol-1 | J·K-1·mol-1 | kJ·mol-1 | |
| 1,6-hexanediol | 422.2-559.5 [10] | 67.7 | 90.9 a | 84.7 |
| 78.3 b | 82.4 | |||
| 97.7 c | 86.0 | |||
| 153.0 d | 96.3 | |||
| 1,10-decanediol | 457.0-566.3 [11] | 73.6 | 124.0 a | 99.6 |
| 116.6 b | 97.0 | |||
| 121.2 c | 99.0 | |||
| 154.0 e | 105.8 |
a Using the original Chickos’s parameters (Table S1) and Equation (4). b Using the experimental heat capacities (Table S2) and Equation (4). c Developed in Refs. [12,13]. d Developed in this work, using the experimental vapor pressure from Ref. [14] . e Developed in this work, using the experimental vapor pressure from Ref. [11].
Table 2.
Comparison of results on α,ω-alkanediols based on QC calculations and the results estimated using the GA method developed by the Chickos group (in J.K−1.mol−1 at T = 298.15 K).
Table 2.
Comparison of results on α,ω-alkanediols based on QC calculations and the results estimated using the GA method developed by the Chickos group (in J.K−1.mol−1 at T = 298.15 K).
| Diol | a | b | c | d | e | f |
|---|---|---|---|---|---|---|
| 1 | 2 | 3 | 4 | 5 | 6 | 7 |
| 1,2-ethanediol | 149.7 | 78.0 | -71.7 | -49.5 | -22.2 | -62.5 |
| 1,3-propanediol | 175.8 | 96.5 | -79.3 | -56.3 | -23.0 | -72.6 |
| 1,4-butanediol | 203.3 | 115.1 | -88.2 | -63.4 | -24.8 | -83.3 |
| 1,5-pentanediol | 232.5 | 137.1 | -95.4 | -71.0 | -24.4 | -94.6 |
| 1,6-hexanediol | 260.4 | 157.7 | -102.7 | -78.3 | -24.4 | -105.5 |
| 1,7-heptanediol | 296.6 | 177.4 | -119.2 | -87.7 | -31.5 | -119.5 |
| 1,8-octanediol | 327.6 | 197.5 | -130.1 | -95.8 | -34.3 | -131.6 |
| 1,9-nonanediol | 359.5 | 217.7 | -141.8 | -104.1 | -37.8 | -144.0 |
| 1,10-decanediol | 388.5 d | 238.0 | -150.5 | -111.6 | -38.9 | -155.2 |
a Experimental data from Table S2, column 2. b DFT calculated values from Table S6, column 3. c Difference between columns 3 and 2 of this table. d Calculated according to the Equation (5) using experimental (liq) data from column 2 of this table. e Difference between columns 4 and 5 of this table. f Calculated according to equation: / J.K−1.mol-1 = −0.3885×(liq) – 4.3 with R2 = 0.9996, derived from approximation of data given in columns 2 and 4 of this table. The data in bold were used for further thermochemical calculations.
Table 3.
Comparison of data on of α,ω-alkanediols derived by methods A, B, and C (in J.K−1.mol−1 at T = 298.15 K).
Table 3.
Comparison of data on of α,ω-alkanediols derived by methods A, B, and C (in J.K−1.mol−1 at T = 298.15 K).
| .Diols | (Equation (11)) a | (Equation (12)) b | c | (Equation (13)) d | e |
|---|---|---|---|---|---|
| 1 | 2 | 3 | | 5 | 6 |
| 1,2-ethanediol | -62.5 | -59.0±1.3 | -3.5 | -68.0±3.9 | 5.5 |
| 1,3-propanediol | -72.6 | -68.4±1.6 | -4.2 | -77.1±5.6 | 4.5 |
| 1,4-butanediol | -83.3 | -82.1±2.6 | -1.2 | -81.2±7.0 | -2.1 |
| 1,5-pentanediol | -94.6 | -96.4±8.0 | 1.4 | -94.0±7.0 | -0.6 |
| 1,6-hexanediol | -105.5 | -106.3±5.3 | -111.5±4.2 | 5.2 | |
| 1,7-heptanediol | -119.5 | ||||
| 1,8-octanediol | -131.6 | ||||
| 1,9-nonanediol | -144.0 | ||||
| 1,10-decanediol | -155.2 | -155.0 ±2.0 | -0.2 | -154.2 ±2.3 | -1.0 |
a From Table 2, column 7, calculated according to Equation (11). The data in bold were used for further thermochemical calculations. b From Table S9, calculated according to Equation (12). Uncertainties are expressed as the standard deviations. c Difference between columns 2 and 3 of this table. d From Table S9, calculated from approximation experimental vapor pressures according to the Clarke and Glew equation (Equation (13)). Uncertainties are expressed as the standard deviations. e Difference between columns 2 and 5 of this table.
Table 4.
Compilation of the recommended standard molar enthalpies of vaporisation of the short-chained α,ω-alkanediols (in kJ⋅mol−1).
Table 4.
Compilation of the recommended standard molar enthalpies of vaporisation of the short-chained α,ω-alkanediols (in kJ⋅mol−1).
| Diol | /298.15 Ka |
|---|---|
| 1,2-ethanediol | 65.7±0.2 |
| 1,3-propanediol | 71.5±0.3 |
| 1,4-butanediol | 79.0±0.7 |
| 1,5-butanediol | 86.8±0.6 |
| 1,6-hexanediol | 90.4±1.0 |
| 1,10-decanediol | 106.6±1.3 |
a Averaged values from Table S10. Uncertainties are presented as expanded uncertainties..
Table 5.
Comparison of results on α,ω-alkanediols based on QC calculations and the results estimated using the GA method developed by the Chickos group (in J.K−1.mol−1 at T = 298.15 K).
Table 5.
Comparison of results on α,ω-alkanediols based on QC calculations and the results estimated using the GA method developed by the Chickos group (in J.K−1.mol−1 at T = 298.15 K).
| Diol | a | b | c | d | e | f |
|---|---|---|---|---|---|---|
| 1 | 2 | 3 | 4 | 5 | 6 | 7 |
| 1,6-hexanediol | 190.7 | 157.7 | -33.0 | -29.4 | -3.6 | -30.1 |
| 1,7-heptanediol | 211.7 d | 177.4 | -34.3 | -32.5 | -1.8 | -33.6 |
| 1,8-octanediol | 236.5 | 197.5 | -39.0 | -36.2 | -2.8 | -37.7 |
| 1,9-nonanediol | 258.7 | 217.7 | -41.0 | -39.6 | -1.4 | -41.5 |
| 1,10-decanediol | 279.6 | 238.0 | -41.6 | -42.7 | 1.1 | -44.9 |
| 1,11-undecanediol | 298.4 | 257.9 | -40.5 | -45.5 | 5.0 | -48.1 |
| 1,12-dodecanediol | 330.7 | 278.1 | -52.6 | -50.4 | -2.2 | -53.5 |
| 1,13-tridecanediol | 365.8 | 298.2 | -67.6 | -55.6 | -12.0 | -59.3 |
| 1,14-tetradecanediol | 380.4 | 318.4 | -62.0 | -57.8 | -4.2 | -61.8 |
| 1,15-pentadecanediol | 404.5 d | 338.5 | -66.0 | -61.4 | -4.6 | -65.8 |
| 1,16-hexadecanediol | 426.4 | 358.6 | -67.8 | -64.7 | -3.1 | -69.4 |
a Experimental and empirical data from Table S8, column 2. b DFT and empirical calculated results from Table S6. c Difference between columns 3 and 2 of this table. d Calculated according to the Equation (6) using experimental (cr) data from column 2 of this table. e Difference between columns 4 and 5 of this table. f Calculated according to Equation (14) derived from data given in columns 2 and 4 this table. The data in bold were used for further thermochemical calculations.
Table 6.
Calculation of the molar heat capacities differences, , for α,ω-alkanediols using the (liq) and (cr) validated in this work and comparison with the Chickos’s method (in J.K−1.mol−1 at T = 298.15 K).
Table 6.
Calculation of the molar heat capacities differences, , for α,ω-alkanediols using the (liq) and (cr) validated in this work and comparison with the Chickos’s method (in J.K−1.mol−1 at T = 298.15 K).
| Diol | a | b | c | d | e |
|---|---|---|---|---|---|
| 1 | 2 | 3 | 4 | 5 | |
| 1,6-hexanediol | 265.1 | 187.6 | -77.5 | -107.0 | 29.5 |
| 1,7-heptanediol | 296.0 | 211.7 | -84.3 | -118.6 | 34.3 |
| 1,8-octanediol | 326.8 | 235.8 | -91.0 | -130.3 | 39.3 |
| 1,9-nonanediol | 357.7 | 259.9 | -97.8 | -141.9 | 44.1 |
| 1,10-decanediol | 388.5 f | 284.0 | -104.5 | -153.5 | 49.0 |
| 1,11-undecanediol | 419.4 f | 308.1 | -111.3 | -165.2 | 53.9 |
| 1,12-dodecanediol | 450.2 f | 332.2 | -118.0 | -176.8 | 58.8 |
| 1,13-tridecanediol | 481.1 f | 356.3 | -124.8 | -188.5 | 63.7 |
| 1,14-tetradecanediol | 511.9 f | 380.4 | -131.5 | -200.1 | 68.6 |
| 1,15-pentadecanediol | 542.8 f | 404.5 | -138.3 | -211.7 | 73.4 |
| 1,16-hexadecanediol | 573.6 f | 428.6 | -145.0 | -223.4 | 78.4 |
a From Table S7, column 7. b From Table S8, column 4. c Difference between columns 3 and 2 of this table. The values in bold are recommended for thermochemical calculations in this work. d Calculated according to Equation (7). e Difference between columns 4 and 5 of this table. f Calculated according to Equation (9).
Table 7.
Compilation of standard molar enthalpies of vaporisation of long-chained α,ω-alkanediols (in kJ⋅mol-1) a.
Table 7.
Compilation of standard molar enthalpies of vaporisation of long-chained α,ω-alkanediols (in kJ⋅mol-1) a.
| Diol | Tav/K | /Tav | /298.15 Kb | Ref. |
|---|---|---|---|---|
| 1,6-hexanediol | 342 | 87.0±4.0 | 91.6±4.1 | [12] |
| 92.3±1.5 | Table S11 | |||
| 90.4±1.0 | Table 4 | |||
| 90.2±0.6 | [26] | |||
| 346.2 | 86.4±0.3 | 91.3±0.7 | Table S5 | |
| 417.2 | 74.0±1.3 | 89.5±3.4 | Table S14 | |
| 90.7±0.4 | average c | |||
| 90.8±0.3 | Table S15 | |||
| 90.9±2.0 | Equation (20) | |||
| 1,7-heptanediol | 323 | 93.8±1.0 | (96.8±1.2) | [20] |
| 341 | 92.4±3.0 | (97.5±3.2) | [13] | |
| (97.9±1.0) | [26] | |||
| 421.3 | 77.2±1.2 | 95.5±3.9 | Table S14 | |
| 95.9±0.6 | Table S15 | |||
| 94.9±2.0 | Equation (20) | |||
| 1,8-octanediol | 356 | 101.1±3.4 | (108.7±3.7) | [12] |
| (106.2±2.0) | Table S11 | |||
| 104.9±0.6 | [26] | |||
| 423.8 | 80.7±1.8 | 98.9±4.1 | Table S14 | |
| 98.7±0.2 | Table S15 | |||
| 98.8±2.0 | Equation (20) | |||
| 1,9-nonanediol | 360 | 104.4±6.8 | (113.3±7.0) | [13] |
| 323 | 110.0±2.0 | (113.6±2.1) | [20] | |
| (112.5±0.4) | [26] | |||
| ± | 102.5±5.2 | Table S14 | ||
| 102.7±0.2 | Table S15 | |||
| 102.8±2.0 | Equation (20) | |||
| 1,10-decanediol | 364 | 112.4±4.6 | (122.6±5.0) | [12] |
| (111.0±2.0) | Table S11 | |||
| 511 | 73.6±1.1 | 106.6±6.7 | [11] | |
| (120.0±0.6) | [26] | |||
| 453.9 | 76.8±2.1 | 106.2±6.2 | Table S14 | |
| 358.1 | 97.3±1.2 | 106.6±1.3 | Table S5 | |
| 106.6±1.3 | average c | |||
| 106.7±0.2 | Table S15 | |||
| 106.7±2.0 | Equation (20) | |||
| 1,11-undecanediol | 110.6±2.0 | Equation (20) | ||
| 1,12-dodecanediol | 114.6±2.0 | Equation (20) | ||
| 114.5±0.6 | Table S15 | |||
| 1,13-tridecanediol | 118.5±2.0 | Equation (20) | ||
| 1,14-tetradecanediol | 122.5±2.0 | Equation (20) | ||
| 122.3±1.2 | Table S15 | |||
| 1,15-pentadecanol | 126.4±2.0 | Equation (20) | ||
| 1,16-hexadecanol | 130.3±2.0 | Equation (20) | ||
| 129.4±2.5 | Table S15 |
a Uncertainties are presented as expanded uncertainties. The values in bold are recommended for thermochemical calculations. b Adjusted in this work using the -values from Table 2, column 7. c Weighted average (uncertainties are used as a weighting factor).
Table 8.
Adjustment of the experimental enthalpies of vaporisation, , of α,ω-alkanediols [12,13] from (Tav) to the reference temperature T = 298.15 K a.
| Diol | Tav | (Tav) | b | ×T | (298.15) c | (298.15)originald |
|---|---|---|---|---|---|---|
| K | kJ mol-1 | J.K-1.mol-1 | kJ mol-1 | kJ mol-1 | kJ mol-1 | |
| 1,11- | 365 | 123.0±3.8 | 167.2 | 5.6 | 128.6±4.0 | 131±6 |
| 1,12- | 379 | 119.4±5.4 | 179.2 | 6.7 | 126.1±5.6 | 132±8 |
| 1,13- | 372 | 122.0±7.6 | 191.2 | 6.2 | 128.2±7.7 | 132±8 |
| 1,14- | 386 | 128.1±5.8 | 203.2 | 7.3 | 135.4±6.0 | 141±8 |
| 1,15- | 390 | 124.3±3.8 | 215.2 | 7.7 | 132.0±4.1 | 138±6 |
| 1,16- | 398 | 130.5±3.6 | 227.2 | 8.3 | 138.8±4.0 | 146±6 |
Disclaimer/Publisher’s Note: The statements, opinions and data contained in all publications are solely those of the individual author(s) and contributor(s) and not of MDPI and/or the editor(s). MDPI and/or the editor(s) disclaim responsibility for any injury to people or property resulting from any ideas, methods, instructions or products referred to in the content. |
© 2025 by the authors. Licensee MDPI, Basel, Switzerland. This article is an open access article distributed under the terms and conditions of the Creative Commons Attribution (CC BY) license (http://creativecommons.org/licenses/by/4.0/).
Copyright: This open access article is published under a Creative Commons CC BY 4.0 license, which permit the free download, distribution, and reuse, provided that the author and preprint are cited in any reuse.


