Submitted:
18 April 2025
Posted:
18 April 2025
You are already at the latest version
Abstract
Multiple sclerosis (MS) is a chronic inflammatory and neurodegenerative disease. Repetitive demyelination defeats remyelination and impairs axonal conduction thus resulting in the characteristic disabilities of MS. Therefore, reducing demyelination and promoting remyelination are key strategies for the prevention and treatment of MS. In searching for new drugs to treat MS, many traditional Chinese herbs are gaining increasing attention. In the present study, baicalein (BA) was comprehensively investigated, by examining its effects on the cuprizone (CPZ)-induced neuropathological changes and behavioral abnormalities which are reminiscent of the clinical symptoms of MS patients, and exploring the cellular and molecular mechanisms underlying the effects. Our in vivo experiments demonstrated that BA facilitates the recovery of motor and cognitive impairment in CPZ-exposed mice while promoting the remyelination process and inhibiting neuroinflammation in their brains. Underlying these protective effects, BA intervention prevented the nuclear factor erythroid 2-related factor 2 (NRF2) and its downstream antioxidant enzymes (HO-1, NQO1, and SOD2) from over activation, thereby maintaining the signal pathway at normal levels through its antioxidant actions. Our in vitro experiments provided evidence that both CPZ and H2O2 delay the development of oligodendrocyte (OL) lineage cells by damaging mitochondria of the cells and resulting in oxidative stress. In the absence of astrocytes and microglia, BA effectively prevented cultured OLs from development delay by scavenging ROS resulted from damaged mitochondria of the cells. The elucidation of these cellular and molecular mechanisms will prompt clinical application of more naturally derived compounds with antioxidant properties to treat patients with MS.
Keywords:
baicalein
; cuprizone
; demyelination
; mitochondria
; oligodendrocytes
; remyelination
1. Introduction
Multiple sclerosis (MS) is a chronic inflammatory and neurodegenerative disease with primary neuropathological changes of demyelination, neuroinflammation, gliosis, and neurodegeneration in the central nervous system (CNS) [1]. MS patients may have diverse clinical manifestations including motor dysfunction and cognitive impairment such as reduced information processing speed, and impaired attention and long-term episodic memory [2]. Approximately 2.8 million people worldwide are affected by MS, with young adults aged 20 to 30 years being the most susceptible population [3]. Although the etiology of MS remains to be elucidated, it is believed that the pathogenesis of MS involves T-lymphocytes-mediated inflammation leading to the inflammation of gray and white matter, along with myelin sheath destruction and impaired remyelination [4,5], in which mitochondrial dysfunction and oxidative stress play important roles [6,7,8,9]. Related to the T-lymphocytes-mediated inflammation in MS, experimental autoimmune encephalomyelitis (EAE) is the most commonly used experimental model for MS. In consistent with the mitochondria hypothesis about MS, the dietary consumption of cuprizone (CPZ, a copper chelator known to induce demyelination in CNS of rodents) in mice has been widely used to model demyelination and remyelination in patients with MS [10,11].
Mitochondria are essential organelles for cellular life because they produce energy for all cellular activities. They are highly reactive to various cellular signals, including oxidative stress (OS), and play a crucial role in regulating apoptosis [12]. Mitochondrial dysfunction has been observed in both immune cells and oligodendrocytes (OLs) in MS patients [13]. In mice exposed to CPZ, mitochondria in OLs were most susceptible to the toxic effects of this chemical, as evidenced by accumulation of 8-OHdG (a marker of mitochondrial DNA damage) and cell loss, whereas astrocytes and microglia were activated, as evidenced by enlarged cell bodies and increased numbers, a sign of neuroinflammation [14,15]. These previous data indicate that neuroinflammation and OS are inextricably linked in the pathogenesis of MS. Indeed, glial and infiltrated immune cells are considered major producers of reactive oxygen species (ROS) and reactive nitrogen species (RNS) in pathological conditions of the CNS [16].
Since 1993, when the FDA approved IFN-β1b for the treatment of relapsing forms of MS [17], the number of approved MS therapies has continued to grow. Although these therapies have changed the management of the disease considerably, patients have to face increasing and sometimes even severe risks from side effects of the active disease-modifying therapies. For example, long-term follow-up of patients in a pivotal trial of intramuscular IFN-β1a revealed a poor prognosis for patients who exhibited active radiographic disease during the two years on the drug [18]. Natalizumab (Tysabri, a monoclonal antibody targeting the α4 integrin) showed impressive inhibitory effects on the inflammatory aspects of MS [19,20], with progressive multifocal leukoencephalopathy (PML) being the major side effect [21]. PML is caused by reactivation of the John Cunningham virus (JCV) in immunocompromised individuals. This leads to a debilitating encephalopathy that is often fatal [22]. The other second-era drug, fingolimod, was reported to suppress MS disease activity, with 55–60% lower relapse rates and an impressive reduction of MRI-visible activity [23,24,25,26], but it may leads to a side effect of lymphopenia associated with reactivation of varicella zoster virus (VCV) [27].
In the search for new drugs to treat MS, antioxidant compounds are gaining interest. A recent literature review summarized roles of naturally derived or combined derivatives of natural compounds, with well-known antioxidant potential, in MS progression modulation [28]. Evidence suggests that these natural compounds exert considerable role in MS pathogenesis by slowing down its progression or improving some of its clinical manifestations, such as fatigue, cognitive dysfunction and paralysis, along with substantial decreases in many oxidative and inflammatory markers. These previous studies encouraged further research on antioxidant compounds or naturally derived compounds, with multi-targeting and disease modulating potential, for the establishment of new treatment or co-treatment approaches in MS.
Baicalein (BA) is a flavonoid extract derived from the roots of the traditional Chinese medicine Scutellaria baicalensis, with anti-inflammatory, antioxidant, and neuroprotective effects. It has been shown to scavenge superoxide and hydroxyl radicals and alleviate mitochondrial dysfunction by activating the transcription factor nuclear factor erythroid 2-related factor 2 (NRF2) and mediating the production of the antioxidant enzyme Mn-SOD in previous studies [29]. In mice with EAE, BA significantly attenuated clinical severity of EAE and inhibited migration of autoimmune T cells into the CNS [30]. In CPZ-exposed mice, BA alleviated CPZ-induced demyelination, glial activation, pro-inflammatory cytokine expression, and motor dysfunction, suggesting that BA may be used as a useful therapeutic agent in demyelinating diseases such as MS [31].
Based on the previous studies, we hypothesized that BA might protect OLs against the toxic effects of CPZ on the development of the OL lineage cells by its antioxidant action thereby promoting the remyelination process in CPZ-exposed mice. To test this hypothesis, experiments with C57BL/6J mice and cultured OLs were done. In the animal experiments, we examined the effects of BA on remyelination and OL development in CPZ-exposed mice, evaluated its potential in promoting the recovery process of the mice from behavioral abnormalities induced by CPZ exposure, and explored the neurobiological mechanisms underlying its protective effects. In cultured OLs and OLN-93 cells, we demonstrated that BA blocks the inhibitory effects of CPZ and H2O2 on the development of OL lineage cells by protecting mitochondrial function of the cells.
2. Materials and Methods
2.1. Reagents and Chemicals
Cuprizone (purity > 99%) and D-biotin were purchased from Sigma (St. Louis, Missouri, USA). Anti-MBP, anti-MOG, anti-total OXPHOS Cocktail, anti-Olig2, anti-Olig4, anti-APC, and anti-IBA1 were purchased from Abcam (Cambridge, UK). Anti-GAPDH, anti-GFAP, anti-NAT8L, horseradish peroxidase-conjugated goat anti-rabbit and horseradish peroxidase-conjugated goat anti-mouse were purchased from Proteintech (Wuhan, China). B27 Plus, Goat anti-rabbit antibody Alexa Fluor 594 and goat anti-mouse antibody Alexa Fluor 488 were from Thermo Fisher (Waltham, Massachusetts, USA). ELISA kits for the assessment of IL-6, TNF-α, IL-10, TGF-β, NRF2, HO-1, NQO1, and SOD2 were from Keduo Di Biotechnology (Fujian, China). Fetal bovine serum (FBS), Dulbecco's Modified Eagle Medium (DMEM), DMEM/F-12, penicillin/streptomycin (P/S) solution and Accutase were purchased from Gibco (Carlsbad, California, USA). b-FGF and PDGF-AA were purchased from Peprotech (New Jersey, USA). Bovine serum albumin (BSA), Triton X-100, JC-1, CCK8, and ROS assay kits were from Beyotime Biotechnology (Shanghai, China). Sterile PBS buffer, sodium citrate repair solution, RIPA lysis buffer, corticosterone and triiodothyronine were purchased from Solarbio (Beijing, China). PVDF membrane was purchased from Millipore (Billerica, Massachusetts, USA). BCA protein assay kit and ECL exposure solution were purchased from NCM Biotech (Suzhou, China).
2.2. Animal Groups
C57BL/6J male mice used in this study were purchased from Zhejiang Viton Lihua laboratory Animal Technology Co., Ltd. on seven weeks old. The mice were maintained in the SPF-grade animal facility of the School of Mental Health, Wenzhou Medical University. They were group-housed (six mice per cage) with free access to water and food. The animal facility was well-ventilated, with a constant temperature (22 ± 1°C), in a humidity range of 50-60%, and a 12 h/12h light-dark cycle. All animal experimental procedures described in this study were following the guidelines on animal care and use of Wenzhou Medical University and approved by the Ethics Committee of Wenzhou Medical University.
After an adaptation period of 7 days, the mice were randomly assigned into each of the following five groups, 16-20 per group in two batches: Control group (CNT), in which mice were fed standard mouse chow for 6 weeks without any additional intervention; CPZ+S group, in which mice were fed standard mouse chow containing 0.2% (w/w) cuprizone for 4 weeks, followed by administration of sterile saline (0.9%, gavage feeding at 1.0 ml/100 g body weight) for 2 weeks; and the other three groups in which mice were given BA at 10, 20, or 40 mg/kg in the same volume (1.0 ml/100 g body weight) of sterile saline as that in CPZ+S group. These three groups were referred to as CPZ+BA10, CPZ+BA20, or CPZ+BA40, respectively. By referring to a previous animal study [32], we chose the above doses of BA in this study.
2.3. Behavioral Tests
Rotarod test: This is a classic test for evaluating motor coordination in rodents. Before the test, the starting speed of the rotarod device was set to 5 r/min, with a uniform accelerating speed from 5 r/min to 50 r/min within 6 min. When tested, a mouse was placed on the rotarod with his forepaws attached to the horizontal bar. The time from the start of the test until the first time the mouse fell off the rod or turned around on the rod was recorded. If a mouse did not slip or flip over for more than 5 min, the first flip latency was recorded as 5 min. The experiment was repeated two times for each mouse at an interval of 15 min, and the average value of the two latencies was finally used to evaluate the motor coordination ability of the mouse. After each experiment, the rotarod was wiped clean with 75% alcohol to eliminate the odor from a previous mouse.
Y-maze test: The Y-maze consisted of three identical arms radiating outward from the joint area at an identical angle of 120 degrees between two arms. All arms had the same dimensions of 30 cm (length), 8 cm (width), and 15 cm (height). Mice were acclimated to the behavioral laboratory environment for 1 day before the test. During the test, a mouse was placed at the end of an arm and allowed to freely explore the Y-maze for 8 minutes, during which period the mouse's movement trajectory on the maze was recorded by a camera above the maze. After a test, the interior walls of the maze were cleaned with 75% alcohol to eliminate the odor from the tested mouse. Mice with normal spatial memory are expected to visit the three arms in a non-repetitive order, such as ABC, BCA, CAB, and so on. The total number of arm entries was recorded, and the percentage of the actual number of correct arm entries to the theoretical number of correct arm entries (total number of arm entries minus 2) is referred to as the spontaneous alternation rate (expressed as percentage).
Novel object recognition (NOR) test: The protocol described here was modified from that by Ennaceur and Delacour [33]. The test was performed in a gray open-top cube empty box (with dimensions of 45 cm in length, width, and height) in three days. The apparatus was placed in a sound-isolated room.
The NOR procedure consisted of the habituation, training, and retention trials in three days. On the first day, mouse was individually habituated to the apparatus by exploring the test area in the absence of objects for 5 minutes. To avoid the presence of olfactory trails, the apparatus after each trial was thoroughly cleaned. On the second day, mouse was individually put back into the box and allowed to explore the same test area in the presence of two identical objects for 10 minutes (training trial). Exploration of an object was defined as directing the nose to the object at a distance of maximum 1 cm and/or touching it with the nose. The objects could not be displaced by a mouse as they were stuck to the wall of the open field. After a 2 hours rest period, the same mouse was subjected to another test (first retention trial) in which he explored two objects, a familiar one from previous objects and a novel one on the same area for 5 minutes. On the third day, each mouse was subjected to the second retention trial as the first retention trial (exploring a familiar object from previous objects and a novel one for 5 minutes). The order of objects used per subject per trial was determined randomly. All combinations and locations of objects were used in a balanced manner to reduce potential biases because of preferences for particular locations or objects.
The exploration time for the novel and familiar objects in the retention trials was recorded, and the recognition index (RI) was quantified as the preference for the novel object, with the formula: RI = (time exploring the novel object - time exploring the familiar object) / (time exploring the novel object + time exploring the familiar object).
2.4. Immunofluorescence Staining
For brain tissue immunofluorescence staining (IFS), the mouse was anesthetized with 1.25% tribromoethanol at a dose of 2.0 ml/100 g body weight. Under the deep anesthesia, the mouse was transcardially perfused with the phosphate buffered saline (PBS, pH = 7.4) until the liquid flowing out of the right atrial appendage was clear and the liver turned white. Then the whole brain of mouse was removed out of the skull and post-fixed in 4% paraformaldehyde (PFA) at 4℃ for 3 days and subsequently transferred into 30% sucrose solution at 4℃ for 48-72 hours. The brain samples were then cut into 30-µm-thickness cross-sections using a Leica cryostat (CM30505, Leica Microsystems, Wetzlar, Germany) for IFS. The procedures for IFS of the brain sections include: 1) brain sections were fixed in 4% PFA for 30 minutes, then placed in a 1 × sodium citrate solution at 95°C for 30 minutes; 2) after cooling to room temperature, the sections were incubated with a mixture of 5% BSA and 0.3% Triton X-100 for 60 minutes at room temperature; 3) one of primary antibodies (Rabbit anti-MBP, 1:1000; Mouse anti-Olig2, 1:500; Mouse anti-GFAP, 1:500; Rabbit anti-IBA-1, 1:1000) was applied and incubated overnight at 4°C in a humidified chamber; 4) After rinsing with PBS 3 × 5 minutes, a second antibody (Goat anti-mouse secondary antibody Alexa Fluor 488, 1:1000; Goat anti-rabbit secondary antibody Alexa Fluor 488, 1:1000; or Goat anti-rabbit secondary antibody Alexa Fluor 594, 1:1000) was applied and incubated for 60 minutes at room temperature; 5) the sections were mounted with a DAPI-containing mounting medium, dried, and observed under an inverted fluorescence microscope for imaging(LEICA DMI8, Wetzlar, Germany). The resulted images were analyzed using the Image J software (NIH, Bethesda, MD, USA).
The procedures of IFS for cultured oligodendrocyte linage cells include: 1) the slides with cultured cells (OLs) were rinsed with PBS 3 × 5 minutes; 2) 4% PFA was added onto the slides to fix the cells for 15 minutes, followed by PBS rinsing three times; 3) the slides with OLs were immersed in 0.3% Triton X-100 for 10 minutes × 3; 4) the slides were immersed in 5% BSA for 60 minutes; 5) the slides were incubated with a primary antibody (Mouse anti-Olig2, 1:200; Mouse anti-Olig4, 1:200; Rabbit anti-APC, 1:500) at 4 ºC overnight; 6) after rinsing with PBS 3 times, the slides were incubated with a secondary antibody specific to a primary antibody for 60 minutes at room temperature; 7) after rinsing with PBS 3 times, the slides were sealed with a sealing agent containing DAPI; 8) observed under an inverted fluorescence microscope for imaging (LEICA DMI8, Wetzlar, Germany). The resulted images were analyzed using the Image J software.
2.5. Western Blot Analysis
Tissue samples from the prefrontal cortex (PFC) and hippocampus (HIP) of mice were weighed and lysed with RIPA lysis buffer (1.0 mg in 1.0 mL), homogenized at 4°C, and centrifuged at 12,000 rpm for 15 minutes. The supernatant was collected, and protein concentration was measured. Equal amounts of protein (20 μg) were loaded onto each well of the 4% stacking gel and run onto the 10% SDS-polyacrylamide gel. Then the proteins were transferred from the separating gel to a PVDF membrane. The membrane was blocked with 5% skim milk for 1.5 hours and incubated with a primary antibody overnight at 4°C. The primary antibodies used for the Western blot experiments include rabbit anti-MBP (1:1000), rabbit anti-MOG (1:1000), mouse anti-total OXPHOS cocktail (1:250), mouse anti-GFAP (1:500), and rabbit anti-NAT8L (1:2000), with the mouse anti-GAPDH (1:10000) as the internal control. After rinsing the PVDF membrane with 1 × TBST (3 × 10 minutes), the membrane was incubated with a secondary antibody of horseradish peroxidase-conjugated goat anti-rabbit (1:10000) or horseradish peroxidase-conjugated goat anti-mouse (1:10000) for 1 hour at room temperature. Finally, the membrane was developed using ECL exposure solution in a gel imaging system (VILBER, Paris, France), and the bands were quantified using ImageJ software.
2.6. Enzyme-Linked Immunosorbent Assay (ELISA) of Cytokines
Tissue samples from the PFC and HIP of mice were weighed and homogenized in PBS (100 mg tissue added into 900 µL PBS). The homogenate was centrifuged at 3,000 rpm, 4℃, for 20 minutes and the supernatant was collected. 50 µL of the prepared samples and standards were added to each well of an ELISA plate, followed by the addition of 50 µL biotinylated antigen working solution and incubated at 37°C for 30 minutes. After spilled out the solutions, all wells were rinsed 5 times with PBS, then 50 µL of streptavidin-HRP working solution was added into each well and incubated at 37°C for 30 minutes. After rinsing wells with PBS again, color development solutions A and B (50 µL each) were added into each well and incubated at 37°C for 10 minutes. The reaction was stopped by adding 50 µL of stop solution, and the OD value was read out within 10 minutes at 450 nm using an ELISA microplate reader (TECAN Infinite M200 Pro, Switzerland). Protein levels of the inflammatory cytokines including IL-6, TNF-α, IL-10, and TGF-β were calculated using ELISA calc with a logistic curve (four-parameter) model.
2.7. Cell Culture of Primary Oligodendrocytes and Drug Treatments
Referring to a previous study [34], brain cells in cerebral cortex of newborn SD rats (0-2 days old) were extracted and seeded at a density of 1 × 10^6/cm² onto poly-D-lysine-coated T75 culture flasks and incubated at 37°C in a CO2 incubator. The medium was changed every 3 days until day 9 in vitro (DIV9). The T75 flasks were placed on a shaker at 150 rpm for 60 minutes to separate microglial cells. Subsequently, the flasks were shaken continuously at 250 rpm for 15-20 hours to separate oligodendrocyte precursor cells (OPCs) from astrocytes. The medium was then transferred to culture dishes and allowed to settle for 60 minutes to remove adherent astrocytes and microglia. Then the medium was centrifuged at 1,800 rpm for 6 minutes, and the pellets were resuspended and seeded onto cell culture inserts or slides at an appropriate density. After culturing in proliferation medium (DMEM supplemented with 2% B27 Plus, 0.5% FBS, 1% P/S, 0.1% PDGF-AA, and 0.1% b-FGF) for 2 days, the cells were switched to differentiation medium (DMEM/F12 was supplemented with 0.5% FBS, 1% P/S, 1% nitrogen, 10 nM Corticosterone, 10 nM D-biotin, and 30 nM triiodothyronine) for further culturing.
In this experiment, OPCs were exposed to 0.5 mM CPZ for 24 hours starting from DIV11. Differentiated OLs were exposed to CPZ for 24 hours starting from DIV13. Immature OLs were exposed to CPZ for 24 hours starting from DIV15.
2.8. Cell Culture of OLN-93 Cell Line
OLN-93, a rat OPC cell line, was obtained from BeNa Culture Collection (Hebei, China). The cells were cultured in DMEM (supplemented with 10% FBS, 1% P/S) at 37 ℃ in a humidified atmosphere containing 95% air and 5% CO2. Cells at 80–90% confluence were selected for subculture and subsequent experimentation.
2.9. CCK-8 Assay
WST-8 (Cell Counting Kit 8; CCK-8) has been accepted as a validated method for measuring the viability of cultured cells. It can be reduced by dehydrogenases in the mitochondria to produce an orange-yellow formazan in the presence of an electron coupling reagent. The color intensity is proportional to cell viability. In our experiment, extracted OL linage cells were cultured in 96-well plates until approximately 80% of the well area is covered by the cells. Then various concentrations of CPZ (0, 0.025, 0.05, 0.1, 0.5, 1.0, 2.0 mM) were added into the culture medium of primary OLs on DIV11-12, or various concentrations of H2O2 (0.2, 0.4, 0.8, or 1.6 mM) were added into the culture medium of OLN-93 cells when the cell density reaches 80% - 90%. Both the culture conditions maintained for 24 hours. Then the culture medium was removed, and the cells were washed once with PBS, followed by the addition of 100 µL fresh medium and 10 µL CCK-8 solution into each well. Furthermore, the plate was incubated in a CO2 incubator for additional 2 hours before absorbance measurement at 450 nm on the same microplate reader as mentioned above. Each group was prepared in 6 wells at least 3 independent experiments. The relative cell viability was expressed as a percentage of the control cells that were treated neither with CPZ nor with H2O2.
2.10. Assessment of Mitochondrial Membrane Potential
During the early stage of differentiation (DIV13-DIV14), primary OPCs were treated with CPZ (0, 0.5 mM) and BA (0, 20 μM) for 24 hours, then the culture medium was removed from the confocal culture dishes, and the cells were washed once with PBS and then stained by a mixture solution consisting of equal volume (each of 1.0 mL) of culture medium and JC-1 staining working solution at 37°C for 20 minutes. After incubation, the supernatant was removed, and the cells were washed twice with JC-1 staining buffer. Then 2.0 mL of culture medium was added, and the cells were observed under a laser confocal microscope (LEICA DMI8, Wetzlar, Germany). The relative degrees of mitochondrial polarization were quantified by measuring the red-shifted JC-1 at 535 nm (Ex) and 590 (Em) and green shifted JC-1 at 515 nm (Ex) and 529 nm (Em).
2.11. Detection of ROS
Intracellular ROS can oxidize non-fluorescent DCFH to fluorescent DCF, allowing the detection of ROS levels based on fluorescence intensity. In brief, when the cell density reaches 80% - 90%, the OLN-93 cells were treated with H2O2 (0, 400 μM) and BA (0, 40 μM) for 24 hours. Then the original culture medium was removed, followed by the addition of diluted DCFH-DA (10 µM/L) into the cell-containing wells. After incubated at 37°C for 20 minutes, the cultures were rinsed three times with serum-free culture medium. Finally, the ROS levels were detected using a fluorescence microplate reader (LEICA DMI8, Wetzlar, Germany).
2.12. Statistical Analysis
SPSS 25 was used to analyze the data. Data conforming to a normal distribution were expressed as mean ± standard error of the mean (Mean ± SEM). Levene's test was used to assess homogeneity of variance. For data in multiple groups, one-way ANOVA or repeated-measures ANOVA was used to evaluate the effects of experimental treatments, followed by LSD multiple comparisons for group-wise comparisons. For comparisons between two groups, t-tests were used, with p < 0.05 indicating statistical significance. GraphPad Prism 9 was used for graphing. Each experiment was repeated at least three times.
3. Results
3.1. Baicalein Improved Motor and Cognitive Impairment in Cuprizone-Exposed Mice
In the rotarod test, the mice in the five groups performed differently in terms of the first flip latency (Figure 1A). One-way ANOVA of the results indicated a significant main effect of grouping (F = 12.27,p<0.01). Post-hoc tests reported a significant difference between CNT and CPZ+S groups in the first flip latency (p<0.01). The differences also existed between CNT and CPZ+BA10/BA20 groups, but not between CNT and CPZ+BA40 groups. Moreover, the CPZ+BA40 group showed a significantly longer first flip latency relative to the CPZ+S group (p<0.05).
In the Y-maze test, the mice in the five groups also performed differently (Figure 1B,C). One-way ANOVA of the spontaneous alternation revealed a significant main effect of grouping (F = 9.295,p<0.01). Post-hoc tests reported that the spontaneous alternation in the CPZ + S group was significantly lower than that in the CNT group (p<0.01), but no significant difference existed between CNT and any of CPZ+BA groups. Moreover, CPZ+BA40 group exhibited a significant higher spontaneous alternation compared to the CPZ+S group (p<0.01). Interestingly, one-way ANOVA of the arm entries data showed no significant effect of grouping (Figure 1C).
In the novel object recognition test, mice in all five groups performed differently in terms of RI in the two retention trials. For the first retention trial (done 2 hours after the training trial), one-way ANOVA revealed a significant effect of grouping on RI (F = 3.244, p<0.05). Post-hoc tests reported a significant lower RI in the CPZ+S group compared to the CNT group (p<0.05). It was also significantly lower than that in the CPZ+BA40 group (p<0.05). But there was no difference between any other two groups (Figure 1D). Same results were also found in the second retention trial, i.e., the main effect of grouping is significant on RI (F = 3.754, p<0.05), significant differences existed between CNT and CPZ+S groups, between CPZ+S and CPZ+BA40 groups (Figure 1E).
3.2. Baicalein Promoted Remyelination following CPZ-induced Demyelination in Mice
Figure 2A shows representative MBP IFS images taken at cerebral cortex of the mice from the three groups of CNT, CPZ+S, and CPZ+BA40. Close observation of these images at a higher magnification tells obvious differences in terms of MBP immunostaining in the mice. Consistent with this visual observation, grouping showed a significant effect on the MFI of MBP (F = 5.444, p < 0.05). Post-hoc comparisons reported that CPZ+S had a significant lower MFI of MBP relative to CNT group (p<0.05) or CPZ+BA40 group (p<0.05), there was no difference between CNT and CPZ+BA40 groups (p = ns) (Figure 2A). These results suggest that administration of BA at 40 mg/kg promoted the remyelination process in brains of mice following the CPZ-induced demyelination.
To provide further evidence for the above inference, we measured the MFI of oligodendrocyte transcription factor 2 (Olig2) IFS in the brains of mice from the same three groups. Figure 2B shows representative Olig2 IFS images taken at the corpus callosum (CC). Close observation of these images at a higher magnification tells obvious difference in Olig2 immunostaining in CC. Consistent with this visual observation, quantitative data of Olig2 MFI reported a significant effect of grouping (F = 5.075, p < 0.05). Post-hoc comparisons showed a significant difference between CPZ+S and CNT groups (p<0.05), but there was no difference between CNT and CPZ+BA40 groups (p = ns) (Figure 2B). These data indicate that administration of BA at 40 mg/kg facilitated the development of OL lineage cells in brains of mice following CPZ-induced demyelination given that Olig2 is expressed in all OL lineage cells.
Further evidence came from the Western blot analysis of MBP and myelin oligodendrocyte glycoprotein (MOG) in HIP and PFC of mice from all five animal groups. Figure 2C presents the representative Western blot images of MBP and MOG (GADPH as the internal control), plus the quantitative data of the two proteins in HIP. One-way ANOVA revealed a significant effect of grouping on MBP (F = 4.006,p<0.05) and MOG (F = 3.830,p<0.05) expression levels. Post-hoc comparisons reported significant lower levels of MBP and MOG in the CPZ+S group relative to the CNT group (p<0.05 in both comparisons) and to the CPZ+BA40 group (p<0.05 in both comparisons). There was no significant difference between CNT group and any of BA-treated groups. Similar changes were also seen in the expression levels of MBP and MOG in PFC of the mice, i.e., there was a significant effect of grouping on MBP (F = 3.428,p<0.05) and MOG (F = 2.863,p<0.05) expression levels. MBP and MOG levels in the CPZ+S group were significantly lower compared to the CNT group (p<0.05 in both comparisons) and CPZ+BA40 group (p<0.05 in both comparisons). There was no significant difference between CNT group and any of BA-treated groups (Figure 2D).
3.3. Baicalein Suppressed Neuroinflammation in Cuprizone-Exposed Mice
We performed IFS on brain sections of mice in the three groups of CNT, CPZ+S, and CPZ+BA40 with the antibodies specific to GFAP and IBA1. Figure 3A shows the representative images of the GFAP+ cells in HIP of the mice in these three groups. The GFAP+ cells in the CPZ+S image seem to be more densely packed than those in the other two images from CNT and CPZ+BA40 groups, respectively. One-way ANOVA revealed a significant effect of grouping on the density of GFAP+ cells in the CA3 region of HIP. Post-hoc multiple comparisons reported that the number of GFAP+ cells in the CA3 region of the CPZ+S group was significantly higher compared to those in the CNT group (p<0.05) and those in the CPZ+BA40 group (p<0.01). Similar changes were also found in IBA1+ cells. The IBA1+ cells in the CPZ+S image seem to be more densely packed than those in the other two images from CNT and CPZ+BA40 groups, respectively (Figure 3B). One-way ANOVA revealed a significant effect of grouping on the density of IBA1+ cells in the CA3 region of HIP. Post-hoc comparisons reported that the number of IBA1+ cells in the CA3 region of the CPZ+S group was significantly higher compared to those in the CNT group (p<0.05) and those in the CPZ+BA40 group (p<0.05) (Figure 3B).
To provide further evidence for the aforementioned IFS findings, we assessed the expression levels of GFAP protein in the HIP and PFC of mice from all five groups (n = 6/group) by means of Western blot method. Figure 3C shows representative Western blot images of GFAP protein expressed in HIP and PFC, plus the statistical analysis results of the Western blot data. One-way ANOVA revealed a significant effect of grouping on GFAP expression levels in HIP (F = 2.972, P<0.05). Post-hoc tests reported that the GFAP expression level in the CPZ+S group was significantly higher than that in the CNT group. There was no significant difference between any other two groups. For GFAP expression level in PFC, one-way ANOVA showed no significant effect of grouping on this measurement (F = 1.540, p = 0.235).
The proliferation and activation of microglia and/or astrocytes are always accompanied with changes in levels of inflammatory cytokines in the brain. Therefore, we quantitatively assessed the protein levels of pro-inflammatory cytokines (IL-6, TNF-α) and anti-inflammatory cytokines (IL-10, TGF-β) in the PFC and HIP regions of mice from each of the five animal groups. The results are presented in Figure 4. In PFC, one-way ANOVA showed significant effects of grouping on IL-6 (F =10.170, p<0.01) and TNF-α (F = 12.840, P<0.01) levels. Post-hoc tests reported that IL-6 and TNF-α levels in the CPZ+S group were significantly higher than those in the CNT group (p<0.01 in both comparisons). The levels of these two cytokines were also significantly higher relative to those in CPZ+BA40 group (p<0.01 in both comparisons). There was no difference between any other two groups in levels of these two inflammatory cytokines. As for IL-10 in PFC, one-way ANOVA showed a significant effect of grouping on this measure (F =5.917, p<0.01). Post-hoc tests reported that IL-10 level in the CPZ+S group was significantly lower than that in the CNT group (p<0.01). There was no difference between any other two groups in this index. Also, one-way ANOVA showed a significant effect of grouping on TGF-β level (F =8.764, p<0.01) in PFC. Post-hoc tests reported that TGF-β level in the CPZ+S group was significantly higher than those in the CNT and CPZ+BA40 groups (p<0.01 in both comparisons). There was no difference between any other two groups in this measure (Figure 4A).
Similar changes in these inflammatory cytokines happened in the HIP region. One-way ANOVA showed significant effects of grouping on IL-6 (F =17.370, p<0.01) and TNF-α (F = 11.070, P<0.01) levels. Post-hoc tests reported that IL-6 and TNF-α levels in the CPZ+S group were significantly higher than those in the CNT group (p<0.01 in both comparisons). The levels of these two cytokines were also significantly higher relative to those in CPZ+BA40 group (p<0.01 in both comparisons). There was no difference between any other two groups in levels of these two inflammatory cytokines. As for IL-10 in HIP, one-way ANOVA showed a significant effect of grouping on this measure (F = 20.750, p<0.01). Post-hoc tests reported that IL-10 level in the CPZ+S group was significantly lower than those in the CNT and CPZ+BA40 groups (p<0.01 in both comparisons). There was no difference between any other two groups in this index. Also, one-way ANOVA showed a significant effect of grouping on TGF-β level (F = 9.655, p<0.01) in HIP. Post-hoc tests reported that TGF-β level in CNT group was the highest among the five groups. There was no difference among the other four groups in this measure (Figure 4B).
3.4. Baicalein Improved Mitochondrial Dysfunction in CPZ-Exposed Mice
Previous studies have shown that CPZ impairs mitochondrial function of neural cells thereby causing demyelination in CNS of mice [14,35]. We expected that baicalein might protect brain cells against the toxic effects of CPZ on mitochondrial function in mice. To test this hypothesis, we assessed mitochondrial function of neural cells in HIP of all mice in this study by means of Western blotting. Figure 5A shows representative Western blot images of mitochondrial respiratory chain complexes CII-CV of neural cells of mice from each group (CI was not shown). The quantitative data of all images were presented in Figure 5A (right). One-way ANOVA revealed significant effects of grouping on protein levels of CIV (F = 5.461, p<0.05) and CV (F = 4.190, p<0.05). The grouping effect was at a marginal level on CII (p = 0.058). Post-hoc comparisons reported that CII level in CPZ S group was significantly lower compared to the CNT group, there was no difference between CNT and CPZ+BA40 groups (p = ns). The CIV and CV levels in CPZ+S group were significantly lower than those in CNT and CPZ+BA40 groups (p<0.05 in both comparisons).
Furthermore, we assessed the protein levels of NAT8L (aspartate N-acetyltrasferase) in HIP and PFC of mice in four groups (CPZ+BA10 was not included). NAT8L is a mitochondrial protein that catalyzes the synthesis of N-acetylaspartate (NAA) from aspartate and acetyl-CoA in mitochondria of neuron. The representative Western blot images of NAT8L in HIP and PFC of mice were presented on the upper and lower rows of the left panel of Figure 5B, respectively, while the statistical analysis of the protein levels in the two brain regions of mice was shown in the right panel of this figure. One-way ANOVA revealed a significant effect of grouping on NAT8L levels in HIP (F = 4.956, p<0.05), but not on that in PFC (F = 0.38, p = ns). Post-hoc comparisons reported that NAT8L level in HIP of mice from the CPZ+S group was significantly lower than those in the CNT and CPZ+BA40 groups (p<0.05 in both comparisons).
3.5. Baicalein Regulated the NRF2 Redox Pathway in CPZ-Exposed Mice
Oxidative stress and mitochondrial dysfunction in MS [36] are partly attributed to the imbalance of the NRF2 signaling pathway, which regulates redox homeostasis and mitochondrial function and plays a crucial role in modulating neuroinflammation [37,38,39,40]. To explore the mechanism underlying the beneficial effects of BA on remyelination following CPZ-induced demyelination in mice, we measured the expression levels of NRF2 and its downstream targets (HO-1, NQO1, and SOD2) in the HIP of mice by means of ELISA. The results are presented in Figure 6. One-way ANOVA revealed a significant effect of grouping on NRF2 levels (F = 17.080, p<0.01). Post-hoc comparisons reported that NRF2 level in CPZ+S group was significantly higher than those in CNT and CPZ+BA40 groups (p<0.01 in both comparisons) (Figure 6A). The same changes are also seen in levels of HO-1, SOD2, and NQO1. That is, levels of these downstream molecules of the NRF2 signaling pathway in CPZ+S group are significantly higher than those in CNT and CPZ+BA40 groups (Figure 6B–D, respectively).
3.6. Baicalein Protected Against the Inhibitory Effects of CPZ on the Development of Cultured OL Lineage Cells
To provide further evidence that BA protects against inhibitory effects of CPZ on the development of OL lineage cells, we did in vitro experiments with cultured OLs. During the OPC proliferation phase (DIV11-12), we treated the cells with various concentrations of CPZ (0, 0.025, 0.05, 0.1, 0.5, 1.0, 2.0 mM) for 24 hours and measured OPCs viability using the CCK8 assay kit. The quantitative results are shown in Figure 7A. One-way ANOVA revealed a significant main effect of CPZ on OPCs viability (F = 18.730, p<0.01). Post-hoc comparisons reported that CPZ dose-dependently reduced OPCs viability as compared to the CNT group. Based on these results, 0.5 mM CPZ and 20 µM BA were chosen to examine possible protective effect of BA on the inhibitory effect of CPZ on OPC proliferation and cell viability. The cells (on DIV11-12) were cultured in three different conditions, i.e., in the absence of CPZ and BA (CNT), in the presence of CPZ (0.5 mM), and in the presence of BA (20 µM) and CPZ (0.5 mM). The results showed a significant main effect of treatment on cell viability (F = 13.270, p<0.01). Post-hoc comparisons reported that CPZ-treated cells had significantly lower viability than the CNT (p<0.01) and CPZ+BA (p<0.05) groups (Figure 7B). In line with the CCK8 assay results, IFS of the cultured cells showed that CPZ group have fewer Olig2+ cells relative to the other two groups (see the images on the first row of Figure 7C). And there were many more DAPI-stained nuclei that were smaller (on the second row of Figure 7C) and not overlapped with green-stained cell body and processes (third row of Figure 7C), indicative of condensed nuclei of the dying cells. These results suggest that BA attenuates the inhibitory effects of CPZ on OPCs proliferation and activity.
With the same treatments, another batch of cell cultures started on DIV13 and lasted for 24 hours. Then the cultured cells were subjected to IFS with the antibody against Olig4+ (a biomarker of immature OLs) or APC+ (a biomarker of mature OLs). As shown in Figure 7D, some of the DAPI-stained nuclei on the second row look smaller relative to the others on the first and third rows. In the fourth column with cell images from the superposition of Olig4+ and APC+, some cell profiles appear pure green in the CPZ (0.5 mM) group, indicating that these immature OLs did not develop to mature ones in the presence of CPZ. This phenomenon was not seen in CNT and CPZ+BA20 groups, indicating that BA attenuated the inhibitory effects of CPZ on the maturation of immature OLs.
3.7. Baicalein Protected Cultured OLs and OLN-93 Cells against the Toxic Effects of CPZ on Mitochondria of the Cells
In the absence of the other glia cells (astrocytes and microglia), that BA attenuated the inhibitory effects of CPZ on the development of cultured OL lineage cells must be due to the protective effects of this drug on mitochondria of the cultured OLs, instead of the involvement of inflammatory factors. To test this inference, we evaluated the mitochondrial membrane potential of OLs cultured under various conditions [in the absence of CPZ and BA, in the presence of CPZ (0.5 mM), or in the presence of CPZ (0.5 mM) + BA (20 µM)]. The culture lasted for 24 hours followed by the assessment of mitochondrial membrane potential of the cultured OLs on DIV13 using the JC-1 kit. As shown in Figure 8A, the CPZ-treated cells appear lighter red fluorescence, but darker green fluorescence, relative to those in the CNT and CPZ+BA groups, indicating the presence of mitochondrial membrane damage in the CPZ-treated cells, which was blocked by BA at the concentration of 20 µM.
To provide further evidence for the mitochondria protection of BA, we did another experiment with the OLN-93 cell line (an immortalized OL cell line) treated with various concentrations of H2O2 (0, 0.2, 0.4, 0.8, 1.6 mM) for 24 hours, followed by cell viability assessment by means of the CCK8 assay. The quantitative results are presented in Figure 8B. One-way ANOVA revealed a significant main effect of H2O2 concentration on OLN-93 viability (% of CNT). Compared to the CNT group, H2O2 dose-dependently reduced cell viability of OLN-93. Based on these results, the OLN-93 cell line were cultured in another experiment in the presence of 400 µM H2O2, 400 µM H2O2 plus 40 µM BA, or in the absence of H2O2 and BA (Control). The culture maintained for 24 hours. Then cell viability and ROS levels in the cultures were measured. As shown in Figure 8C, the main effect of treatment on cell viability was significant (F = 7.456, p<0.05). Post-hoc comparisons reported a significant difference between CNT and H2O2 (400 µM) groups. As for ROS levels, OLN-93 cells treated with H2O2 (400 µM) showed strongest green fluorescence relative to those in the other two groups (Figure 8D). These differences were confirmed by the quantitative analysis of the fluorescence intensity of cultured cells in the three groups (Figure 8E). One-way ANOVA revealed a significant effect of grouping on integrated density of the fluorescence staining of cultured cells (F = 11.510, p<0.01). Post-hoc comparisons reported the highest level of fluorescence intensity in the H2O2 group relative to the CNT (p<0.05) and the 400 µM H2O2+40 µM BA (p<0.05) groups.
4. Discussion
The pathogenesis of MS is characterized by demyelination, OLs apoptosis, and glial cell activation, ultimately leading to failed remyelination [41,42]. Demyelination impairs axonal conduction, resulting in the characteristic disabilities of MS [43]. Therefore, reducing demyelination and promoting remyelination are key strategies for the treatment of MS [44]. In searching for new drugs to treat MS, many traditional Chinese herbs are increasingly being studied as complementary and alternative interventions. In the present study, BA was comprehensively investigated regarding its effects on CPZ-induced neuropathological changes and behavioral abnormalities in the CPZ-exposed mice because of its anti-inflammatory, antioxidant, and cognitive-enhancing properties [45,46,47]. The strong antioxidant properties of BA are partly attributed to the three hydroxyl groups (at positions 5, 6, and 7) in its structure, which enable the compound to scavenge ROS through oxidation of these groups [48]. Additionally, BA can form stable semiquinone radicals, which underpin its potent antioxidant activity [49].
Consistent with previous studies from our group and the others [50,51,52], the CPZ-exposed mice in the present study exhibited demyelination in cerebral cortex, HIP, and CC. These mice also showed significantly shorter first flip latency in the rotarod test, lower spontaneous alternation rates in the Y-maze test, and decreased RI in retention trials of the NOR test. These behavioral abnormalities in CPZ-exposed mice suggest the presence of motor coordination and cognitive impairments due to CPZ-exposure, which are reminiscent of the clinical manifestations seen in MS patients as mentioned above. Importantly, BA administration for two weeks following four-weeks CPZ-exposure significantly improved the above mentioned brain function abnormalities while facilitated remyelination process as evidenced by increased MBP and Olig2 IFS along with elevated levels of MBP and MOG in the PFC and HIP of CPZ-exposed mice. Taken together, it is plausible to conclude that BA promoted remyelination in the brain of CPZ-exposed mouse thereby improving motor and cognitive deficits in the animals. This conclusion is in line with the commonly accepted notion that it is demyelination in both white and gray matter in the brain that lead to motor dysfunction and cognitive impairments such as attention deficits and long-term memory loss [53,54,55,56,57].
MS patients exhibit pathological features of inflammatory infiltration and glial cell proliferation. Relevantly, the CPZ-induced mice present astrocyte and microglial proliferation and activation, along with increased levels of inflammatory cytokines such as TNF-α and IL-1β. These inflammatory factors act synergistically and impair mitochondrial function of OLs and increase ROS levels as shown in previous studies [10,58,59]. ROS, in turn, damage mitochondria by blocking complexes in the respiratory chain, leading to OLs apoptosis and ultimately demyelination [60,61,62]. In consistent with these previous studies, the present study found that CPZ-exposed mice had significantly increased numbers of GFAP+ and IBA1+ cells in the cerebral cortex and HIP, along with elevated GFAP in HIP, suggesting the presence of neuroinflammation in brain tissue of the CPZ-exposed mice. Further supporting evidence for this inference, the CPZ-exposed mice in this study showed higher levels of pro-inflammatory cytokines TNF-α and IL-6, but significantly lower levels of anti-inflammatory cytokines IL-10 and TGF-β. However, BA given at 40 mg/kg/day for 2 weeks following CPZ-exposure for 4 weeks alleviated the CPZ-induced neuroinflammation, while promoting the remyelination process as discussed above. The concurrent antiinflammation and promyelinating effects of BA (40 mg/kg/gay for 2 weeks) added further evidence for the application of antiinflammation drugs in patients with MS. It also highlights the complex interplay between inflammation and demyelination in CNS [63,64,65].
The initial effect of CPZ on brain cells is toxicity to the mitochondria of cells. Therefore, we examined possible effects of BA on mitochondria of brain cells in CPZ-exposed mice. We found that protein levels of mitochondrial respiratory complexes II, IV, and V (ATP synthase) were significantly lower in the HIP of CPZ-treated mice, along with decreased levels of NAT8L, a marker of neuronal mitochondrial function, indicating the damaging effect of CPZ on mitochondria. Moreover, BA40 effectively reversed these mitochondria function impairments induced by CPZ-exposure. Further evidence for the damaging effects of CPZ on mitochondrial function of brain cells came from the analysis of the NRF2 pathway, which is a crucial defense mechanism of the cellular response to oxidative stress and mitochondrial dysfunction. The CPZ exposure significantly elevated levels of NRF2 and its down-stream antioxidant enzymes of HO-1, NQO1, and SOD2, confirming the up-regulation of this pathway in response to the oxidative stress induced by CPZ exposure. More importantly, BA intervention restored the up-regulation of these pathway proteins to normal levels in a dose-dependent manner, suggesting that BA protects the NRF2 pathway from over activation, maintaining it at normal levels through its antioxidant effects. Certainly, these findings have broad relevance to clinical research advances in MS pathogenesis and treatment. For example, MS patients exhibited mitochondrial dysfunction and impaired mitochondrial respiratory chain complexes, leading to axonal degeneration and demyelination [66,67,68,69]. Abnormally activated NRF2 pathway was also reported in MS patients [29,70,71,72]. Moreover, the therapeutic effects of the clinical MS drug dimethyl fumarate are believed to be related to this pathway [73,74].
To provide further evidence for the toxic effects of CPZ on the survival and development of OL lineage cells and the protective effects of BA on these cells, we did in vitro experiments with OL lineage cells and OLN-93 cell line. It was found that CPZ dose-dependently decreased the viability of cultured OLs during the OPC proliferation phase (DIV11-12), but this toxic effect was not seen in cultured cells in the presence of BA (20 µM) and CPZ (0.5 mM). These data added evidence for the protective effect of BA on OPCs survival and growing in the in vitro microenvironment lacking microglia and astrocytes. Going further, we found that CPZ (0.5 mM) suppressed the development of Olig4+ cells into more mature APC+ cells. And these inhibitory effects were effectively blocked in the CPZ+BA group. In later stages of OL development, CPZ-exposure inhibited the maturation of OLs as some cells stayed at the immature stage (Olig4+ cells), but these immature OLs were not seen in the CNT and CPZ+BA groups. Taken together, CPZ suppressed the development of cultured OL lineage cells in the inflammation-free environment, but BA prevented the cultured OL lineage cells from this inhibition of CPZ.
Last but not least, JC-1 assays revealed that mitochondrial membrane potential of cultured OLs was significantly lower in the CPZ-treated cells compared to the CNT group, but BA (20 µM) blocked this effect. These data added direct evidence that both CPZ and BA impact on mitochondria of cultured OLs in damaging and protecting manners, respectively. Further evidence for the protective effect of BA on mitochondria of cultured OLs came from the experiment with OLN-93 cells treated with various concentrations of H2O2 in the absence or presence of BA. CCK8 assays reported that H2O2 dose-dependently reduced the viability of OLN-93 cells, but BA (40 µM) completely blocked this effect. The H2O2 (400 µM) treatment significantly increased ROS level in the culture medium, but this effect was completely blocked in OLN-93 cells treated H2O2 and BA (40 µM). Consistent with our results, the H2O2-induced oxidative stress was reported in a recent study with cultured OLN-93 cells [75]. BA has been shown to scavenge free radicals and reduce ROS production in various cell types [49,76], protect the cells against oxidative damage [77,78,79]. Taken together, by its antioxidant action, BA protects cultured OLs and OLN-93 cells against the toxic effects of CPZ and H2O2 on mitochondria of these cells.
5. Conclusions
In conclusion, our in vivo experiments demonstrated that BA facilitates the recovery of motor and cognitive impairments in CPZ-exposed mice while promoting the remyelination process and inhibiting neuroinflammation in their brains. Underlying these protective effects, BA intervention prevents the NRF2 pathway from over activation, thereby maintaining the signal pathway at relatively normal levels through its antioxidant effects. Our in vitro experiments provide evidence that both CPZ and H2O2 delay the development of OL lineage cells by damaging mitochondria of the cells and resulting in oxidative stress. In the absence of astrocytes and microglia, BA effectively prevents cultured OLs from development delay by scavenging ROS resulted from damaged mitochondria of the cells. The elucidation of these cellular and molecular mechanisms will prompt clinical application of many more naturally derived compounds with antioxidant properties to treat patients with MS.
Institutional Review Board Statement:All experimental protocols involving animals in this study received approval by the Animal Welfare Ethics Committee of Wenzhou Medical University (Number: wydw2025-0209) and were carried out according to the institutional and ARRIVE guidelines.
Author Contributions
Q.W. (Qin Wang) and H.X. conceived the proposal and designed the experiments; Q. W. (Qin Wang), Z.W., Y. L., Y. C., and B. X. carried out the experiments and analyzed data; Q. W. (Qiongzhang Wang) and H. X. instructed the experiments; Q. W. (Qin Wang) and H. X. interpreted experimental results and prepared the manuscript; H. X. revised and edited the manuscript. All authors have read and agreed to the published version of the manuscript.
Funding
This work was supported by Wenzhou Medical University (89220001) and the National Natural Science Foundation of China (81971256).
Data Availability Statement
All data associated with this study are presented in this manuscript.
References
- Tobore, T.O. Towards a comprehensive etiopathogenetic and patho-- theory of multiple sclerosis. Int. J. Neurosci. 2020, 130, 279–300. [Google Scholar] [CrossRef] [PubMed]
- Woo, M.A.-O.; Engler, J.A.-O.; Friese, M.A.-O. The neuropathobiology of multiple sclerosis. Nat. Rev. Neurosci. 2024, 25(7), 493–513. [Google Scholar] [CrossRef] [PubMed]
- Walton, C.; King, R.; Rechtman, L.; Kaye, W.; Leray, E.; Marrie, R.A.; Robertson, N.; La Rocca, N.; Uitdehaag, B.; van der Mei, I.; et al. Rising prevalence of multiple sclerosis worldwide: Insights from the Atlas of MS, third edition. Mult. Scler. 2020, 26, 1816–1821. [Google Scholar] [CrossRef]
- Tanaka, M.; Toldi, J.; Vécsei, L. Exploring the Etiological Links behind Neuro-degenerative Diseases: Inflammatory Cytokines and Bioactive Kynurenines. Int. J. Mol. Sci. 2020, 21. [Google Scholar] [CrossRef]
- Zarghami, A.; Li, Y.; Claflin, S.B.; van der Mei, I.; Taylor, B.V. Role of environmental factors in multiple sclerosis. Expert Rev. Neurother. 2021, 21, 1389–1408. [Google Scholar] [CrossRef] [PubMed]
- Corthay, A. A Three-cell Model for Activation of Naïve T Helper Cells. Scand. J. Immunol. 2006, 64, 93–96. [Google Scholar] [CrossRef]
- Bargiela, D.; Chinnery, P.F. Mitochondria in neuroinflammation – Multiple sclerosis (MS), leber hereditary optic neuropathy (LHON) and LHON-MS. Neurosci. Lett. 2019, 710. [Google Scholar] [CrossRef]
- McGarry, T.; Biniecka, M.; Veale, D.J.; Fearon, U. Hypoxia, oxidative stress and inflammation. Free Radic. Biol. Med. 2018, 125, 15–24. [Google Scholar] [CrossRef]
- Gambini, J.; Stromsnes, K. Oxidative stress and inflammation: From mechanisms to therapeutic approaches. Biomedicines 2022, 10. [Google Scholar] [CrossRef]
- Abdel-Maged, A.E.-S.; Gad, A.M.; Rashed, L.A.; Azab, S.S.; Mohamed, E.A.; Awad, A.S. Repurposing of secukinumab as neuroprotective in cuprizone-induced multiple sclerosis experimental model via inhibition of oxidative, inflammatory, and neurodegenerative signaling. Mol. Neurobiol. 2020, 57, 3291–3306. [Google Scholar] [CrossRef]
- Zirngibl, M.; Assinck, P.; Sizov, A.; Caprariello, A.V.; Plemel, J.R. Oligodendrocyte death and myelin loss in the cuprizone model: an updated overview of the intrinsic and extrinsic causes of cuprizone demyelination. Mol. Neurodegener. 2022, 17. [Google Scholar] [CrossRef] [PubMed]
- Signorile, A.; Ferretta, A.; Ruggieri, M.; Paolicelli, D.; Lattanzio, P.; Trojano, M.; De Rasmo, D. Mitochondria, oxidative stress, cAMP signalling and apoptosis: A crossroads in lymphocytes of multiple sclerosis, a possible role of nutraceutics. Antioxidants 2020, 10. [Google Scholar] [CrossRef]
- López-Muguruza, E.; Matute, C. Alterations of oligodendrocyte and myelin energy metabolism in multiple sclerosis. Int. J. Mol. Sci. 2023, 24. [Google Scholar] [CrossRef] [PubMed]
- Luo, M.; Deng, M.; Yu, Z.; Zhang, Y.; Xu, S.; Hu, S.; Xu, H. Differential susceptibility and vulnerability of brain cells in C57BL/6 mouse to mitochondrial dysfunction induced by short-term cuprizone exposure. Front. Neuroanat. 2020, 14. [Google Scholar] [CrossRef] [PubMed]
- Yang, L.; Zhou, R.; Tong, Y.; Chen, P.; Shen, Y.; Miao, S.; Liu, X. Neuroprotection by dihydrotestosterone in LPS-induced neuroinflammation. Neurobiol. Dis. 2020, 140. [Google Scholar] [CrossRef]
- D'Ambrosi, N.; Cozzolino, M.; Carrì, M.T. Neuroinflammation in amyotrophic lateral sclerosis: Role of redox (dys) regulation. Antioxid. Redox Signal. 2018, 29, 15–36. [Google Scholar] [CrossRef]
- Paty, D.W.; Li, D.K.B. Interferon beta-1b is effective in relapsing-remitting multiple sclerosis. Neurology 1993, 43, 662–662. [Google Scholar] [CrossRef]
- Bermel Ra Fau - Inglese, M.; Inglese, M. Neurodegeneration and inflammation in MS: the eye teaches us about the storm. Neurology 2012, 80, 19–20. [Google Scholar] [CrossRef]
- Polman, C.H. Anti-myelin antibodies in multiple sclerosis: clinically useful? J. Neurol. Neurosurg. Psychiatry. 2006, 77, 712–712. [Google Scholar] [CrossRef]
- Rudick, R.A.; Stuart Wh Fau - Calabresi, P.A.; Calabresi Pa Fau - Confavreux, C.; Confavreux C Fau - Galetta, S.L.; Galetta Sl Fau - Radue, E.-W.; Radue Ew Fau - Lublin, F.D.; Lublin Fd Fau - Weinstock-Guttman, B.; Weinstock-Guttman B Fau - Wynn, D.R.; Wynn Dr Fau - Lynn, F.; Lynn F Fau - Panzara, M.A.; et al. Natalizumab plus interferon beta-1a for relapsing multiple sclerosis. N. Engl. J. Med. 2006, 354, 911–923. [Google Scholar] [CrossRef]
- Langer-Gould, A.; Atlas Sw Fau - Green, A.J.; Green Aj Fau - Bollen, A.W.; Bollen Aw Fau - Pelletier, D.; Pelletier, D. Progressive multifocal leukoencephalopathy in a patient treated with natalizumab. N. Engl. J. Med. 2005, 353(4), 375–381. [Google Scholar] [CrossRef] [PubMed]
- Morrow, S.A.; Clift, F.; Devonshire, V.; Lapointe, E.; Schneider, R.; Stefanelli, M.; Vosoughi, R. Use of natalizumab in persons with multiple sclerosis: 2022 update. Mult. Scler. Relat. Disord. 2022, 65. [Google Scholar] [CrossRef]
- Cohen, J.A.; Barkhof F Fau - Comi, G.; Comi G Fau - Hartung, H.-P.; Hartung Hp Fau - Khatri, B.O.; Khatri Bo Fau - Montalban, X.; Montalban X Fau - Pelletier, J.; Pelletier J Fau - Capra, R.; Capra R Fau - Gallo, P.; Gallo P Fau - Izquierdo, G.; Izquierdo G Fau - Tiel-Wilck, K.; et al. Oral fingolimod or intramuscular interferon for relapsing multiple sclerosis. N. Engl. J. Med. 2010, 362(5), 402–415. [Google Scholar] [CrossRef] [PubMed]
- Kappos, L.; Radue Ew Fau - O'Connor, P.; O'Connor P Fau - Polman, C.; Polman C Fau - Hohlfeld, R.; Hohlfeld R Fau - Calabresi, P.; Calabresi P Fau - Selmaj, K.; Selmaj K Fau - Agoropoulou, C.; Agoropoulou C Fau - Leyk, M.; Leyk M Fau - Zhang-Auberson, L.; Zhang-Auberson L Fau - Burtin, P.; et al. A placebo-controlled trial of oral fingolimod in relapsing multiple sclerosis. N. Engl. J. Med. 2010, 362(5), 387–401. [Google Scholar] [CrossRef]
- Pelletier, D.; Hafler, D.A. Fingolimod for multiple sclerosis. N. Engl. J. Med. 2012, 366, 339–347. [Google Scholar] [CrossRef]
- He, A.; Spelman, T.; Jokubaitis, V.; Havrdova, E.; Horakova, D.; Trojano, M.; Lugaresi, A.; Izquierdo, G.; Grammond, P.; Duquette, P.; et al. Comparison of Switch to Fingolimod or Interferon Beta/Glatiramer Acetate in Active Multiple Sclerosis. JAMA Neurol. 2015, 72. [Google Scholar] [CrossRef] [PubMed]
- Tanaka, M. The risk of varicella zoster virus infection in multiple sclerosis patients treated with fingolimod. Rinsho Shinkeigaku. 2016, 56, 270–272. [Google Scholar] [CrossRef]
- Theodosis-Nobelos, P.; Rekka, E.A. The multiple sclerosis modulatory potential of natural multi-targeting antioxidants. Molecules 2022, 27. [Google Scholar] [CrossRef]
- Licht-Mayer, S.; Wimmer, I.; Traffehn, S.; Metz, I.; Brück, W.; Bauer, J.; Bradl, M.; Lassmann, H. Cell type-specific Nrf2 expression in multiple sclerosis lesions. Acta Neuropathol. 2015, 130, 263–277. [Google Scholar] [CrossRef]
- Xu, J.; Zhang, Y.; Xiao, Y.; Ma, S.; Liu, Q.; Dang, S.; Jin, M.; Shi, Y.; Wan, B.; Zhang, Y. Inhibition of 12/15-lipoxygenase by baicalein induces microglia PPARβ/δ: a potential therapeutic role for CNS autoimmune disease. Cell Death Dis. 2013, 4, e569–e569. [Google Scholar] [CrossRef]
- Hashimoto, M.; Yamamoto, S.; Iwasa, K.; Yamashina, K.; Ishikawa, M.; Maruyama, K.; Bosetti, F.; Yoshikawa, K. The flavonoid Baicalein attenuates cuprizone-induced demyelination via suppression of neuroinflammation. Brain Res. Bull. 2017, 135, 47–52. [Google Scholar] [CrossRef] [PubMed]
- Li, Y.-y.; Wang, X.-j.; Su, Y.-l.; Wang, Q.; Huang, S.-w.; Pan, Z.-f.; Chen, Y.-p.; Liang, J.-j.; Zhang, M.-l.; Xie, X.-q.; et al. Baicalein ameliorates ulcerative colitis by improving intestinal epithelial barrier via AhR/IL-22 pathway in ILC3s. Acta Pharmacol. Sin. 2021, 43, 1495–1507. [Google Scholar] [CrossRef]
- Ennaceur, A.; Delacour, J. A new one-trial test for neurobiological studies of memory in rats. 1: Behavioral data. Behav. Brain Res. -59. [CrossRef]
- Xu, H.; Yang, H.-J.; Li, X.-M. Differential effects of antipsychotics on the development of rat oligodendrocyte precursor cells exposed to cuprizone. Eur. Arch. Psychiatry Clin. Neurosci. 2013, 264, 121–129. [Google Scholar] [CrossRef]
- Faizi, M.; Salimi, A.; Seydi, E.; Naserzadeh, P.; Kouhnavard, M.; Rahimi, A.; Pourahmad, J. Toxicity of cuprizone a Cu2+chelating agent on isolated mouse brain mitochondria: a justification for demyelination and subsequent behavioral dysfunction. Toxicol. Mech. Methods 2016, 26, 276–283. [Google Scholar] [CrossRef]
- Kim, G.H.; Kim, J.E.; Rhie, S.J.; Yoon, S. The role of oxidative stress in neurodegenerative diseases. Exp. Neurobiol. 2015, 24, 325–340. [Google Scholar] [CrossRef] [PubMed]
- Branca, C.; Ferreira, E.; Nguyen, T.-V.; Doyle, K.; Caccamo, A.; Oddo, S. Genetic reduction of Nrf2 exacerbates cognitive deficits in a mouse model of Alzheimer’s disease. Hum. Mol. Genet. 2017, 26, 4823–4835. [Google Scholar] [CrossRef] [PubMed]
- Brandes, M.S.; Gray, N.E. NRF2 as a therapeutic target in neurodegenerative diseases. ASN Neuro 2020, 12. [Google Scholar] [CrossRef]
- MichaliČKovÁ, D.; ŠÍMa, M.; SlanaŘ, O. New insights in the mechanisms of impaired redox signaling and its interplay with inflammation and immunity in multiple sclerosis. Physiol. Res. 2020, 1–19. [Google Scholar] [CrossRef]
- Chen, P.C.; Vargas, M.R.; Pani, A.K.; Smeyne, R.J.; Johnson, D.A.; Kan, Y.W.; Johnson, J.A. Nrf2-mediated neuroprotection in the MPTP mouse model of Parkinson's disease: Critical role for the astrocyte. Proc. Natl. Acad. Sci. U.S.A. 2009, 106, 2933–2938. [Google Scholar] [CrossRef]
- Podbielska, M.; Banik, N.; Kurowska, E.; Hogan, E. Myelin recovery in multiple sclerosis: The challenge of remyelination. Brain Sci. 2013, 3, 1282–1324. [Google Scholar] [CrossRef]
- van der Valk, P.; De Groot, C.J.A. Staging of multiple sclerosis (MS) lesions: pathology of the time frame of MS. Neuropathol. Appl. Neurobiol. 2000, 26, 2–10. [Google Scholar] [CrossRef]
- Sriram, S. Role of glial cells in innate immunity and their role in CNS demyelination. J. Neuroimmunol. 2011, 239, 13–20. [Google Scholar] [CrossRef]
- Dolati, S.; Babaloo, Z.; Jadidi-Niaragh, F.; Ayromlou, H.; Sadreddini, S.; Yousefi, M. Multiple sclerosis: Therapeutic applications of advancing drug delivery systems. Biomed. Pharmacother. 2017, 86, 343–353. [Google Scholar] [CrossRef]
- Brinza, I.; Ayoub, I.M.; Eldahshan, O.A.; Hritcu, L. Baicalein 5,6-dimethyl ether prevents memory deficits in the scopolamine zebrafish model by regulating cholinergic and antioxidant systems. Plants 2021, 10. [Google Scholar] [CrossRef] [PubMed]
- Gregory, J.; Vengalasetti, Y.V.; Bredesen, D.E.; Rao, R.V. Neuroprotective herbs for the management of alzheimer’s disease. Biomolecules 2021, 11. [Google Scholar] [CrossRef]
- Shi, J.; Chen, J.; Xie, X.; Li, Y.; Ye, W.; Yao, J.; Zhang, X.; Zhang, T.; Gao, J. Baicalein-corrected gut microbiota may underlie the amelioration of memory and cognitive deficits in APP/PS1 mice. Front. Pharmacol. 2023, 14. [Google Scholar] [CrossRef] [PubMed]
- de Oliveira, M.R.; Nabavi, S.F.; Habtemariam, S.; Erdogan Orhan, I.; Daglia, M.; Nabavi, S.M. The effects of baicalein and baicalin on mitochondrial function and dynamics: A review. Pharmacol. Res. 2015, 100, 296–308. [Google Scholar] [CrossRef] [PubMed]
- Gao, Z.H.; Huang, K.X.; Yang, X.L.; Xu, H.B. Free radical scavenging and antioxidant activities of flavonoids extracted from the radix of Scutellaria baicalensis Georgi. Biochim. Biophys. Acta. 1999, 1472, 643–650. [Google Scholar] [CrossRef]
- Mihai, D.P.; Ungurianu, A.; Ciotu, C.I.; Fischer, M.J.M.; Olaru, O.T.; Nitulescu, G.M.; Andrei, C.; Zbarcea, C.E.; Zanfirescu, A.; Seremet, O.C.; et al. Effects of Venlafaxine, Risperidone and Febuxostat on Cuprizone-Induced Demyelination, Behavioral Deficits and Oxidative Stress. Int. J. Mol. Sci. 2021, 22. [Google Scholar] [CrossRef]
- Zhang, L.; Xu, S.; Huang, Q.; Xu, H. N-acetylcysteine attenuates the cuprizone-induced behavioral changes and oligodendrocyte loss in male C57BL/7 mice via its anti-inflammation actions. J. Neurosci. Res. 2017, 96, 803–816. [Google Scholar] [CrossRef]
- Yang, L.; Su, Y.; Guo, F.; Zhang, H.; Zhao, Y.; Huang, Q.; Xu, H. Deep rTMS mitigates behavioral and neuropathologic anomalies in cuprizone-exposed mice through reducing microglial proinflammatory cytokines. Front. Integr. Neurosci. 2020, 14. [Google Scholar] [CrossRef] [PubMed]
- Franco-Pons, N.; Torrente, M.; Colomina, M.T.; Vilella, E. Behavioral deficits in the cuprizone-induced murine model of demyelination/remyelination. Toxicol. Lett. 2007, 169, 205–213. [Google Scholar] [CrossRef] [PubMed]
- Hibbits, N.; Pannu, R.; Wu, T.J.; Armstrong, R.C. Cuprizone demyelination of the corpus callosum in mice correlates with altered social interaction and impaired bilateral sensorimotor coordination. ASN Neuro 2009, 1. [Google Scholar] [CrossRef] [PubMed]
- Woo, M.S.; Engler, J.B.; Friese, M.A. The neuropathobiology of multiple sclerosis. Nat. Rev. Neurosci. 2024, 25, 493–513. [Google Scholar] [CrossRef]
- Kutzelnigg, A.; Lucchinetti, C.F.; Stadelmann, C.; Brück, W.; Rauschka, H.; Bergmann, M.; Schmidbauer, M.; Parisi, J.E.; Lassmann, H. Cortical demyelination and diffuse white matter injury in multiple sclerosis. Brain 2005, 128, 2705–2712. [Google Scholar] [CrossRef]
- Calabrese, M.; Rinaldi, F.; Grossi, P.; Gallo, P. Cortical pathology and cognitive impairment in multiple sclerosis. Expert Rev. Neurother. 2011, 11, 425–432. [Google Scholar] [CrossRef]
- Pasquini, L.A.; Calatayud, C.A.; Bertone Uña, A.L.; Millet, V.; Pasquini, J.M.; Soto, E.F. The neurotoxic effect of cuprizone on oligodendrocytes depends on the presence of pro-inflammatory cytokines secreted by microglia. Neurochem. Res. 2006, 32, 279–292. [Google Scholar] [CrossRef]
- Arnett, H.A.; Mason, J.; Marino, M.; Suzuki, K.; Matsushima, G.K.; Ting, J.P.Y. TNFα promotes proliferation of oligodendrocyte progenitors and remyelination. Nat. Neurosci. 2001, 4, 1116–1122. [Google Scholar] [CrossRef]
- Mahad, D.; Lassmann, H.; Turnbull, D. Review: Mitochondria and disease progression in multiple sclerosis. Neuropathol. Appl. Neurobiol. 2008, 34, 577–589. [Google Scholar] [CrossRef]
- Kipp, M.; Clarner, T.; Dang, J.; Copray, S.; Beyer, C. The cuprizone animal model: new insights into an old story. Acta Neuropathol. 2009, 118, 723–736. [Google Scholar] [CrossRef]
- Praet, J.; Guglielmetti, C.; Berneman, Z.; Van der Linden, A.; Ponsaerts, P. Cellular and molecular neuropathology of the cuprizone mouse model: Clinical relevance for multiple sclerosis. Neurosci. Biobehav. Rev. 2014, 47, 485–505. [Google Scholar] [CrossRef] [PubMed]
- Ganz, T.; Zveik, O.; Fainstein, N.; Lachish, M.; Rechtman, A.; Sofer, L.; Brill, L.; Ben-Hur, T.; Vaknin-Dembinsky, A. Oligodendrocyte progenitor cells differentiation induction with MAPK/ERK inhibitor fails to support repair processes in the chronically demyelinated CNS. Glia 2023, 71, 2815–2831. [Google Scholar] [CrossRef] [PubMed]
- Zveik, O.; Fainstein, N.; Rechtman, A.; Haham, N.; Ganz, T.; Lavon, I.; Brill, L.; Vaknin-Dembinsky, A. Cerebrospinal fluid of progressive multiple sclerosis patients reduces differentiation and immune functions of oligodendrocyte progenitor cells. Glia 2022, 70, 1191–1209. [Google Scholar] [CrossRef] [PubMed]
- Zveik, O.; Rechtman, A.; Ganz, T.; Vaknin-Dembinsky, A. The interplay of inflammation and remyelination: rethinking MS treatment with a focus on oligodendrocyte progenitor cells. Mol. Neurodegener. 2024, 19. [Google Scholar] [CrossRef]
- Komiyama, T.; Al-Kafaji, G.; Bakheit, H.F.; AlAli, F.; Fattah, M.; Alhajeri, S.; Alharbi, M.A.; Daif, A.; Alsabbagh, M.M.; Alwehaidah, M.S.; et al. Next-generation sequencing of the whole mitochondrial genome identifies functionally deleterious mutations in patients with multiple sclerosis. PLoS One 2022, 17. [Google Scholar] [CrossRef]
- Campbell, G.R.; Mahad, D.J. Mitochondrial changes associated with demyelination: Consequences for axonal integrity. Mitochondrion 2012, 12, 173–179. [Google Scholar] [CrossRef]
- Dutta, R.; McDonough, J.; Yin, X.; Peterson, J.; Chang, A.; Torres, T.; Gudz, T.; Macklin, W.B.; Lewis, D.A.; Fox, R.J.; et al. Mitochondrial dysfunction as a cause of axonal degeneration in multiple sclerosis patients. Ann. Neurol. 2006, 59, 478–489. [Google Scholar] [CrossRef]
- Maldonado, P.P.; Guevara, C.; Olesen, M.A.; Orellana, J.A.; Quintanilla, R.A.; Ortiz, F.C. Neurodegeneration in multiple sclerosis: The role of Nrf2-dependent pathways. Antioxidants 2022, 11. [Google Scholar] [CrossRef]
- Draheim, T.; Liessem, A.; Scheld, M.; Wilms, F.; Weißflog, M.; Denecke, B.; Kensler, T.W.; Zendedel, A.; Beyer, C.; Kipp, M.; et al. Activation of the astrocytic Nrf2/ARE system ameliorates the formation of demyelinating lesions in a multiple sclerosis animal model. Glia 2016, 64, 2219–2230. [Google Scholar] [CrossRef]
- Rosito, M.; Testi, C.; Parisi, G.; Cortese, B.; Baiocco, P.; Di Angelantonio, S. Exploring the use of dimethyl fumarate as microglia modulator for neurodegenerative diseases treatment. Antioxidants 2020, 9. [Google Scholar] [CrossRef]
- Dinkova-Kostova, A.T.; Abramov, A.Y. The emerging role of Nrf2 in mitochondrial function. Free Radical Biol. Med. 2015, 88, 179–188. [Google Scholar] [CrossRef] [PubMed]
- Yan, N.; Xu, Z.; Qu, C.; Zhang, J. Dimethyl fumarate improves cognitive deficits in chronic cerebral hypoperfusion rats by alleviating inflammation, oxidative stress, and ferroptosis via NRF2/ARE/NF-κB signal pathway. Int. Immunopharmacol. 2021, 98. [Google Scholar] [CrossRef] [PubMed]
- Uruno, A.; Yamamoto, M. The KEAP1-NRF2 system and neurodegenerative diseases. Antioxid. Redox Signal. 2023, 38, 974–988. [Google Scholar] [CrossRef] [PubMed]
- Li, F.; Song, X.; Xu, J.; Shi, Y.; Hu, R.; Ren, Z.; Qi, Q.; Lü, H.; Cheng, X.; Hu, J. Morroniside protects OLN-93 cells against H2O2-induced injury through the PI3K/Akt pathway-mediated antioxidative stress and antiapoptotic activities. Cell Cycle 2021, 20, 661–675. [Google Scholar] [CrossRef]
- Saija, A.; Scalese, M.; Lanza, M.; Marzullo, D.; Bonina, F.; Castelli, F. Flavonoids as antioxidant agents: importance of their interaction with biomembranes. Free Radic. Biol. Med. 1995, 19, 481–486. [Google Scholar] [CrossRef]
- Jeong, J.Y.; Cha, H.-J.; Choi, E.O.; Kim, C.H.; Kim, G.-Y.; Yoo, Y.H.; Hwang, H.-J.; Park, H.T.; Yoon, H.M.; Choi, Y.H. Activation of the Nrf2/HO-1 signaling pathway contributes to the protective effects of baicalein against oxidative stress-induced DNA damage and apoptosis in HEI193 Schwann cells. Int. J. Med. Sci. 2019, 16, 145–155. [Google Scholar] [CrossRef]
- Park, C.; Choi, E.O.; Kim, G.-Y.; Hwang, H.-J.; Kim, B.W.; Yoo, Y.H.; Park, H.T.; Choi, Y.H. Protective Effect of Baicalein on Oxidative Stress-induced DNA Damage and Apoptosis in RT4-D6P2T Schwann Cells. Int. J. Med. Sci. 2019, 16, 8–16. [Google Scholar] [CrossRef]
- Ma, J.; Li, S.; Zhu, L.; Guo, S.; Yi, X.; Cui, T.; He, Y.; Chang, Y.; Liu, B.; Li, C.; et al. Baicalein protects human vitiligo melanocytes from oxidative stress through activation of NF-E2-related factor2 (Nrf2) signaling pathway. Free Radic. Biol. Med. 2018, 129, 492–503. [Google Scholar] [CrossRef]
Figure 1.
Baicalein alleviates CPZ-induced behavioral changes in mice. (A) Results of the rotarod test (n = 10-16/group). (B & C) Results of the Y-maze test (n = 11-19/group). (D & E) Results of the novel object recognition test (n = 10-17/group); Data are presented as mean ± SEM. *p < 0.05, **p < 0.01.
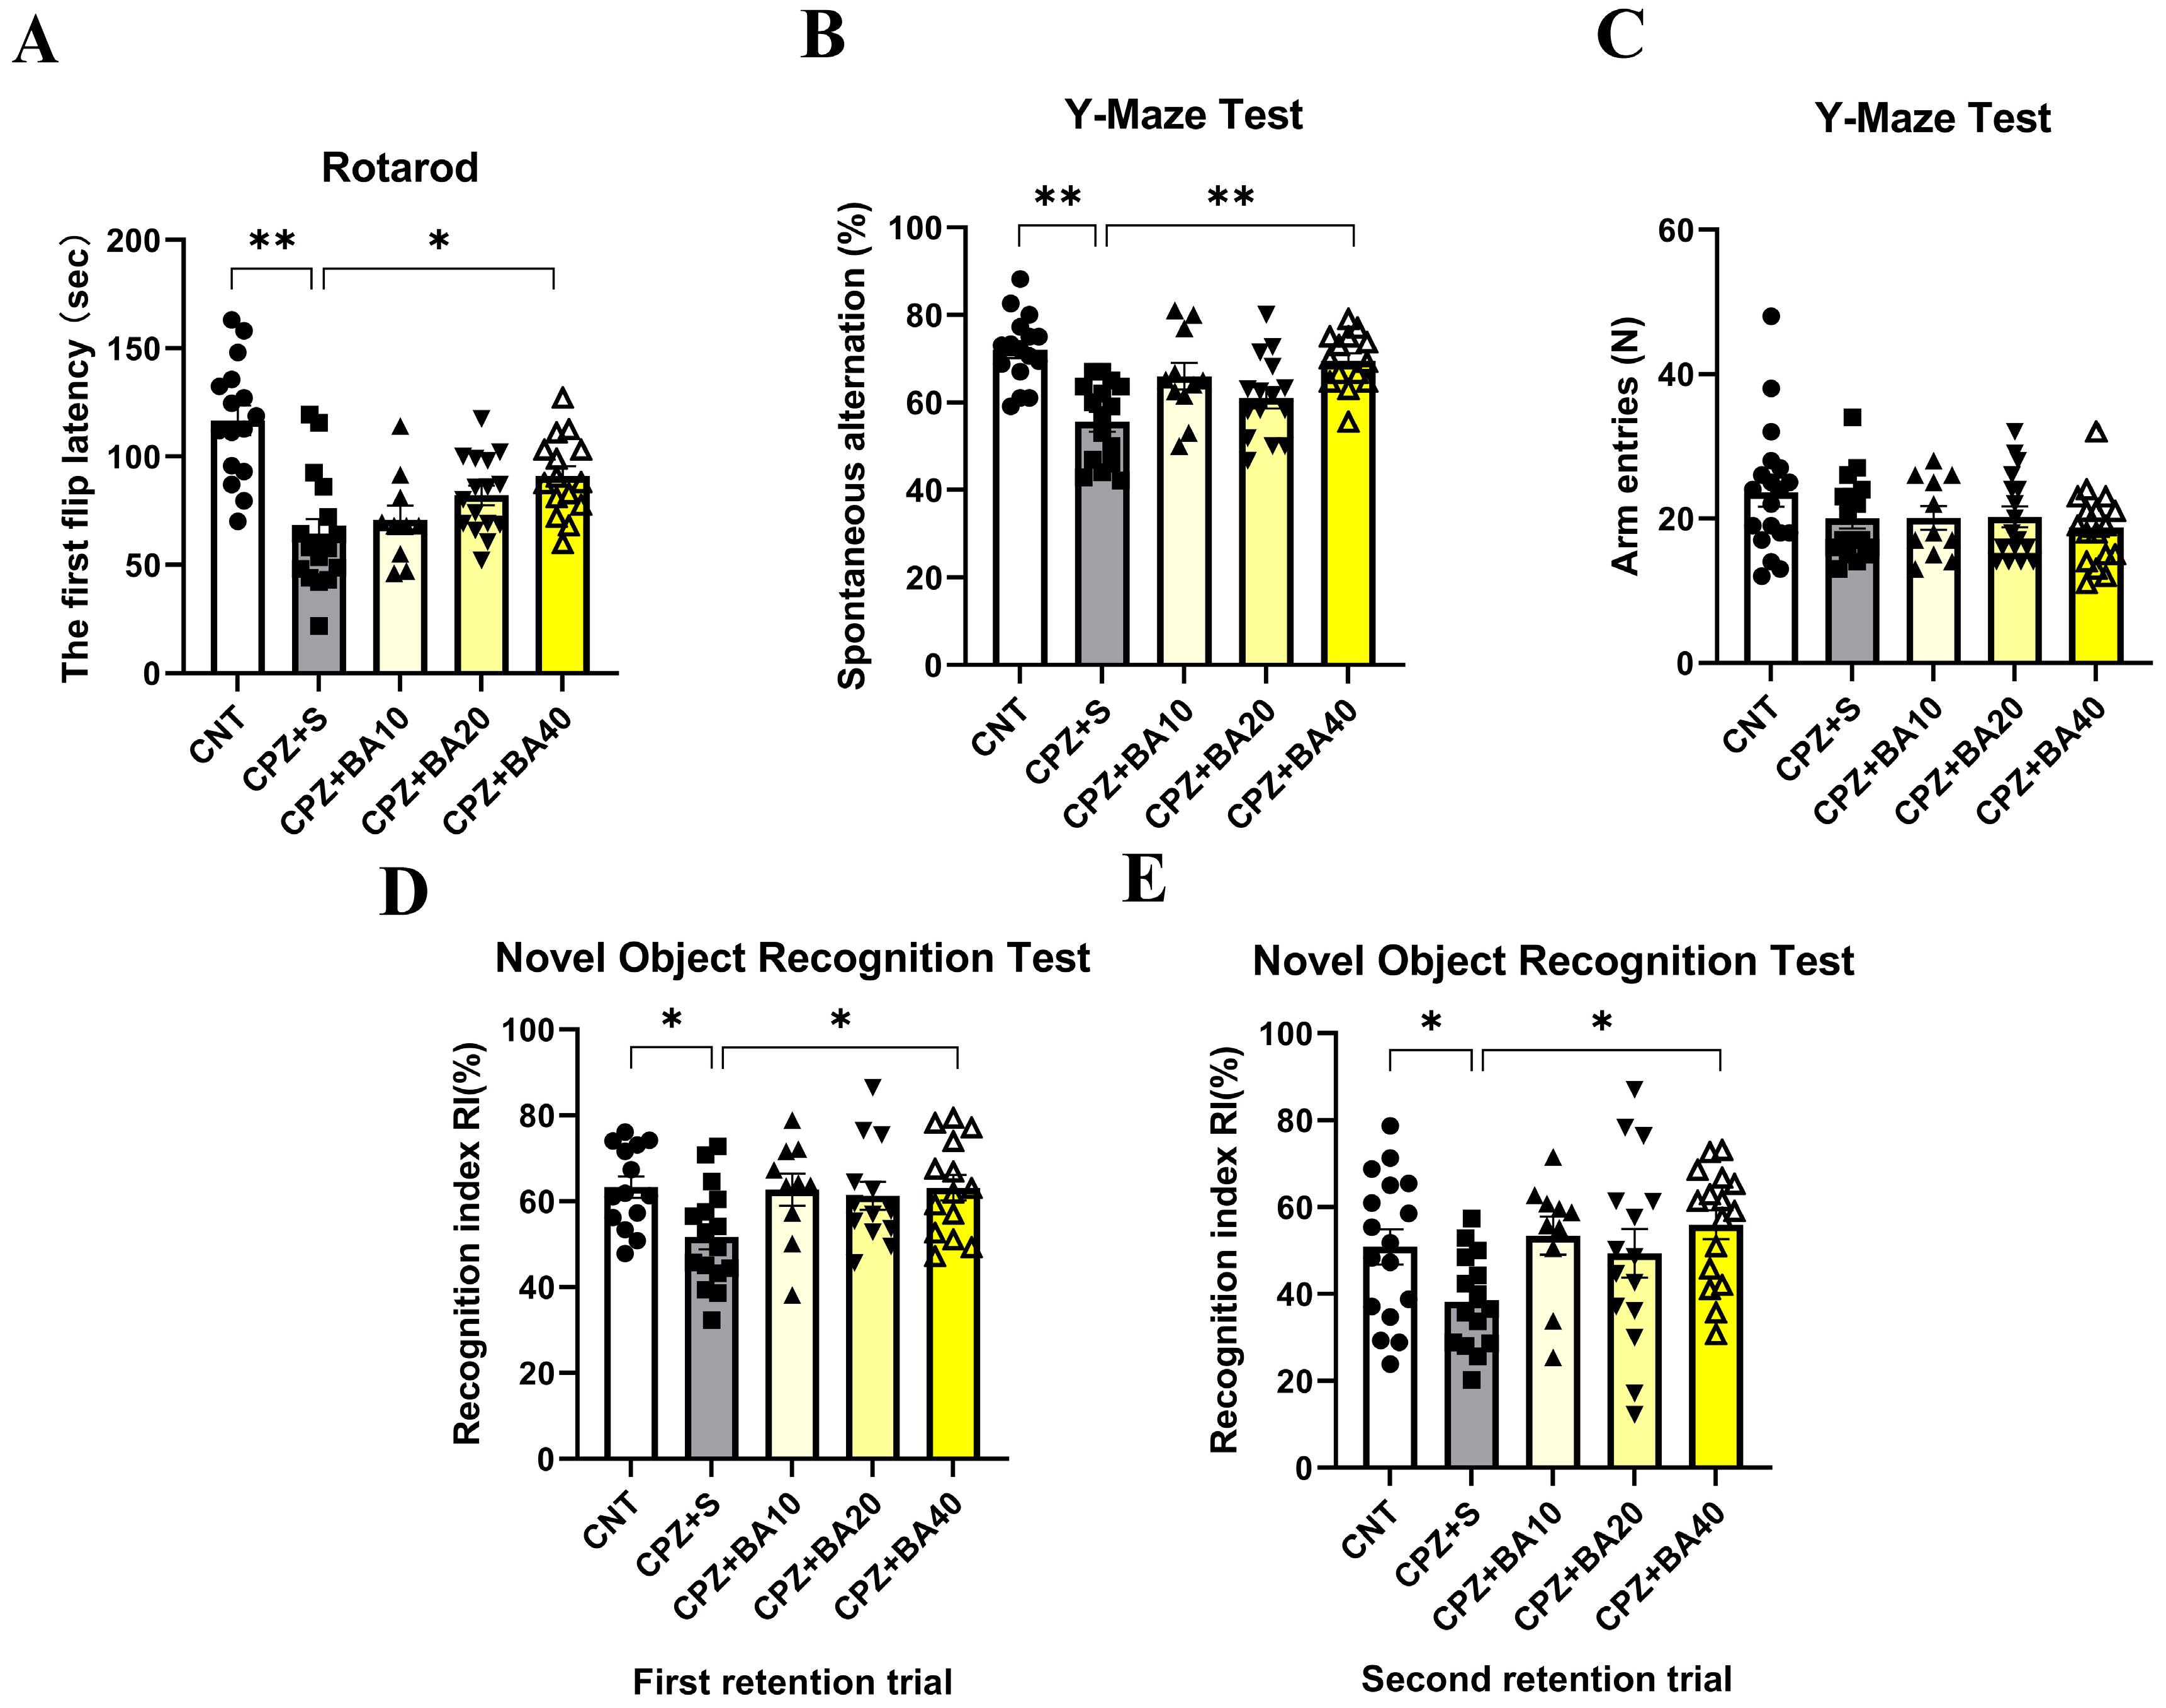
Figure 2.
Baicalein promotes remyelination after CPZ-induced demyelination in the mouse brain. (A) Representative immunofluorescence staining images of MBP in the cerebral cortex and the statistical analysis results of MBP MFI there (n = 5/group). (B) Representative immunofluorescence staining images of Olig2 in the corpus callosum and the statistical analysis results of Olig2 MFI there (n = 4/group). (C) The representative Western blot images of MBP and MOG proteins in HIP and the quantitative analysis results of the proteins there in (n = 5-7/group). (D) The representative Western blot images of MBP and MOG proteins in the cerebral cortex and the quantitative analysis results of the proteins there (n = 4-7/group). *p < 0.05, data are presented as mean ± SEM.
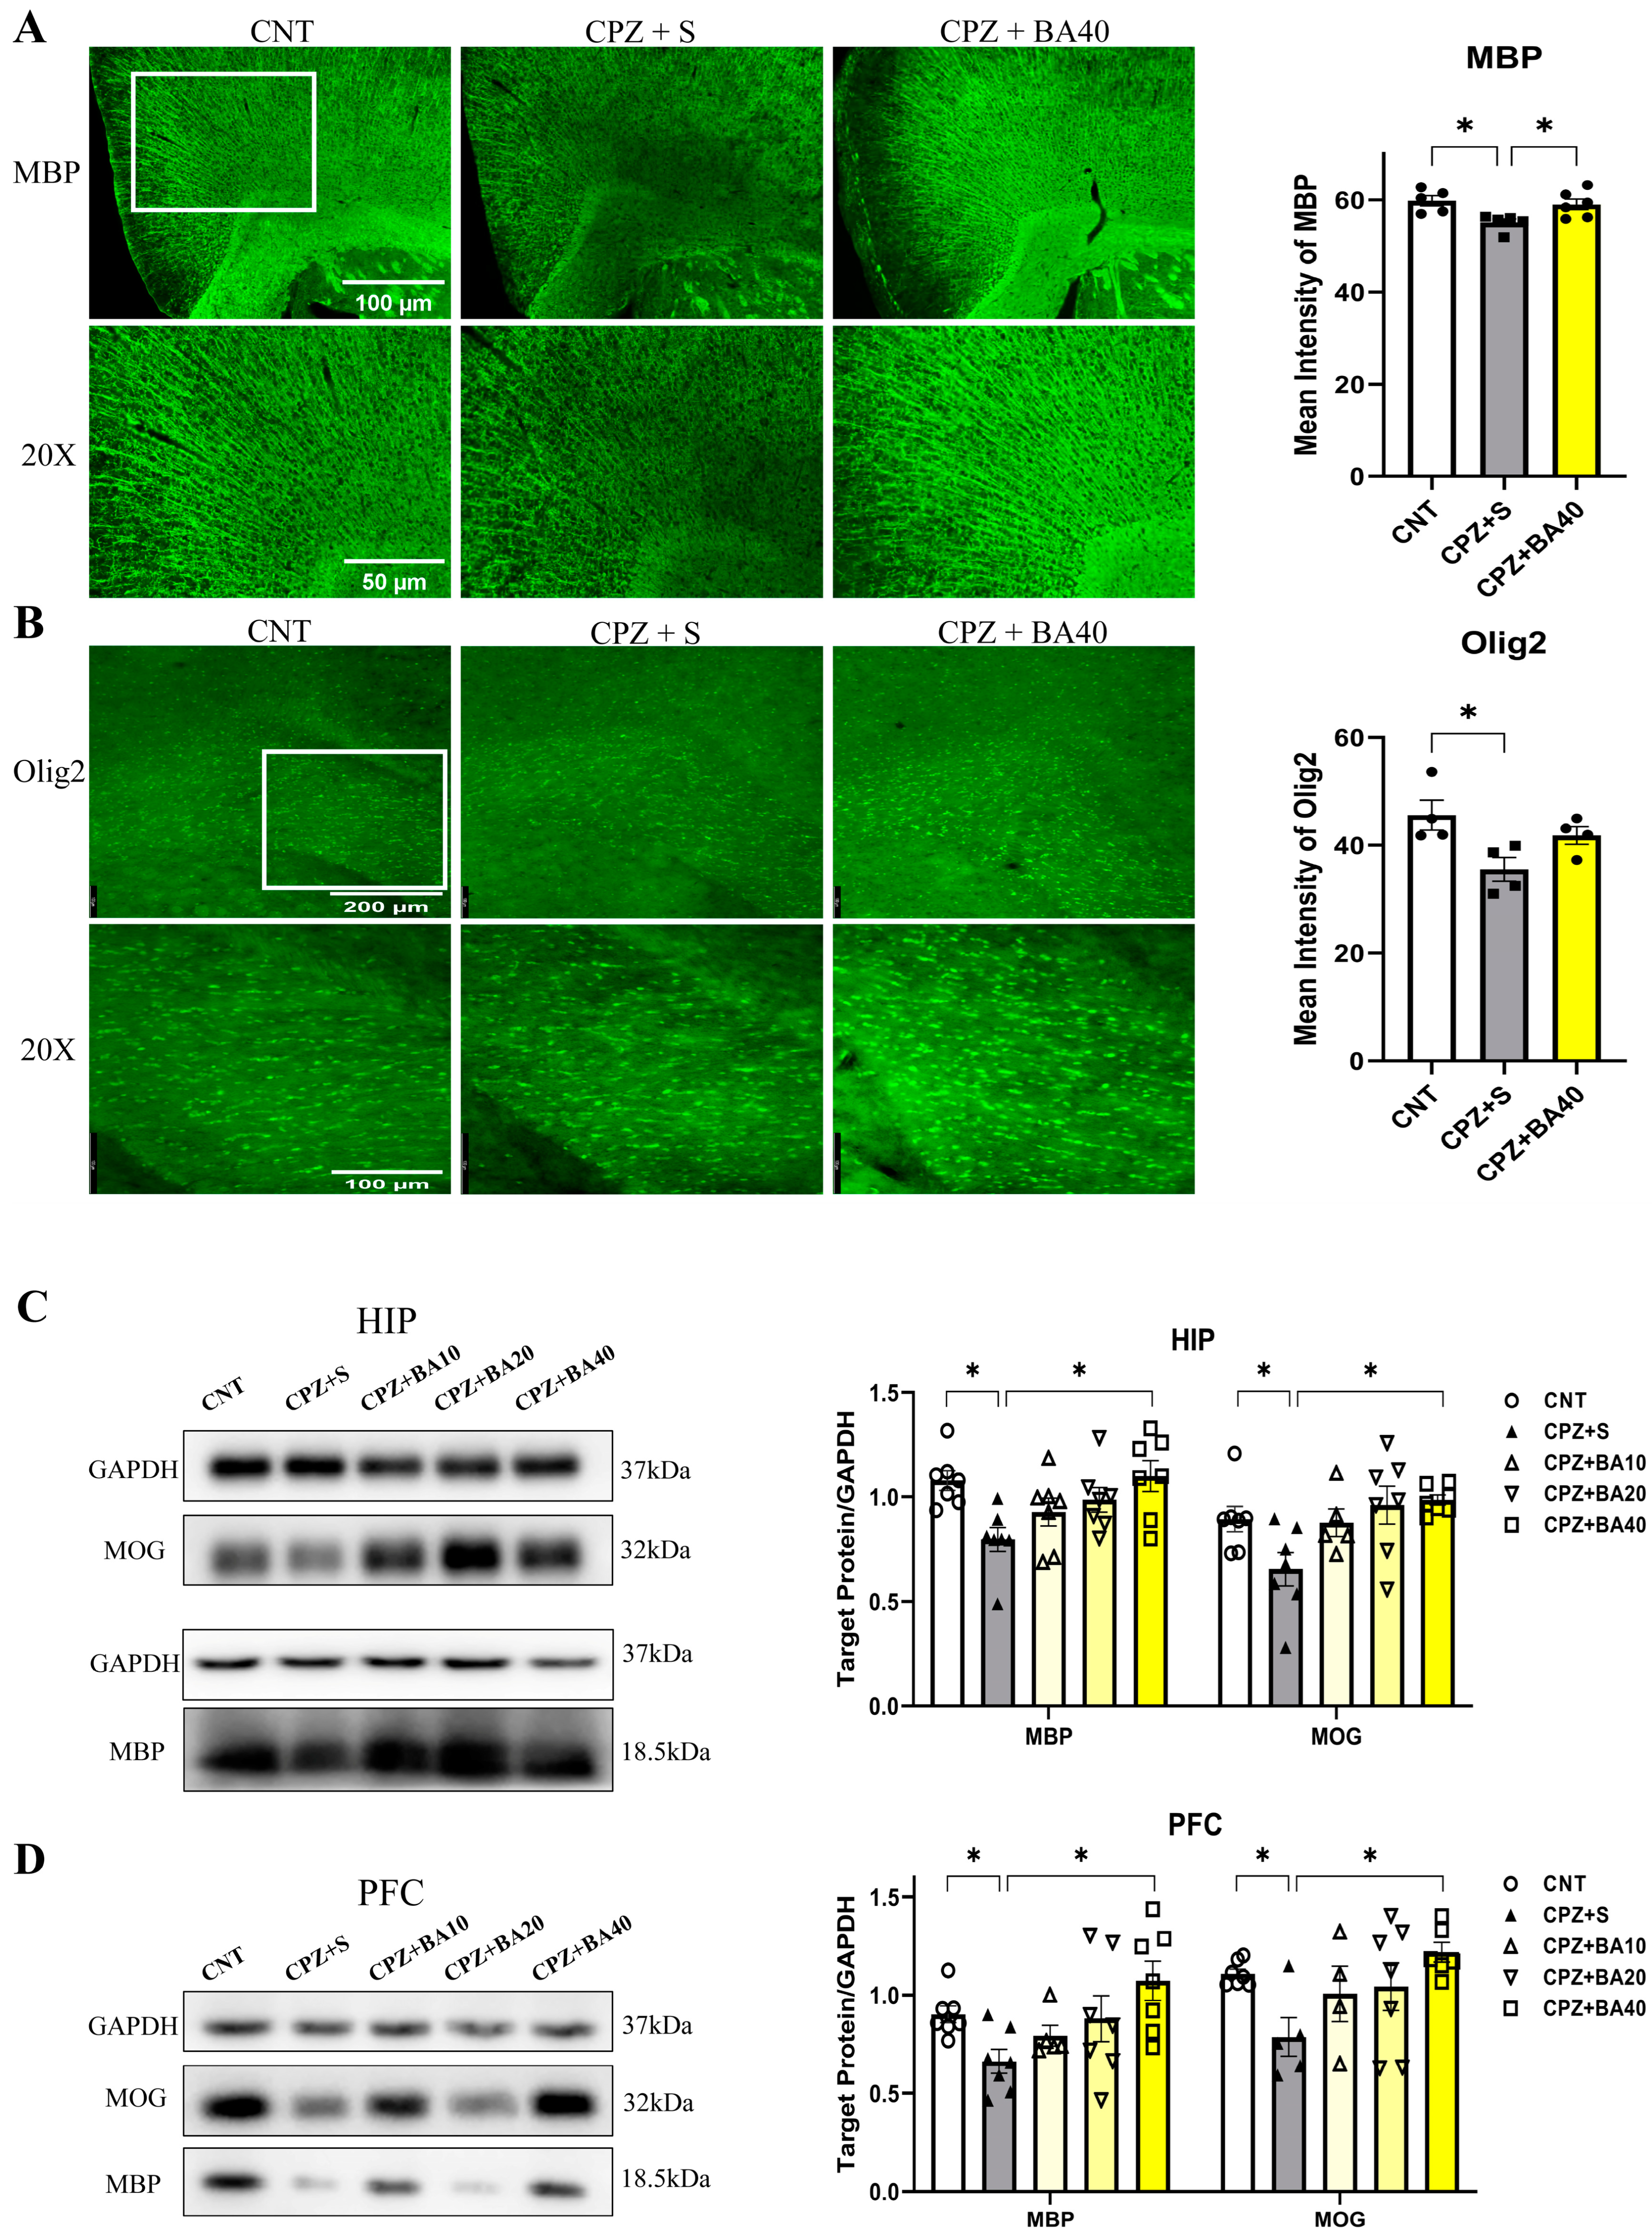
Figure 3.
Baicalein inhibits the proliferation of astrocytes and microglia in mouse brain following cuprizone exposure. (A) Representative immunofluorescence staining images of GFAP in the CA3 region of HIP and statistical analysis results of GFAP+ cell density there (n = 5/group). (B) Representative immunofluorescence staining images of IBA-1 in the CA3 region and statistical analysis results of IBA1+ cell density there (n = 5/group). (C) Representative Western blot images of GFAP in the HIP and PFC and statistical analysis of GFAP expression in the brain regions (n = 6). *p < 0.05, data are presented as mean ± SEM.
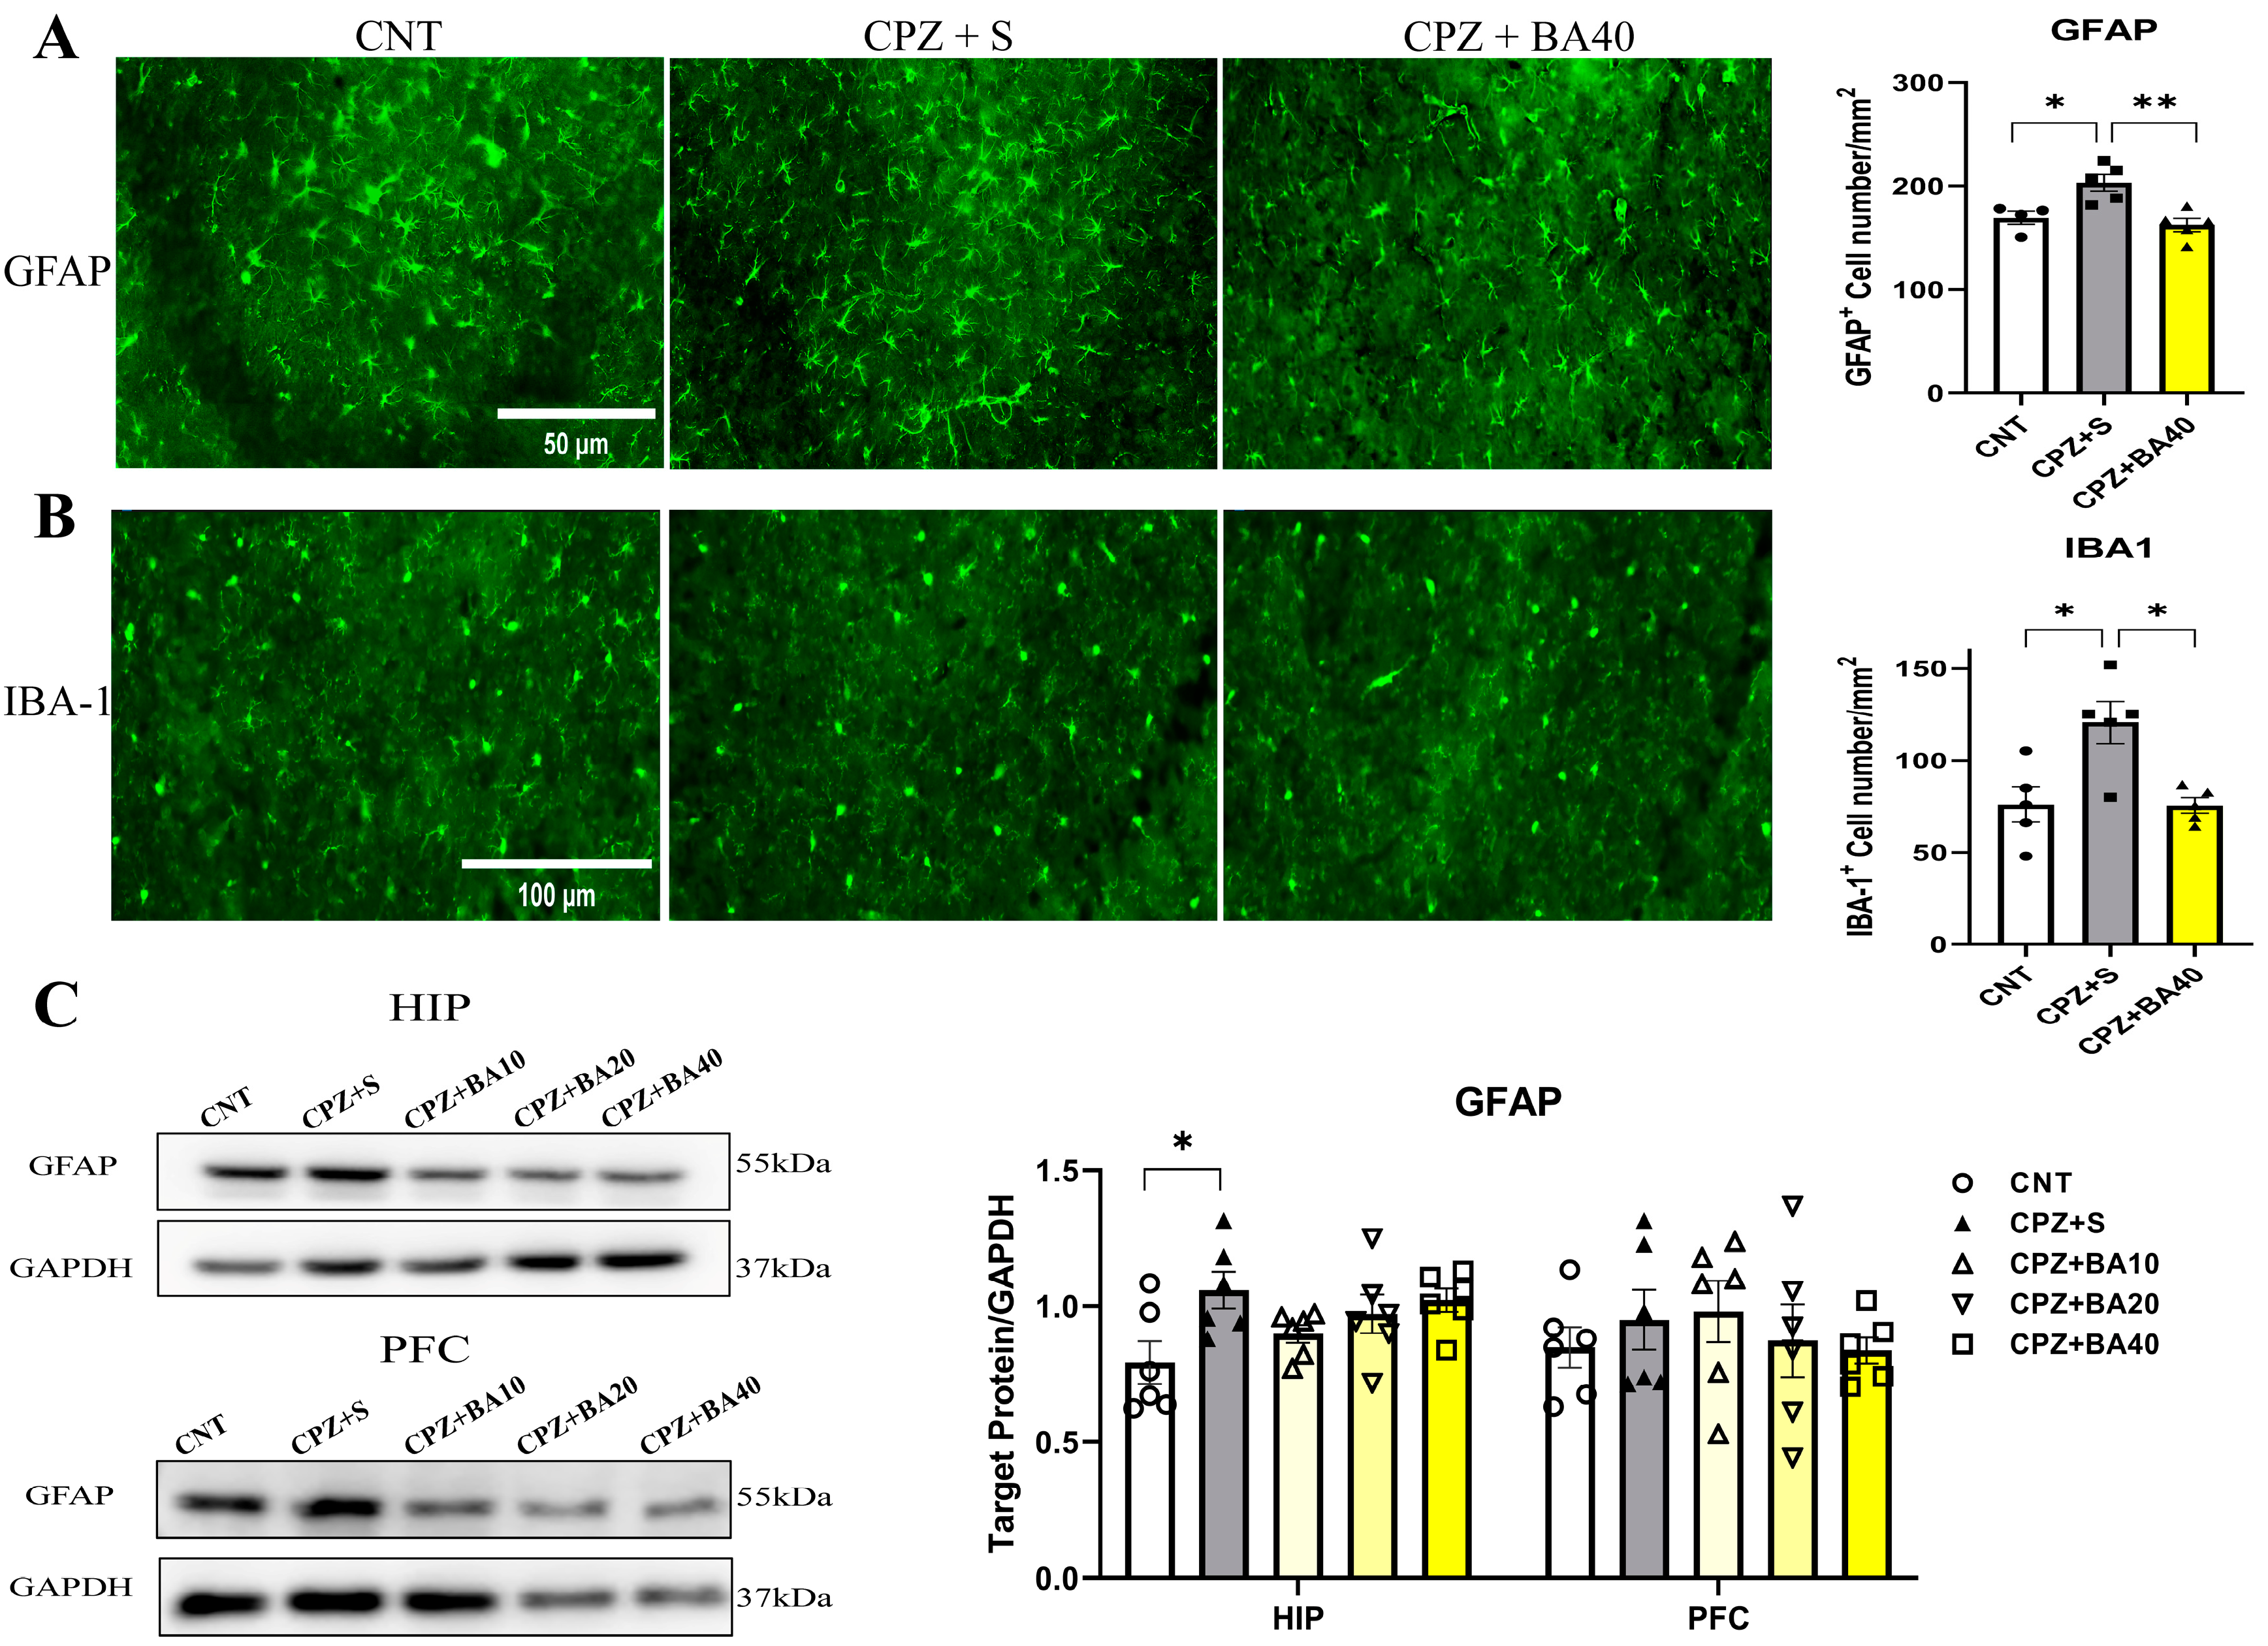
Figure 4.
Baicalein reverses the CPZ-induced changes in levels of inflammatory cytokines in mouse brain. (A) Bar charts showing the levels of IL-6, TNF-α, IL-10 and TGF-β in the PFC (n = 6/group). (B) Bar charts showing the levels of IL-6, TNF-α, IL-10 and TGF-β in the HIP (n = 6/group). *p < 0.05, **p < 0.01. Data are presented as mean ± SEM.
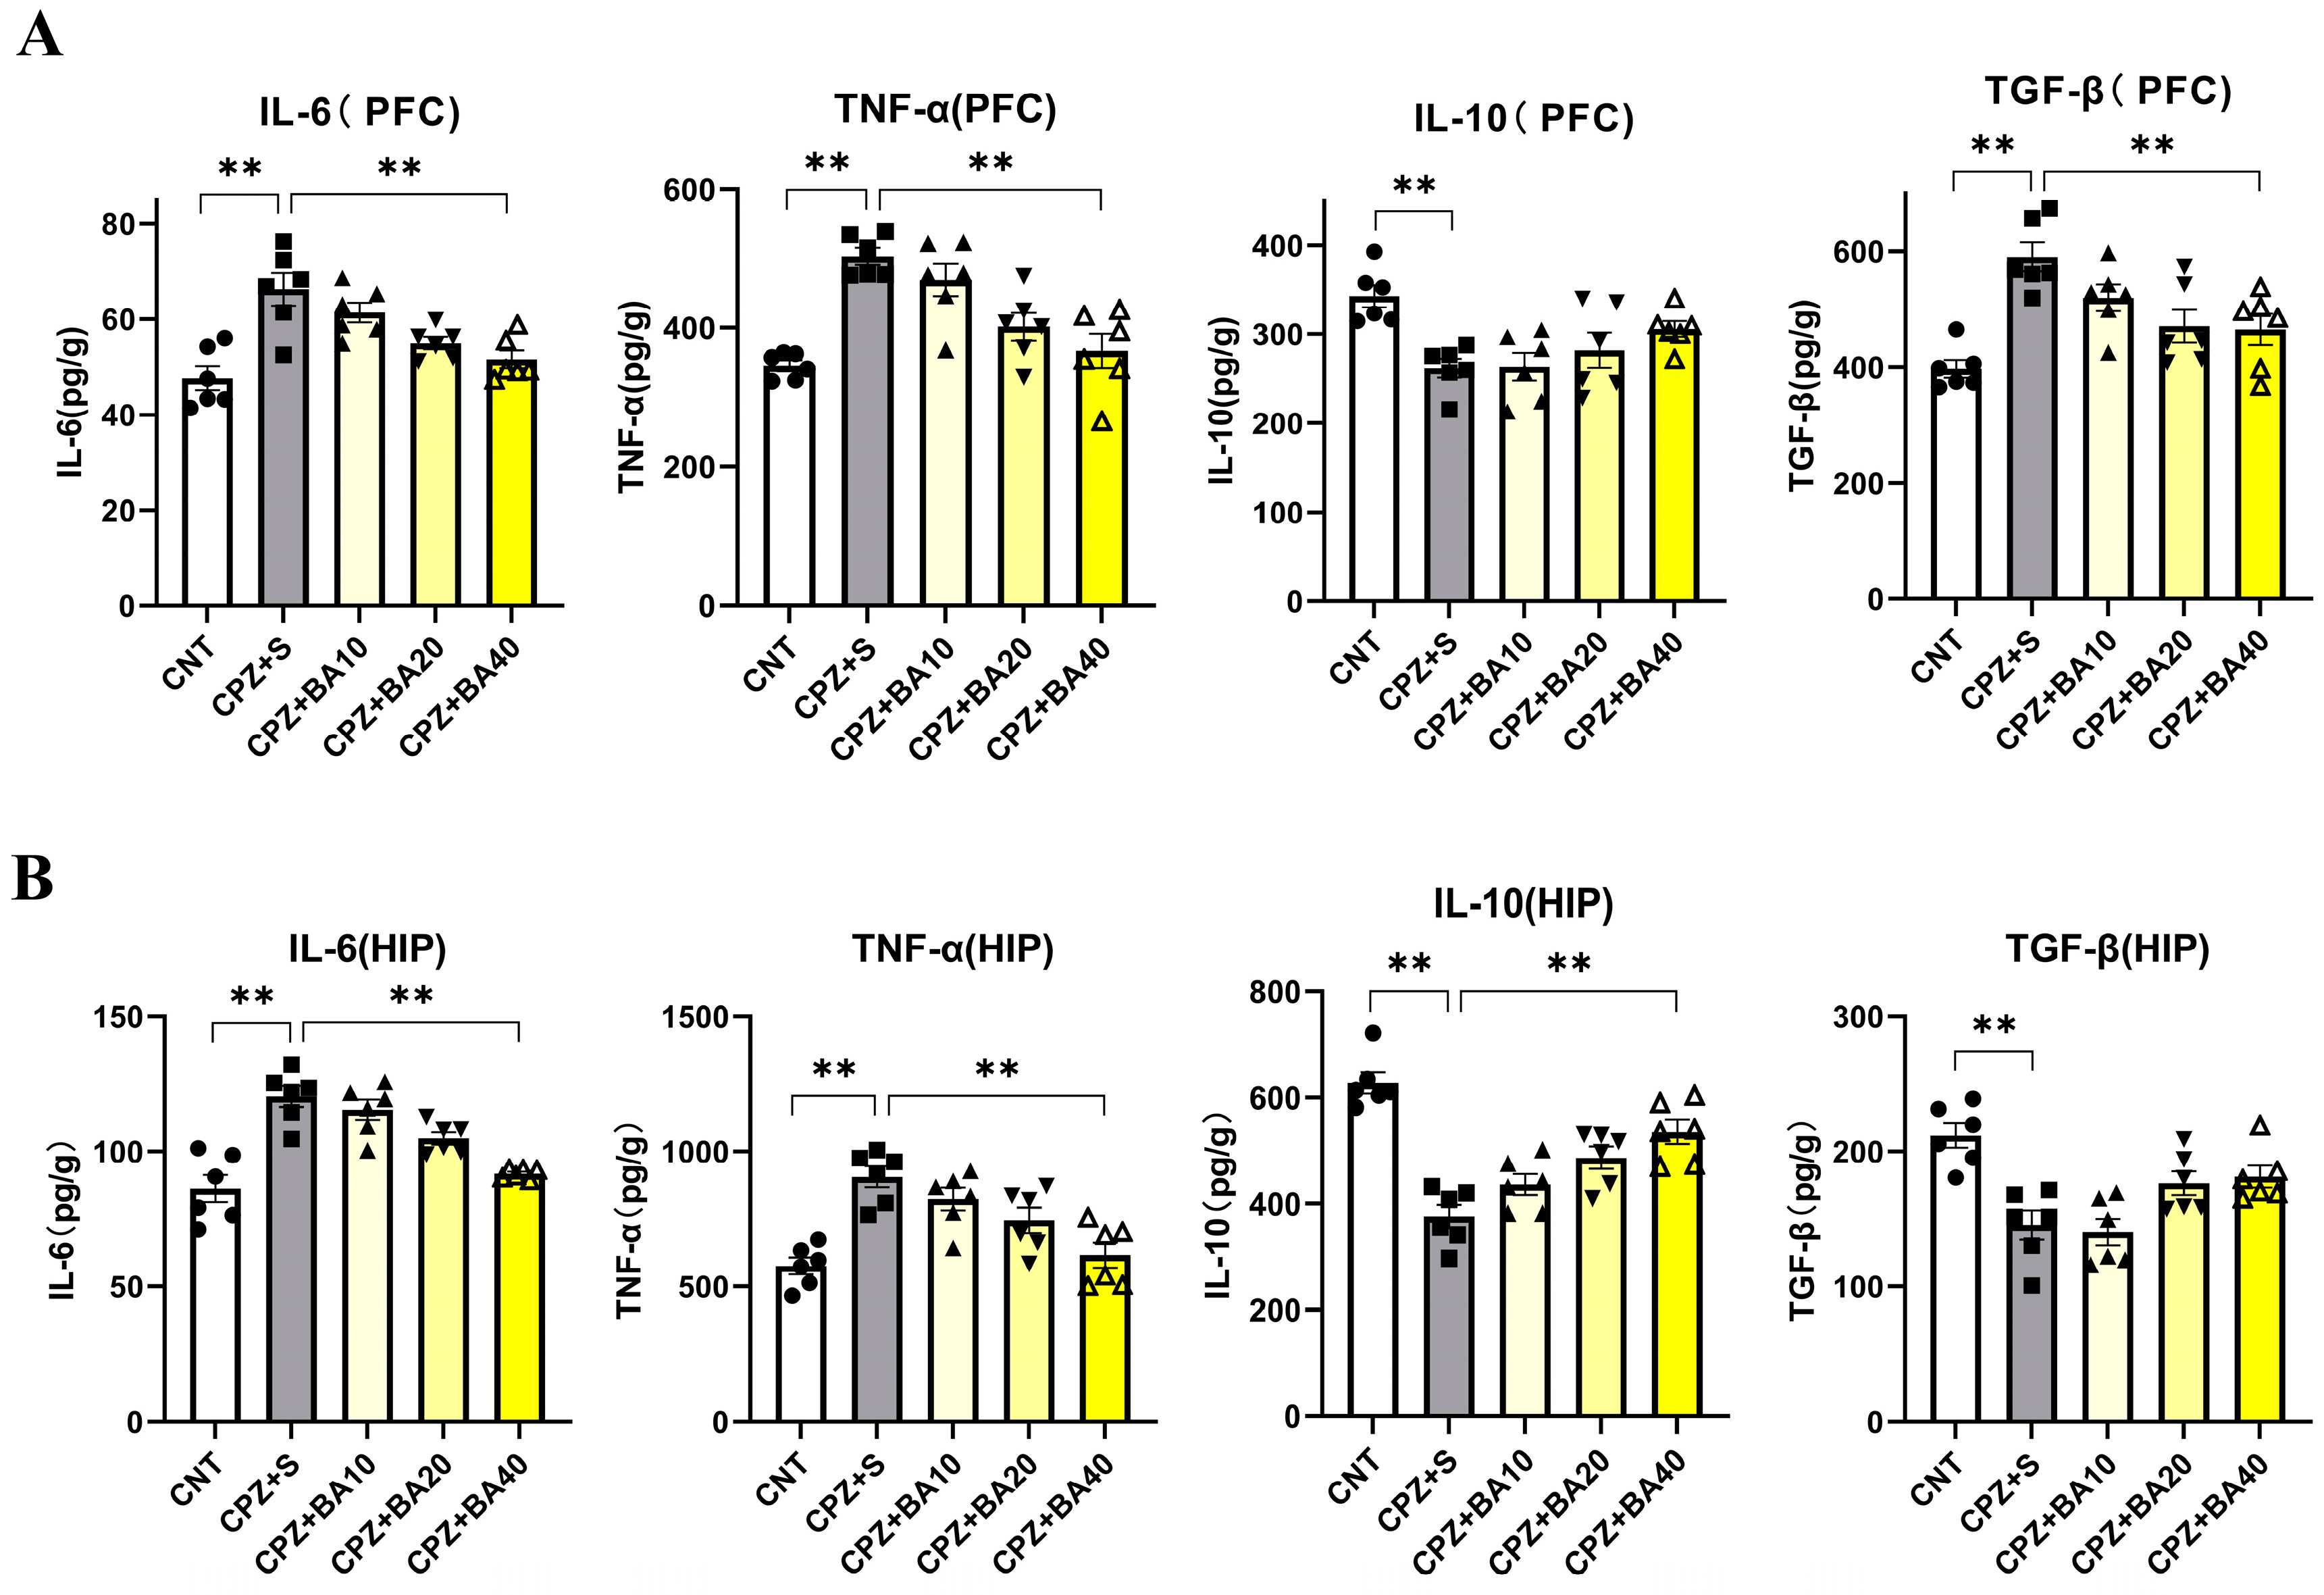
Figure 5.
Baicalein facilitates the recovery of decreased mitochondrial respiratory chain complexes in HIP tissue of the CPZ-exposed mice. (A) Representative Western blot images of mitochondrial respiratory chain complexes CII-CV and quantitative analysis of them in the HIP (n = 3-7). (B) Representative Western blot images of the NAT8L protein the HIP and PFC regions and the quantitative analysis of NAT8L in the two brain regions (n = 4). *p < 0.05, data are presented as mean ± SEM.
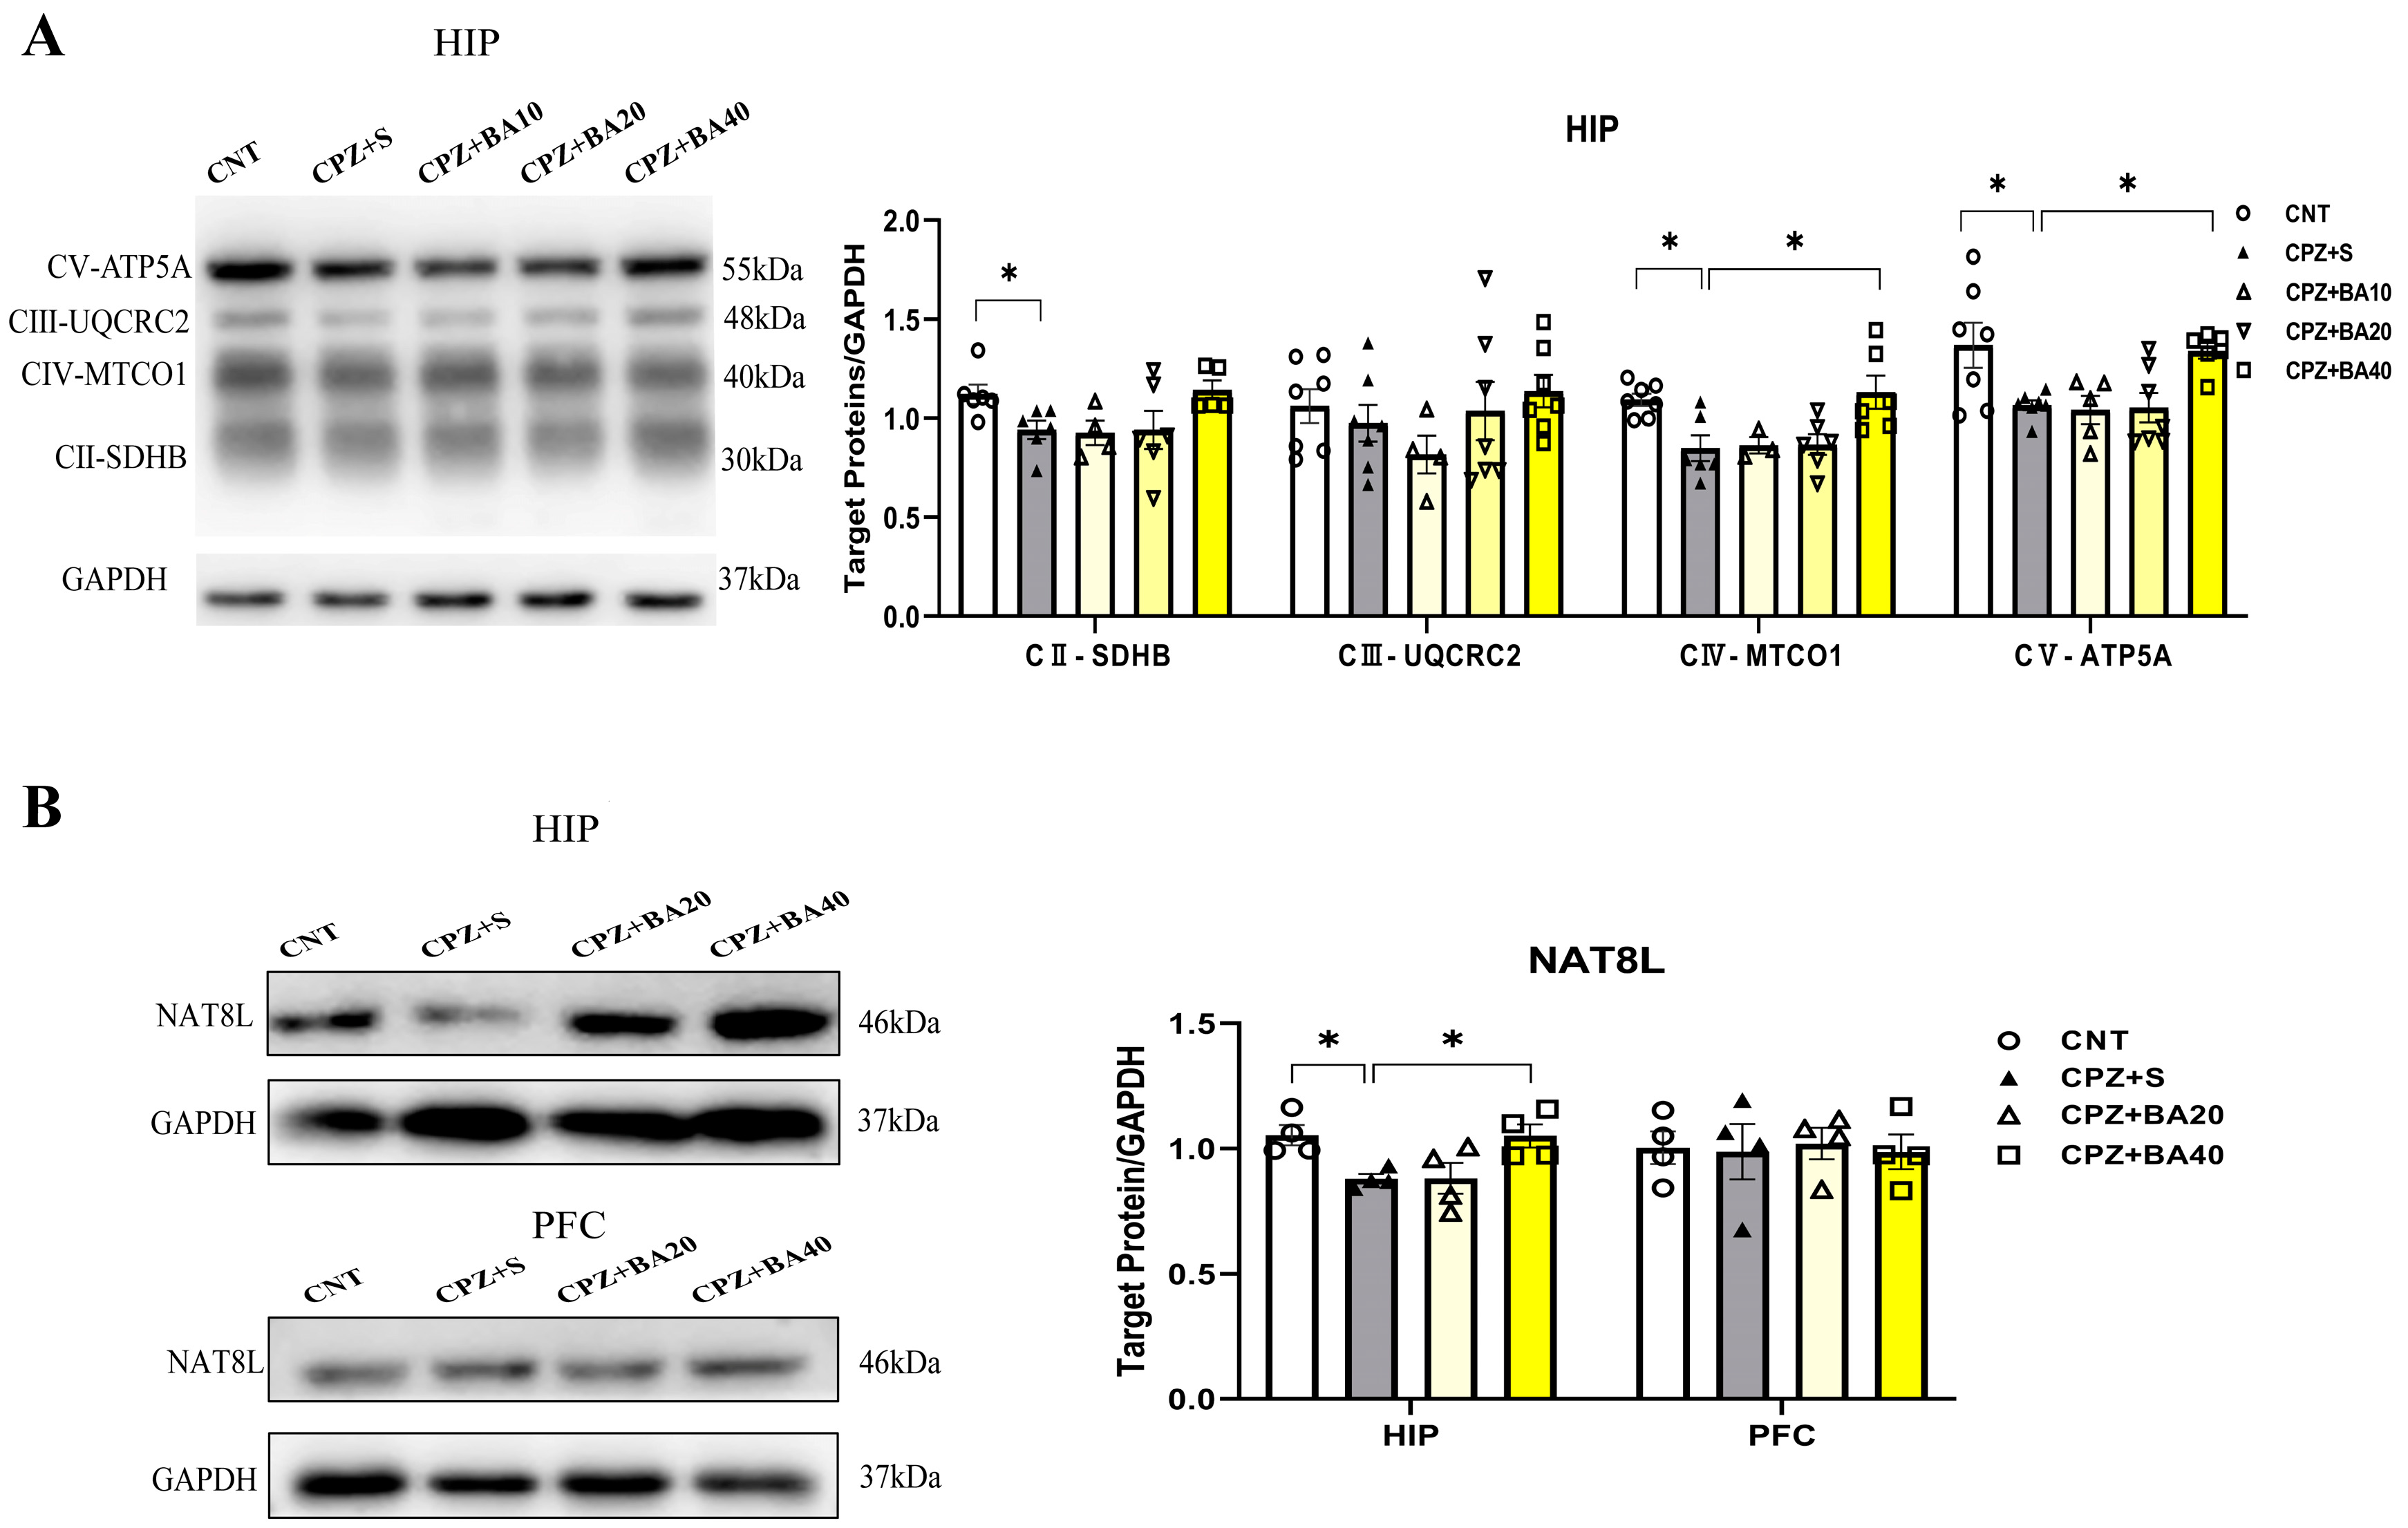
Figure 6.
Baicalein facilitates the recovery of the CPZ-induced changes in the NRF2 pathway proteins in HIP of Mice. (A) The bar chart showing the quantitative analysis results of the NRF2 levels in all mice of the five groups (n = 6/group). (B) The bar chart showing the quantitative analysis results of the HO-1 levels (n = 6/group). (C) The bar chart showing the quantitative analysis results of the NQO1 levels (n = 6/group). (D) The bar chart showing the quantitative analysis results of the SOD2 levels (n = 6/group). *p < 0.05, **p < 0.01. Data are presented as mean ± SEM.
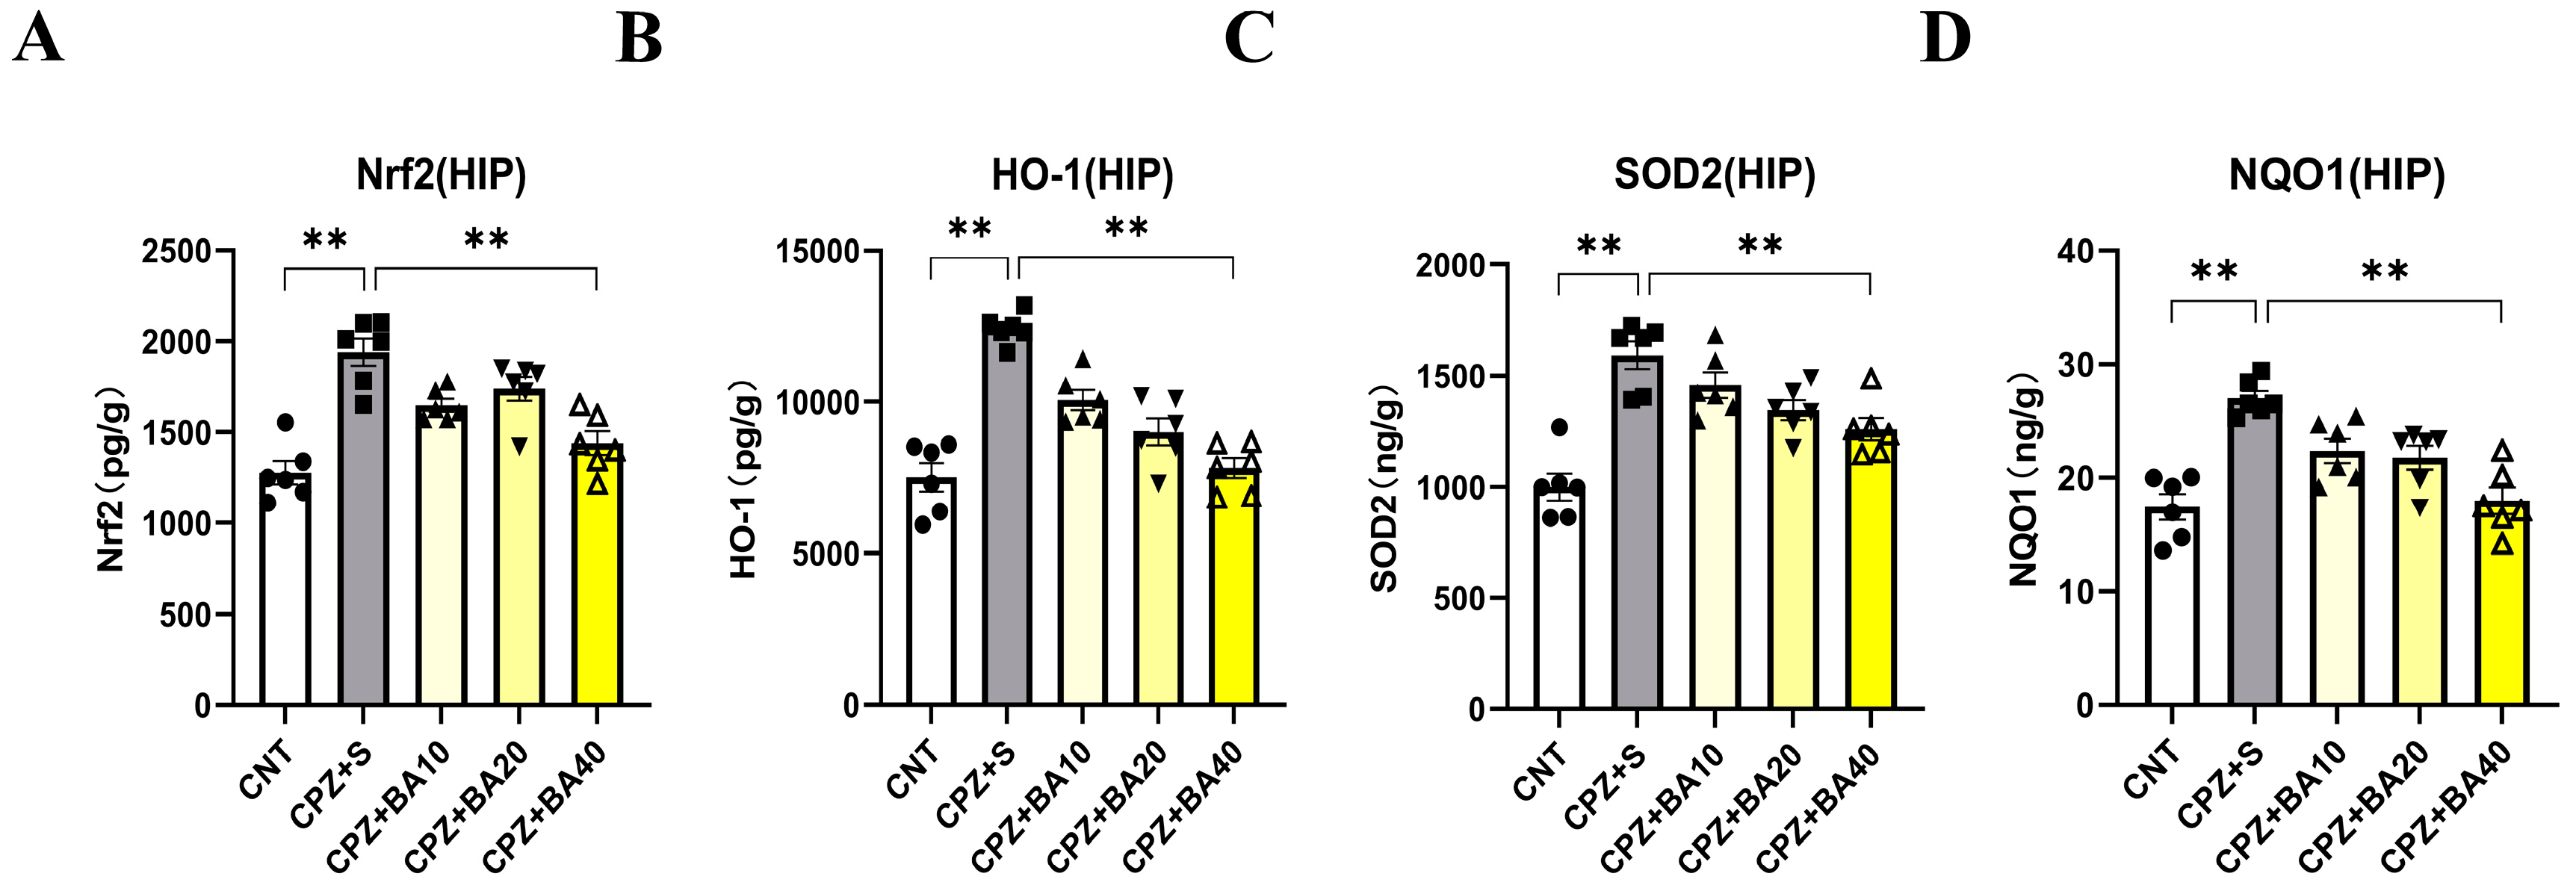
Figure 7.
Baicalein blocks the inhibitory effects of CPZ on the viability and development of cultured OL lineage cells. (A) CPZ inhibits the viability of cultured OPCs in a dose-dependent manner. (B) BA (40 µM) blocks the inhibitory effect of CPZ on the viability of cultured OPCs. (C) Representative immunofluorescence staining images of Olig2+ cells cultured under three conditions. (D) Representative immunofluorescence staining images of the cells expressing both APC (red) and Olig4 under three conditions, while cell nuclei were labeled by DAPI (blue). *p < 0.05, **p < 0.01. Data are presented as mean ± SEM.
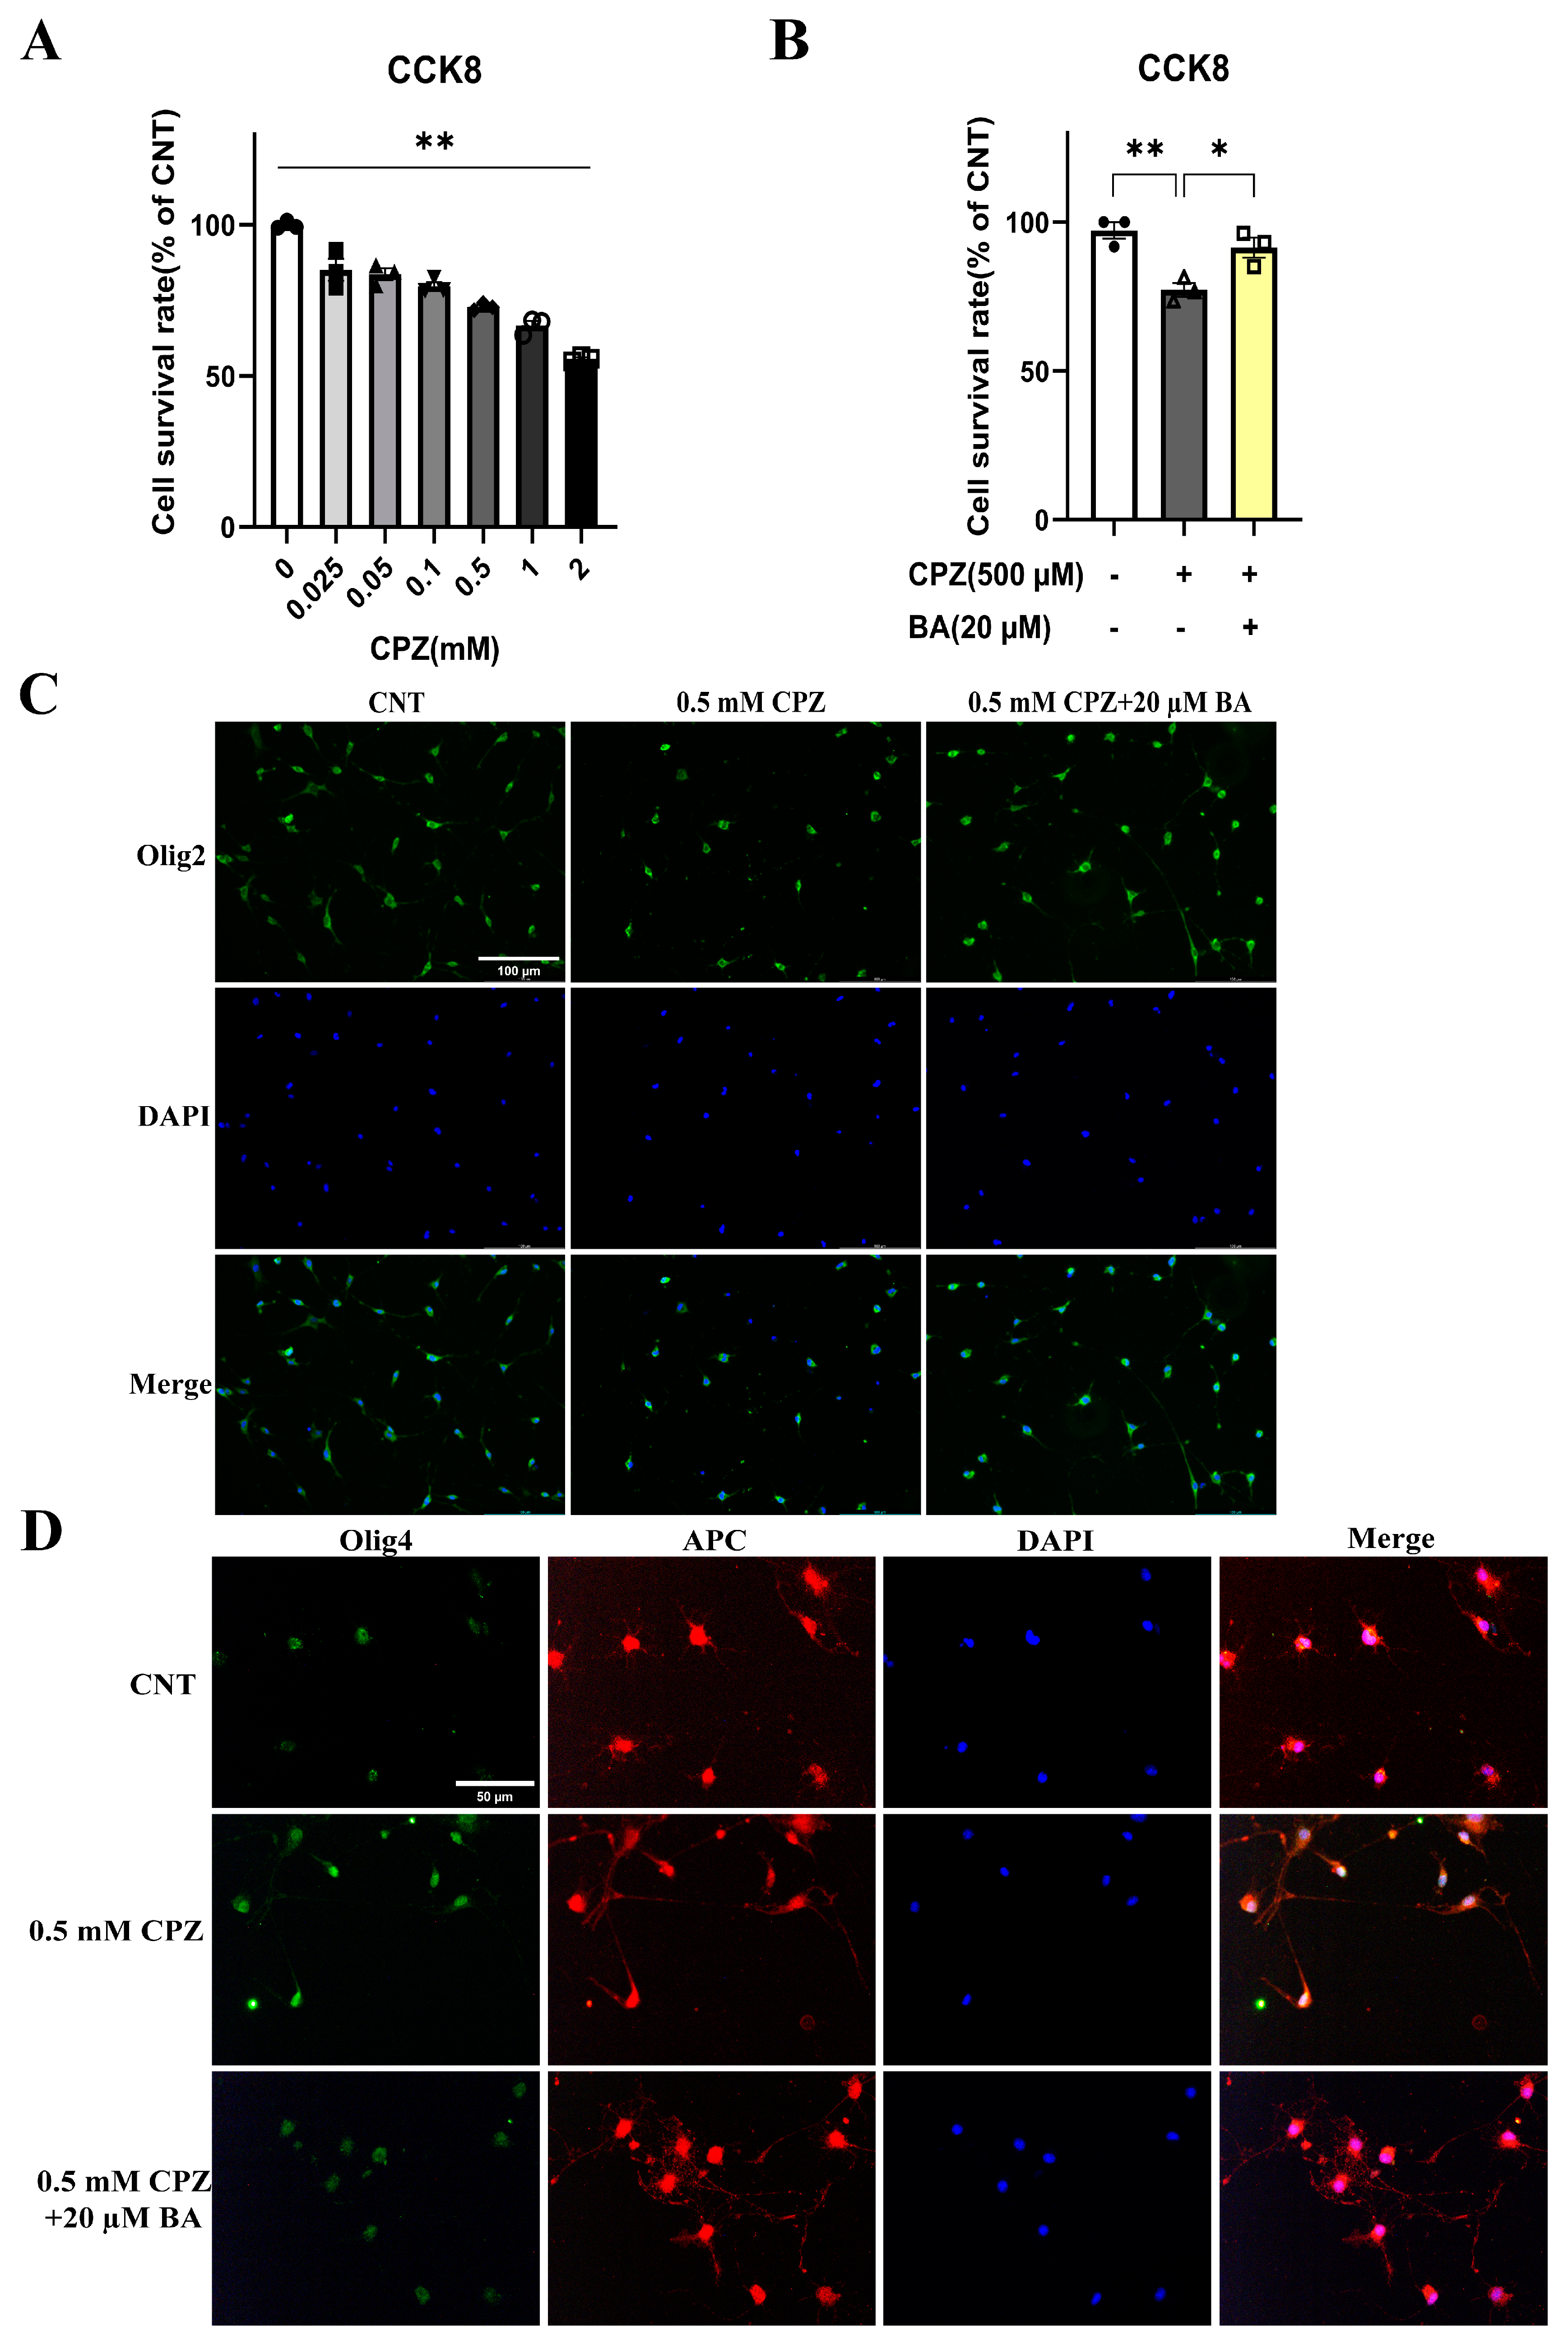
Figure 8.
Baicalein prevents cultured OLs from the CPZ-induced mitochondrial membrane potential decrease and blocks the inhibitory effect of H2O2 on viability of OLN-93 cells by decreasing the production of ROS in the H2O2-treated cells. (A) JC-1 staining results show that BA prevents cultured OLs from the CPZ-induced mitochondrial membrane potential decrease. (B) H2O2 decreases the viability of OLN-93 cells in a dose-dependent manner. (C) BA prevents OLN-93 cells from H2O2-induced viability decrease. (D) Representative ROS fluorescence images of OLN-93 cells cultured under three conditions. (E) Quantitative analysis of ROS fluorescence intensity in OLN-93 cells cultured under three conditions. *p < 0.05, **p < 0.01. Data are presented as mean ± SEM..
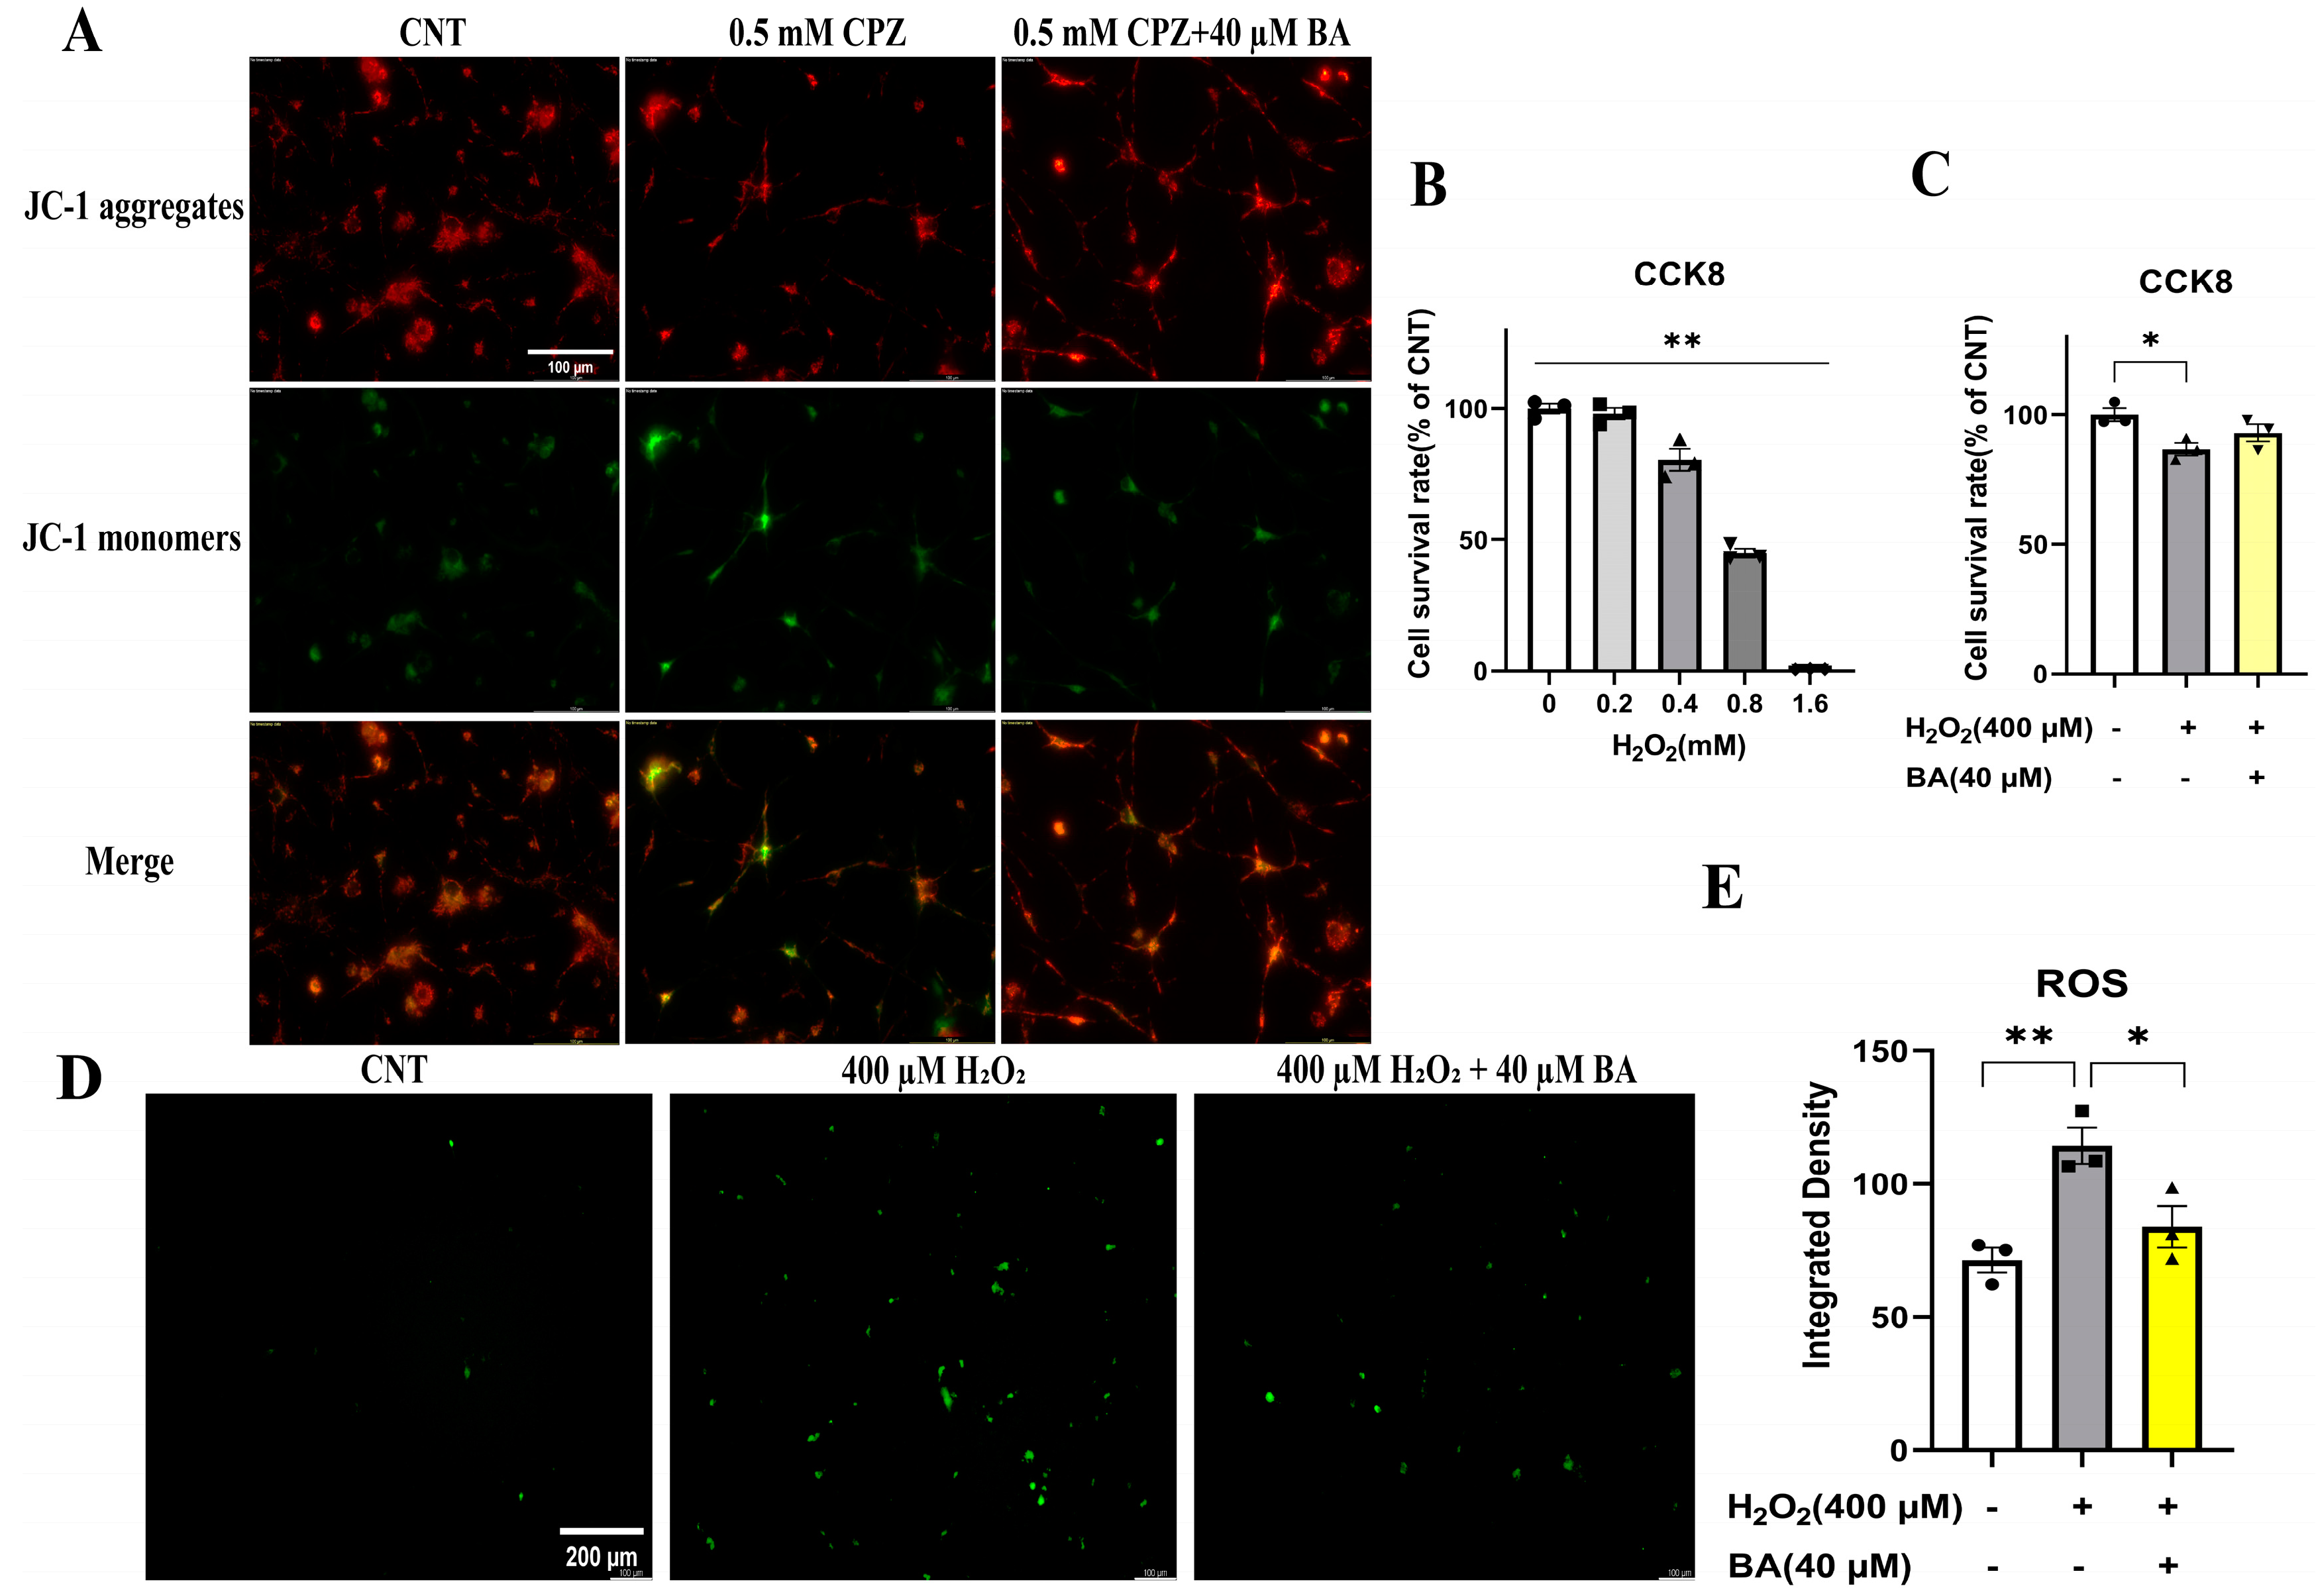
Disclaimer/Publisher’s Note: The statements, opinions and data contained in all publications are solely those of the individual author(s) and contributor(s) and not of MDPI and/or the editor(s). MDPI and/or the editor(s) disclaim responsibility for any injury to people or property resulting from any ideas, methods, instructions or products referred to in the content. |
© 2025 by the authors. Licensee MDPI, Basel, Switzerland. This article is an open access article distributed under the terms and conditions of the Creative Commons Attribution (CC BY) license (http://creativecommons.org/licenses/by/4.0/).
Copyright: This open access article is published under a Creative Commons CC BY 4.0 license, which permit the free download, distribution, and reuse, provided that the author and preprint are cited in any reuse.


