Submitted:
14 April 2025
Posted:
15 April 2025
You are already at the latest version
Abstract
The use of agrochemicals in agriculture is common around the world as it allows for increased crop production. However, they also contain heavy metals such as copper and nickel, which can leach into the drinking water and harm the environment and human health. As such, it is important to remediate them from drinking water. One way to do so is via adsorption using biosorbents. This study aimed to synthesize and characterize environmentally friendly hydrogels from sodium alginate and pomegranate peel. The effect of organic vs commercial pomegranate peel was also tested. Moreover, the gel’s ability to remediate copper and nickel from contaminated water was tested. The gels were characterized using FTIR, SEM and water uptake tests. These results were promising as FTIR showed that the expected functional groups were present, SEM showed that incorporating organic pomegranate peel enhanced the roughness and porosity of the gels, and gels with organic pomegranate peel incorporations were able to take up 1.58x more water than sodium alginate only gels. Moreover, the effect of contact time, pH and adsorbent amount was tested for copper and showed that the optimal contact time was 60 minutes, the optimal pH was ~5, and increasing adsorbent amount decreases adsorption. The effect of contact time was tested for nickel and showed that the optimal contact time was 5 minutes. Overall, these hydrogels show promising results for the remediation of copper and nickel from contaminated water.
Keywords:
water remediation
; adsorption
; pomegranate peel
1. Introduction
1.1. Agrochemicals in Sri Lanka
Agrochemicals can be defined as chemicals used in agriculture [1]. They include fertilizers and pesticides, both of which are common in agriculture to improve crop yields [1]. This is important as it is beneficial for the economy and can prevent food insecurity [1]. This is because fertilizers contains essential nutrients for growth such as nitrogen and phosphorous, while pesticides contain chemicals that prevents attacks from herbs (herbicides), insects (insecticides) and fungi (fungicides) [1]. In fact, without pesticides, food production across all sectors would decrease. For example, fruit production would decrease by 78% due to attacks from pests [1].
The use of agrochemicals is particularly common in Global South countries such as Sri Lanka since the economy relies heavily on these crops and there are less strict regulations surrounding their use [1,2]. Within Sri Lanka, various agrochemicals are used based on the types of crops grown in specific regions and their needs [2]. For example, there are two vegetable growing areas, upcountry and low country [2]. In the upcountry areas, the primary crops cultivated include beans, potato and tomato, while in the low country areas, the crops grown include rice, maize and green gram [2]. As such, both areas uses slightly different agrochemicals [2]. For example, in upcountry areas, pesticides such as metribuzin (herbicide), thiram (fungicide) and carbosulfan (insecticide) are used, while in the low country areas, pesticides such as 4-chloro-2-mehtylphenoxyacetic acid (MCPA) (herbicide), metribuzin and carbosulfan are used [2].
1.2. Heavy Metals in Agrochemicals and Their Effects on Human Health
Heavy metals are typically defined as elements with metallic properties that is 5 times as dense as water and are toxic to human health [3]. However, this does not encompass the many elements that are less than 5 times denser than water and are also toxic to the environment and human health, such as aluminum [3]. As such, heavy metals will be defined as metals that are toxic to the environment and human health for the purposes of this paper.
While agrochemicals contain essential nutrients to aid in crop productivity and chemicals to prevent attacks from herbs, pests, and fungi, many of them contain heavy metals and are hazardous to human health as a result [4]. For example, it has been shown that metribuzin, a herbicide, contains cadmium (Cd), aluminum (Al), manganese (Mn), lead (Pb), copper (Cu), cobalt (Co), nickel (Ni), chromium (Cr), iron (Fe) and zinc (Zn).4 This pesticide is a phenoxyacid pesticide that is primarily used for cereal and grain crops [4]. Another herbicide, MCPA also contains similar heavy metals, including mercury (Hg), cadmium (Cd), zinc (Zn), arsenic (As), cobalt (Co), iron (Fe), copper (Cu), chromium (Cr) and palladium (Pd) [5]. This is a triazine pesticide and is primarily used for vegetable crops [5]. Both pesticides are classified as class II, meaning they moderately hazardous according to the world health organization (WHO) [6]. The heavy metals can either be intentionally incorporated into agrochemicals to increase their efficiency, or get into the formulation due to contamination of the source material [1,4].
The heavy metals from these agrochemicals and many others that are commonly used in Sri Lanka and other Global South countries can affect human health in many ways [7]. They can bioaccumulate in the crops grown, and leach into surface drinking water through runoffs when there is rainfall [7]. As such, when humans eat these contaminated crops or drink the contaminated water, they are exposed to the heavy metals present, which leads to chronic exposure in humans overtime [3,7]. This can cause a variety of adverse health effects [8]. For example, chromium has been shown to cause damage to deoxyribonucleic acid (DNA) via interference with base pair stacking [8]. Another example is arsenic, which can lead to adverse effects such as chronic kidney disease of an unknown etiology (CKDu) and cancer of multiple organs including the kidney and bladder [3]. Exposure to heavy metals is particularly prevalent in Sri Lanka [9]. For example, the concentration of arsenic in groundwater, which is the primary drinking water source for many, is much higher than the 10 μg/L deemed safe by the WHO [9]. For example, it is up to 43.8 μg/L in the Mannar region [9].
1.3. Copper and Nickel as Heavy Metals
Copper is a metal that is vital for plants as it aids in the prevention of many diseases such as Grape downy mildew [10]. As such, it has been incorporated into agrochemicals such as pesticides for over 160 years [10]. It is still being incorporated into these agrochemicals today [10]. Copper is also essential in trace amounts for many physiological processes in humans such as energy production and aiding in the reduction of oxidative stress [9,10]. However, in excess amounts, it has been shown to lead to conditions such as Alzheimer’s Disease (AD) [10]. Similarly, nickel is important for plant growth and development, such as seed germination, so it can be incorporated into agrochemicals [11]. However, it is toxic to plants at increased concentrations [11]. It is also toxic to humans at high concentrations and may lead to lung fibrosis and even cancer [11]. As such, removing these contaminants from contaminated water is important to prevent these long-term effects.
1.4. Removal of Heavy Metals from Contaminated Water
There are several methods for removal of pollutants such as heavy metals from contaminated water [12]. These include adsorption, membrane, chemical, electric and photocatalytic based removal systems [12]. These systems all have various advantages and disadvantages [12]. For example, a chemical method known as the sulfide precipitation method which works by precipitating the heavy metal using sulfide, has a high removal efficiency, but it also produces hydrogen sulfide gas, which is toxic [12]. Of all the methods listed, adsorption one of the leading methods being researched [12]. Adsorption is a removal technique in which contaminated water passes through a nanoporous adsorbent which traps contaminants due to its high surface area and porosity [12]. It is cost-effective, has a high removal capacity and is easy to implement [12]. However, it can also have disadvantages depending on the type of adsorbent used [13]. For instance, the stability and material degradation of many adsorbents remain low, which means that wastewater conditions are harsh for them to survive as they cannot maintain their structure, function and performance [13]. Another limitation is that for many adsorbents, the ability to be recovered from wastewater and be reused for multiple rounds of adsorption is limited [13]. This is because water would need to be treated many more times (due to the increasing concentrations and complexity of pollutants) than the maximum recovery and reusability capacity of the adsorbent [13].
1.4.1. Biosorbents
Currently, there is a variety of adsorbents that can be used for wastewater remediation [12,13]. These include carbon based ones such as activated carbon, which has been used since the early 20th century [13]. However, its efficiency has decreased overtime given the increased complexity of wastewater pollutants [13]. It is also expensive, and not eco-friendly since it can produce secondary pollution in high temperatures, and hazardous waste products from its production process [14]. As such, it is important to develop adsorbents that are both efficient at removing contaminants and environmentally friendly so the adsorbent does not become a pollutant itself. It is also imperative that the materials used for adsorbent synthesis are readily available in Global South countries since heavy metal contamination is more prevalent there [7].
With that, biosorbents are currently being researched as a more environmentally friendly alternatives to synthetic ones [12]. Biosorbents have been shown to be more efficient as they contain a variety of functional groups such as carboxylic acid and hydroxyl groups on their surface, which allows for higher efficiency than traditional adsorbents [12]. This also allows for multiple types of interactions to occur, further increasing the efficiency of biosorbents [12]. These include electrostatic, aggregation, ion exchange and oxidation/reduction interactions [12]. These biosorbents also tend to have greater stability and material degradation, and increased recovery and reusability, both achieved by chemical modification [13]. In addition, they have been shown to remove a multitude of contaminants such as heavy metals and dyes [12]. Hydrogels as adsorbents have been gaining more attention recently as an alternative to traditional ones [15].
1.5. Hydrogels as Adsorbents for Heavy Metals and More
Hydrogels are three-dimensional polymer networks that are crosslinked and contains water [15]. They are jelly-like beads with a very rough and porous surface [15]. They can maintain their structural stability while holding on to a large quantity of water, and are hydrophilic [15]. As such, they are ideal candidates to remove pollutants from contaminated water [15]. Currently, there are several types of hydrogels, with the ability to remove various types of pollutants from contaminated water [16]. These include lignin based hydrogels, which has been effective at removing Pb2+, Cr3+ and Cu2+ from contaminated water via hydrogen bonding, electrostatic interactions and more [16]. It is advantageous as it is cost effective and has versatile functional groups, enhancing adsorption, but has low mechanical strength [16]. Nonetheless, the adsorption capacities for Pb2+, Cr3+ and Cu2+ were 308, 65.72 and 541 mg/g, respectively [16]. Graphene oxide-based gels are another type, which has been shown to remove methylene blue and rhodamine B dyes via van der Waals forces, hydrogen bonding and more [16]. The adsorption capacities here were 324 mg/g and 114.4 mg/g for methylene blue and rhodamine B, respectively [16]. It is thermostable but is unfortunately costly [16]. There are also chitosan and polyvinyl/ chitosan-based hydrogels, which have been shown to remove Cd2+ at an adsorption capacity of 80-150 mg/g and Mn2+ at 10.5mg/g, respectively, via ion exchange and complexation [16]. They are both biodegradable but have limited mechanical strength [16]. Other types of hydrogels include aluminum hydroxide polyhydrate, Kappa carrageenan, titanium dioxide and carboxymethyl cellulose based ones, to name a few [16]. These have all shown varying capacities to adsorb heavy metals such as Cu2+, Zn2+, Cr6+, Ni2+, and Pb2+ and dyes such as brilliant green and methylene blue [16]. Overall, hydrogels can be synthesized from a variety of materials, and display a wide range of adsorbates [16].
1.6. Synthesis of Hydrogels via Crosslinking
There are many methods that can be used to synthesize hydrogels such as crosslinking [17]. Crosslinking is a method used to hold polymer chains together thus forming stable structures [18]. These include physical crosslinking which is reversible and entails formation through interconnecting non-covalent bonds such as hydrogen bonding and electrostatic interactions [18,19] Examples of this includes ionic exchange and macromolecular electrostatic crosslinking [17,19]. This method is advantageous for many reasons such the mild conditions required and low toxicity options for crosslinkers such as Ca2+ [19,20]. It is also has disadvantages for several reasons such as needing additional crosslinking in some cases [20]. There is also chemical crosslinking in which the hydrogels are formed through irreversible covalent bonds between the monomers/polymers of the hydrogel itself [17,19]. Examples of this include photo-induced and enzymatic crosslinking [18,20]. This method is advantageous as it offers more stability than physical crosslinking, but is disadvantageous as it can be expensive [20].
With that, physical crosslinking, more specifically crosslinking via ionic crosslinking, is the most common. [19] It relies on the electrostatic interactions between a polymer chain backbone that has a specific charge and its attraction to an ion of the opposite charge [20,21]. This interaction forms ionotropic hydrogels, which are insoluble [20]. Ionic crosslinking is inexpensive, simple and uses mild conditions [19]. There are also many crosslinking agents that can be used, but Ca2+ is the most common since it is relatively cheap and has low toxicity [19]. Typically, a solution of precursors would be prepared by dissolving raw material in a solvent such as water [20]. This solution is then dropped into a solution of crosslinker, for example calcium chloride to form the hydrogel beads and left to stabilize [20]. The beads are then isolated and dried, producing the final hydrogel [20].
1.6.1. Alginate Based Hydrogels
Alginate is a commonly used biopolymer in many industries as it is biodegradable, biocompatible and non-toxic [20,22]. It can be extracted from the cell wall and intercellular mucilage of marine brown algae or certain bacteria like Pseudomonas aeruginosa [17,19,23]. It is primarily found in the salt form of sodium alginate [20]. Its monomer unit is made of α-L-mannuronic acid (M-block) and β-D-glucuronic acid (G-block) [18]. As such, there are various ratios of MM, GG and GM units, brought together by 1,4-glycosidic linkages [18]. The varying ratios depend on multiple factors including the source (brown algae vs bacteria), seasons and location [18]. In addition, the ratio of M to G units affects its properties [18]. The M unit is linear and soft, allowing for flexibility, while the G unit is sturdy and increases its strength [18]. Alginate consists of hydroxyl and carboxyl groups that can use mechanisms such as ion exchange and complexing to remove various heavy metals such as copper and nickel [24]. It is also important to note that seaweed is abundant is Sri Lanka and is being increasingly recognized for its beneficial properties such as bioactive components [25]. Hence, it is accessible for use in Sri Lanka, and can be utilized for heavy metal removal there.
Alginate based hydrogels are formed using the ionic crosslinking mechanism [18]. It has an abundance of carboxyl and hydroxyl groups [18]. The type of ion used for crosslinking is important here as formation occurs through different mechanisms [18]. Monovalent cations such as Li+ causes protonation of the carboxyl groups [16]. As such, when the pH of alginate is lower than its pKa, gelation occurs as the alginate is protonated and contains intermolecular entanglement and hydrogen bonding [18]. On the other hand, divalent cations such as Ca2+ are able to coordinate more than monovalent ions [18]. So, they induce gelation by forming an ”egg-box” structure when they bind to G units of alginate [18,20].
Furthermore, there are two ways for crosslinking to occur: an internal gelation method and an external gelation method [20]. The internal gelation method consists of adding a metal ion solution to the alginate solution [20]. This way, the hydrogel is formed by the metal ions slowly diffusing outwards [20]. This method offers gelation at specific sites, but it produces high internal density and a non-homogenous structure [20]. External gelation on the other hand involves formation of hydrogels by the ions moving from the outside to the inside [18]. This method offers instant gelation, but the density of the internal crosslinking is uneven [20].
1.7. Pomegranate Peel as a Heavy Metal Adsorbent
While alginate can be used for hydrogel synthesis, there are also some drawbacks [20]. When it is crosslinked by cations, the gels produced tend to have decreased mechanical strength and stability, and usually degrade easily [20]. However, these issues can be solved by incorporating bioactive reagents which increases their function and other properties such as mechanical strength [20]. One such bioactive compound is pomegranate peel (Punica granatum L.) [26]. Thirty to forty percent of a pomegranate is comprised of its peel, which is often discarded [26]. As such, pomegranate peel is abundant and cheap [26]. It contains many compounds such as cellulose/hemicellulose, pectin, and lignin and thus also contains functional groups from these compounds such as hydroxyl, carboxyl and carbonyl groups [26]. Given that, it can be used to remove heavy metal contaminants from polluted water [26]. Previously, pomegranate peel based activated carbon was shown to effectively remove heavy metals such as Cu2+, Ni2+, Cd2+, Zn2+ and Cr4+, dyes such as direct blue 106, and other organic contaminants such as 2.4-dichlorophenol (2,4-DCP) from aqueous solutions [27]. Typically, pomegranate peel is functionalized with various metal ions such as Zirconium (IV) to improve its stability before being used as an adsorbent [26]. Zirconium improves its stability and efficiency by chelating with pectic acid— a component of pomegranate peel [26]. Pomegranate peel can also be incorporated into hydrogels to increase its efficiency and stability [22]. Abbaz et al (2023) previously demonstrated enhanced adsorption efficiency and removal rates of up to 30.679 mg/g for safranin-O when raw pomegranate peel was incorporated into sodium alginate hydrogels synthesized via ionic crosslinking with Ca2+ [22]. Another study done by Wang and Zhang showed that sodium alginate-pomegranate peel hydrogels (SA-PP-H) synthesized by ionic crosslinking with Ca2+ was successful in removing cyanobacterial blooms up to 84.96% [28]. In addition, the production process of this type of gel remains green as it requires mild pH and temperature conditions and non-toxic, environmentally friendly reagents [22]. With this, and given that pomegranate peel has been successful in heavy metal removal, it is plausible that SA-PP-H would be able to remove heavy metals from contaminated water. It should also be noted that the peel obtained could be from either organic pomegranates or commercial sources. However, organic pomegranates have been shown to be superior in quality as it has been sure to contain more biomolecules such as tannins, thus its peel would also likely be superior for hydrogel synthesis and function by increasing the number of functional groups present for adsorption [29].
1.8. Flame Atomic Absorption Spectroscopy (FAAS)
Flame atomic absorption spectroscopy is a common analytical technique used for measuring the concentration of trace elements (<100 parts per million (ppm)) [30]. It is a simple, sensitive and cheap technique for analyzing metal concentrations such as copper and zinc [30]. Essentially, a sample is atomized by a flame, which then absorbs light in amounts proportional to its concentration [31]. The flame in most cases is air-acetylene, which heats up to approximately 2300oC [31]. The absorbed light is at a wavelength specific to the analyte of interest [28]. The light source is typically a hollow cathode lamp where the analyte of interest coats the cathode [31]. Finally, the amount of light absorbed is detected and reported as an absorbance. In a typical setup, a standard curve of concentration vs absorbance would be made from solutions that contains the analyte of interest at known concentrations [31]. From this, the concentration of any sample with concentrations that fall within its linear range can be determined using the equation of the line of best fit from the standard curve [31]. Advantages of this technique as compared to other methods of detection include its simplicity, its sensitivity and how rapid it is [31]. A disadvantage, however, is that only one analyte can be detected at a time, though there have been improvements overtime with this [31]. With that, FAAS can be used to detect trace levels of copper and nickel [31]. In this case, the wavelength of interest would be 324.8nm and 231.9nm for copper and nickel, respectively [32,33].
1.9. Project Aims
The primary aim of this study is to synthesize an environmentally friendly hydrogel from sodium alginate with a pomegranate peel powder incorporation for increased efficiency (SA-PP-H). The synthesis procedure is modified from Abbaz et al, 2023 [22]. Another aim to characterize this hydrogel via Fourier-Transform Infrared Spectroscopy (FTIR), Scanning Electron Microscopy (SEM), diameter size, and water uptake capacity tests. In addition, a comparison of the hydrogels synthesized from commercial pomegranate peel vs organic pomegranate peel via FTIR and water uptake tests will be carried out. Finally, various copper and nickel adsorption tests will be carried out with the SA-PP-H (org). These tests include the effect of contact time, hydrogel amount, and initial pH for copper and the effect of contact time for nickel. FAAS will be used to quantify the concentration of copper and nickel, and three trials will be conducted for every adsorption test. The results of this study will allow future CHMD90 students to conduct further heavy metal testing with copper and nickel such as the effect of temperature and explore other metals such as Zinc.
2. Materials and Methods
2.1. Materials and Reagents
Organic pomegranates were purchased from Chalo Freshco (2650 Lawrence Avenue East, Scarborough ON, M1P 2S1), 100% Pomegranate peel powder from the brand Mi Nature was purchased from Amazon, Sodium Alginate (CAS-No: 9005-38-3) was purchased from SigmaAldrich, Calcium Chloride Dihydrate, ACS grade (CAS No: 10035-04-8), 99.0-105.0% was purchased from Alfa Aesar, TraceMetal Grade Nitric Acid (CAS No: 7697-37-2) was purchased from Fisher Chemicals, Cupric Nitrate Trihydrate (CAS No: 19004-19-4) was purchased from VWR BDH Chemicals, Sodium Hydroxide (NaOH) (CAS No 1310-73-2) was purchased from ACP Chemicals. RO/DI water and MilliQ water was used throughout.
Sodium alginate was in the form of a white, odourless powder. Commercial pomegranate peel powder was a dark, odourless powder. Organic pomegranate peel powder was a lighter brown, odourless powder.
2.2. Preparation of Organic Pomegranate Peel Powder (PPP)
To start, pomegranates were peeled, and the peels were rinsed with distilled water, and left overnight to airdry. After, it was oven dried at 60oC overnight then ground to a powder using a blender. The powder was then sieved through a 100-mesh sieve (PATIKIL, nylon and polypropylene) to get it to a fine powder. The powder was stored in 20mL vials at -20oC for future use.
2.3. Synthesis of Sodium Alginate- Organic Pomegranate Peel Hydrogels (SA-PP-H (org))
The procedure for this synthesis was modified from Abbaz et al. (2023). To start, a 3% w/v sodium alginate solution was stirred and heated at 50oC for 1 hour. Pomegranate peel powder was added to this solution to a final concentration of 3% w/v organic pomegranate peel powder and stirred until a homogenous dispersion was observed. This solution was then dropped into a 4% w/v CaCl2 solution using a Fisherbrand 5mL plastic syringe (Luer-Lock sterile, 3 parts) and left overnight to stabilize. The beads were then subsequently washed three times with DI water to remove any excess CaCl2 and isolated via vacuum filtration. They were then oven dried at 60oC for approximately 24 hours and stored in 20mL scintillation vials at -20oC for future use. To compare the use of commercial pomegranate peel powder vs organic, this procedure was repeated using commercial pomegranate peel powder from Amazon (SA-PP-H (com)). As a control, sodium alginate hydrogels (SA-H) were prepared using this procedure without the addition of pomegranate peel powder. This process is visualized in Figure 1 below.
2.4. Characterization
To characterize the hydrogels, various techniques were used, including Fourier-Transform Infrared Spectroscopy (FTIR), Scanning Electron Microscopy (SEM), diameter size, and water uptake capacity tests.
2.4.1. Fourier-Transform Infrared Spectroscopy (FTIR)
FTIR was used to visualize the functional groups present on various samples. The Bruker Alpha-P ATR FTIR (Diamond ATR) was used. SA-PP-H (org), SA-PP-H (com), SA-H, commercial pomegranate peel powder (PPP (com), and organic pomegranate peel powder (PPP (org)) were used for FTIR. The commercial PPP was oven dried at 60oC for 24h beforehand to get rid of any water that may be present. The hydrogel samples were crushed to a fine powder using a mortar and pestle beforehand. FTIR spectra were recreated in Excel for visual representations.
2.4.2. Scanning Electron Microscopy (SEM)
SEM imaging was used to visualize the surface and cross sections of hydrogels. For this, SA-H, SA-PP-H (org) and SA-PP-H (org) after copper adsorption were used. Before SEM, the beads were frozen at -20oC, and subsequently lyophilized (8 hour freezing, 20 hours drying). The beads were molted onto gold plates and visualized at 1.00mm, 50.0µm and 100 µm.
2.4.3. Diameter Size
The diameter of the SA-PP-H (org) and SA-H hydrogel beads when wet, after drying and after lyophilization was measured. To do this, ImageJ (Fiji, version 2.14.0/1.54f)— an image processing software was used. 24 beads were measured for each condition. Excel was used to create visual representations of the data obtained.
2.4.4. Water Uptake Capacity
To test the ability of the hydrogels to take up water, ~0.07g of SA-PP-H (org) were weighed out and added to 10mL of distilled water in a 20mL scintillation vial (WHAETON, borosilicate glass). After 1 hour, the beads were isolated via vacuum filtration, using water to remove any beads that were stuck in the vial. They were gently patted with a kimwipe to remove any excess water. The beads were then re-weighed. This process was repeated for the SA-PP-H (com) and the control SA-H. Three trials were conducted for each type of hydrogel. To calculate the percent water uptake, equation (1) was used. Here, mf represents the weight of the hydrogel beads after water uptake, and mi represents the mass of the dried hydrogel beads before water uptake.20 Excel was used to create visual representations of the data obtained.
2.4.5. Effect of Pomegranate Peel Concentration on Water Uptake Capacity
To test what concentration of pomegranate peel would be best for adsorption, hydrogels with different ratios of pomegranate peel to sodium alginate were synthesized using the procedure from 2.3. The ratios were 0.00, 0.50, 0.75, 1.00, 1.50 and 2.00. The water uptake capacity of these hydrogels was tested using the procedure outlined in 2.4.4 and the % water uptake was calculated using equation (1). It should be noted that these hydrogels were synthesized using commercial pomegranate peel. Excel was used to create visual representations of the data obtained.
2.5. Batch Adsorption Tests
To test the ability of the sodium alginate-pomegranate peel (organic) hydrogels to adsorb copper and nickel, batch adsorption tests were conducted. All beads were lyophilized before adsorption tests. For these tests, CuNO3·3H2O and NiNO3·6H2O was used, and all solutions were diluted in 2% HNO3 (in MilliQ water). The pH of CuNO3·3H2O and NiNO3·6H2O was adjusted to ~5.5 and ~5, respectively, using 30% NaOH for all tests (expect for the effect of pH test). pH paper was used to monitor the pH (Fisherbrand, pH 0.0-14.0). After adsorption, all solutions were diluted and filtered into 15mL falcon tubes (VWR centrifuge tube) using a 10mL plastic syringe (Air-Tite Luer-Lock) and a 0.22 µm syringe filter (ESBE, nylon) in preparation for FAAS. A calibration curve (R2=0.9998) was made using 0.2500 0.5000, 1.0000, 2.5000, and 5.000ppm CuNO3·3H2O in 2% HNO3. The same concentrations were used to construct a standard curve for NiNO3·6H2O (R2=0.9998). Thermo iCE 3500 Flame Absorption Spectrophotometer (Acetylene/Air) was used to measure the adsorption of CuNO3·3H2O at 324.8nm and NiNO3·6H2O at 231.8nm. Excel was used to create visual representations of the data obtained.
2.5.1. Effect of Contact Time
This test was used to test how time affects how much copper can be adsorbed by SA-PP-H (org). For each time point, ~0.07g of hydrogel beads were weighed out and added to 50mL of 50ppm CuNO3·3H2O or 50ppm NiNO3·6H2O in a 50mL beaker. The solutions were stirred at 400rpm for 0, 5, 15, 30, 45, 60, 90 and 120 minutes for Cu, and 0, 5, 30, 60, 90 and 120 minutes for Ni. At the specified time, some solution was aliquoted and diluted 10 folds with 2% HNO3 then filtered into a 15mL falcon tube for FAAS. Three trials were conducted. FAAS was then used to measure the concentration of copper in the supernatant. Equation (2) was then used to calculate qt or adsorptive capacity, which is the amount of adsorbate adsorbed per mass of adsorbent (hydrogel beads). Here, Co and Ce are the initial concentration and final concentrations of the adsorbates, respectively. V represents the volume of adsorbate in L, and m represents the mass of the adsorbent in g. The percent removal capacity was calculated using equation 3.
2.5.2. Effect of Initial pH
To find the optimal pH for adsorption, this test was conducted. Approximately 0.07g of SA-PP-H (org) beads were weighed out and added to 10mL of 50ppm CuNO3·3H2O at pH 1, 3, 5 and 13 (adjusted with 30% NaOH) in a 20mL scintillation vial. The solution was stirred at 400rpm for 60 minutes, then decanted, diluted 10 folds with 2% HNO3, filtered into 15mL falcon tubes and analyzed by FAAS. Three trials were conducted. Equations 2 and 3 were used to calculate qt and R%, respectively.
2.5.3. Effect of Hydrogel Amount
This test was used to examine how varying amounts of hydrogel would affect the amount of copper that is adsorbed per weight of hydrogel. To do this, varying amounts of SA-PP-H (org) beads were weighed out (0.1, 0.2, 0.3, 0.4 and 0.5g) and added to 10mL of 50ppm CuNO3·3H2O in a 20mL scintillation vial. The solutions were stirred at 400rpm for 60 minutes, decanted and diluted 10 folds with 2% HNO3, and filtered into a 15mL flacon tube for FAAS analysis. Three trials were conducted. Equations 2 and 3 were used to calculate qt and R%, respectively.
3. Results
3.1. Characterization
The physical properties of the hydrogels synthesized in this study can be seen in Table 1 below. Overall, the appearances involve circular shapes for all hydrogels, and the colour of the SA-H was white/off-white, but when pomegranate peel was incorporated, the gels took the colour of the pomegranate peel powder, which was a darker brown/black for the commercial pomegranate peel, and a lighter brown for the organic pomegranate peel.
These hydrogels were further characterized by FTIR, SEM, diameter size, and water uptake capacity tests
3.1.1. FTIR for Commercial vs Organic Pomegranate Peel Powder
FTIR is a technique that can help to determine what functional groups are present in a compound. Figure 2 illustrates a comparison between organic pomegranate peel powder (PPP) and commercial. The powders were both oven-dried at 60oC for 24 hours before analysis. There is a broad peak in both spectra at 3265.26 cm-1 in both types of pomegranate peel powders, characteristic of O-H stretching [34,35]. These can be H-bonded or free hydroxyl groups [35]. They are indicative of carboxylic acid, phenol and alcohol groups from cellulose, lignin and hemicellulose [35]. This could also indicate the presence of water, but this is unlikely since both powders were oven dried beforehand. The weak peak in both spectra at 2922.63 cm-1 is characteristic of C-H stretching from CH2 groups [22]. The weak peak on both spectra at 1713.19 cm-1 represents C=O stretching, confirming the presence of carbonyl groups, which confirms the presence of aldehydes, ketones and further confirms that there are carboxylic acid groups present [34,35]. There is also a medium sharp peak on both spectra at 1607.14 cm-1, which is characteristic of Ar-CH2 stretching vibrations from hemicellulose [34]. It may also indicate that C=C double bonds are present, so alkenes are present [34]. The weak peak on both spectra at 1513.32 cm-1 is characteristic of cellulosic materials, known to be present in pomegranate peel [22]. The weak peak at 1441.94 cm-1 on both spectra is characteristic of ring vibrations [36]. There is a weak peak at 1315.49 cm-1 on both spectra, which represents the bending of CH2 [34]. The weak peaks at 1221.67 cm-1 and 1211.47 cm-1 for the organic and commercial PPP, respectively represents C-O bending, indicating the presence of ester, ether carboxylic acid, alcoholic and phenolic groups [34,36]. The strong peak at 1013.64 cm-1 on both spectra represents C-O stretching, further indicating the presence of ester and ether functional groups due to lignin and hemicellulose [22,34,37]. It also confirms the presence of carboxylic acid, alcoholic and phenolic compounds from lignin and hemicellulose [35]. Finally, the weak peak at 872.91 cm-1 on both spectra is characteristic of both -CCH and -COH bending [34]. The -CCH bending can be attributed to alkane groups, while the -COH bending is attributed to hydroxyl, carboxylic acid, aldehyde and phenol groups [34,35]. Overall, both spectra are similar to what was observed by Abbaz et al, Salih et al and Hashem et al [22,34,35].
3.1.2. FTIR for SA-H, SA-PP-H (com) and SA-PP-H (org)
To identify the functional groups present on the surface of the three hydrogels that were synthesized (SA-H, SA-PP-H (com), SA-PP-H (org)), FTIR was used. Here, the beads were crushed into a powder using a mortar and pestle before analysis. The results are illustrated in Figure 3. The broad peak at 3261.19 cm-1 in all spectra represents the O-H stretching vibrations, indicating the presence of carboxylic acid, phenol and alcohol groups from both the SA and PPP [22,34,35]. The O-H may be bonded or free [35]. These groups indicate the presence of cellulose, lignin and hemicellulose, which would come from the pomegranate peel [35]. It may also indicate the presence of water, but that is unlikely as the samples were lyophilized before FTIR analysis was conducted. For the SA-PP-H (com) and SA-PP-H (org) spectra, the weak peak at 2918.55 cm-1 represents C-H stretching from CH2 groups from the PPP [22,34,35]. The weak peak at 1723.39 cm-1 in both SA-PP-H (com) and SA-PP-H (org) spectra is indicative of C=O stretching vibrations from PPP, which means that carbonyl groups such as ketones, carboxylic acids, and aldehydes are present [22,34,35]. The medium peaks at 1596.94 cm-1 and 1423.58 cm-1 on all spectra are indicative of COO- stretching, symmetric and antisymmetric, respectively [22]. This confirms the presence of carboxylic acid and ester functional groups from both SA and PPP [22]. Furthermore, the weak peak at 1315.49 cm-1 on both SA-PP-H (com) and SA-PP-H (org) spectra represents C-H bending from CH2 groups from PPP [34].The weak peak at 1229.83 cm-1 on all spectra represents C-O bending, indicating the presence of ester, ether carboxylic acid, alcoholic and phenolic groups [34,36]. The strong peak at 1007.52 cm-1 on all spectra represents C-O stretching vibrations [34,35,36]. This further highlights the presence of ester, ether, carboxylic acid, alcoholic and phenolic functional groups due to lignin and hemicellulose present in PPP [22,34,35,36]. It is also indicative of carboxylic acid, ether and hydroxyl functional groups present in SA [22]. Finally, the weak peak at 819.89 cm-1 on all spectra is characteristic of both -CCH and -COH bending [34]. The -CCH bending can be attributed to alkane groups, while the -COH bending can be attributed to hydroxyl, carboxylic acid, aldehyde and phenol groups [34,35].
3.1.3. SEM
To visualize the surface and cross-sections of the SA-PP-H (org), SA-H, and SA-PP-H (org) after copper adsorption at various magnifications, SEM was utilized. The results are illustrated in Figure 4 and Figure 5. respectively. The surface images demonstrate that the SA-H had a smooth surface, and is highly compact (Figure 4, 2b, 2c, 3c), while the SA-PP-H (org) had a rougher and more porous surface (Figure 4, 1a, 1b, 1c), and is less compact. Furthermore, the cross-sections of SA-PP-H (org), SA-H, and SA-PP-H (org) after copper adsorption at various magnifications can be seen in Figure 5. Like the surface images, the SA-H also appears to be smoother and more compact throughout the hydrogel (Figure 5, 2a,2b,2c), while the SA-PP-H (org) appears rougher and more porous throughout (Figure 5, 1a, 1b, 1c).
3.1.4. Diameter Size
During the synthesis process for all hydrogels, they were first oven-dried then lyophilized. To estimate the size of hydrogels when wet, oven-dried and lyophilized, ImageJ— a software commonly used to analyze scientific images, was used. The data obtained can be visualized in Figure 6 and Figure 7 for sodium alginate beads and sodium alginate-pomegranate peel beads, respectively. Figure 6 shows that the average diameters were 9.91 ± 0.65, 0.95 ± 0.13 and 1.63 ± 0.24 mm for the wet, dried and lyophilized sodium alginate beads, respectively. Figure 7 shows that the average diameters were 4.38 ± 0.33, 1.25 ± 0.19 and 1.45 ± 0.23 mm for the wet, dried and lyophilized sodium alginate-pomegranate peel (org) beads, respectively.
3.1.5. Effect of Pomegranate Peel Powder Concentration on Water Uptake Capacity
To test the ideal ratio of PPP to SA for the water uptake capacity of the hydrogels, and therefore the ideal ratio for heavy metal adsorption, a test was carried out. [20] To conduct this test, sodium alginate-pomegranate hydrogel beads with different concentrations of commercial pomegranate peel powder were synthesized. The ratios of PPP to SA were 0.00, 0.50, 0.75, 1.00, 1.50 and 2.00. After, a specified amount of hydrogel beads was placed in 10mL of water for 1 hour, then isolated via vacuum filtration, patted dry and reweighed. Three trials were conducted for each ratio. The water uptake capacity was calculated using equation (1). The results are illustrated in Figure 8. The uptake percentages were 42.55 ± 1.96%, 52.61 ± 3.24%, 55.47 ± 3.29%, 59.92 ± 1.05%, 58.48 ± 6.33% and 60.07 ± 2.48% for a ratio of 0.00, 0.50, 0.75, 1.00, 1.50, and 2.00, respectively.
3.1.5. Water Uptake Capacity of SA-H, SA-PP-H (com) and SA-PP-H (org)
To test how much water each type of hydrogel can take up, and therefore get an idea of how much heavy metal can be adsorbed, a water uptake capacity test was carried out. A specified amount of beads were placed in 10mL of water for 1 hour, then isolated via vacuum filtration, patted dry and reweighed. Three trials were conducted for each hydrogel. The water uptake capacity was calculated using equation (1). The results are illustrated in Figure 9. The uptake percentages were 42.55 ± 1.96, 59.92 ± 1.05 and 67.49 ± 0.23 for SA-H gels, SA-PP-H (com), and SA-PP-H (org), respectively. Overall, the SA-PP-H (com) and SA-PP-H (org) beads showed a 1.40x and a 1.58x increase in water adsorption, respectively, as compared to the SA-H beads.
3.2. Batch Adsorption Tests for Copper and Nickel
Batch adsorption tests for copper and nickel were carried out. The tests conducted include the effect of contact time, initial adsorbate amount, adsorbent amount, and pH for Cu, and the effect of contact time for Ni.
3.2.1. Effect of Contact Time on Cu and Ni Adsorption
To test the effect of time on Cu and Ni adsorption onto SA-PP-H(org), a contact time test was carried out. Here, a specified amount of hydrogels were weighed out, and placed in 50ppm CuNO3·3H2O (pH ~5.5) for 5, 15, 25, 45, 60, 90 and 120 minutes or 50ppm NiNO3·6H2O (pH ~5) for 0, 5, 30, 60, 90, and 120 minutes. Three trials were conducted for each time point. After the specified time, a 10-fold dilution in 2% HNO3 was carried out, and this solution was filtered for FAAS analysis. Three trials were conducted for each time point for each metal. The results are illustrated in Figure 10 below. The average adsorption capacities for copper were 2.44 ± 0.76, 30.76 ± 1.34, 30.52 ± 2.11, 31.17 ± 2.94, 31.97 ±2.48, 32.55 ± 2.14, 32.52 ± 2.60 and 33.06 ± 3.01 mg/g for 0, 5, 15, 25, 45, 60, 90, and 120 minutes, respectively. The removal percent for copper were 29.54 ± 1.83, 66.99 ± 1.82, 66.40 ± 1.05, 67.73 ± 2.03, 69.55 ±2.65, 70.83 ± 0.79, 70.70 ± 0.83, 71.83 ± 1.58 % for 5, 15, 25, 45, 60, 90, and 120 minutes, respectively. Furthermore, the average adsorption capacities for nickel were 5.85 ± 1.08, 39.52 ± 7.49, 39.24 ± 7.55, 39.03 ± 7.67), 38.91 ± 7.62, 38.70 ± 7.58 mg/g for 0, 5, 30, 60, 90, and 120 minutes, respectively. The removal percent for nickel were 79.57 ± 0.77, 82.26 ± 0.48, 81.63 ± 0.43, 81.13 ± 0.54, 80.94 ± 1.27, 80.50 ± 1.08 % for 0, 5, 30, 60, 90, and 120 minutes, respectively. The error bars on both graphs represent the standard deviation in adsorption capacity (n=3) and R% (n=3). As evident, for copper (Figure 10A), with time, both the adsorption capacity and the removal percent increases. They both rapidly increase in the first 5 minutes, then slow down as an equilibrium is achieved (t=60 minutes), then plateaus. For nickel (Figure 10B), they also rapidly increase within the first 5 minutes, but plateaus after.
3.2.3. Effect of pH on Adsorption of Copper onto SA-PP-H (org)
To find the ideal pH for adsorption, a pH test was carried out. A specified amount of hydrogels were placed in CuNO3·3H2O at varying pH values (1, 3, 5, 13) for 60 minutes after which the supernatant was diluted 10 folds and filtered, then analyzed by FAAS. Three trials were conducted for each concentration. The results are illustrated in Figure 11. The adsorption capacity is 7.81 ± 0.53, 6.91 ±0.69, 7.29 ± 0.41 and 6.48 ± 0.31 mg/g for pH 1, 3, 5 and 13, respectively. The removal capacity is 72.82 ± 0.49, 72.83 ± 1.58, 78.40 ± 1.15, and 78.76 ± 0.95 % for pH 1, 3, 5 and 13, respectively. The error bars represent the standard deviation in adsorption capacity (n=3) and R% (n=3). Overall, as the pH increases, qt decreases, but R% increases until plateauing at pH 5.
3.2.2. Effect of Adsorbate Amount on Adsorption of Cu onto SA-PP-H (org)
To test how increasing the amount of hydrogel would affect copper adsorption, an adsorbent dosage test was carried out. Here, varying amounts of hydrogels (0.01, 0.02, 0.03, 0.04 and 0.05g) were placed in CuNO3·3H2O (pH ~5.5) for 60 minutes after which the supernatant was diluted 10 folds and filtered, then analyzed by FAAS. Three trials were conducted for each concentration. The results are visualized in Figure 12 below. The adsorption capacity is 42.37 ± 3.35, 26.18 ± 1.10, 16.95 ± 1.27, 12.61 ±0.44, 9.37 ± 0.32 mg/g for 0.01, 0.02, 0.03, 0.04 and 0.05g of adsorbent, respectively. The removal capacity is 89.98 ± 1.55, 88.17 ± 0.96, 87.23 ± 1.96, 88.11 ± 1.05 and 87.22 ± 0.97 % for 0.01, 0.02, 0.03, 0.04 and 0.05g of adsorbent, respectively. The error bars represent in both graphs represent the standard deviation in adsorption capacity (n=3, black) and R% (n=3, grey). As evident, as the adsorbent dose increases, qt decreases while R% plateaus.
4. Discussion
4.1. Evaluation of Hydrogel Efficiency
The purpose of this study was to synthesize and characterize hydrogels from sodium alginate with pomegranate peel incorporations. Moreover, their ability to remediate heavy metals from contaminated water was also explored. Overall, the synthesis of the hydrogel was successful. Overall, the appearance of the hydrogels is consistent with literature [22]. The hydrogels were all circular in shape, as expected since a syringe was used to drop them into the crosslinker. The colour of the SA-PP-H (org) more closely aligns with the literature than the SA-PP-H (com) [22].
Organic and commercial pomegranate peel were characterized via FTIR [22,34,35]. Overall, the expected peaks for PPP are present in both organic and commercial PPP. However, the intensities of the peaks are stronger for the commercial PPP, which indicates that the quantity of each functional group in the commercial PPP was higher than in the organic PPP [37]. This is potentially because different processing methods may have been used for the commercial PPP. The organic PPP was oven dried, but the processing method for the commercial PPP remains unclear. As such, if a different processing method was used for the commercial PPP, such as lyophilization, more components of the peel may have been retained [38]. For example, PPP prepared via lyophilization has been shown to retain three to five times the amount of phenol, tannin and flavonoid contents than PPP prepared via oven-drying [38]. In addition, the label claims that it is “100% natural pomegranate peel powder,” but this label can also be used if there are natural additives present [39]. Furthermore, additives may be used to improve shelf life and prevent clumping [39]. Thus, additives may be present, which contributes to increased intensity. Finally, contamination during the production process is also possible, which may have contributed to the increased intensity [39]. Furthermore, FTIR was also conducted for SA-H, SA-PP-H (com) and SA-PP-H (org). Here, the hydrogels with pomegranate peel incorporations showed more peaks than the SA-H, indicating that the addition of pomegranate peel allowed for an increased amount of functional groups present [22]. For example, while SA-H should contain C=O bonds due to the carboxylic acid groups present (see Figure 2 and Figure 3), it is not evident on the FTIR. However, for the SA-PP-H samples, there is a weak C=O peak at 1723.39 cm-1, indicating that incorporating PPP into the structure allowed for more functional groups to be present in the final structure. In addition, the peaks that are present in both SA-H and SA-PP-H are more intense with pomegranate peel incorporations, indicating that quantity of each functional group in the SA-H was higher than in the SA-PP-H samples [37]. For instance, the hydroxyl peak at 3261.19 cm-1 is more intense for both SA-PP-H samples than with the SA-H samples. This was expected as pomegranate peel is known to enhance the structure of SA-H, allowing for increased adsorption efficiency of contaminants [22].
Moreover, surface and cross-section images of SA-H, SA-PP-H (org) before copper adsorption, and SA-PP-H (org) after copper adsorption were also taken via SEM. The surface images demonstrate that the SA-H had a smooth surface, and is highly compact, while the SA-PP-H (org) had a rougher and more porous surface and is less compact. This is because the SA-PP-H (org) had pomegranate peel incorporations, which means its lignocellulosic content is higher than in the SA-H, allowing for more pores to be available and a rougher surface [22]. Abbaz et al. (2023) also looked at the surface of SA-PP-H and SA-H via SEM, and had similar findings [22]. In addition, the SA-H has visible cracks on the surface, which may have occurred during lyophilization. Here, the pomegranate peel enhanced the stability of the SA-PP-H (org), so it remained intact during lyophilization. Since the SA-H did not have pomegranate peel, it was less stable and therefore cracked [22,40]. Moreover, Figure 4, 3a, 3b and 3c shows the SA-PP-H (org) after copper adsorption. Here, it is evident that the gel is rougher and more porous after copper is adsorbed. This was expected as Tenea et al. 2024 saw similar morphology changes when cadmium, nickel and lead were adsorbed onto polystyrene and polypropylene microplastics [41]. There are also cracks in the gel, likely due to mechanical agitation from the stir bar during adsorption. These morphology changes are likely due to heavy metal deposition on the surface, which indicates that copper was indeed adsorbed onto the hydrogel [41]. Like the surface images, the cross sections of SA-H also appear to be smoother and more compact throughout the hydrogel, while the SA-PP-H (org) appears rougher and more porous throughout. There are also cracks throughout the SA-H, likely due to it being less stable than the SA-PP-H (org) [28]. Figure 5 (1c, 2c, 3c) also shows that the SA-PP-H (org) gel is rougher and more porous after copper is adsorbed, as expected since copper is now deposited onto the gel [41]. It also shows that the copper is adsorbed and distributed throughout the gel, as opposed to only being adsorbed on the surface. Overall, both surface and cross-section images show that SA-PP-H (org) is effective at copper adsorption, as expected [22].
Furthermore, the diameter size of SA-H and SA-PP-H (org) when wet, oven-dried, and lyophilized was analyzed. Oven drying is a process that involves the use of heat to dry a sample [40]. Upon the introduction of heat to a sample, the water present in the sample evaporates, leaving behind a water free structure [40]. This shrinks the structure, thus reducing its diameter [40]. On the other hand, freeze-drying or lyophilization involves freezing the sample to allow the solvent to freeze, and subjecting it to sublimation (primary drying) at low pressure for the removal of the frozen solvent [42]. Here, 95% of the solvent gets frozen and sublimed [42]. The sample is then subject to desorption (secondary drying) to remove the remaining solvent [42]. Typically, samples that undergo lyophilization expand in size due to the freezing of the solvent, which occupies greater space than in it would in liquid form [42]. The solvent pushes outward on the structure as it freezes to create more space [38]. This causes the structure to expand, increasing its diameter [42]. As expected, when dried, both types of hydrogel beads shrunk in size due to water being removed from their structures [40]. When lyophilized after oven-drying, their structures expanded, as expected [42]. Overall, the SA-H were larger than the SA-PP-H (org) diameter when wet (9.91 ± 0.65 vs 4.38 ± 0.33, respectively; Figure 6 and Figure 7). This is expected as sodium alginate is hydrophilic in nature, so when added to water, all its functional groups would be able to interact with water, thus increasing the diameter of the SA-H structure [18]. However, the incorporation of pomegranate peel powder likely reduces the overall hydrophilicity of the structure, as pomegranate peel has some hydrophobic characteristics, thus reducing the interaction with water, and a smaller diameter [43]. Furthermore, after oven-drying, the SA-H had an average diameter of 0.95 ± 0.13, while the SA-PP-H (org) had an average diameter of 1.25 ± 0.19, despite the SA-H having a larger diameter when wet. This likely because the Ca2+ crosslinker promotes decreased electrostatic repulsion between the alginate molecules, which causes the structure to collapse [44]. It also increases the molecular interactions in the structure, and chelates the carboxyl groups of alginates, further collapsing the structure once water is removed [44]. Once pomegranate peel is added, the structural integrity is enhanced through interactions between the functional groups present in the pomegranate peel and alginate, preventing collapsing of the structure [22]. The degree of crosslinking may have also been improved due to the pomegranate peel incorporation, further preventing structural collapse [22]. Moreover, after lyophilization, the diameter for both types of hydrogels increased (1.63 ± 0.24 mm for SA-H vs 1.45 ± 0.23 mm for SA-PP-H (org)), as expected since lyophilization freezes the solvent within the structure, which causes it to expand [42]. The SA-H expanded more than the SA-PP-H(org), suggesting higher water content in the former. This makes sense as the functional groups of alginate in SA-H were able to fully interact with the water during synthesis, thus more water was taken up [18]. On the other hand, pomegranate peel powder decreased the interaction with water by making the structure more hydrophobic, so less water was taken up during synthesis [43]. This means that SA-PP-H (org) had less water initially, so after oven drying there was less water content to be removed via lyophilization, hence why it expanded less than SA-H beads. Furthermore, as seen in both Figure 6 and Figure 7, the beads are distributed over a range of sizes, meaning they are not uniform in size. This is due to manually dropping them into CaCl2 with a syringe as opposed to using an automated dropper.
Moreover, the effect of pomegranate peel concentration on the hydrogel’s ability to take up water was investigated. Here, as expected, there is an increase in water uptake capacity with increased amounts of pomegranate peel powder incorporations [22]. However, there is a plateau once the ratio becomes 1.00. This indicates that a 1 to 1 ratio of PPP to SA is ideal for hydrogel synthesis for water remediation. Furthermore, a water uptake test comparing SA-H, SA-PP-H (com) and SA-PP-H (org) was conducted. Overall, the SA-PP-H (com) and SA-PP-H (org) beads showed a 1.40x and a 1.58x increase in water adsorption, respectively, as compared to the SA-H beads. This can be attributed to the increased porosity of the SA-PP-H beads [22]. However, PPP also makes the structure more hydrophilic, which also increases the uptake capacity [22]. Overall, the organic pomegranate peel incorporations performed better than the commercial, with a 1.40x increase compared to a 1.58x increase from SA-H. This may be because the commercial PPP may have contained additives or contaminants, which may have made its hydrogel internal structure collapse more than the SA-PP-H (org) [39]. As such, the ability of SA-PP-H (com) to take up water may have been hindered. In addition, the additives and/or contaminants may have included hydrophobic components, thus preventing the structure from being as hydrophilic as with the organic PPP, reducing its water uptake capacity [22]. This may explain why the FTIR for the commercial PPP showed more intense peaks, but the water uptake capacity for SA-PP-H (com) was lower than SA-PP-H (org) [37,39].
Finally, the ability of SA-PP-H (org) to take up copper and nickel was tested. Here, contact time, adsorbent amount and pH was tested. Contact time tests can provide insights into how long it takes for the adsorbent to reach equilibrium and its maximum adsorption capacity. For copper (Figure 10A), with time, both the adsorption capacity and the removal percent increases. They both rapidly increase in the first 5 minutes, then slow down as an equilibrium is achieved (t=60 minutes), then plateaus. This pattern of a rapid increase, slowing down then plateauing is also seen in Abbaz et al. (2023) for adsorption capacity, and in El-Ashtoukhy et al. (2008) for removal percent [22,45]. This pattern is seen as initially, there are many adsorption sites available, which allows for many adsorbate molecules to get adsorbed [45]. Then, as the adsorption sites become more saturated, less sites are available for the adsorbate, and therefore the adsorption rates slow down until reaching an equilibrium and plateauing [45]. The maximum removal capacity was 71.83 ± 1.58% after 2 hours, which is higher than what was observed in literature by El-Ashtoukhy et al. (2008), who observed maximum copper removal rates with raw pomegranate peel to be ~60% after ~10 minutes, and a decrease to ~40% after 2 hours [45]. This is likely because they used raw pomegranate peel, while a more stable hydrogel structure was used here. Raw pomegranate peel has been found to be less effective and more unstable on its own as compared to when it is in a hydrogel structure or modified with materials such as carbon or zirconium (IV) [22,26,45]. This demonstrates that using pomegranate peel in the format of a hydrogel is more effective for Cu removal. However, they also noticed removal percentages close to 100% with activated carbon from pomegranate peel that was chemically treated with 10% nitric acid. While the removal percent is higher than what was observed in this study, nitric acid poses various environmental and human health impacts such as freshwater ecotoxicity and cancer, respectively [46].
Moreover, the maximum adsorption capacity observed here was 33.06 ± 3.01 mg/g after 120 minutes, while Abbaz et al. (2023) found a maximum adsorption capacity of 3.99 mg/g after 20 minutes for the adsorption of safranin-O on sodium alginate-pomegranate peel hydrogels with an initial adsorbate concentration of 50ppm [22]. This difference is likely because safranin-O is an organic molecule that is larger than copper ions (350.84g/mol vs 63.55 g/mol) [47,48]. Copper is smaller, meaning that more copper molecules can diffuse onto the adsorption sites as compared to the larger safranin-O molecules [49]. Also, copper’s smaller size should mean that it should diffuse faster into the pores of the hydrogel than safranin-O and therefore get to its maximum qt faster, but this was not observed here, likely because Cu2+ strongly interacts with the functional groups present on the surface, such as OH- and COO- via coordination, which takes longer to form than weaker bonds such as hydrogen bonding like in the adsorption of safranin-O [22,50]. This is also why the optimal contact time was longer (t=60 minutes) than it was for safranin-O (t=20 minutes). Furthermore, it was found that the maximum adsorption capacity for 50mg/L copper onto raw pomegranate peel was 6-7 mg/g, and 6-8 m/g for adsorption onto pomegranate peel activated carbon [36,51]. These are both lower than the adsorption capacity observed in this study. Additionally, the percent adsorption of copper onto pomegranate peel treated with zinc chloride and phosphoric acid was close to 100% [52]. However, phosphoric and zinc chloride are both toxic to the environment and human health, which means that the synthesis of the adsorbent is not green [53,54]. Overall, since the hydrogels produced in this study can be considered green, and its adsorption capacity was higher than other types of similar adsorbents, it is superior for copper adsorption.
Furthermore, the adsorption capacity of nickel (Figure 10B) increases rapidly in the first 5 minutes, then plateaus, which was unexpected since Abbaz et al. (2023) observed a rapid increase, slowing down then plateauing [22]. This may be due to the hydrogels not being lyophilized before adsorption due to time constraints, meaning that the beads were likely smaller, smoother, and contained water, so less adsorption sites were likely available for Ni after the first 5 minutes [42]. Also, the removal percent increases rapidly within the first 5 minutes then plateaus, which is inconsistent with literature as Abbasi et al. (2013) observed that the removal percent rapidly increases within the first 5 minutes, then slowly increases until 35 minutes then plateaus [55]. This may be due to the hydrogels not being lyophilized before adsorption [42]. Also, this study observed that the maximum removal capacity was 82.26 ± 0.48% after 5 minutes, while Abbasi et al. (2013) observed that after 5 minutes the removal capacity was ~15%, which is lower than what is observed here [55]. Also, the maximum percent removal observed by Abbasi et al. (2013) was 78% after 35 minutes, which is still lower than the maximum removal percent in this study, and lower than the removal percent observed here at ~35 minutes [55]. This difference may be because they used raw pomegranate peel, while this study used pomegranate peel-based hydrogels, meaning that the adsorbent used here was more stable therefore allowing for more Ni removal [22,26,55]. This demonstrates that SA-PP-H (org) is more effective at removing nickel from contaminated water than raw pomegranate peel, as expected. Furthermore, the maximum adsorption capacity was found to be 39.52 ± 7.49 mg/g after 5 minutes, while Abbaz et al. (2023) found that the maximum adsorption capacity for safranin-O onto SA-PP-H (org) with an initial adsorbate concentration of 50ppm was 3.99 mg/g after 20 minutes [22]. Like with copper, nickel is much smaller than Safranin-O (350.84g/mol vs 58.69 g/mol), so more nickel can diffuse into the available pores of the hydrogel, so more adsorption is observed [48,56]. Nickel is also smaller than safranin-O, so it can also diffuse faster into the pores of the hydrogel, which explains why the optimal contact time was 5 minutes [49]. This was also observed by Abbasi et al. (2013) [55]. Furthermore, Bhatnagar and Minocha (2010) found that the maximum adsorption capacity for nickel onto a pomegranate peel adsorbent was 20-25 mg/g, which is lower than what was observed here [57]. Also, the maximum percent adsorption for nickel onto pomegranate peel treated with zinc chloride and phosphoric acid was shown to be close to 100% [52]. However, phosphoric acid and zinc chloride are both toxic to the environment and human health, so the synthesis is not green [53,54] Since the synthesis of the hydrogels in this study was green, and showed superior adsorption capacities for nickel, they are better for nickel adsorption when compared to other similar adsorbents.
Moreover, it is important to understand what the optimal pH is for adsorbate adsorption as different pH value can affect the charge of the hydrogel’s active sites, which affects their efficiency. Here, as the pH increases, qt decreases, but R% increases until plateauing at pH 5 for copper. The trend for R% was expected as at low pH values, there are H+ ions present in solution, which compete with Cu for adsorption sites [45]. This means that would not be able to interact with the adsorbate as much, resulting in a lower removal percent [22]. Furthermore, as the pH increases, the adsorption sites become more negatively charged since less H+ is present for competition, so they can interact more with the positively charged copper ions [22,45]. As such, higher pH values were expected to show higher removal percents, which was seen here, and is consistent with the observations made by El-Ashtoukhy et al. (2008) [45]. Also, the highest copper removal % observed here was 78.76 ± 0.95%, which is higher than the ~40% observed by El-Ashtoukhy et al. (2008) [45]. This is likely because they used raw pomegranate peel which is less stable and effective at adsorption than when in hydrogel structures, which was used here [22,26,45]. This shows that the hydrogels are superior for copper removal when compared to raw pomegranate peel. El-Ashtoukhy et al. (2008) also observed that the percent removal increases to almost 100% when chemically treated pomegranate peel is used instead [45]. However, the chemicals used are toxic to the environment and human health [46]. As such, even though they are better for copper removal, the synthesis of the adsorbent used in literature was not green, while for the hydrogels used in this study, it was [46]. Moreover, the maximum adsorption capacity trend was not expected as there were some fluctuations before pH 5, then decreased after. There is a dip in adsorption capacity at pH 3, then an increase again at pH 5, which cannot be explained by precipitation of Cu since Cu would not precipitate at pH 3, so it is likely due to the varying sizes of beads [49]. Saadi et al. (2022) also noticed that the absorbance of copper onto pomegranate peel activated carbon increases until pH 6 [51]. pH values higher than 6 results in the precipitation of copper as Cu(OH)2, thus decreasing its adsorption capacity as less copper is in solution [51,58]. As such, the decrease in adsorption capacity at pH 5 is consistent with literature since the only pH value tested after 5 as 13. Moreover, However, R% increase as the percent of removed copper is higher when compared to the overall Cu in solution at that pH [58]. Moreover, the observed optimal pH for copper adsorption is ~5, which is consistent with literature as this was also seen in El-Ashtoukhy et al. (2008) [45]. They noticed an optimal pH of ~6-8, while here, the removal percent plateaus at pH 5 [45]. The maximum adsorption capacity here was 7.81 ± 0.53 mg/g, which is comparable to what has been shown in literature as Saadi et al. (2023) showed that it was 6-8mg/g for pomegranate peel activated carbon [51].
To gain insights into how much adsorbent is needed for maximum adsorption, the effect of adsorbent amount on copper adsorption was tested. Here, as the adsorbent dose increases, qt and R% plateaus for copper. A decreasing adsorption capacity is expected because qt is a measure of adsorbate adsorbed per weight of adsorbent, therefore with increasing adsorbent amounts and no changes in adsorbate amount, less adsorbate is adsorbed per weight of adsorbent [22]. This is also seen in Abbaz et al. (2023) for safranin-O adsorption onto SA-PP-H [22]. Also, the maximum qt seen in Abbaz et al. (2023) was ~25-30mg/g at 1 g/L, while here it is 42.37 ± 3.35 mg/g for 0.01g [22]. This is because copper is smaller than safranin-O, so more copper can diffuse into the gel than the larger safranin-O [47,48]. Moreover, the trend seen for removal capacity was not expected as Abbaz et al. (2023) and El-Ashtoukhy et al. (2008) saw an increase in R% after leaving SA-PP-H in 50mg/L safranin-O for 3 hours, and raw pomegranate peel in 50mg/L of copper for 2 hours, respectively [22,45]. Since only a plateau is seen here, it is likely that the removal percent peaked at an adsorbent dosage lower than 0.01g, meaning that less adsorbent is needed to reach the maximum removal percent. Also, El-Ashtoukhy et al. (2008) also noticed that maximum removal percent of copper onto activated carbon from pomegranate peel that was chemically treated was nearly 100% at 1g/L [45]. Here, the maximum removal percent was seen at 89.98 ± 1.55 with 0.01g of adsorbent (or 1g/L). While this is lower, the adsorbent is also synthesized in an eco-friendly manner and showed only an ~10% lower adsorption than in literature. As such, these hydrogels may be superior to other similar adsorbents. Abbaz et al. (2023) also noticed high removal percents of ~90% for safranin-O adsorption onto SA-PP-H, which is comparable to what was observed here. However, this was noticed with 20g/L of adsorbent, while here the maximum removal percent was noticed with 1g/L. This is likely because copper is smaller than safranin-O so more copper molecules can diffuse into the pores of the hydrogel than safranin-O [47,48].
4.2. Comparison to Existing Adsorbents
Currently, the water remediation methods include adsorption, membrane, chemical, electric and photocatalytic based methods [12,13]. Of these methods, adsorption is most researched as it is cost-effective, easy to implement and has high removal capacities [12]. However, it can also be disadvantageous in some ways. For example, the adsorption capacity of many adsorbents remains insufficient for the high concentrations of contaminants present [13]. Based on the results of this study, the adsorption capacity of SA-PP-H is higher when compared to other similar adsorbents, which means that it might be promising for removing copper and nickel from contaminated water. Another limitation of adsorption is the high cost of materials for adsorbent synthesis [13]. The SA-PP-H synthesized here remains low cost as sodium alginate and pomegranate peel are cheap [22]. This helps to keep the cost of synthesis low, which is useful in large scale applications. Furthermore, a concern with many different types of adsorbents is they may become harmful to human health and the environment overtime due to the way they are produced, used and disposed of [13]. Here, since SA-PP-H are made from environmentally friendly reagents, the risk of becoming harmful to the environment might be lower. While SA-PP-H is promising for heavy metal remediation from contaminated water, several limitations are present. These include the fact that while it is good for remediation, other adsorbents such as chemically treated pomegranate peel is better [51,52]. However, the synthesis of these adsorbents uses harsh chemicals, while the hydrogels synthesized here remains environmentally friendly. Moreover, the sodium alginate-pomegranate peel mixture was dropped into the crosslinker manually. This means that beads were not uniform throughout the experiment, so despite having similar masses of adsorbent, some vials may have had larger beads than others, which may have caused discrepancies in adsorption [49]. Larger beads tend to adsorb less than smaller ones, so the vials with larger beads likely adsorbed less copper than those with smaller beads, leading to larger standard deviations between trails [49]. The SA-PP-H (org) were also not lyophilized before nickel adsorption, which may have also caused discrepancies in the observed data.
4.3. Future Directions
Overall, while this study showed that SA-PP-H (org) is promising for remediating heavy metals, there are some things that could be done in future studies to help obtain better and more accurate data. One such thing would be to use an automated dropper for dropping the hydrogels into the crosslinker. This would allow for more uniform hydrogels to be formed, and thus prevent dips or spikes in the data for adsorption tests. It would also prevent large variations in the data, as seen in the effect of contact time and initial adsorbate data. Moreover, it would allow smaller beads, which would be better for adsorption due to their greater surface area to volume ratio. Furthermore, other adsorption tests could be carried out such as the effect of temperature to see how the hydrogels behave as the temperature increases or declines. Moreover, more detailed tests for nickel are required such as the effect of adsorbent amount and pH. This would give a better picture of how nickel is adsorbed, therefore allowing for better optimization of the hydrogels. Finally, the recyclability and reusability of this type of hydrogel for heavy metal remediation may be tested.
5. Conclusion
To conclude, the primary goal of this experiment was to synthesize hydrogel beads from sodium alginate, with pomegranate peel incorporations. This goal was achieved as the beads were successfully synthesized. Another goal was to characterize these hydrogels using FTIR, SEM and water uptake tests, which was also achieved. These characterization tests demonstrated that pomegranate peel incorporations may enhance the ability of the hydrogels to remediate heavy metals from contaminated water. This is because they included more functional groups, a rougher and more surface and cross section and higher water uptake capacities. Finally, we aimed to test the ability of these hydrogels to remediate heavy metal from contaminated water. Several tests were conducted with both copper and nickel, though nickel was less extensively studied due to time constraints. For copper, the test conducted include the effect of contact time, adsorbent amount, and pH. For nickel, the tests conducted included the effect of contact time. The results indicate that SA-PP-H (org) is a good candidate for copper heavy metal remediation, with an optimal contact time of 60 minutes and optimal pH of ~5. Finally, for nickel, the tests conducted include the effect of contact time. This indicated that nickel had an optimal contact time of 5 minutes. These results are promising as they demonstrate that SA-PP-H is a good candidate for both copper and nickel remediation. This offers a cost effective, eco-friendly way to remediate heavy metals from contaminated water.
Author Contributions
Conceptualization: N.T. and P.L., Investigation: P.L., Data curation: N.T. and P.L., Original draft preparation: P.L., Review and editing: N.T., X.F.
Funding
This research received no external funding.
Institutional Review Board Statement
Not applicable.
Informed Consent Statement
Not applicable.
Conflicts of Interest
The authors declare no conflicts of interest.
References
- Devi, P. I.; Manjula, M.; Bhavani, R. V. Agrochemicals, Environment, and Human Health. Annual Review of Environment and Resources 2022, 47, 399–421. [Google Scholar] [CrossRef]
- Sumudumali, R. G. I.; Jayawardana, J. M. C. K.; Piyathilake, I. D. U. H.; Randika, J. L. P. C.; Udayakumara, E. P. N.; Gunatilake, S. K.; Malavipathirana, S. What Drives the Pesticide User Practices among Farmers in Tropical Regions? A Case Study in Sri Lanka. Environ Monit Assess 2021, 193(12), 860. [Google Scholar] [CrossRef]
- Tchounwou, P. B.; Yedjou, C. G.; Patlolla, A. K.; Sutton, D. J. Heavy Metals Toxicity and the Environment. EXS 2012, 101, 133–164. [Google Scholar] [CrossRef] [PubMed]
- Naccarato, A.; Vommaro, M. L.; Amico, D.; Sprovieri, F.; Pirrone, N.; Tagarelli, A.; Giglio, A. Triazine Herbicide and NPK Fertilizer Exposure: Accumulation of Heavy Metals and Rare Earth Elements, Effects on Cuticle Melanization, and Immunocompetence in the Model Species Tenebrio Molitor. Toxics 2023, 11(6), 499. [Google Scholar] [CrossRef]
- Bernardini, G.; Spinelli, O.; Vismara, C.; Presutti, C.; Bolzacchini, E.; Orlandi, M.; Settimi, R. Evaluation of the Developmental Toxicity of the Pesticide Mcpa and Its Contaminants Phenol and Chlorocresol. Environmental Toxicology and Chemistry 1996, 15(5), 754–760. [Google Scholar] [CrossRef]
- The WHO Recommended Classification of Pesticides by Hazard and guidelines to classification, 2019 edition. https://www.who.int/publications/i/item/9789240005662 (accessed 2024-12-08).
- Priyashantha, A. K. H.; Mahendranathan, C. Heavy Metal Contamination and Accumulation in Groundwater and Food Crops in Sri Lanka: A Review. Vingnanam J Sci 2019, 14(2), 7. [Google Scholar] [CrossRef]
- Ding, C.; Chen, J.; Zhu, F.; Chai, L.; Lin, Z.; Zhang, K.; Shi, Y. Biological Toxicity of Heavy Metal(Loid)s in Natural Environments: From Microbes to Humans. Front. Environ. Sci. 2022, 10. [Google Scholar] [CrossRef]
- Indika, S.; Wei, Y.; Cooray, T.; Ritigala, T.; Jinadasa, K. B. S. N.; Weragoda, S. K.; Weerasooriya, R. Groundwater-Based Drinking Water Supply in Sri Lanka: Status and Perspectives. Water 2022, 14(9), 1428. [Google Scholar] [CrossRef]
- Coelho, F. C.; Squitti, R.; Ventriglia, M.; Cerchiaro, G.; Daher, J. P.; Rocha, J. G.; Rongioletti, M. C. A.; Moonen, A.-C. Agricultural Use of Copper and Its Link to Alzheimer’s Disease. Biomolecules 2020, 10(6), 897. [Google Scholar] [CrossRef]
- Genchi, G.; Carocci, A.; Lauria, G.; Sinicropi, M. S.; Catalano, A. Nickel: Human Health and Environmental Toxicology. Int J Environ Res Public Health 2020, 17(3), 679. [Google Scholar] [CrossRef]
- Qasem, N. A. A.; Mohammed, R. H.; Lawal, D. U. Removal of Heavy Metal Ions from Wastewater: A Comprehensive and Critical Review. npj Clean Water 2021, 4(1), 1–15. [Google Scholar] [CrossRef]
- Satyam, S.; Patra, S. Innovations and Challenges in Adsorption-Based Wastewater Remediation: A Comprehensive Review. Heliyon 2024, 10(9), e29573. [Google Scholar] [CrossRef]
- Ma, Y.; Zhang, X.; Wen, J. Study on the Harm of Waste Activated Carbon and Novel Regeneration Technology of It. 2021, 769, 022047. [Google Scholar] [CrossRef]
- Guo, Y.; Bae, J.; Fang, Z.; Li, P.; Zhao, F.; Yu, G. Hydrogels and Hydrogel-Derived Materials for Energy and Water Sustainability. Chem. Rev. 2020, 120(15), 7642–7707. [Google Scholar] [CrossRef] [PubMed]
- Alsaka, L.; Alsaka, L.; Altaee, A.; Zaidi, S. J.; Zhou, J.; Kazwini, T. A Review of Hydrogel Application in Wastewater Purification. Separations 2025, 12(2), 51. [Google Scholar] [CrossRef]
- Yuan, Y.; Zhang, Q.; Lin, S.; Li, J. Water: The Soul of Hydrogels. Progress in Materials Science 2025, 148, 101378. [Google Scholar] [CrossRef]
- Ren, Y.; Wang, Q.; Xu, W.; Yang, M.; Guo, W.; He, S.; Liu, W. Alginate-Based Hydrogels Mediated Biomedical Applications: A Review. International Journal of Biological Macromolecules 2024, 279, 135019. [Google Scholar] [CrossRef]
- Djemaa, I. B.; Auguste, S.; Drenckhan-Andreatta, W.; Andrieux, S. Hydrogel Foams from Liquid Foam Templates: Properties and Optimisation. Advances in Colloid and Interface Science 2021, 294, 102478. [Google Scholar] [CrossRef]
- Tan, J.; Luo, Y.; Guo, Y.; Zhou, Y.; Liao, X.; Li, D.; Lai, X.; Liu, Y. Development of Alginate-Based Hydrogels: Crosslinking Strategies and Biomedical Applications. International Journal of Biological Macromolecules 2023, 239, 124275. [Google Scholar] [CrossRef]
- Naranjo-Alcazar, R.; Bendix, S.; Groth, T.; Gallego Ferrer, G. Research Progress in Enzymatically Cross-Linked Hydrogels as Injectable Systems for Bioprinting and Tissue Engineering. Gels 2023, 9, 230. [Google Scholar] [CrossRef]
- Abbaz, A.; Arris, S.; Viscusi, G.; Ayat, A.; Aissaoui, H.; Boumezough, Y. Adsorption of Safranin O Dye by Alginate/Pomegranate Peels Beads: Kinetic, Isotherm and Thermodynamic Studies. Gels 2023, 9(11), 916. [Google Scholar] [CrossRef]
- Savić Gajić, I. M.; Savić, I. M.; Svirčev, Z. Preparation and Characterization of Alginate Hydrogels with High Water-Retaining Capacity. Polymers 2023, 15(12), 2592. [Google Scholar] [CrossRef] [PubMed]
- Elwakeel, K. Z.; Ahmed, M. M.; Akhdhar, A.; Sulaiman, M. G. M.; Khan, Z. A. Recent Advances in Alginate-Based Adsorbents for Heavy Metal Retention from Water: A Review. Desalination and Water Treatment 2022, 272, 50–74. [Google Scholar] [CrossRef]
- Jayakody, M. M.; Vanniarachchy, M. P. G.; Wijesekara, I. Composition Analysis of Selected Sri Lankan Seaweeds. Journal of Tropical Forestry and Environment 2019, 9(2). [Google Scholar] [CrossRef]
- Poudel, B. R.; Ale, D. S.; Aryal, R. L.; Ghimire, K. N.; Gautam, S. K.; Paudyal, H.; Pokhrel, M. R. Zirconium Modified Pomegranate Peel for Efficient Removal of Arsenite from Water. BIBECHANA 2022, 19(1–2), 1–13. [Google Scholar] [CrossRef]
- Bhatnagar, A.; Sillanpää, M.; Witek-Krowiak, A. Agricultural Waste Peels as Versatile Biomass for Water Purification – A Review. Chemical Engineering Journal 2015, 270, 244–271. [Google Scholar] [CrossRef]
- Wang, H.; Zhang, L. Preparation of Hydrogel Beads Based on Sodium Alginate and Aqueous Extract from Pomegranate Peel and Its Cyanobacteria Removal Performance. Environment Protection Engineering 2018, 44, 159–167. [Google Scholar] [CrossRef]
- Nuncio-Jáuregui, N.; Cano-Lamadrid, M.; Hernández, F.; Carbonell-Barrachina, Á. A.; Calín-Sánchez, Á. Comparison of Fresh and Commercial Pomegranate Juices from Mollar de Elche Cultivar Grown under Conventional or Organic Farming Practices. 2015, 34–44. [Google Scholar] [CrossRef]
- Bulska, E.; Ruszczyńska, A. Analytical Techniques for Trace Element Determination. Physical Sciences Reviews 2017, 2(5). [Google Scholar] [CrossRef]
- Hill, S. J.; Fisher, A. S. Atomic Absorption, Methods and Instrumentation*. In Encyclopedia of Spectroscopy and Spectrometry (Second Edition); Lindon, J. C., Ed.; Academic Press: Oxford, 1999; pp. 46–53. [Google Scholar] [CrossRef]
- Bagherian, G.; Arab Chamjangali, M.; Shariati Evari, H.; Ashrafi, M. Determination of Copper(II) by Flame Atomic Absorption Spectrometry after Its Perconcentration by a Highly Selective and Environmentally Friendly Dispersive Liquid–Liquid Microextraction Technique. Journal of Analytical Science and Technology 2019, 10(1), 1–11. [Google Scholar] [CrossRef]
- Escudero, L. A.; Blanchet, A. J.; Sombra, L. L.; Salonia, J. A.; Gasquez, J. A. Determination of the Total and Extractable Fraction of Ni in Lake Sediments and Natural Waters of San Luis (Argentina) by FAAS Using a Simple Solid Phase Extraction System. Microchemical Journal 2014, 116, 92–97. [Google Scholar] [CrossRef]
- Salih, S. I.; Oleiwi, J. K.; Mohamed, A. S. INVESTIGATION OF MECHANICAL PROPERTIES OF PMMA COMPOSITE REINFORCED WITH DIFFERENT TYPES OF NATURAL POWDERS. 2018, 13(22). [Google Scholar]
- Hashem, A.; Aniagor, C. O.; Fikry, M.; Taha, G. M.; Badawy, S. M. Characterization and Adsorption of Raw Pomegranate Peel Powder for Lead (II) Ions Removal. J Mater Cycles Waste Manag 2023, 25(4), 2087–2100. [Google Scholar] [CrossRef]
- Ben-Ali, S. Application of Raw and Modified Pomegranate Peel for Wastewater Treatment: A Literature Overview and Analysis. International Journal of Chemical Engineering 2021, 2021(1), 8840907. [Google Scholar] [CrossRef]
- Bacsik, Z.; Mink, J.; Keresztury, G. FTIR Spectroscopy of the Atmosphere. I. Principles and Methods. Applied Spectroscopy Reviews 2004, 39(3), 295–363. [Google Scholar] [CrossRef]
- Magangana, T. P.; Makunga, N. P.; Fawole, O. A.; Opara, U. L. Processing Factors Affecting the Phytochemical and Nutritional Properties of Pomegranate (Punica Granatum L.) Peel Waste: A Review. Molecules 2020, 25(20), 4690. [Google Scholar] [CrossRef]
- Baines, D. 1 - Defining the Term ‘Natural’ in the Context of Food Products. In Natural food additives, ingredients and flavourings; Elsevier Ltd, 2012; pp. 1–22. [Google Scholar] [CrossRef]
- Peng, Y.; Gardner, D. J.; Han, Y. Drying Cellulose Nanofibrils: In Search of a Suitable Method. Cellulose 2012, 19(1), 91–102. [Google Scholar] [CrossRef]
- Tenea, A.-G.; Dinu, C.; Rus, P. A.; Ionescu, I. A.; Gheorghe, S.; Iancu, V. I.; Vasile, G. G.; Pascu, L. F.; Chiriac, F. L. Exploring Adsorption Dynamics of Heavy Metals onto Varied Commercial Microplastic Substrates: Isothermal Models and Kinetics Analysis. Heliyon 2024, 10(15), e35364. [Google Scholar] [CrossRef]
- Assegehegn, G.; Brito-de La Fuente, E.; Franco, J. M.; Gallegos, C. The Importance of Understanding the Freezing Step and Its Impact on Freeze-Drying Process Performance. Journal of Pharmaceutical Sciences 2019, 108(4), 1378–1395. [Google Scholar] [CrossRef]
- Baniasadi, H.; Fathi, Z.; Lizundia, E.; Cruz, C. D.; Abidnejad, R.; Fazeli, M.; Tammela, P.; Kontturi, E.; Lipponen, J.; Niskanen, J. Development and Characterization of Pomegranate Peel Extract-Infused Carboxymethyl Cellulose Composite Films for Functional, Sustainable Food Packaging. Food Hydrocolloids 2025, 158, 110525. [Google Scholar] [CrossRef]
- Shivakumara, L. R.; Demappa, T. Synthesis and Swelling Behavior of Sodium Alginate/Poly(Vinyl Alcohol) Hydrogels. Turk J Pharm Sci 2019, 16(3), 252–260. [Google Scholar] [CrossRef] [PubMed]
- El-Ashtoukhy, E.-S. Z.; Amin, N. K.; Abdelwahab, O. Removal of Lead (II) and Copper (II) from Aqueous Solution Using Pomegranate Peel as a New Adsorbent. Desalination 2008, 223(1–3), 162–173. [Google Scholar] [CrossRef]
- Parsons, S.; Poyntz-Wright, O.; Kent, A.; McManus, M. C. Green Chemistry for Stainless Steel Corrosion Resistance: Life Cycle Assessment of Citric Acid versus Nitric Acid Passivation. Materials Today Sustainability 2019, 3–4, 100005. [Google Scholar] [CrossRef]
- Safranin O Dye content = 85 477-73-6. https://www.sigmaaldrich.com/CA/en/product/sial/s2255?srsltid=AfmBOoq82HdBgKZj2ICNSP2DMJxitDgs0TeOyEH5k6Gj9DAOEjtL0NKm (accessed 2025-01-26).
- Copper - Copper. https://www.sigmaaldrich.com/CA/en/substance/copper63557440508 (accessed 2025-01-26).
- Natarajan, R.; Saikia, K.; Ponnusamy, S. K.; Rathankumar, A. K.; Rajendran, D. S.; Venkataraman, S.; Tannani, D. B.; Arvind, V.; Somanna, T.; Banerjee, K.; Mohideen, N.; Vaidyanathan, V. K. Understanding the Factors Affecting Adsorption of Pharmaceuticals on Different Adsorbents – A Critical Literature Update. Chemosphere 2022, 287(Part 1). [Google Scholar] [CrossRef]
- Fan, Y.; Lan, H.; Qi, Z.; Liu, R.; Hu, C. Removal of Nickel and Copper Ions in Strongly Acidic Conditions by In-Situ Formed Amyloid Fibrils. Chemosphere 2022, 297(Complete). [Google Scholar] [CrossRef]
- Saadi, W.; Othman, M.; Souissi-Najar, S.; Ouederni, A. COPPER ADSORPTION ONTO POMEGRANATE PEEL ACTIVATED CARBON AS A NEW ADSORBENT. Cellulose Chemistry and Technology 2023, 57. [Google Scholar] [CrossRef]
- Saeed, H.; Chaudhry, F. S.; Rehman, S.; Rashid, Z.; Ijaz, A.; Awan, J. A. Removal of Toxic Metallic Ions Cr(VI), Cu(II), Ni(II), Co(II) and Cd(II) from Waste Water Effluents of Tanneries by Using Punica Granatum (Pomgranate) Membrane. Iranica Journal of Energy & Environment 2016, 7(1), 52–57. [Google Scholar] [CrossRef]
- Salvaggio, A.; Marino, F.; Albano, M.; Pecoraro, R.; Camiolo, G.; Tibullo, D.; Bramanti, V.; Lombardo, B. M.; Saccone, S.; Mazzei, V.; Brundo, M. V. Toxic Effects of Zinc Chloride on the Bone Development in Danio Rerio (Hamilton, 1822). Front Physiol 2016, 7, 153. [Google Scholar] [CrossRef]
- Nashira, A.; Istiqomah, I.; Putri, A. N.; Badari, M. F. Carbon Footprint Analysis on Phosphoric Acid Production Using Wet Process at PT Petrokimia Gresik. E3S Web of Conf. 2024, 517, 08005. [Google Scholar] [CrossRef]
- Abbasi, Z.; Alikarami, M.; Homafar, A. Adsorption Study on Pomegranate Peel: Removal of Ni 2+ and Co 2+ from Aqueous Solution. Inorganic CHEMISTRY 2013. [Google Scholar]
- Nickel - Nickel. https://www.sigmaaldrich.com/CA/en/substance/nickel58697440020 (accessed 2025-02-15).
- Bhatnagar, A.; Minocha, A. K. Biosorption Optimization of Nickel Removal from Water Using Punica Granatum Peel Waste. Colloids and surfaces, B, Biointerfaces 2010, 76(2), 544–548. [Google Scholar] [CrossRef] [PubMed]
- Cuppett, J.; Duncan, S.; Dietrich, A. Evaluation of Copper Speciation and Water Quality Factors That Affect Aqueous Copper Tasting Response. Chemical senses 2006, 31, 689–697. [Google Scholar] [CrossRef] [PubMed]
Figure 1.
Process of synthesizing SA-PP-H.
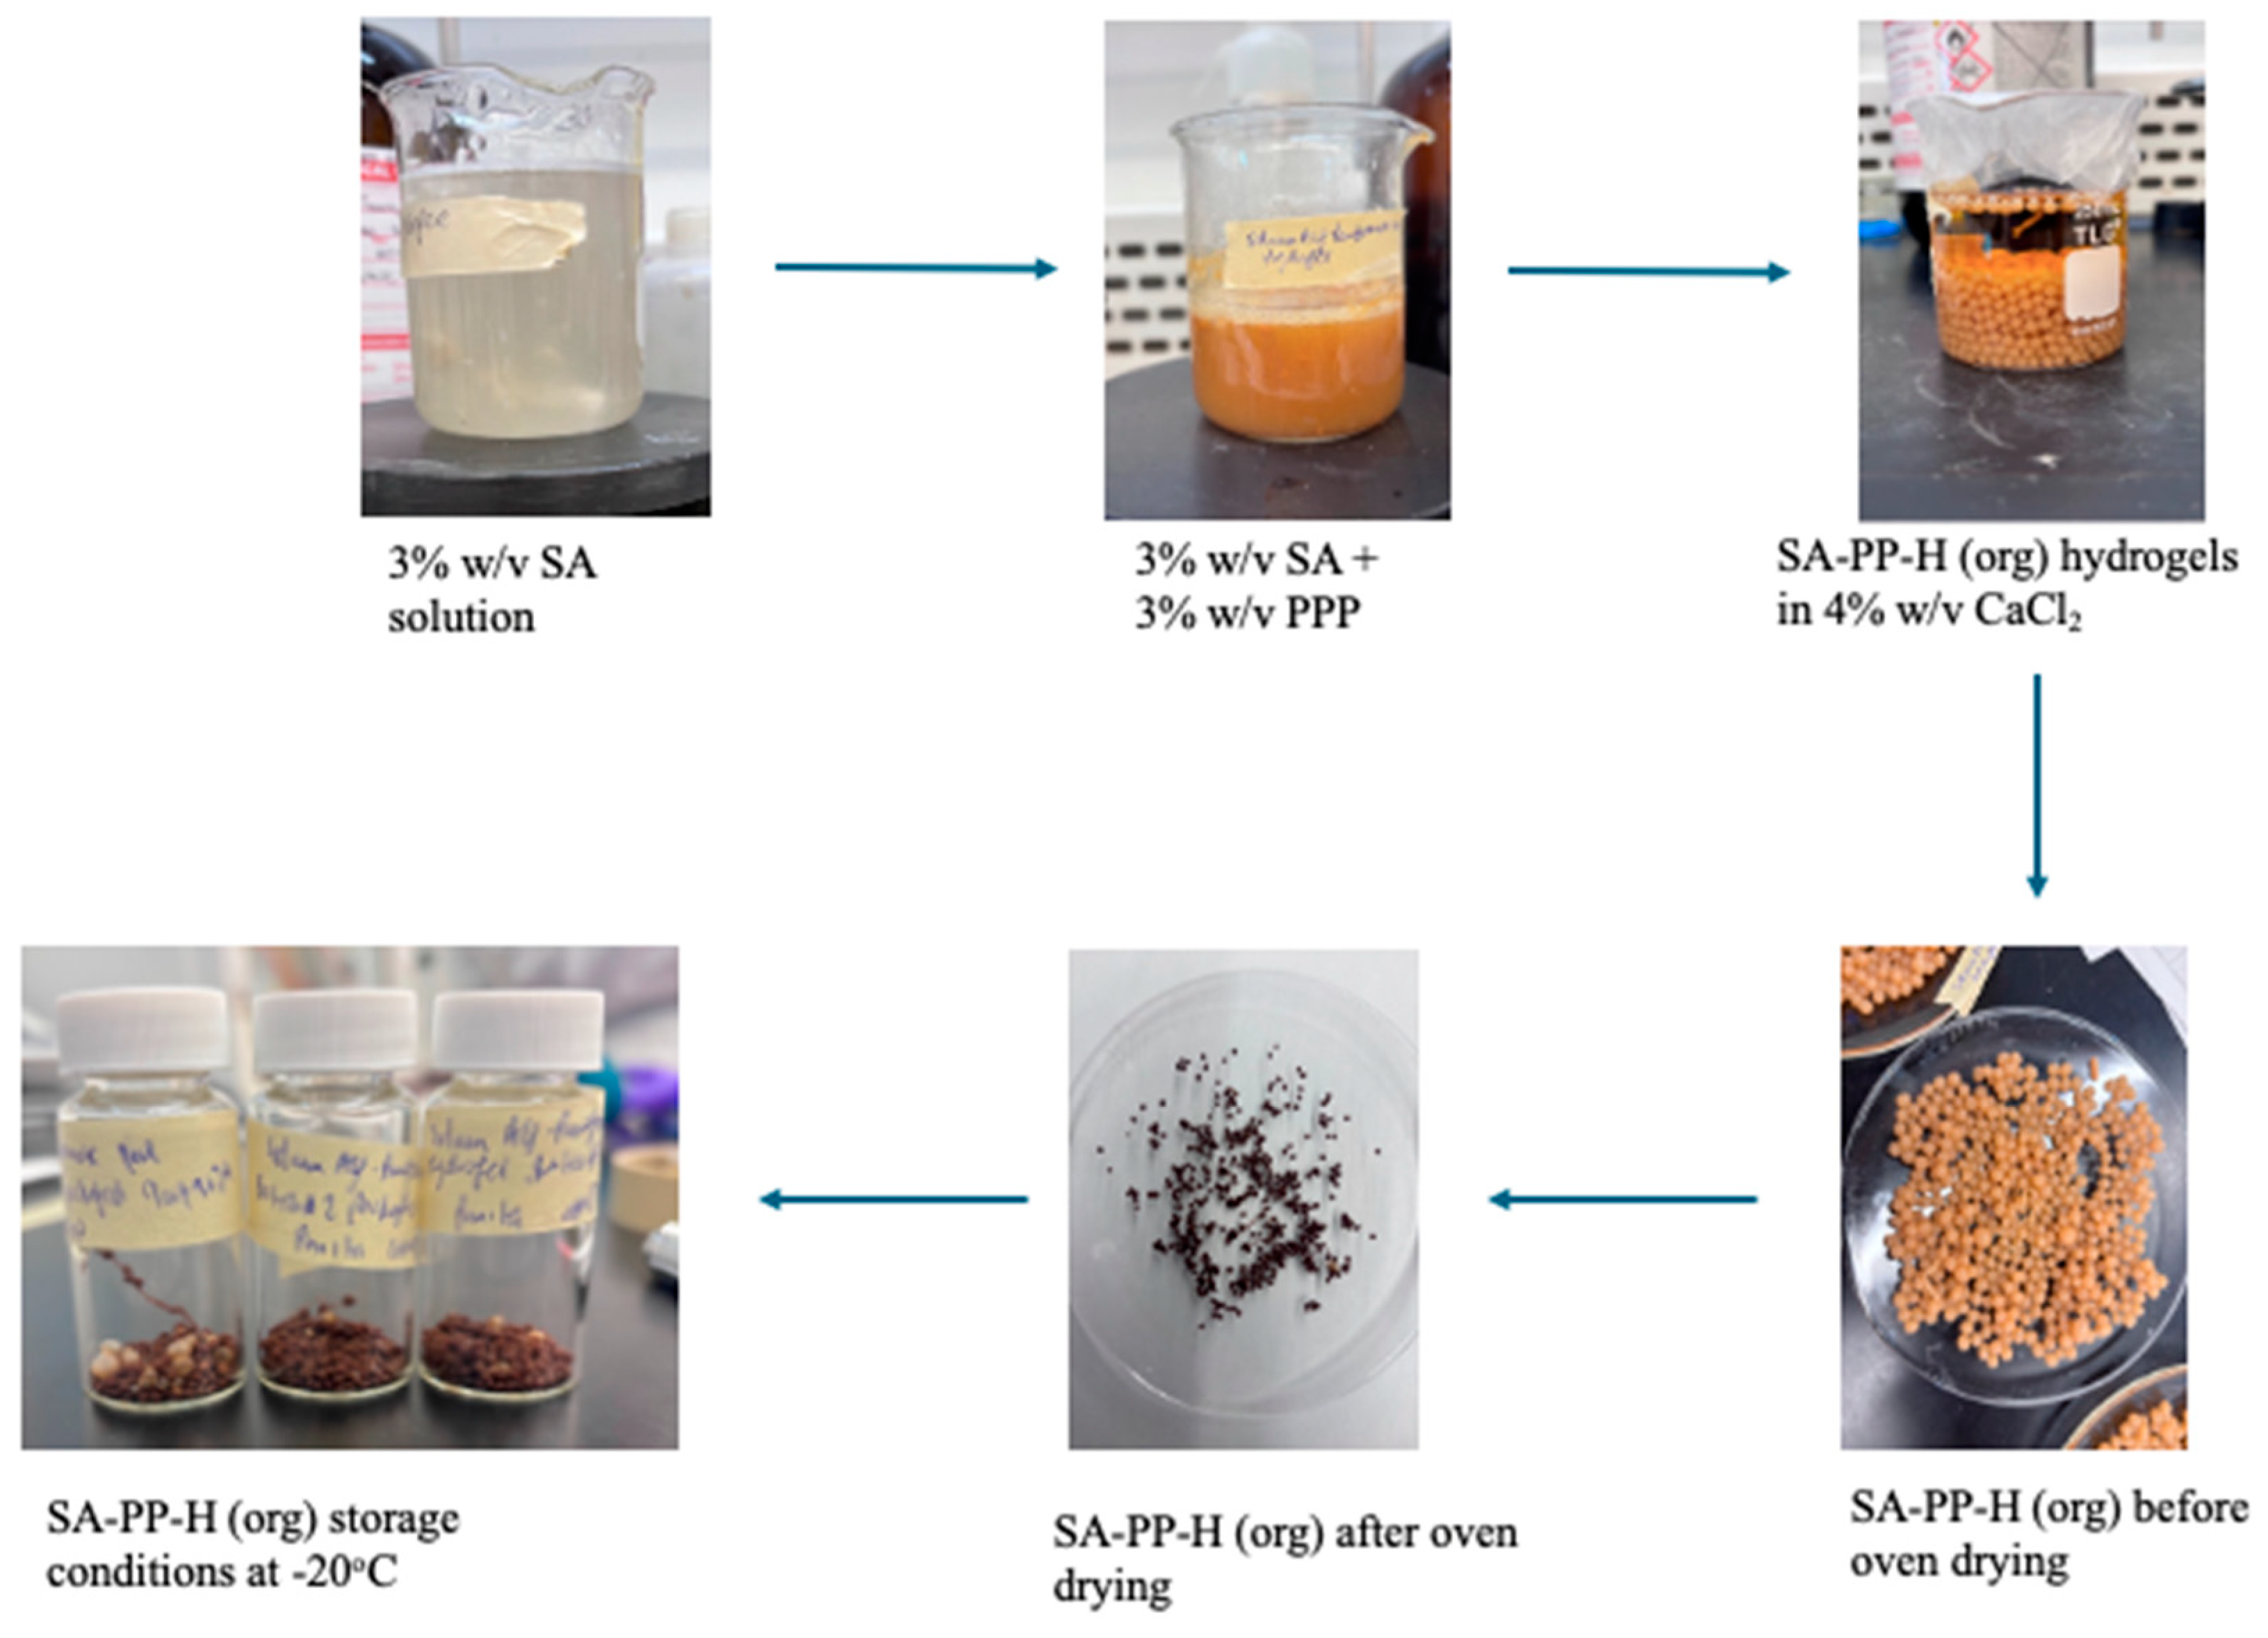
Figure 2.
Overlapped FTIR spectra of commercial vs organic pomegranate peel powder. Here PPP (com) is commercial pomegranate peel powder and PPP (org) is organic pomegranate peel powder.
Figure 2.
Overlapped FTIR spectra of commercial vs organic pomegranate peel powder. Here PPP (com) is commercial pomegranate peel powder and PPP (org) is organic pomegranate peel powder.
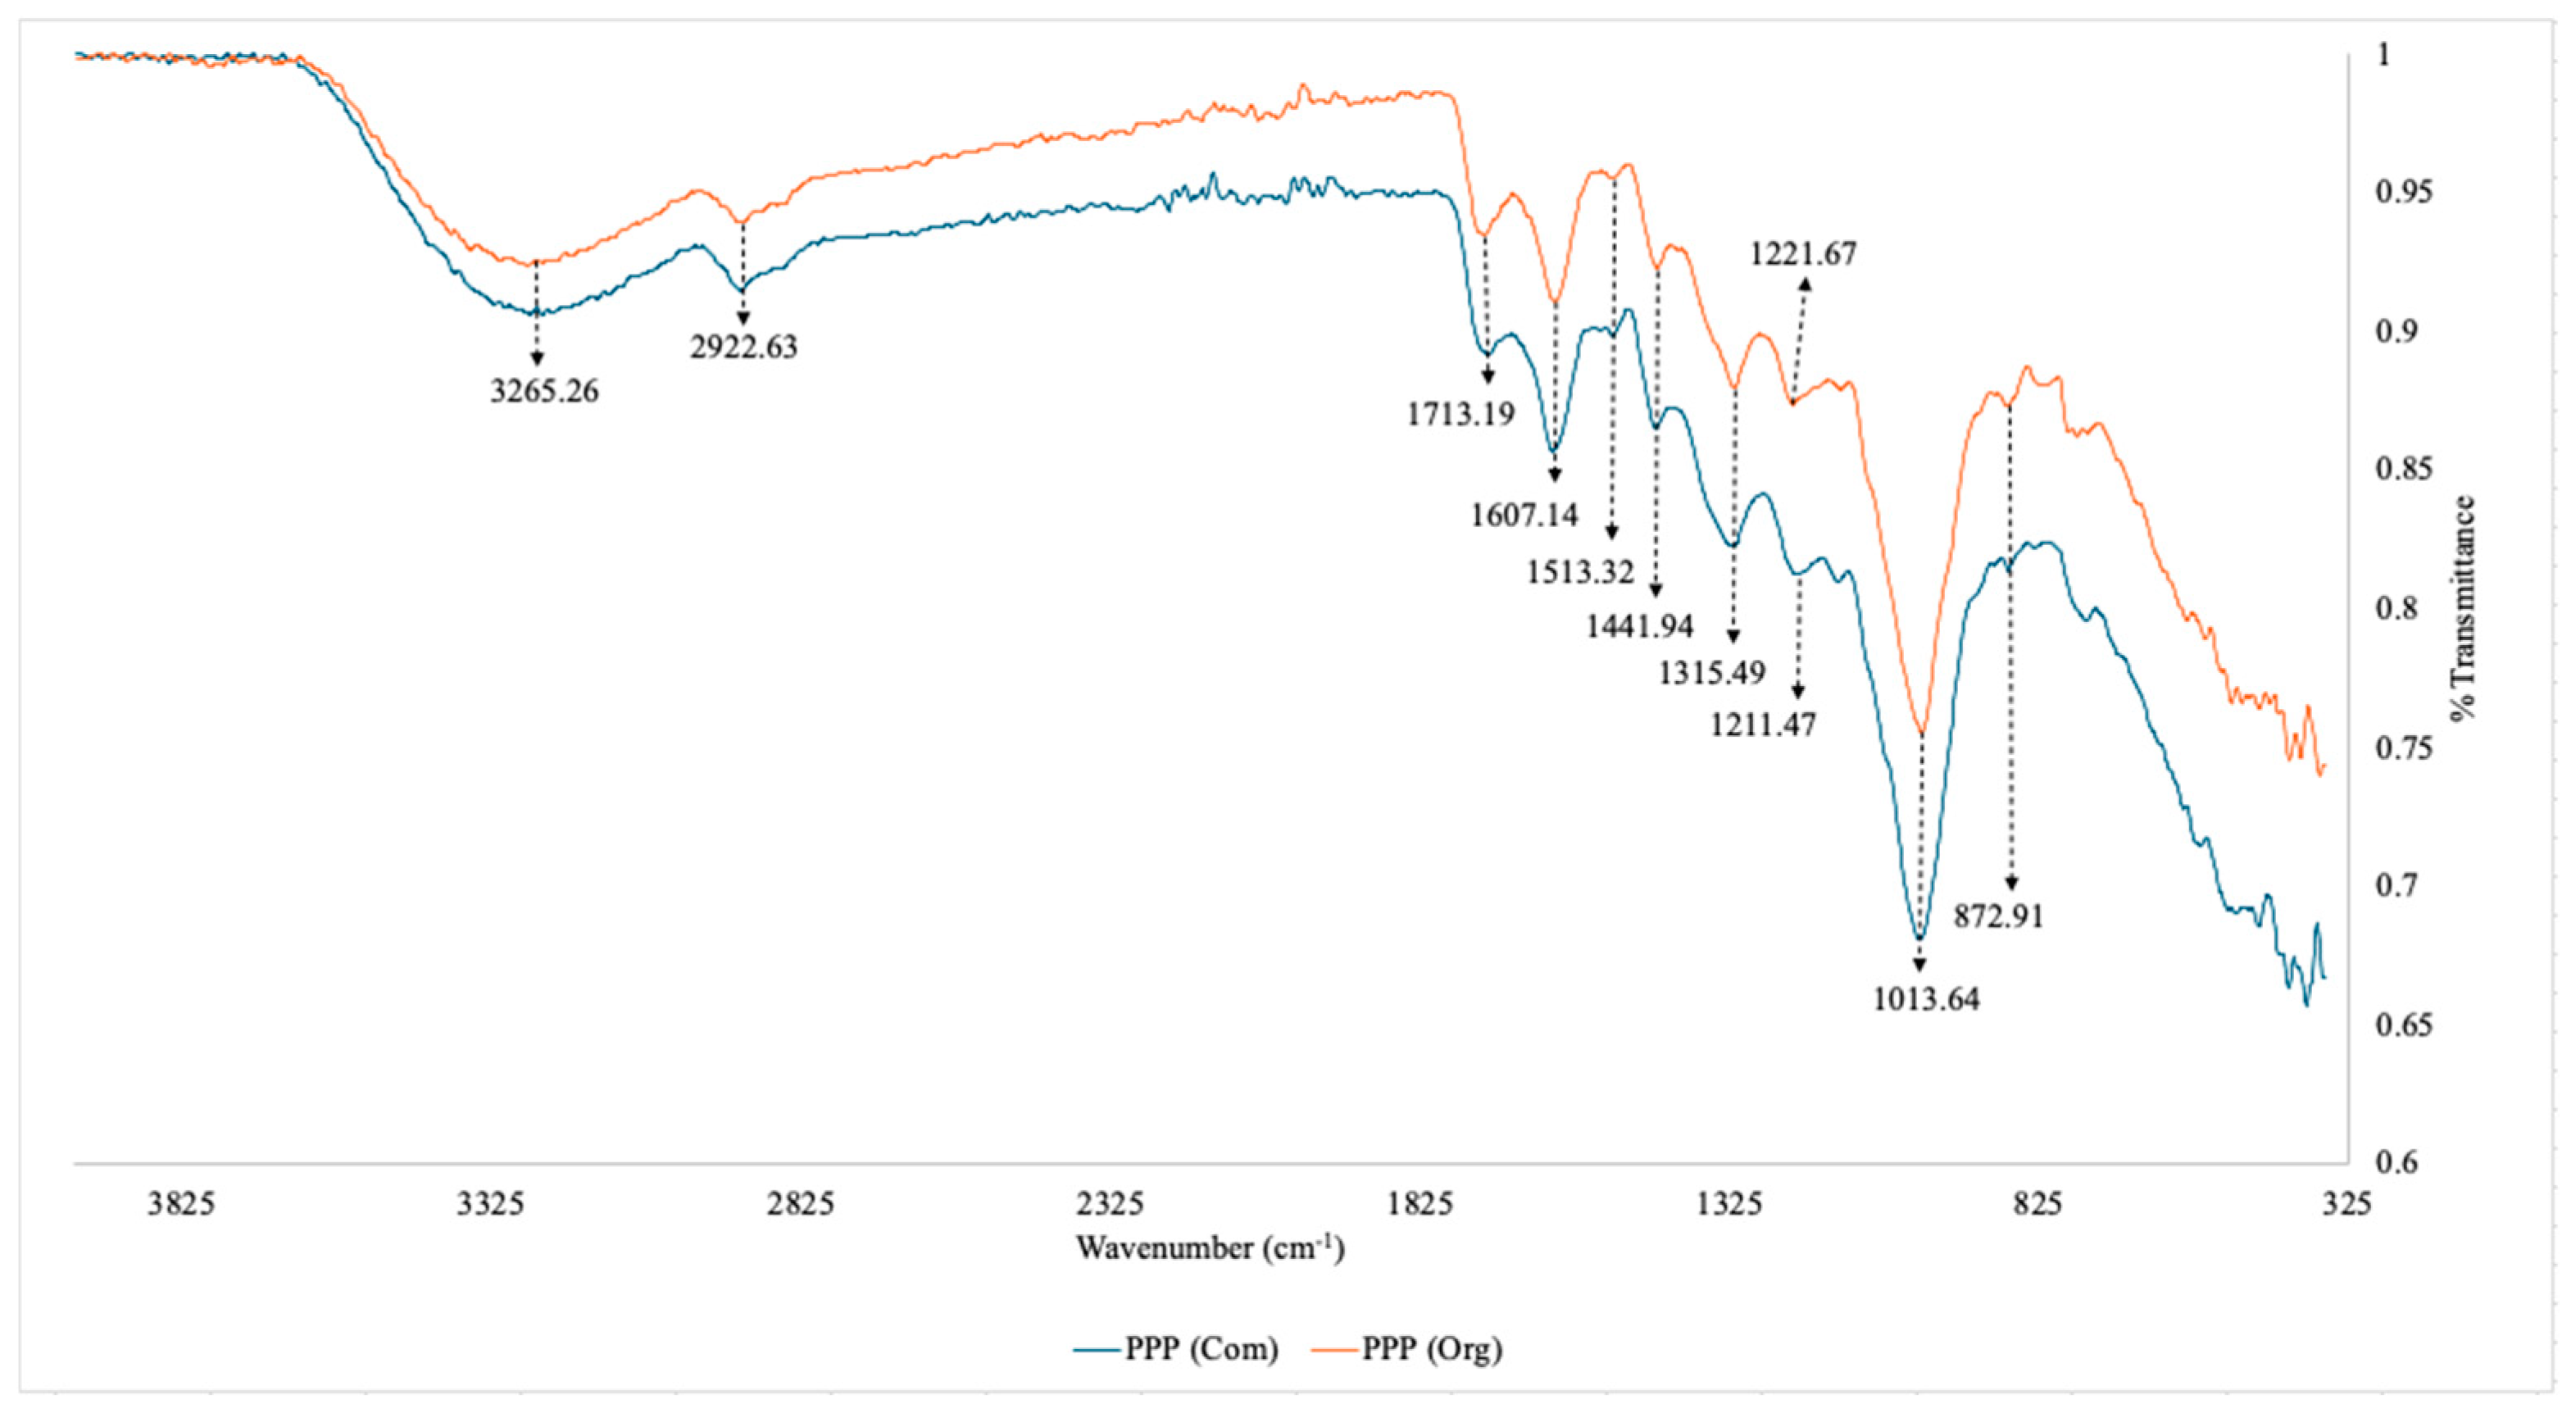
Figure 3.
Overlapped FTIR spectra of Sodium Alginate Hydrogels (SA-H), Sodium Alginate-Pomegranate Peel Hydrogels synthesized from commercial pomegranate peel (SA-PP-H (com)), and Sodium Alginate-Pomegranate Peel Hydrogels synthesized from organic pomegranate peel (SA-PP-H(org)).
Figure 3.
Overlapped FTIR spectra of Sodium Alginate Hydrogels (SA-H), Sodium Alginate-Pomegranate Peel Hydrogels synthesized from commercial pomegranate peel (SA-PP-H (com)), and Sodium Alginate-Pomegranate Peel Hydrogels synthesized from organic pomegranate peel (SA-PP-H(org)).
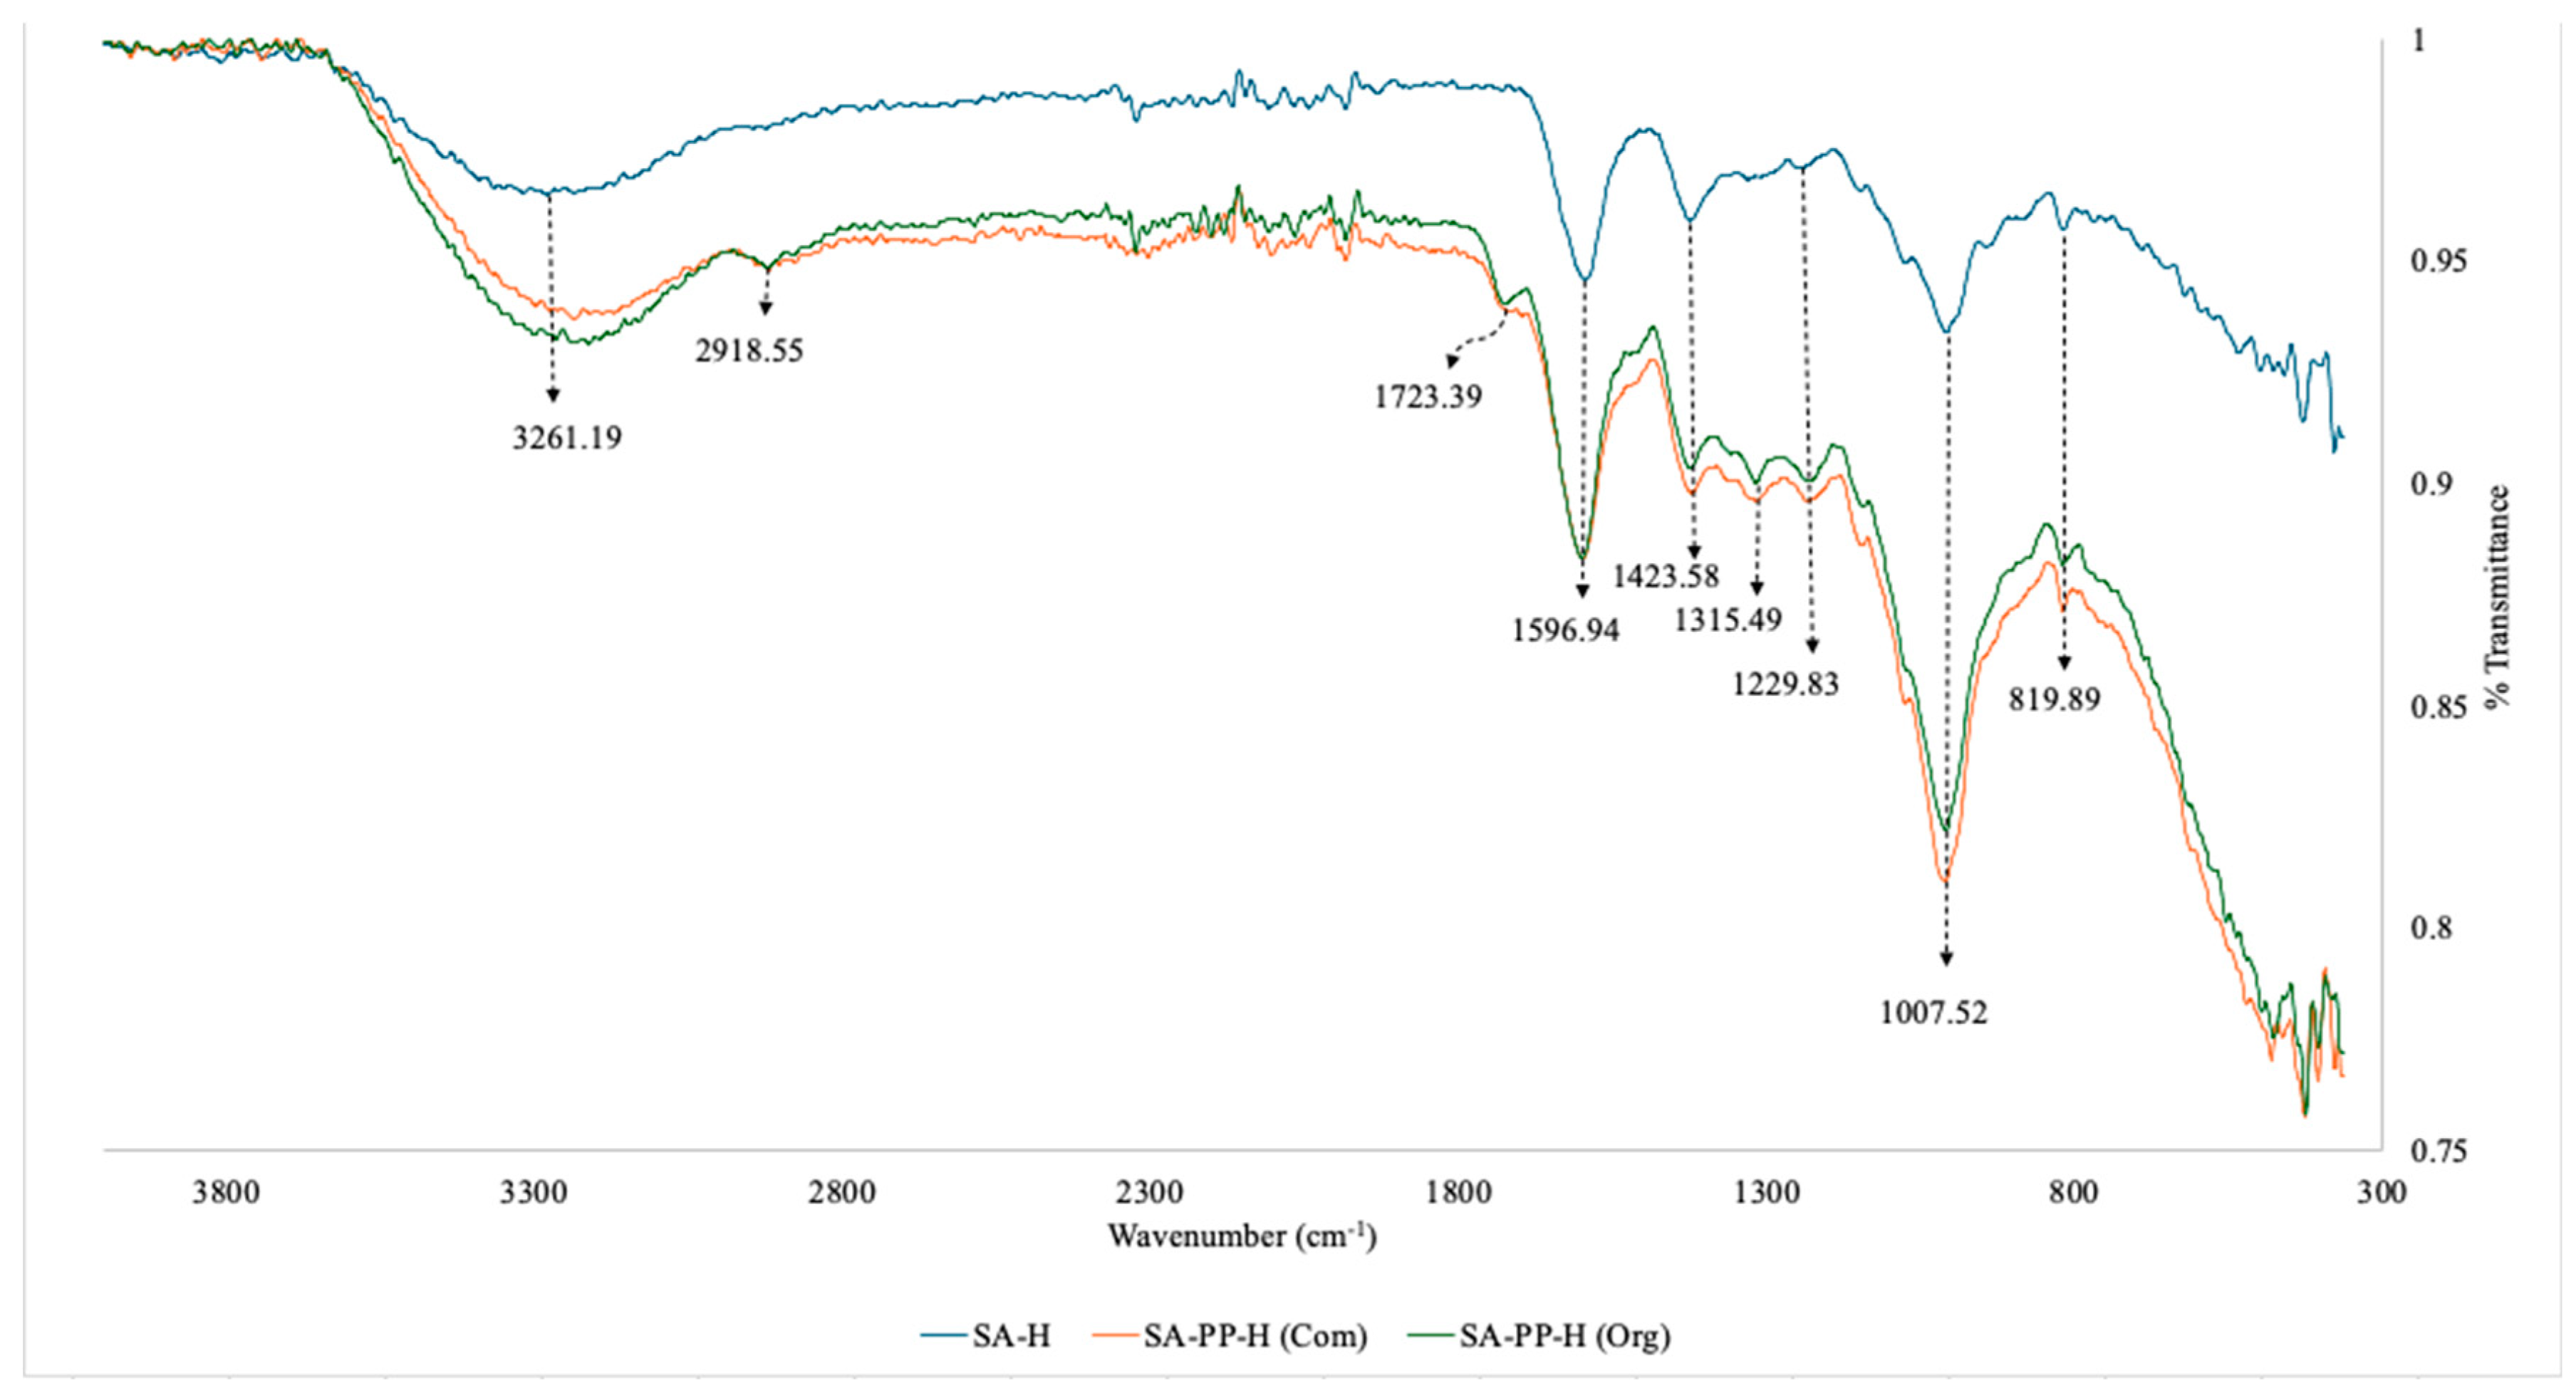
Figure 4.
SEM image of the surface of SA-PP-H (org) (1a,2a,3a), SA-H (1b,2b,3b) and SA-PP-H (org) after Cu adsorption (1c,2c,3c) at different magnifications (1.00mm, 50.0µm, 100 µm).
Figure 4.
SEM image of the surface of SA-PP-H (org) (1a,2a,3a), SA-H (1b,2b,3b) and SA-PP-H (org) after Cu adsorption (1c,2c,3c) at different magnifications (1.00mm, 50.0µm, 100 µm).
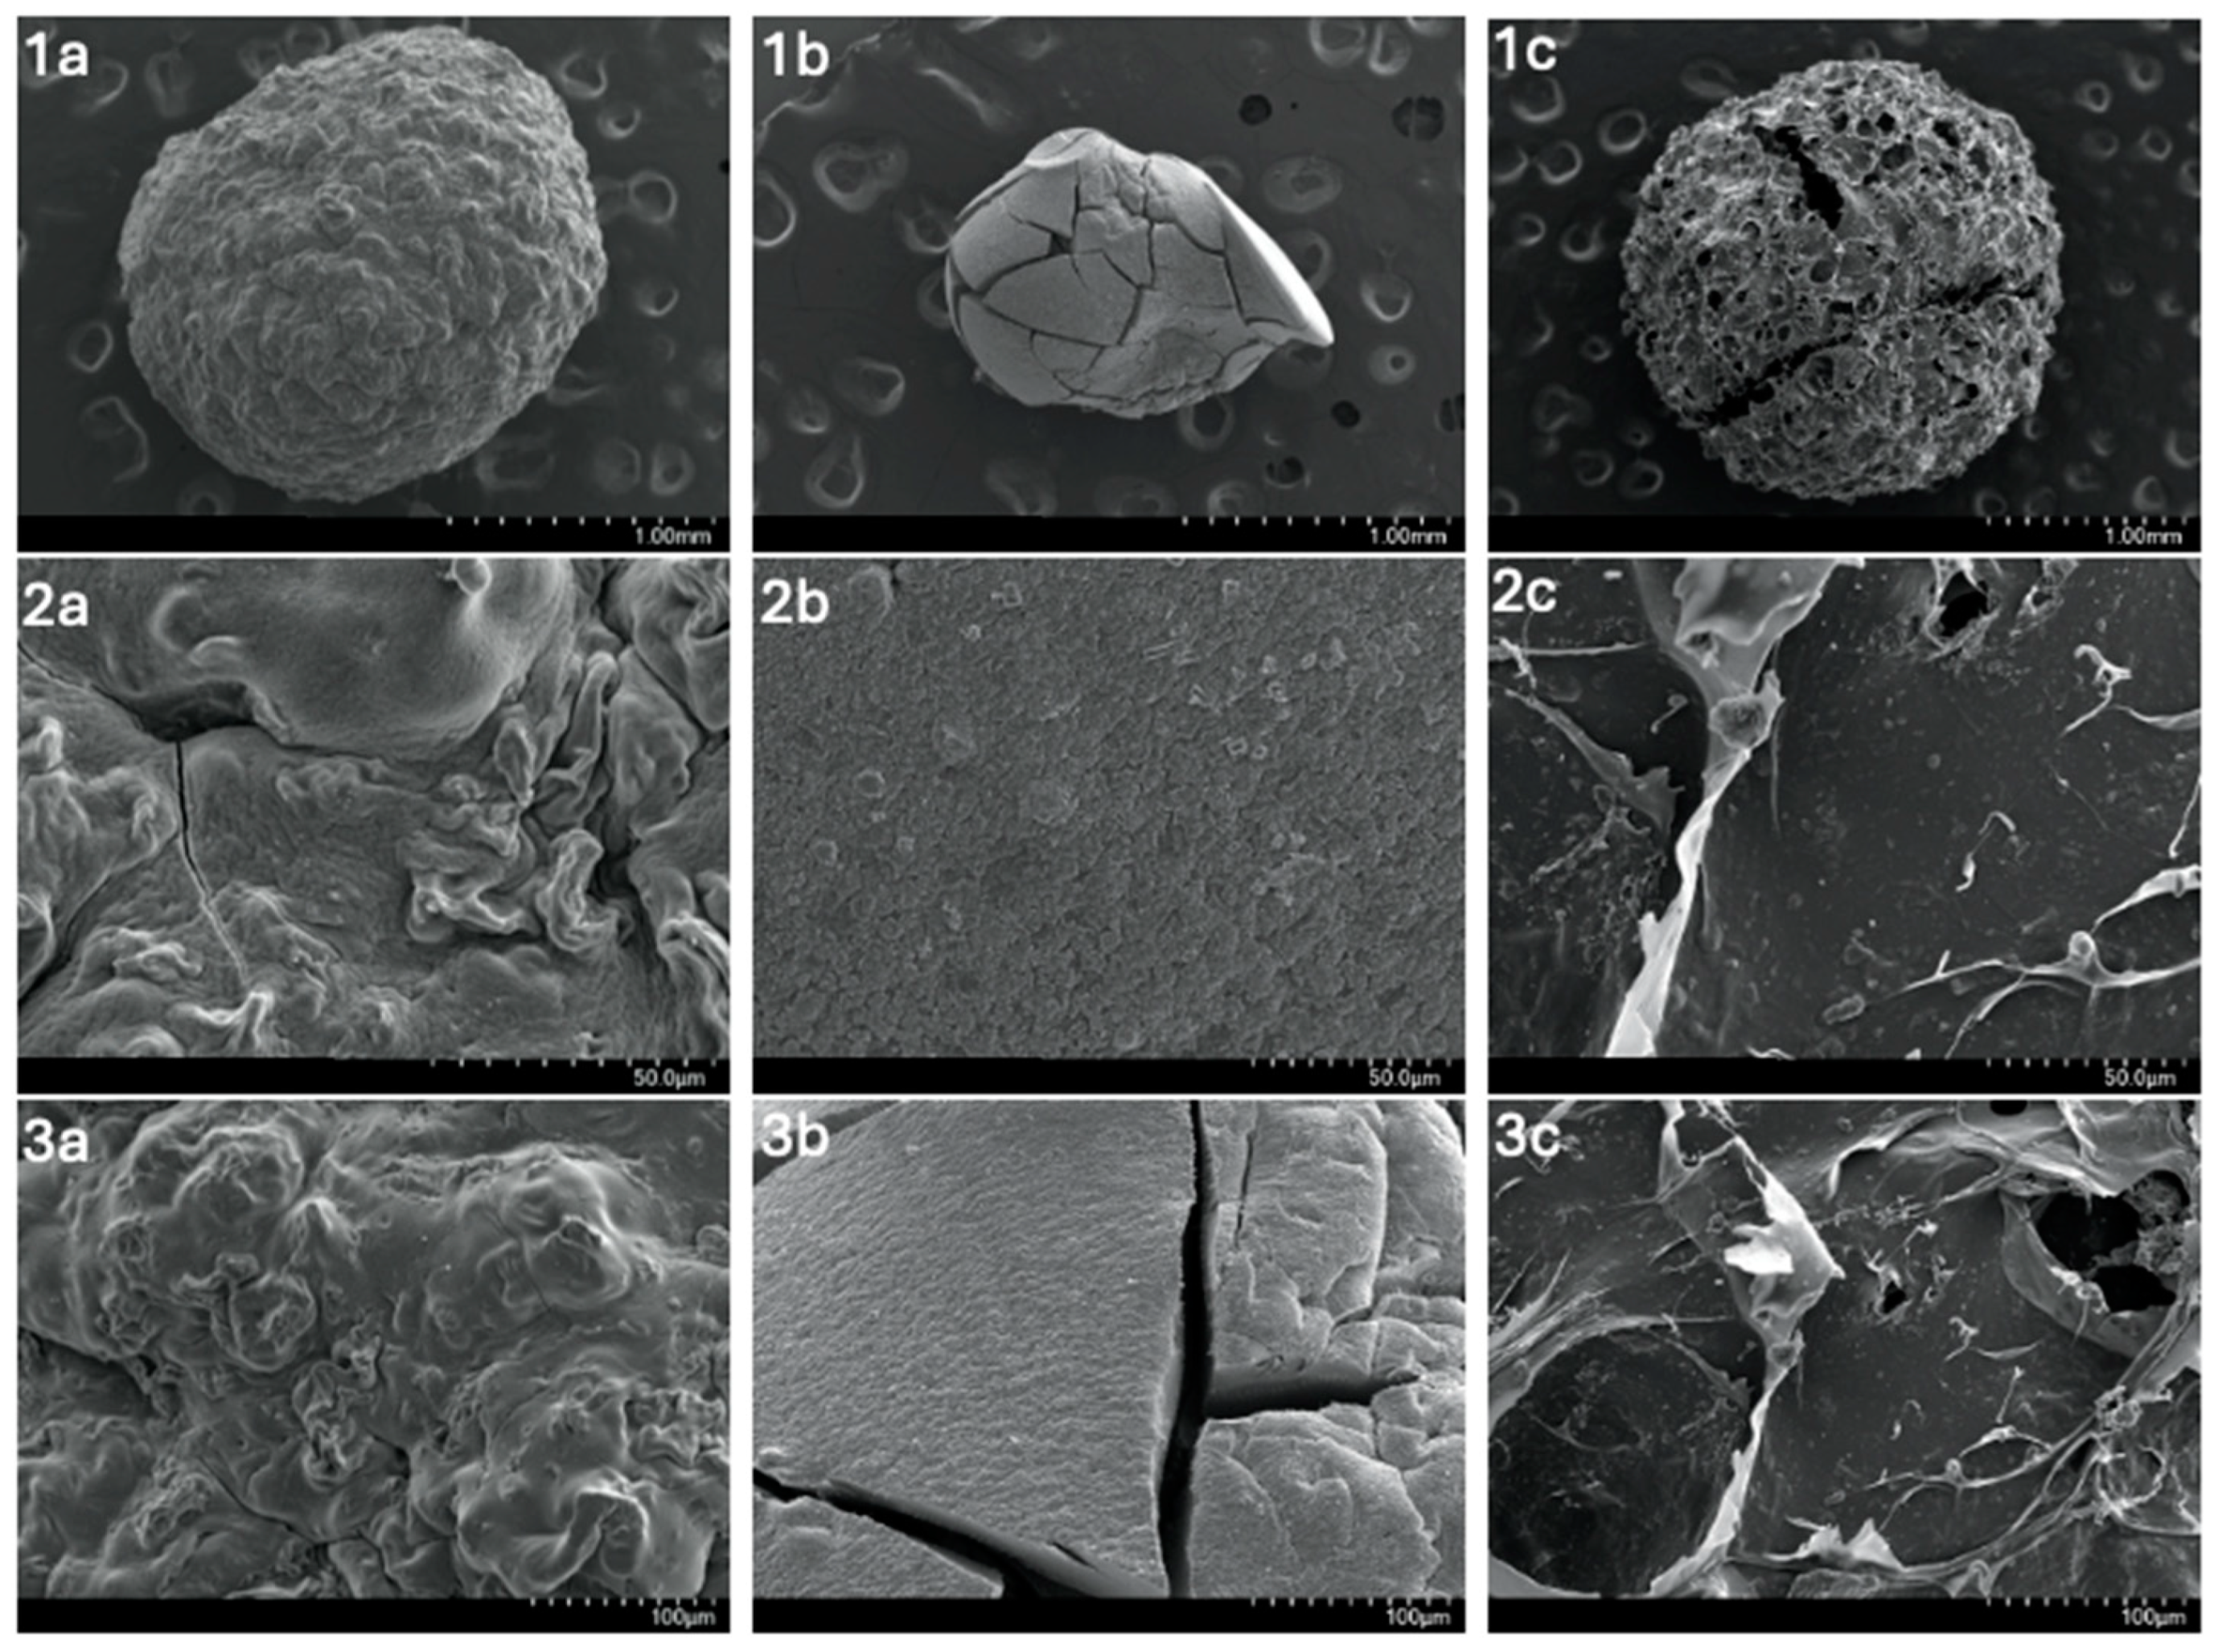
Figure 5.
SEM image of the cross-section of SA-PP-H (org) (1a,2a,3a), SA-H (1b,2b,3b) and SA-PP-H (org) after Cu adsorption (1c,2c,3c) at different magnifications (1.00mm, 50.0µm, 100 µm).
Figure 5.
SEM image of the cross-section of SA-PP-H (org) (1a,2a,3a), SA-H (1b,2b,3b) and SA-PP-H (org) after Cu adsorption (1c,2c,3c) at different magnifications (1.00mm, 50.0µm, 100 µm).
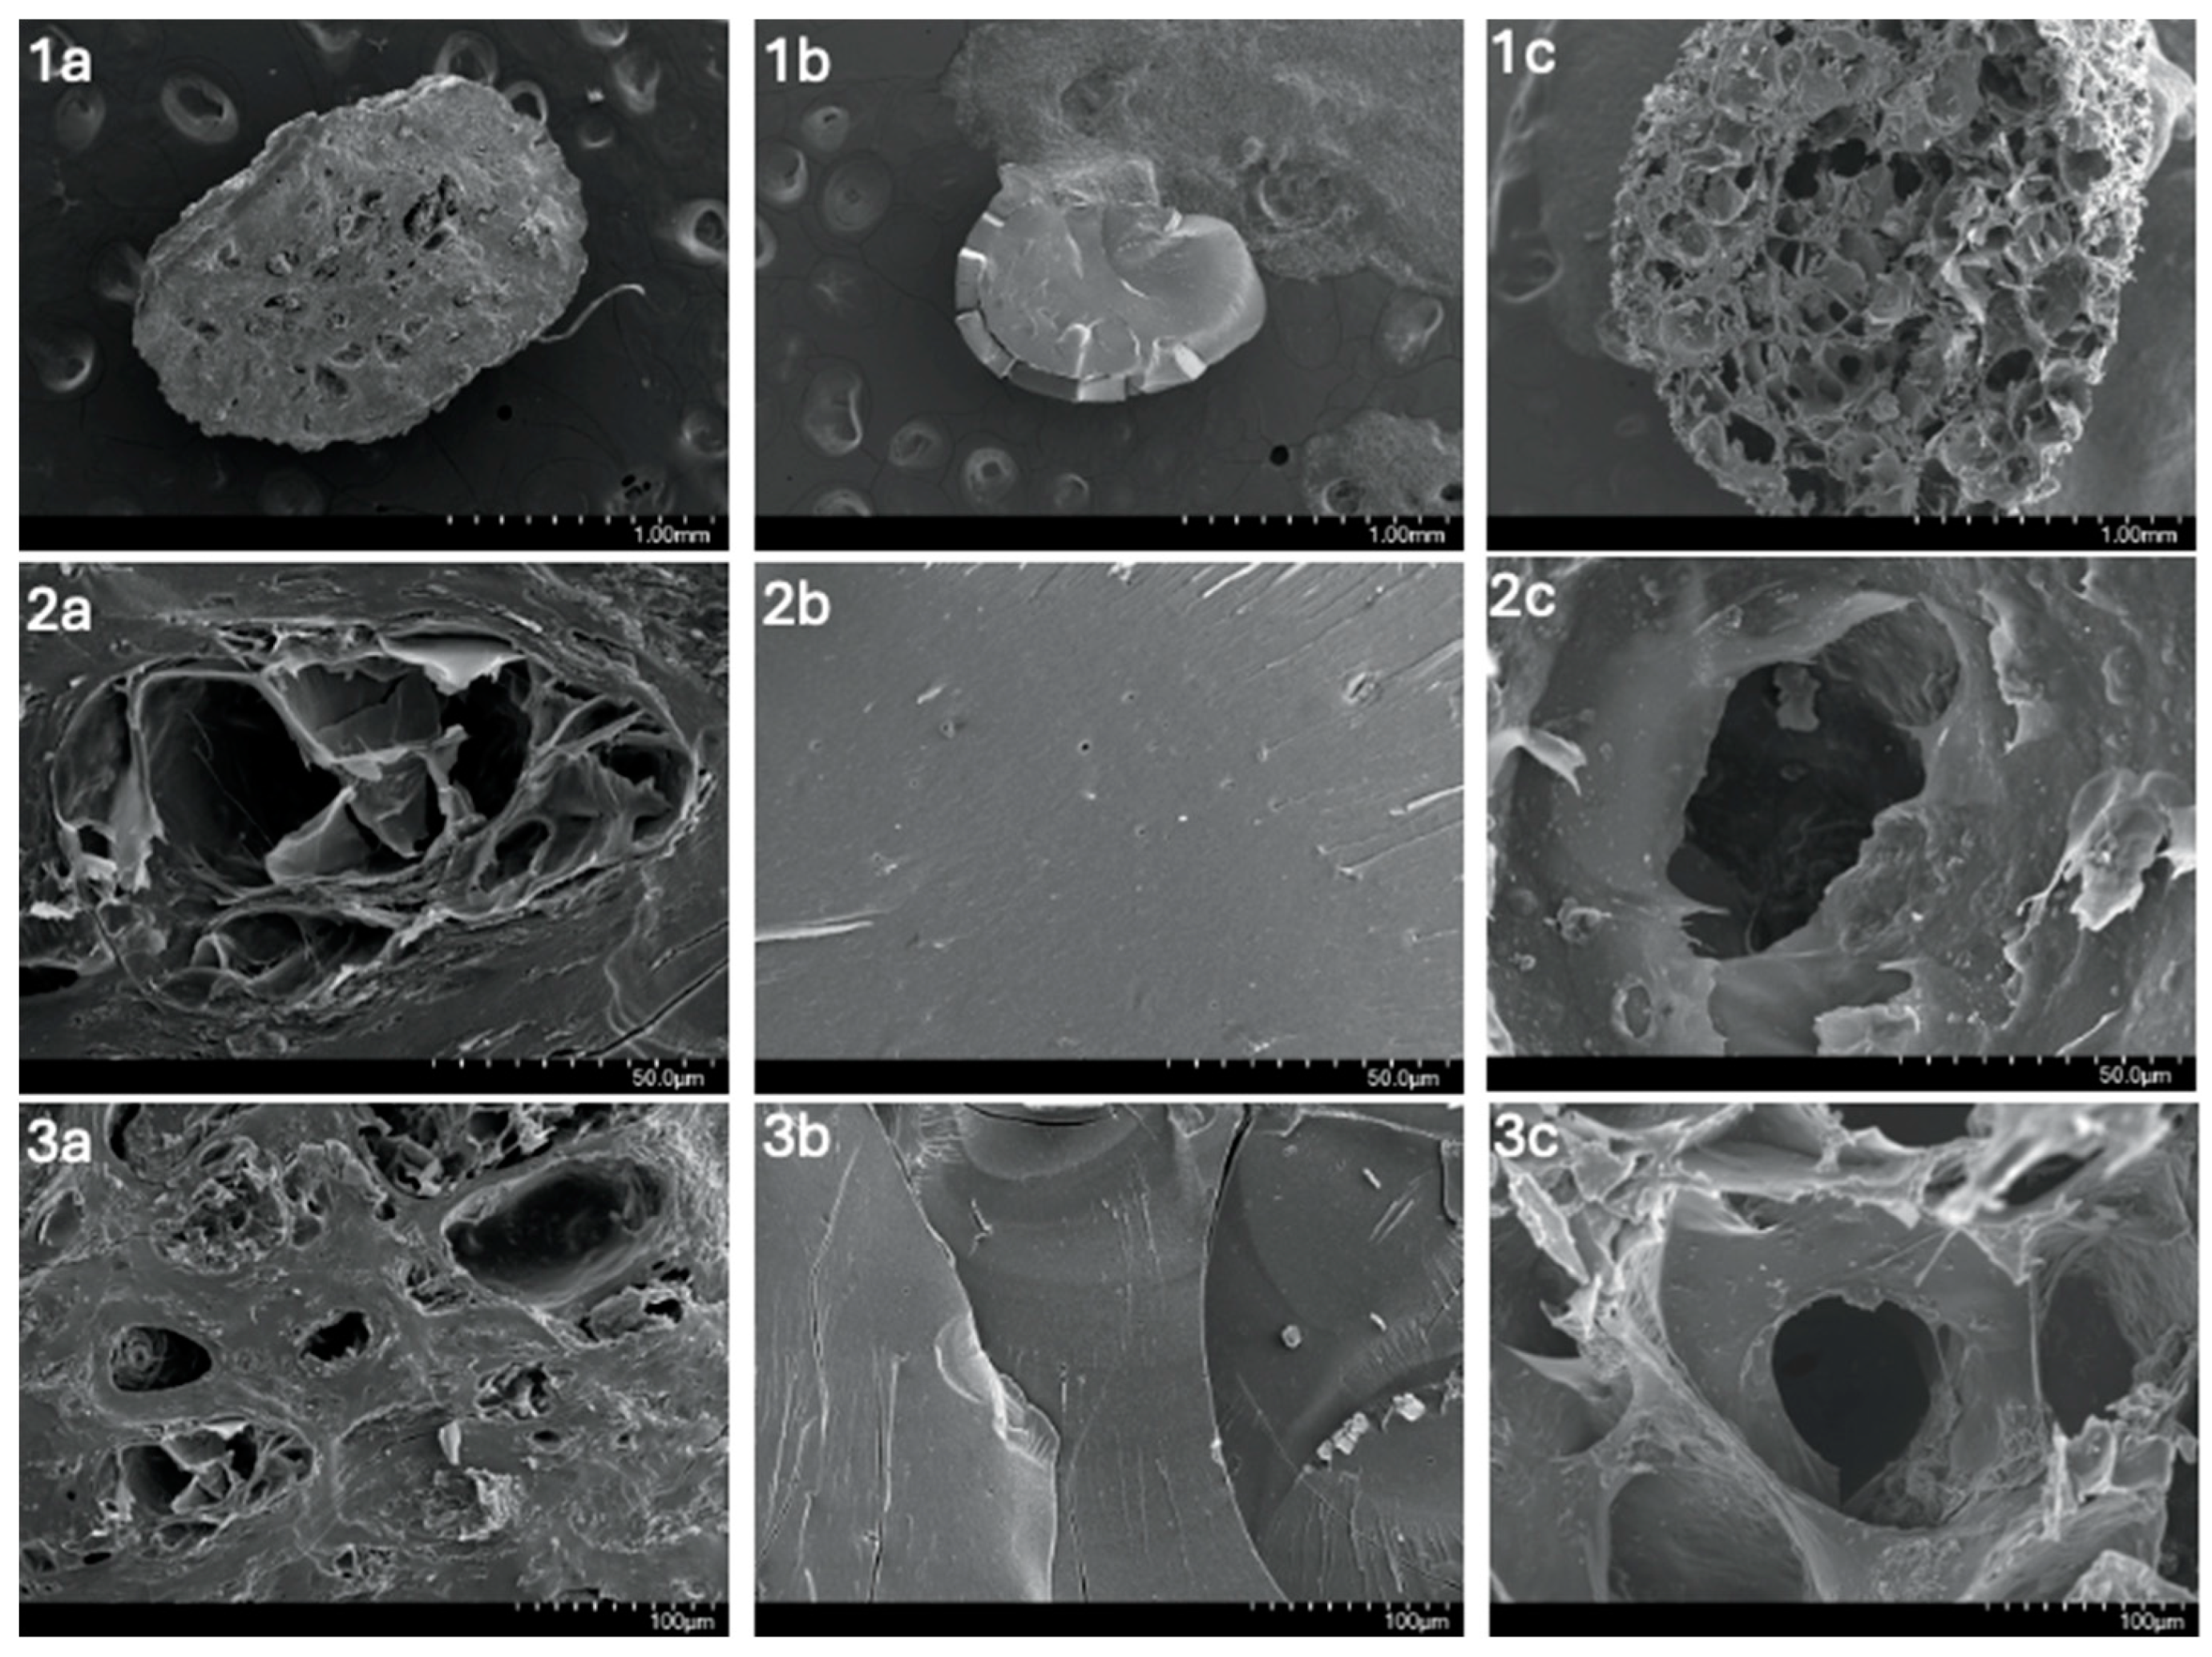
Figure 6.
Size distribution of wet (A), oven-dried (B) and lyophilized (C) sodium alginate beads. The average diameters were 9.91 ± 0.65, 0.95 ± 0.13 and 1.63 ± 0.24 mm for the wet, dried and lyophilized sodium alginate beads, respectively. The sample size was 24 beads for each condition.
Figure 6.
Size distribution of wet (A), oven-dried (B) and lyophilized (C) sodium alginate beads. The average diameters were 9.91 ± 0.65, 0.95 ± 0.13 and 1.63 ± 0.24 mm for the wet, dried and lyophilized sodium alginate beads, respectively. The sample size was 24 beads for each condition.
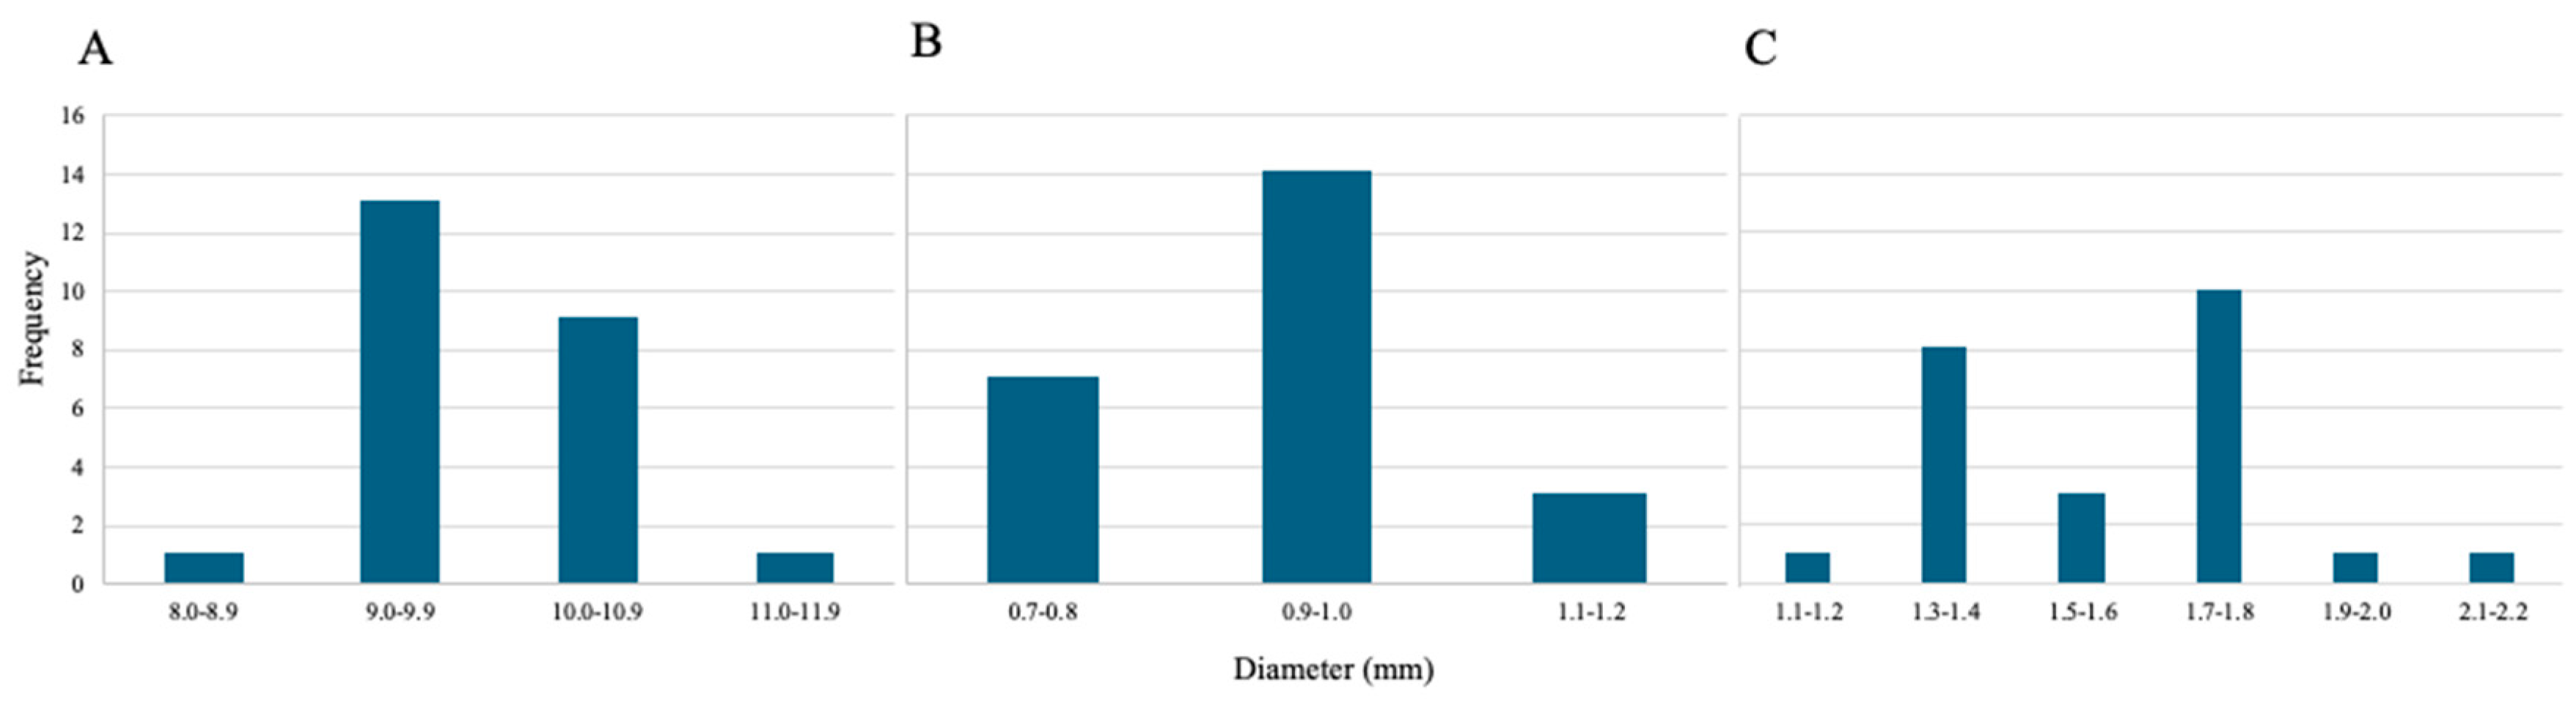
Figure 7.
Size distribution of wet (A), oven-dried (B) and lyophilized (C) sodium alginate-pomegranate peel (org) beads. The average diameters were 4.38 ± 0.33, 1.25 ± 0.19 and 1.45 ± 0.23 mm for the wet, dried and lyophilized sodium alginate-pomegranate peel (org) beads, respectively. The sample size was 24 beads for each condition.
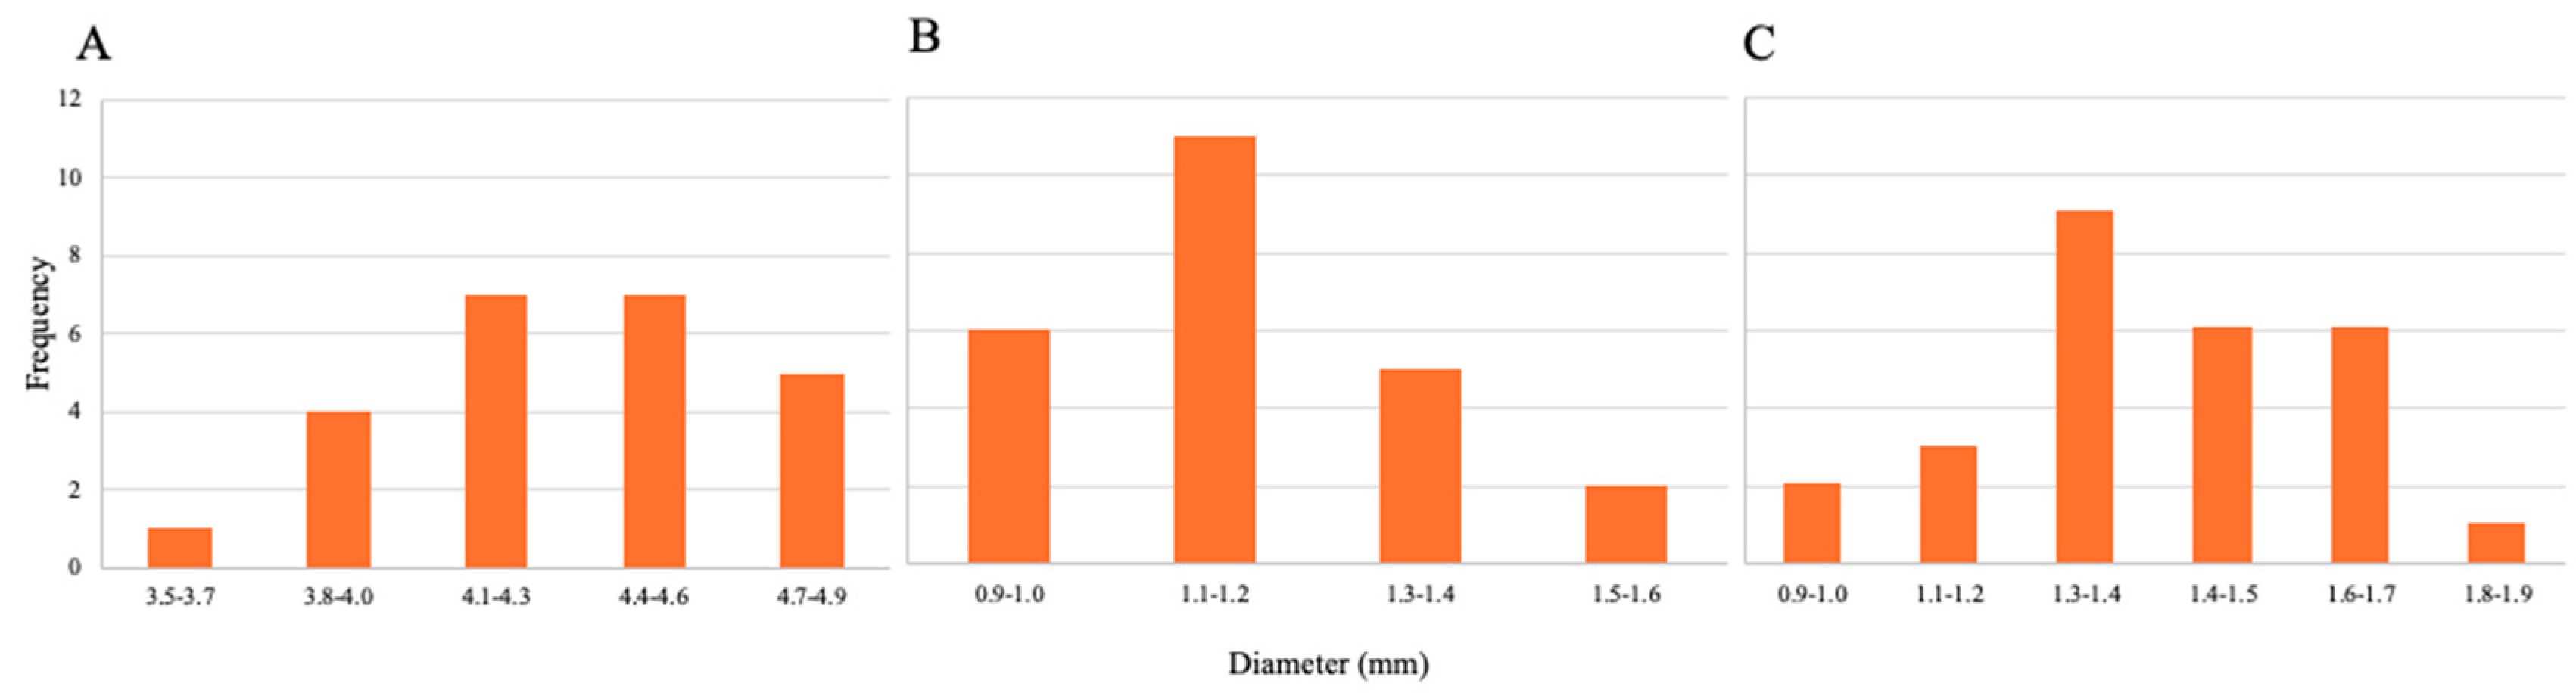
Figure 8.
Increasing the concentration of pomegranate peel in hydrogels increases mean water uptake percent. Pre-weighed hydrogels with varying pomegranate peel powder concentrations were treated with water for 1 hour and reweighed. A total of 3 trials were conducted for each ratio. The uptake percentages were 42.55 ± 1.96%, 52.61 ± 3.24%, 55.47 ± 3.29%, 59.92 ± 1.05%, 58.48 ± 6.33% and 60.07 ± 2.48% for a ratio of 0.00, 0.50, 0.75, 1.00, 1.50, and 2.00, respectively.
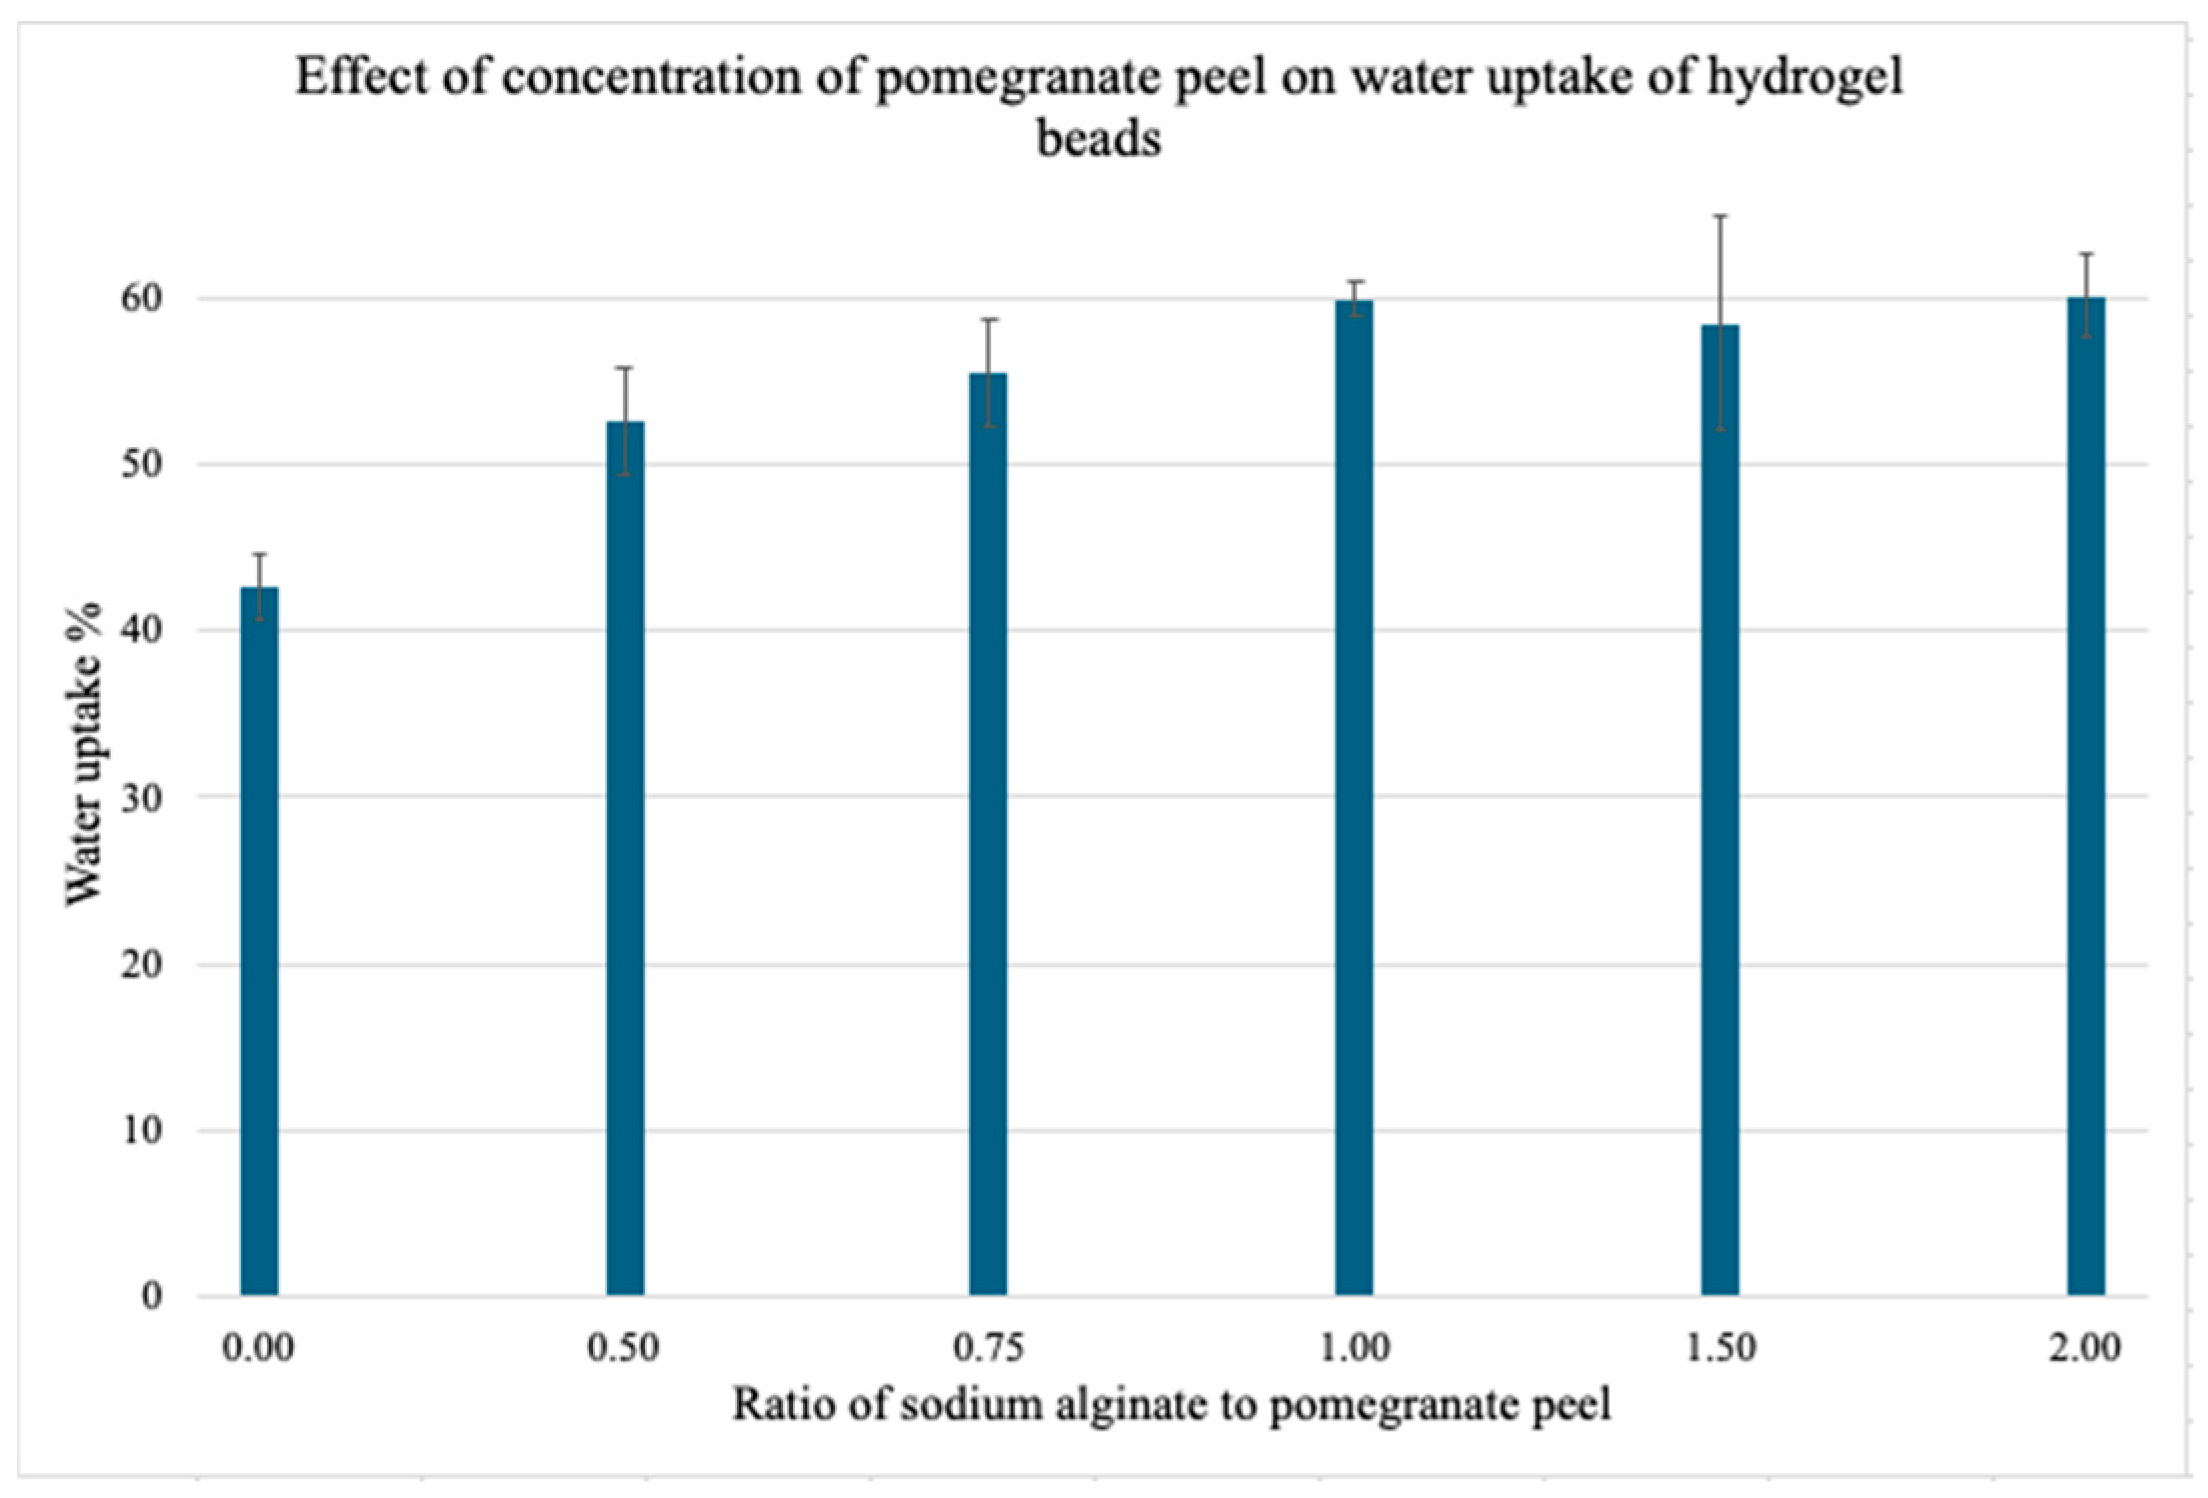
Figure 9.
Sodium alginate-pomegranate peel hydrogels made from commercial pomegranate peel powder (SA-PP-H(com)) and organic pomegranate peel powder showed a 1.40x and a 1.58x increase in water uptake as compared to sodium alginate hydrogels (SA-H), respectively. Pre-weighed hydrogels of different types were treated with water and then reweighed. A total of 3 trials were conducted for each type of hydrogel. The uptake percentages were 42.55 ± 1.96, 59.92 ± 1.05 and 67.49 ± 0.23 for SA-H gels, SA-PP-H (com), and SA-PP-H (org), respectively.
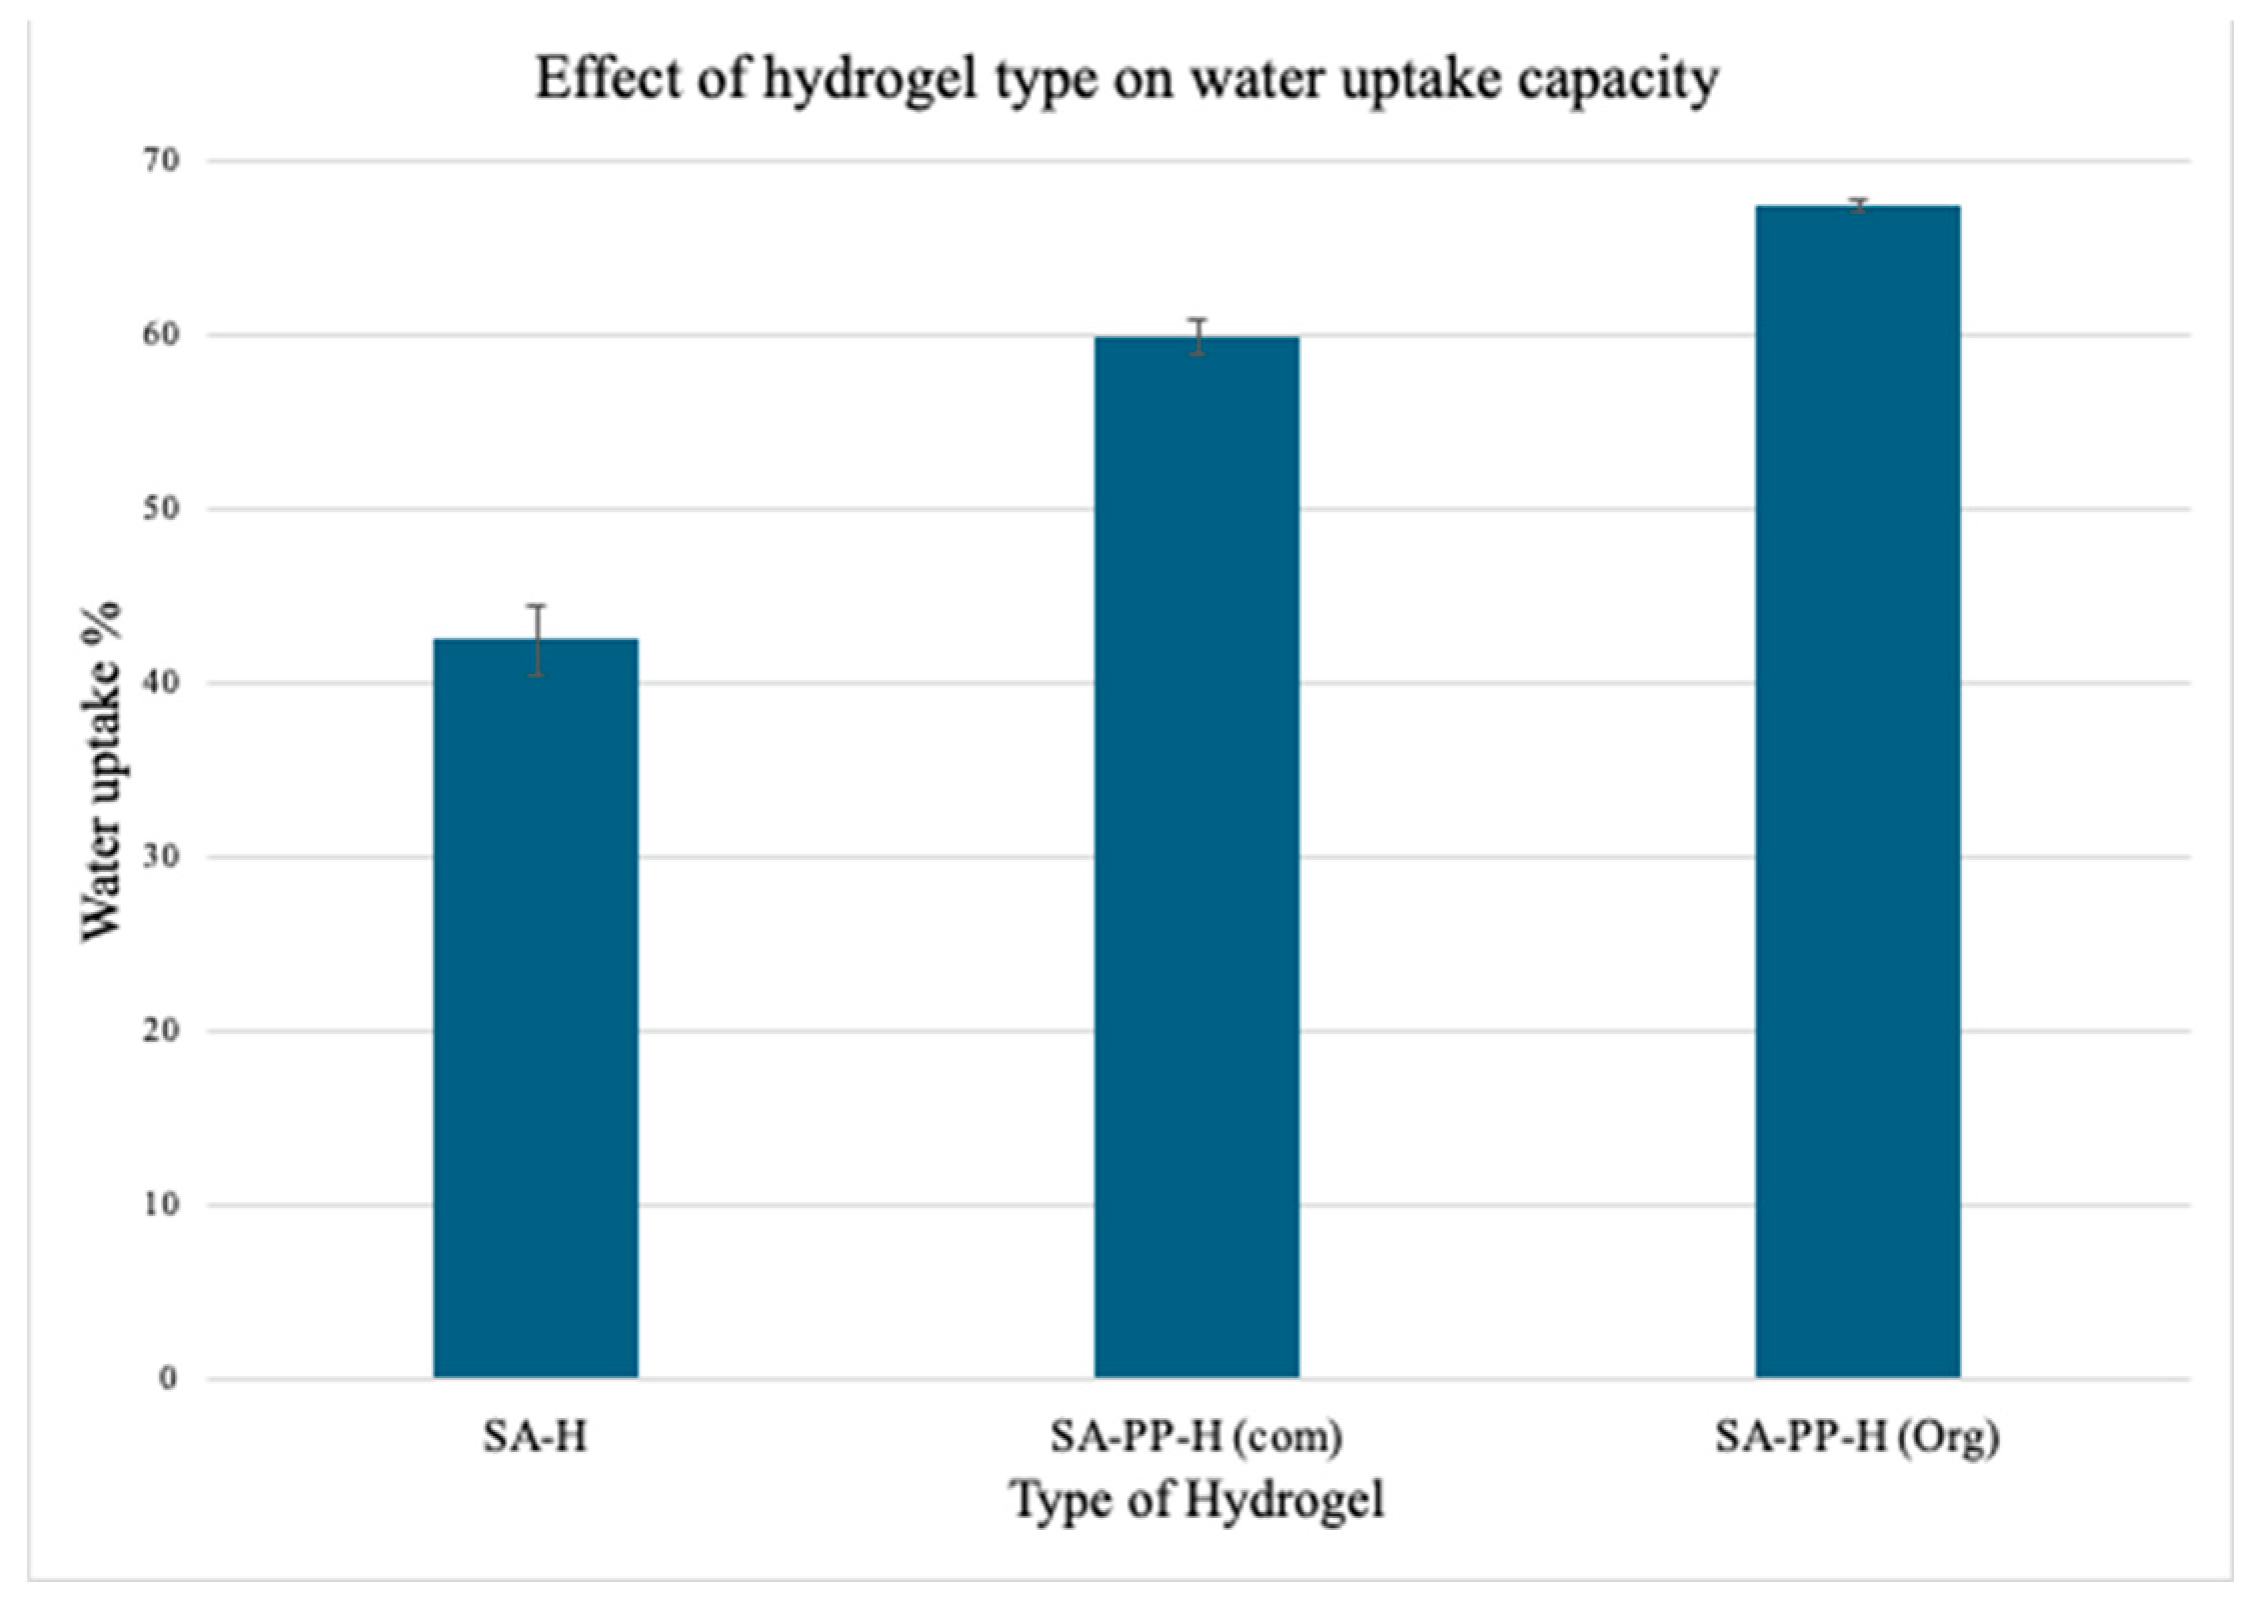
Figure 10.
The effect of contact time on adsorption of (A) copper and (B) nickel onto SA-PP-H (org). Hydrogels were placed in 50ppm CuNO3·3H2O (pH ~5.5) for 0, 5, 15, 25, 45, 60, 90 and 120 minutes or 50ppm NiNO3·6H2O (pH ~5) for 0, 5, 30, 60, 90 and 120 minutes, after which the supernatant was diluted 10 folds and filtered, then analyzed by FAAS. Three trials were conducted for each time point. As time increases, both the adsorption capacity (qt(mg/g); blue) and removal percent (R%; orange) of copper with SA-PP-H (org) increase. The increase in qt and R% plateaus at 60 minutes. The average adsorption capacities for copper were 2.44 ± 0.76, 30.76 ± 1.34, 30.52 ± 2.11, 31.17 ± 2.94, 31.97 ±2.48, 32.55 ± 2.14, 32.52 ± 2.60 and 33.06 ± 3.01 mg/g for 0, 5, 15, 25, 45, 60, 90, and 120 minutes, respectively. The removal percent for copper were 29.54 ± 1.83, 66.99 ± 1.82, 66.40 ± 1.05, 67.73 ± 2.03, 69.55 ±2.65, 70.83 ± 0.79, 70.70 ± 0.83, 71.83 ± 1.58 % for 5, 15, 25, 45, 60, 90, and 120 minutes, respectively. Moreover, as time increases, the adsorption capacity (qt(mg/g); blue) and removal percent (R%; orange) increases from 0 to 5 minutes then plateaus. The average adsorption capacities for nickel were 5.85 ± 1.08, 39.52 ± 7.49, 39.24 ± 7.55, 39.03 ± 7.67), 38.91 ± 7.62, 38.70 ± 7.58 mg/g for 0, 5, 30, 60, 90, and 120 minutes, respectively. The removal percent for nickel were 79.57 ± 0.77, 82.26 ± 0.48, 81.63 ± 0.43, 81.13 ± 0.54, 80.94 ± 1.27, 80.50 ± 1.08 % for 0, 5, 30, 60, 90, and 120 minutes, respectively. The error bars in both graphs represent the standard deviation in adsorption capacity (n=3, black) and R% (n=3, grey).
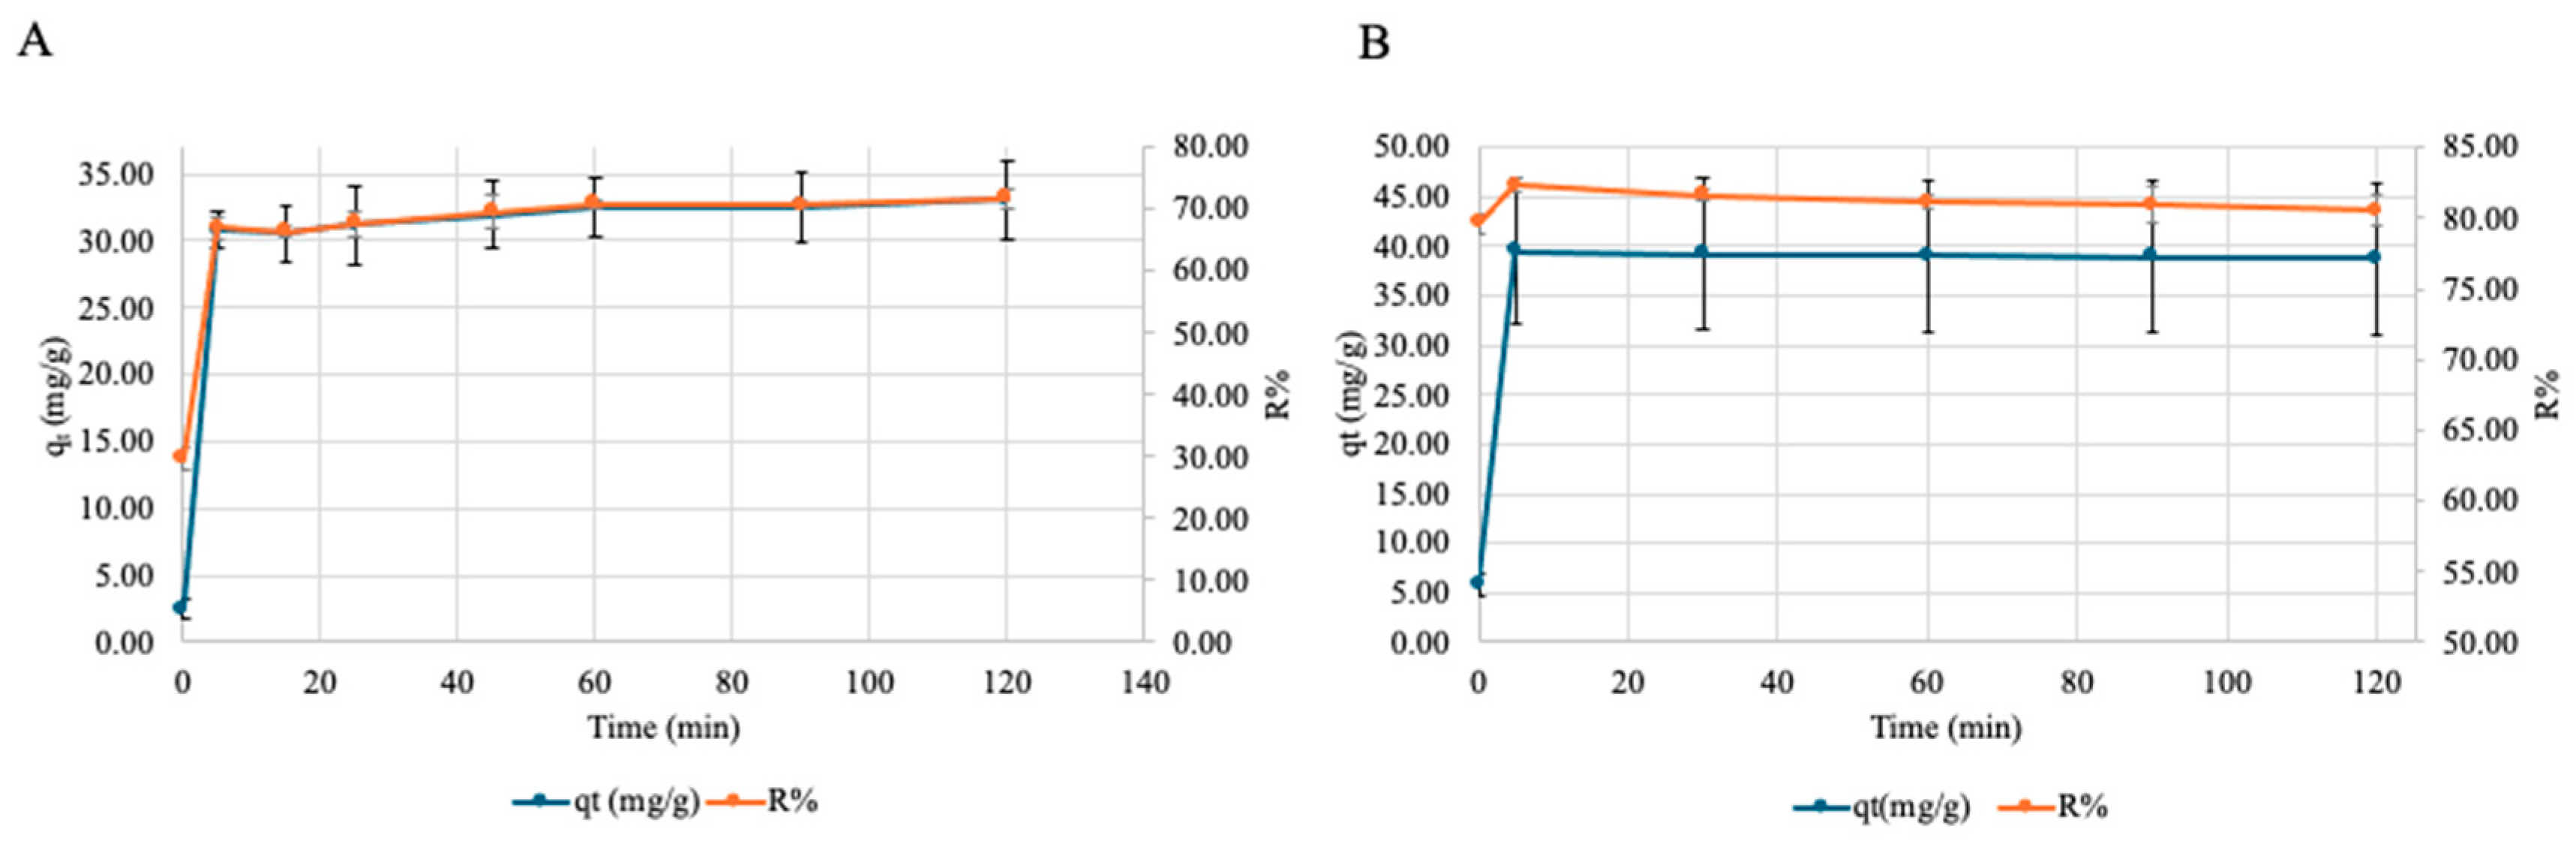
Figure 11.
Effect of pH on adsorption of Cu onto SA-PP-H (org). A specified amount of hydrogels were placed in CuNO3·3H2O at varying pH values (1, 3, 5, 13) for 60 minutes after which the supernatant was diluted 10 folds and filtered, then analyzed by FAAS. Three trials were conducted for each concentration. As evident, as the pH value increases, the adsorption capacity decreases, but the removal capacity increases until plateauing. The adsorption capacity is 7.81 ± 0.53, 6.91 ±0.69, 7.29 ± 0.41 and 6.48 ± 0.31 mg/g for pH 1, 3, 5 and 13, respectively. The removal capacity is 72.82 ± 0.49, 72.83 ± 1.58, 78.40 ± 1.15, and 78.76 ± 0.95 % for pH 1, 3, 5 and 13, respectively. The error bars represent the standard deviation in adsorption capacity (n=3, black) and R% (n=3, grey).
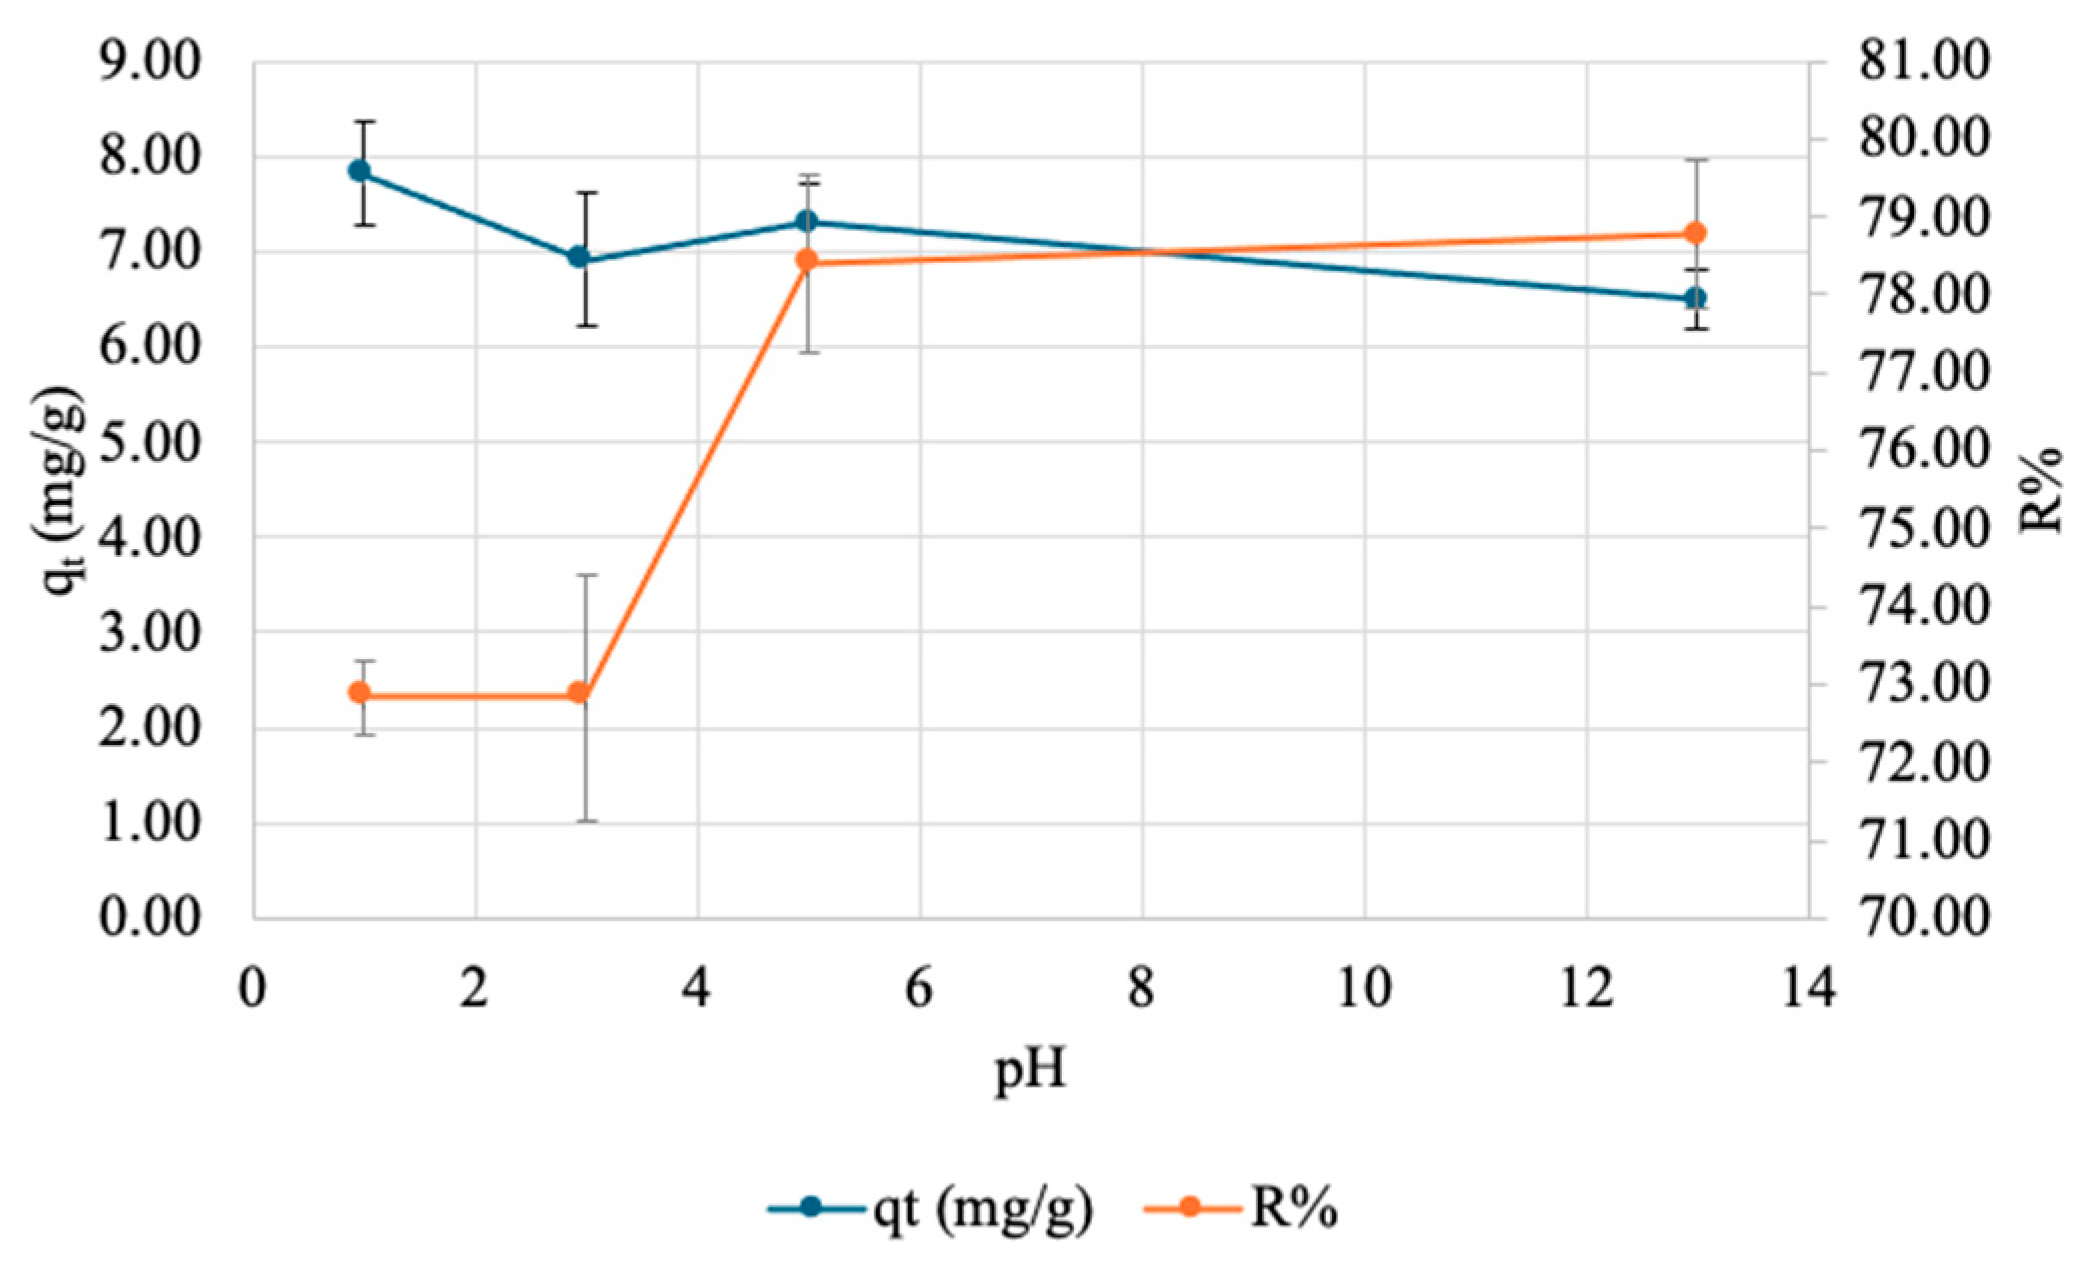
Figure 12.
Effect of adsorbate amount on adsorption of Cu onto SA-PP-H (org). Varying amounts of hydrogels (0.01, 0.02, 0.03, 0.04 and 0.05g) were placed in CuNO3·3H2O (pH ~5.5) for 60 minutes after which the supernatant was diluted 10 folds and filtered, then analyzed by FAAS. Three trials were conducted for each concentration. As evident, increasing the amount of adsorbate generally decreases the adsorption (qt(mg/g); blue) while the removal capacity (R%; orange) plateaus. The adsorption capacity is 42.37 ± 3.35, 26.18 ± 1.10, 16.95 ± 1.27, 12.61 ±0.44, 9.37 ± 0.32 mg/g for 0.01, 0.02, 0.03, 0.04 and 0.05g of adsorbent, respectively. The removal capacity is 89.98 ± 1.55, 88.17 ± 0.96, 87.23 ± 1.96, 88.11 ± 1.05 and 87.22 ± 0.97 % for 0.01, 0.02, 0.03, 0.04 and 0.05g of adsorbent, respectively.The error bars represent the standard deviation in adsorption capacity (n=3, black) and R% (n=3, grey).
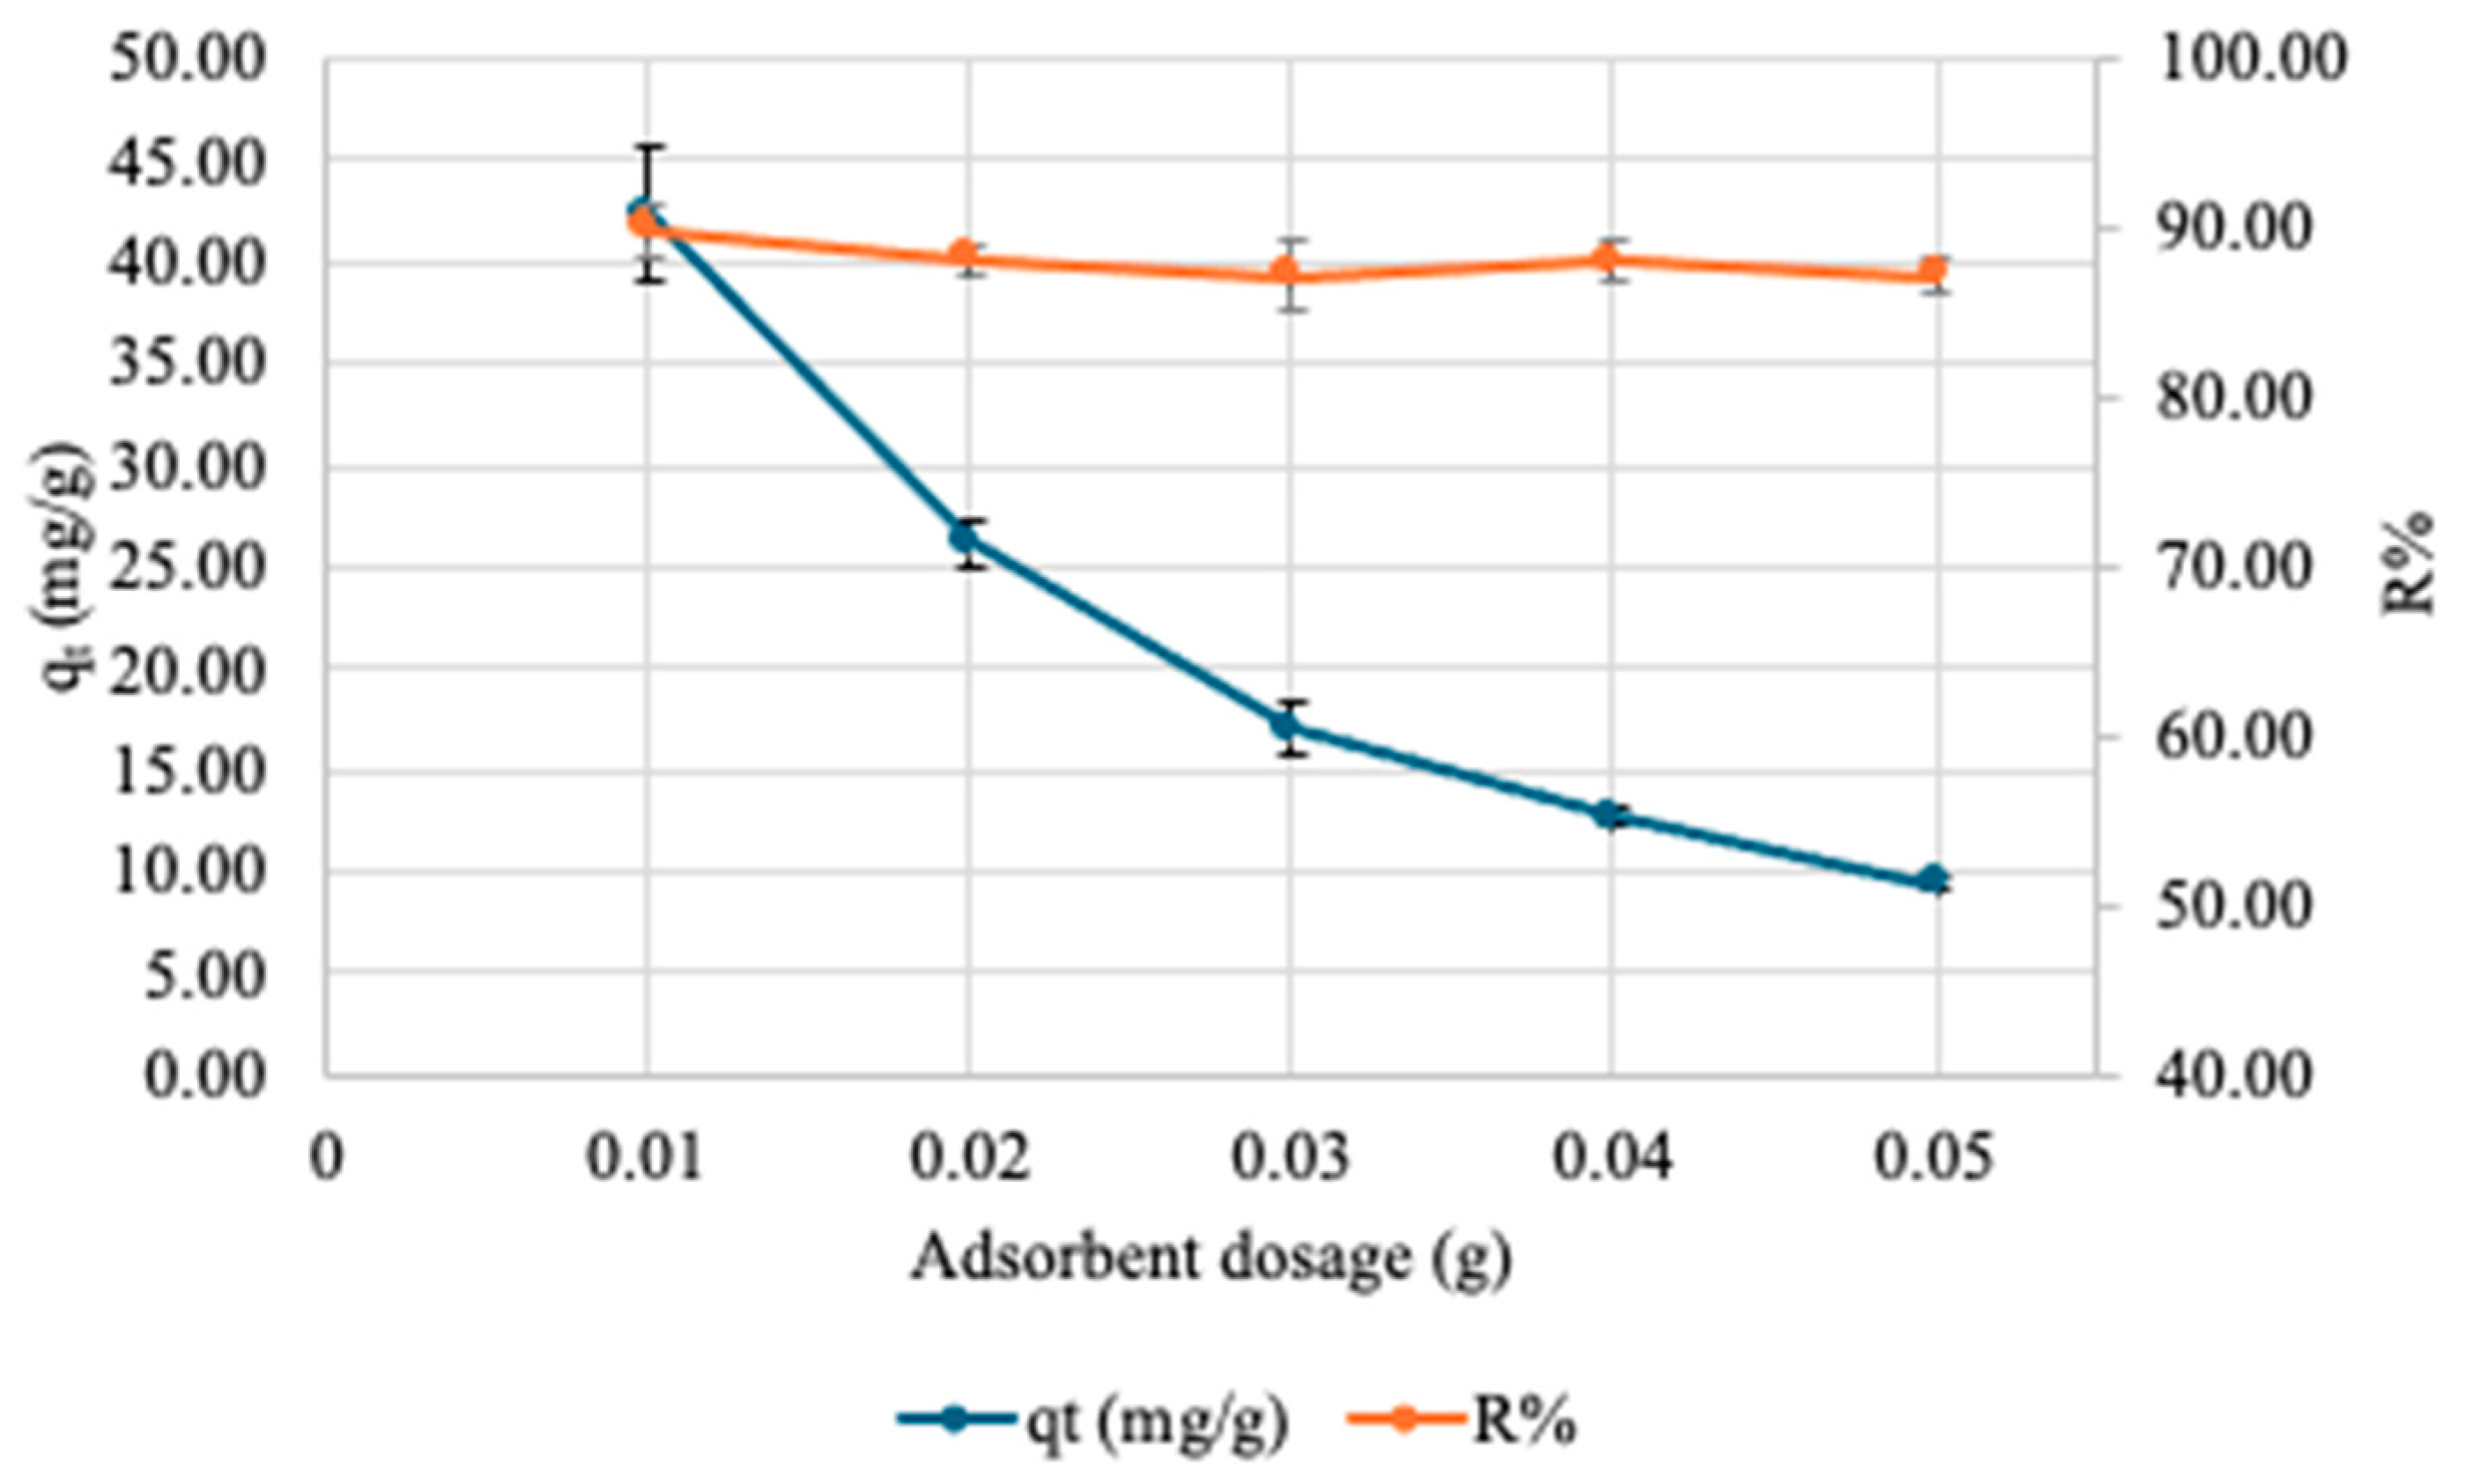

Table 1.
Physical properties of SA-H, SA-PP-H (com) and SA-PP-H (org).
| Hydrogel type | Appearance | |
| Colour (wet, dry, lyophilized) | Shape | |
| SA-H | White, off-white, off white | Circular |
| SA-PP-H (com) | Dark brown, black, black | Circular |
| SA-PP-H (org) | Light brown, light brown, light brown | Circular |
Disclaimer/Publisher’s Note: The statements, opinions and data contained in all publications are solely those of the individual author(s) and contributor(s) and not of MDPI and/or the editor(s). MDPI and/or the editor(s) disclaim responsibility for any injury to people or property resulting from any ideas, methods, instructions or products referred to in the content. |
© 2025 by the authors. Licensee MDPI, Basel, Switzerland. This article is an open access article distributed under the terms and conditions of the Creative Commons Attribution (CC BY) license (http://creativecommons.org/licenses/by/4.0/).
Copyright: This open access article is published under a Creative Commons CC BY 4.0 license, which permit the free download, distribution, and reuse, provided that the author and preprint are cited in any reuse.


