1. Introduction
The Coronavirus Disease 2019 (COVID-19) pandemic was an unprecedented event that forced governments to compose a plan of action with minimal preparation time. With over 300,000 deaths associated with COVID-19 in 2020 [
1], and millions more cases spreading, the United States government labored toward a vaccination solution for its’ population. As availability of a vaccine became imminent, the Centers for Disease Control and Prevention’s (CDC) Advisory Committee on Immunization Practices (ACIP) produced a national vaccine distribution plan targeting priority population for initial vaccine distribution efforts. The distribution plan prioritized healthcare personnel and essential workers, people with high-risk medical conditions, and adults over the age of 65. However, the CDC ultimately charged the individual states to develop and implement a distribution plan that met the needs of their state, using the national plan as a guide [
2].
The Alabama Department of Public Health (ADPH) is the primary state health agency for the state of Alabama and is led by the State Health Officer (SHO). The SHO designated the Bureau of Communicable Disease Director (BCDD) to lead the overall COVID-19 planning efforts. The BCDD identified expert staff and external partners as members of the ADPH Executive Committee and formed an Internal Implementation Committee (IIC) to assist with planning, coordination, and execution of the plan. An External Partner Executive Committee (EPEC) consisted of numerous medical and non-medical groups whose role was to ensure transparency and equitable access to critical populations and distribution of the COVID-19 vaccine [
3]. The distribution priorities aligned with the ACIP national plan were organized into three phases beginning in December 2020 [
Table 1 p. 2].
One of the principles used to guide the development of the ACIP plan was ‘mitigating health inequities.’ Evidence from national studies shows an association between health outcome and socioeconomic status, with poorer health outcomes among people with the lowest income categories [
4]. The Centers for Disease Control and Agency for Toxic Substances and Disease Registry (ATSDR) developed the Social Vulnerability Index (SVI) as a socioeconomic indicator. The SVI indicates the relative vulnerability of every United States county. The SVI uses 16 social factors including poverty, lack of vehicle access, and crowded housing, and groups them into four related themes: socioeconomic status, household characteristics, racial & ethnic minority status, housing type & transportation. The closer the value to 1.0, the more vulnerable the county [
5]. Several studies have used SVI to aid in determining equity in COVID 19-vaccine distribution [
6,
7,
8,
9]. Kazemi and Kong’s international study concluded there was a clear inequality in the worldwide distribution of COVID-19 vaccines, which prioritized populations with a higher socioeconomic status [
10]. The SVI for each Alabama county is readily available through the CDC/ATSDR SVI Interactive map [
11]. For these reasons, the SVI was selected as a socioeconomic indicator in the distribution of the COVID-19 vaccine in the state of Alabama.
However, the evidence indicates multi-level determinants of inequality in COVID-19 vaccine distribution in areas across the country which included economic conditions, legal and political factors. In addition, the infrastructure of health systems, their reliability on information systems, transportation, employment capacity, and other basic demographics also played a role in distribution [
12,
13]. The inequality of the COVID-19 vaccine distribution in addition to the existing health inequity within our population is cause for concern in the effectiveness of the health system.
The primary purpose of this study was to determine if the distribution of the COVID-19 vaccine in the state of Alabama aligned with the vaccination plan as outlined by the ADPH Executive Committee. A secondary purpose was to assess whether there was a socioeconomic disparity in vaccine distribution by Alabama county based on the SVI.
2. Materials and Methods
The Alabama Department of Public Health supplied county-level COVID-19 vaccine distribution data for the state of Alabama from December 15, 2020, to March 25, 2022. Due to the large volume of data, we divided it into five quarterly segments for a more manageable analysis. Four quarters (Q1-Q4) are included for 2021 and one quarter (Q5) for 2022. Data from December 15-31, 2020, was included in Q1 for 2021. Variables included in the dataset were date, facility name, facility county, and type of facility (i.e., hospital, pharmacy, nursing home, clinic).
Population information for each county in Alabama was collected through the United States Census Bureau website [
14]. The number of hospitals per county was extracted from the Alabama Hospital Association website. There were 123 hospitals in Alabama at the time of this study [
15]. There were 229 nursing homes in the state, according to the Alabama Nursing Home Association [
16]. Using this information, we created
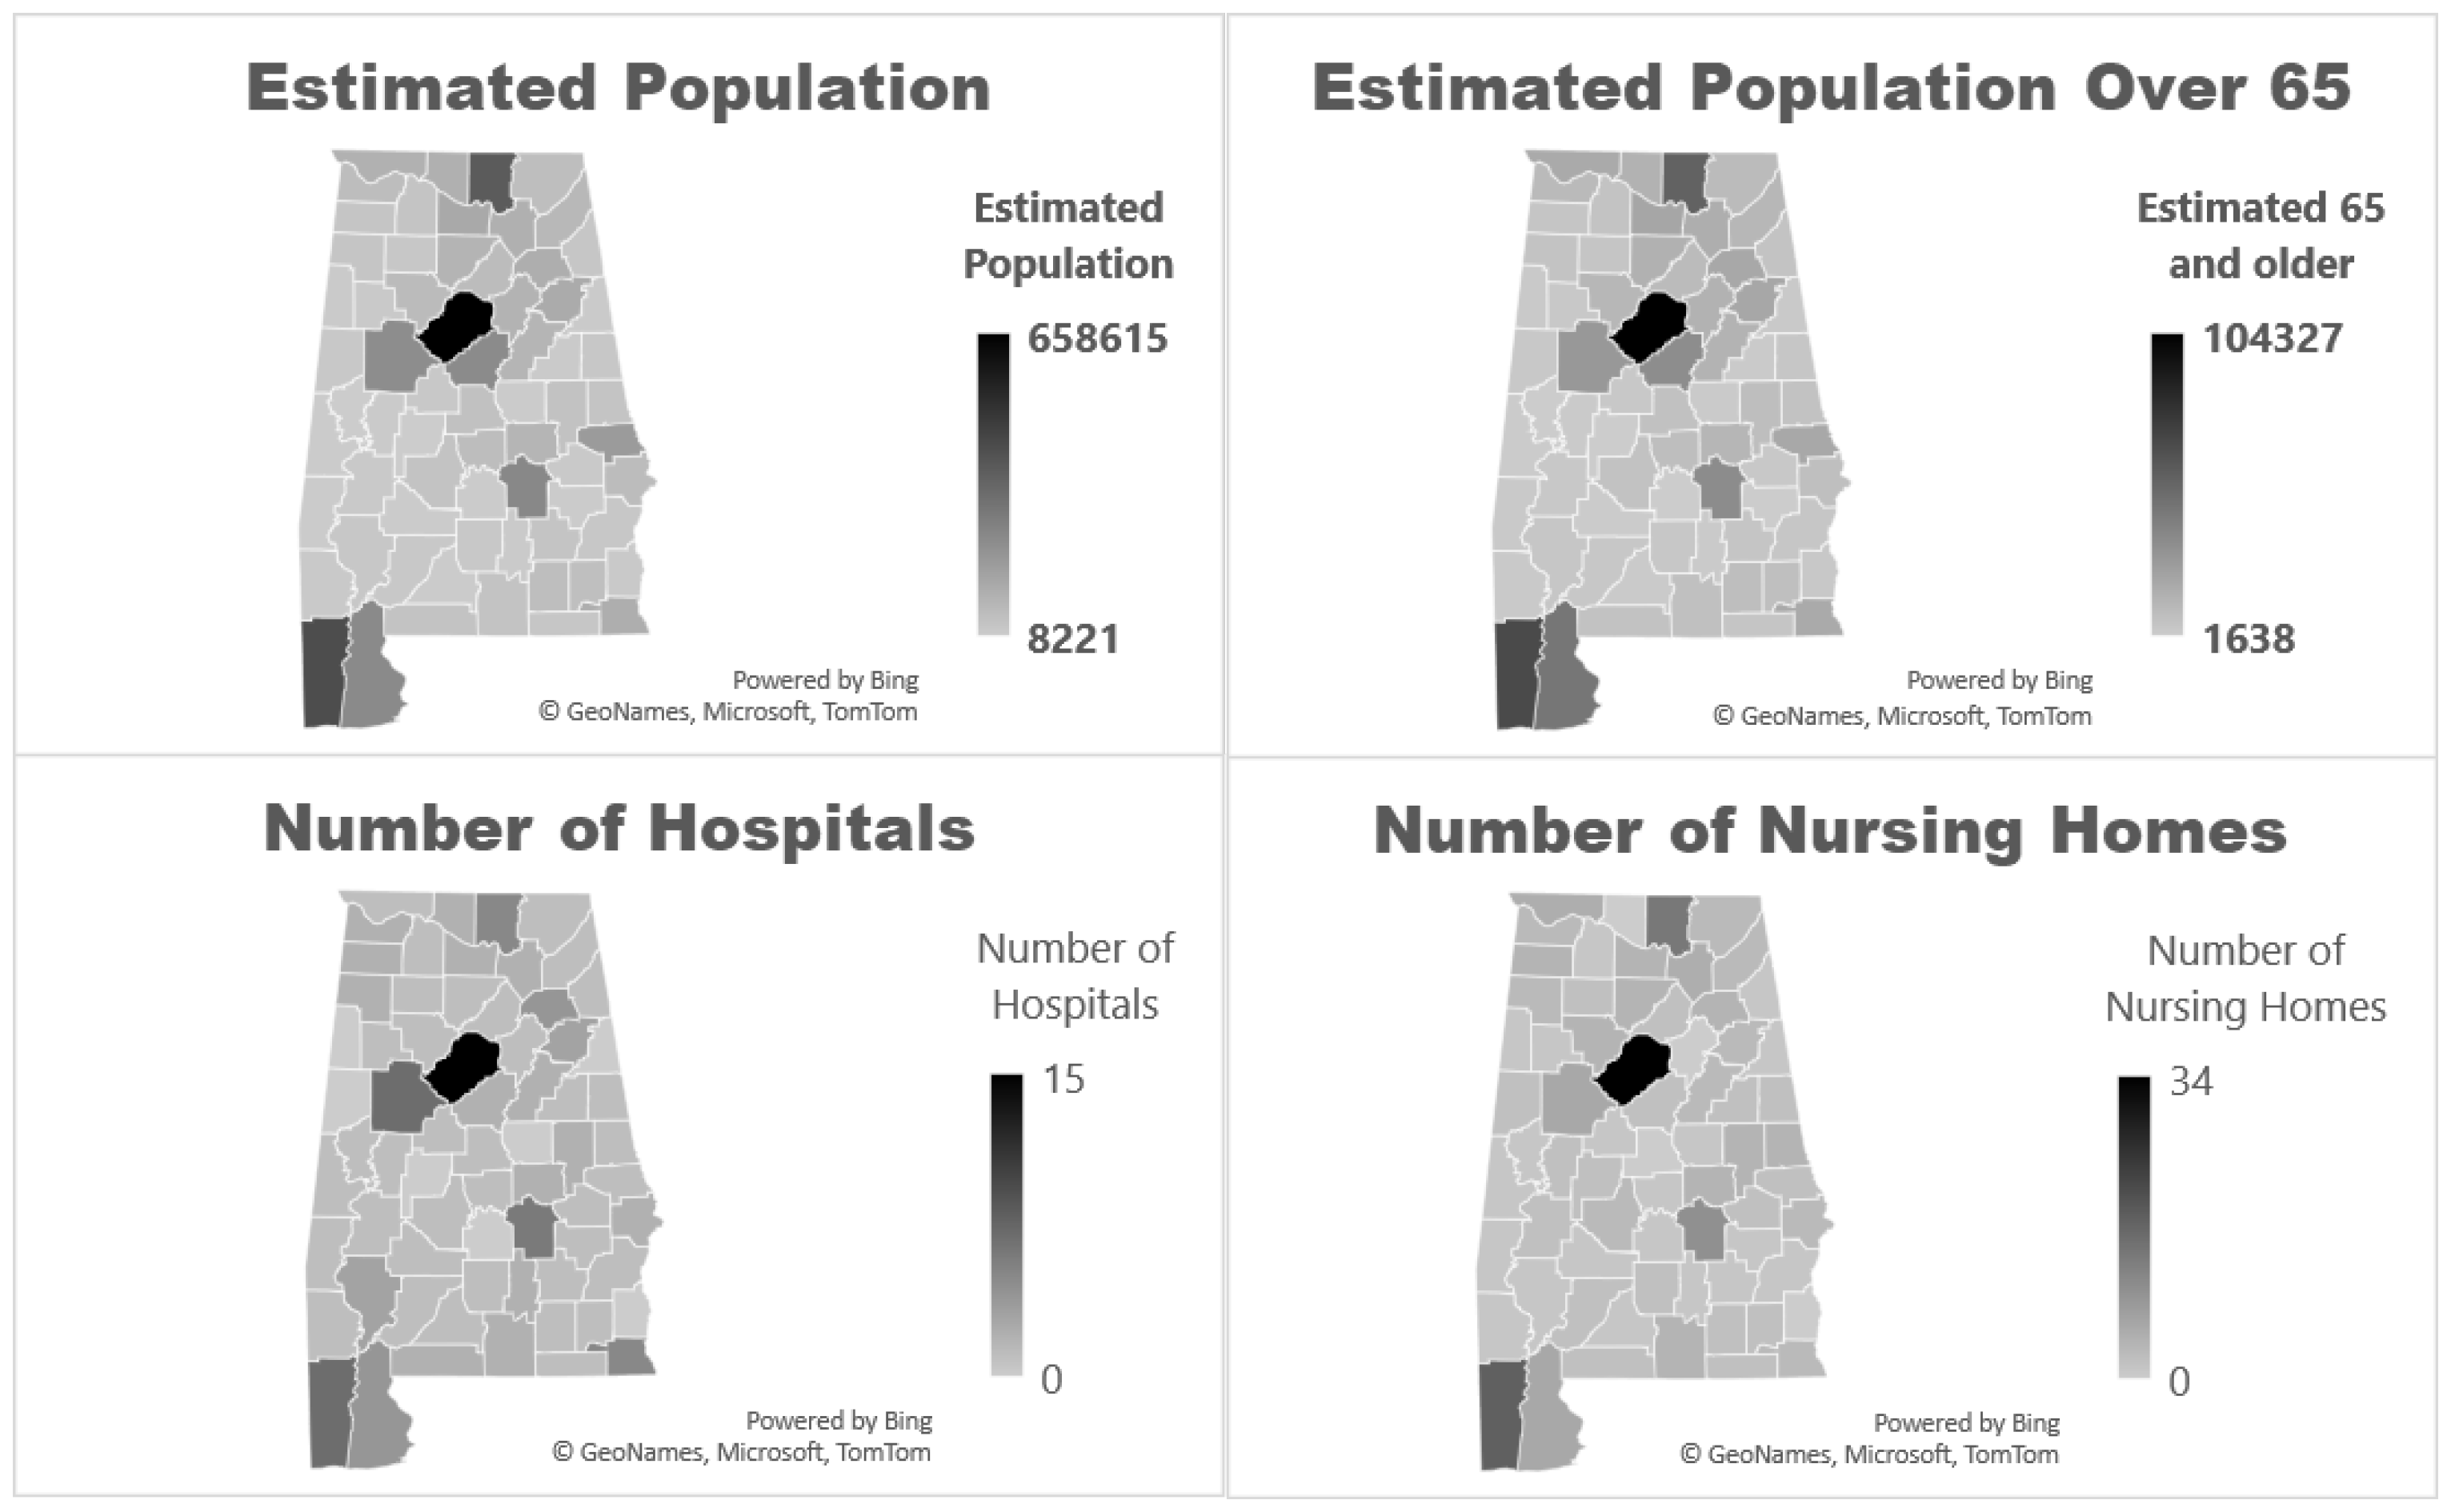
Figure 1 (Maps 1-4 p. 4) to demonstrate the correlation between estimated population and the number of hospitals, and the number of nursing homes with the number of individuals over the age of 65. Because healthcare facilities require personnel, we made a reasonable association between the number of hospitals, nursing homes and healthcare workers in that area.
The SVI was used to help determine the presence of socioeconomic disparity in the distribution of COVID-19 vaccinations in Alabama counties [
5]. Pearson correlation statistics and linear models were used to identify county associations. Pearson correlations were used to identify association with dose distribution by quarter. Multiple linear regressions were used to decide which factor best explained the variation.
3. Results
3.1. Data Analysis
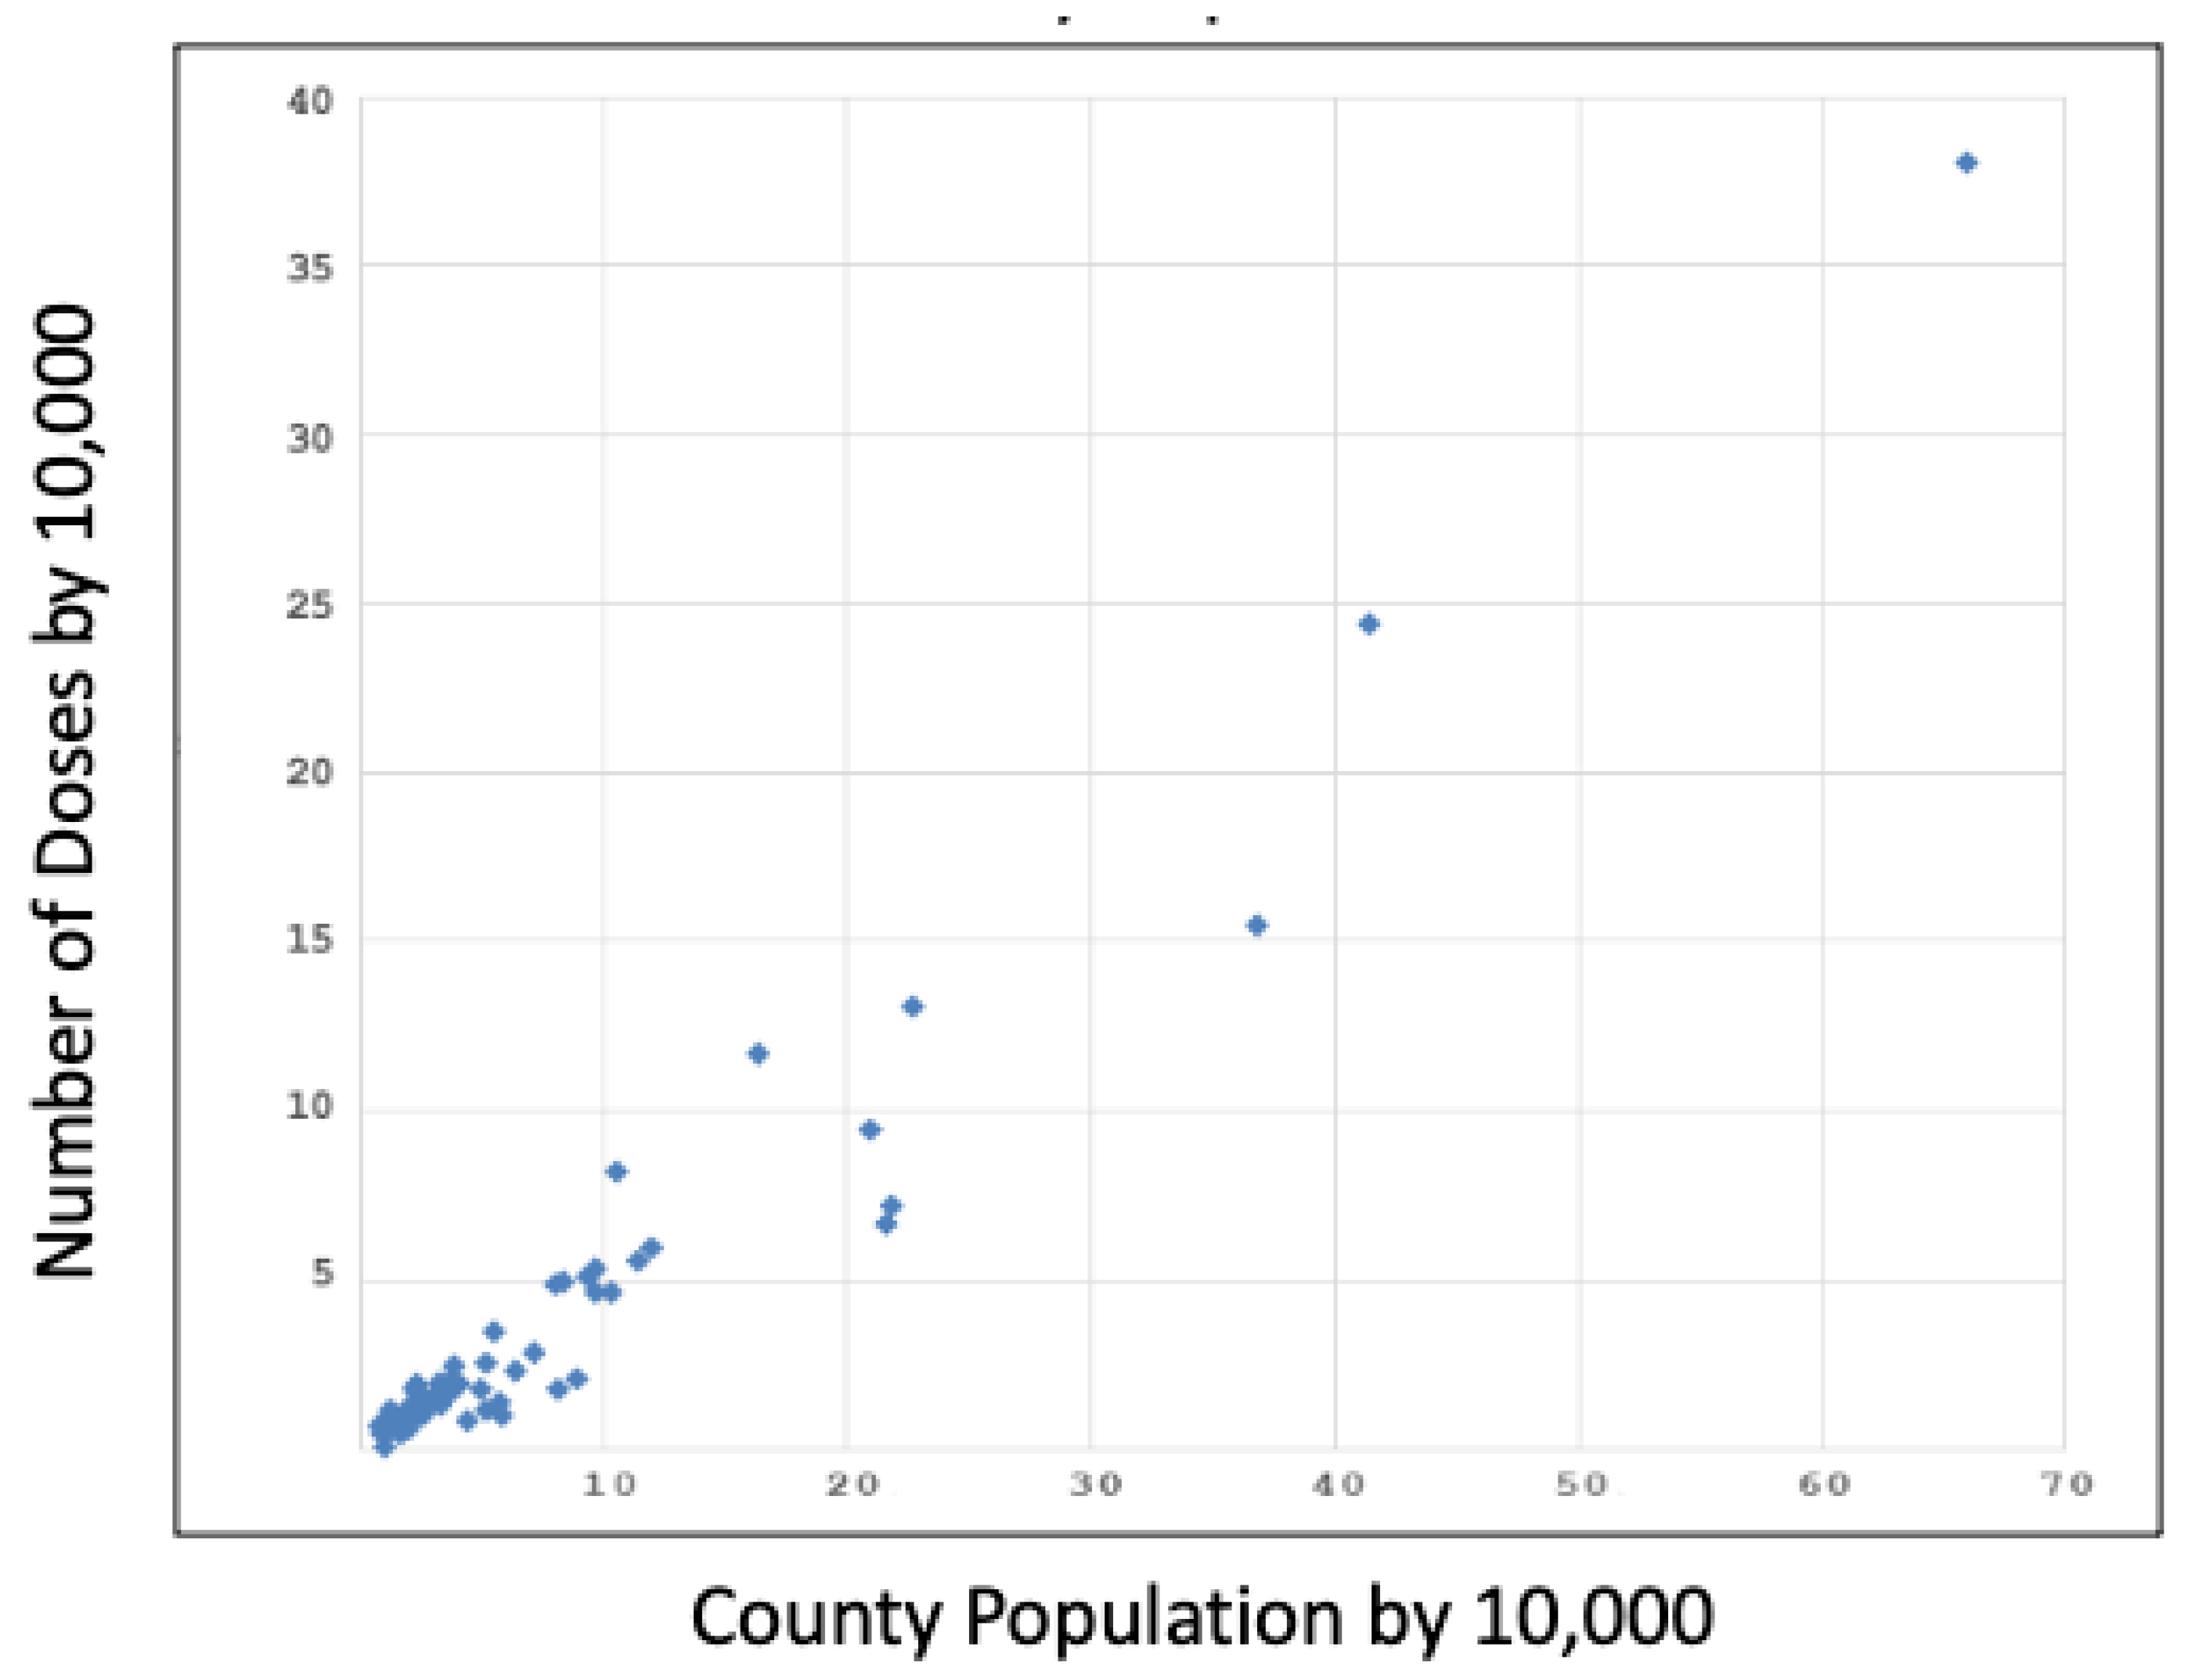
Alabama county population size was highly associated with the number of doses distributed to each county (p<.0001) with correlations of > 0.84, as shown in
Graph 1 (p.4). Of note, the graphs contain only the data points for Quarter 1 (Q1), although Quarters 2-5 (Q2-5) revealed remarkably comparable results. The association between number of doses distributed per quarter and the number of hospitals and nursing homes within the county was statistically significant (p<.0001), with correlations ranging from 0.83 to 0.96 as seen in
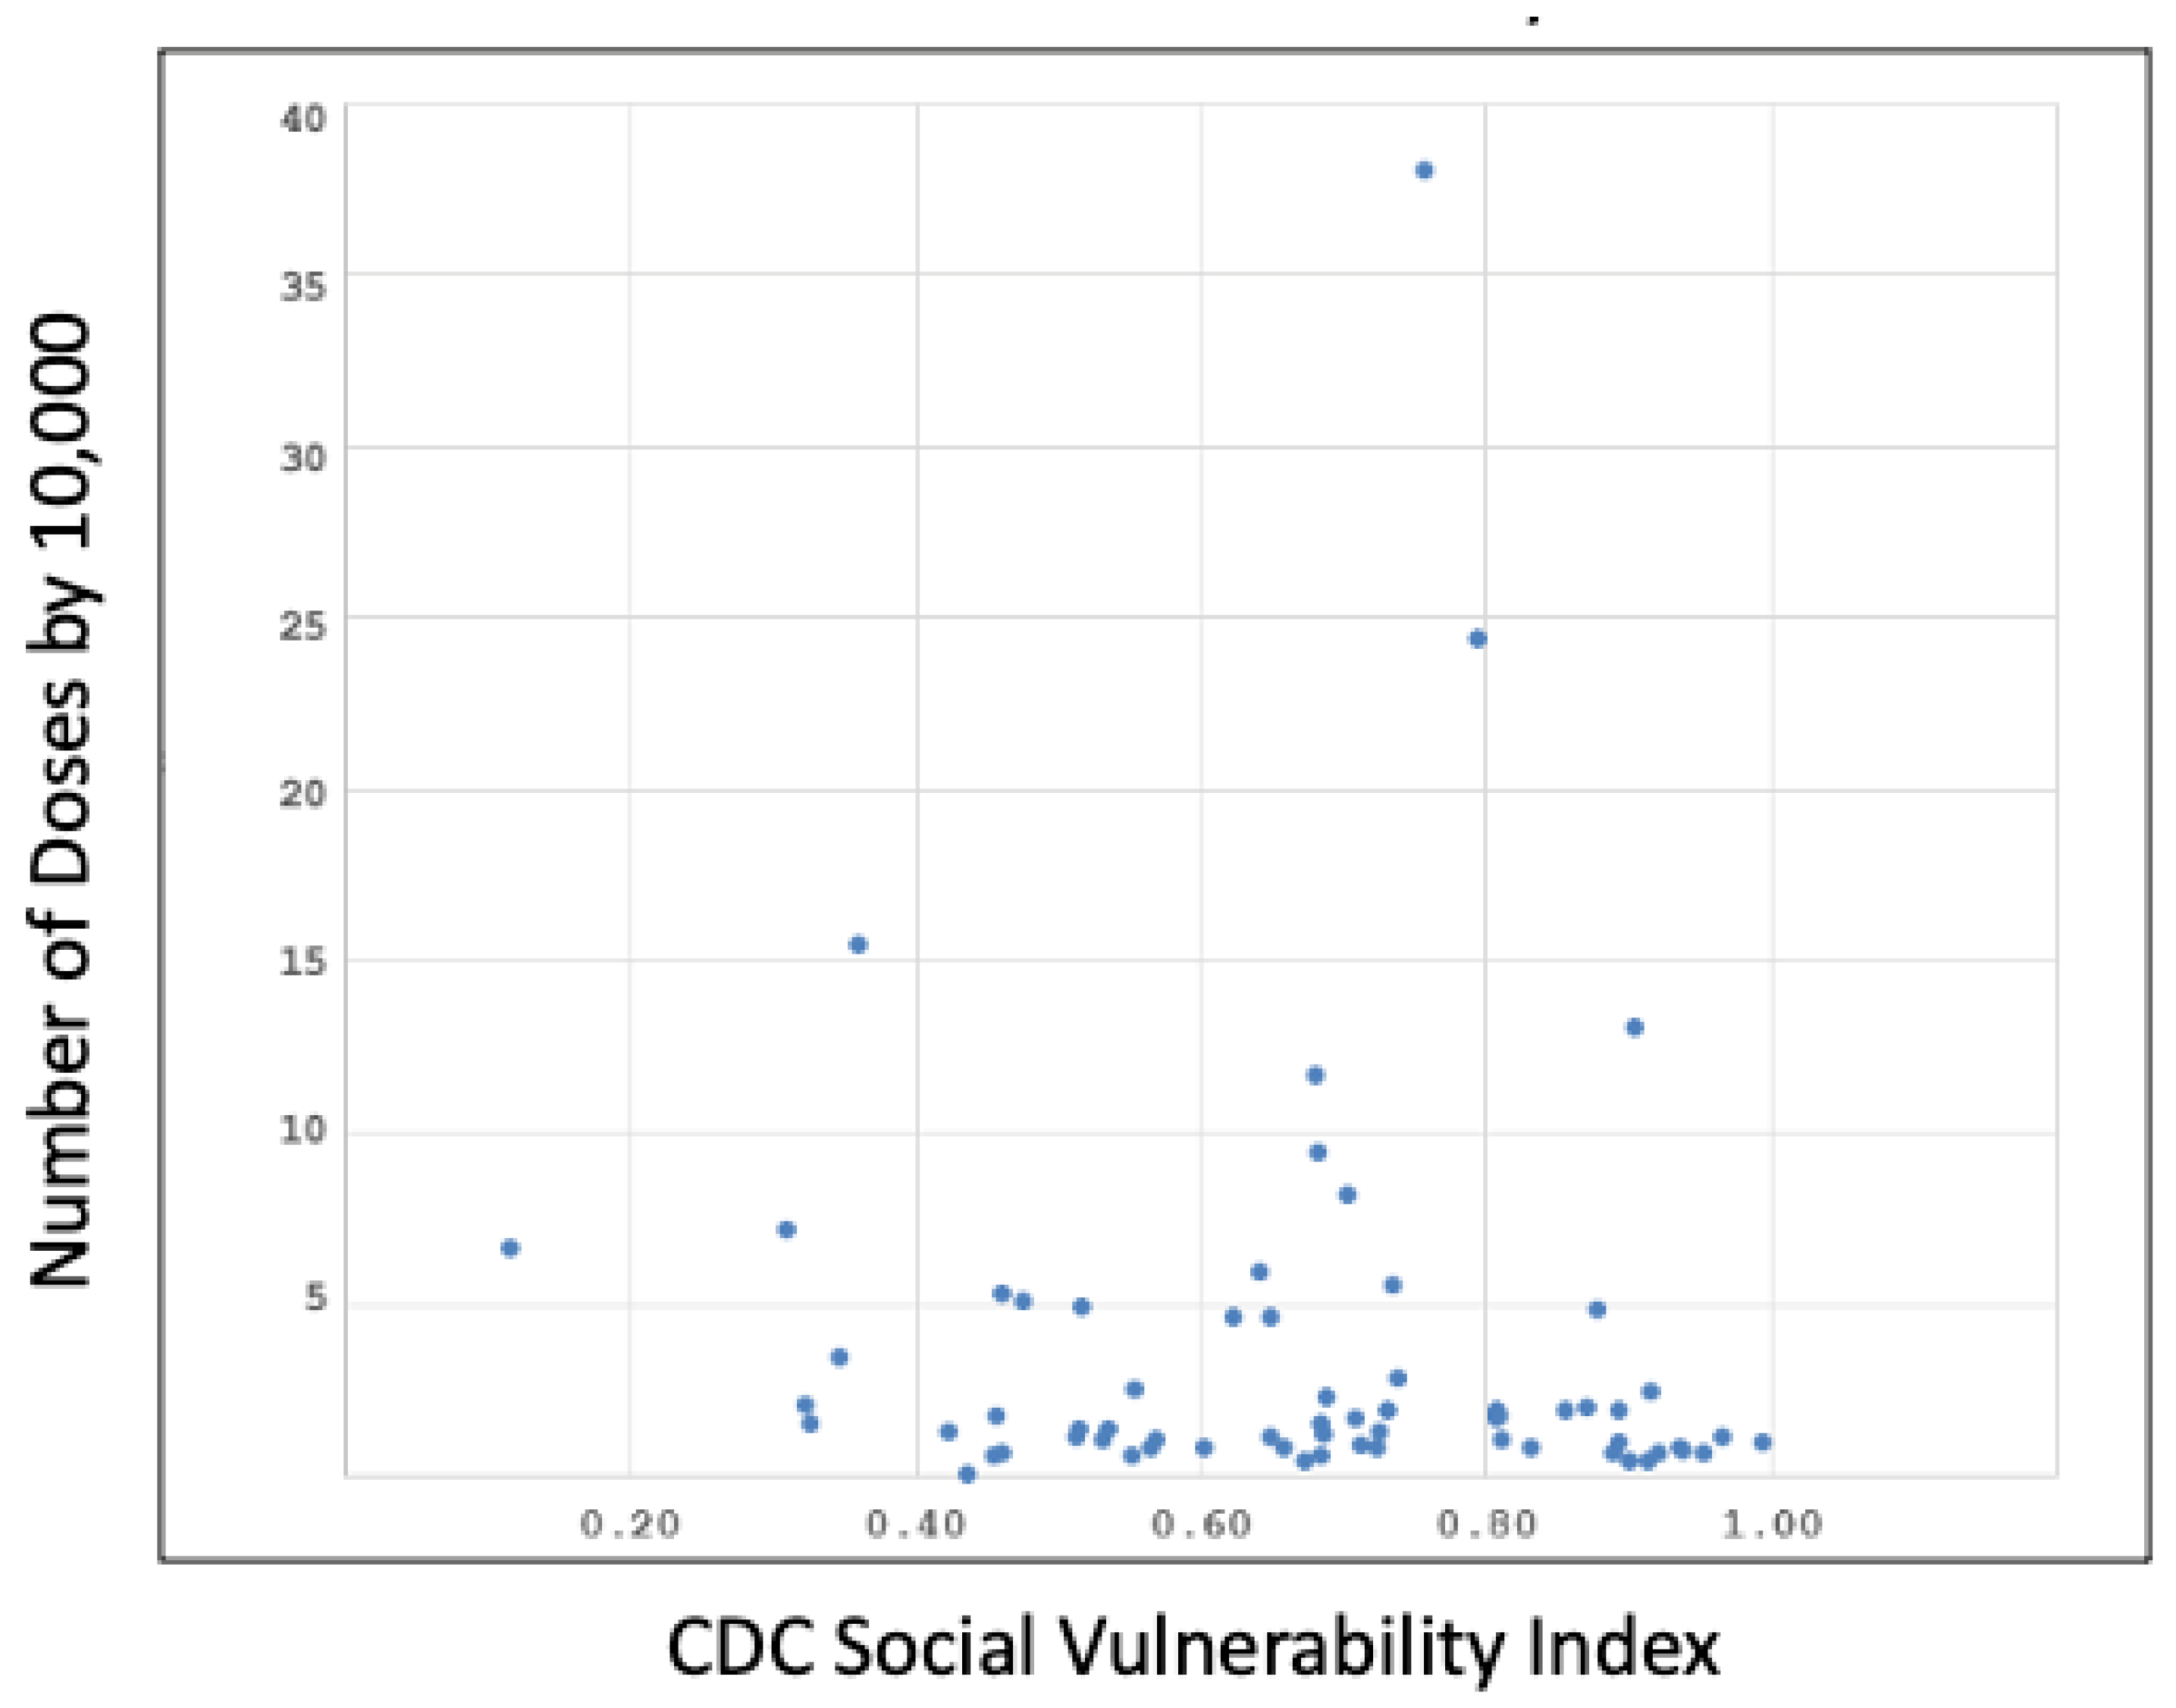
Table 2 (p. 5). SVI was the only factor that did not achieve statistical significance with the number of doses distributed per quarter, as shown in
Table 2 (p. 5). The SVI for Q1 is shown in
Graph 2 (p. 5).
4. Discussion
A statistically significant correlation between the number of COVID vaccine doses distributed and the county population indicates that the Alabama counties with the largest population received the most COVID vaccines. Likewise, a statistically significant correlation between the number of hospitals and the number of COVID vaccine doses distributed reveals that those counties with the greatest number of hospitals received the highest number of COVID vaccine doses. One can make a reasonable association between the county population, number of hospitals, and number of healthcare workers in that area. Another plausible assumption is that most patients in nursing homes are over the age of 65. The significant correlation between the number of nursing homes and the number of COVID vaccine doses distributed would suggest that a larger proportion of patients over the age of 65 compared to a younger population were given initial access to the vaccine. The state of Alabama’s COVID-19 vaccine distribution plan declared that healthcare personnel and those over the age of 65 be among the first groups to receive the vaccine [
3]. Thus, the observations from this study indicate that the distribution of the COVID-19 vaccine to the intended groups aligned with the original plan. The SVI was not found to be a statistically significant data point in this study. This suggests that there was no socioeconomic disparity in the distribution of the COVID-19 vaccine in the state of Alabama.
We acknowledge several limitations to this study. Initial distribution sites were strategically identified based on their ability to adequately store and handle COVID-19 vaccines, as there were specific temperature requirements that required the purchase of certain equipment. These sites were in more densely populated areas, so distribution to these areas would naturally be higher. As additional vaccines became available and revised storing and handling procedures were released, additional facilities were able to procure the vaccines, although this occurred much later than the original vaccine distribution.
In our methodology, we used the SVI to investigate the social disparity of COVID-19 vaccine distribution, but did not include other proxy variables such as timing of vaccine, type of vaccine administration site, zip code or ethnicity. A prior study conducted in St. Louis and Kansas City, Missouri, concluded apparent inequities in the initial COVID-19 vaccine and booster rollout in these areas. Overall, these findings highlight the need for continued transparency and commitment to addressing social determinants during a public health response from the outset to track equity metrics over time. [
6].
We acknowledge that the COVID-19 pandemic caused unexpected delays in the reporting of data in the ADPH database. In addition to healthcare personnel, essential workers, and patients over the age of 65, the Alabama distribution plan for the COVID vaccine prioritized those with high-risk medical conditions. Due to the information and data provided by ADPH, we can only assess distribution to healthcare facilities and nursing homes as a proxy for elderly at high risk, but not specifically for high-risk medical conditions. An assumption was made that most of the nursing home residents were over the age of 65, but this information was not available in the dataset.
This study focused exclusively on data regarding the distribution of the COVID-19 vaccine in Alabama. To further dissect the complex public health situation that unfolded during the challenging times of the COVID-19 pandemic, it would be interesting to include analysis of COVID-19 vaccine administration data for Alabama and assess for potential correlations between vaccine distribution and administration rates across the state.
As a result of the pandemic, there was a wave of mistrust that plagued healthcare professionals and the healthcare system overall. In addition, evidence of disproportionate vaccine distribution efforts in some areas further propelled the suspicion among the lay public. To prepare for the next pandemic, concerted efforts to evaluate vaccine distribution are needed. This study recognizes Alabama’s efforts in planning and implementing COVID-19 vaccine distribution, identifies healthcare facilities that played a vital role in the process, and highlights the state’s effort to efficiently and effectively navigate the pandemic with its limited resources.
5. Conclusions
Vaccine distribution was significantly associated with county population size, number of hospitals, and number of nursing homes, adhering to the priorities of Alabama’s COVID-19 vaccine distribution plan. These findings support the Alabama Department of Public Health’s efforts to successfully manage COVID-19 vaccine distribution to healthcare personnel and adults over the age of 65. There was no association between SVI and vaccines distributed, revealing no apparent socioeconomic disparity in vaccine distribution in the state of Alabama based on the SVI. Therefore, the findings of this study indicate that the state of Alabama adhered to the plan set forth by ADPH Executive Committee.
Author Contributions
Conceptualization M.H. and D.R.; methodology, D.R..; software, D.R..; validation, D.R.; formal analysis, M.H.,D.R.; investigation M.H., D.R.; resources, M.H., D.R.; data curation, D.R..; writing—original draft preparation, M.H.; writing—review and editing, M.H, M.R, D.R..; visualization, M.H., M.R., D.R.; supervision, M.H.; project administration, M.H. All authors have read and agreed to the published version of the manuscript.
Funding
This research received no external funding.
Institutional Review Board Statement
The study was determined to not human subjects research by the Institutional Review Board of EDWARD VIA COLLEGE OF OSTEOPATHIC MEDICNE (protocol code 2023-049, approved June 13, 2023) and therefore does not require approval.
Data Availability Statement
The data presented in this study is available on request from the corresponding author due to the request from the Alabama Department of Public Health for privacy of the institutions.
Acknowledgments
We would like to acknowledge Dr. Kenny Brock from VCOM for his valuable idea that contributed to the development of this project. We would also like to acknowledge Chevonne Tyner with the ADPH for his effort in procuring and providing the data used in this project.
Conflicts of Interest
The authors declare no conflicts of interest.
Abbreviations
The following abbreviations are used in this manuscript:
| ACIP |
Advisory Committee on Immunization Practices |
| ADPH |
Alabama Department of Public Health |
| ATSDR |
Agency for Toxic Substances and Disease Registry |
| CDC |
Centers for Disease Control and Prevention |
| COVID-19 |
Coronavirus Disease 2019 |
| SVI |
Social Vulnerability Index |
| VCOM |
Edward Via College of Osteopathic Medicine |
References
- Centers for Disease Control and Prevention, National Center for Health Statistics. Multiple Cause of Death Files, 2018-2021. CDC WONDER Online Database, https://wonder.cdc.gov/mcd.html. Accessed 22 May 2023.
- McClung N, Chamberland M, Kinlaw K, et al. The Advisory Committee on Immunization Practices' Ethical Principles for Allocating Initial Supplies of COVID-19 Vaccine-United States, 2020. Am J Transplant. Jan 2021;21(1):420-425. [CrossRef]
- Alabama COVID-19 Vaccination Plan. October 2020. https://www.alabamapublichealth.gov/covid19/assets/adph-covid19-vaccination-plan.pdf. Accessed 4/7/2025.
- Kim Y, Vazquez C, Cubbin C. Socioeconomic disparities in health outcomes in the United States in the late 2010s: results from four national population-based studies. Arch Public Health. Feb 4 2023;81(1):15. [CrossRef]
- CDC/ATSDR Social Vulnerability Index 2020. https://www.arcgis.com/home/item.html?id=80010607e93249b2b6d98147805f1f7410.
- Mody A, Bradley C, Redkar S, et al. Quantifying inequities in COVID-19 vaccine distribution over time by social vulnerability,race nd ethnicity, and location: A population-level analysis in St. Louis and Kansas City, Missouri. PLoS Med. Aug 2022;19(8): e1004048. [CrossRef]
- Thakore N, Khazanchi R, Orav EJ, Ganguli I. Association of Social Vulnerability, COVID-19 vaccine site density, and vaccination rates in the United States. Healthc (Amst). Dec 2021;9(4):100583. [CrossRef]
- Mofleh D, Almohamad M, Osaghae I, et al. Spatial Patterns of COVID-19 Vaccination Coverage by Social Vulnerability Index and Designated COVID-19 Vaccine Sites in Texas. Vaccines (Basel). Apr 8 2022;10(4). [CrossRef]
- Hughes MM, Wang A, Grossman MK, et al. County-Level COVID-19 Vaccination Coverage and Social Vulnerability - United States, December 14, 2020-March 1, 2021. MMWR Morb Mortal Wkly Rep. Mar 26 2021;70(12):431-436. [CrossRef]
- Kazemi M, Bragazzi NL, Kong JD. Assessing Inequities in COVID-19 Vaccine Roll-Out Strategy Programs: A Cross-Country Study Using a Machine Learning Approach. Vaccines (Basel). Jan 26 2022;10(2). [CrossRef]
- ATSDR. SVI Interactive Map. https://www.atsdr.cdc.gov/place-health/php/svi/svi-interactive-map.html.
- Bayati M, Noroozi R, Ghanbari-Jahromi M, Jalali FS. Inequality in the distribution of Covid-19 vaccine: a systematic review. Int J Equity Health. Aug 30 2022;21(1):122. [CrossRef]
- Burgos RM, Badowski ME, Drwiega E, Ghassemi S, Griffith N, Herald F, Johnson M, Smith RO, Michienzi SM. The race to a COVID-19 vaccine: opportunities and challenges in development and distribution. Drugs Context. 2021 Feb 16;10:2020-12-2. [CrossRef] [PubMed] [PubMed Central]
- Alabama population by county according to US census 2020. https://public.tableau.com/app/profile/us.census.bureau/viz/2020CensusPopulationandHousingMap/County?:showVizHome=no&STATE%20NAME%20(cb%202020%20us%20county%20500k.shp)=Alabama.
- Alabama Hospital Association. 2023. https://www.alaha.org/.
- Alabama Nursing Home Association. 2023. https://anha.org/.
|
Disclaimer/Publisher’s Note: The statements, opinions and data contained in all publications are solely those of the individual author(s) and contributor(s) and not of MDPI and/or the editor(s). MDPI and/or the editor(s) disclaim responsibility for any injury to people or property resulting from any ideas, methods, instructions, or products referred to in the content. |
© 2025 by the authors. Licensee MDPI, Basel, Switzerland. This article is an open access article distributed under the terms and conditions of the Creative Commons Attribution (CC BY) license (http://creativecommons.org/licenses/by/4.0/).


