Submitted:
14 April 2025
Posted:
15 April 2025
You are already at the latest version
Abstract
Freeze-thaw (F/T) technology is an environmentally friendly and efficient method for residual sludge treatment. This study investigates the enhancement of sludge de-watering performance through the addition of straw during F/T cycles. A mathemati-cal model was established using the Box-Behnken central composite design and vali-dated via COMSOL Multiphysics simulations. Optimal conditions were identified as freezing at -16°C for 24 hours, 12.5 freeze-thaw cycles, and a straw mixing ratio of 20%, reducing the sludge moisture content from 62.7% to 35.9%. The specific resistance to filtration (SRF) and cake moisture content decreased significantly with increasing straw addition, reaching a minimum SRF of 1.30×10¹²m/kg at the optimal straw ratio. Straw conditioning also intensified the combustion stage of sludge by increasing the maximum weight loss rate and elevating the thermal decomposition temperature. Numerical simulations confirmed the experimental results, demonstrating that straw addition significantly improves sludge dewaterability by modifying heat and mass transfer mechanisms.
Keywords:
residual sludge
; freeze-thaw cycles
; heat and mass transfer
; dewatering performance
; COMSOL Multiphysics
; response surface methodology
1. Introduction
The rapid acceleration of global urbanization has precipitated a dramatic increase in sludge production from municipal wastewater treatment plants (WWTPs), posing significant challenges to sustainable waste management. Based on data from China Water Network, by 2023, over 17,000 WWTPs currently process approximately 216 million cubic meters of wastewater daily [1], generating vast quantities of residual sludge. Conventional sludge treatment methods, including thermal drying, incineration, landfill disposal, and agricultural reuse, face critical limitations in cost efficiency, energy consumption, and environmental compatibility. Among these challenges, the reduction of sludge moisture content stands as a pivotal yet unresolved issue, as high water content (typically 60–80% in raw sludge) not only complicates transportation and disposal but also escalates operational costs and greenhouse gas emissions during thermal treatments.
F/T pretreatment operates on the principle of exploiting ice crystal formation during freezing to disrupt sludge floc structures, followed by thawing-induced water release. This process effectively reduces sludge volume and moisture content while concurrently degrading organic pollutants, enabling the resulting dried sludge to be repurposed for energy applications in sectors like fertilizers and fuels. thereby aligning with the “three reductions” principle (reduction in volume, weight, and harmfulness) advocated for sustainable sludge management. China, as the world’s largest agricultural producer, generates approximately 900 million tons of crop straw annually, with corn straw alone accounting for 40% of this volume. Despite its abundance, a significant proportion of straw is incinerated or discarded indiscriminately, contributing to air pollution and resource wastage. Recent studies have demonstrated the potential of straw as a multifunctional conditioning agent in sludge treatment. For instance, Xie Xizhu et al. [3] reported that straw addition during sludge composting elevated pile temperatures and prolonged thermophilic phases, enhancing organic matter degradation. Meng Yunjiao et al [4] further compared the efficacy of corn straw with wheat straw and sawdust, revealing that corn straw exhibited superior performance in improving compost quality and microbial activity. Beyond composting applications, straw has been synergistically combined with advanced oxidation processes (e.g., persulfate activation) and biomass char to enhance sludge dewaterability. Guo Junyuan et al. [5] demonstrated that AlCl3-modified corn stover biochar reduced specific resistance to filtration (SRF) by 58.3% through electrostatic neutralization and porous structure-mediated water release. These findings underscore straw’s dual role as a physical skeleton builder and chemical conditioner, yet its interaction with F/T cycles remains insufficiently explored, particularly in terms of microstructural modification and heat-mass transfer dynamics. Qian et al. [6] integrated iron powder activated persulfate with waste straw, presenting a novel approach to enhance the dewatering performance of waste sludge. The experiments yielded noteworthy reductions in both the specific filtration resistance and moisture content of the sludge, ultimately enhancing its dewatering performance. Guo et al. [7] examined how agricultural waste affects the dewatering performance of ultrasound-assisted activated sludge and discovered that incorporating wheat straw powder, corn straw powder, and rice husk powder aided in enhancing the high calorific value of dewatered sludge. Additionally, ultrasound waves contributed to the reduction of the sludge's moisture content, thereby further improving its low calorific value.
The numerical simulation of the sludge freeze-thaw process is a crucial aspect of sludge freeze-thaw technology research. International researchers have elucidated the mechanism of sludge freeze-thaw and investigated the impact of various parameters on the sludge freeze-thaw process through the development of numerical models for the sludge freeze-thaw process. The numerical simulation of F/T processes has become indispensable for elucidating the underlying mechanisms of sludge dehydration. Early modeling efforts by Chen et al. [8] established a theoretical foundation by correlating temperature gradients with ice lens formation and sludge cracking. Yan et al. [9] employed numerical simulation techniques to investigate the heat transfer characteristics in the sludge freeze-thaw process, compared the heat transfer coefficients across various freeze-thaw cycles, and examined the impact of phase change heat on heat transfer during the sludge freeze-thaw process. Zheng et al. [10] advanced this field through three-dimensional ANSYS Fluent simulations, visualizing water redistribution and ice propagation patterns during F/T cycles, thereby validating the model's reliability. Montusiewicz et al. [11] employed a three-dimensional unsteady numerical model to simulate the sludge freeze-thaw process and examined the impact of various parameters on the moisture content of sludge. Their study suggests that sludge freeze-thaw technology can effectively decrease the moisture content of sludge.
This study bridges these knowledge gaps by systematically investigating the synergistic effects of straw conditioning on sludge dewatering performance during F/T cycles, integrating experimental optimization with Multiphysics numerical simulations. The research objectives are threefold: (1) to determine the optimal operational parameters (freezing temperature, duration, F/T cycles, and straw ratio) for maximizing moisture reduction using response surface methodology (RSM); (2) to characterize microstructural changes induced by straw incorporation, including floc size distribution, pore network development, and thermal decomposition behavior; and (3) to develop a COMSOL Multiphysics-based model simulating coupled heat-mass transfer in straw-conditioned sludge, validating experimental observations while identifying unmodeled phenomena such as crack propagation.
The novelty of this work lies in its holistic approach to unraveling the physicochemical interplay between straw and sludge matrices during F/T treatment. By combining RSM optimization with advanced characterization techniques (e.g., thermogravimetric analysis, particle size distribution) and Multiphysics modeling, this study provides mechanistic insights into how straw modifies heat transfer pathways, enhances pore connectivity, and alters combustion properties. Furthermore, the integration of agricultural waste valorization with sludge treatment aligns with circular economy principles, offering a dual solution to sludge management and straw utilization challenges. The findings are anticipated to inform the design of scalable F/T systems incorporating biomass conditioners, thereby advancing sustainable practices in wastewater treatment and resource recovery.
2. Experimental Design of Freeze-Thaw Cycle of Straw-Mixed Residual Sludge Based on Response Curved Surface Method
2.1. Experimental Design Scheme
The experimental design for investigating the synergistic effects of straw conditioning on sludge dewatering during freeze-thaw (F/T) cycles was structured using a rigorous framework combining preliminary trials and response surface methodology (RSM). Initial experiments were conducted to identify baseline parameters that maximized moisture reduction in untreated sludge, revealing optimal F/T conditions of −16°C freezing temperature, 14-hour freezing duration, and 20 cycles. Building upon these findings, the study expanded its scope to incorporate straw as a conditioning agent, aiming to quantify its impact on moisture content dynamics and establish an optimized operational window for mixed sludge-straw systems. It illustrated the impact of the straw blending ratio on the moisture content of the sludge under specific freeze-thaw conditions (Figure 1).
The moisture content of the sludge decreases as the straw blending ratio increases. At a straw blending ratio of 20%, the sludge's moisture content measures 35.65%, marking a 40.35% reduction compared to the original sewage sludge and a 4.75% decrease compared to freeze-thaw cycles without straw conditioning under identical freeze-thaw conditions. This negative correlation between the sludge's moisture content and the straw blending ratio implies that raising the straw blending ratio benefits the sludge's dewatering efficiency. Beyond a 20% straw blending ratio, the decline in sludge moisture content persists, albeit with diminishing returns. As the straw blending ratio rises, the dry straw absorbs some moisture, hindering the sludge from expelling water under lower pressure and increasing the workload of sludge treatment. Hence, it can be inferred that in this experiment, a higher straw blending ratio does not necessarily yield superior results. The optimal range of straw blending ratio influencing the dewatering performance of sludge during freeze-thaw cycles is 5% to 20%.
As revealed by the response surface experiments, the freezing temperature during sludge freeze-thaw cycles exerts a comparatively minor influence when contrasted with the freezing-thawing duration and frequency. Consequently, during the design of the straw-conditioned sludge freeze-thaw cycle experiments, the optimal freezing temperature (approximately -16°C) was initially ascertained. Following this, parameters including freezing-thawing duration, frequency, and straw blending ratio were chosen in accordance with this temperature. Varied proportions of screened straw were incorporated into the sludge for the freeze-thaw cycle experiments (5%, 10%, 15%, 20%).
A three-factor, three-level Box-Behnken design (BBD) was employed under the RSM framework, selected for its efficiency in exploring nonlinear interactions while minimizing experimental runs compared to full factorial designs. The independent variables included:
Freezing-Thawing Duration (X₁): Ranging from 4 to 24 hours, this parameter governs ice crystal growth and structural disruption of sludge flocs.
F/T Cycle Frequency (X₂): Tested between 5 and 20 cycles, this factor determines the cumulative mechanical stress imposed on the sludge matrix.
Straw Mixing Ratio (X₃): Varied from 5% to 20% (w/w), representing the proportion of dried straw (particle size < 2 mm) blended into the sludge.
Subsequently, these ranges were transformed into low and high-level values, coded according to their respective factors, while maintaining central level values at 14, 12.5, and 12.5 for each coded factor.
2.2. ANOVA with the Establishment of the Regression Equation
A regression model was developed and validated to ascertain the optimal parameters. Based on the BBD response surface experimental design, a total of 12 experiments at varying levels were performed, including 5 repetitions. Eventually, the optimal experimental conditions that influenced the moisture content of straw-conditioned sludge after freeze-thaw cycles were identified as follows: freezing at -16°C for 24 hours, 12.5 freeze-thaw cycles, and a 20% straw blending ratio. Under these circumstances, the moisture content of the sludge decreased from 62.7% to 35.9%, resulting in a 3.4% reduction compared to the sludge without straw conditioning in the same conditions.
The experimental results underwent a variance analysis using Design-Expert 13.0 software. The sludge moisture content model had a significant F-value of 63.83, a fitted R^2 of 0.9880, and a correlation p-value < 0.0001, all of which suggest the model's importance, accuracy, and usefulness in analyzing and predicting the effects of individual factors and interaction terms on sludge moisture content. Furthermore, a lack of fit can serve as an indicator of model adequacy [12]. The p-value for the moisture content model's lack of fit was 0.1183, exceeding the 0.05 significance level, indicating a non-significant lack of fit. In addition, the signal-to-noise ratio was 26.9581, surpassing 4, indicating the model's reliability and repeatability to a certain degree [13]. The experimental actual values were distributed around the predicted values, which confirms the accuracy of the model fit by demonstrating close agreement between actual and predicted values (Figure 2).
Equation (1) displays the fitted equation for sludge moisture content (Y) under varying factor conditions (X1, X2, X3). The positive sign (+) preceding an influencing factor represents a promotion effect on sludge moisture content, while a negative sign (-) signifies a reduction effect on sludge moisture content.
Y=67.04404-0.51863X1-1.36178X2-0.92933X3-0.03733X1X2-0.026X1X3-0.02044X2X3+0.03635X12+0.0664X22+0.03529X32
2.3. Experimental Analysis of Response Surface Method Using Sludge Water Content as an Evaluation Index
By conducting a significance test on the model coefficients, an analysis of the sludge moisture content demonstrated that the p-values for each individual influencing factor, namely X1 (freeze-thaw duration), X2 (freeze-thaw frequency), and X3 (straw mixing ratio), were all found to be less than 0.0001. These results indicate that the effects of freeze-thaw duration, frequency, and straw mixing ratio on the sludge moisture content are all highly significant. Moreover, the negative signs preceding X1, X2, and X3 signify that an increase in freeze-thaw duration, frequency, and straw mixing ratio leads to a decrease in the sludge moisture content. The order of influence of the independent variables on the response value, as determined by the F-values of X1, X2, and X3, is as follows: straw mixing ratio (X3) > freeze-thaw frequency (X2) > freeze-thaw duration (X1). This section elaborates on the mechanistic interpretation of factor effects, interaction dynamics, and validation experiments, supported by contour plots, perturbation analyses, and empirical verification.
Regarding the interaction effects between different factors, the p-values for X1X2 (freeze-thaw duration and frequency), X1X3 (freeze-thaw duration and straw mixing ratio), and X2X3 (freeze-thaw frequency and straw mixing ratio) are 0.0008, 0.0058, and 0.0541, respectively. Based on the F-values of the interaction terms, which are 31.66 and 15.36, respectively, we can conclude that the interaction effect of X1X2 has a greater impact on the sludge moisture content compared to X1X3.
By representing the interrelationships between different factors as contour plots, Figure 3(a) reveals that the sludge moisture content decreases rapidly with an increase in freeze-thaw duration and frequency, thus indicating a synergistic effect between these two factors on the sludge moisture content. With regard to the relationship between freeze-thaw duration and straw mixing ratio, as well as freeze-thaw frequency and straw mixing ratio, Figure 3(b) and (c) reveal that as the straw mixing ratio increases, an increase in freeze-thaw duration and frequency can result in a reduction in the sludge moisture content within a certain range.
In light of the experimental findings, it was prognosticated that the optimal experimental parameters would entail a freeze-thaw duration of 24 hours, a freeze-thaw frequency of 20 cycles, and a straw mixing ratio of 20%.Under these specified conditions, the model envisaged a sludge moisture content of 33.93%.To validate the predicted value, three parallel experiments were executed under the anticipated optimal conditions, yielding experimental results of 31.92%, 31.26%, and 30.83% correspondingly. The projected outcomes fell within 5% of the actual results [14], suggesting the viability of utilizing response surface methodology to optimize the physicochemical characteristics of straw-conditioned sludge during freeze-thaw cycles, thereby enhancing its dewatering efficiency.
The dewatering performance of sludge is generally subpar, and depending solely on mechanical methods has limited efficacy in enhancing its dewatering capabilities [15]. Hence, to further decrease the moisture content of sludge and bolster its dewatering performance, conditioning agents can be incorporated for treating the sludge. In this investigation, straw was employed as a conditioning agent primarily due to its capacity to absorb residual moisture in the sludge, consequently diminishing its moisture content and enhancing its dewatering performance [16]. Moreover, this treatment method demonstrates consistent outcomes and facilitates the utilization of straw resources.
By comparing the F-values of the sludge moisture content model, it becomes apparent that the proportion of straw mixing in the independent variables has the most substantial effect on the response variable. Hence, the impact of the straw mixing ratio on sludge dewatering performance is examined and evaluated, as illustrated in Figure 4. It is evident that after undergoing freeze-thaw cycle pretreatment, the residual sludge's specific resistance to filtration (SRF) diminishes as the straw mixing ratio increases. With the gradual increase of added straw, both SRF and cake moisture content display a notable downtrend. The optimal straw mixing ratio amounts to 20%, at which juncture both SRF and cake moisture content can be minimized to their respective lowest values of 1.30×10¹² m/kg and 35.65%. However, when the straw mixing ratio keeps surging, alterations in SRF and moisture content of the sludge become sluggish, leading to a limited effect on its dewatering efficiency.
In order to delve deeper into the impact of straw conditioning on the thermal-mass transfer characteristics of sludge and analyze the mechanism through which straw affects the flocculent structure of sludge, the particle size distribution of the sludge floc before and after straw conditioning is depicted in Figure 5a and b. During the experiment, utilizing straw as a conditioner can induce varying degrees of alteration in the particle size of sludge flocs. Thus, by scrutinizing the particle size distribution of sludge flocs, the underlying mechanism of the experiment can be elucidated more effectively. The particle size distribution of sludge within the 0-1000 μm range was investigated, and it was observed that the particle size distribution exhibited a predominantly normal pattern. Following the straw conditioning, the sludge exhibited a notable leftward displacement in comparison to the particle size distribution curve of the frozen-thawed pretreated sludge. In order to provide a more intuitive depiction of the alterations in sludge particle size, the mean particle size of sludge flocs was selected as the principal criterion for analysis. Upon the introduction of straw into the sludge, the average particle size of the sludge diminished from 116.4 μm to 74.96 μm. This occurs because introducing straw leads to the expansion of sludge flocs, thus facilitating the development of dehydration pores. Furthermore, the collaborative influence of freeze-thaw cycles augments the requisite channels for dehydration, subsequently enhancing the efficiency of sludge dewatering.
Utilizing TG-DTG curves of sludge samples subjected to varying freezing temperatures, this study investigates the impact of straw conditioning on the thermal mass transfer in sludge during freeze-thaw cycles. In order to facilitate comparison, the thermogravimetric curves of both untreated and straw-conditioned sludge samples after undergoing freeze-thaw cycles were acquired at a heating rate of 20℃/min, as depicted in Figure 5c.
Through a comparison of the characteristic curves between individual sludge samples and sludge-straw mixed samples, it becomes evident that the combustion performance of both sludge and straw was thoroughly accounted for during the entire process. The composition of straw encompasses crude protein, cellulose, hemicellulose, lignin, and various other components. Hemicellulose, one of these components, possesses an irregular amorphous structure characterized by low thermal stability, with a decomposition temperature ranging from 220 to 315℃.Cellulose molecules are linked together by glycosidic bonds and possess a non-branching structure that makes them resistant to decomposition. The decomposition temperature of cellulose is documented to fall within the range of 315 to 400℃ [17]. Conversely, lignin exhibits high stability and is resistant to degradation. Its combustion range can span from room temperature up to 850℃ (without achieving complete combustion) [18]. Evidently, during the second stage, the combustion of straw is predominantly governed by the presence of hemicellulose and cellulose.
The stages of volatilization and combustion represent the periods wherein the maximum weight loss rate is most prone to manifest during the combustion of sludge and straw. Nevertheless, the maximum weight loss rate of the sludge mixed sample following straw conditioning surpasses that of sludge-only combustion, rising from 1.84% to 4.75%. This observation suggests that the freeze-thaw cycles experienced by straw-conditioned sludge can augment the maximum weight loss rate, thereby intensifying the volatilization and combustion stages of the sample. Furthermore, as a result of straw conditioning, the weight loss temperature associated with sludge pyrolysis correspondingly rises. This phenomenon is likely attributed to the fact that straw conditioning expedites the combustion of volatile components within the sludge, facilitating the premature reaction between unburned organic matter in the sludge and environmental oxygen, thereby decomposing it into more combustible substances.
3. Mathematical Model for Coupled Freezing-Thawing Process
The freeze-thaw (F/T) dewatering of sludge involves intricate interactions among heat transfer, moisture migration, and multiphase fluid dynamics within a porous medium [19]. To elucidate these coupled phenomena, a comprehensive mathematical model was developed using COMSOL Multiphysics® 5.6, integrating the principles of non-isothermal flow, phase change dynamics, and hygroscopic porous media theory. This section delineates the governing equations, boundary conditions, and numerical implementation strategies underpinning the model, which bridges experimental observations with mechanistic insights into sludge dehydration [20].
3.1. Heat Conduction Containing Wet Porous Media
The heat balance transfer equation for the sludge is derived from the following equation, taking into account the effective control volume heat capacity at constant pressure, the temporal temperature variation, the energy change due to thermal convection of water vapor and liquid water, the diffusion term, and the heat source term:
The variables and parameters introduced in the equation are employed for modeling the heat conduction process, particularly in the context of moist air and water. The subscript "" is used to denote the gas phase (moist air), while the subscript "1" is applied to the liquid phase (water). The variables "" and "" represent the densities of water vapor and liquid water, respectively. Similarly, "" and "" correspond to the specific heat capacities of water vapor and liquid water at constant pressure. The variables "" and "" denote the velocity fields of liquid water and water vapor, respectively. "" represents the heat flux, "" signifies the effective thermal conductivity (averaged across solid, liquid, and gas phases), and "" denotes the effective volume heat capacity at constant pressure.
Building upon the provided equation, "" denotes the liquid water saturation, while "" signifies the combined effect of heat diffusion and capillary flux in liquid water. By incorporating the following formula, the latent heat of evaporation is included as a source term in the heat transfer equation:
Within the equation, "" represents the heat source resulting from water phase change, and "" symbolizes the latent heat of evaporation.
3.2. Water Transport in the Porous Media
By summing the mass conservation equations for steam and liquid water, we can acquire the temporal variation of humidity within a porous medium:
Within the equation, "" denotes the total moisture content, encompassing both liquid water and water vapor, measured in kg/m^3. "" represents the relative humidity, "" symbolizes the velocity field of moist air, and "" signifies the mass fraction of water vapor in moist air.
Within this equation, "" denotes the molar mass of water vapor, "" signifies the saturation concentration of water vapor, "" represents the diffusive flux of moist air, "" symbolizes the effective diffusion coefficient of water vapor in the porous medium, "" denotes the velocity field of liquid water, "" signifies the relative permeability of liquid water as a function of saturation, "" represents the permeability of the porous medium, "" symbolizes absolute pressure, and "" represents the capillary flux of liquid water, expressed through the diffusion equation concerning relative humidity:
"" symbolizes the diffusion coefficient of water. In equation (7), "" serves as the water source term, and the condensation source term in the liquid water mass conservation equation nullifies the evaporation source term in the vapor mass conservation equation. The source term for water via evaporation can be defined using a water vapor transport equation.
4. Model Development
The simplified dewatering process of sludge, acting as a porous medium, assumes significance in industries like water treatment and resource recycling, where it necessitates the consideration of strongly coupled physical effects, including fluid flow, phase change heat transfer, and the transfer of liquid and gas [21]. The effects occurring within hygroscopic porous media can be modeled by utilizing predefined interfaces in COMSOL. Within this model, an assumption is made that the liquid phase and gas phase achieve equilibrium within the simplified porous sludge cake sample. Moreover, the calculation of time-varying water saturation is conducted to simulate the thermal and moisture transfer during two-phase flow.
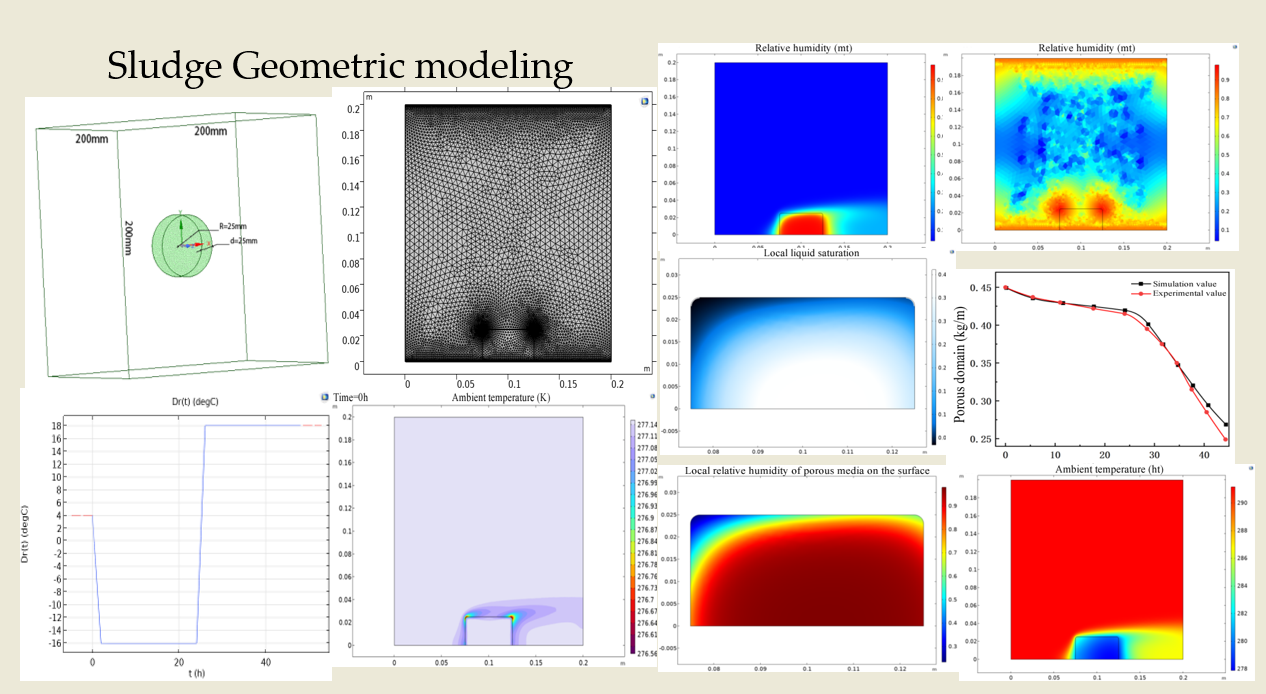
4.1. Geometric Model and Network Partitioning
The geometric representation of the sludge sample was designed to replicate experimental conditions while balancing computational efficiency. The cylindrical sludge cake, with a diameter of 5 cm and height of 2.5 cm, was simplified to a two-dimensional axisymmetric domain (Figure 6a) to reduce computational overhead without sacrificing accuracy. This simplification is justified by the radial symmetry observed in experimental moisture and temperature distributions. The model is discretized using a swept meshing technique with a maximum element size of 1 mm, minimum element size of 0.02 mm, curvature factor of 0.2, and a resolution of 1 in regions of high curvature. Figure 6b illustrates the resulting meshed domain of the porous medium.
4.2. Condition of Experiment
The purpose of the sludge freezing experiment is to simulate a cyclic test in which the surrounding environment, characterized by cold airflow, facilitates the removal of moisture. The non-steady-state nature of sludge dewatering simulation imposes limitations on the duration of software simulation due to factors like small time steps. In this experimental study, our focus is solely on simulating and analyzing the sludge dewatering process under specific conditions, namely a freezing temperature of -16°C, a freezing duration of 24 hours, and one freeze-thaw cycle. This approach allows us to evaluate the accuracy of our model. In COMSOL, interpolation functions are employed to set the temperature distribution surrounding the sludge, approximating the actual experimental conditions. This setup is depicted in Figure 6c. The dry density of the mud cake is specified as 1700 kg/m3, accompanied by an initial uniform moisture content of 0.8075 cm3/cm3 and a saturation water content of 95.00%. The sludge initially has a temperature of 4°C. The corresponding temperature distribution within the model is illustrated in Figure 6d.
4.3. Parametric Analysis and Discussion
The primary method for verifying the simulation involves comparing and analyzing the experimental values with the simulated values, with a specific emphasis on the temporal trend of sludge moisture content. Figure 7d illustrates the utilization of an integration operator within the porous domain to calculate the variations in moisture content within the sludge, thereby facilitating the determination of its changes.
The findings from Figure 7d demonstrate that, under specific experimental conditions, the numerical simulation closely corresponds to the experimental values of sludge moisture content during the initial to intermediate stages. The disparity is minimal, and the experimental and simulated data exhibit a high degree of proximity. These results indicate that the numerical simulation process, which incorporates parameters such as sludge density, specific heat, and thermal conductivity, is highly suitable for studying the sludge dewatering process experimentally.
Nevertheless, as the dewatering process advances, the experimental and simulated values progressively deviate due to the formation of cracks and shrinkage in the sludge, resulting in an augmented divergence in moisture content between the two. The presence of cracks and pores facilitates the escape of moisture from the sludge, thereby considerably improving the dewatering efficiency. Moreover, the disparity between the experimental and simulated values intensifies with the ongoing progress of the dewatering process.
In the simulation of the sludge dewatering process, the presence of cracks and pores, which enhances the contact area between the sludge and air, was not taken into account. This omission led to the numerical model of the sludge remaining unaltered throughout the calculation process, signifying that the formation of cracks and pores profoundly affects the mass transfer phenomena during the simulation of the sludge dewatering process.
The experimental dewatering process was concluded when the integral of the sludge porous medium attained 0.257 kg/m. At this juncture, the simulated sludge mass fell within the range of 0.263 to 0.271 kg/m, exhibiting close agreement with the experimental values.
Under freezing conditions of -16℃, following 24 hours of freezing and one freeze-thaw cycle, the mean moisture content within the sludge, as well as the average temperature distribution across the central cross-section of the entire model, were visually displayed using cloud charts, as depicted in Figure 7e and f.
To provide a clearer representation of the moisture content distribution within the sludge, the figure showcases the grid quality of the porous medium and the relative humidity of the surrounding environment. Additionally, the liquid saturation of the porous medium is depicted in Figure 7a, b and c. The observation reveals that the liquid saturation in the model demonstrates a certain correlation with the relative humidity, suggesting that the model construction aligns more closely with the real-world scenario.
It indicates a gradient distribution trend, where the surface layer exhibits lower moisture content compared to the interior (Figure 7e). During the initial stage of the dewatering process, at the 120-minute mark, the loss of moisture in the sludge primarily occurs from the free water present on the surface. Simultaneously, the moisture surrounding the surface of the sludge diffuses outward, replenishing the lost surface moisture. While the moisture content near the center of the sludge remains uniform, a small amount of this moisture will also migrate towards the surface.
That depicts the temperature distribution at different positions within the sludge throughout the thawing process (Figure 7f). Initially, in the thawing stage, the temperatures above and to the left of the sludge exhibit relatively higher values, while the central temperature is comparatively lower, resulting in an overall gradient distribution. Over time, the temperature at the center of the sludge gradually rises until the entire sludge reaches a uniform thawed state. During the dewatering process, air passes over the surface of the sludge, dissipating heat from the surface layer and causing a rapid increase in surface temperature. Once the thawing stage commences, the surface layer of the sludge and the boundary temperature rapidly approach the pre-set environmental temperature. Consequently, a temperature difference arises between the outer and inner layers of the sludge, leading to heat transfer towards the internal regions influenced by this temperature gradient. As a result, the temperature within the sludge progressively increases from the outer layers towards the inner layers.
Under the given condition of freezing at a temperature of -16°C for a duration of 24 hours and undergoing a single freeze-thaw cycle, the central cross-section of the model is chosen as the subject of investigation. Temperature distribution contour maps along the cross-sectional direction are plotted at specific time points, namely 23 hours, 24 hours, 26 hours, 33 hours, and 45 hours, to depict the experimental environment and the localized temperature distribution within the porous medium. This analysis aids in exploring and illustrating the temperature variation pattern during the dewatering process of the sludge, as visually represented in Figure 8.
From the observations presented in Figure 8, it is apparent that as the sludge undergoes the thawing and dewatering process, the low-temperature region gradually decreases while the temperature rises progressively. The blue region within the sludge gradually diminishes, whereas the yellow region occupies a larger portion of the sludge. As the dewatering process advances, the temperature gradient layer within the sludge gradually diminishes until it eventually vanishes. Initially, at around the 26-hour mark, each temperature layer near the outer layer of the sludge exhibits a thinner thickness, and there exist more temperature layers due to the convective heat transfer caused by air passing over the surface of the sludge. This heat transfer leads to heat being transferred to the surface of the sludge, resulting in a temperature difference between the surface and interior of the sludge. Utilizing this temperature difference, heat starts to transfer from the surface of the sludge towards its interior, causing the internal temperature to gradually approach the surface temperature. Consequently, each temperature layer gradually disappears, and the internal temperature rises progressively.
It is worth noting that the model is designed to simulate the ventilation of the drying room, entering from the left side, which exerts the greatest impact on the upper left position of the sludge during the simulation process. This observation further validates that the model construction aligns with the actual operating conditions.
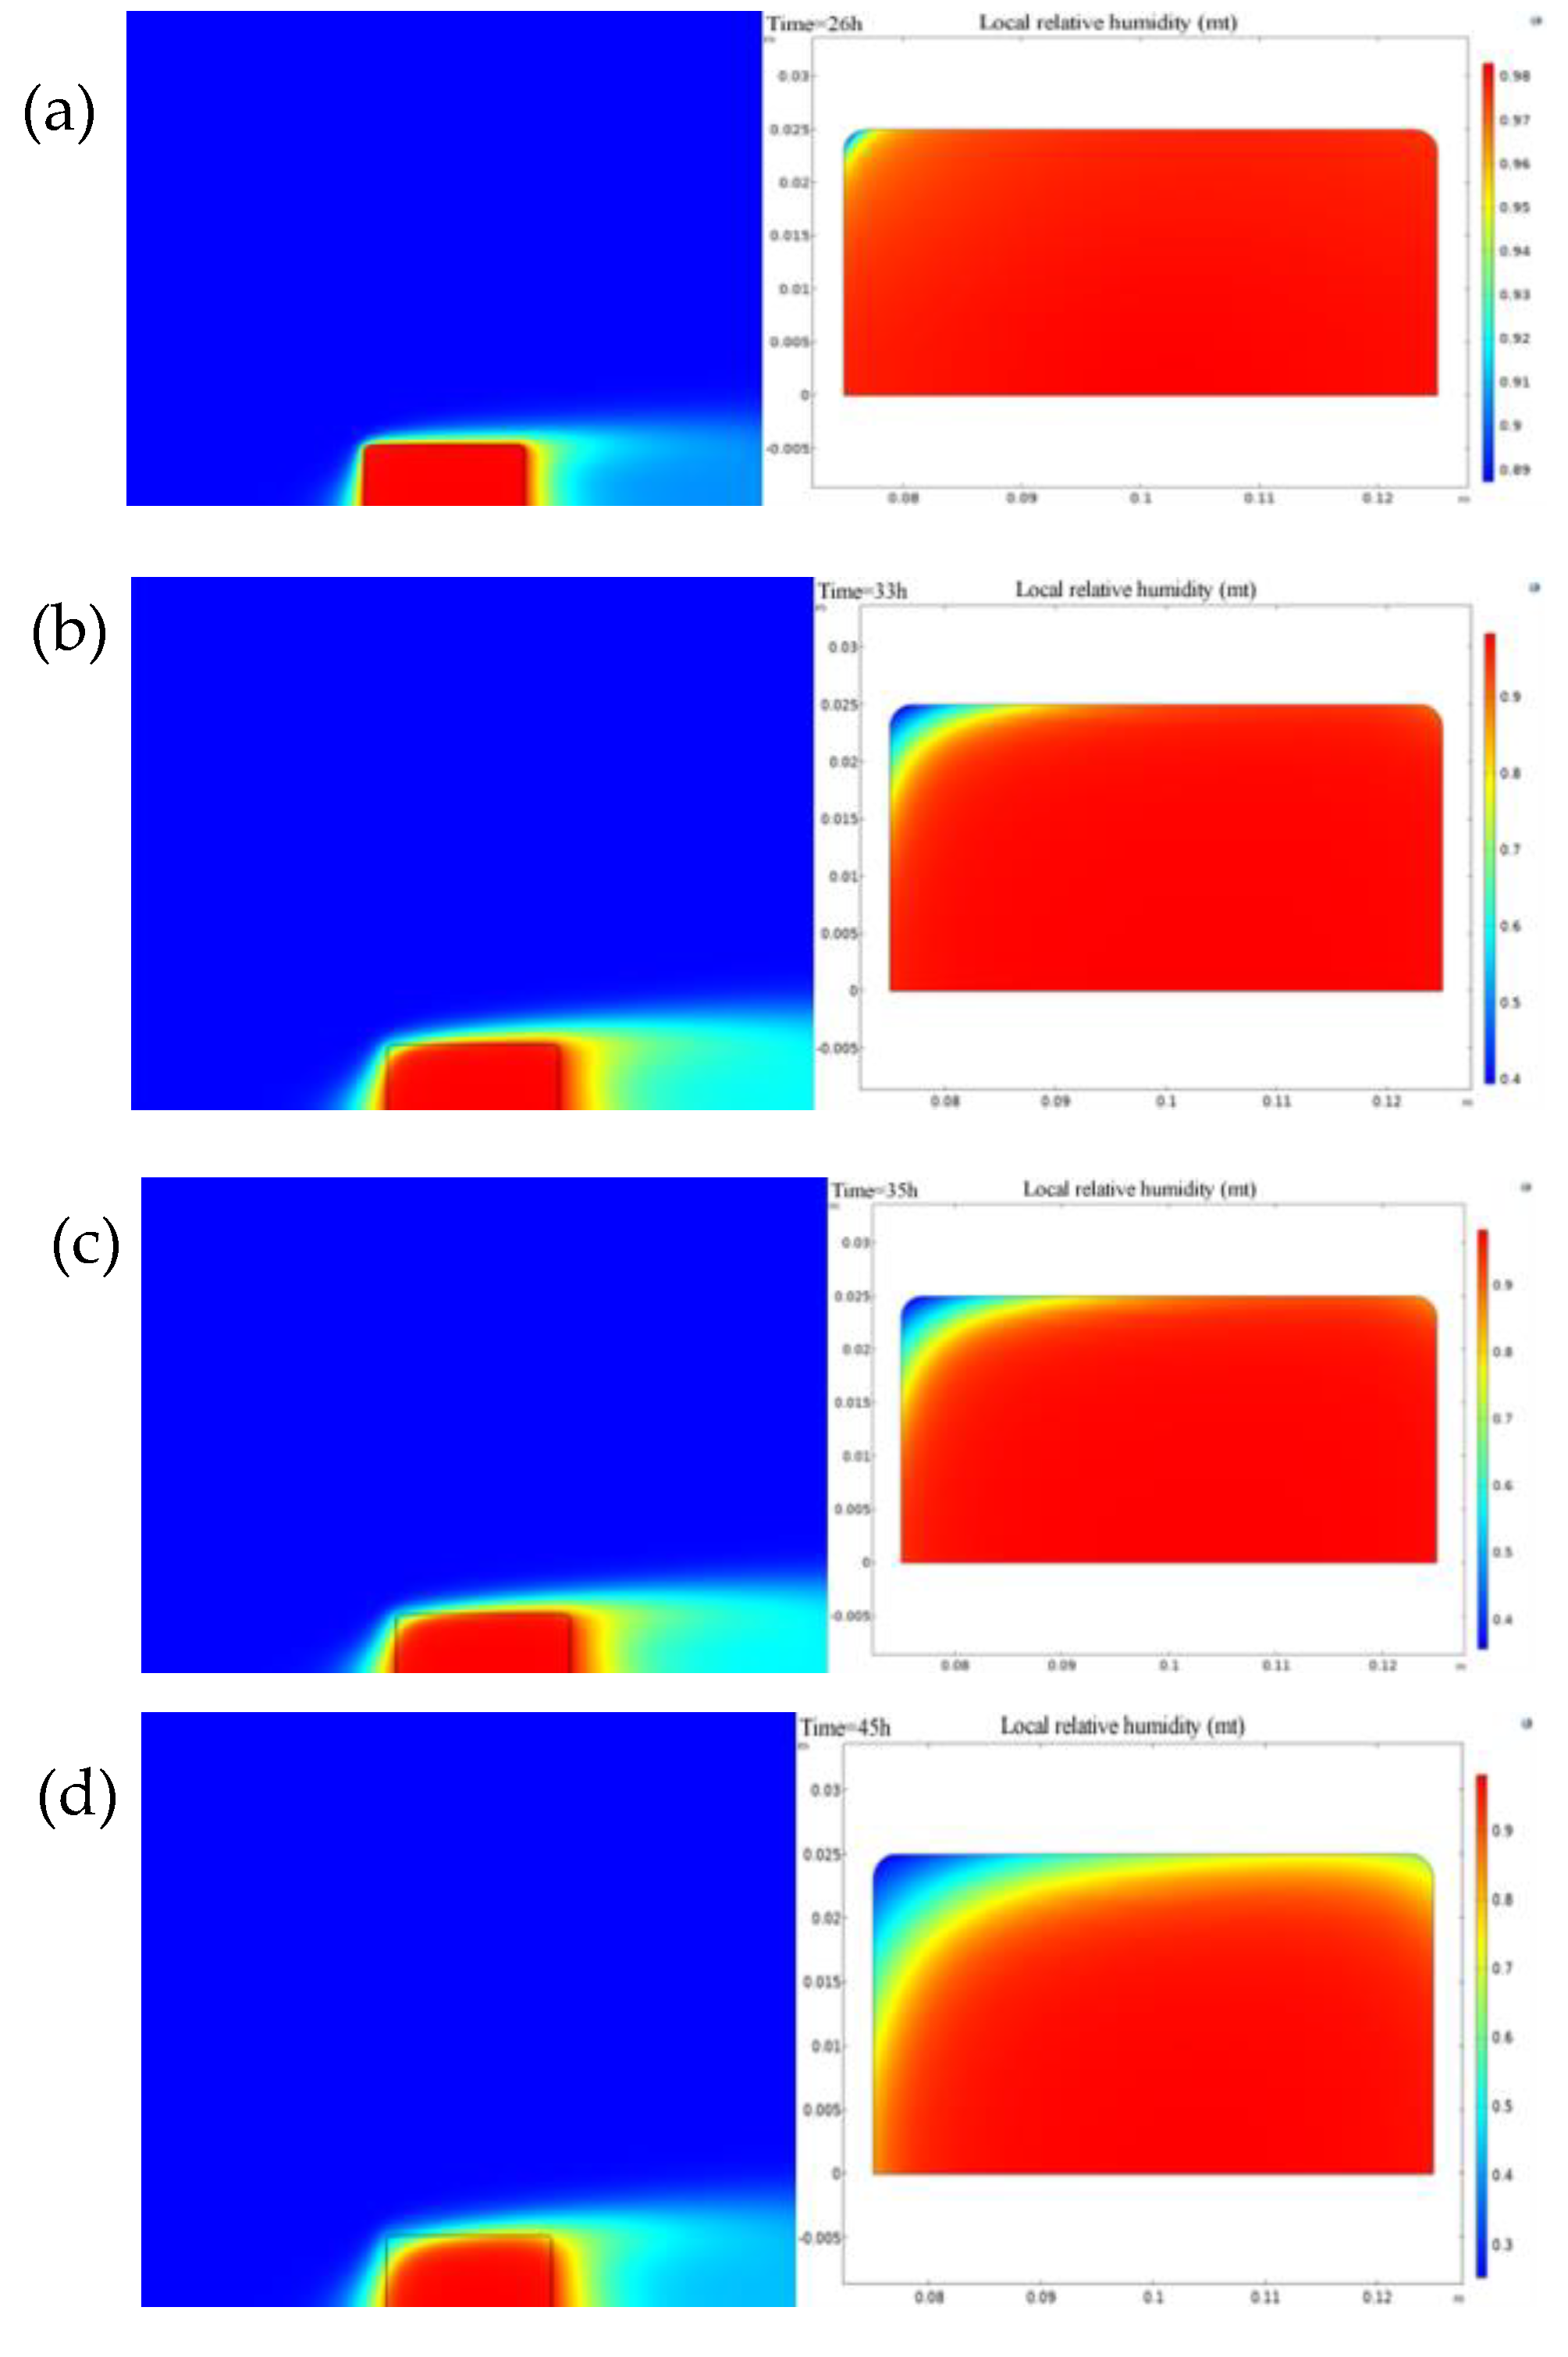
Under the condition of freezing at -16℃ for 24 hours and undergoing one cycle of freezing and thawing, the central cross-section of the sludge was selected as the research object. The humidity distribution cloud maps of the experimental environment and the local porous medium were obtained at the moments of 26 hours, 33 hours, 35 hours, and 45 hours to investigate the moisture variation law of the sludge during the dehydration process, as depicted in Figure 9.
Figure 9 illustrates that as the sludge undergoes gradual thawing and dehydration, the region with higher moisture content (the red area) contracts towards the center of the sludge. With the progress of the experiment, the water content inside the sludge gradually decreases, while the trend of increasing moisture content from the surface to the center of the sludge remains unchanged. With the progress of the experiment, the water content inside the sludge gradually decreases, while the trend of increasing moisture content from the surface to the center of the sludge remains unchanged. The thickness of each moisture layer in the sludge increases as well. The difference in moisture content between the surface and the interior of the sludge is caused by the absorption of heat by the sludge from the air, which leads to the initial evaporation of surface moisture into the air.
Therefore, moisture in the vicinity of the sludge surface preferentially moves towards the surface, gradually decreasing the moisture content and forming a moisture gradient towards the central region of the sludge. Consequently, the moisture content progressively increases layer by layer from the surface to the interior of the sludge.
5. Conclusion
(1) Optimal Operational Parameters: Through response surface methodology (RSM), the optimal F/T conditions were identified as freezing at −16°C for 24 h, 12.5 cycles, and a 20% straw mixing ratio. Under these conditions, the sludge moisture content decreased from 62.7% to 35.9%, achieving a 40.35% reduction compared to untreated sludge and a 4.75% improvement over F/T treatment without straw. This configuration balances dewatering efficiency with practical feasibility, offering a scalable solution for industrial applications.
(2) With a gradual increase in the amount of added straw, notable reductions were observed in both the solidification reactivity factor (SRF) and the cake moisture content. Upon reaching the optimal straw mixing ratio of 20%, the SRF minimized to 1.301012 m/kg. Subsequent increments in straw addition yielded marginal improvements in dewatering performance.
(3) Incorporating straw conditioner facilitated the formation of supplementary channels in the dewatering process, while the synergistic impact of freezing-thawing cycles contributed to a decreased particle size of the sludge, consequently elevating its dewatering efficiency. Thermogravimetric analysis highlighted that the freezing-thawing cycles of straw-conditioned sludge escalated the maximum weight loss rate during volatilization and combustion phases. Additionally, the straw conditioning elevated the temperature associated with substantial weight loss in the sludge during thermal decomposition.
(4) Through the utilization of COMSOL Multiphysics software, simulations were performed to assess thermal and moisture variations, along with heat and mass transfer, throughout the sludge dewatering procedure. Subsequently, the simulated outcomes underwent comparison and analysis alongside experimental data, confirming the alignment between numerical simulations and empirical observations. This methodology elucidated the mechanism underpinning the decline in sludge moisture content during the freezing-thawing study and validated the efficacy of simulating the integrated water and heat mechanisms of sludge through COMSOL Multiphysics, substantiated by indoor freezing-thawing assessments on sludge specimens.
6. Acknowledgement
This research was sponsored by the Natural Science Foundation of Heilongjiang Province of China (No.PL2024E017), Reserve Talents Program of Heilongjiang Regular Undergraduate Institution(No.2023-KYYWF-0986).
References
- Askari, S.S.; Giri, B.S.; Basheer, F.; Izhar, T.; Ahmad, S.A.; Mumtaz, N. Enhancing sequencing batch reactors for efficient wastewater treatment across diverse applications: a comprehensive review. Enviro. Res. 2024, 119656. [Google Scholar] [CrossRef] [PubMed]
- Meng, M.; Zhang, W.; Zhu, X.; Shi, Q. Agricultural mechanization and rural worker mobility: evidence from the agricultural machinery purchase subsidies programme in China. Econ. Model. 2024, 139, 106784. [Google Scholar] [CrossRef]
- Bicalho, S. F.; Pegoraro, R. F.; Almeida Neta, M. N.; Barroso, A. M. F.; Frana, Letícia Oliveira; Santos, L. S.; Silva R. R.; Rodrigues M. N.; Sampaio R. A.; Viana L.B. Biochemical changes, metal content, and spectroscopic analysis in sewage sludge composted with lignocellulosic residue using ftir-mir and ftir-nir. Environ. Sci. Pollut. R. 2024, 31, 35727–35743. [Google Scholar] [CrossRef] [PubMed]
- Famielec, S.; Malinowski, M.; Krilek, W. K. The effect of biological methods for msw treatment on the physicochemical, microbiological and phytotoxic properties of used biofilter bed media. Waste Manage. 2024, 175, 276–285. [Google Scholar] [CrossRef] [PubMed]
- Wei, W.; Guo, W.; Ngo, H.H.; Mannina, G.; Wang, D.; Chen, X.; Liu, Y.; Peng, L.; Ni, B.J. Enhanced high-quality biomethane production from anaerobic digestion of primary sludge by corn stover biochar. Bioresource Technol. 2020, 306, 123159. [Google Scholar] [CrossRef] [PubMed]
- Wang, Q.; Song, L.; Hui, K.; Song, H. Iron powder activated peroxymonosulfate combined with waste straw to improve sludge dewaterability. Environ. Technol. 2021, 42, 1302–1311. [Google Scholar] [CrossRef] [PubMed]
- Guo, S.; Qu, F.; Ding, A.; He, J.; Yu, H.; Bai, L.; Li, G.; Liang, H. Effects of agricultural waste-based conditioner on ultrasonic-aided activated sludge dewatering. RSC Adv. 2015, 5, 43065–43073. [Google Scholar] [CrossRef]
- Chen, J.; Gao, X.; Zheng, X.; Miao, C.; Zhang, Y.; Du, Q.; Xu, Y. Simulation of soil freezing and thawing for different groundwater table depths. Vadose Zone J. 2019, 18, 1–4. [Google Scholar] [CrossRef]
- Zhao, Y.; Zhang, L.; Wang, Y.; Lin, H. Thermal-hydraulic-mechanical (THM) coupling behaviour of fractured rock masses. Geofluids (Online), 2023. [Google Scholar]
- Zheng, G.; Yang, Y.; Yang, D.; Dafflon, B.; Lei, H.; Yang, H. Satellite-based simulation of soil freezing/thawing processes in the northeast Tibetan Plateau. Remote Sens. Environ. 2019, 231, 111269. [Google Scholar] [CrossRef]
- Montusiewicz, A.; Lebiocka, M.; Rożej, A.; Zacharska, E.; Pawłowski, L. Freezing/thawing effects on anaerobic digestion of mixed sewage sludge. Bioresource Technol. 2010, 101, 3466–3473. [Google Scholar] [CrossRef] [PubMed]
- Guo, C.J.; Ding, L.; Jin, X.P.; Zhang, H.W.; Zhang, D. Application of response surface methodology to optimize chromium (VI) removal from aqueous solution by cassava sludge-based activated carbon. J. Environ. Chem. Eng. 2021, 9, 104785. [Google Scholar] [CrossRef]
- Ma, J.; Chen, F.; Xue, S.; Pan, J.; Khoshnevisan, B.; Yang, Y.; Liu, H.; Qiu, L. Improving anaerobic digestion of chicken manure under optimized biochar supplementation strategies. Bioresource Technol. 2021, 325, 124697. [Google Scholar] [CrossRef] [PubMed]
- Zhou, R.; Zhang, M.; Li, J.; Zhao, W. Optimization of preparation conditions for biochar derived from water hyacinth by using response surface methodology (RSM) and its application in Pb2+ removal. J. Environ. Chem. Eng. 2020, 8, 104198. [Google Scholar] [CrossRef]
- Zhang, X.; Ye, P.; Wu, Y. Enhanced technology for sewage sludge advanced dewatering from an engineering practice perspective: A review. J. Environ. Manage. 2022, 321, 115938. [Google Scholar] [CrossRef] [PubMed]
- Gu, T.; Yamamoto-Ikemoto, R.; Tsuchiya-Nakakihara, E.; Watanabe, H.; Suetsugu, Y.; Yanai, A. Improvement of dewatering characteristics by co-digestion of rice straw with sewage sludge. Environ. Technol. 2016, 37, 3024–3029. [Google Scholar] [CrossRef] [PubMed]
- Yang, H.; Yan, R.; Chen, H.; Lee, D.H.; Zheng, C. Characteristics of hemicellulose, cellulose and lignin pyrolysis. Fuel, 2007, 86, 1781–1788. [Google Scholar] [CrossRef]
- Chen, D.; Cen, K.; Zhuang, X.; Gan, Z.; Zhou, J.; Zhang, Y.; Zhang, H. Insight into biomass pyrolysis mechanism based on cellulose, hemicellulose, and lignin: Evolution of volatiles and kinetics, elucidation of reaction pathways, and characterization of gas, biochar and bio-oil. Combust. Flame, 2022, 242, 112142. [Google Scholar] [CrossRef]
- Zhang, M.; Wen, Z.; Xue, K.; Chen, L.; Li, D. A coupled model for liquid water, water vapor and heat transport of saturated–unsaturated soil in cold regions: model formulation and verification. Environ. Earth Sci. 2016, 75, 1–9. [Google Scholar] [CrossRef]
- Chen, P.; Qi, L.; Zhang, X.; Ma, L.; Yang, G.; Qi, J. Analysis of heat–moisture coupling transfer for unsaturated soil under freezing and thawing based on fractal theory. Cold Reg. Sci. Technol. 2023, 206, 103744. [Google Scholar] [CrossRef]
- Liang, S.; Teng, J.; Shan, F.; Zhang, S. A numerical model of vapour transfer and phase change in unsaturated freezing soils. Adv. Civ. Eng. 2020, 2020, 8874919. [Google Scholar] [CrossRef]
Figure 1.
Effect of straw mixing ratio on sludge dewatering performance.
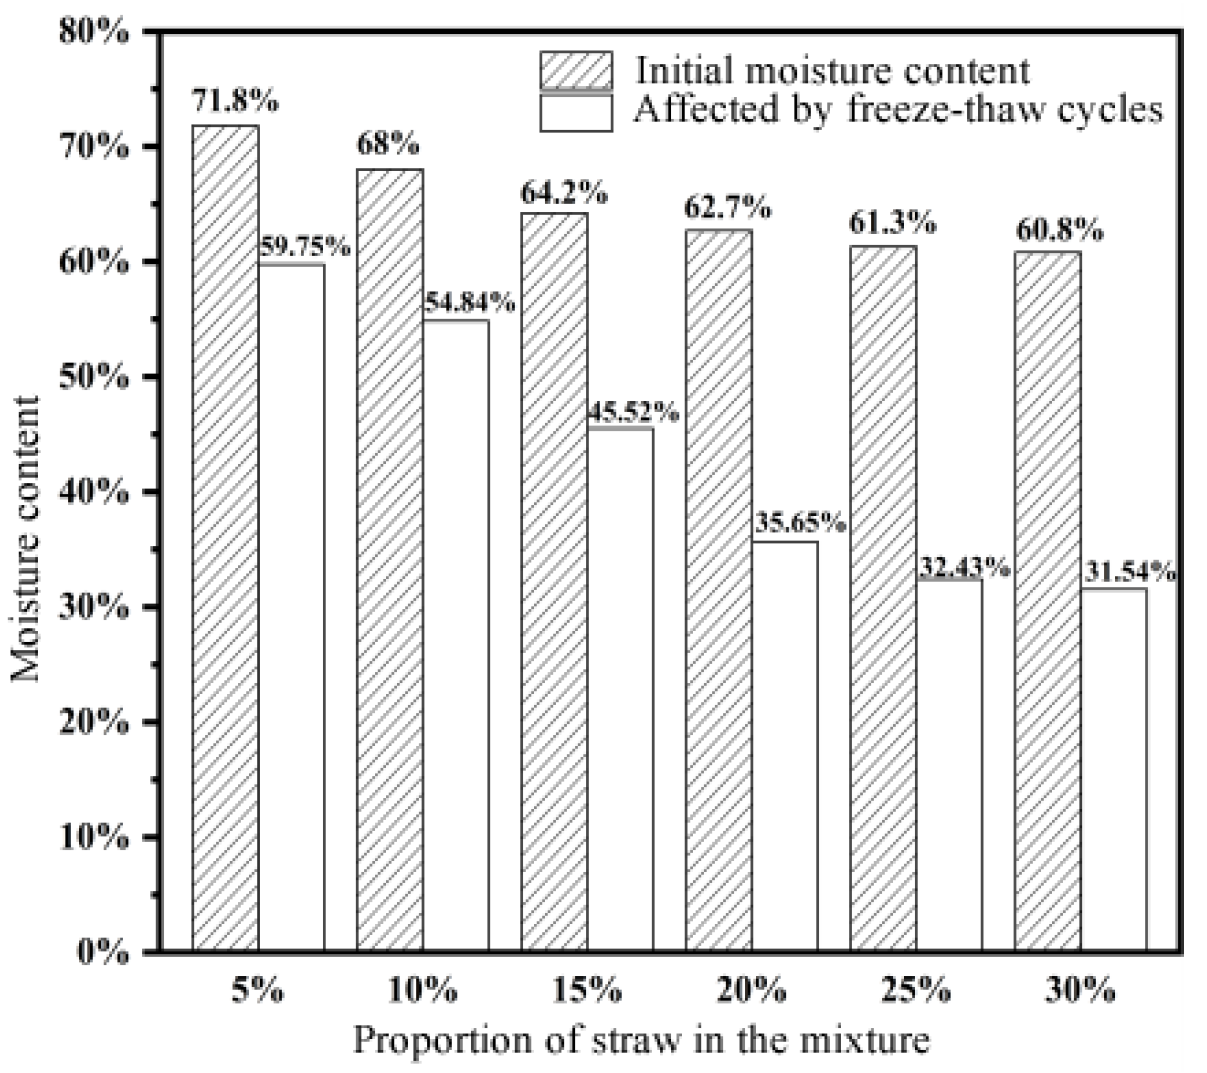
Figure 2.
The relationship between the actual and predicted values of moisture content.
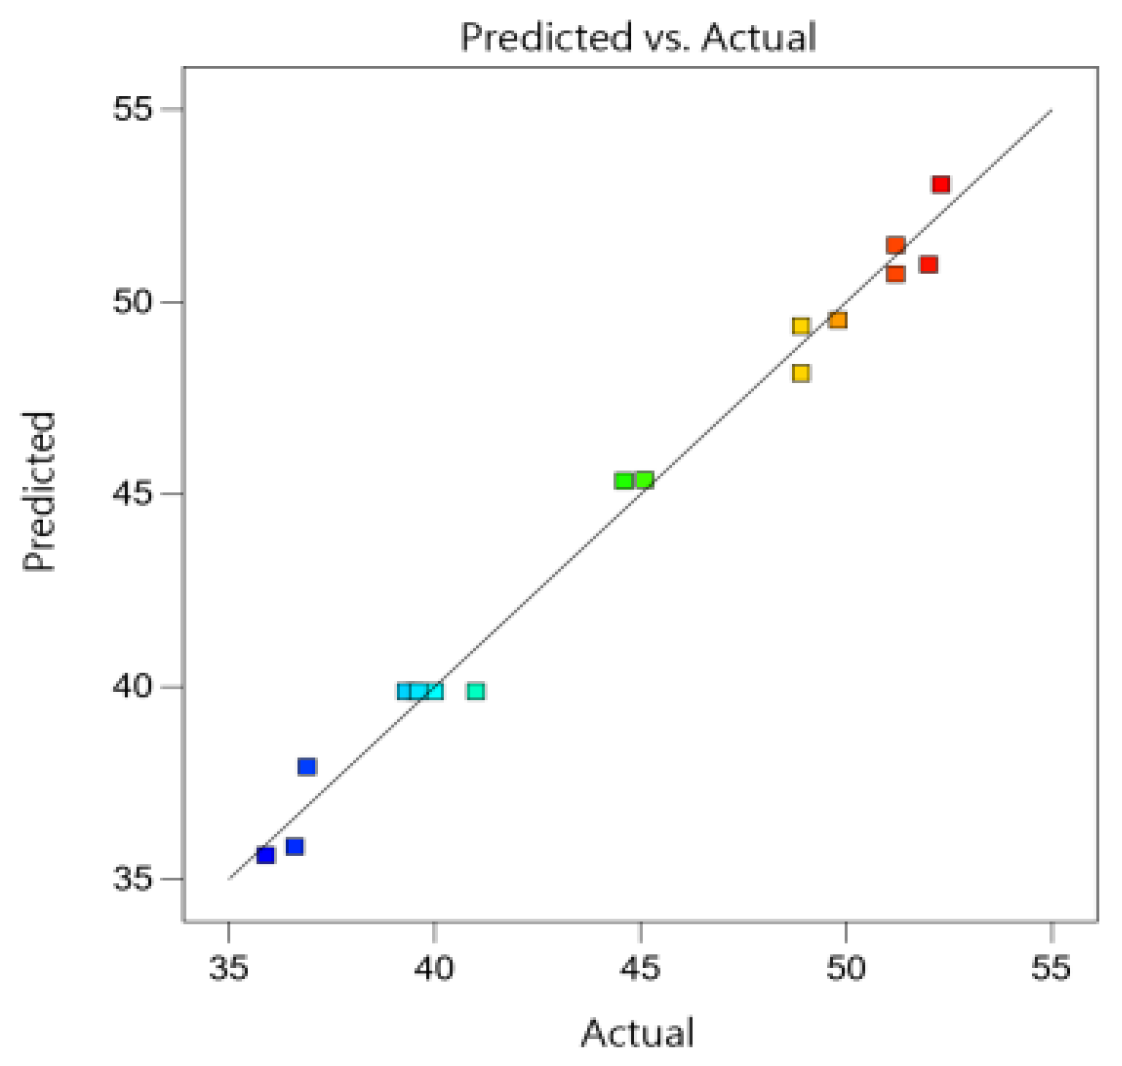
Figure 3.
Influence of Interaction of Factors on Straw Moisture Content Contour Diagram (a, b, c).
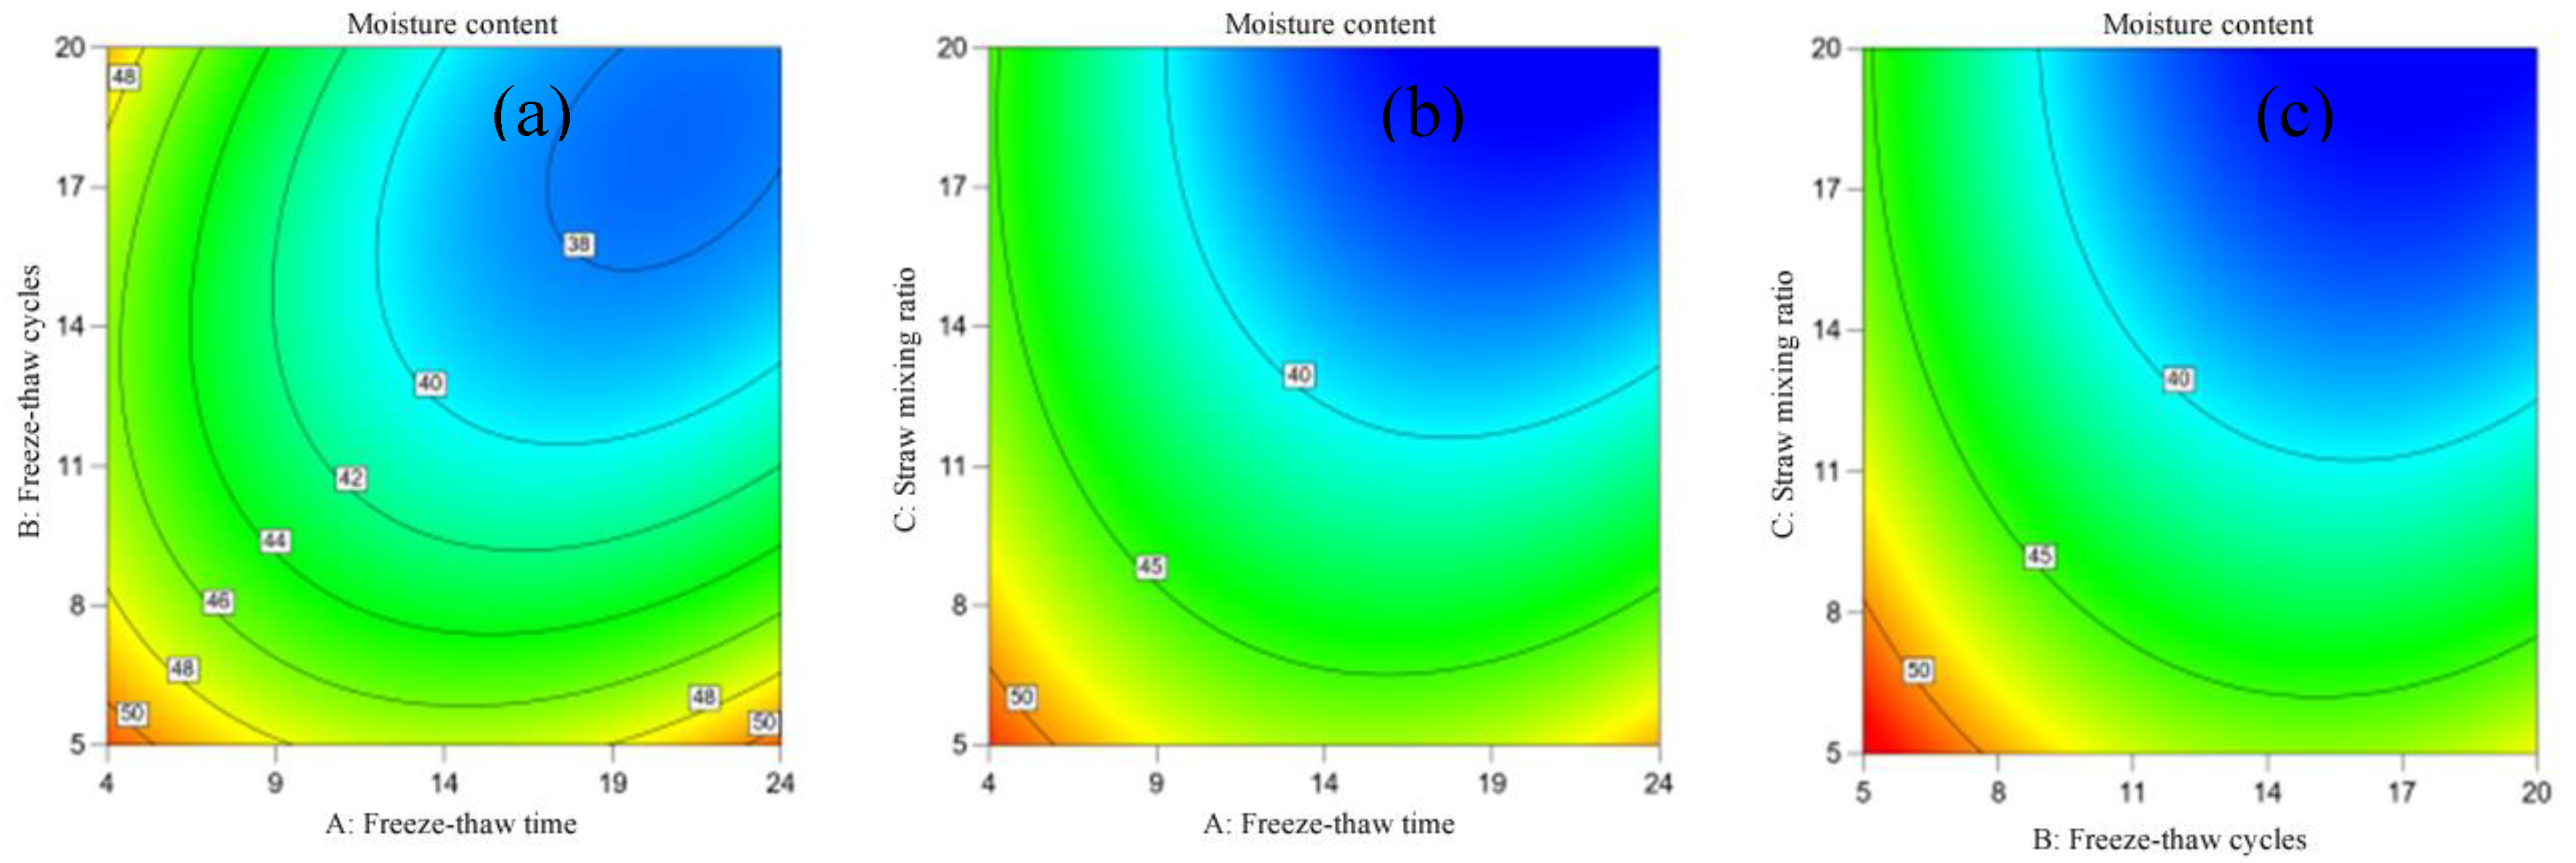
Figure 4.
Effect of freeze-thaw cycle on sludge dewatering performance.
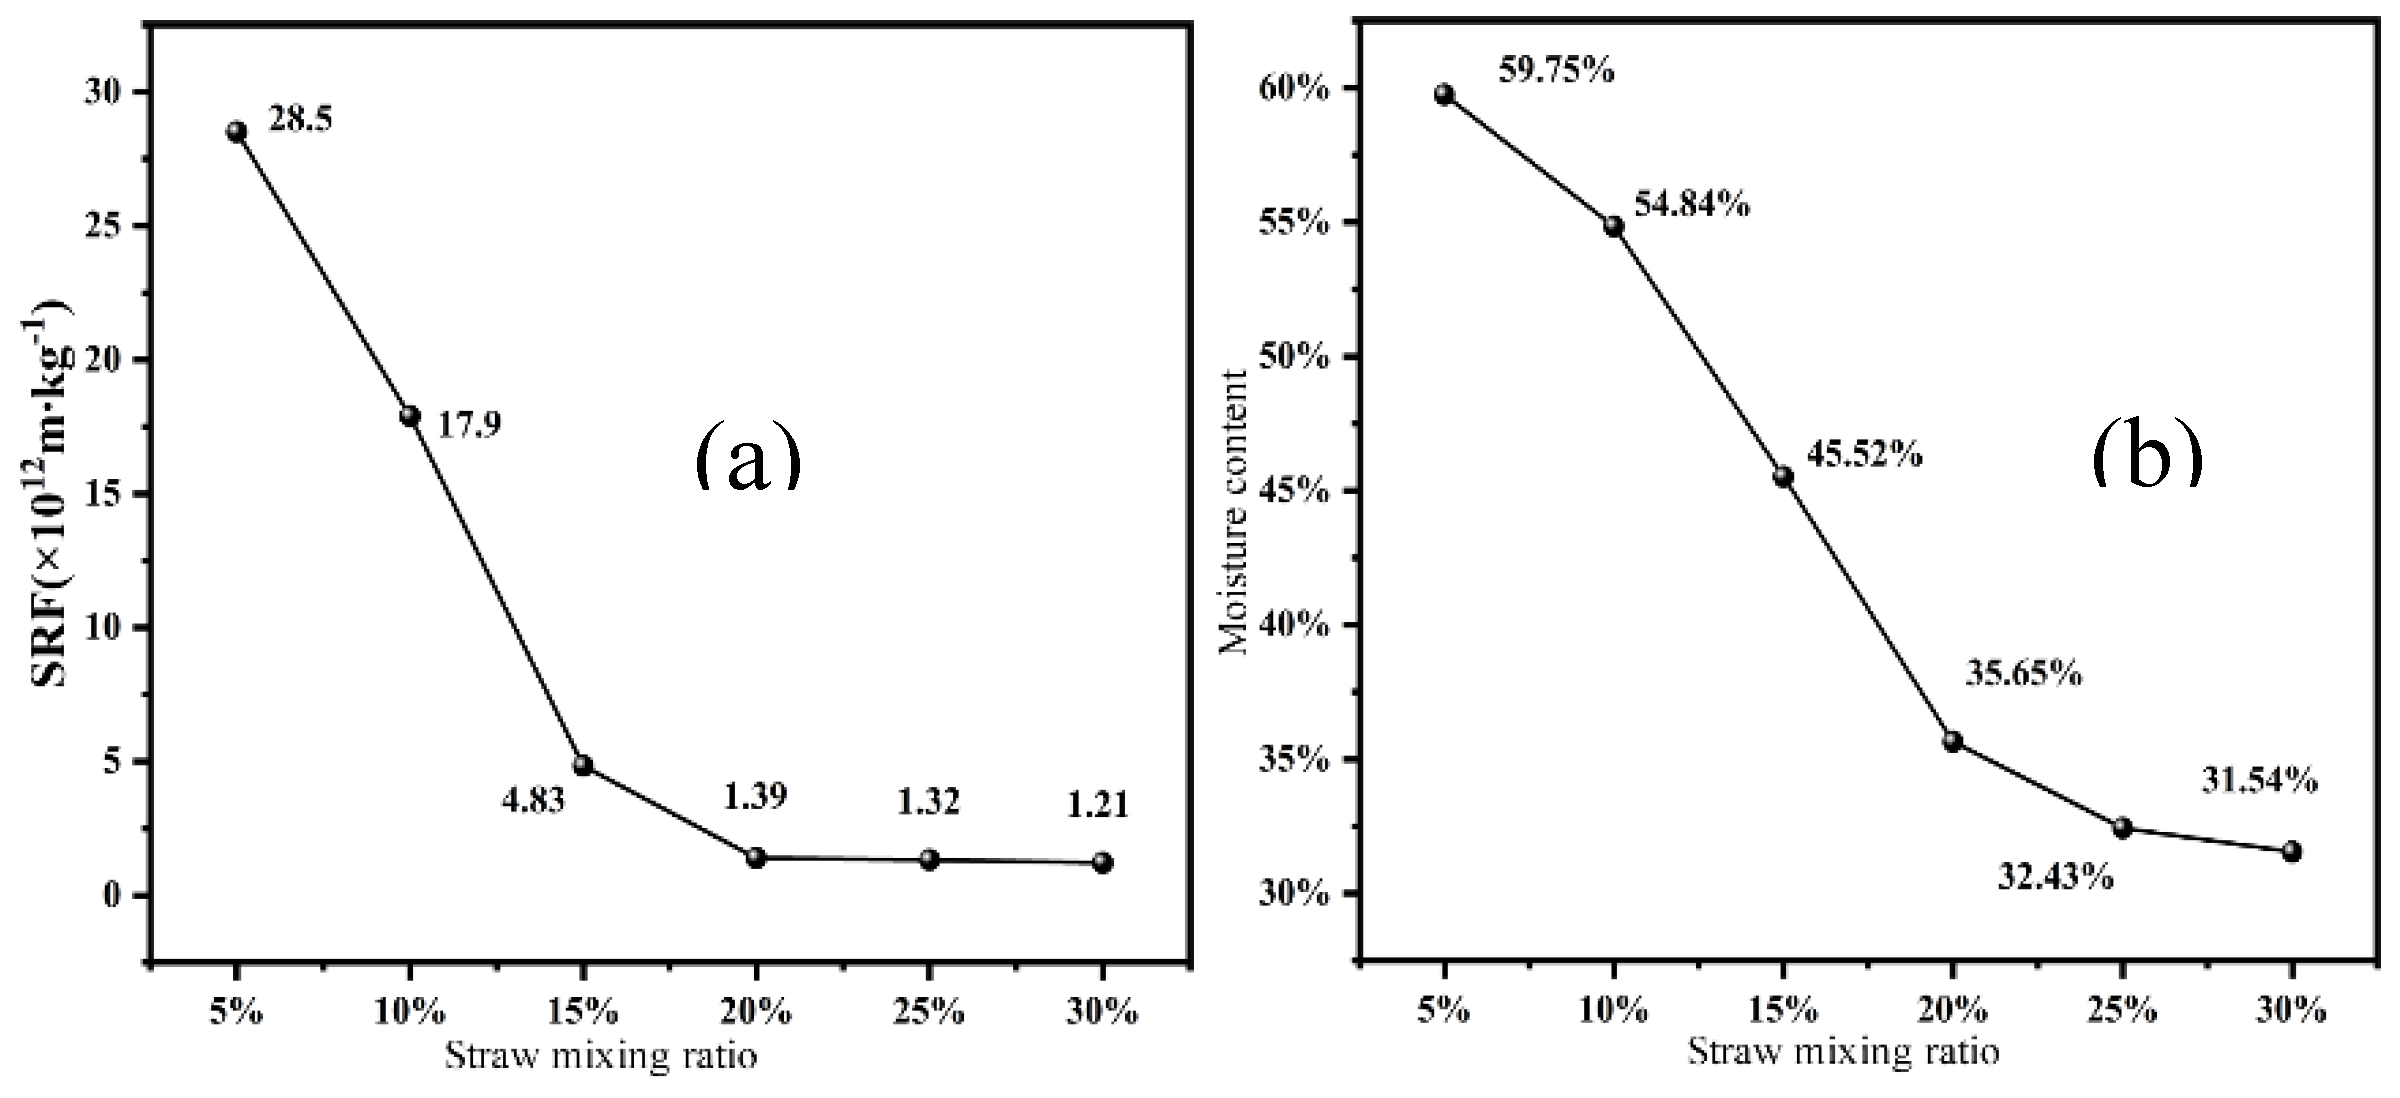
Figure 5.
Normal distribution map of sludge particle size.
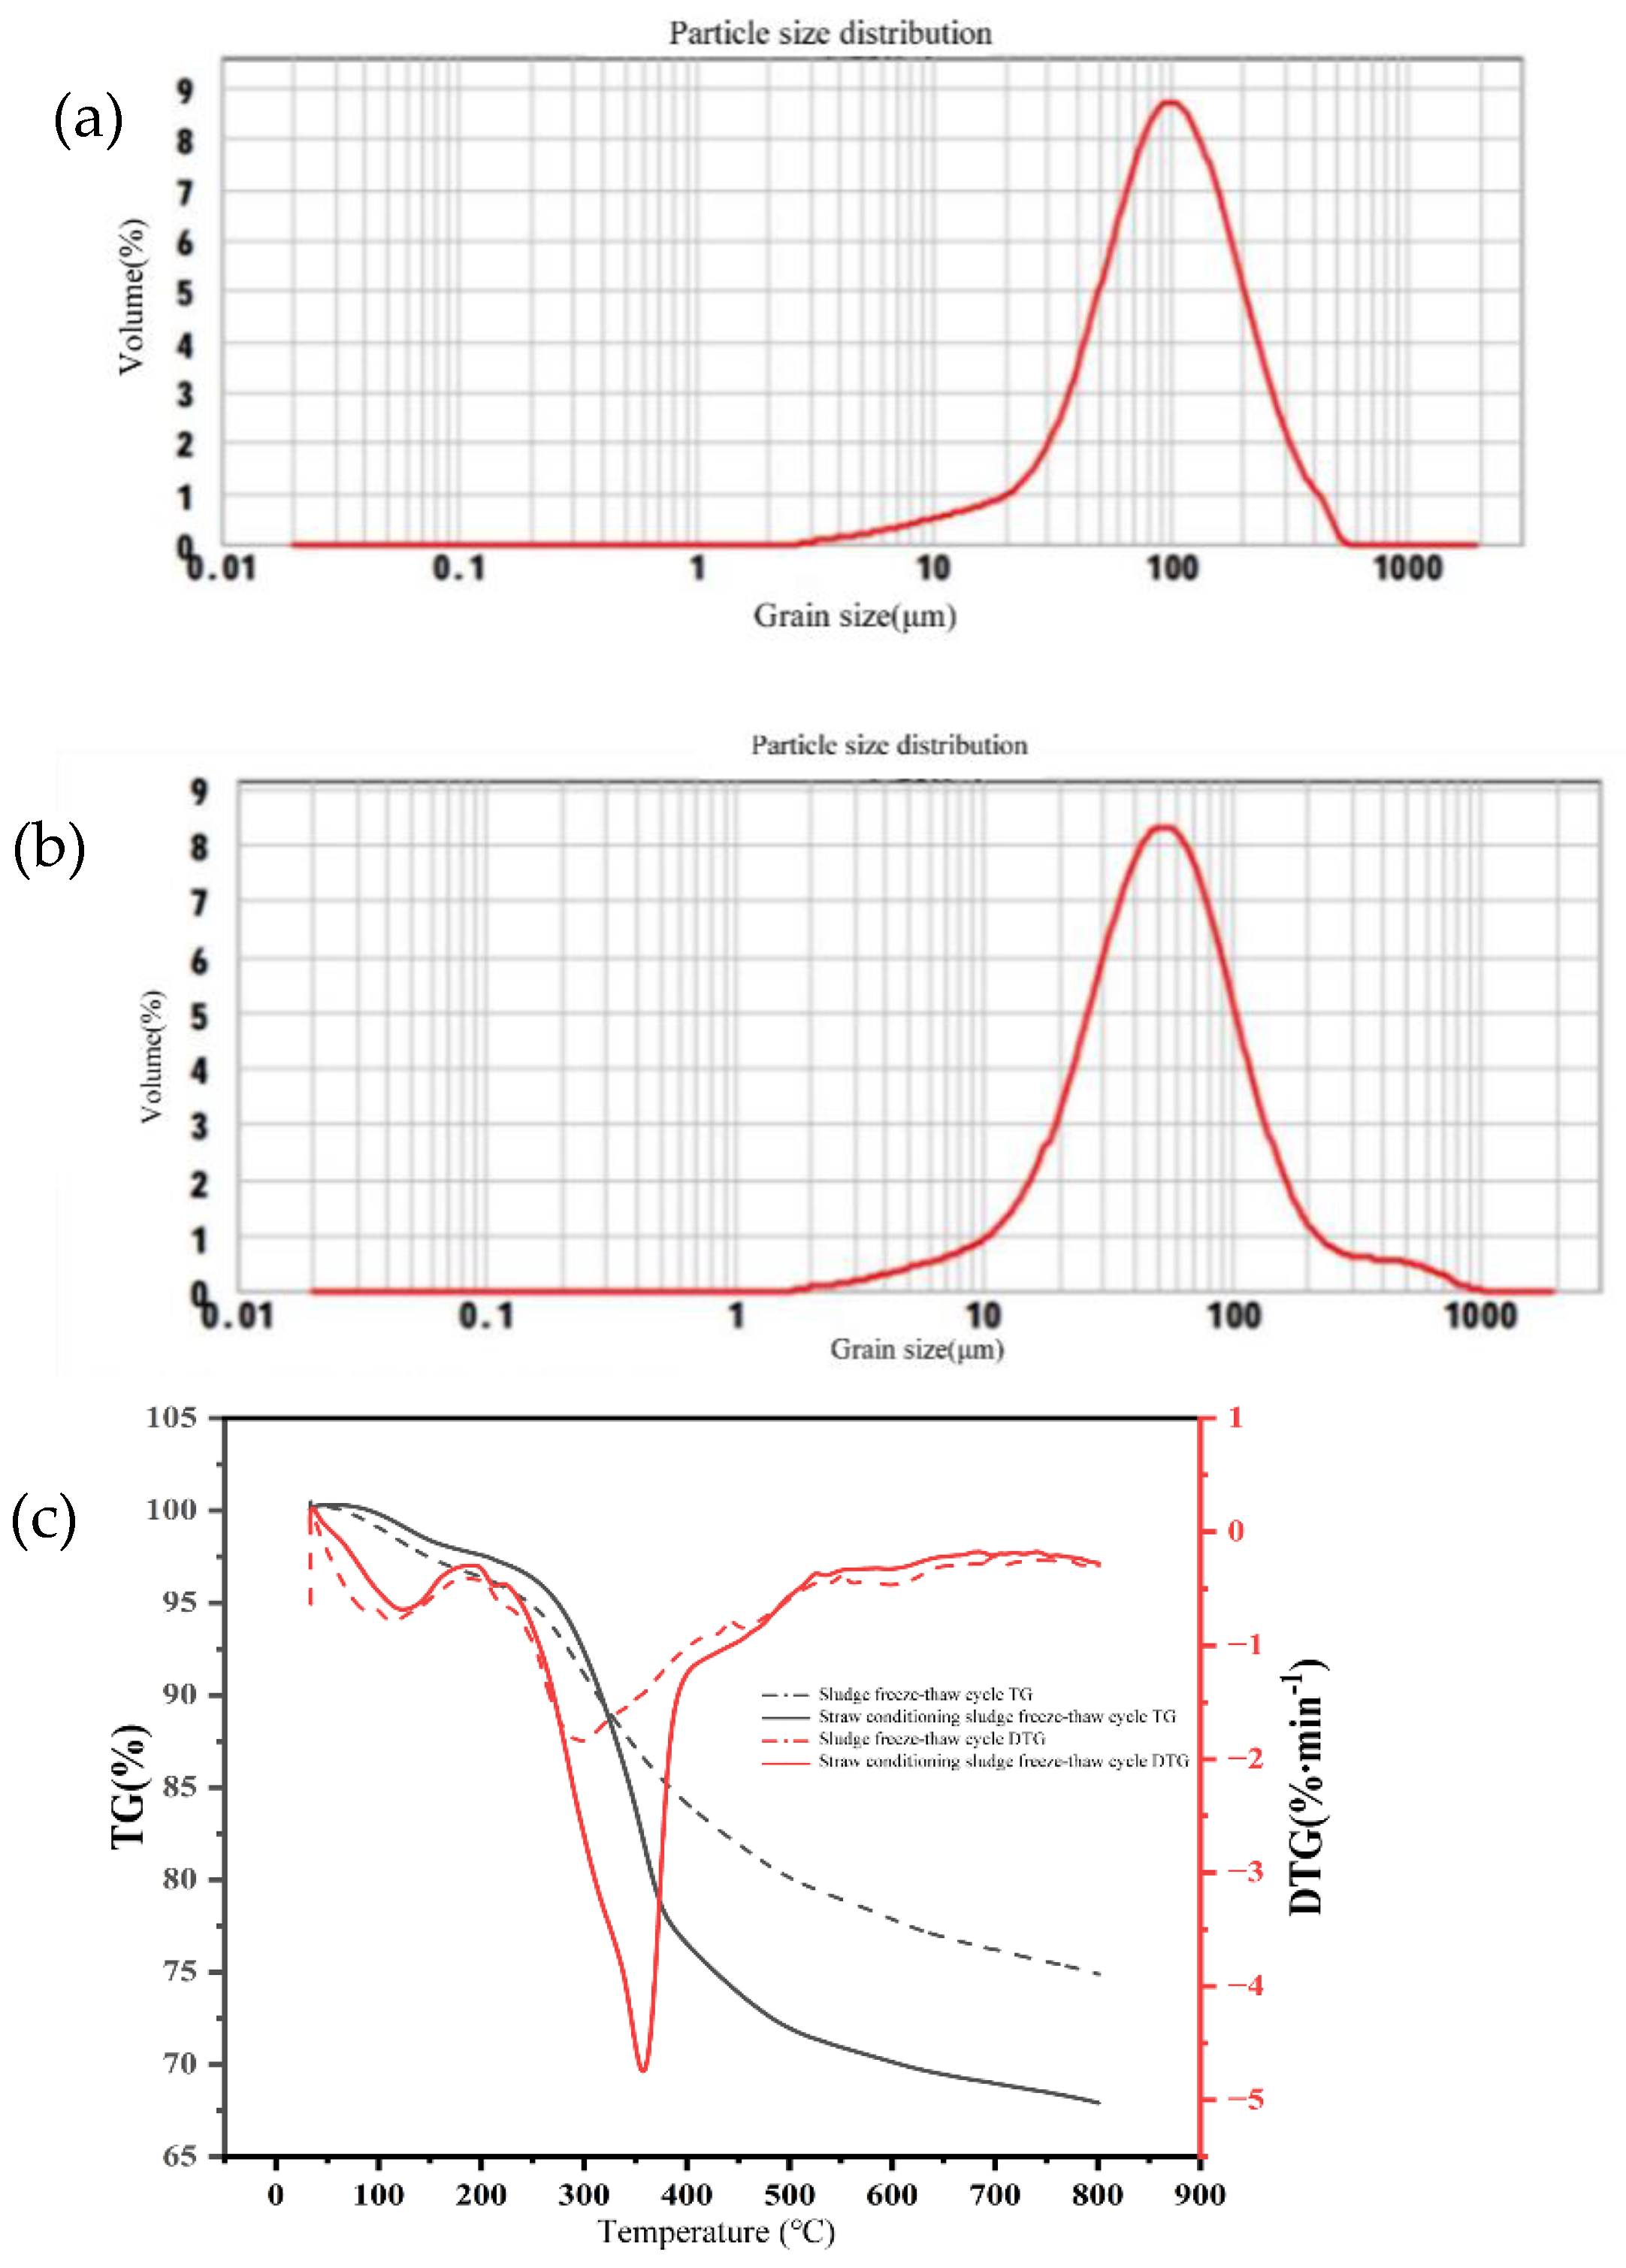
Figure 6.
Sludge Geometric modeling: (a) Sludge geometric modeling; (b) Model grid division; (c) Model temperature boundary; (d) Model of the initial temperature distribution.
Figure 6.
Sludge Geometric modeling: (a) Sludge geometric modeling; (b) Model grid division; (c) Model temperature boundary; (d) Model of the initial temperature distribution.
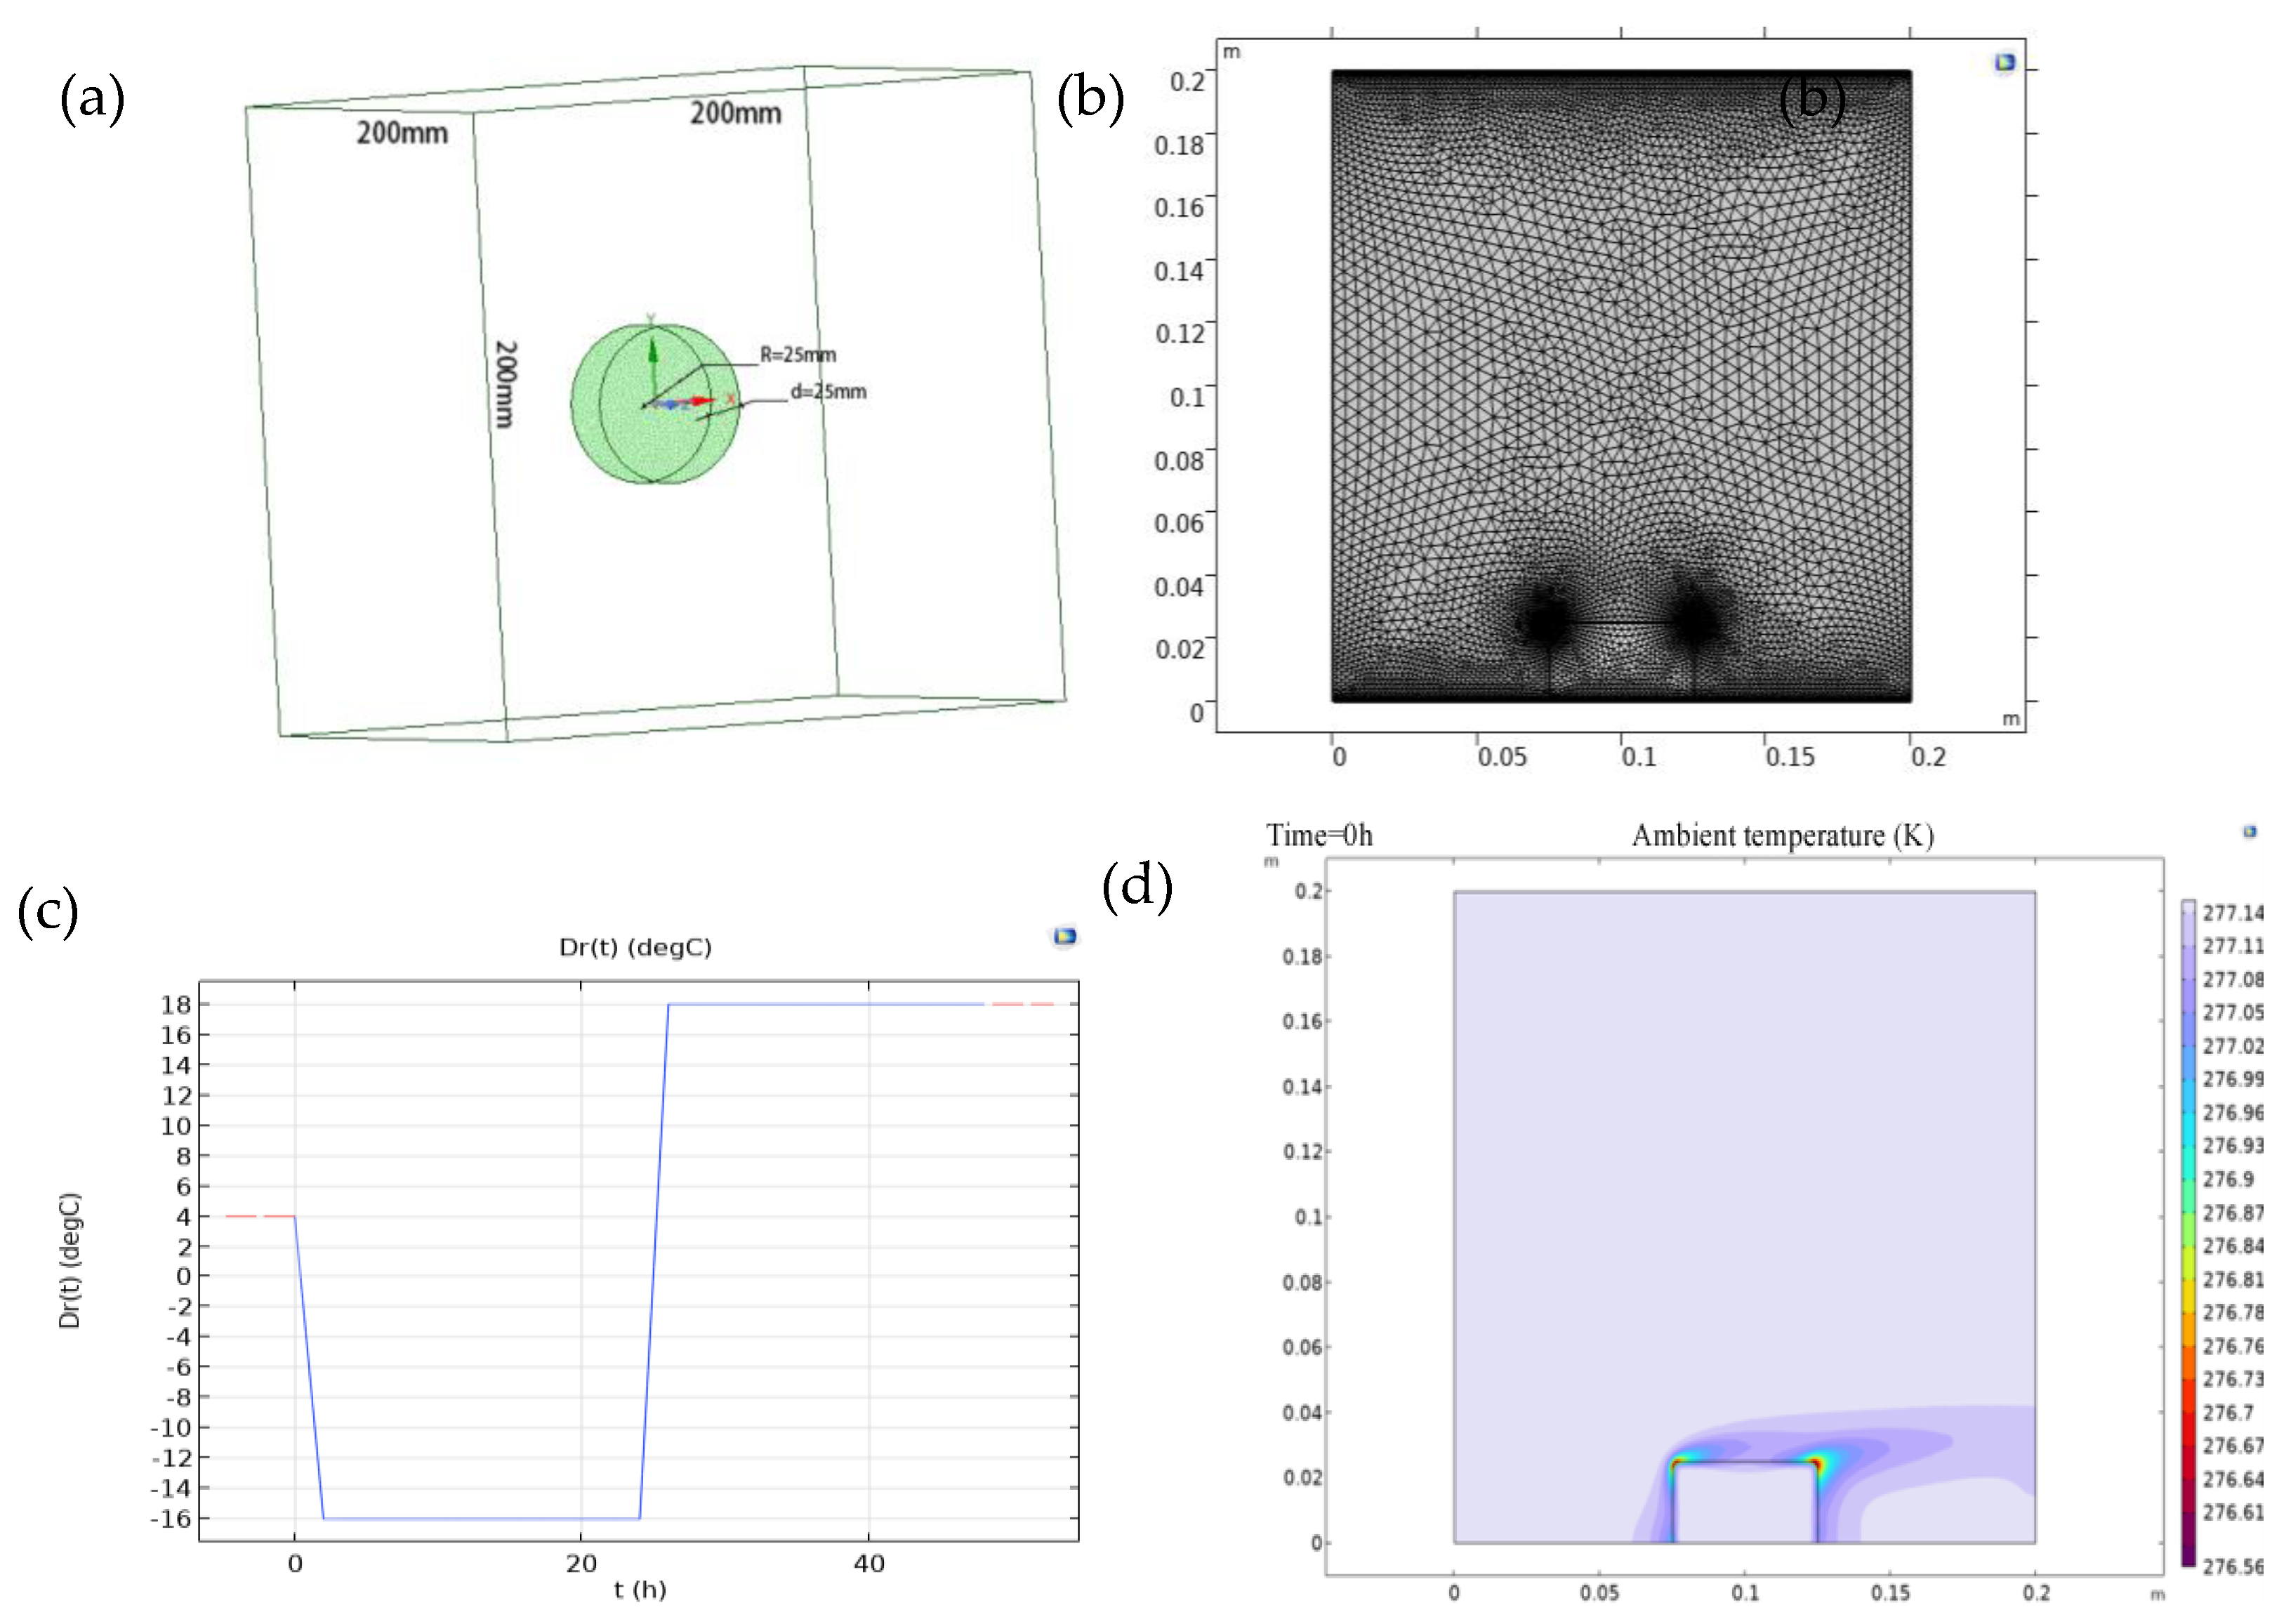
Figure 7.
Relative relationship between the model environment and the local humidity of the sludge: (a) Relative humidity of the model, (b) Model humidity grid quality, (c) Fluid saturation inside the sludge, (d) Simulated values and experimental values of sludge humidity; (e) Cloud map of humidity distribution of sludge cross-section; (f) Cloud plot of the temperature distribution of the model cross-section.
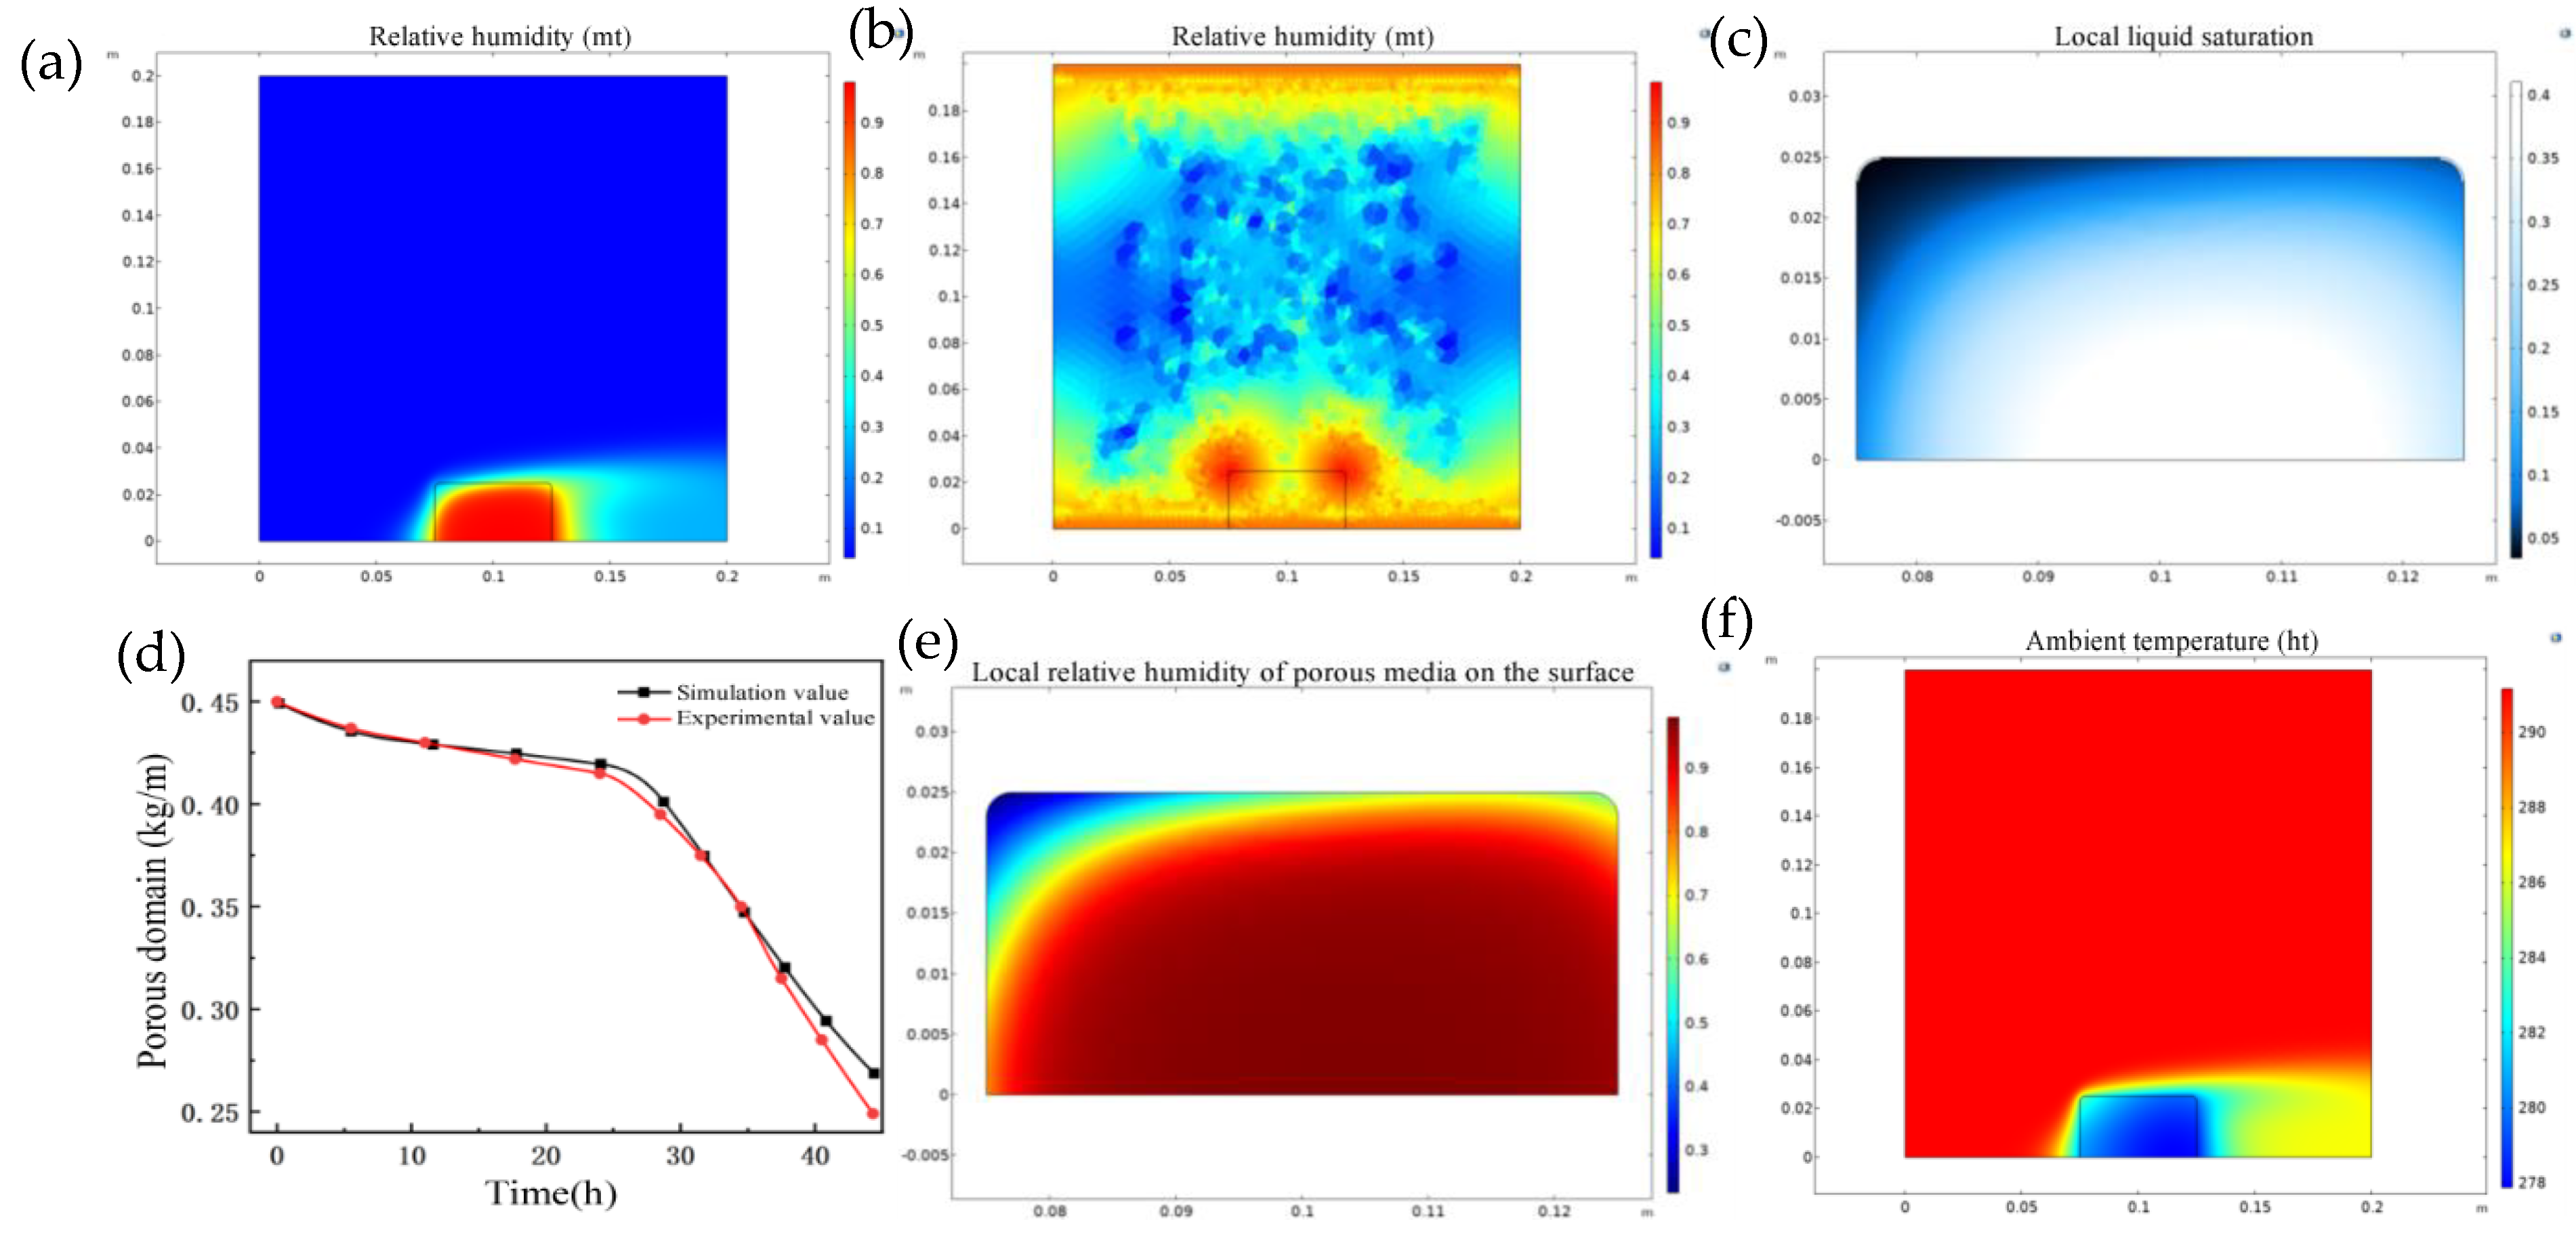
Figure 8.
Cloud map of the center cross-section temperature of the model at different times.
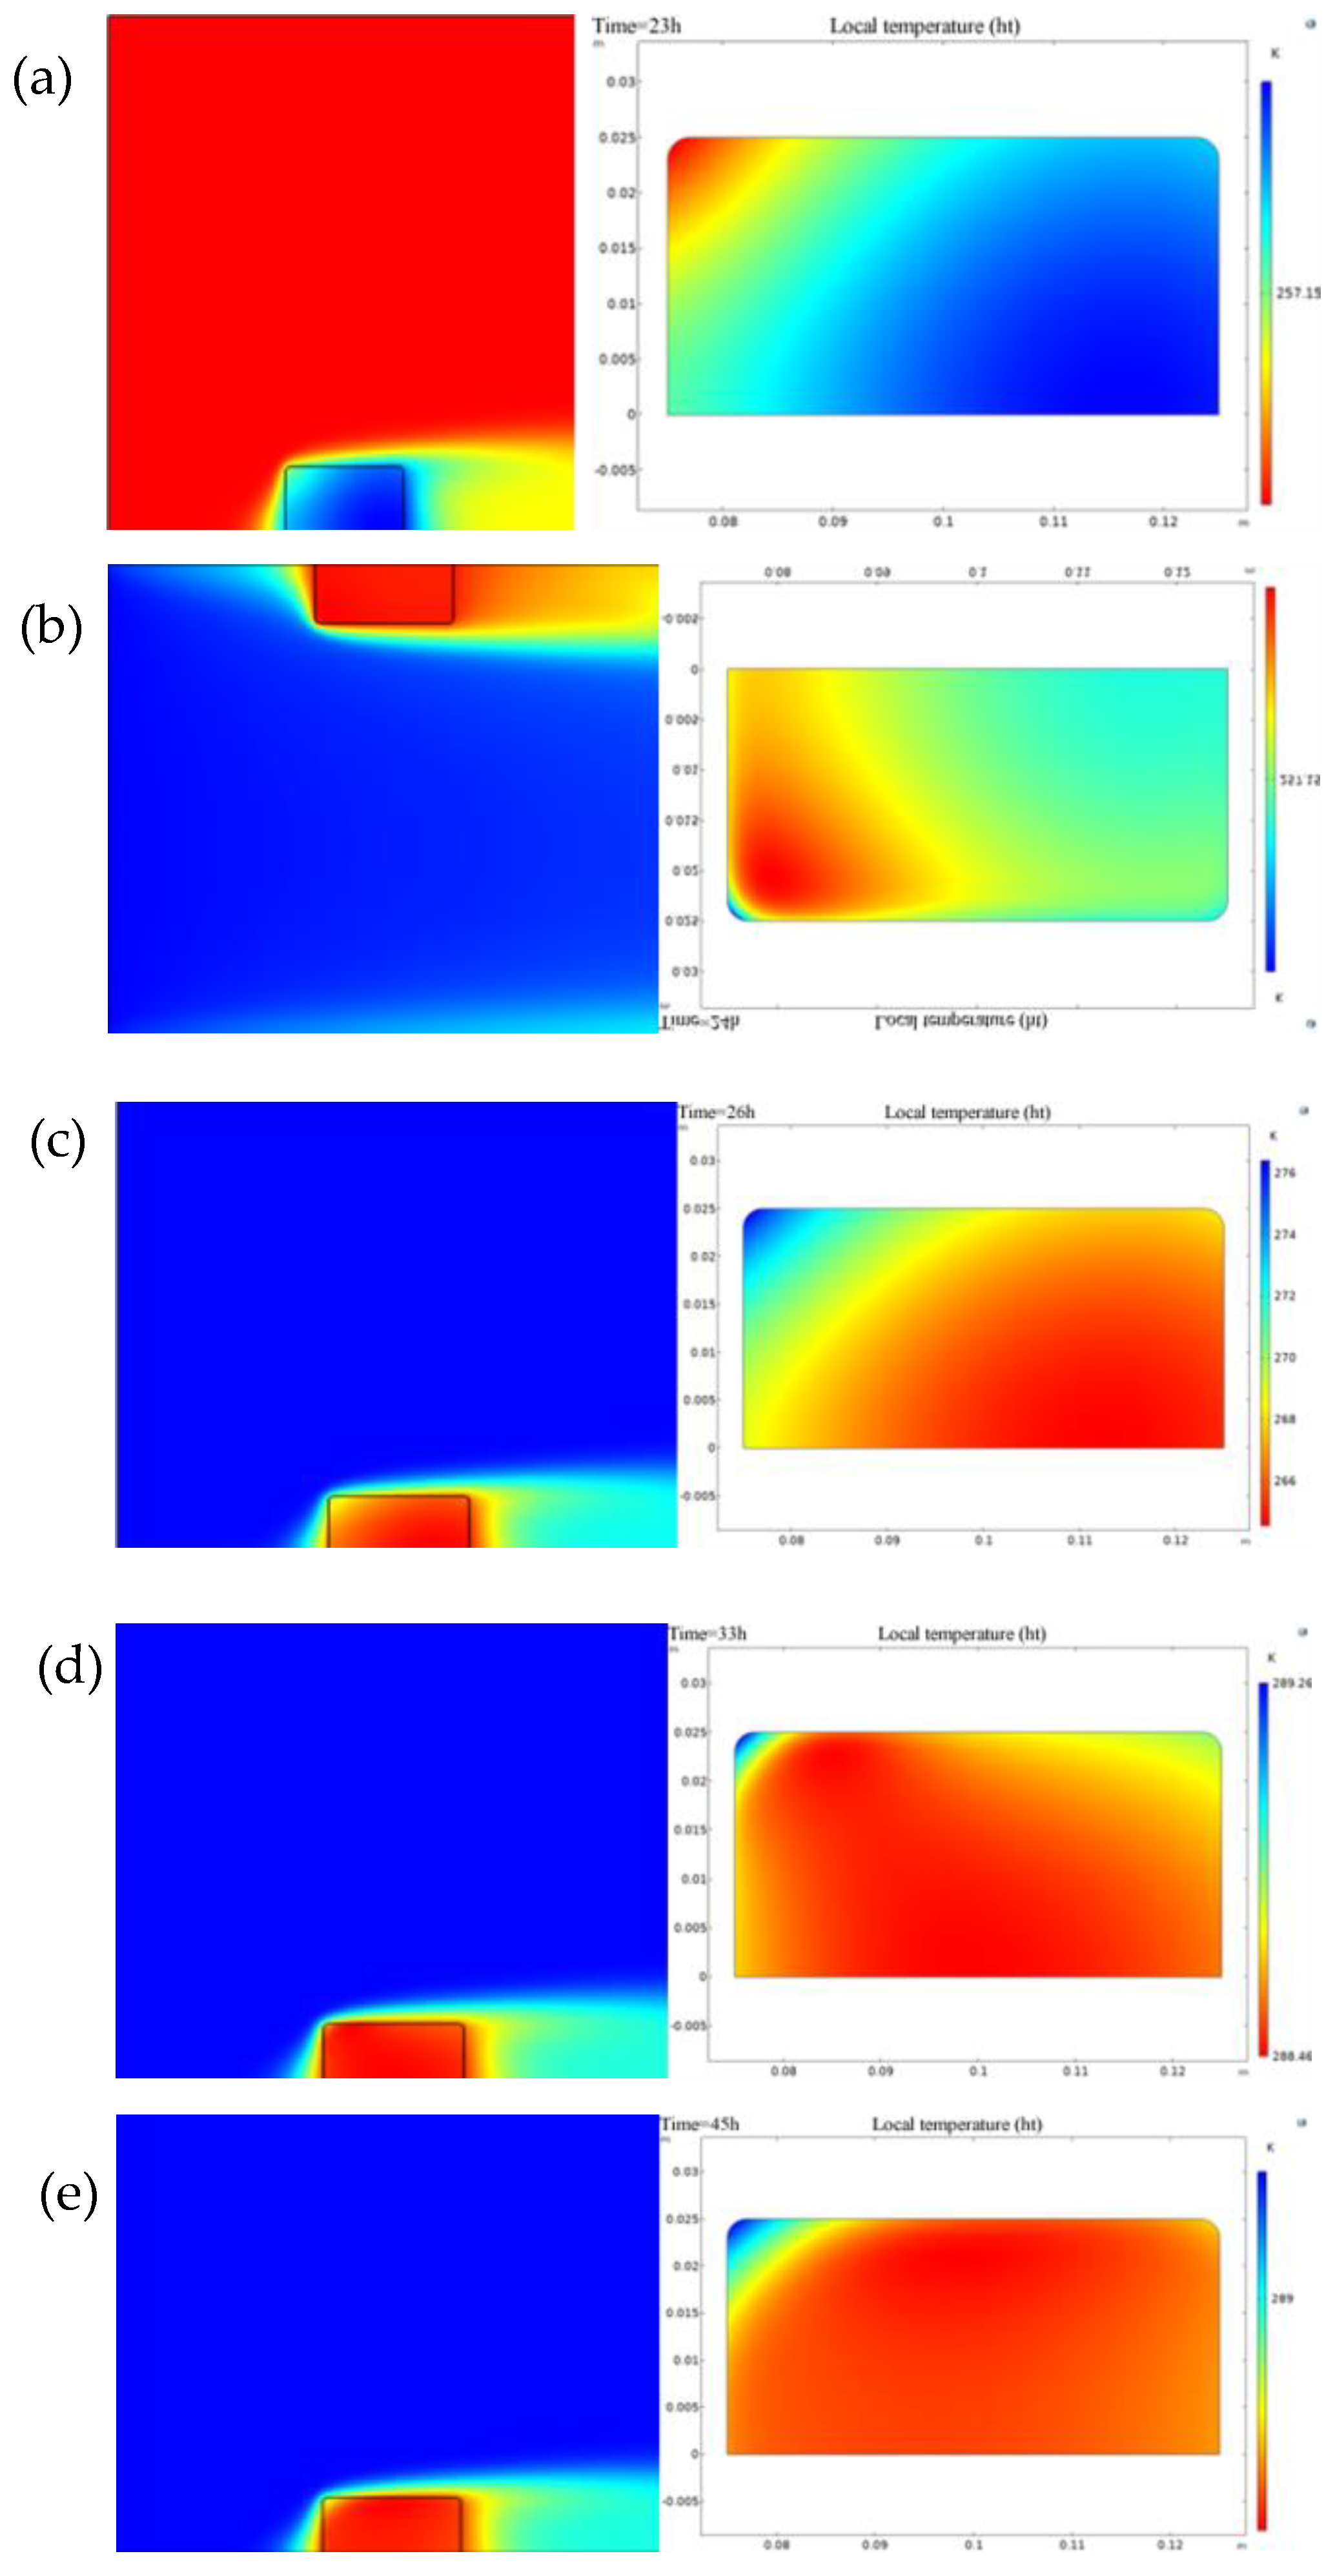
Figure 9.
Cloud map of humidity of model at different times.
Disclaimer/Publisher’s Note: The statements, opinions and data contained in all publications are solely those of the individual author(s) and contributor(s) and not of MDPI and/or the editor(s). MDPI and/or the editor(s) disclaim responsibility for any injury to people or property resulting from any ideas, methods, instructions or products referred to in the content. |
© 2025 by the authors. Licensee MDPI, Basel, Switzerland. This article is an open access article distributed under the terms and conditions of the Creative Commons Attribution (CC BY) license (http://creativecommons.org/licenses/by/4.0/).
Copyright: This open access article is published under a Creative Commons CC BY 4.0 license, which permit the free download, distribution, and reuse, provided that the author and preprint are cited in any reuse.


