Submitted:
11 April 2025
Posted:
15 April 2025
You are already at the latest version
Abstract
Modulating the enzymatic activity of amylase holds significant therapeutic promising in diabetes mellitus, primarily due to its ability to catalyze the hydrolysis of starch into simpler sugars. This study employs computational models utilizing experimental datasets, focusing on designing inhibitors of α-amylase. Despite limited information regarding in silico predictive models’ capability related to α-amylase, we collected various data and applied multiple linear regression-based machine learning technique (MLR-ML) to forecast the inhibitory activity of α-amylase inhibitors as antidiabetic agents. The model was developed using a dataset comprising compounds relevant to α-amylase's preventive action and the model exhibited R2 correlation values of 0.887 and 0.887 for training and prediction sets, respectively. These findings underscore the efficacy of an in silico approach employing machine learning (ML) techniques in identifying potential antidiabetic compounds. Collectively, our study demonstrates that this approach is a viable strategy for regulating postprandial hyperglycemia and mitigating diabetes risk.
Keywords:
α-amylase
; diabetes mellitus
; machine learning
; QSAR
; AI
1. Introduction
Diabetes mellitus (DM) is a collection of metabolic and chronic disorders marked by atypical carbohydrate, protein, lipid, electrolysis metabolism, and blood glucose levels.[1] Elevated glucose levels arise from insulin secretion, activity, or a combination of both factors. Type-1 DM develops when the pancreas fails to secrete insulin, while type-2 DM is initiated by inadequate insulin production.[2] According to the World Health Organization, DM directly led to around 1.5 million deaths in 2012 (Organization W.H., 2014). The International Diabetes Federation reported that the global diabetes prevalence in individuals aged 20-79 was estimated to be 10.5%, encompassing 536.6 million people. This figure is projected to rise to 12.2%, affecting 783.2 million individuals by 2045.[3] This notable increase in diabetes cases is predominantly attributed to type-2 DM, constituting over 90% of these instances. The combined numbers of this disease have advanced into a significant global health concern, characterized by its continual rise and the onset of severe complications.[4,5] The diabetes epidemic is considerably influenced by the aging of the global population, with older adults forming one of the rapidly expanding segments within this demographic.[6] Guaranteeing appropriate glucose-lowering treatments is crucial, particularly among older individuals with diabetes mellitus (DM).[7]
The therapeutic goal to control DM heavily hinges on maintaining the glycemic levels within a regulated range. Accomplishing this goal is critical to lowering the risk of vascular complications and minimizing the incidence of hypoglycemia in DM patients [8] Of the several conventional therapies available, including the use of oral hypoglycemic agents that stimulate endogenous insulin secretion, inhibiting the breakdown of dietary starch by enzymes such as α-amylase and α-glucosidase is also a powerful therapeutic alternative to control type-2 DM. Modern drug discovery research focuses significantly on inhibiting enzymes associated with metabolic disorders, including Type 2 Diabetes (T2D). Since α-amylase is a critical enzyme in insulin regulation, inhibiting their activity becomes a therapeutic target for slowing down glucose absorption and suppressing postprandial hyperglycemia. Therefore, in this report, we focus on in-silico screening of α-amylase inhibitors, which can effectively hinder the digestion of carbohydrates and control the fluctuation of hyperglycemic conditions.[9]
Physiologically, amylase is a digestive enzyme primarily secreted by the pancreas and salivary glands. It is also found in trace amounts in other tissues within the body. The principal function of amylase is to break down the glycosidic bonds present in starch molecules, converting complex carbohydrates into simple sugars. Chemically, natural amylases exist in two forms: endo-amylases and exo-amylases.[10] These enzymes are grouped into three main classes- alpha (α), beta (β), and gamma (g) amylases, based on their catalytic functions and structures, each having specific segments on the carbohydrate molecules during the digestion process. [11,12] An instance of endo-amylases is α-amylase, which operates on the nonreducing end of starch molecules during hydrolysis.[13] This enzyme functions within the interior sections of the amylose or amylopectin polymer of starch. [14] In contrast, exo-amylases encompass both β-amylase and γ-amylase and hydrolyze the non-reducing end of starch molecules by cleaving the -1,4-glycosidic linkage specifically from the outer polysaccharide chains.[15,16]
The key amylase enzyme in humans is α-amylase, this calcium metalloenzyme participates in carbohydrate metabolism and cleaves glucose from the non-reducing end of the polysaccharides via hydrolyzing α-1,4 links.[17] This process converts larger glucose fragments into smaller units, ultimately yielding mono-, di-, and trisaccharides.[18] Therefore, inhibition of α-amylase leads to a reduction in blood glucose levels and aids in mitigating complications linked to hyperglycemia.[19] As such, there has been a persistent focus on developing drugs aimed towards the maintenance of postprandial blood glucose by inhibiting α-amylase. Although this effort is crucial for developing, preventing, and treating diabetes in patients, the design and development of amylase-selective inhibitors are not trivial.[20] [21,22] This is because α-amylase is one of the key enzymes that is required for maintaining glucose homeostasis – a sub-optimal maintenance of which will lead to metabolic and microbiome-associated side effects. Therefore, this work will complement the drug development campaign of designing a potent α-amylase inhibitor by employing in silico techniques such as machine learning (ML)-based Quantitative Structure-Activity Relationship (QSAR) analysis.[23,24,25,26] Building on the application of QSAR modeling of nitroaromatic toxicity prediction by Daghighi et al., (2022), the approach in current work utilizes a ML-QSAR model with a genetic algorithm (GA) for a feature/descriptor selection. This strategy diverges from ensemble learning methods by focusing on a single optimized model. [27,28,29]
In silico modeling expedites the screening of extensive databases of experimental data in a high-throughput manner, streamlining the process of drug discovery and development.[30] QSAR study, extensively utilized in drug discovery enables the prediction and optimization of the biological activity of compounds by identifying optimal binding between an inhibitor and the amylase enzyme. [31,32] The application of QSAR has long been recognized as an effective strategy for structure- and knowledge-based drug design and optimization. Additionally, it has widespread use in characterizing the biophysical properties of diverse chemicals as well as for characterizing the biophysical properties of various chemicals.[33] This technique involves leveraging data analysis methods and statistics to develop models that accurately predict the biological activities or properties of compounds based on their structural characteristics.[34,35] This method relies on establishing empirical relationships between the biological activities (or other properties of interest) of molecules and their computed or experimentally measured structural properties (molecular descriptors). These relationships are typically represented as mathematical transformations of descriptors, aiming to calculate property values for all molecules. [36]
The overarching goal of QSAR modeling is to identify trends in descriptor values that reflect biological activity. This process establishes a quantitative link between chemical structures and specific parameters like biological activity or chemical reactivity, enabling the prediction of biological responses for various chemical structures. This predictive capability is vital in drug discovery and development, where QSAR models assist in screening chemical databases to identify potential drug candidates efficiently.[37] For instance, Dieguez-Santana et al. utilized artificial intelligence techniques to develop QSAR models targeting antidiabetic agents against both α-amylase and α-glucosidase enzymes, resulting in the identification of 30 top-ranked compounds from a vast chemical database.[38] Likewise, Izadpanah et al. focused on a series of 35 α-glucosidase inhibitors, utilizing Genetic Algorithm (GA), multiple linear regression (MLR), and least squares-support vector machine (SVM) methods to construct QSAR models. They identified a single descriptor called DELS, which was highly correlated with inhibitory activity and was chosen to build a simple model. The researchers used molecular docking to study how the inhibitor (ligand) interacts with α-glucosidase in the active regions. This allowed them to identify the optimal binding mode and the area responsible for the enzyme functions.[39] This approach aligns with Duhan et al., who similarly used molecular docking to investigate the production of a novel thiazole-clubbed pyrazole hybrid as an α-amylase inhibitor. Their study revealed binding interactions between the synthesized compounds and the active site of α-amylases, shedding light on the molecular mechanism underlying inhibition. In addition, the study extended beyond molecular docking to include QSAR modeling and employing Monte Carlo optimization methods. Through QSAR analysis, the study identified two compounds, showing more than 85% inhibition of the enzyme at 50µg/mL.[40] Like this study, their approach aimed to identify molecular features related to anti-diabetic activity. Mitra et al. (2022) developed a regression model based on a dataset of 157 α-amylase and α-glucosidase dual inhibitors. Their comprehensive analysis incorporating both 2D-QSAR and 3D-QSAR models revealed that specific chemical properties and structural features are crucial for the increased activity of inhibitors. For example, in 2D-QSAR models, features including lipophilicity, dipole moments, sphericity, hydrogen bond donors in molecules, and certain structural moieties were found to be critical for augmenting the activity of the inhibitors. On the other hand, the 3D-QSAR models can underscore the importance of statistically significant 3D electrostatic, and electrostatic steric fields, which are also required to achieve more potent binding potentials between the inhibitors and targets.[41]
In line with these earlier reports, the techniques applied in current study highlight the importance of 3D descriptors in capturing the relationship between structural features and biological activity. For constructing QSAR models in this research, QSARINS software has been used.[42] The relationship between biological activity and structural properties was determined through the application of the variable selection GA and MLA methods.[43,44] Usually, the GA is an integral part of the analysis, which was utilized to select the optimal number and set of descriptors. The goal is to leverage the power of GA to identify the most critical structural features of the α-amylase molecule that influence its inhibitory potential in the context of anti-diabetic discovery. The use of GA facilitated the identification of descriptors that significantly contributed to the predictive power of MLR equations, enhancing the precision and relevance of the model in the context of the dataset under investigation.[44,45]
2. Materials and Methods
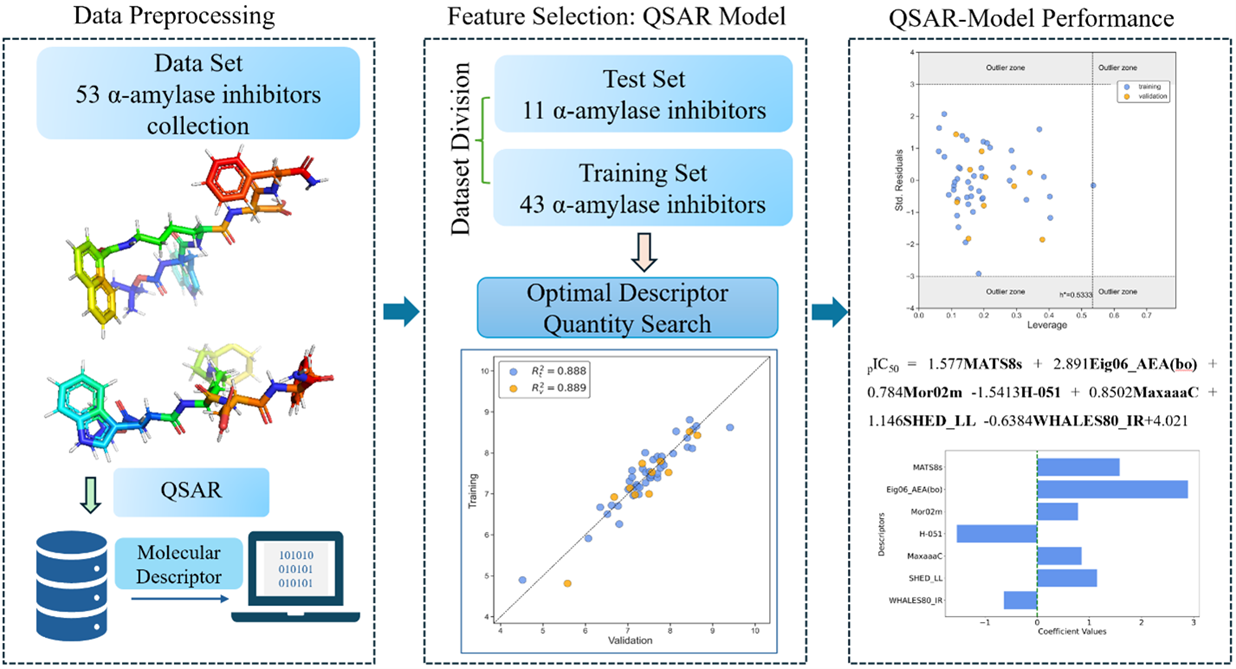
The dataset includes pre-clinical assays of 130 α-amylase enzyme inhibitors sourced from the ChEMBL database and some representative structures are depicted in Figure 1. Initially, we curated the dataset by eliminating duplicates in the dataset ending up with 53 inhibitor compounds. Then these compounds were sorted an ascending order by the target value (pIC50) in the guinea pig pancreas (Cavia porcellus) organism assay and then the data was split taking the fifth case in the series to the test keeping a ratio 4:1 (training: test) which accounts for the 80% and 20%, respectively.[46] Furthermore, we utilized pIC50 as a response variable for our QSAR analysis and model development. The pIC50 values represent the negative logarithm (base 10) of the IC50 values, which is the concentration of a compound required to inhibit a biological target by 50%. In the following step, the Simplified Molecular-Input Line-Entry Systems (SMILES) representations of the 53 inhibitors were converted to 3D chemical structures (Supplementary Information) via Avogadro software.[47] The chemical structures underwent geometric optimization using the Universal Force Field (UFF) in preparation for subsequent molecular descriptor generation and QSAR modeling. All this process and subsequent steps are illustrated in the workflow in Figure 2.
In QSAR analysis, molecular descriptors function as a mathematical representation of the molecular properties of the compound of interest. We computed and generated the molecular descriptors (features) for each of the α-amylase inhibitors using alvaDesc software. It computed over 5,666 descriptors including topological indices, 2D matrix-based descriptors, 2D autocorrelations, and constitutional information, all of which are independent of 2D and 3D data. This encompasses fragment numbers, functional groups, atom-type-E-state indices, and ETA indices.[48] In our study those descriptors exhibiting high correlations, single variables, and non-informative information were removed based on the constant value, near constant, and pair correlation criteria (R>0.95). Following the application of initial filter criteria, a total of 1603 descriptors of various types were kept and used in the feature selection process for QSAR model development. Each of these descriptors serves as a unique molecular graph invariant, detailing specific properties, and contributes to the overall chemical diversity essential for understanding and predicting the behavior of the, as elucidated by the QSAR model represented in the form of Eq. 1. [48]. Furthermore, the multilinear regression approaches employed in investigations with QSARINS yield to mathematical models that establish a linear relationship between the response variable (Yi) and molecular descriptors (Xij) [49].
Internal validation of a QSAR models was conducted within the training set, and several parameters were used for the internal validation including: R2cv (Q2Loo), RMSEcv, MAEcv, PRESScv, CCCcv, Q2LMO, and the determination coefficient for Y-scrambling, R2Yscr.[49,50] While internal validation asses a model's performance on the training set, determining its ability to predict the behavior of novel molecules requires external validation. The performance of each model was evaluated using RMSE and R2 (Eqs 2 and 3). The RMSE is defined as , , a are actual values, predicted values, and the size of the dataset. The R2 (Eq. 3) defines , , and that represents the proportionality of the variance variable which is explained by the MLR model. This comprehensive validation process ensures the reliability and predictive capability of the QSAR models developed in the study. [51]
Besides, leveraging QSARINS software for model development aligns seamlessly with our core focus of the construction and validation of robust QSAR models.[40] In utilized approach for variable selection a split dataset approach was applied, with 80% of the molecules[43] selected for training set and the remaining 20% (11) for the test set. For each model, the GA module of QSARINS determined the optimal number and combination of molecular descriptors, utilizing Q2LOO (equations 4) as the fitness function.
In the GA-based variable selection process, we chose 3000 generations with a mutation rate of 45 and utilized a population size of 500, to select the top-performing models. To prevent over-fitting and enhance model interpretability, the iterative search was constrained to a single model to confirm the predictions were not a result of chance correlation. Additionally, the statistical quality of the constructed single model was evaluated and a model capable of making accurate predictions was selected. The validation of QSAR models is a crucial step to ensure their consistency and robustness. This process involves thorough checks of statistical data quality and model applicability, relying on various validation metrics.[52] The key techniques for validating QSAR models encompass cross/internal validation, external validation, and Y-scrambling or data randomization. To ensure model robustness, a Y-scrambling test was employed to assess the robustness of a QSAR model (Eq. 5). The procedure involves randomizing the biological activity data (the dependent variable, often represented as "Y" in QSAR modeling) while keeping the molecular descriptors (independent variables) unchanged. This is done to investigate whether the obtained QSAR model is based on genuine relationships between molecular descriptors and biological activity or if it is the result of chance correlations.
Afterward, the applicability domain was verified using William's plot. This plot helped define areas where the model could be practically utilized with increased confidence in the predictions obtained. The applicability domain was established within a squared area, with a standard deviation cutoff value (σ = +-3), indicating the range for accepting predictions. For more detailed insights into the symbols and equations used to calculate these parameters, additional details are provided in the Supplementary Material. This comprehensive validation procedure ensures the credibility and practical application of the QSAR models established in the study. Last, to evaluate the predictability and applicability of the developed models, a squared correlation coefficient was computed, allowing the identification of the best descriptors within the models.[53] External validation parameters play a crucial role in determining the reliability and robustness of a QSAR model for predictions on novel compounds. A QSAR model with strong external prediction ability and statistical robustness should meet predefined threshold values for these parameters (Table 1) [54].
3. Results
In this study, the task was to identify novel α-amylase inhibitors with potential antidiabetic activity by applying ML-QSAR techniques. In the developed model the GA was employed to select the optimal number of descriptors from a dataset containing 1603 descriptors. The utilization of GA algorithms facilitated the identification of descriptors that significantly contributed to the predictive power of subsequent models, thereby enhancing the precision and relevance of the ML-QSAR model. The regression model, developed using a dataset comprising 43 compounds relevant to α-amylase target, demonstrated promising predictive performance, with a R2train = 0.888 and R2test = 0.889 for the training and test set, respectively. As seen from Eq. 6, seven descriptors were used to build the QSAR-MLR model as some of the parameters are shown below the equation confirming its reliability and adequate performance (Table 1).
pIC50 = 1.577MATS8s + 2.891Eig06_AEA(bo) + 0.784Mor02m -1.5413H-051 +0.8502MaxaaaC + 1.146SHED_LL -0.6384WHALES80_IR+4.021
N = 43; R²train = 0.888; s =0.298; F= 38.524; Q2Loo = 0.834; R²test= 0.889
These results indicated that approximately 88.8 % and 88.9% of the variance in the biological activity of the inhibitors could be explained by the predictor variables included in the model for the training and prediction sets, as can be observed in Figure 3.
In a second step, we verified the applicability domain using William's plot approach, focusing on leverage versus standardized residual as depicted in Figure 4. This analysis was crucial in ensuring the reliability of our model, as it allowed us to identify areas where the model could be confidently achieved. By defining a squared area established using a standard deviation cutoff value (x = 3), we established within which predictions could be accepted. Any data points falling outside this range risked inaccurate predictions, potentially indicating structural significance in the model.
All the data points were within the three standardized residues (±3 σ). Furthermore, we assessed the HAT index to determine the critical value of leverage (h*), which played a key role in identifying the structural significance of the model. The proposed models also included seven variables using Eq. 6, providing additional insights into the mechanism. As depicted in the Williams plots outlined in Figure 4, it is evident that only one compound exhibits values of h higher than h*. One compound, ChEMBL64605, leverage value comparable with the critical value (h* = 0.533). This suggests that it has a significant influence on the model. The high leverage indicates that ChEMBL64605 possesses substructural features distinct from the other compounds in the training set. As shown in the graph, the QSAR model maintains reliable predictions for compounds like those in the datasets.
To validate the proposed models, we conducted a two-step validation process. Initially, internal validation employing leave-one-out cross-validation (LOO-CV) was performed to assess model robustness. Following this, internal validation was conducted to estimate predictive power. This evaluation included the calculation of several coefficients such as root mean square error, RMSE, and coefficient of determination R² (as indicated in Eq. 3) and as a measure of goodness of fit for each model. In the LOO-CV validation method, each molecule is iteratively excluded from the training set, and the model is applied to the remaining data to predict the response for the excluded molecule. This process is repeated for each molecule in the training set. Finally, the mean Q2 value is calculated as an estimate of the model's predictive ability to prevent overfitting. The cross-validated coefficient Q2LOO corresponds to Eq. 4. Furthermore, to ensure the robustness of the ML-QSAR model a y-scrambling test was employed, Eq.5. This applied technique is randomizing the biological activity data while keeping the overall order of compounds and molecular descriptors unchanged, aiming to discern whether the obtained QSAR model was based on genuine relationships or chance correlations between descriptors and biological activity (Figure 5).
In Table 2 are listed the molecular descriptors included in the model with some description. Besides, in Figure 6 the coefficient for the descriptors in the QSAR-MLR are represented graphically and as can be seen Eig06_AEA(bo) emerged as the most significant descriptor with positive impact toward the activity. This descriptor is mainly related to edge adjacency indices. The most significant descriptor with positive coefficient found in Eq. 6 was MATS8s, which is Moran autocorrelation of lag 8 weighted by I-state, which characterizes 2D autocorrelations.
Next, the third highest correlation molecular descriptor was SHED_LL, a pharmacophore descriptor, that infers lipophilic-lipophilic interaction that can play a great role in its pharmacologic activity. Mor02m, 3D-Morse descriptors were found with a very low value of 0.784 indicating, offering structural insights. MaxaaaC, with the fourth highest coefficient value, is an atom-type E-state indices descriptor having the fourth highest correlation value and is expected to contribute significantly to biological activity. Interestingly, H-051, an atom-centered fragment was shown to be negatively correlated, implying lower values compounds having greater α-amylase inhibition activity. The last descriptor with the lowest correlation value was WHALES80_IR, which can encapsulate molecular shape and partial charges simultaneously.
4. Discussion
In summary, this study underscores the potential of utilizing ML-based QSAR methods to identify promising α-amylase inhibitors with antidiabetic activity. Through accurate descriptor selection via genetic algorithms, the QSAR model was optimized, enhancing the predictive power of it. The developed MLR-QSAR model yielded high predictions for both training and prediction sets. Rigorous validation, including internal and external validation and Y-scrambling tests, affirmed the reliability and applicability of our QSAR model. Overall, the best performance was achieved in R2 of 0.888 and 0.889 for the training and prediction sets. The statistical details of the developed ML-QSAR model are presented in Eq. 6. A brief explanation of the seven descriptors is outlined in Table 2 and the coefficient values are in Figure 4. The first descriptor having the highest coefficient value in the equation is Eig06_AEA(bo) linked to the augmented edge adjacency matrix and integrating bond order information. Higher values on the descriptor indicate greater electron delocalization and molecular rigidity, which may enhance enzyme binding interactions..[55] Next, the MATS8s Is a Moran’s Autocorrelation (MATS) descriptor that measures how similar properties are at a given topological distance (lag) within a molecule with in our case with lag = 8 and this mean that considers atoms that are 8 bonds apart, providing insight into long-range electronic and structural effects. The weighting scheme is the I-State (Intrinsic State) that represents atomic contributions based on electronegativity, hybridization, and valence. In this case higher MATS8s values indicate optimized electron distribution across the molecule, enhancing interactions with the enzyme's active site.[56] Mor02m is a 3D-MoRSE Descriptors: This descriptor is derived from electron diffraction theory, and they encode spatial arrangements of atoms and their influence on molecular properties. The signal value 02 corresponds to specific interatomic distances that significantly impact molecular structure and function. The weighting scheme is the Atomic Mass which means that the heavier atoms influence molecular stability and binding strength. In the case of this molecular descriptor higher value means that the compounds have heavier atoms in specific positions have a positive impact in the hydrophobic interactions, which are critical in enzyme inhibition.[57]
MaxaaaC, an atom-type E-state indices descriptor as described previously. SHED_LL, a lipophilic-lipophilic pharmacophore descriptor, bridges chemical features with ligand binding activity, as noted by Ginex et al.[57] WHALES' Isolation-Remoteness ratio (IR) at the 80th percentile captures molecular shape and partial charges simultaneously, as elucidated by Grisoni et al.[58] Lastly, H-051 descriptor represents an atom-centered fragment providing valuable data on molecular connectivity, reactivity, and functional groups, including hydrogen atoms attached to α-carbons bearing amino groups (NH2), carboxyl groups (COOH), and R-groups.[59,60] Among the descriptors utilized in this study, Eig06_AEA(bo), MATS8s, SHED_LL, Maxaaac, and Mor20m demonstrated strong correlation values, contributing significantly to the predictive power of the model in identifying α-amylase inhibitors with antidiabetic activity. These descriptors, particularly Eig06_AEA(bo) and MATS8s played pivotal roles in elucidating molecular connectivity, reactivity, and lipophilic-lipophilic interactions essential for drug discovery. On the other hand, WHALES' Isolation-Remoteness ratio (IR) at the 80th percentile and H-051, while exhibiting lower correlation values, provided valuable insights into molecular shape, partial charges, and functional group characteristics. Despite their lower correlation coefficients, these descriptors added complementary information, enhancing our understanding of the molecular features associated with inhibition of α-amylase. Additionally, the collective contributions of these descriptors underscore the importance of the QSAR model in accelerating the discovery of novel antidiabetic agents. The current study not only highlights the importance of descriptors with strong correlations but also emphasizes the value of exploring descriptors with lower correlation values to gain comprehensive insights into molecular mechanisms relevant to drug development for combating diabetes.
5. Conclusions
In conclusion, the study employs cheminformatics ML-QSAR approach utilizing experimental datasets, focusing on analyzing the structure-activity relationship of the inhibitors of α-amylase. The best ML-QSAR model was developed predicting α-amylase inhibitors’ activity, as antidiabetic agents. Through data collection, data curation steps and meticulous descriptor selection using genetic algorithms and subsequent optimization of the ML-QSAR model, this study was able to identify special physico-chemical properties and structural fragments responsible for α-amylase inhibitors’ activity. The mechanistic explanation of the descriptors selected in the best ML-QSAR model is discussed and analyzed, to provide a deeper understanding of their significance. Among these descriptors, Eig06_AEA(bo) stood out with the highest contributing coefficient value, proving its relevance in describing the desired biological property of α-amylase inhibitors. Furthermore, descriptors like MATS8s, Mor02m, MaxaaaC, SHED_LL, H-051, and WHALES' Isolation-Remoteness ratio contributed valuable insights into molecular structures and properties essential for the activity.
The model's robustness was affirmed through rigorous validation steps, including internal and external validation along with y-scrambling tests. Overall, the ML-QSAR model demonstrated high predictive accuracy, as evidenced by R-squared values of 0.888 and 0.889 for the training and prediction sets, respectively. These findings not only validate the reliability and applicability of the developed model but also offer valuable insights into future drug development efforts aimed at combating diabetes disease. Moreover, the developed model showcases the potential of applied computational and cheminformatics methods in accelerating drug discovery processes through finding the right structural fragments responsible for the activity.
Supplementary Materials
The following supporting information can be downloaded at the website of this paper posted on Preprints.org.
Author Contributions
Conceptualization, G.C. and B.R.; methodology M.Z and G.C.; software, G.C.; validation, M.Z., and G.C; formal analysis, G.C and M.Z.; investigation, M.Z.; resources, B.R.; data curation, G.C.; writing—original draft preparation, M.Z and G.C.; writing—review and editing, M.Z., G.C. and B.R.; visualization, M.Z. and G.C.; supervision B.R.; project administration, B.R.; funding acquisition, B.R. All authors have read and agreed to the published version of the manuscript.
Funding
This research was supported in part by the NSF MRI award OAC-2019077.
Institutional Review Board Statement
Not applicable.
Data Availability Statement
The authors declare that the data supporting the findings of this study are available within the paper. Should any raw data files be needed in another format they are available from the corresponding author upon reasonable request.
Acknowledgments
Authors thank the Biomedical Engineering (BME) program (College of Engineering, NDSU) for the financial support of the M.Z. in the form of the graduate research assistantship. The authors also thank Prof. Paola Gramatica for generously providing a free license for the QSARINS software. Supercomputing support (Thunder Prime) from the CCAST HPC System at NDSU is acknowledged.
Conflicts of Interest
The authors declare no conflicts of interest.
References
- American Diabetes Association. Classification and Diagnosis of Diabetes: Standards of Medical Care in Diabetes—2021. Diabetes Care 2021, 44, S15–S33. [Google Scholar] [CrossRef]
- Galicia-Garcia, U.; Benito-Vicente, A.; Jebari, S.; Larrea-Sebal, A.; Siddiqi, H.; Uribe, K.B.; Ostolaza, H.; Martín, C. Pathophysiology of Type 2 Diabetes Mellitus. Int. J. Mol. Sci. 2020, 21, 6275. [Google Scholar] [CrossRef] [PubMed]
- Sun, H.; Saeedi, P.; Karuranga, S.; Pinkepank, M.; Ogurtsova, K.; Duncan, B.B.; Stein, C.; Basit, A.; Chan, J.C.; Mbanya, J.C.; et al. IDF Diabetes Atlas: Global, regional and country-level diabetes prevalence estimates for 2021 and projections for 2045. Diabetes Res. Clin. Pract. 2022, 183, 109119. [Google Scholar] [CrossRef] [PubMed]
- Ruan, C.-T.; Lam, S.-H.; Lee, S.-S.; Su, M.-J. Hypoglycemic action of borapetoside A from the plant Tinospora crispa in mice. Phytomedicine 2013, 20, 667–675. [Google Scholar] [CrossRef]
- Khan, M.A.B.; Hashim, M.J.; King, J.K.; Govender, R.D.; Mustafa, H.; Al Kaabi, J. Epidemiology of Type 2 Diabetes–Global Burden of Disease and Forecasted Trends. J. Epidemiol. Glob. Health 2020, 10, 107–111. [Google Scholar] [CrossRef]
- Ong, K.L.; Stafford, L.K.; McLaughlin, S.A.; Boyko, E.J.; Vollset, S.E.; Smith, A.E.; Dalton, B.E.; Duprey, J.; Cruz, J.A.; Hagins, H.; et al. Global, regional, and national burden of diabetes from 1990 to 2021, with projections of prevalence to 2050: a systematic analysis for the Global Burden of Disease Study 2021. Lancet 2023, 402, 203–234. [Google Scholar] [CrossRef]
- Sarwar, N.; Gao, P.; Seshasai, S.R.; Gobin, R.; Kaptoge, S.; Di Angelantonio, E.; Ingelsson, E.; Lawlor, D.A.; Selvin, E.; et al.; The Emerging Risk Factors Collaboration Diabetes mellitus, fasting blood glucose concentration, and risk of vascular disease: A collaborative meta-analysis of 102 prospective studies. Lancet 2010, 375, 2215–2222. [Google Scholar] [CrossRef] [PubMed]
- Fonseca, V.A.; Kulkarni, K.D. Management of Type 2 Diabetes: Oral Agents, Insulin, and Injectables. J. Am. Diet. Assoc. 2008, 108, S29–S33. [Google Scholar] [CrossRef]
- Batchuluun, B.; Pinkosky, S.L.; Steinberg, G.R. Lipogenesis inhibitors: therapeutic opportunities and challenges. Nat. Rev. Drug Discov. 2022, 21, 283–305. [Google Scholar] [CrossRef]
- Kamon, M.; Sumitani, J.-I.; Tani, S.; Kawaguchi, T. Characterization and gene cloning of a maltotriose-forming exo-amylase from Kitasatospora sp. MK-1785. Appl. Microbiol. Biotechnol. 2015, 99, 4743–4753. [Google Scholar] [CrossRef]
- Zakowski, J.J.; Bruns, D.E. Biochemistry of Human Alpha Amylase Isoenzymes. CRC Crit. Rev. Clin. Lab. Sci. 1985, 21, 283–322. [Google Scholar] [CrossRef] [PubMed]
- Akinfemiwa, O.; Zubair, M.; Muniraj, T. Amylase. In StatPearls; StatPearls Publishing LLC.: Treasure Island (FL), 2025. [Google Scholar]
- Gupta, R.; Gigras, P.; Mohapatra, H.; Goswami, V.K.; Chauhan, B. Microbial α-amylases: a biotechnological perspective. Process. Biochem. 2003, 38, 1599–1616. [Google Scholar] [CrossRef]
- Ju, L.; Pan, Z.; Zhang, H.; Li, Q.; Liang, J.; Deng, G.; Yu, M.; Long, H. New insights into the origin and evolution of α-amylase genes in green plants. Sci. Rep. 2019, 9, 4929. [Google Scholar] [CrossRef] [PubMed]
- Farooq, M.A.; Ali, S.; Hassan, A.; Tahir, H.M.; Mumtaz, S.; Mumtaz, S. Biosynthesis and industrial applications of α-amylase: a review. Arch. Microbiol. 2021, 203, 1281–1292. [Google Scholar] [CrossRef]
- Gachons, C.P.D.; Breslin, P.A.S. Salivary Amylase: Digestion and Metabolic Syndrome. Curr. Diabetes Rep. 2016, 16, 102. [Google Scholar] [CrossRef]
- van der Maarel, M.J.; van der Veen, B.; Uitdehaag, J.C.; Leemhuis, H.; Dijkhuizen, L. Properties and applications of starch-converting enzymes of the α-amylase family. J. Biotechnol. 2002, 94, 137–155. [Google Scholar] [CrossRef] [PubMed]
- Reynolds, T.M. Amylase. Br. J. Hosp. Med. 2009, 70, M8–M9. [Google Scholar] [CrossRef]
- Gong, L.; Feng, D.; Wang, T.; Ren, Y.; Liu, Y.; Wang, J. Inhibitors of α-amylase and α-glucosidase: Potential linkage for whole cereal foods on prevention of hyperglycemia. Food Sci. Nutr. 2020, 8, 6320–6337. [Google Scholar] [CrossRef]
- Kaur, N.; Kumar, V.; Nayak, S.K.; Wadhwa, P.; Kaur, P.; Sahu, S.K. Alpha-amylase as molecular target for treatment of diabetes mellitus: A comprehensive review. Chem. Biol. Drug Des. 2021, 98, 539–560. [Google Scholar] [CrossRef]
- Hiele, M.; Ghoos, Y.; Rutgeerts, P.; Vantrappen, G. Effects of acarbose on starch hydrolysis. Dig. Dis. Sci. 1992, 37, 1057–1064. [Google Scholar] [CrossRef]
- Tsunoda, T.; Samadi, A.; Burade, S.; Mahmud, T. Complete biosynthetic pathway to the antidiabetic drug acarbose. Nat. Commun. 2022, 13, 1–12. [Google Scholar] [CrossRef] [PubMed]
- Tropsha, A. Best Practices for QSAR Model Development, Validation, and Exploitation. Mol. Inform. 2010, 29, 476–488. [Google Scholar] [CrossRef] [PubMed]
- Turabekova, M.A.; Rasulev, B.F.; Dzhakhangirov, F.N.; Salikhov, S.I. Aconitum and Delphinium alkaloids "Drug-likeness" descriptors related to toxic mode of action. Environmental Toxicology and Pharmacology 2008, 25, 310–320. [Google Scholar] [CrossRef]
- Toropova, A.P.; Toropov, A.A.; Rasulev, B.F.; Benfenati, E.; Gini, G.; Leszczynska, D.; Leszczynski, J. QSAR models for ACE-inhibitor activity of tri-peptides based on representation of the molecular structure by graph of atomic orbitals and SMILES. Struct. Chem. 2012, 23, 1873–1878. [Google Scholar] [CrossRef]
- Gramatica, P.; Cassani S Fau - Chirico, N.; Chirico, N. QSARINS-chem: Insubria datasets and new QSAR/QSPR models for environmental pollutants in QSARINS. Journal of Computational Chemistry 2014, 1036–1044. [Google Scholar] [CrossRef]
- Gad, S.C. QSAR. In Encyclopedia of Toxicology, 4th ed.; Wexler, P., Ed.; Academic Press, 2024; pp. 55–65. [Google Scholar]
- Gooch, A.; Sizochenko, N.; Rasulev, B.; Gorb, L.; Leszczynski, J. In vivo toxicity of nitroaromatics: A comprehensive quantitative structure–activity relationship study. Environ. Toxicol. Chem. 2017, 36, 2227–2233. [Google Scholar] [CrossRef]
- Juretic, D.; Kusic, H.; Dionysiou, D.D.; Rasulev, B.; Bozic, A.L. Modeling of photooxidative degradation of aromatics in water matrix; combination of mechanistic and structural-relationship approach. Chem. Eng. J. 2014, 257, 229–241. [Google Scholar] [CrossRef]
- Daghighi, A.; Casanola-Martin, G.M.; Timmerman, T.; Milenković, D.; Lučić, B.; Rasulev, B. In Silico Prediction of the Toxicity of Nitroaromatic Compounds: Application of Ensemble Learning QSAR Approach. Toxics 2022, 10, 746. [Google Scholar] [CrossRef]
- Basnet, S.A.; Ghimire, M.P.; Lamichhane, T.A.; Adhikari, R.A.; Adhikari, A. Identification of potential human pancreatic α-amylase inhibitors from natural products by molecular docking, MM/GBSA calcula-tions, MD simulations, and ADMET analysis. PlOS One 2023, 18, e0275765. [Google Scholar] [CrossRef]
- Tropsha, A.; Isayev, O.; Varnek, A.; Schneider, G.; Cherkasov, A. Integrating QSAR modelling and deep learning in drug discovery: the emergence of deep QSAR. Nat. Rev. Drug Discov. 2023, 23, 141–155. [Google Scholar] [CrossRef]
- Cramer, R.D.; Patterson, D.E.; Bunce, J.D. Comparative molecular field analysis (CoMFA). 1. Effect of shape on binding of steroids to carrier proteins. J. Am. Chem. Soc. 1988, 110, 5959–5967. [Google Scholar] [CrossRef] [PubMed]
- Zhuravskyi, Y.; Iduoku, K.; Erickson, M.E.; Karuth, A.; Usmanov, D.; Casanola-Martin, G.; Sayfiyev, M.N.; Ziyaev, D.A.; Smanova, Z.; Mikolajczyk, A.; et al. Quantitative Structure─Permittivity Relationship Study of a Series of Polymers. ACS Mater. Au 2024, 4, 195–203. [Google Scholar] [CrossRef] [PubMed]
- Mao, J.; Akhtar, J.; Zhang, X.; Sun, L.; Guan, S.; Li, X.; Chen, G.; Liu, J.; Jeon, H.-N.; Kim, M.S.; et al. Comprehensive strategies of machine-learning-based quantitative structure-activity relationship models. iScience 2021, 24, 103052. [Google Scholar] [CrossRef]
- Dieguez-Santana, K.; Pham-The, H.; Rivera-Borroto, O.M.; Puris, A.; Le-Thi-Thu, H.; Casanola-Martin, G.M. A Two QSAR Way for Antidiabetic Agents Targeting Using α-Amylase and α-Glucosidase Inhibitors: Model Parameters Settings in Artificial Intelligence Techniques. Lett. Drug Des. Discov. 2017, 14. [Google Scholar] [CrossRef]
- Izadpanah, E.; Riahi, S.; Abbasi-Radmoghaddam, Z.; Gharaghani, S.; Mohammadi-Khanaposhtanai, M. A simple and robust model to predict the inhibitory activity of α-glucosidase inhibitors through combined QSAR modeling and molecular docking techniques. Mol. Divers. 2021, 25, 1811–1825. [Google Scholar] [CrossRef]
- Duhan, M.; Singh, R.; Devi, M.; Sindhu, J.; Bhatia, R.; Kumar, A.; Kumar, P. Synthesis, molecular docking and QSAR study of thiazole clubbed pyrazole hybrid as α-amylase inhibitor. J. Biomol. Struct. Dyn. 2019, 39, 91–107. [Google Scholar] [CrossRef]
- Mitra, S.; Chatterjee, S.; Bose, S.; Panda, P.; Basak, S.; Ghosh, N.; Mandal, S.C.; Singhmura, S.; Halder, A.K. Finding structural requirements of structurally diverse α-glucosidase and α-amylase inhibitors through validated and predictive 2D-QSAR and 3D-QSAR analyses. J. Mol. Graph. Model. 2023, 126, 108640. [Google Scholar] [CrossRef]
- Gramatica, P.; Chirico, N.; Papa, E.; Cassani, S.; Kovarich, S. QSARINS: A new software for the development, analysis, and validation of QSAR MLR models. J. Comput. Chem. 2013, 34, 2121–2132. [Google Scholar] [CrossRef]
- Devillers, J. Genetic algorithms in molecular modeling; Academic Press, 1996. [Google Scholar]
- Fjodorova, N.; Novič, M.; Venko, K.; Drgan, V.; Rasulev, B.; Saçan, M.T.; Erdem, S.S.; Tugcu, G.; Toropova, A.P.; Toropov, A.A. How fullerene derivatives (FDs) act on therapeutically important targets associated with diabetic diseases. Comput. Struct. Biotechnol. J. 2022, 20, 913–924. [Google Scholar] [CrossRef]
- Alhijawi, B.; Awajan, A. Genetic algorithms: theory, genetic operators, solutions, and applications. Evol. Intell. 2023, 17, 1245–1256. [Google Scholar] [CrossRef]
- Cvetnic, M.; Perisic, D.J.; Kovacic, M.; Ukic, S.; Bolanca, T.; Rasulev, B.; Kusic, H.; Bozic, A.L. Toxicity of aromatic pollutants and photooxidative intermediates in water: A QSAR study. Ecotoxicol. Environ. Saf. 2018, 169, 918–927. [Google Scholar] [CrossRef] [PubMed]
- Holford, N. Pharmacodynamic principles and the time course of immediate drug effects. Transl. Clin. Pharmacol. 2017, 25, 157–161. [Google Scholar] [CrossRef]
- Hanwell, M.D.; Curtis, D.E.; Lonie, D.C.; Vandermeersch, T.; Zurek, E.; Hutchison, G.R. Avogadro: An advanced semantic chemical editor, visualization, and analysis platform. J. Cheminform. 2012, 4, 17. [Google Scholar] [CrossRef]
- Mauri, A.; Bertola, M. Alvascience: A New Software Suite for the QSAR Workflow Applied to the Blood–Brain Barrier Permeability. Int. J. Mol. Sci. 2022, 23, 12882. [Google Scholar] [CrossRef]
- David, L.; Thakkar, A.; Mercado, R.; Engkvist, O. Molecular representations in AI-driven drug discovery: a review and practical guide. J. Chemin- 2020, 12, 1–22. [Google Scholar] [CrossRef] [PubMed]
- Freeman, W.M.; Bixler, G.V.; Brucklacher, R.M.; Lin, C.-M.; Patel, K.M.; VanGuilder, H.D.; LaNoue, K.F.; Kimball, S.R.; Barber, A.J.; A Antonetti, D.; et al. A multistep validation process of biomarkers for preclinical drug development. Pharmacogenomics J. 2009, 10, 385–395. [Google Scholar] [CrossRef] [PubMed]
- Rácz, A.; Bajusz, D.; Héberger, K. Modelling methods and cross-validation variants in QSAR: a multi-level analysis$. SAR QSAR Environ. Res. 2018, 29, 661–674. [Google Scholar] [CrossRef]
- Mathai, N.; Chen, Y.; Kirchmair, J. Validation strategies for target prediction methods. Briefings Bioinform. 2020, 21, 791–802. [Google Scholar] [CrossRef]
- Li, L.; Hu, J.; Ho, Y. Global Performance and Trend of QSAR/QSPR Research: A Bibliometric Analysis. Mol. Informatics 2014, 33, 655–668. [Google Scholar] [CrossRef]
- Ramspek, C.L.; Jager, K.J.; Dekker, F.W.; Zoccali, C.; van Diepen, M. External validation of prognostic models: what, why, how, when and where? Clin. Kidney J. 2020, 14, 49–58. [Google Scholar] [CrossRef]
- De, P.; Kar, S.; Ambure, P.; Roy, K. Prediction reliability of QSAR models: an overview of various validation tools. Arch. Toxicol. 2022, 96, 1279–1295. [Google Scholar] [CrossRef] [PubMed]
- Estrada, E. Spectral Moments of the Edge Adjacency Matrix in Molecular Graphs. 1. Definition and Applications to the Prediction of Physical Properties of Alkanes. J. Chem. Inf. Comput. Sci. 1996, 36, 844–849. [Google Scholar] [CrossRef]
- Velázquez-Libera, J.L.; Caballero, J.; Toropova, A.P.; Toropov, A.A. Estimation of 2D autocorrelation descriptors and 2D Monte Carlo descriptors as a tool to build up predictive models for acetylcholinesterase (AChE) inhibitory activity. Chemom. Intell. Lab. Syst. 2019, 184, 14–21. [Google Scholar] [CrossRef]
- Ginex, T.; Vazquez, J.; Gilbert, E.; Herrero, E.; Luque, F.J. Lipophilicity in Drug Design: An Overview of Lipophilicity Descriptors in 3D-QSAR Studies. Futur. Med. Chem. 2019, 11, 1177–1193. [Google Scholar] [CrossRef] [PubMed]
- Grisoni, F.; Schneider, G. Molecular Scaffold Hopping via Holistic Molecular Representation. Methods Mol Biol 2021, 2266, 11–35. [Google Scholar] [CrossRef]
- Baskin, I. Fragment Descriptors in SAR/QSAR/QSPR Studies, Molecular Similarity Analysis and in Virtual Screening. In Chemoinformatics Approaches to Virtual Screening; Varnek, A., Tropsha, A., Eds.; Chapter 1, The Royal Society of Chemistry; 2008. [Google Scholar] [CrossRef]
- Neto, L.R.d.S.; Moreira-Filho, J.T.; Neves, B.J.; Maidana, R.L.B.R.; Guimarães, A.C.R.; Furnham, N.; Andrade, C.H.; Silva, F.P. In silico Strategies to Support Fragment-to-Lead Optimization in Drug Discovery. Front. Chem. 2020, 8, 93. [Google Scholar] [CrossRef]
Figure 1.
Example structures of α-amylase inhibitor used in this study.
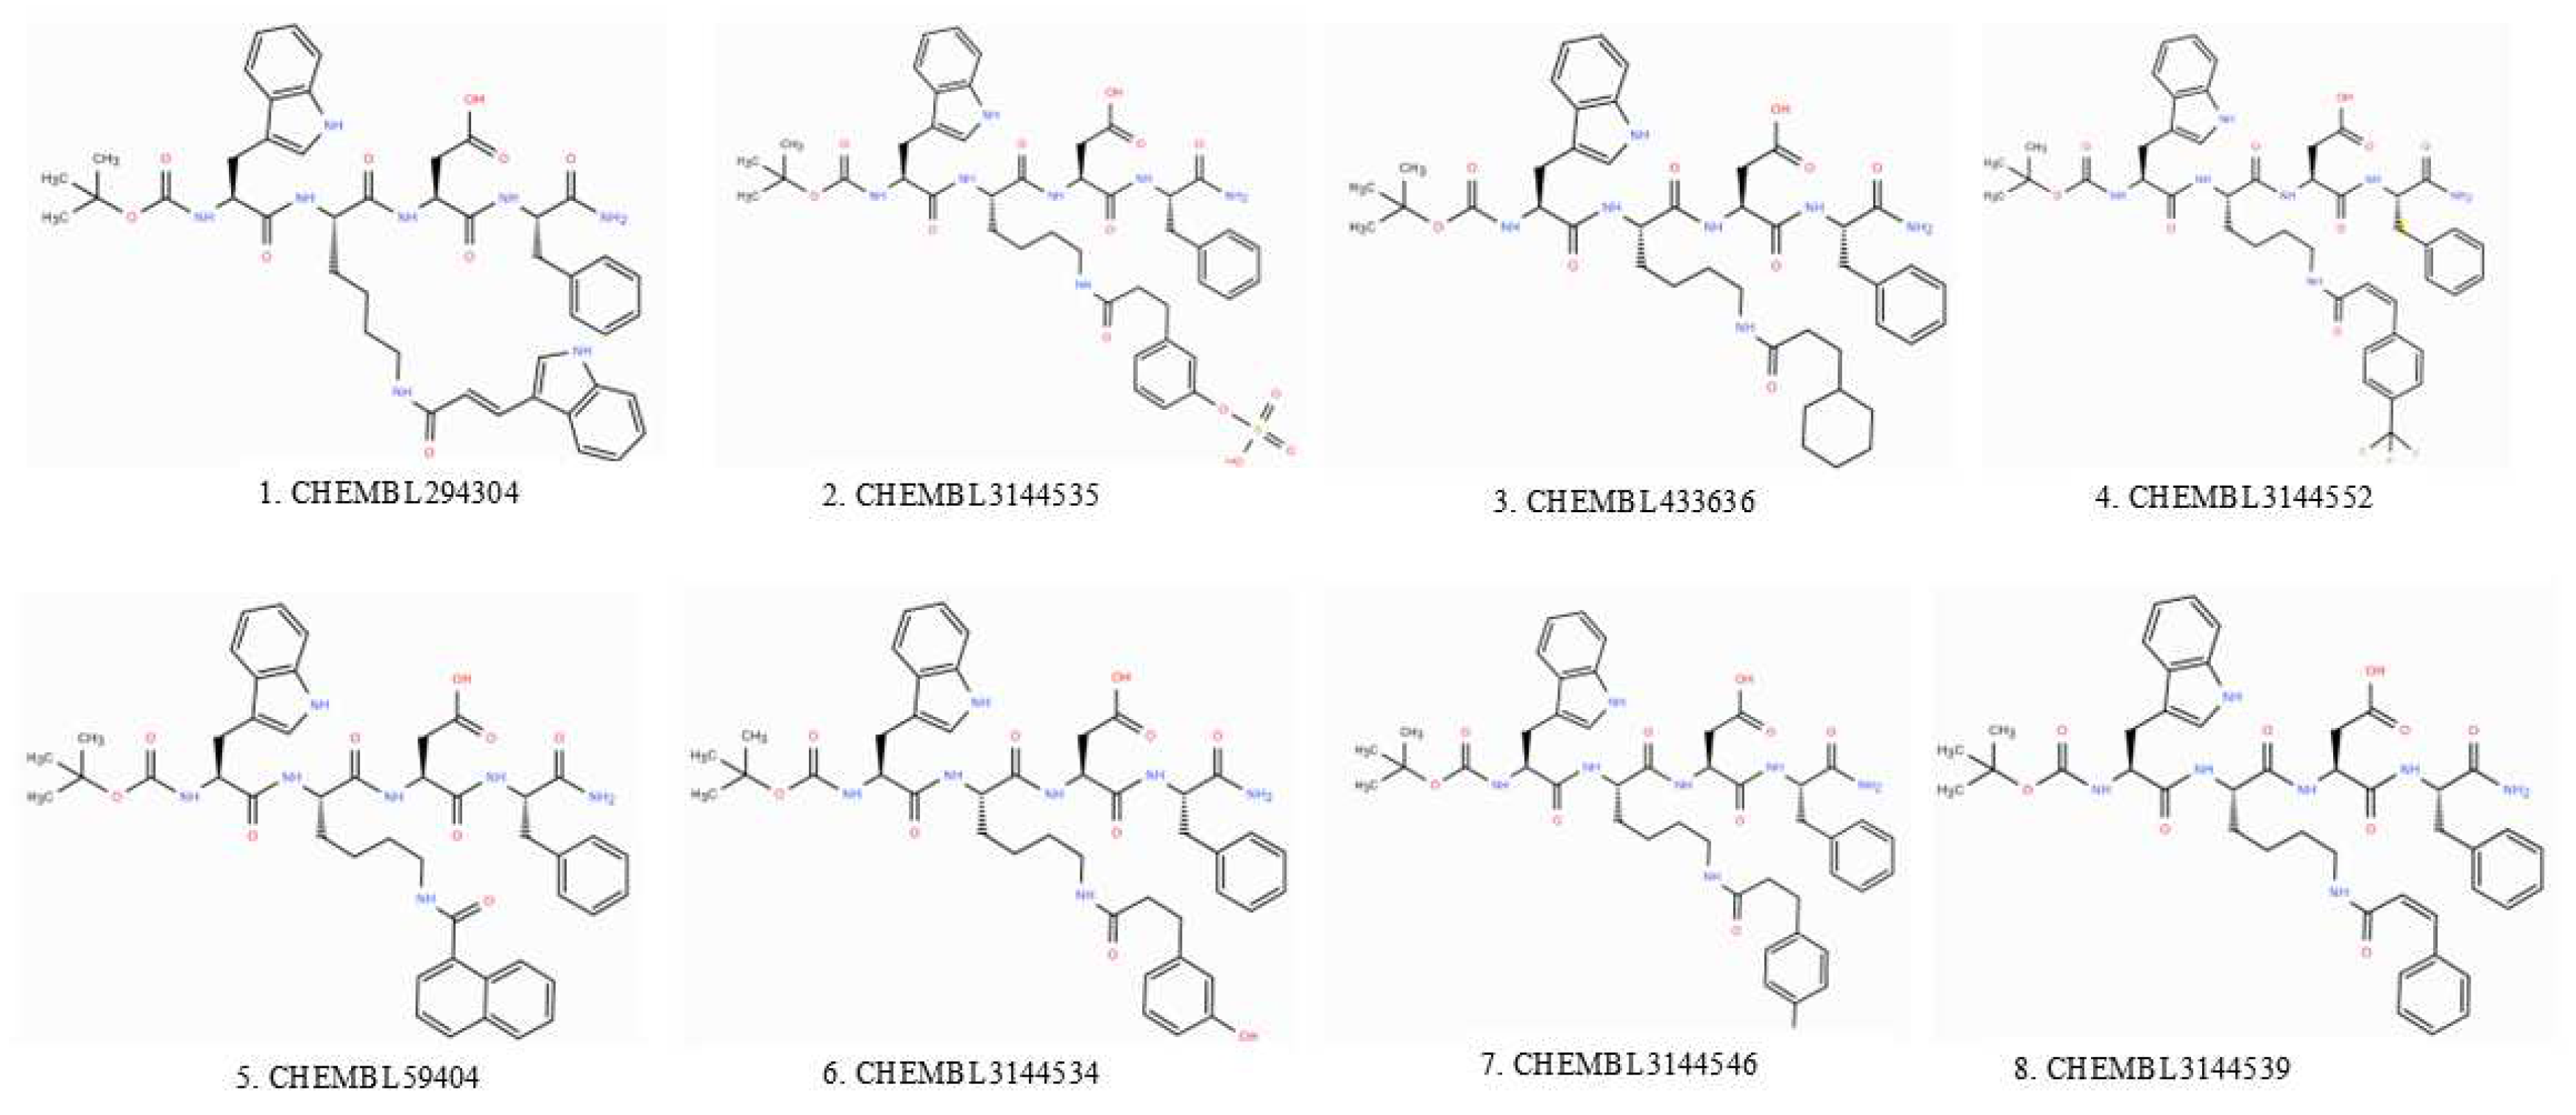
Figure 2.
ML-QSAR workflow for the α-amylase inhibitors.
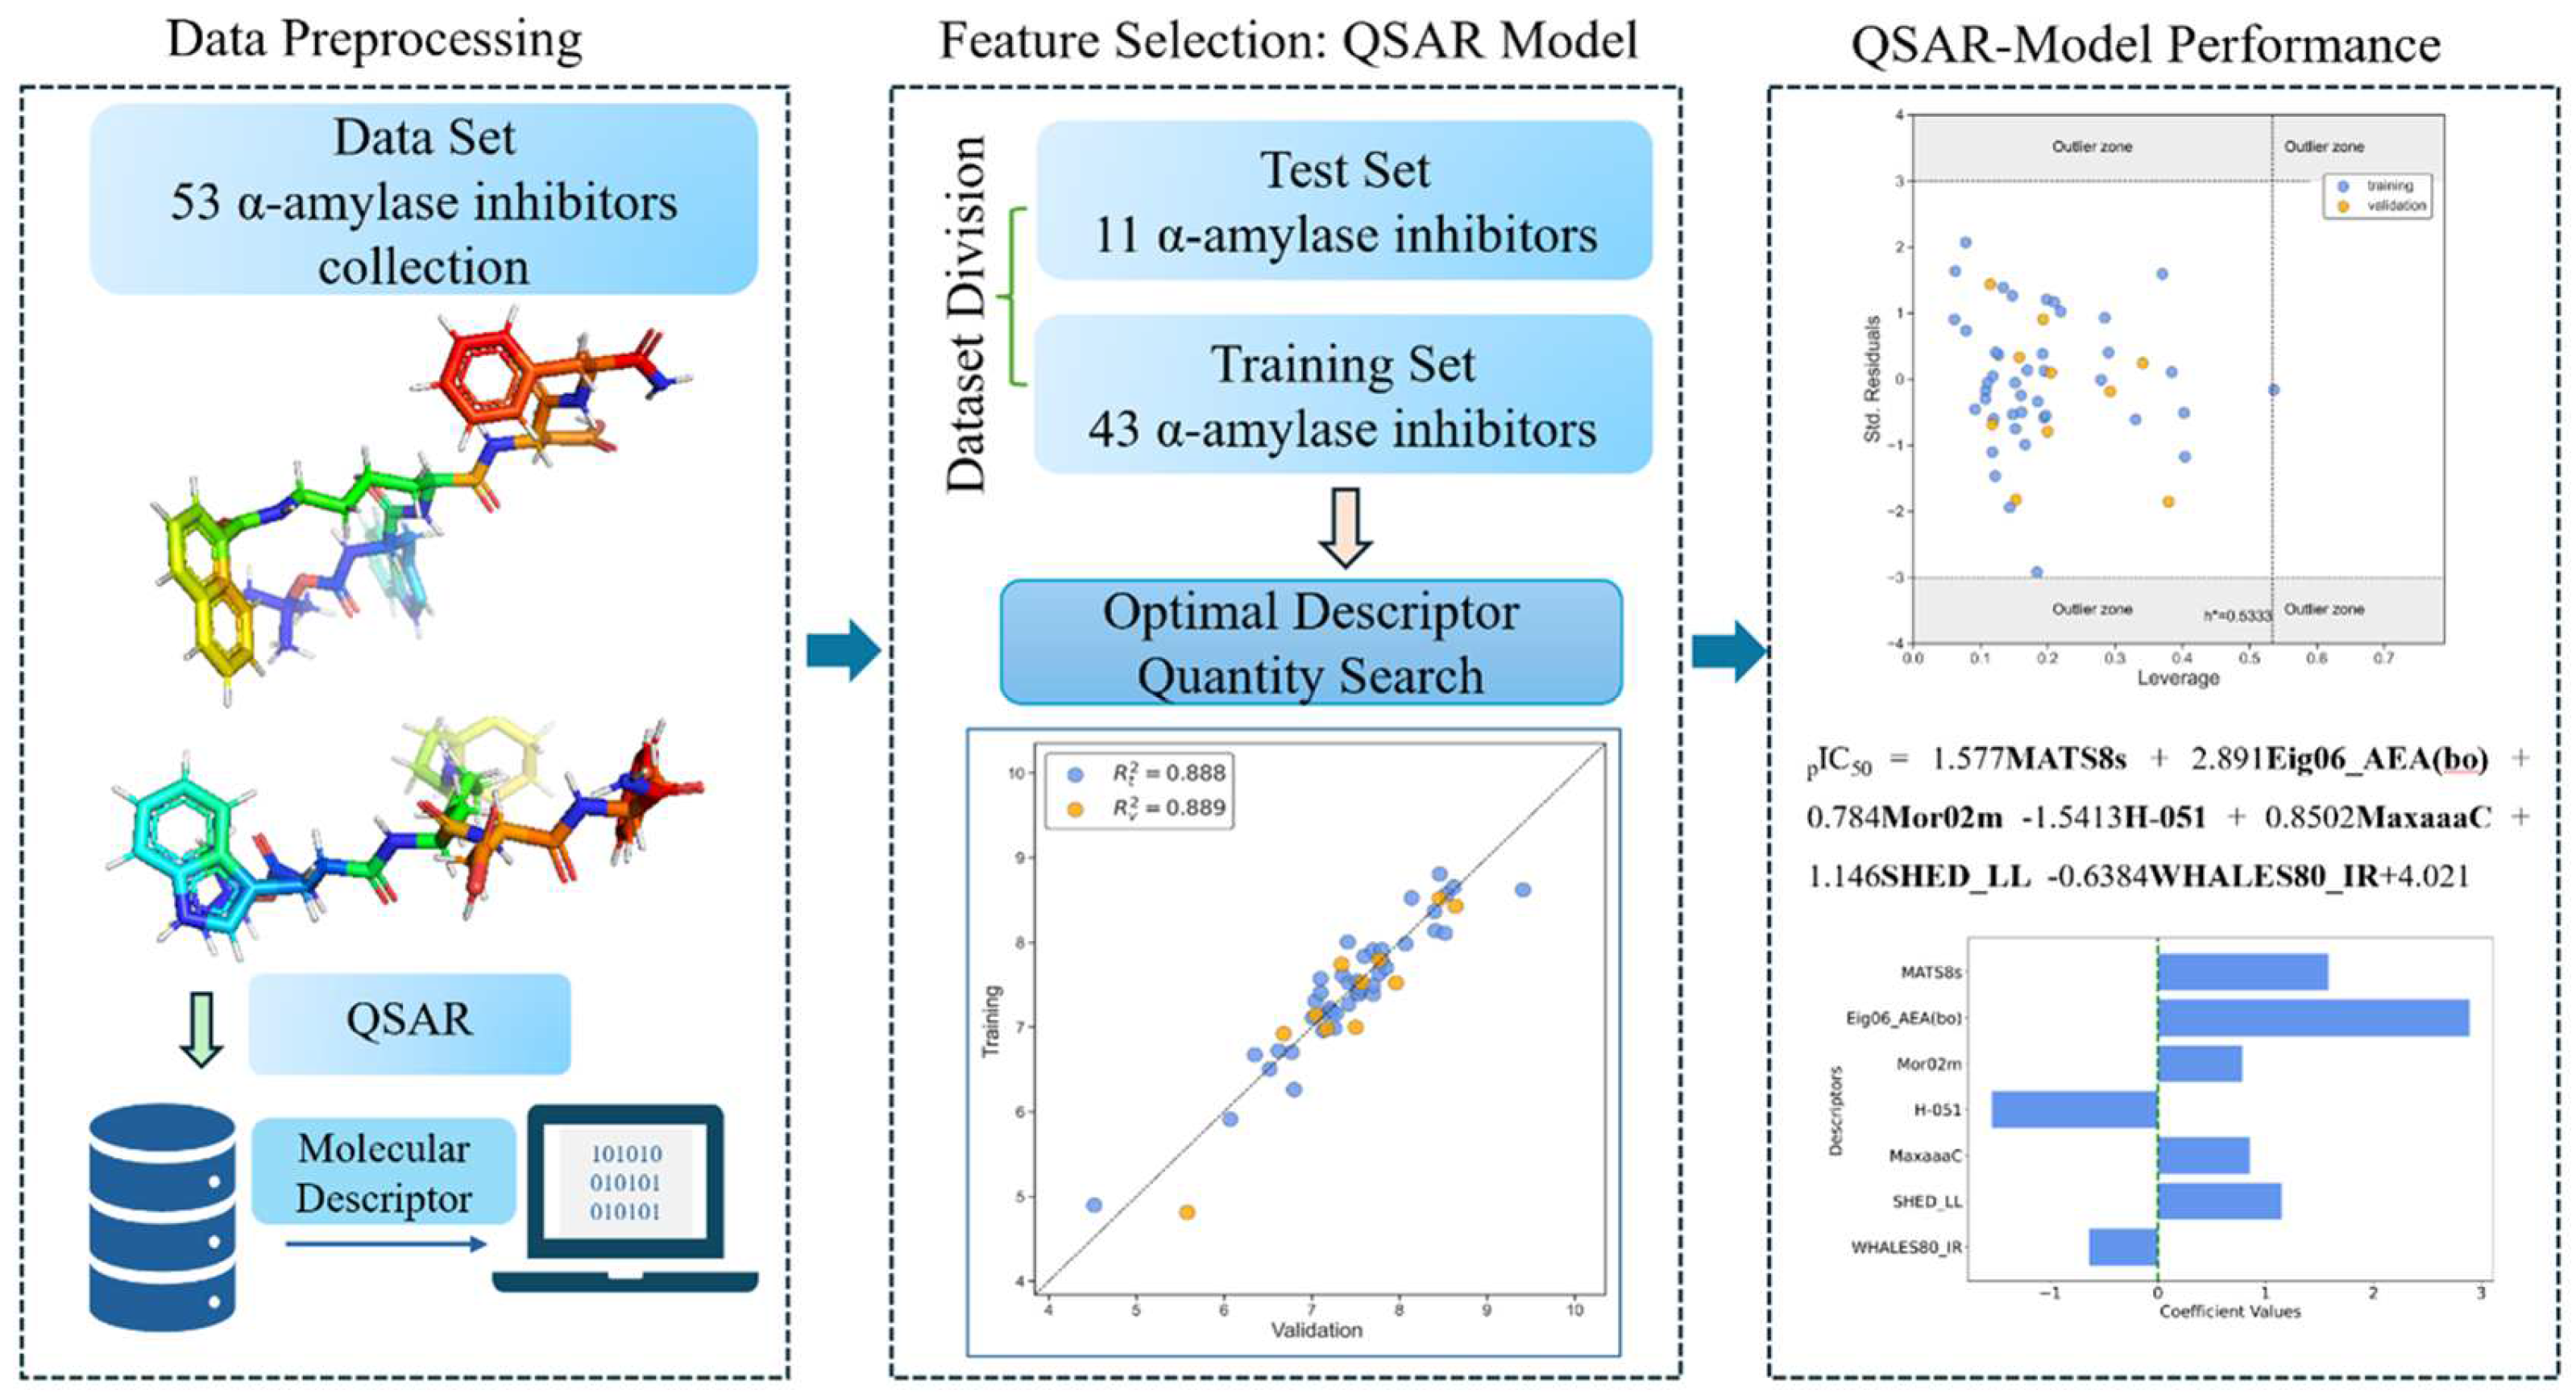
Figure 3.
Correlation plot of training vs predicted (validation) values for the best ML-QSAR models for α-amylase inhibitors.
Figure 3.
Correlation plot of training vs predicted (validation) values for the best ML-QSAR models for α-amylase inhibitors.
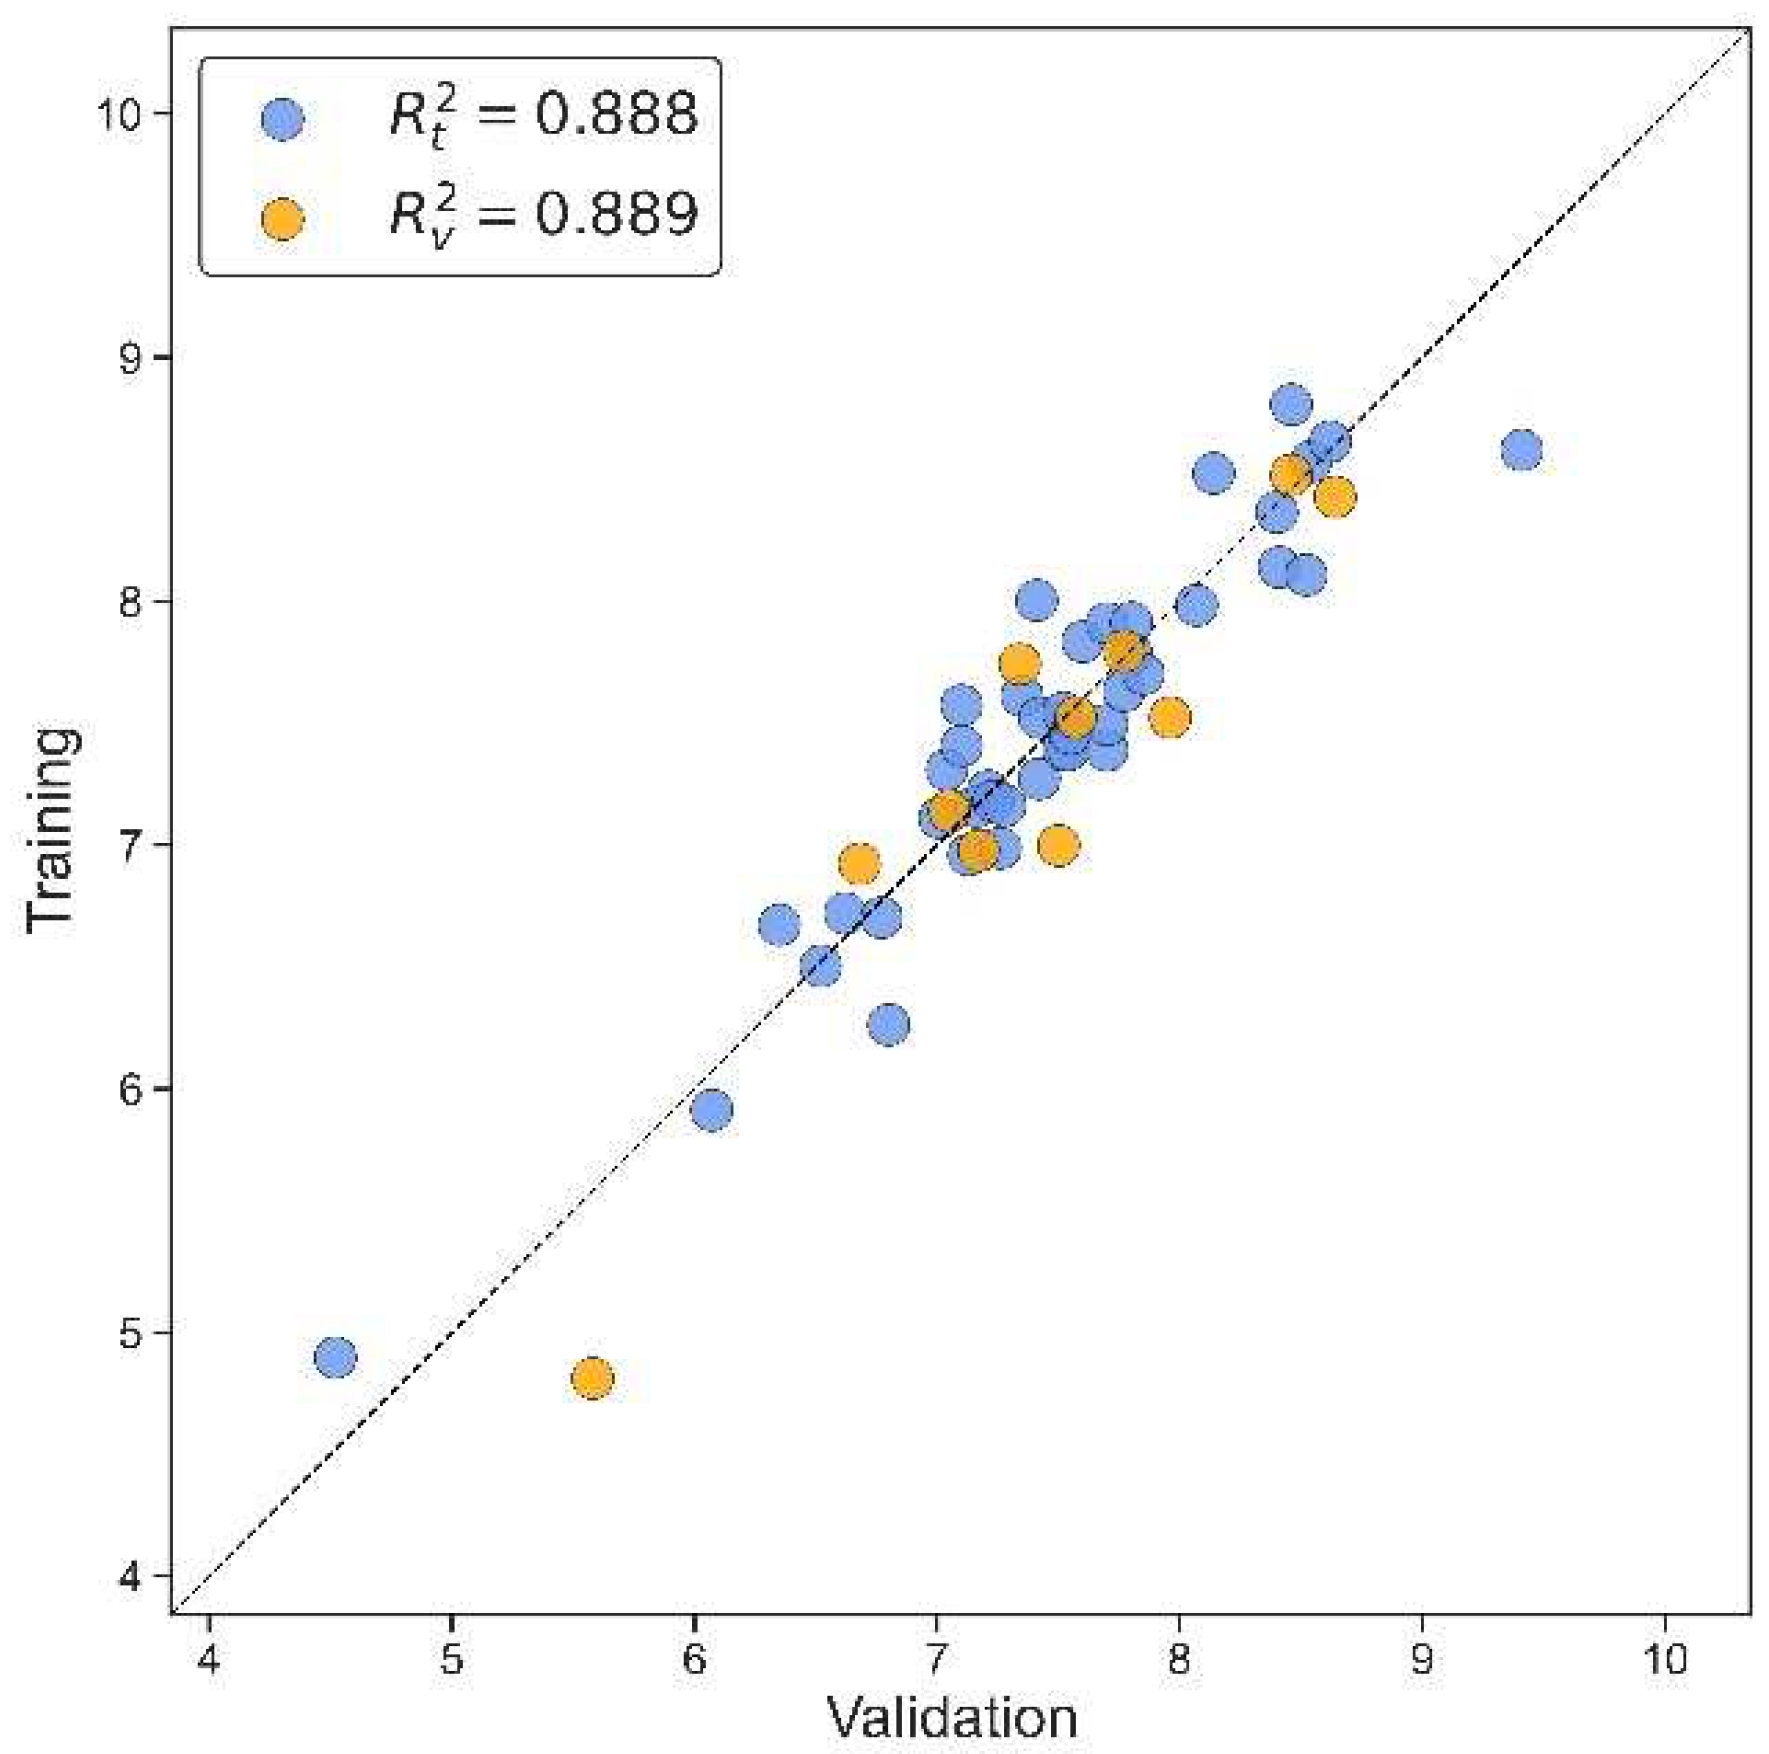
Figure 4.
Willams plot for the best seven-variable ML-QSAR model. The yellow dots are for the training set, and the blue dots are for the test set. The horizontal dash lines represent ±3 standard residuals, and the vertical dashed line represents the warning leverage, Hat-value h* =0.533.
Figure 4.
Willams plot for the best seven-variable ML-QSAR model. The yellow dots are for the training set, and the blue dots are for the test set. The horizontal dash lines represent ±3 standard residuals, and the vertical dashed line represents the warning leverage, Hat-value h* =0.533.
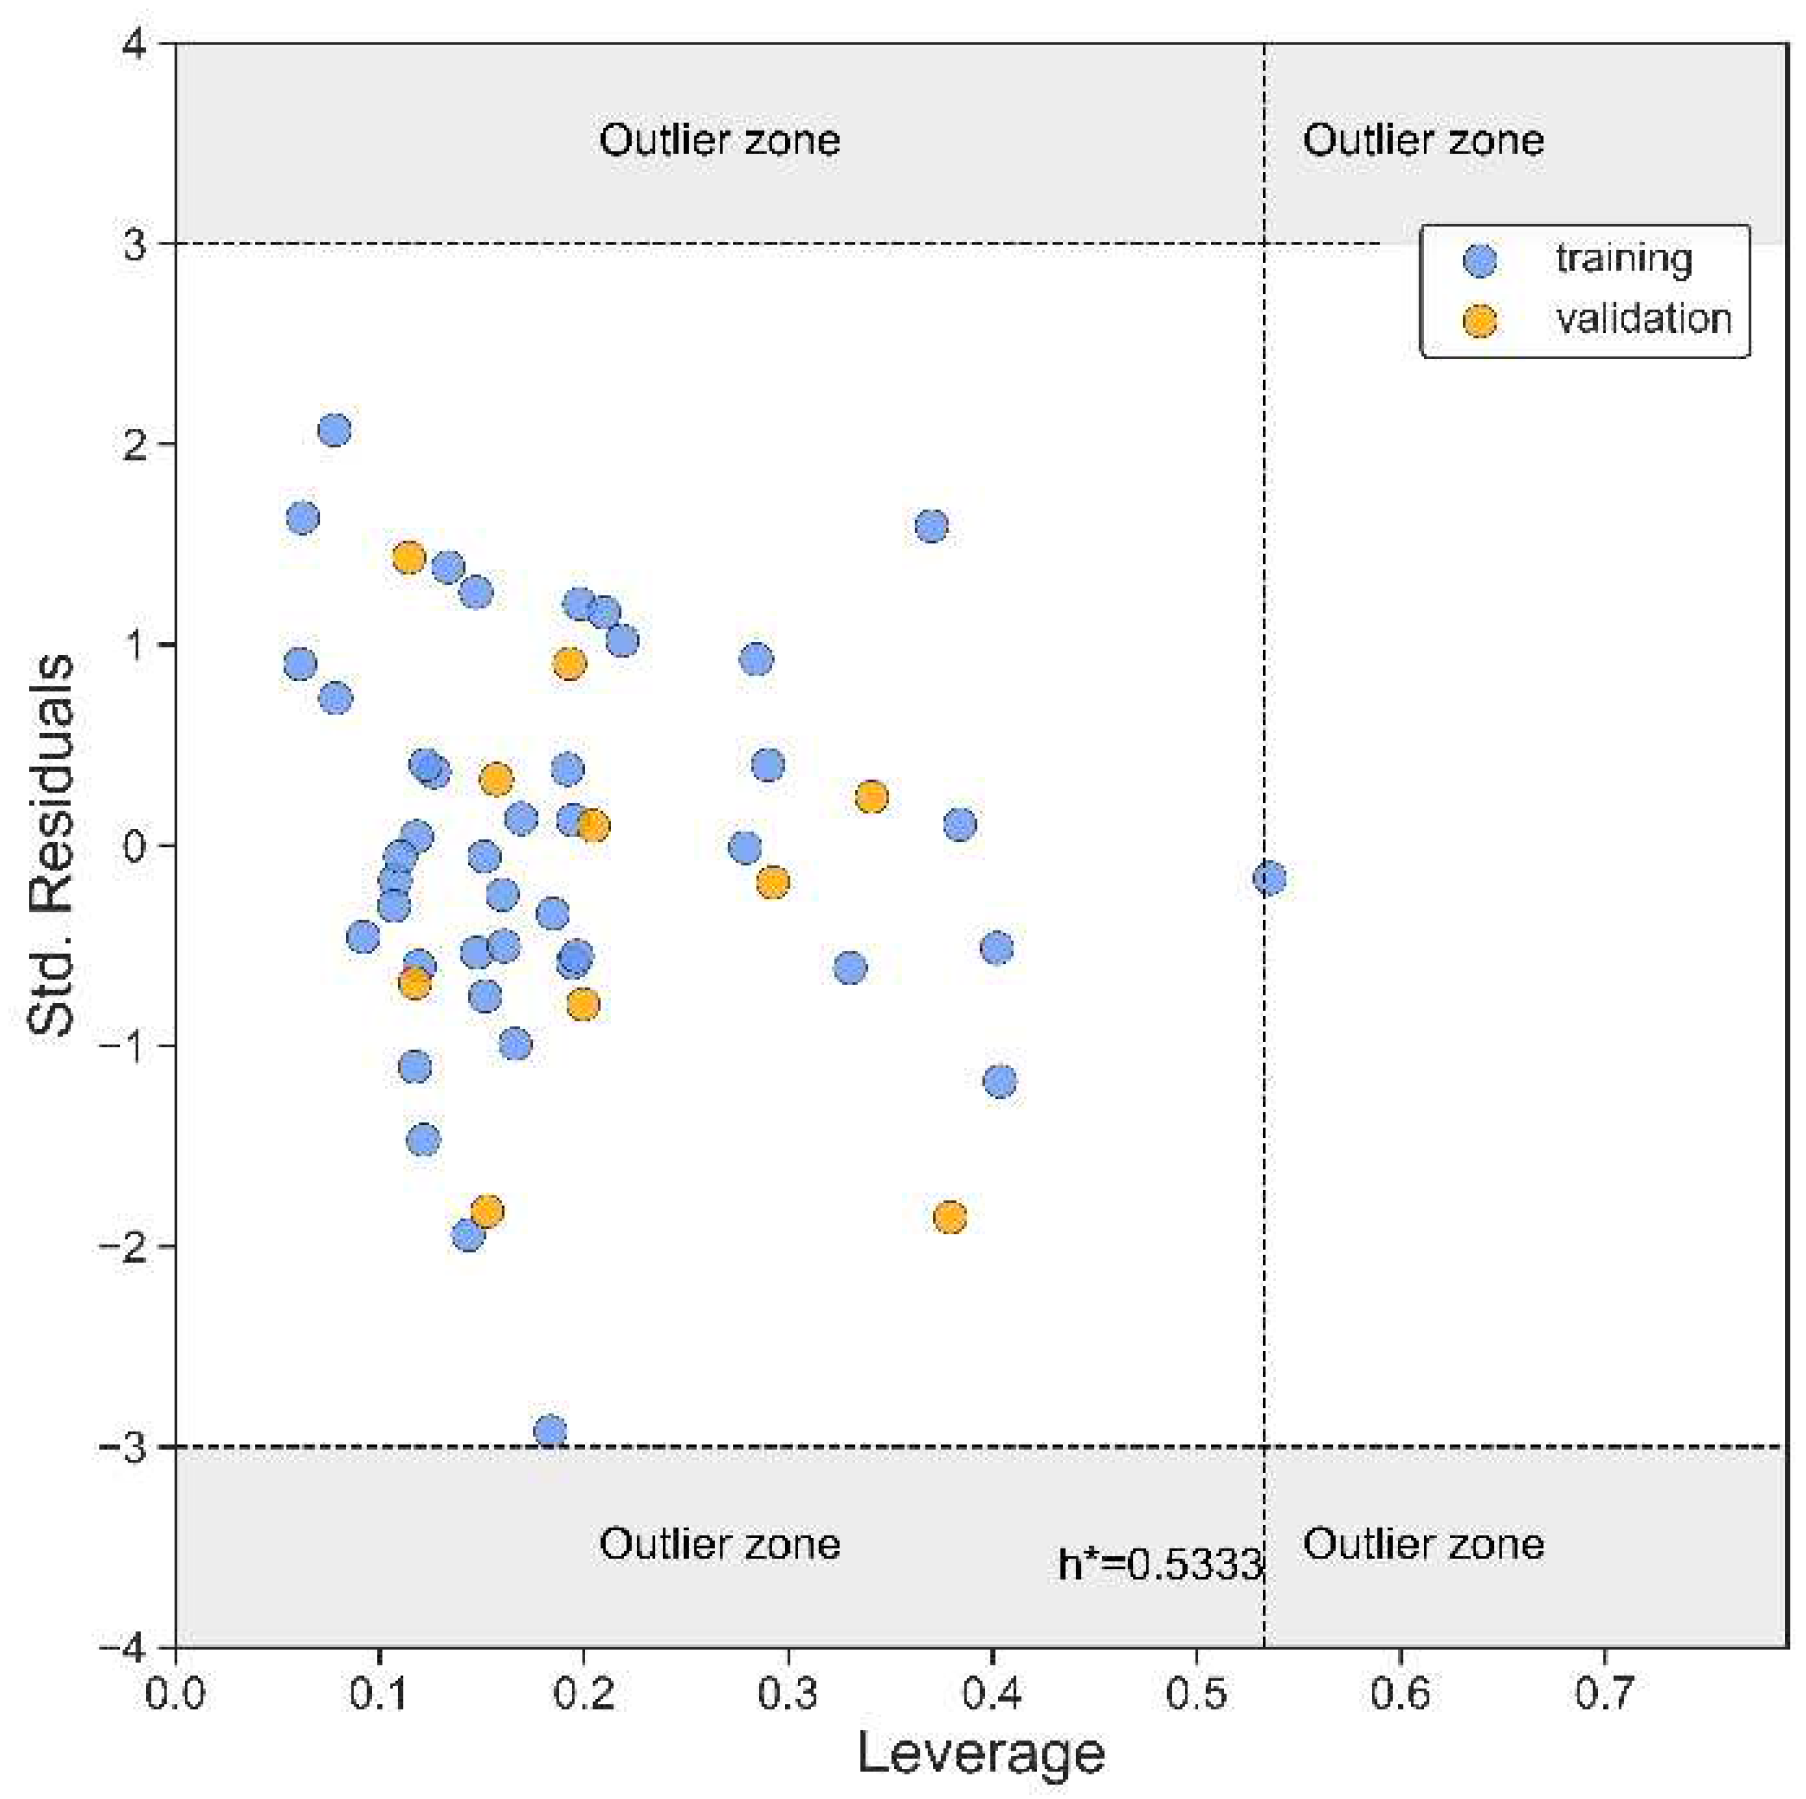
Figure 5.
The y-scrambling plot of selected 7-descriptor models.
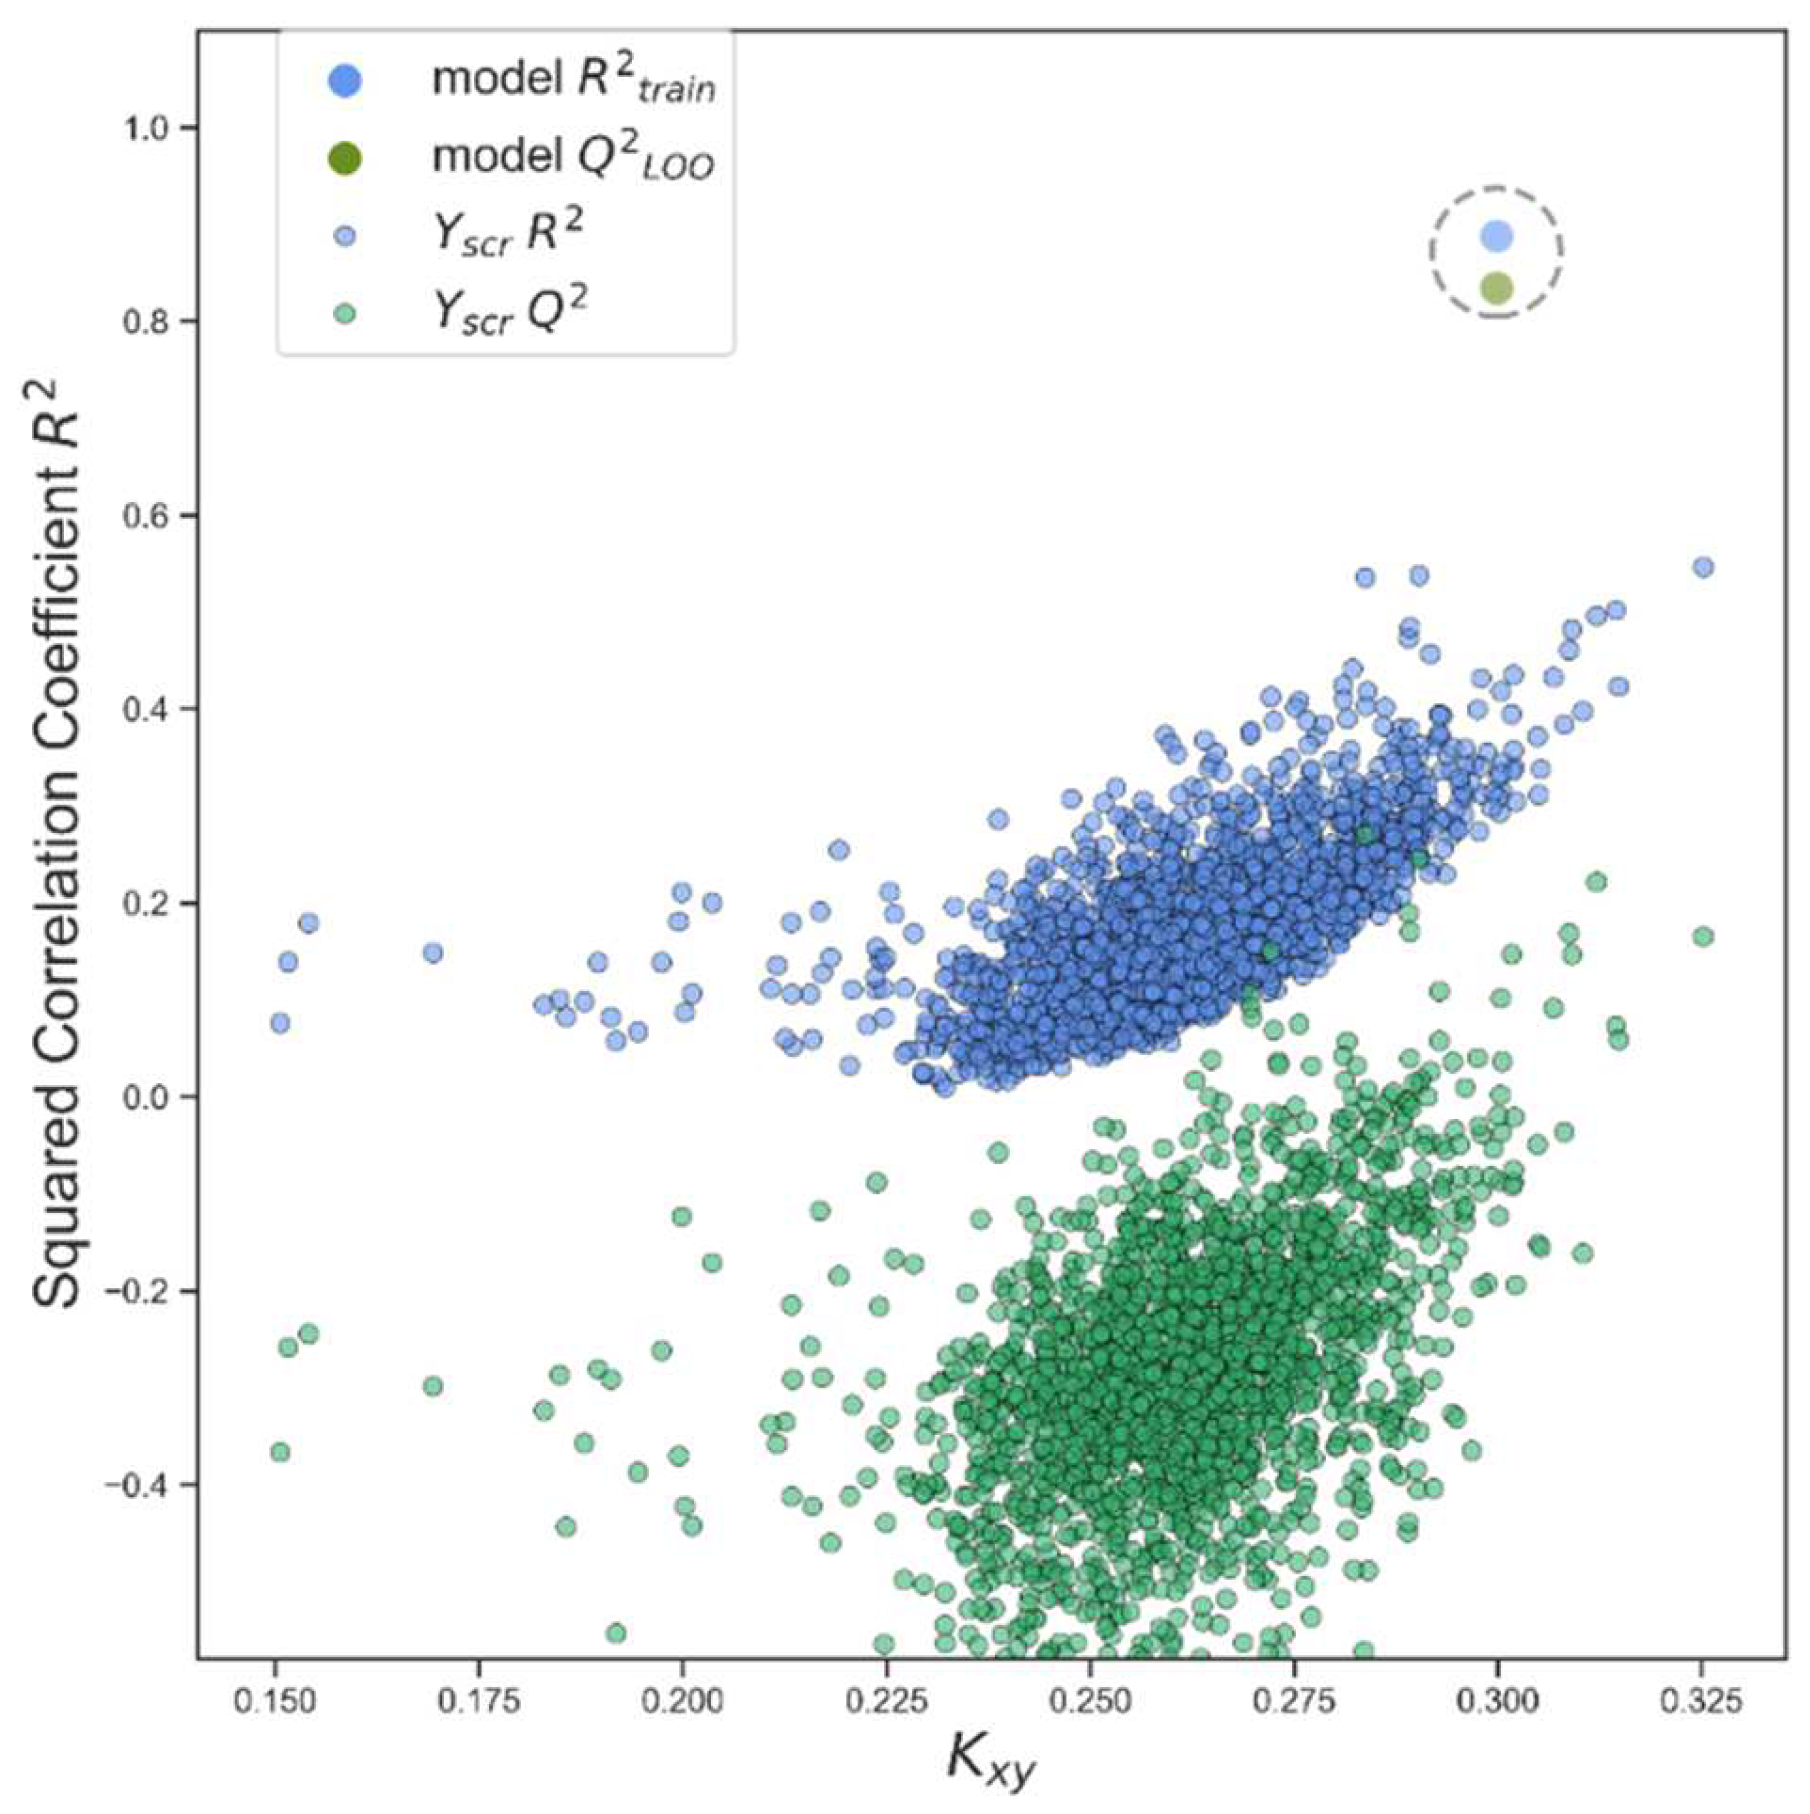
Figure 6.
The coefficient values for each descriptor in α-amylase inhibitors.
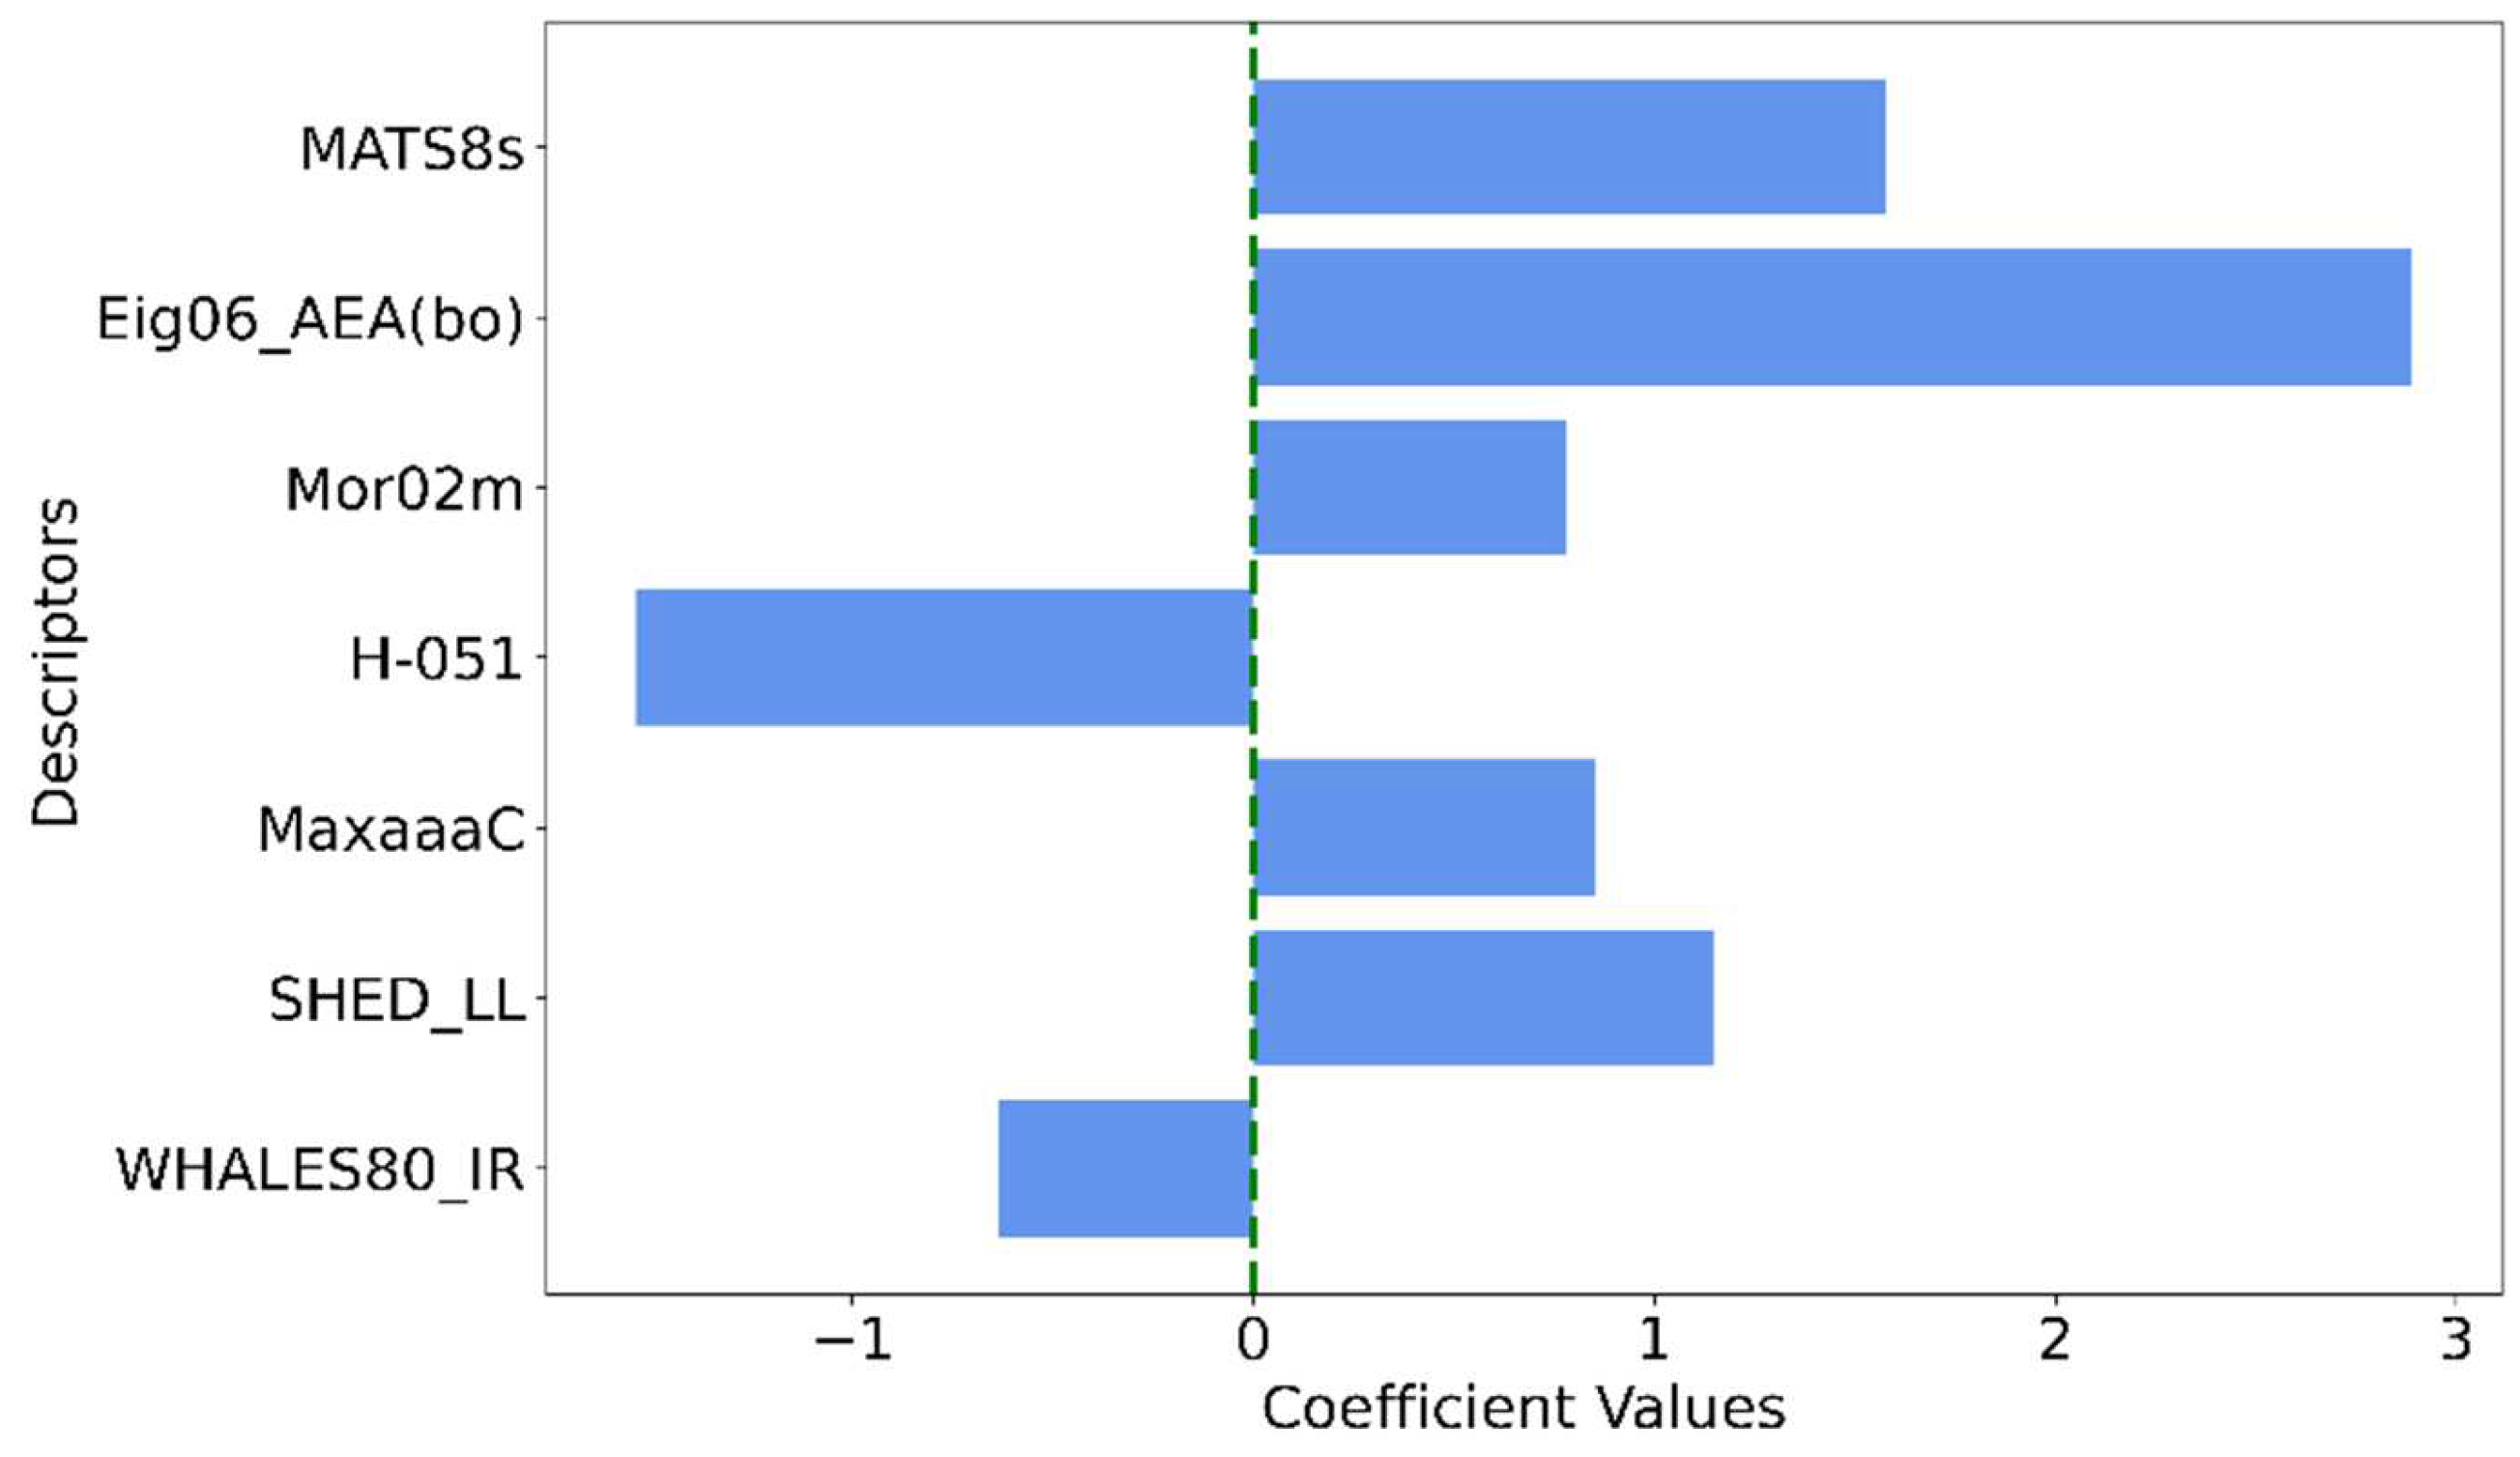

Table 1.
Statistical parameters for the 7-variable ML-QSAR model.
| N(TS/ES)* | R²train | R2adj | R²test | Q2Loo | RMSEtrain | RMSEval | RMSEtest | F | Intercept |
| 43/11 | 0.888 | 0.865 | 0.889 | 0.834 | 0.268 | 0.326 | 0.350 | 38.524 | 4.021 |
*N - Number of compounds in the training set (TS) and test set (ES); R2 - Coefficient of determination; Q2Loo - Leave-one-out-cross-validated R2; F - Fisher Ration; RMSE - Root mean square error.
Table 2.
Description of the molecular descriptors selected for the best model.
| Descriptor | Description | Descriptor family |
|---|---|---|
| MATS8s | Moran autocorrelation of lag 8 weighted by I-state | 2D autocorrelations |
| Eig06_AEA(bo) | Eigenvalue number 6 from augmented edge adjacency matrices weighted by bond order | Edge adjacency indices |
| Mor02m | Signal 02 / weighted by mass | 3D-MoRSE descriptors |
| H-051 | H attached to alpha C | Atom-centered fragments |
| MaxaaaC | Maximum aaaC | Atom-type E-state indices |
| SHED_LL | SHED Lipophilic-Lipophilic | Pharmacophore descriptors |
| WHALES80_IR | WHALES Isolation-Remoteness ratio (IR) (percentile 80) | WHALES descriptors |
Disclaimer/Publisher’s Note: The statements, opinions and data contained in all publications are solely those of the individual author(s) and contributor(s) and not of MDPI and/or the editor(s). MDPI and/or the editor(s) disclaim responsibility for any injury to people or property resulting from any ideas, methods, instructions or products referred to in the content. |
© 2025 by the authors. Licensee MDPI, Basel, Switzerland. This article is an open access article distributed under the terms and conditions of the Creative Commons Attribution (CC BY) license (http://creativecommons.org/licenses/by/4.0/).
Copyright: This open access article is published under a Creative Commons CC BY 4.0 license, which permit the free download, distribution, and reuse, provided that the author and preprint are cited in any reuse.


