Submitted:
12 April 2025
Posted:
15 April 2025
You are already at the latest version
Abstract
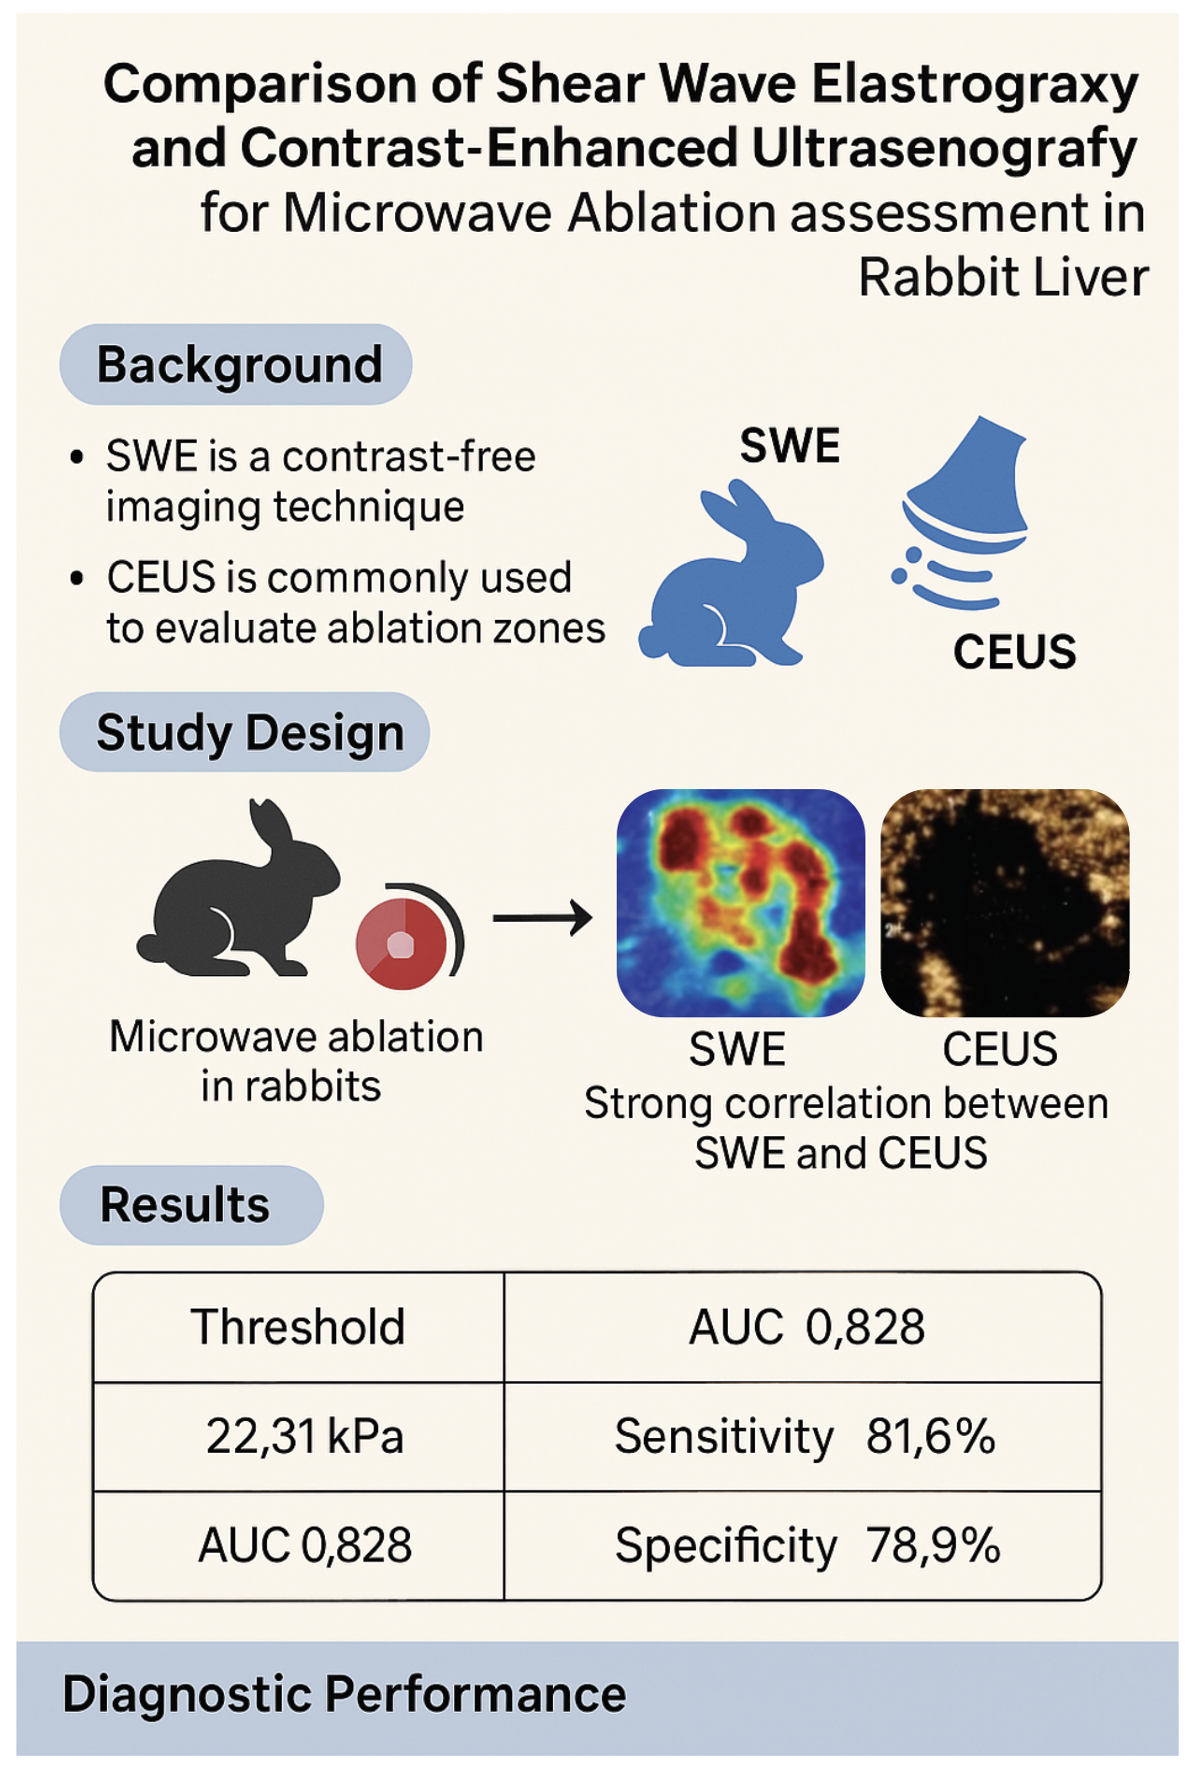
Background/Objectives: To evaluate the feasibility and diagnostic performance of shear wave elastography (SWE) compared to contrast-enhanced ultrasonography (CEUS) in real-time assessment of microwave ablation (MWA) zones in rabbit liver, and to deter-mine the SWE stiffness threshold indicative of coagulative necrosis. Methods: Microwave ablation was performed on 90 liver lesions in 30 rabbits using two power/time settings. SWE was performed immediately post-ablation to measure stiffness at the lesion center, edge, and surrounding liver. CEUS was subsequently used to assess lesion size. Meas-urements from SWE and CEUS were compared with gross pathology. Receiver operating characteristic (ROC) analysis was conducted to define the SWE threshold for ablation boundary detection. Results: SWE-mean values increased significantly at the ablation center and edge (P < 0.001), with a decreasing gradient from center to periphery. ROC analysis identified 22.31 kPa as the optimal stiffness threshold for coagulative necrosis at the ablation margin (AUC = 0.828, sensitivity = 81.6%, specificity = 78.9%). Lesion di-mensions measured by SWE and CEUS were comparable to those of gross specimens, with no significant differences. Conclusions: SWE provides accurate and reproducible as-sessment of microwave ablation zones and may serve as a contrast-free alternative to CEUS for intraoperative monitoring. These findings support the potential clinical utility of SWE in real-time, non-invasive evaluation of ablation efficacy.
Keywords:
Shear wave elastography
; contrast-enhanced ultrasonography
; microwave ablation
; liver imaging
; non-invasive assessment
1. Introduction
Primary liver cancer, particularly hepatocellular carcinoma (HCC), remains a major global health concern and is the fourth most common malignancy worldwide. In China, the disease burden is especially high, accounting for nearly half of all new cases globally1, 2. While surgical resection offers the best chance for cure, many patients are diagnosed at an advanced stage or present with underlying cirrhosis that limits surgical eligibility3. In such cases, image-guided thermal ablation has emerged as an effective alternative treatment.
Microwave ablation (MWA) is increasingly favored among ablation techniques due to its high thermal efficiency, rapid ablation time, and reduced sensitivity to the heat sink effect compared with radiofrequency ablation4, 5. Ensuring complete ablation with a sufficient safety margin—typically at least 5 mm beyond the tumour border—is critical to reducing recurrence risk6. Accurate intraoperative evaluation of the ablation zone is therefore essential.
Contrast-enhanced ultrasonography (CEUS) is widely used for real-time assessment of ablation efficacy. It enables visualization of perfusion changes to identify residual viable tissue7, 8. However, CEUS requires intravenous contrast agents, which can increase procedural complexity, cost, and carry a risk of allergic reactions9. Moreover, image quality can be degraded by gas artifacts produced during ablation, impairing boundary delineation.
Shear wave elastography (SWE) is a novel, contrast-free ultrasound modality that quantifies tissue stiffness in real time by analysing the propagation speed of shear waves. It has demonstrated diagnostic potential in liver fibrosis, tumours, and post-ablation tissue characterization10, 11. Experimental studies have shown that SWE can identify the extent of ablation in ex vivo porcine liver models, with specific stiffness thresholds corresponding to areas of coagulative necrosis9, 12. However, data on SWE application in vivo—particularly in real-time assessment immediately following microwave ablation—remain limited.
This study aims to address that gap by evaluating the performance of SWE for intraoperative monitoring of microwave ablation in rabbit liver. Specifically, we sought to (1) determine the SWE threshold corresponding to the ablation boundary, and (2) assess the feasibility and accuracy of SWE compared to CEUS and gross pathology in a live animal model. These findings may inform future clinical applications of SWE as a non-invasive, real-time alternative to contrast-based imaging during liver tumour ablation.
2. Materials and Methods
Animal Model and Ethics Statement
Thirty healthy New Zealand White rabbits (both sexes; age range, 6–8 months; mean body weight, 4.0 ± 0.67 kg) were obtained from Tianqin Biotechnology Co., Ltd. (Changsha, China; Production License No. SCXK (Xiang) 2019-0015). All experimental procedures were approved by the Animal Care and Use Committee of the Xiangya School of Medicine, Affiliated Haikou Hospital of Central South University, and adhered to the guidelines outlined in the Guide for the Care and Use of Laboratory Animals13. Rabbits are widely used in liver ablation studies due to their favourable anatomical and physiological characteristics11.
Anesthesia and Surgical Procedure
Rabbits were fasted for 12 hours before surgery. Anesthesia was induced with intramuscular sumianxin (0.1 mL/kg), followed by intravenous administration of 1% pentobarbital sodium (0.3 mL/kg) via the auricular vein. Once anesthetized, rabbits were secured in the supine position on a custom operating platform, and vital signs were continuously monitored. A midline L-shaped incision was made below the xiphoid process to expose the liver. All surgical procedures were conducted under aseptic conditions.
Microwave Ablation Protocol
Microwave ablation (MWA) was performed using the ECO-100 C-type ultrasound-guided microwave coagulation therapy system and ECO-100AI3 disposable ablation needles (Nanjing Yigao Co., China). Two ablation protocols were employed: Group A (30 W for 45 s) and Group B (35 W for 60 s). A total of 90 lesions were created in 30 rabbits. Under 2D ultrasound guidance, a 16G microwave needle was inserted into the targeted hepatic lobes. Different power settings were used to reflect clinical variability in ablation parameters9, 10.
Shear Wave Elastography
Shear wave elastography (SWE) was performed immediately post-ablation using the Mindray Resona 7 ultrasound system with a linear array probe (L11-3U; 3.0–11.0 MHz). Two experienced sonographers (>5 years) independently performed the measurements. The elastography scale was set to 0–75 kPa, with a mechanical index (MI) of 1.0. A region of interest (ROI) with a 2 mm diameter and ≥95% confidence index was positioned to cover the ablation zone. Three repeated measurements were averaged per location. SWE-mean values were recorded at three specific points: point a (lesion center), point b (lesion edge), and point c (5 mm beyond the lesion margin), following validated methodologies9, 10.
Contrast-Enhanced Ultrasonography
CEUS was performed after SWE using the same ultrasound system. The contrast agent (SonoVue, Bracco, Italy) was reconstituted with 5 mL of saline and agitated for 1 minute. A 0.5 mL bolus was administered via the auricular vein followed by a 1 mL saline flush. CEUS acquisition began 60 seconds post-injection, during the arterial phase, with an MI of 0.071. Dynamic images were stored for post-processing. Lesion dimensions (maximum transverse and vertical diameters) were measured and compared with SWE and gross pathology 6, 7, 14-16.
Pathological and Histochemical Analysis
Following imaging, rabbits were euthanized by intravenous injection of 10 mL of air into the auricular vein. The liver was excised and sectioned along the longest axis of the ablation lesion under ultrasound guidance. Gross lesion dimensions were recorded. Tissue samples from points a, b, and c were obtained for histological analysis. Sections were stained with hematoxylin and eosin (HE) and with nicotinamide adenine dinucleotide (NADH) tetrazolium reductase to assess cellular viability17. For NADH staining, frozen sections were imaged at 400× magnification. Ten random high-power fields were selected per sample. Image analysis was performed using Image-Pro Plus 6.0 (Media Cybernetics, USA) to quantify the number of NADH-positive granules and the integrated optical density (IOD), serving as surrogates for metabolic activity10, 17.
Statistical Analysis
Statistical analyses were performed using SPSS version 22.0 (IBM Corp., Armonk, NY, USA). Data were reported as mean ± standard deviation. Paired and independent-samples t-tests were used to assess pre- and post-ablation differences in SWE-mean, NADH granule count, and IOD. One-way ANOVA was applied to compare these parameters across points a, b, and c. Pearson correlation and linear regression analyses were used to explore associations between SWE-mean values, NADH staining, and IOD12. Receiver operating characteristic (ROC) curve analysis was conducted using histopathological evidence of coagulative necrosis as the reference standard to determine the SWE-mean cutoff for boundary detection. The area under the curve (AUC), sensitivity, and specificity were calculated. Statistical significance was defined as a two-tailed P-value < 0.05.
3. Results
Shear Wave Elastography (SWE) Analysis
A total of 136 ablation procedures were performed across 30 rabbits, yielding 90 valid ablation lesions for analysis. Of these, 38 were created using 30 W for 45 seconds (Group A), and 52 using 35 W for 60 seconds (Group B).
In Group A, pre-ablation SWE-mean values at points a (center), b (edge), and c (5 mm outside the lesion) were 8.02 ± 0.26, 8.09 ± 0.35, and 8.05 ± 0.45 kPa, respectively. Following ablation, these increased significantly to 98.70 ± 6.58, 20.52 ± 3.34, and 8.35 ± 0.83 kPa, respectively. SWE-mean values at points a and b were significantly higher post-ablation (P < 0.001), while no significant difference was observed at point c.
In Group B, similar trends were observed. Pre-ablation SWE-mean values at points a, b, and c were 8.02 ± 0.13, 8.04 ± 0.17, and 8.07 ± 0.15 kPa, respectively, and post-ablation values increased to 103.64 ± 8.21 (a), 22.27 ± 2.55 (b), and 8.61 ± 0.23 kPa (c). Significant increases were again found at points a and b (P < 0.001), while point c remained unchanged (P > 0.05). Within-group comparisons also revealed a significant spatial gradient in SWE-mean values post-ablation (P < 0.001; Table 1).
No statistically significant difference in SWE-mean at the lesion boundary (point b) was observed between Groups A and B (P > 0.05), indicating robustness of SWE measurements across varying ablation parameters.
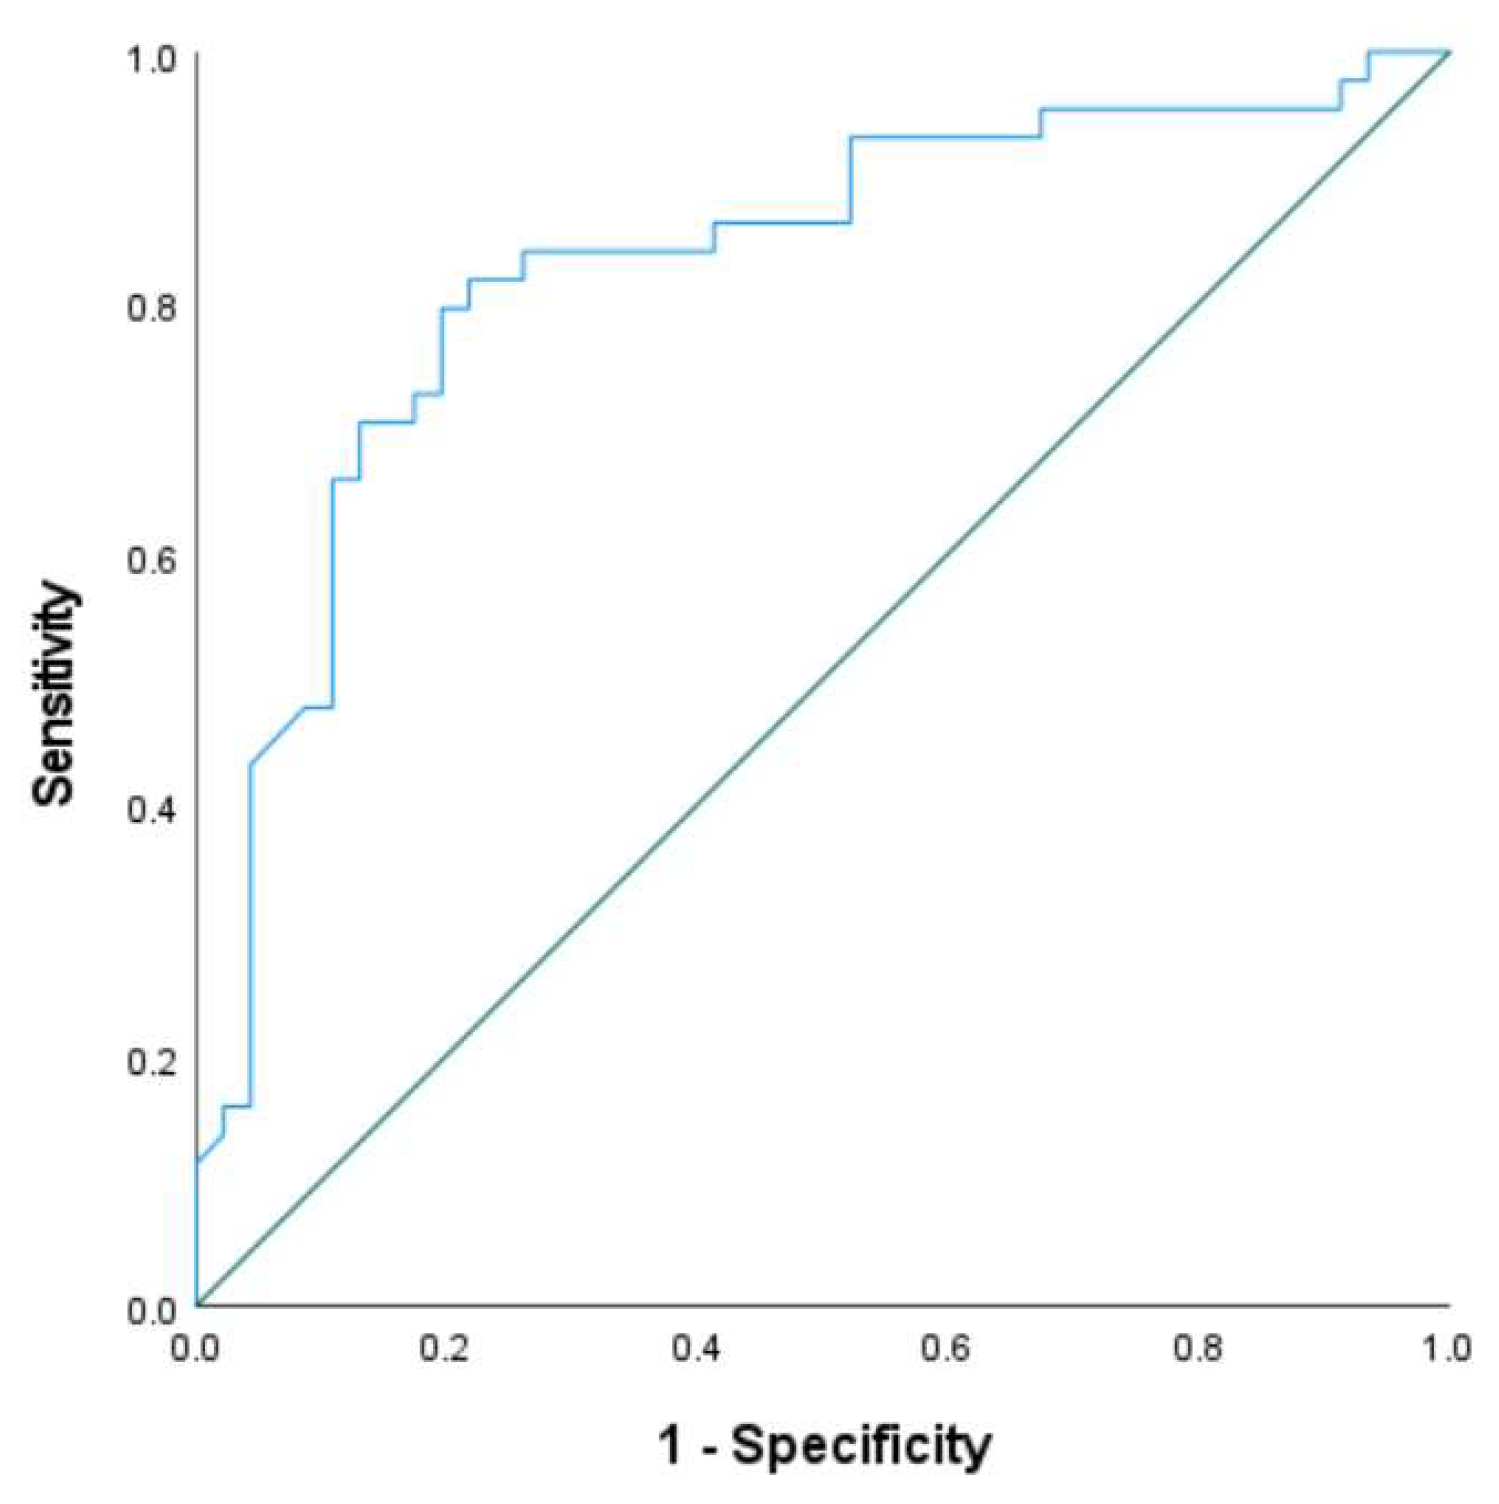
Receiver operating characteristic (ROC) analysis at point b, using histopathological diagnosis as the reference standard, yielded an area under the curve (AUC) of 0.828 (Figure 2). The optimal SWE-mean threshold for identifying coagulative necrosis at the ablation edge was determined to be 22.31 kPa, with sensitivity and specificity of 81.6% and 78.9%, respectively. This is consistent with previously reported thresholds in ex vivo models10.
Figure 1.
Representative shear wave elastography (SWE) image obtained immediately after microwave ablation of rabbit liver tissue. The color-coded elastogram shows Young’s modulus values distributed across the ablation zone. SWE-mean values were measured at three specific locations: point a (ablation center), point b (ablation edge), and point c (5 mm beyond the edge of the lesion, representing normal parenchyma). A marked gradient in tissue stiffness is evident, with the highest stiffness at the center and progressively lower values toward the periphery, corresponding to histological zones of necrosis, transitional damage, and viable tissue.
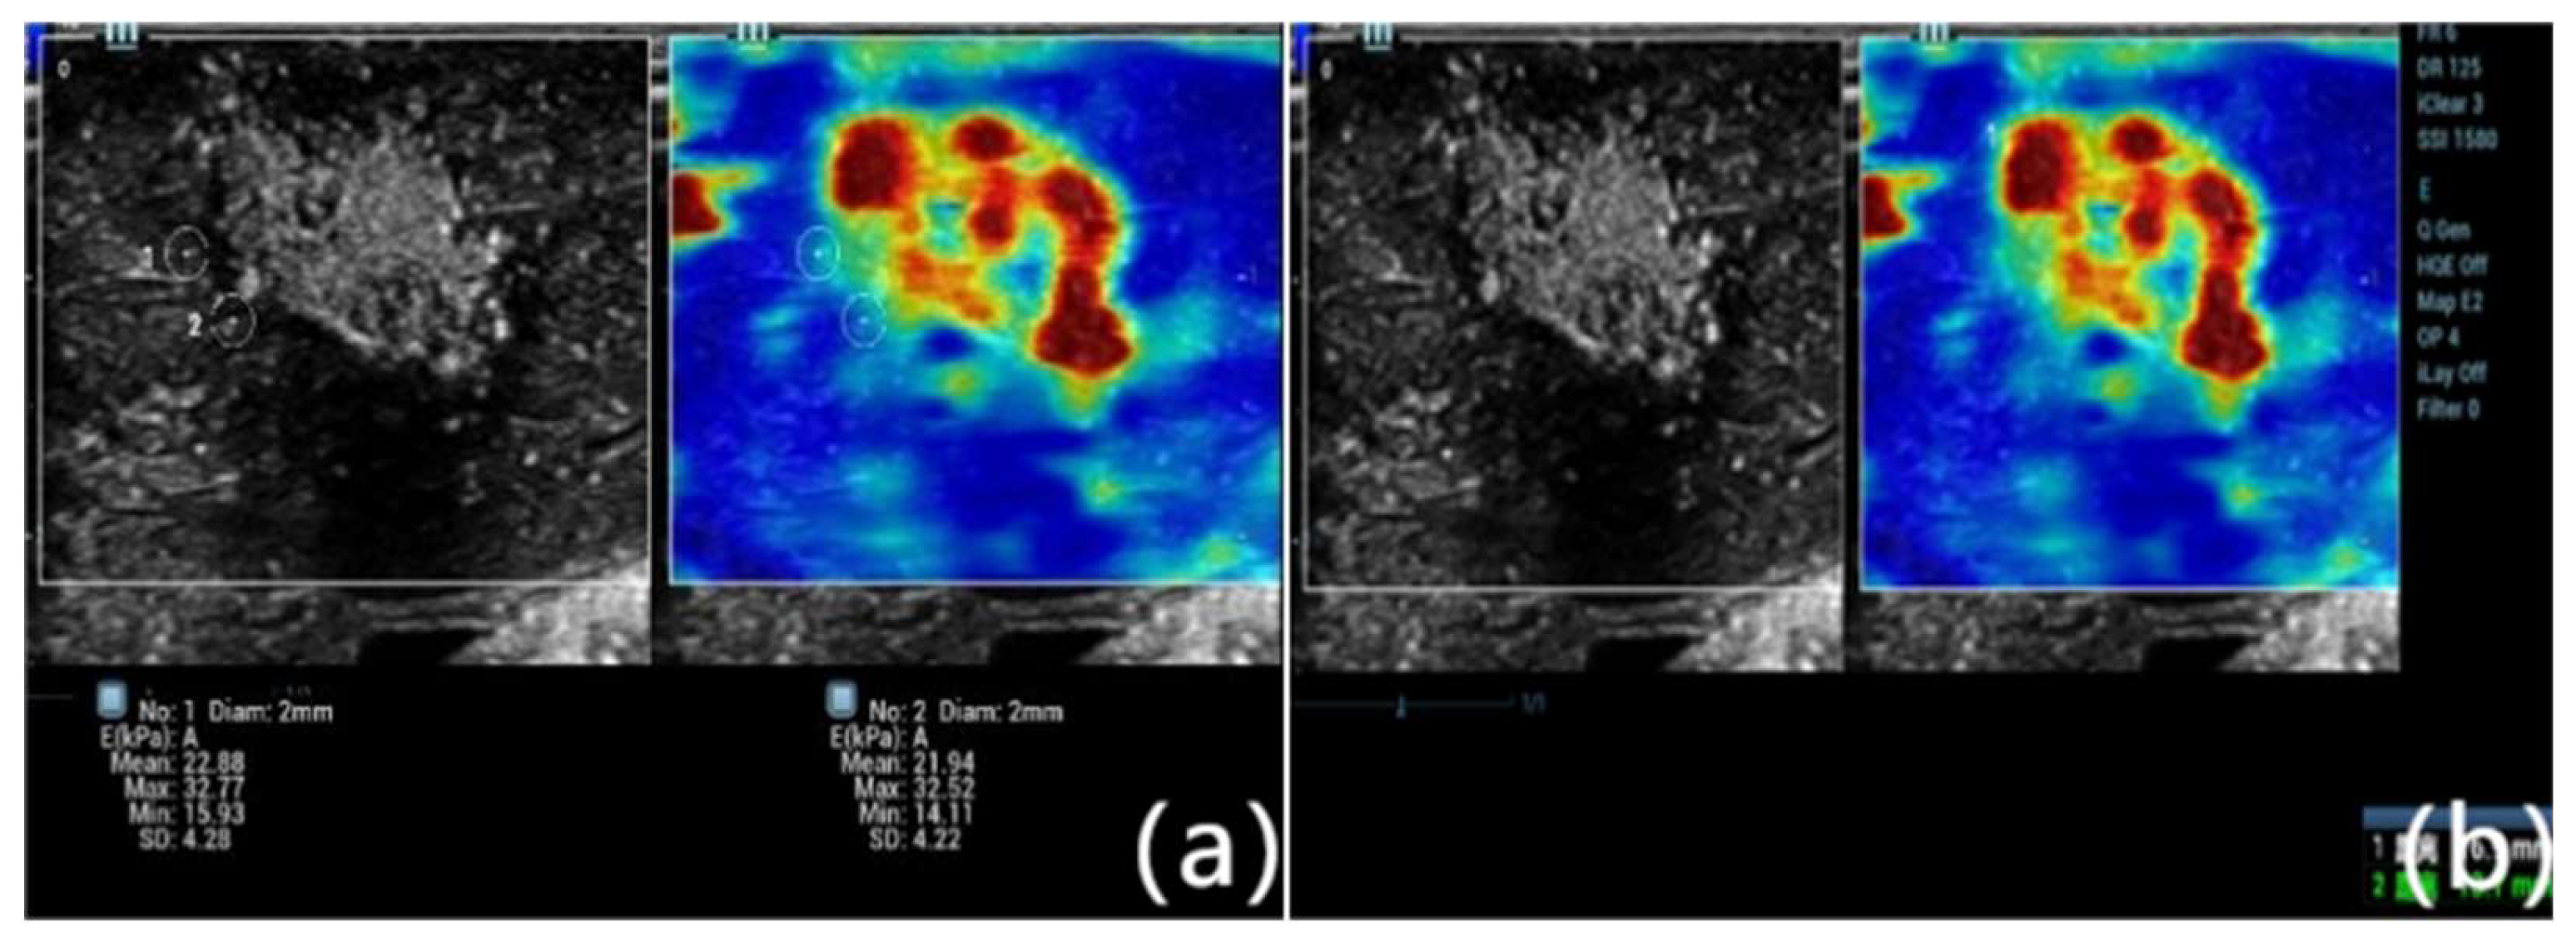
Figure 2.
Receiver operating characteristic (ROC) curve of SWE-mean values measured at point b (ablation edge) immediately post-procedure. Histopathological confirmation of coagulative necrosis was used as the diagnostic gold standard. The area under the curve (AUC) was 0.828, indicating good discriminatory performance. The optimal cutoff for identifying ablation boundaries was 22.31 kPa, yielding a sensitivity of 81.6% and specificity of 78.9%. This threshold value may be clinically relevant for determining real-time completeness of ablation using SWE.
Histopathological and Biochemical Correlation
Hematoxylin and eosin (HE) staining confirmed ablation-induced tissue injury. Point a exhibited complete coagulative necrosis with loss of cellular structure. Point b showed a transitional zone of partial necrosis and peripheral oedema, while point c maintained normal hepatic architecture (Figure 3).
Nicotinamide adenine dinucleotide (NADH) tetrazolium reductase staining revealed a spatial gradient in tissue viability. Post-ablation, NADH-positive granule counts, and integrated optical density (IOD) were significantly lower at points a and b compared to point c (P < 0.001; Table 2 and Table 3). Between-group comparisons showed no significant differences in NADH metrics at the lesion boundary (point b), further supporting procedural consistency.
Pearson correlation analysis revealed strong negative associations between SWE-mean values and NADH-positive granules (r = –0.733, P < 0.001), as well as between SWE-mean and IOD (r = –0.701, P < 0.001; Figure 4). These findings confirm that increased tissue stiffness detected by SWE corresponds to increased cellular necrosis and reduced metabolic activity14-16.
Comparison of SWE and CEUS Measurements
Lesion dimensions assessed by SWE and CEUS were compared against gross pathology. In Group A, transverse and vertical lesion diameters on gross specimens were 16.86 ± 3.15 mm and 11.25 ± 1.19 mm, respectively. SWE-based measurements were 16.73 ± 2.97 mm and 11.51 ± 1.43 mm, while CEUS measurements were 17.09 ± 3.25 mm and 11.17 ± 1.47 mm. No statistically significant differences were found among the three methods (P > 0.05).
In Group B, gross dimensions were 20.47 ± 2.85 mm (transverse) and 14.04 ± 2.03 mm (vertical). SWE measured 21.29 ± 3.87 mm and 13.63 ± 2.69 mm, while CEUS reported 20.76 ± 3.10 mm and 14.05 ± 2.59 mm. Again, no significant differences were observed (P > 0.05; Table 4). These results demonstrate the consistency and accuracy of SWE in evaluating ablation dimensions compared with CEUS and gross pathology (Figure 5).
Figures, Tables and Schemes
Quantitative comparison of SWE-mean values at points a (center), b (edge), and c (normal parenchyma) before and after microwave ablation in Group A (30 W, 45 s) and Group B (35 W, 1 min). Both groups showed statistically significant increases in SWE-mean values at points a and b post-ablation (P < 0.001), consistent with thermal coagulation necrosis. No significant difference was observed at point c, suggesting localized thermal effects. Between-group comparison showed that Group B had a significantly higher SWE-mean at point a, but not at point b. This suggests consistent stiffness at the lesion boundary across power settings. Note: point a: ablation stove center; point b: ablation stove edge; point c: normal unablated liver 5 mm beyond the edge of the ablation focus. * Compared with the same group before ablation, P<0.001. # Compared with group A after ablation, P<0.001; the same as Table 2 and Table 3. ±s stands for standard deviation.
4. Discussion
Microwave ablation (MWA) is increasingly used in clinical practice as a minimally invasive treatment for hepatocellular carcinoma (HCC), especially in patients who are not candidates for surgical resection due to underlying liver disease or poor hepatic reserve18. Ensuring complete ablation with adequate margins is critical for reducing local recurrence. In current practice, contrast-enhanced ultrasonography (CEUS) serves as the intraoperative imaging standard for evaluating the extent of ablation. However, CEUS is semi-invasive, requires the use of contrast agents, and is sometimes limited by artifacts such as gas interference generated during ablation 6, 7, 9.
Shear wave elastography (SWE), a contrast-free ultrasound technique, has emerged as a promising alternative for real-time tissue characterization based on mechanical stiffness. Its diagnostic value has been demonstrated in assessing liver fibrosis, tumor stiffness, and, more recently, ablation zones19-24. Although ex vivo studies have reported SWE’s potential for delineating ablation margins and identifying thermal coagulation necrosis9, 10 limited in vivo evidence exists on SWE’s performance immediately following MWA.
In this study, SWE-mean values increased significantly at the lesion center and edge after MWA, while values in the surrounding normal parenchyma remained unchanged. The spatial stiffness gradient observed—from the center of the ablation lesion (point a) to the edge (point b), and further to the non-ablated liver (point c)—was consistent across both ablation protocols (30 W/45 s and 35 W/60 s). These results agree with previous ex vivo work demonstrating similar gradients in tissue stiffness following thermal injury9, 10.
Importantly, our findings show that the SWE-mean value at the lesion boundary (point b) did not differ significantly between the two ablation protocols, suggesting that SWE reliably characterizes lesion margins regardless of thermal dose. Receiver operating characteristic (ROC) curve analysis identified an optimal SWE-mean threshold of 22.31 kPa for detecting coagulative necrosis at the ablation edge (AUC = 0.828), with high sensitivity (81.6%) and specificity (78.9%). This threshold closely aligns with previously reported values in porcine models (≈22.5 kPa)9, 10 supporting the potential generalizability of this cutoff.
Histological evaluation further validated SWE findings. Hematoxylin and eosin (HE) staining confirmed distinct zones of necrosis, transitional damage, and normal tissue. NADH tetrazolium reductase staining, a more sensitive marker for tissue viability17, revealed a decrease in granule count and optical density from the ablation centre to the periphery. The SWE-mean values correlated strongly and negatively with both NADH granule counts (r = –0.733) and integrated optical density (IOD; r = –0.701), confirming that increasing tissue stiffness reflects increasing thermal damage at the cellular level.
Moreover, SWE measurements of lesion size were comparable to those obtained via CEUS and gross pathology. No significant differences were observed across modalities in either group, indicating that SWE offers similar accuracy in defining ablation dimensions. These findings reinforce the feasibility of using SWE as a standalone, real-time modality for intraoperative assessment of MWA efficacy.
Taken together, our results suggest that SWE can serve as a robust, non-invasive imaging alternative to CEUS for delineating MWA lesions. SWE eliminates the need for contrast agents and is particularly useful in cases where CEUS is contraindicated or not readily available. Additionally, SWE’s high reproducibility and operator-independence may support its broader adoption in clinical ablation workflows.
Limitations
This study has several limitations. First, experiments were conducted in normal rabbit liver tissue, which does not fully replicate the mechanical and biological properties of fibrotic or tumor-bearing human liver. The SWE-mean threshold identified here may differ in cirrhotic or cancerous tissue. Second, the study was limited to an animal model; future human studies are required to validate these findings in clinical settings. Finally, although SWE demonstrated strong correlation with histology and CEUS, further work is needed to evaluate inter-operator variability and technical reproducibility across devices.
5. Conclusions
SWE accurately quantifies changes in liver tissue stiffness following microwave ablation and correlates well with histological markers of necrosis. An SWE-mean threshold of 22.31 kPa reliably identifies the boundary of coagulative necrosis. SWE measurements are comparable to CEUS and gross pathology in determining ablation zone size. These findings support the potential of SWE as a contrast-free, real-time imaging modality for intraoperative monitoring of liver ablation procedures.
Author Contributions
Z. Z., Y. F were responsible for the study design. Z. Z.,J. Z; implemented the research. Z. Z., Y. F., J. Z conceived the experiments. Z. Z.,J. Z; conducted the experiments. Z. Z.,J. Z. analysed the results. Z.L. and J.L. wrote the main manuscript text and prepared the figures. All authors reviewed the manuscript. All authors have read and agreed to the published version of the manuscript.
Funding
This research received no external funding.
Institutional Review Board Statement
The study was conducted in accordance with the Animal Care and Use Committee of the Xiangya School of Medicine, Affiliated Haikou Hospital of Central South University, and adhered to the guidelines outlined in the National Institutes of Health Guide for the Care and Use of Laboratory Animals.
Informed Consent Statement
Not applicable.
Data Availability Statement
The raw data supporting the conclusions of this article will be made available by the authors on request.
Acknowledgments
None.
Conflicts of Interest
The authors declare no conflicts of interest.
Abbreviations
The following abbreviations are used in this manuscript:
| AUC | Area Under the Curve |
| CEUS | Contrast-Enhanced Ultrasonography |
| HCC | Hepatocellular Carcinoma |
| HE | Hematoxylin and Eosin |
| IOD | Integrated Optical Density |
| kPa | Kilopascals |
| MI | Mechanical Index |
| MWA | Microwave Ablation |
| NADH | Nicotinamide Adenine Dinucleotide |
| ROC | Receiver Operating Characteristic |
| ROI | Region of Interest |
| SWE | Shear Wave Elastography |
References
- Ganesan, P.; Kulik, L. M. Hepatocellular Carcinoma: New Developments. Clin Liver Dis 2023, 27, 85–102. [Google Scholar] [CrossRef]
- Bray, F.; Laversanne, M.; Sung, H.; Ferlay, J.; Siegel, R. L.; Soerjomataram, I.; Jemal, A. Global cancer statistics 2022: GLOBOCAN estimates of incidence and mortality worldwide for 36 cancers in 185 countries. CA Cancer J Clin 2024, 74, 229–263. [Google Scholar] [CrossRef]
- Takahashi, H.; Berber, E. Role of thermal ablation in the management of colorectal liver metastasis. Hepatobiliary Surg Nutr 2020, 9, 49–58. [Google Scholar] [CrossRef]
- Zhou, J.; Sun, H.; Wang, Z.; Cong, W.; Zeng, M.; Zhou, W.; Bie, P.; Liu, L.; Wen, T.; Kuang, M.; et al. Guidelines for the Diagnosis and Treatment of Primary Liver Cancer (2022 Edition). Liver Cancer 2023, 12, 405–444. [Google Scholar] [CrossRef]
- Yin, H. H.; Wen, R.; Lin, P.; Yang, H.; Hu, M.; Yang, H. Ultrasound-guided microwave ablation of soft tissue venous malformations. J Vasc Surg Venous Lymphat Disord 2023, 11, 605–609. [Google Scholar] [CrossRef]
- Lekht, I.; Gulati, M.; Nayyar, M.; Katz, M. D.; Ter-Oganesyan, R.; Marx, M.; Cen, S. Y.; Grant, E. Role of contrast-enhanced ultrasound (CEUS) in evaluation of thermal ablation zone. Abdom Radiol (NY) 2016, 41, 1511–1521. [Google Scholar] [CrossRef]
- Dietrich, C. F.; Nolsoe, C. P.; Barr, R. G.; Berzigotti, A.; Burns, P. N.; Cantisani, V.; Chammas, M. C.; Chaubal, N.; Choi, B. I.; Clevert, D. A.; et al. Guidelines and Good Clinical Practice Recommendations for Contrast-Enhanced Ultrasound (CEUS) in the Liver-Update 2020 WFUMB in Cooperation with EFSUMB, AFSUMB, AIUM, and FLAUS. Ultrasound Med Biol 2020, 46, 2579–2604. [Google Scholar] [CrossRef]
- Zheng, S. G.; Xu, H. X.; Liu, L. N. Management of hepatocellular carcinoma: The role of contrast-enhanced ultrasound. World J Radiol 2014, 6, 7–14. [Google Scholar] [CrossRef]
- Luo, C.; Li, T.; Li, Z.; Zuo, Y.; He, G.; Lin, J.; Liu, G.; Dai, L. Evaluation of Microwave Ablation Efficacy by Strain Elastography and Shear Wave Elastography in ex Vivo Porcine Liver. Ultrasound Med Biol 2021, 47, 2636–2645. [Google Scholar] [CrossRef]
- Luo, C.; Lin, J.; Liu, G.; He, G.; Zuo, Y.; Dai, L.; Li, T. Preliminary Exploration on the Value of Shear Wave Elastography in Evaluating the Effectiveness of Microwave Ablation on Hepatic Malignancies. Ultrasound Q 2022, 38, 160–164. [Google Scholar] [CrossRef]
- Brewer, N. R. Biology of the rabbit. J Am Assoc Lab Anim Sci 2006, 45, 8–24. [Google Scholar]
- Obuchowski, N. A. ROC analysis. AJR Am J Roentgenol 2005, 184, 364–372. [Google Scholar] [CrossRef]
- Bayne, K. Revised Guide for the Care and Use of Laboratory Animals available. American Physiological Society. Physiologist 1996, 39, 199–208. [Google Scholar]
- Bedewi, M. A.; Alhariqi, B. A.; Aldossary, N. M.; Gaballah, A. H.; Sandougah, K. J. Shear wave elastography of the scalene muscles in healthy adults: A preliminary study. Medicine (Baltimore) 2021, 100, e26891. [Google Scholar] [CrossRef]
- Bedewi, M. A.; Elsifey, A. A.; Alfaifi, T.; Kotb, M. A.; Abdelgawad, M. S.; Bediwy, A. M.; Swify, S. M.; Awad, E. M. Shear wave elastography of the tibial nerve in healthy subjects. Medicine (Baltimore) 2021, 100, e23999. [Google Scholar] [CrossRef]
- Bedewi, M. A.; Elsifey, A. A.; Alfaifi, T.; Saleh, A. K.; Swify, S. M.; Sandougah, K. J. Shearwave elastography of the Sartorius muscle. Medicine (Baltimore) 2021, 100, e25196. [Google Scholar] [CrossRef]
- (17) Liu, D. Q.; Lu, M. D.; Tan, J. F.; Wang, Z.; Zhou, Z. X. [Microwave coagulation at different temperatures for hepatocellular carcinoma management: efficacy evaluation by enzyme histochemical staining]. Nan Fang Yi Ke Da Xue Xue Bao 2006, 26, 1149–1151. [Google Scholar]
- European Association for the Study of the, L. EASL Clinical Practice Guidelines: Management of hepatocellular carcinoma. J Hepatol 2018, 69, 182–236. [Google Scholar] [CrossRef]
- Yoo, J.; Seo, B. K.; Park, E. K.; Kwon, M.; Jeong, H.; Cho, K. R.; Woo, O. H.; Song, S. E.; Cha, J. Tumor stiffness measured by shear wave elastography correlates with tumor hypoxia as well as histologic biomarkers in breast cancer. Cancer Imaging 2020, 20, 85. [Google Scholar] [CrossRef] [PubMed]
- Kim, J. Y.; Kim, J. J.; Hwangbo, L.; Suh, H. B.; Lee, J. W.; Lee, N. K.; Choo, K. S.; Kim, S. Tumor stiffness measured by shear-wave elastography: association with disease-free survival in women with early-stage breast cancer. Br J Radiol 2021, 94, 20210584. [Google Scholar] [CrossRef] [PubMed]
- Farrokh, A.; Maass, N.; Treu, L.; Heilmann, T.; Schafer, F. K. Accuracy of tumor size measurement: comparison of B-mode ultrasound, strain elastography, and 2D and 3D shear wave elastography with histopathological lesion size. Acta Radiol 2019, 60, 451–458. [Google Scholar] [CrossRef] [PubMed]
- Alawaji, G.; Alhothali, W.; Albakr, A.; Amer, A.; Al-Habib, A.; Ajlan, A. Shear wave elastography for intracranial epidermoid tumors. Clin Neurol Neurosurg 2021, 207, 106531. [Google Scholar] [CrossRef] [PubMed]
- Fang, C.; Lim, A.; Sidhu, P. S. Ultrasound-based liver elastography in the assessment of fibrosis. Clin Radiol 2020, 75, 822–831. [Google Scholar] [CrossRef] [PubMed]
- Fang, C.; Sidhu, P. S. Ultrasound-based liver elastography: current results and future perspectives. Abdom Radiol (NY) 2020, 45, 3463–3472. [Google Scholar] [CrossRef]
25. Disclaimer/Publisher’s Note: The statements, opinions and data contained in all publications are solely those of the individual author(s) and contributor(s) and not of MDPI and/or the editor(s). MDPI and/or the editor(s) disclaim responsibility for any injury to people or property resulting from any ideas, methods, instructions or products referred to in the content. |
Figure 3.
Histological images of ablation lesions from rabbit liver stained with hematoxylin and eosin (HE) at 200× magnification. Point a (central lesion zone) shows complete coagulative necrosis with loss of cellular detail. Point b (ablation edge) demonstrates partial coagulation necrosis and perilesional hyperemic edema, forming the transition zone. Point c (5 mm beyond lesion margin) displays normal hepatic architecture. These spatial zones correlate with the elastographic measurements and reflect distinct pathological responses to thermal injury.
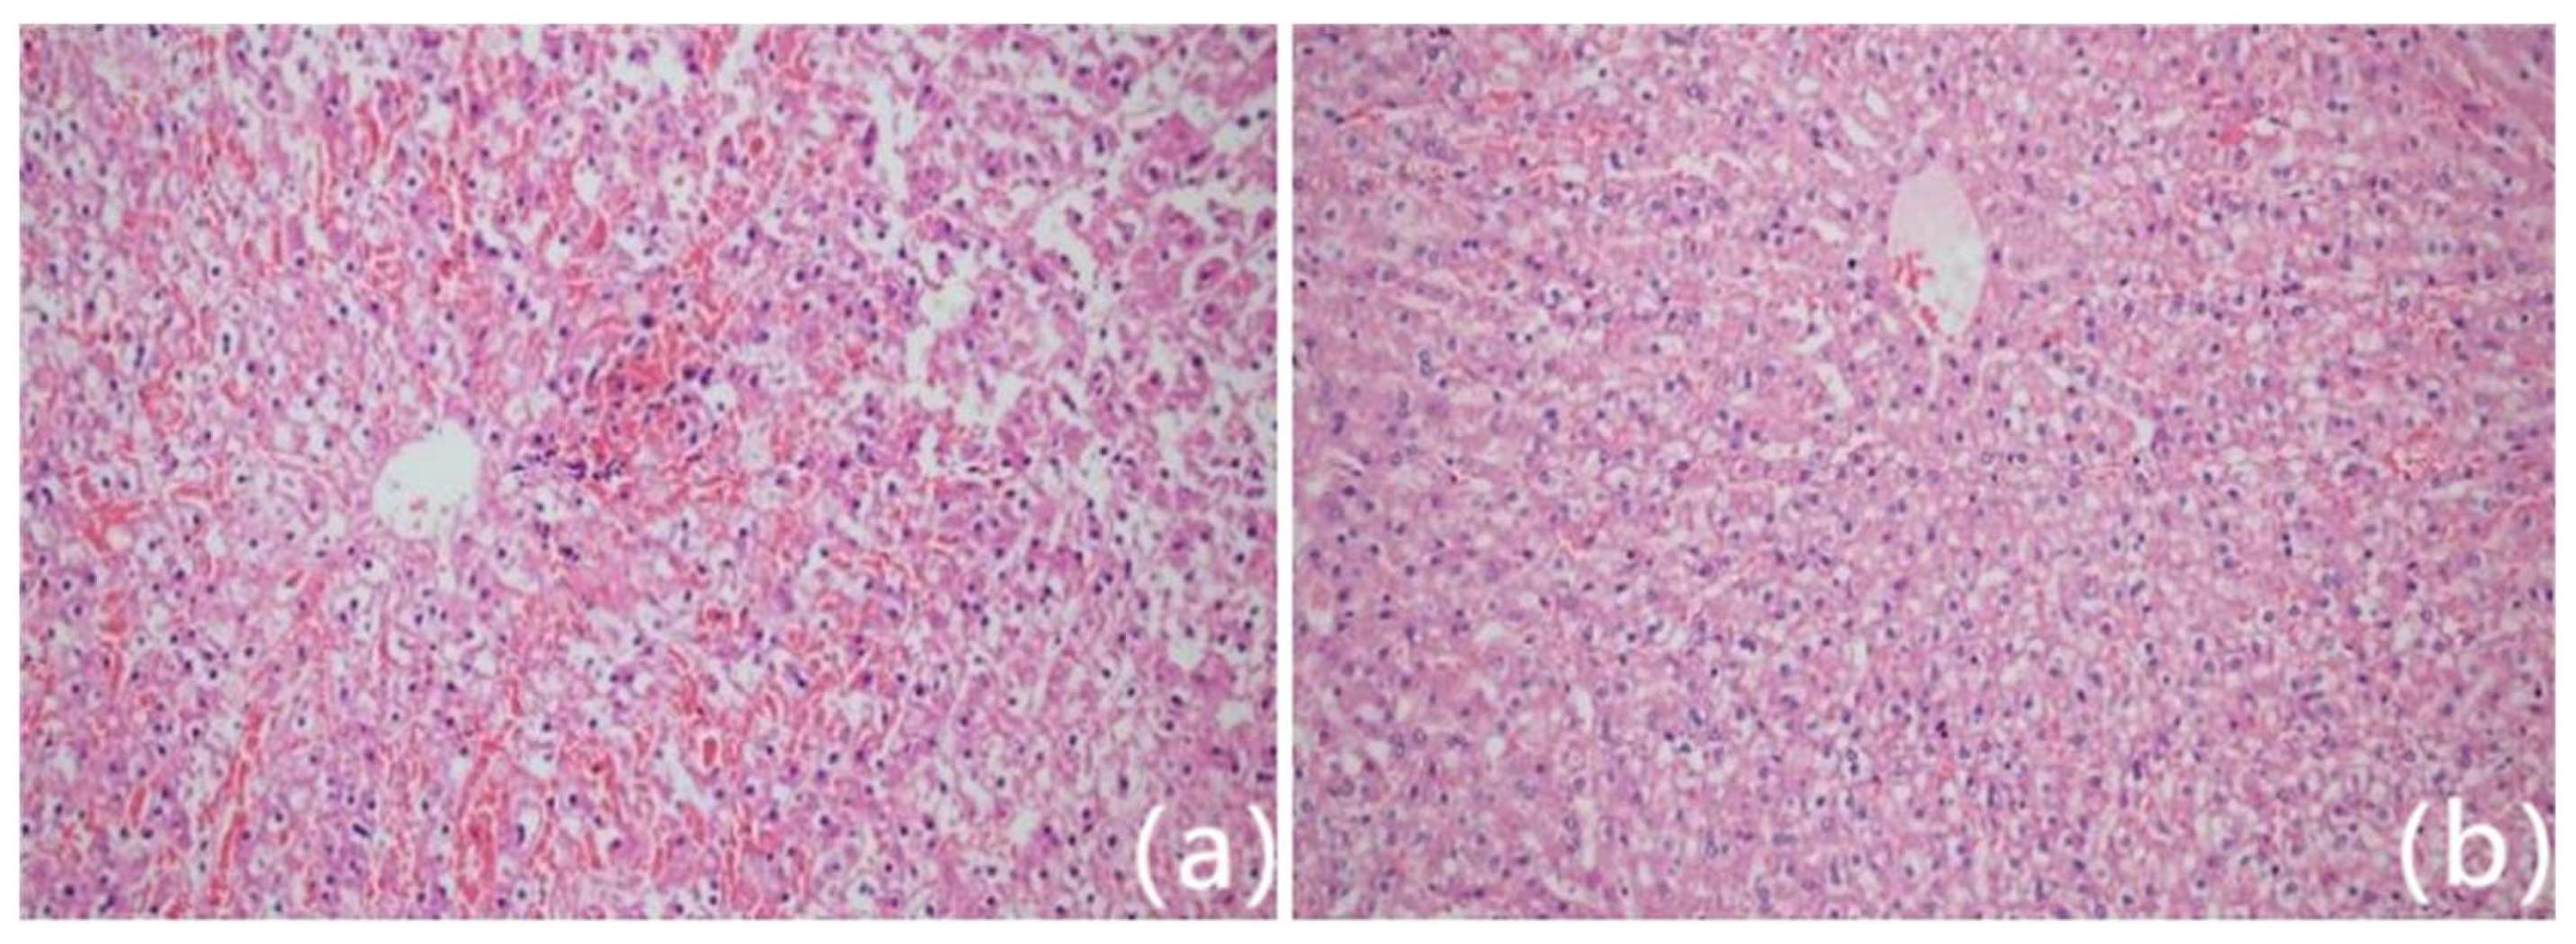
Figure 4.
Scatter plots demonstrating the inverse relationship between tissue stiffness (SWE-mean) and biochemical markers of cell viability. (A) Correlation between SWE-mean and NADH xanthine oxidase-positive granule count (r = –0.733, P < 0.001). (B) Correlation between SWE-mean and integrated optical density (IOD) from NADH-stained tissue sections (r = –0.701, P < 0.001). The negative correlations confirm that higher stiffness measured via SWE is associated with greater tissue necrosis and reduced metabolic activity.
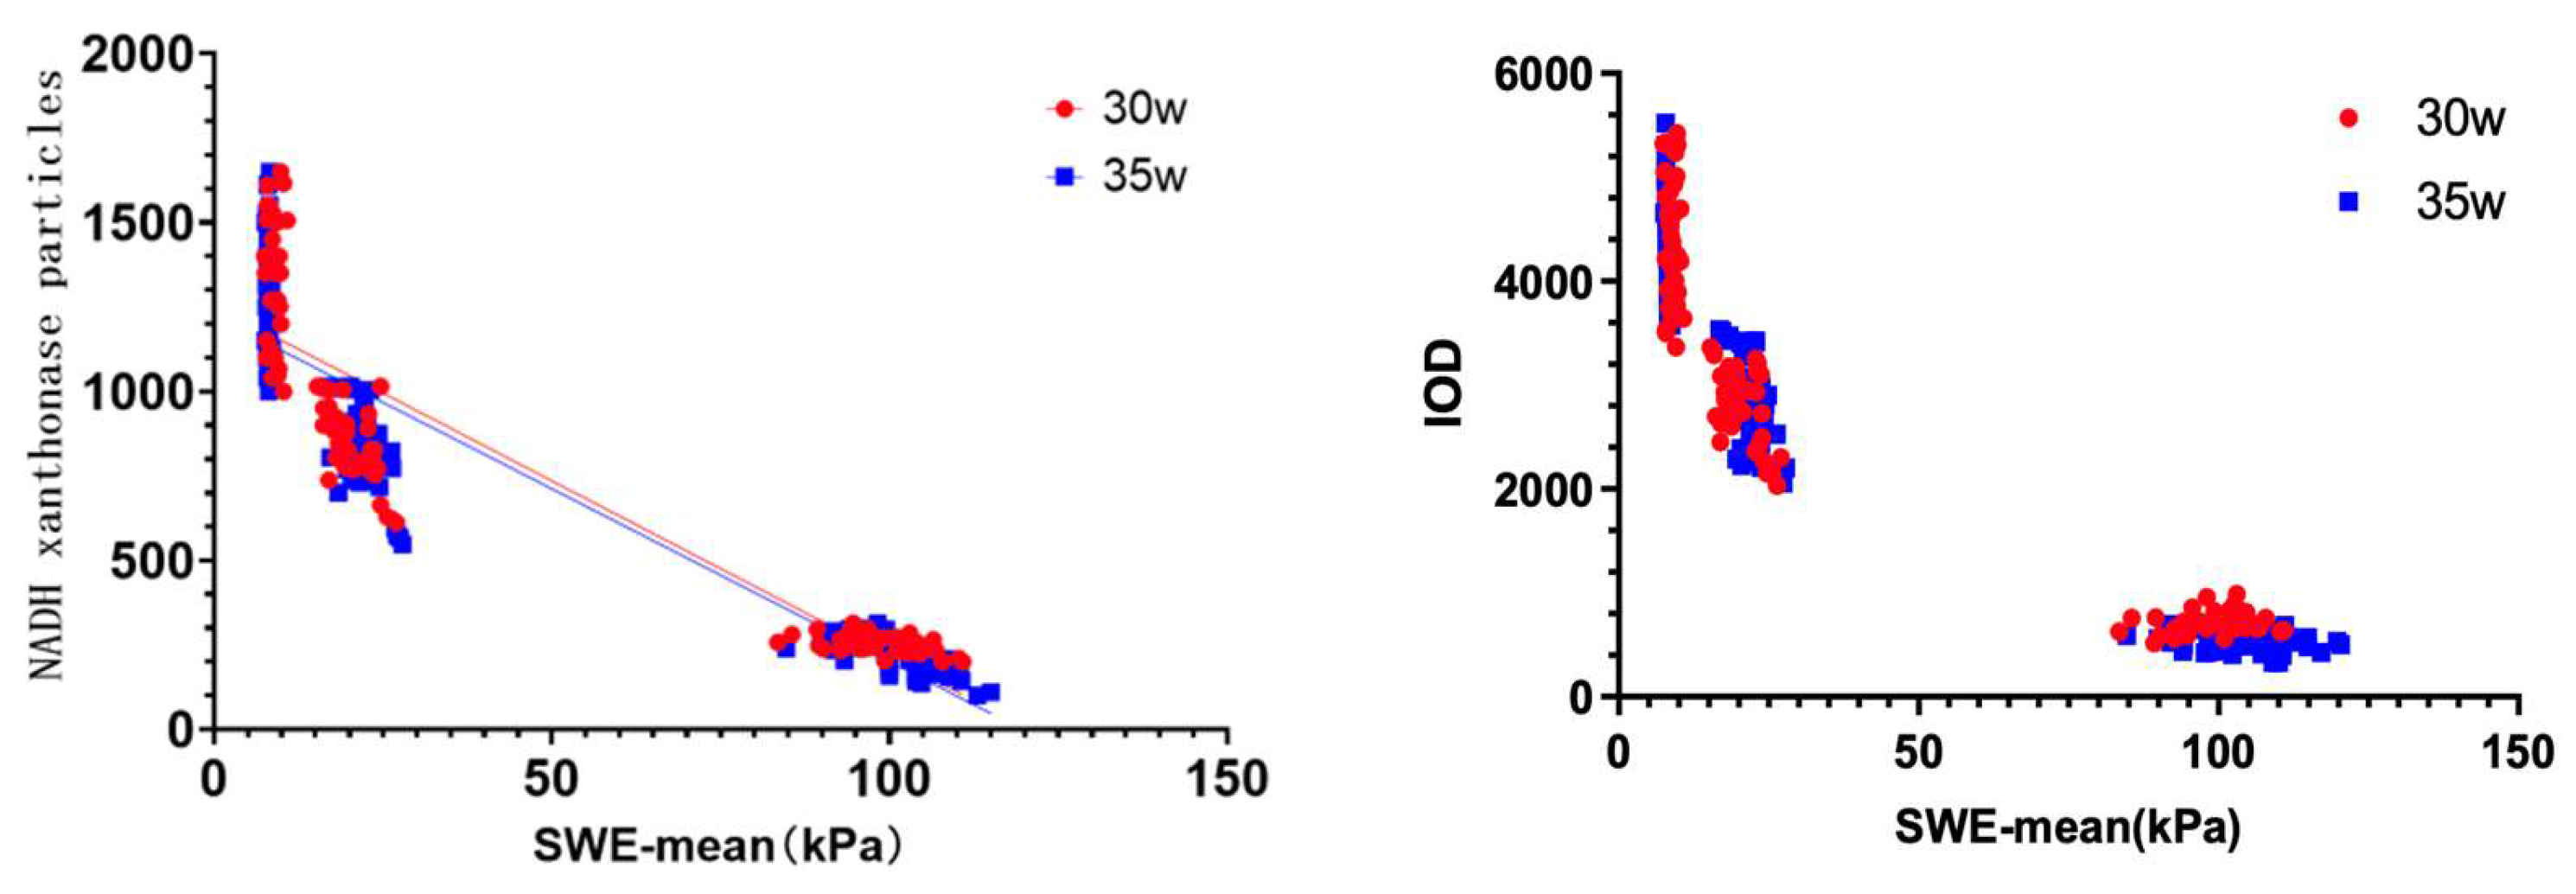
Figure 5.
Comparison of lesion size measurements using three modalities. (A) SWE-mode showing transverse and vertical diameters of the ablation zone based on elasticity contrast. (B) CEUS-mode depicting the non-perfused area within the lesion, used to delineate the ablation extent. (C) Gross pathological specimen after surgical excision and sectioning along the largest radial axis under ultrasound guidance. Measurements across modalities showed high concordance, supporting the validity of SWE as a non-invasive alternative to CEUS in intraoperative assessment. (D) Close-up of gross pathological specimen after surgical excision, clearly showing the ablation lesion's characteristics, including tissue discoloration and coagulative changes. The lesion size measurement obtained during pathology closely correlates with measurements acquired via ultrasound imaging modalities, further validating the accuracy of SWE and CEUS in delineating ablation extents.
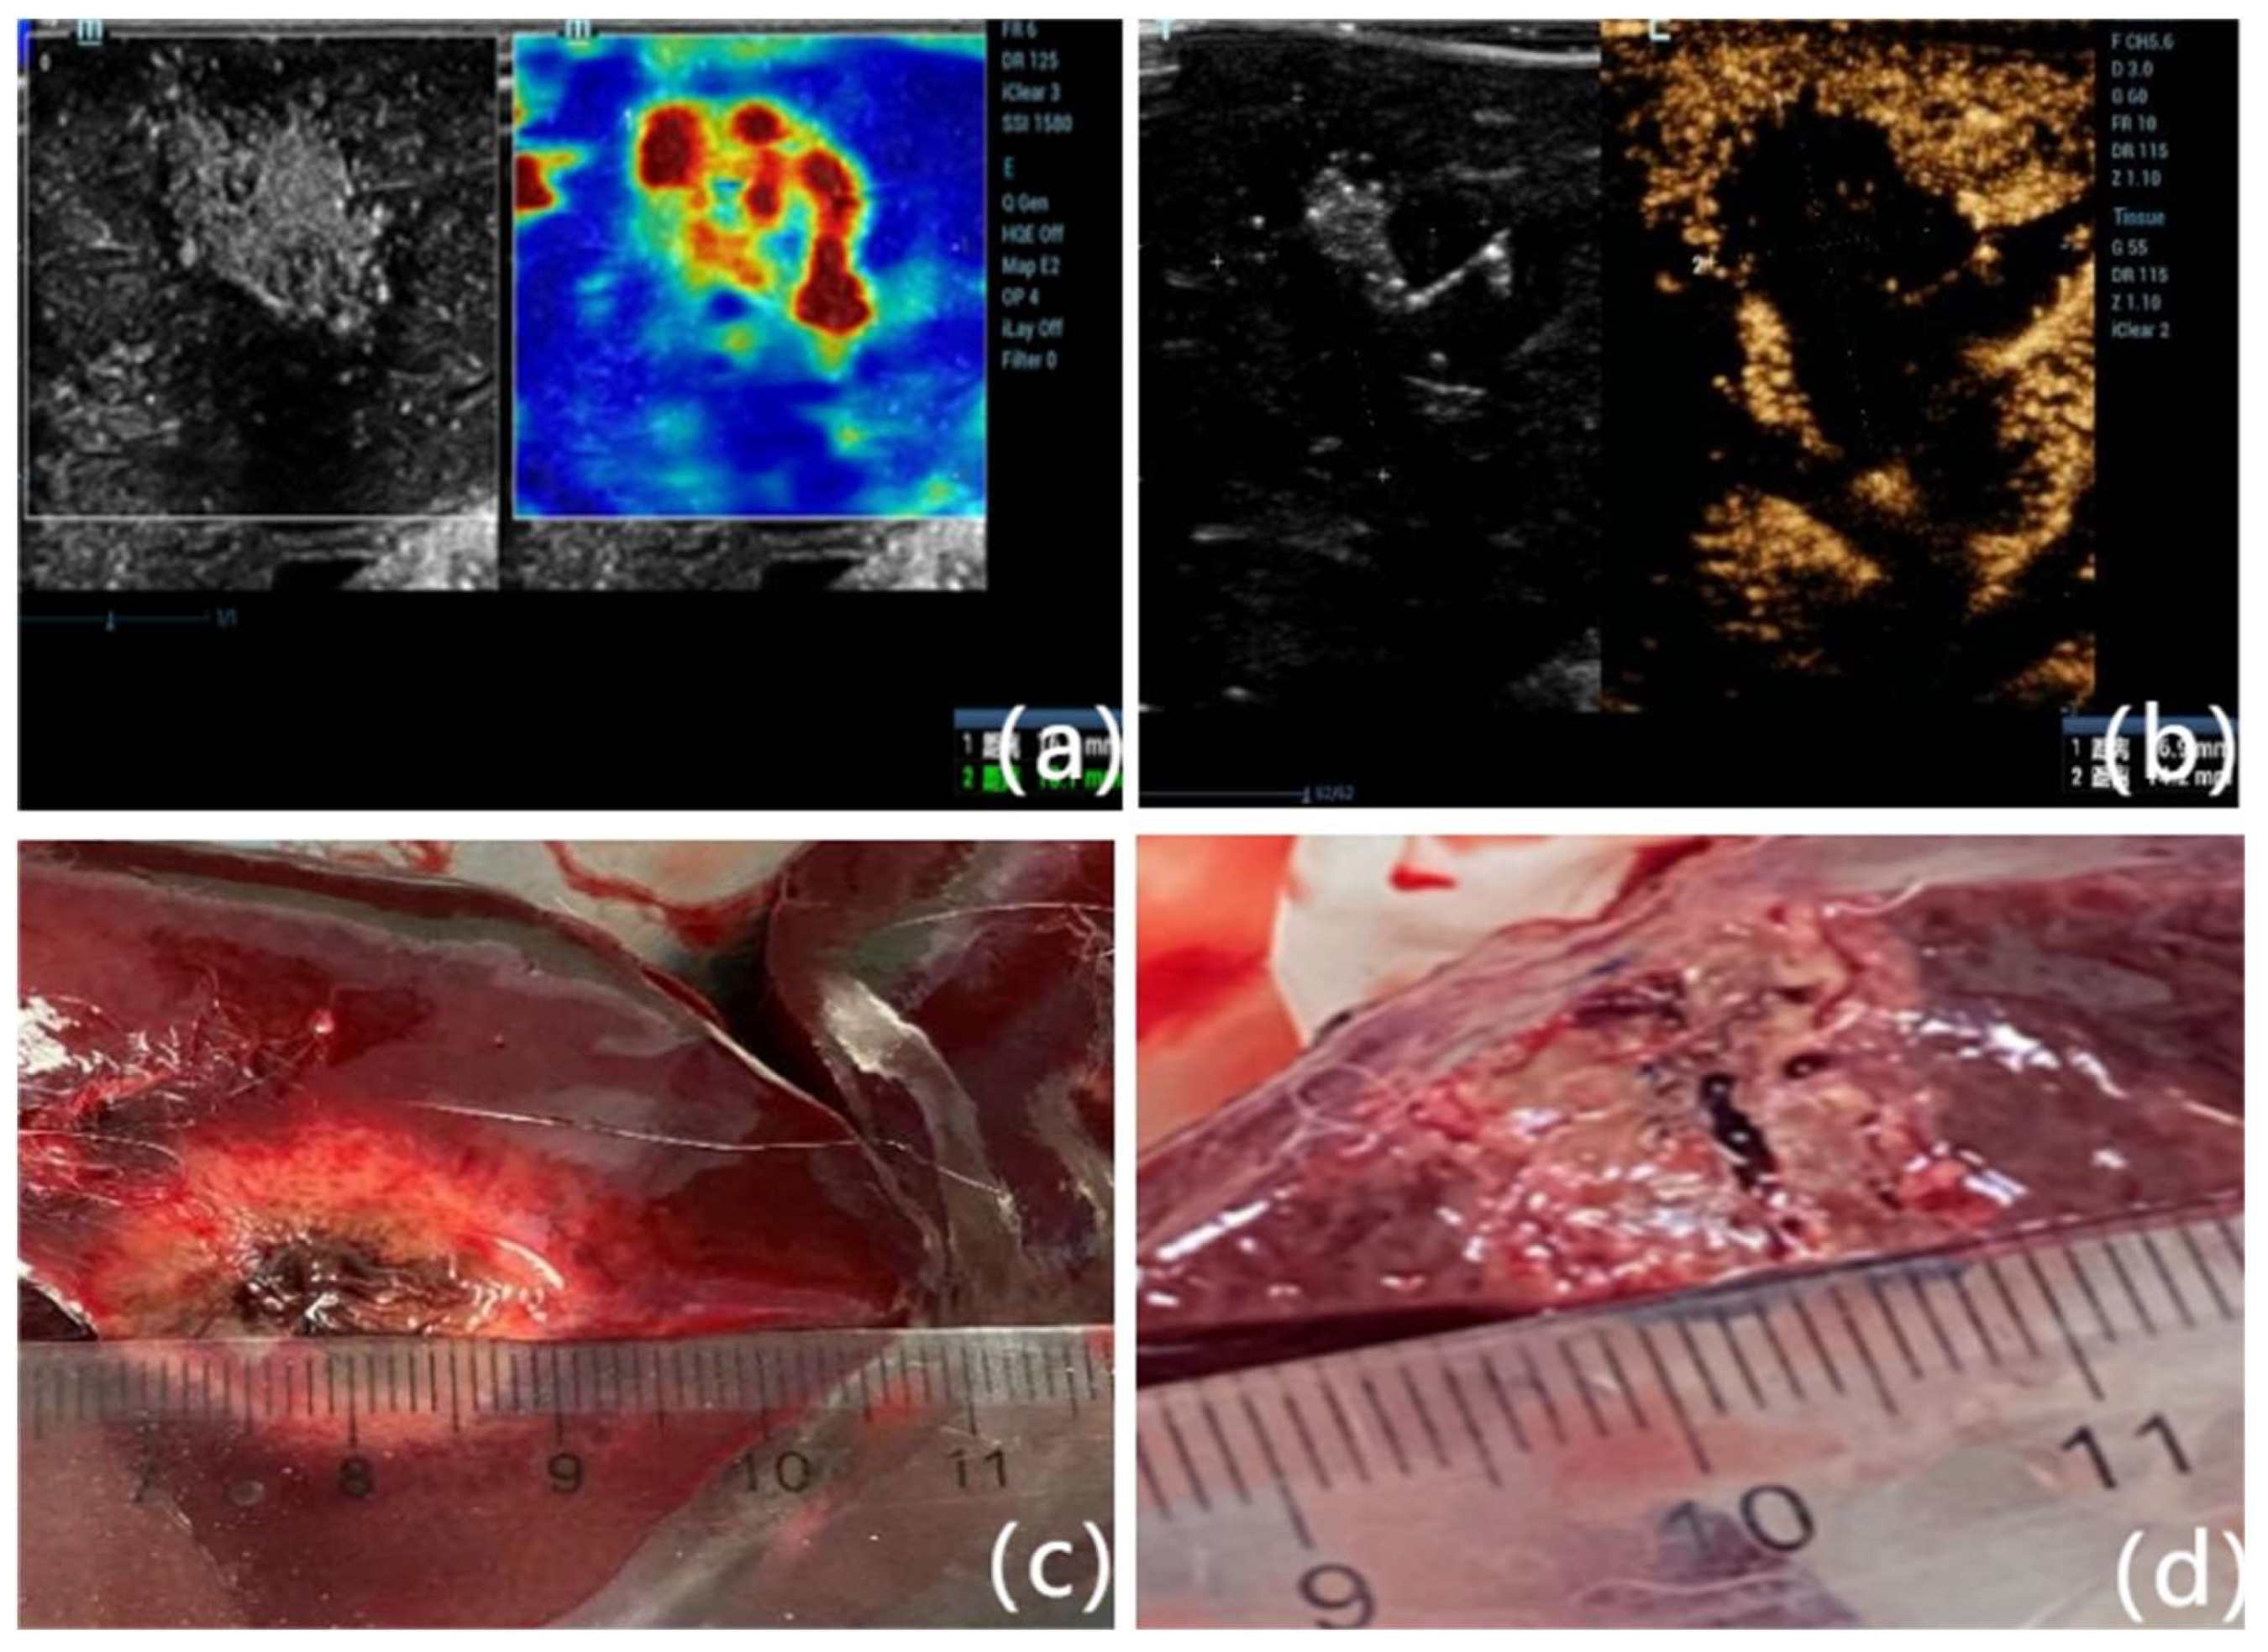

Table 1.
Comparison of elasticity of each point before and after ablation.
| Groups | No. of cases | Variables | Point a | Point b | Point c | p value |
| Group A (30 W, 45 s) |
38 | Before ablation (kPa, ±s) | 8.02±0.26 | 8.09±0.35 | 8.05±0.45 | 0.694 |
| After ablation (kPa, ±s) | 98.70±6.58* | 20.52±3.34* | 8.35±0.83 | <0.001 | ||
| Group B (35 W, 1 min) |
52 | Before ablation (kPa, ±s) | 8.02±0.13 | 8.04±0.17 | 8.07±0.15 | 0.550 |
| After ablation (kPa, ±s) | 103.64±8.21*# | 22.27±2.55* | 8.61±0.23 | <0.001 |
Table 2.
Comparison of NADH xanthine oxidase granule expression at points a, b, and c before and after ablation in Groups A and B. Postoperative reductions in granule counts at points a and b were significant (P < 0.001), indicating tissue necrosis. Point c values remained stable, confirming preservation of normal parenchyma. Group B showed a more pronounced reduction in granule count at the lesion center compared to Group A, reflecting increased thermal dose.
| Groups | No. of cases | Variables | Point a | Point b | Point c | p value |
| Group A (30 W, 45 s) |
38 | Before ablation (kPa, ±s) | 1361.31±315.03 | 1386.5±284.51 | 1384.3±298.39 | 0.921 |
| After ablation (kPa, ±s) | 258.05±24.84* | 750.77±114.73* | 1352.85±286.61 | <0.001 | ||
| Group B (35 W, 1 min) |
52 | Before ablation (kPa, ±s) | 1372.05±329.83 | 1353.43±293.57 | 1383.99±271.68 | 0.871 |
| After ablation (kPa, ±s) | 175.61±22.63*# | 749.94±109.17* | 1349.81±339.27 | <0.001 |
Table 3.
Integrated optical density (IOD) values derived from NADH-stained tissue sections at points a, b, and c in Groups A and B, pre- and post-ablation. IOD values significantly decreased at points a and b after ablation (P < 0.001), in line with reduced enzymatic activity due to cell death. No significant changes were observed at point c. Between-group comparisons revealed lower post-ablation IOD values at point a in Group B compared to Group A, suggesting more extensive coagulation necrosis with higher power/time parameters.
| Groups | No. of cases | Variables | Point a | Point b | Point c | p value |
| Group A (30 W, 45 s) |
38 | Before ablation ±s) |
4292.18 ±763.94 |
4307.39 ±899.07 |
4397.66 ±632.27 |
0.813 |
| After ablation ±s) |
710.87 ±106.98* |
2842.09 ±570.29* |
4303.59 ±717.37 |
<0.001 | ||
| Group B (35 W, 1 min) |
52 | Before ablation ±s) |
4313.64 ±727.87 |
4209.47 ±731.54 |
4363.22 ±770.53 |
0.562 |
| After ablation ±s) |
528.29 ±91.12*# |
2856.29 ±524.36* |
4307.95 ±785.92 |
<0.001 |
Table 4.
Comparison of ablation zone dimensions measured using gross pathology (specimen), shear wave elastography (SWE), and contrast-enhanced ultrasound (CEUS) in both Group A and Group B. Transverse and vertical lesion diameters measured by SWE and CEUS closely matched those of the excised specimens. No statistically significant differences were observed among the three methods (P > 0.05), indicating that SWE provides comparable spatial resolution to CEUS for evaluating thermal ablation zones.
| Method | Group A (30 W, 45 s) n=38 |
Group B (35 W, 1 min) n=52 |
||
| Transverse ±s) |
Vertical ±s) |
Transverse ±s) |
Vertical ±s) |
|
| Specimen measurement | 16.86±3.15 | 11.25±1.19 | 20.47±2.85 | 14.04±2.03 |
| SWE | 16.73±2.97 | 11.51±1.43 | 21.29±3.87 | 13.63±2.69 |
| CEUS | 17.09±3.25 | 11.17±1.47 | 20.76±3.10 | 14.05±2.59 |
| t value | 0.508 | 0.892 | 0.825 | 0.368 |
| P value | 0.603 | 0.412 | 0.440 | 0.693 |
Disclaimer/Publisher’s Note: The statements, opinions and data contained in all publications are solely those of the individual author(s) and contributor(s) and not of MDPI and/or the editor(s). MDPI and/or the editor(s) disclaim responsibility for any injury to people or property resulting from any ideas, methods, instructions or products referred to in the content. |
© 2025 by the authors. Licensee MDPI, Basel, Switzerland. This article is an open access article distributed under the terms and conditions of the Creative Commons Attribution (CC BY) license (https://creativecommons.org/licenses/by/4.0/).
Copyright: This open access article is published under a Creative Commons CC BY 4.0 license, which permit the free download, distribution, and reuse, provided that the author and preprint are cited in any reuse.


