

Submitted:
13 April 2025
Posted:
15 April 2025
You are already at the latest version
Abstract
Pedestrian panic behavior is a primary cause of overcrowding and stampede accidents in public micro-road network areas with high-density pedestrians. However, reliably detecting such behaviors remains challenging due to their inherent complexity, variability, and stochastic nature. Current detection models often rely on single-modality features, limiting their effectiveness in complex, dynamic crowd scenarios. To overcome these limitations, this study proposes a novel multimodal panic detection approach integrating crowd density mapping, pedestrian trajectory analysis, and semantic recognition. Specifically, crowd density maps are generated using a convolutional neural network (CDNet) to identify regions with abnormal density gradients via contour analysis. Within these potential panic zones, pedestrian trajectories are analyzed through LSTM networks to capture irregular movements such as counterflow and nonlinear wandering behaviors. Concurrently, semantic recognition based on Transformer models is utilized to identify verbal distress cues extracted through Baidu AI real-time speech-to-text conversion. These multi-modal features—spatial, temporal, and semantic—are systematically fused and weighted using an MLP-based feature fusion framework to achieve robust panic detection accuracy. Comprehensive experiments on the UCF Crowd dataset demonstrate that this proposed approach significantly outperforms state-of-the-art methods, achieving an accuracy of 91.7%. The proposed detection framework can technically support real-time crowd safety management further in high-density pedestrian scenarios, including significant public crowd-gathering activities, transportation hubs, and emergency evacuations.
Keywords:
pedestrian panic
; behavior detection
; density maps
; trajectory recognition
; semantic recognition
1. Introduction
In large-scale activities and daily transportation hubs, there are a great number of complex pedestrian channels limited by various isolation facilities, which form various micro-road networks to guide crowd movements. Understanding how pedestrians behave in micro-road networks is crucial to the safe crowd movement, as their abnormal behaviors can significantly impact evacuation efficiency and overall safety [1]. However, one of the most urgent challenges is identifying and managing pedestrian panic[2, 3], which can exacerbate the risk of injury or even fatalities during pedestrian crowd movement.
In general, most pedestrian stampede accidents in crowded micro-road networks have shown that pedestrian panic behavior is one of the main causes of overcrowding and stampedes. However, there is still a lack of mature and usable models for identifying panic behaviors because they are complex, variable, and stochastic[4]. Recent advancements in computer vision and sensor technologies have facilitated the development of crowd-monitoring systems[5, 6]. Traditional approaches, such as surveillance cameras and sensor-based tracking, have provided valuable insights into crowd behavior. Nevertheless, these methods often face limitations in real-time panic detection due to their reliance on sparse data, isolated analysis of crowd density, or lack of individual behavioral interpretation[7]. Detecting panic behaviors, such as sudden changes in movement patterns or the formation of dangerous density gradients, requires more sophisticated, multi-dimensional approaches that can capture individual and collective responses to perceived threats[8].
Several studies have investigated using density maps to assess crowd congestion and predict potential hazards[9, 10]. However, existing methods typically focus on spatial density without considering dynamic factors such as individual trajectories or semantic cues that may indicate distress. While trajectory analysis has been employed to study pedestrian movement[11], it is often disconnected from contextual interpretations of behavior. Some recent approaches have attempted to integrate social and psychological factors, such as speech analysis or sentiment detection [12, 13], but these remain underexplored in crowd panic.
To address this issue above, this study proposes a novel, data-driven framework that integrates multiple sources of information—density maps, contour-based analysis, trajectory recognition, and semantic interpretation—to identify and localize panic behaviors in moving crowds. By generating high-resolution density maps and analyzing their contour lines, we can identify regions of unusual density gradients likely to signal panic zones. In these zones, individual trajectories are analyzed to detect irregularities, such as sudden changes in direction or speed. Additionally, semantic recognition of verbal cues, enabled by speech-to-text conversion via the Baidu AI interface [14], enhances our ability to detect distress signals or panic-related language.
This proposed approach represents a significant advancement in crowd safety management, offering a more comprehensive and accurate method for detecting panic behaviors in real time. By integrating these diverse data sources, we provide a holistic view of crowd dynamics that accounts for spatial and behavioral factors, enabling timely and effective interventions in high-risk scenarios that occur in crowded micro-road networks.
The structure of this paper is constructed as follows: Section 0 reviews related work in the fields of crowd density and panic detection. Section 0 presents the methodology, including the data collection process and the integration of density maps, trajectory analysis, and semantic recognition. Section 0 discusses experimental results and evaluation. Finally, Section 0 concludes with a discussion of the potential applications of the proposed framework and directions for future research.
2. Related Work
2.1. Crowd Density and Movement Analysis
A micro road network refers to a network structure composed of passages or streets with different functions, levels, and locations (typically with widths ranging from 2.4m to 4.2m) in large event areas. These networks are formed with a certain density and appropriate layout. During events, such networks bear the burden of large crowds gathering and moving, posing significant risks of crowd congestion. Crowd density estimation remains one of the most employed approaches in crowd behavior analysis. Initial works in this area largely relied on crowd flow models and density maps to identify potential risks. For instance, Muhammad Asif K et al.[15] proposed a method for crowd density estimation that leveraged deep learning models to predict crowd congestion in real-time crowd density estimation, which was effective in detecting congestion in open spaces, but it failed to account for the behavioral nuances of crowd panic, such as sudden changes in movement patterns and emotional escalation that make it difficult to pick up the behavioral cues indicative of panic, which are often characterized by sudden, irregular movements and deviations from the general flow of the crowd [16]. Similarly, Alashban et al. [17] introduced a method using convolutional neural networks (CNNs) for estimating crowd density, achieving promising results in detecting crowded areas. However, their model could not assess sudden shifts in behavior that could signal an emergency or panic situation.
2.1. Panic Behavior Detection
In contrast to density-based methods, some researchers have explored the role of individual behaviors in identifying crowd panic. Zhao et al. [18] incorporated trajectory analysis to track individual movements and detect deviations from normal crowd behavior. Their approach successfully identified individuals who began moving erratically or in the opposite direction of the crowd flow, a key indicator of panic. However, trajectory analysis is often limited by the challenge of occlusions and the inability to track individuals in very dense crowds, where individuals may become difficult to distinguish due to visual clutter [19].
Building upon this, Xie et al.[20] proposed a multi-agent model for crowd panic detection that combined trajectory data with crowd density maps. Their model could track individual panic behavior by examining trajectory irregularities, such as increased speed or erratic movement patterns. Although this approach showed promise in simulated environments, it faced challenges when implemented in real-world scenarios, where sensor data can be noisy or incomplete.
In recent years, the integration of semantic understanding has emerged as a promising direction in panic detection. Sen et al.[21] utilized AI-driven natural language processing (NLP) techniques to identify distress signals through spoken language during crowd events. The method combined video analysis with speech-to-text algorithms to detect panic-related communication, significantly enhancing predictive performance of panic behaviors. However, this approach requires additional computational resources for processing and analyzing speech, which may not always be feasible in real-time scenarios.
Despite these advancements, existing methods often fail to integrate trajectory and semantic features, leading to high false alarm rates and limited adaptability in dynamic crowd scenarios, primarily due to the reliance on sparse data sources or isolated analysis of crowd density or individual behaviors. Related achievements of panic behavior detection in recent years are shown in Table 1. It is worth noting that approaches focusing solely on crowd density fail to account for sudden behavioral shifts or irregular trajectories that often accompany panic scenarios. Similarly, trajectory-based methods may not work well in environments with occlusions or dense crowds where tracking individual movement becomes impractical.
Our work aims to overcome these limitations by adopting a multi-dimensional approach that combines crowd density maps, trajectory analysis, and semantic recognition to improve the real-time detection of panic behaviors. Integrating these different data sources can provide a more comprehensive and accurate understanding of individual and collective panic responses.
3. Methodology
To detect and analyze pedestrian panic behaviors within crowds effectively, we propose a comprehensive framework that integrates density mapping, contour-based analysis, trajectory recognition, and semantic interpretation. This multi-modal approach identifies potential panic zones based on density irregularities and then examines individual behaviors to distinguish between normal and abnormal motion patterns. Furthermore, semantic recognition of verbal cues provides additional insight into potential distress signals within the crowd. Combining spatial, motion, and semantic data, our method offers a robust solution for real-time panic detection and crowd management. The following section details the technical implementation and methodological steps to achieve these objectives.
3.1. Crowd Density Measures Panic Risk
Crowd density is a critical metric for measuring spatial congestion and is closely tied to the emergence of panic behaviors.
3.1.1. CDNet Framework
In this study, we propose CDNet (Crowd Density Network), a CNN-based deep learning model optimized for crowd density estimation. Unlike conventional CNNs, CDNet integrates an attention mechanism and a contextual enhancement module (CEM) to capture local and global density variations better. The model consists of a Backbone Extractor (BE), a Density Perception Module (DPM), a Contextual Enhancement Module (CEM), and a Density Map Generator (DMG). BE, built on a pre-trained VGG-16, is enhanced with an attention mechanism and additional convolutional layers to improve spatial and semantic feature extraction. DPM processes feature maps from BE using multi-scale convolutional kernels, allowing the model to adapt to varying crowd densities across spatial resolutions. CEM refines these features by integrating Spatial Pyramid Pooling (SPP) and a Transformer-based self-attention mechanism, generating dynamic weights to emphasize critical density regions. Finally, DMG fuses enhanced feature maps to produce the final density map through convolution layers, batch normalization, activation functions, and skip connections, ensuring efficient feature integration and precise density estimation. An overview of CDNet’s working principles is presented in Figure 1.
To verify the proposed CDNet, we choose the ShanghaiTech crowd count dataset[31] as the main dataset to validate our proposed CDNet model. We mainly used the Part A subset for our experiments because high-density scenarios are more challenging and require more robust models. We scaled all images to a uniform size (512×512) to fit the model inputs and improve training efficiency. The training uses a custom mixed loss function (MSE + MAE) to optimize global and local density distributions. The model's performance can be comprehensively analyzed through the predicted density map, as shown in Figure 2.
3.1.2. Abnormal Change of Contour Line
Contour is an effective method to describe the distribution of a two-dimensional density map by layers, and it can intuitively represent the change of density distribution in the form of lines. In the crowd density map, each contour line represents the boundary of the same density value, and the number, distribution shape, and area of the contour line reflect the density and change trend of the crowd in the region. The variation of the number of contours can reflect the complexity of the density distribution. For example, when there is a sudden increase in the number of contours, it often means a drastic change in the dense distribution of pedestrians in the area. The area surrounded by contours can reflect the size of the high-density region. When the contour area changes significantly in a short period of time, it may indicate a rapid gathering or dispersion of the crowd.
For image frames continuously captured in the same scene (e.g., every second or every few frames), CDNet performs frame-by-frame inference to generate corresponding density maps for multiple frames. Here, represents a discrete time index . Each density map is typically a matrix with the same resolution as the input image or a downscaled version, where the values represent the estimated number of pedestrians distributed in each pixel region.
- Mathematical Description of Contour Features.
The change in contour quantity can be defined as expressed in Equation (1).
(1)
where represent the number of contours at time , and when exceeds a predefined threshold , it indicates the presence of abnormal behavior in the current frame. The total change rate of the contour area can be defined as expressed in Equation (2).
(2)
where represent the area of contour at time , and is a smoothing term to avoid division by zero.
- 2.
- Evaluation Rules of contour line.
To effectively detect panic behavior within a region based on contour features, the following rules are proposed. These rules leverage changes in contour quantity and contour area to evaluate whether anomalies occur.
Rules 1(Abnormal Change in Contour Quantity).
(3)
When the change in contour quantity exceeds the predefined threshold , it may indicate the presence of panic-induced crowding behavior at that time.
Rules 2:(Abnormal Change in Contour Area).
(4)
When the rate of change in contour area exceeds the threshold , it may indicate abnormal crowd gathering or dispersal behavior.
Combining the above two rules, the total fraction s is calculated as shown in Equation (5)
(5)
where and are the weights, and if the total score S exceeds a predefined threshold, it is determined that panic behavior has occurred.
3.2. Panic Trajectory Recognition Criterion
After analyzing the Abnormal change of the contour line, we can identify regions with potential panic risks on both local and global scales. However, it is limited to relying solely on density maps for behavior detection because density maps lack direct individual movement information. To solve this problem, we can combine the time series density map and pedestrian trajectory analysis and use the context information provided by the density map to help identify the abnormal behavior of individuals. Trajectory sequences encoded as time-series velocity and directional changes were fed into a 2-layer LSTM with 128 hidden units per layer, followed by a fully connected layer to classify trajectory anomalies.
Density maps are usually generated from continuous video frames, so capturing dynamic features of crowd behavior by analyzing changes in the density map sequence is possible. These dynamic features can provide auxiliary information for individual behavior detection. To summarize the possible individual abnormal trajectory, Figure 3 shows two abnormal dynamic trajectories that may occur in different situations, where (a) represents the Density Map with Reverse Flow Contour and (b) represents the Density Map with Wandering Movement.
3.2.1. Countercurrent Trajectory Criterion
Countercurrent movement refers to a movement pattern wherein an individual or object travels in the direction opposite to the predominant flow of the subject group.
In this scenario, the direction of the countercurrent entity is contrary to the overall flow, and regions experiencing countercurrent movement often exhibit changes in density. These changes may include increased density due to the overlap between the countercurrent and the main crowd, or unusual density distributions. The criterion for judging countercurrent motion is shown in Equation (6).
(6)
where represents the direction angle of motion, and if represents the mainstream direction, and the direction angle changes by more than 110°, it is determined that there is a countercurrent, as shown in Equation (7).
(7)
3.2.2. Nonlinear Motion Trajectory Criterion
Nonlinear motion is a movement mode characterized by an irregular and nonlinear trajectory. This type of motion typically encompasses behaviors such as wandering, which deviates from the predominant direction of the main group's movement. The path of nonlinear motion is generally curved and unpredictable, potentially including loops or random variations. Regions experiencing nonlinear motion often exhibit lower density with smoothly varying density gradients. However, localized density concentrations can occur within meandering areas. The judgment criterion of nonlinear motion is shown in Equation (8).
(8)
where represents curvature of discrete points, and if exceeds 0.5, then it is judged that there is nonlinear motion, as shown in Equation (9).
(9)
3.3. Panic Semantic Recognition Criterion
Currently, most existing research focuses on using physical models to predict crowd flow trends and safety evacuation, while there is still a significant gap in recognition and
prediction of abnormal crowd behavior, especially in emergency response strategies under sudden, nonlinear, and complex scenarios. The panic event scenario model based on the ontology of panic events takes the panic scenario as the description object, the knowledge elements of the panic scenario as semantic units, the crowd states during the occurrence of panic events as model states, and stampede events caused by large-scale panic events as model instances. The panic semantic knowledge network is used as a method for scenario representation, which helps in constructing a panic semantic model capable of semantic analysis and reasoning about panic events. After formalizing the panic semantic model using the Web Ontology Language (OWL), it can be parsed, accessed, and operated by computers to enable semantic reasoning, thereby achieving semantic services.
Building upon the panic semantic model, a reasoning network for panic semantics is developed. The model also includes statistical analysis of the weights of key phrases within this network. In this study, the Baidu AI API [14] is employed for real-time speech recognition, converting audio streams into text. Upon recognition of key phrases such as 'killing,' 'help,' or 'fire,' the system matches them with elements in the panic semantic reasoning network, which helps in identifying the occurrence of panic scenarios, such as disasters or terrorist attacks. This allows for early warnings and effectively prevents panic behaviors. The reasoning network based on panic semantics is illustrated in Figure 4. The description matrix derivation logic diagram of inference network based on panic semantics is shown in Figure 5.
Define that when a key phrase recognized by the computer matches the layer of the panic semantic model, the key phrase requires positioning coordinates. The positioning coordinate matrix is shown in Equation (10).
(10)
where , represents the total number of keywords at the level where the key segment resides, and A represents the corresponding relationship formed according to the semantic network.
The description matrix of the reasoning network using panic semantics can be expressed by Equation (11) and (12).
=, (11)
(12)
where represents the weight of key segment in this level.
The experimental section uses an audio dataset from real-world settings, covering different types of public events (such as concerts, rallies, and festivals). The dataset is processed using the Baidu AI speech recognition API, converted into text form, and keyword extraction is performed using a predefined semantic dictionary. To validate the accuracy of the model, we evaluated its performance in four scenarios depicted in Figure 5 and were taken as examples to carry out a random survey. The total number of participants in the survey amounts to 300, and the groups are divided as follows:
(1) Elderly group (below 60 years old): 62, among which 29 are male and 33 are female;
(2) Middle-aged group (between 40 and 60 years old): 98, of whom 61 are male and 37 are female;
(3) Youth group (between 16 and 40 years old): 140, of whom 65 are male and 75 are female.
This study employs statistical methods to optimize the survey results and weights. These methods help identify the most influential variables and refine the model parameters, ensuring a more accurate and robust data analysis. By adjusting the weights based on these statistical techniques, we can enhance the precision of our predictions regarding panic behavior and improve the overall effectiveness of the panic event semantic model. The weight information table is presented in Table 2.
The results show that the inference network can accurately identify event-related keywords and match them with actual event scenes when recognizing panic behavior. Specifically, in disaster event scenarios, the model achieved an accuracy rate of 87%, while the false alarm rate in normal activity scenarios was below 5%. Moreover, the model is also capable of inferring the event type and potential impact range based on the recognized semantic vocabulary, thereby providing timely early warning information to public safety management departments.
3.4. Fusion-Based Multi-Feature Method for Pedestrian Panic Recognition
Panic behaviors in pedestrian crowds often manifest through irregular movement patterns, verbal distress signals, and abnormal crowd density distributions. However, identifying panic behaviors individually within a crowded environment presents a significant challenge due to high occlusion, motion complexity, and the ambiguity of panic indicators. This study integrates crowd density estimation, trajectory analysis, and semantic recognition into a comprehensive pedestrian panic recognition framework to address this issue. The proposed model enhances the reliability of panic detection by correlating abnormal density gradients, erratic motion patterns, and panic-related verbal cues.
The proposed approach is structured into three core modules: CDNet-based Crowd Density Feature Extraction, LSTM-based Trajectory Sequence Modeling, and Transformer-based Semantic Feature Representation. Each module processes data from a distinct modality—spatial density distribution, temporal pedestrian movement, and verbal cues—extracting high-level representations that capture the intrinsic characteristics of crowd behavior. These modality-specific feature embeddings are then integrated through a Multi-Layer Perceptron (MLP)--based Multi-Modal Feature Fusion mechanism, which optimally weights and combines the extracted features to compute a final panic probability score. This fusion framework ensures a comprehensive and robust assessment of panic-induced behaviors in high-density environments. The detailed workflow is illustrated in Figure 6.
4. Experiments
4.1. Experimental Setup
To evaluate the performance of the proposed multimodal panic recognition system, we employed a combination of real-world and simulated datasets. Specifically, we utilized the stampede in Itaewon, South Korea, October 29, 2022[32], as a case study for model validation. On December 29, 2024, real-world videos were collected on the Internet and made into a dataset to capture the flow of pedestrian on Itaewon's Y-shaped micro-road, as illustrated in Figure 7. Panic scenarios in the Stampede in Itaewon dataset were annotated by three experienced annotators with an inter-annotator agreement (Cohen’s Kappa) of 0.85. This dataset extracted multimodal features—including crowd density maps, trajectory patterns, and semantic cues—to facilitate panic behavior detection.
In addition to real-world data, we incorporated benchmark open-source and simulated datasets to assess the model's generalization capability. The UCF Crowd Dataset[33], a publicly available dataset comprising diverse crowd density scenarios, was utilized to test the proposed model's robustness across varying congestion levels. Furthermore, we generated synthetic Simulated Panic Behavior Datasets using SUMO (Simulation of Urban Mobility) and Unity 3D, enabling controlled experimentation of pedestrian movement dynamics under sudden emergency scenarios. These simulation-based datasets provide valuable insights into panic-induced deviations in trajectory, abnormal density fluctuations, and distress-related verbal cues, thereby supplementing real-world observations with a broader range of behavioral conditions. Table 3 summarizes the statistical distribution of datasets used in this study, detailing the number of video sequences, average crowd density (pedetrian/m²), and number of annotated panic events.
4.1. Case Analysis
To evaluate the practical effectiveness of the proposed multimodal panic recognition system, a case study was conducted using real-world surveillance data from Stampede in Itaewon, a high-density transportation hub. The dataset includes video recordings capturing normal pedestrian movement and panic scenarios, allowing for a detailed assessment of the system’s ability to detect and analyze abnormal behaviors in a complex micro-road network environment.
The input video stream is first processed by CDNet, which generates a crowd density map. Subsequently, contour-based criteria are applied to identify panic regions based on predefined thresholds. Specifically, the contour quantity variation threshold is set to 7, while the contour area variation threshold is set to 30%. The overall panic score S is determined using a threshold of 2.2, where the weights for contour quantity change ) and contour area change () are set to 0.6 and 0.4, respectively, reflecting the greater significance of contour quantity variation in the Itaewon, the results are illustrated in Figure 8, where (a) and (c) represent the judgment results of crowd count and panic area respectively,
In addition to density-based panic region detection, pedestrian abnormal trajectory data is extracted according to panic trajectory recognition criteria, which categorize anomalies such as counterflow movements, wandering behaviors, and abrupt directional changes. The extracted abnormal trajectories, including counterflow movements, behaviors, and other deviations from normal pedestrian flow, are processed by the LSTM- based.
trajectory analysis module to generate high-dimensional trajectory feature vectors. Simultaneously, speech and textual data derived from Baidu AI’s semantic analysis are fed into the Transformer-based semantic representation module, which encodes panic-related linguistic features into structured feature vectors. These modality-specific feature embeddings are subsequently fused through a Multi-Layer Perceptron (MLP)-based Multi-Modal Feature Fusion framework, where optimized weighting mechanisms are applied to integrate spatial, temporal, and semantic representations. The final panic probability score, which quantifies the likelihood of panic-induced behaviors, is obtained as the output of this fusion process, as illustrated in Figure 9.
The results demonstrate that the proposed system successfully detects panic behaviors before large-scale crowd disturbances occur, allowing for early intervention and risk mitigation. The multimodal integration of spatial, temporal, and semantic features enables a more comprehensive understanding of panic propagation, distinguishing true panic events from high-density but non-emergency crowd formations. The system’s performance in Stampede in Itaewon, South Korea validates its robustness in real-world, high-density public settings, confirming its potential applicability in intelligent surveillance and emergency response management.
4.1. Evaluation Metrics
To comprehensively assess the effectiveness and real-time feasibility of the proposed multimodal panic recognition system, we employ a hybrid evaluation framework that integrates classification performance metrics with computational efficiency metrics. This dual-faceted evaluation ensures that the model not only achieves high detection accuracy but also meets the stringent latency and throughput requirements necessary for real-time deployment in high-density micro-road network environments.
4.1.1. Performance Metrics
The ability of the system to accurately distinguish panic-induced behaviors from normal pedestrian activities is quantified using five key classification metrics: Accuracy, Precision, Recall, F1-score, and AUC-ROC. These metrics collectively assess the model’s effectiveness in minimizing both false negatives (missed panic events) and false positives (erroneous panic alerts) while ensuring robustness under varying crowd densities and pedestrian dynamics.
The accuracy of the model is defined by the ratio of correctly classified samples to the total number of samples, as expressed in Equation (13).
(13)
where (True Positives) and (True Negatives) represent correctly classified panic and non-panic events, respectively, while (False Positives) and (False Negatives) denote incorrect classifications. Although accuracy provides an overall performance measure, it may be biased in imbalanced datasets, where panic events occur less frequently.
Precision quantifies the proportion of correctly predicted panic events among all instances classified as panic, as given in Equation (14).
(14)
A high precision score indicates a lower occurrence of false alarms, which is critical for ensuring system reliability in real-world deployment scenarios.
Recall, also referred to as sensitivity, measures the proportion of actual panic events that were successfully detected by the system, as formulated in Equation (15).
(15)
Since precision and recall present a trade-off, F1-score is employed as a harmonic mean of the two, ensuring a balanced assessment of the detection performance. The F1-score is computed using Equation (16).
(16)
A higher F1-score reflects both a reduced false alarm rate and a strong sensitivity to panic events, making it a crucial metric in safety-critical applications.
The Area Under the Curve - Receiver Operating Characteristic (AUC-ROC) is used to evaluate the model’s discrimination ability between panic and non-panic cases across different decision thresholds. The AUC is calculated using Equation (17).
(17)
where TPR (True Positive Rate) and FPR (False Positive Rate) are plotted at varying thresholds to measure the model’s classification robustness. A model with is considered highly effective in distinguishing between panic and non-panic behaviors.
4.3.2. Ablation Study
To assess the contribution of each modality in the proposed multimodal panic recognition system, we conduct an ablation study on the UFC Crowd and Simulated Panic Behavior Datasets by selectively removing different feature inputs, including crowd density, trajectory patterns, and semantic cues. The objective is to quantify the impact of each modality on overall classification performance and validate the necessity of multi-modal fusion. The study includes evaluations of the full model, single-modality models that rely solely on crowd density (CNN), trajectory features (LSTM), or semantic cues (Transformer), and two-modality combinations to analyze the complementary effects of different feature types. The experimental results are summarized in Table 4, which presents classification accuracy, F1-score, and inference speed across different model configurations.
The results indicate that the full model, integrating all three modalities, achieves the highest performance—91.7% accuracy, 88.2% F1-score, and 40 FPS—thus validating the
efficacy of multi-modal fusion. By contrast, excluding any single modality causes a marked decline in performance; notably, the semantic-only configuration records the lowest accuracy, reflecting its susceptibility to unreliable speech cues in noisy conditions. The density-only (74.5% accuracy, 76.3% F1-score, 50 FPS) and trajectory-only (77.2% accuracy, 79.1% F1-score, 48 FPS) models improve upon semantic-only but cannot match the full model, emphasizing the complementary nature of spatial and temporal analyses. Among two-modality configurations, density + trajectory stands out, registering 81.6% accuracy, 83.4% F1-score, and 45 FPS, which underscores the critical role of spatial distributions and movement patterns in accurately recognizing panic. Meanwhile, density + semantic (78.9% accuracy, 80.7% F1-score, 47 FPS) and trajectory + semantic (76.5% accuracy, 78.2% F1-score, 49 FPS) outperform single-modality approaches but still fall below the synergy afforded by three-way fusion.
5. Conclusions
This study presents a novel multimodal framework designed for detecting pedestrian panic behaviors within crowded micro-road networks. The methodology integrates spatial analysis using convolutional neural networks (CDNet) to identify panic-prone areas based on abnormal crowd density contours, temporal trajectory anomaly detection through LSTM networks to recognize irregular pedestrian movements, and semantic analysis via Transformer models interpreting verbal distress signals converted from real-time speech-to-text using Baidu AI. Additionally, a multi-layer perceptron (MLP) based multimodal fusion approach effectively integrates these diverse data streams for enhanced panic detection accuracy.
Comprehensive experiments conducted on datasets from the Itaewon Stampede accident and benchmark datasets, such as the UCF Crowd dataset, validate the efficacy of the proposed approach. The multimodal model achieved an impressive panic detection accuracy of 91.7%, significantly surpassing results from single- and dual-modality approaches in comparative ablation studies, highlighting its robustness and reliability.
In conclusion, the developed framework significantly enhances capabilities for real-time crowd monitoring and emergency response in densely populated public scenarios. However, certain aspects warrant further investigation, particularly regarding the model's predictive performance in cases where distinct dynamic features are less prominent, potentially introducing noise into prediction outcomes. Future research should conduct a detailed exploration of the effective temporal ranges and variability trends of multimodal features to refine prediction capabilities, alongside efforts to reduce computational complexity through model compression and lightweight architecture.
Author Contributions
Conceptualization, methodology, software, validation, formal analysis, investigation, resources, data curation, writing—original draft preparation, L.H., R.Z. and C.L.; writing—review and editing, B.W., R.Z., A.R. and Y.C., and visualization, L.H., C.L. and Y.M.; supervision and project administration, R.Z. All authors have read and agreed to the published version of the manuscript.
Funding
This research was funded by the National Natural Science Foundation of China (No. 72374154).
Institutional Review Board Statement
Not applicable.
Informed Consent Statement
Not applicable.
Conflicts of Interest
The authors declare no conflicts of interest.
References
- Yanghui H, Yubo B, Xiangxia R, Shenshi H, Wei G. Experimental study on the impact of a stationary pedestrian obstacle at the exit on evacuation. Physica A: Statistical Mechanics and its Applications. 2023.
- Ahmed BA, Habib U. Panic Detection in Crowded Scenes. Engineering, Technology & Applied Science Research. 2020.
- Melissa De I, Edoardo B, Marco D, Gian Paolo C, Bottino A. Large scale simulation of pedestrian seismic evacuation including panic behavior. Sustainable Cities and Society. 2023.
- Altamimi A, Ullah H. Panic Detection in Crowded Scenes. Engineering, Technology & Applied Science Research. 2020;10:5412-8.
- Deepak Kumar J, Xudong Z, Germán G-A, Chenquan G, Ketan K. Multimodal pedestrian detection using metaheuristics with deep convolutional neural network in crowded scenes. Information Fusion. 2023.
- Antonio, L. Pedestrian Detection Systems. Wiley Encyclopedia of Electrical and Electronics Engineering. 2018.
- Ganga B, Lata B, Venugopal K. Object detection and crowd analysis using deep learning techniques: Comprehensive review and future directions. Neurocomputing. 2024:127932.
- Hamid, A.A.; Monadjemi, S.A.; Shoushtarian, B. ABDviaMSIFAT: Abnormal Crowd Behavior Detection utilizing a Multi-Source Information Fusion Technique. IEEE Access 2024, PP, 1–1. [Google Scholar] [CrossRef]
- Lazaridis, L.; Dimou, A.; Daras, P. Abnormal Behavior Detection in Crowded Scenes Using Density Heatmaps and Optical Flow. 2018 26th European Signal Processing Conference (EUSIPCO). LOCATION OF CONFERENCE, ItalyDATE OF CONFERENCE; pp. 2060–2064.
- Sharma, V.K.; Mir, R.N.; Singh, C. Scale-aware CNN for crowd density estimation and crowd behavior analysis. Comput. Electr. Eng. 2023, 106. [Google Scholar] [CrossRef]
- Zhou, S.; Shen, W.; Zeng, D.; Zhang, Z. Unusual event detection in crowded scenes by trajectory analysis. ICASSP 2015 - 2015 IEEE International Conference on Acoustics, Speech and Signal Processing (ICASSP). LOCATION OF CONFERENCE, AustraliaDATE OF CONFERENCE; pp. 1300–1304.
- Miao, Y.; Yang, J.; Alzahrani, B.; Lv, G.; Alafif, T.; Barnawi, A.; Chen, M. Abnormal Behavior Learning Based on Edge Computing toward a Crowd Monitoring System. IEEE Netw. 2022, 36, 90–96. [Google Scholar] [CrossRef]
- Tyagi, B.; Nigam, S.; Singh, R. A Review of Deep Learning Techniques for Crowd Behavior Analysis. Arch. Comput. Methods Eng. 2022, 29, 5427–5455. [Google Scholar] [CrossRef]
- Baidu AI Open Platform. Available online: https://ai.baidu.com/ (accessed on 11 November 2020).
- Muhammad Asif K, Hamid M, Ridha H. LCDnet: a lightweight crowd density estimation model for real-time video surveillance. Journal of Real-time Image Processing. 2023.
- Luo, L.; Xie, S.; Yin, H.; Peng, C.; Ong, Y.-S. Detecting and Quantifying Crowd-Level Abnormal Behaviors in Crowd Events. IEEE Trans. Inf. Forensics Secur. 2024, 19, 6810–6823. [Google Scholar] [CrossRef]
- Alashban, A.; Alsadan, A.; Alhussainan, N.F.; Ouni, R. Single Convolutional Neural Network With Three Layers Model for Crowd Density Estimation. IEEE Access 2022, 10, 63823–63833. [Google Scholar] [CrossRef]
- Zhao, R.; Wang, Y.; Jia, P.; Zhu, W.; Li, C.; Ma, Y.; Li, M. Abnormal Behavior Detection Based on Dynamic Pedestrian Centroid Model: Case Study on U-Turn and Fall-Down. IEEE Trans. Intell. Transp. Syst. 2023, 24, 8066–8078. [Google Scholar] [CrossRef]
- Korbmacher, R.; Dang, H.-T.; Tordeux, A. Predicting pedestrian trajectories at different densities: A multi-criteria empirical analysis. Phys. A: Stat. Mech. its Appl. 2023, 634. [Google Scholar] [CrossRef]
- Xie, C.-Z.T.; Xu, J.; Zhu, B.; Tang, T.-Q.; Lo, S.; Zhang, B.; Tian, Y. Advancing crowd forecasting with graphs across microscopic trajectory to macroscopic dynamics. Inf. Fusion 2024, 106. [Google Scholar] [CrossRef]
- Sen, A.; Rajakumaran, G.; Mahdal, M.; Usharani, S.; Rajasekharan, V.; Vincent, R.; Sugavanan, K. Live Event Detection for People’s Safety Using NLP and Deep Learning. IEEE Access 2024, 12, 6455–6472. [Google Scholar] [CrossRef]
- Li N HY, Huang ZQ. Implementation of a Real-time Fall Detection Algorithm Based on Body's Acceleration [Article in Chinese]. Journal of Chinese Computer Systems. 2012;33(11):2410-3.
- Pan, D.; Liu, H.; Qu, D.; Zhang, Z. Human Falling Detection Algorithm Based on Multisensor Data Fusion with SVM. Mob. Inf. Syst. 2020, 2020, 1–9. [Google Scholar] [CrossRef]
- Jing L, Qingwang H, Yingjun D, Xiantong Z, Shengyong C, Ling S. Variational Abnormal Behavior Detection With Motion Consistency. IEEE transactions on image processing. 2022.
- Shuqiang G, Qianlong B, Song G, Yaoyao Z, Ai-Quan L. An Analysis Method of Crowd Abnormal Behavior for Video Service Robot. IEEE Access. 2019.
- FZ, H. Research on evacuation of people in panic state considering rush behavior [Article in Chinese]. Journal of Safety Science and Technology. 2022;18(10):203-9.
- S, Z. Panic Crowd Behavior Detection Based on Intersection Density of Motion Vector [Article in Chinese]. Computer Systems & Applications. 2017;26(07):210-4.
- Chang, C.-W.; Lin, Y.-Y. A hybrid CNN and LSTM-based deep learning model for abnormal behavior detection. Multimedia Tools Appl. 2022, 81, 11825–11843. [Google Scholar] [CrossRef]
- Jiefan Q, Xing-Gang Y, Wei W, Wei W, Kai F. Skeleton-Based Abnormal Behavior Detection Using Secure Partitioned Convolutional Neural Network Model. IEEE Journal of Biomedical and Health Informatics. 2022.
- Vinothina V, George A, editors. Recognizing Abnormal Behavior in Heterogeneous Crowd using Two Stream CNN. 2024 Asia Pacific Conference on Innovation in Technology (APCIT); 2024: IEEE.
- Zhang Y, Zhou D, Chen S, Gao S, Ma Y, editors. Single-Image Crowd Counting via Multi-Column Convolutional Neural Network. 2016 IEEE Conference on Computer Vision and Pattern Recognition (CVPR); 2016 27-. 30 June.
- Kyoo-Man, H. Reviewing the Itaewon Halloween crowd crush, Korea 2022: Qualitative content analysis. F1000Research. 2023.
- Haroon I, Muhmmad T, Kishan A, Dong Z, Somaya AM, Nasir R, Mubarak S. Composition Loss for Counting, Density Map Estimation and Localization in Dense Crowds. arXiv (Cornell University). 2018.
Figure 1.
The structure of the proposed neural network for crowd density map estimation.
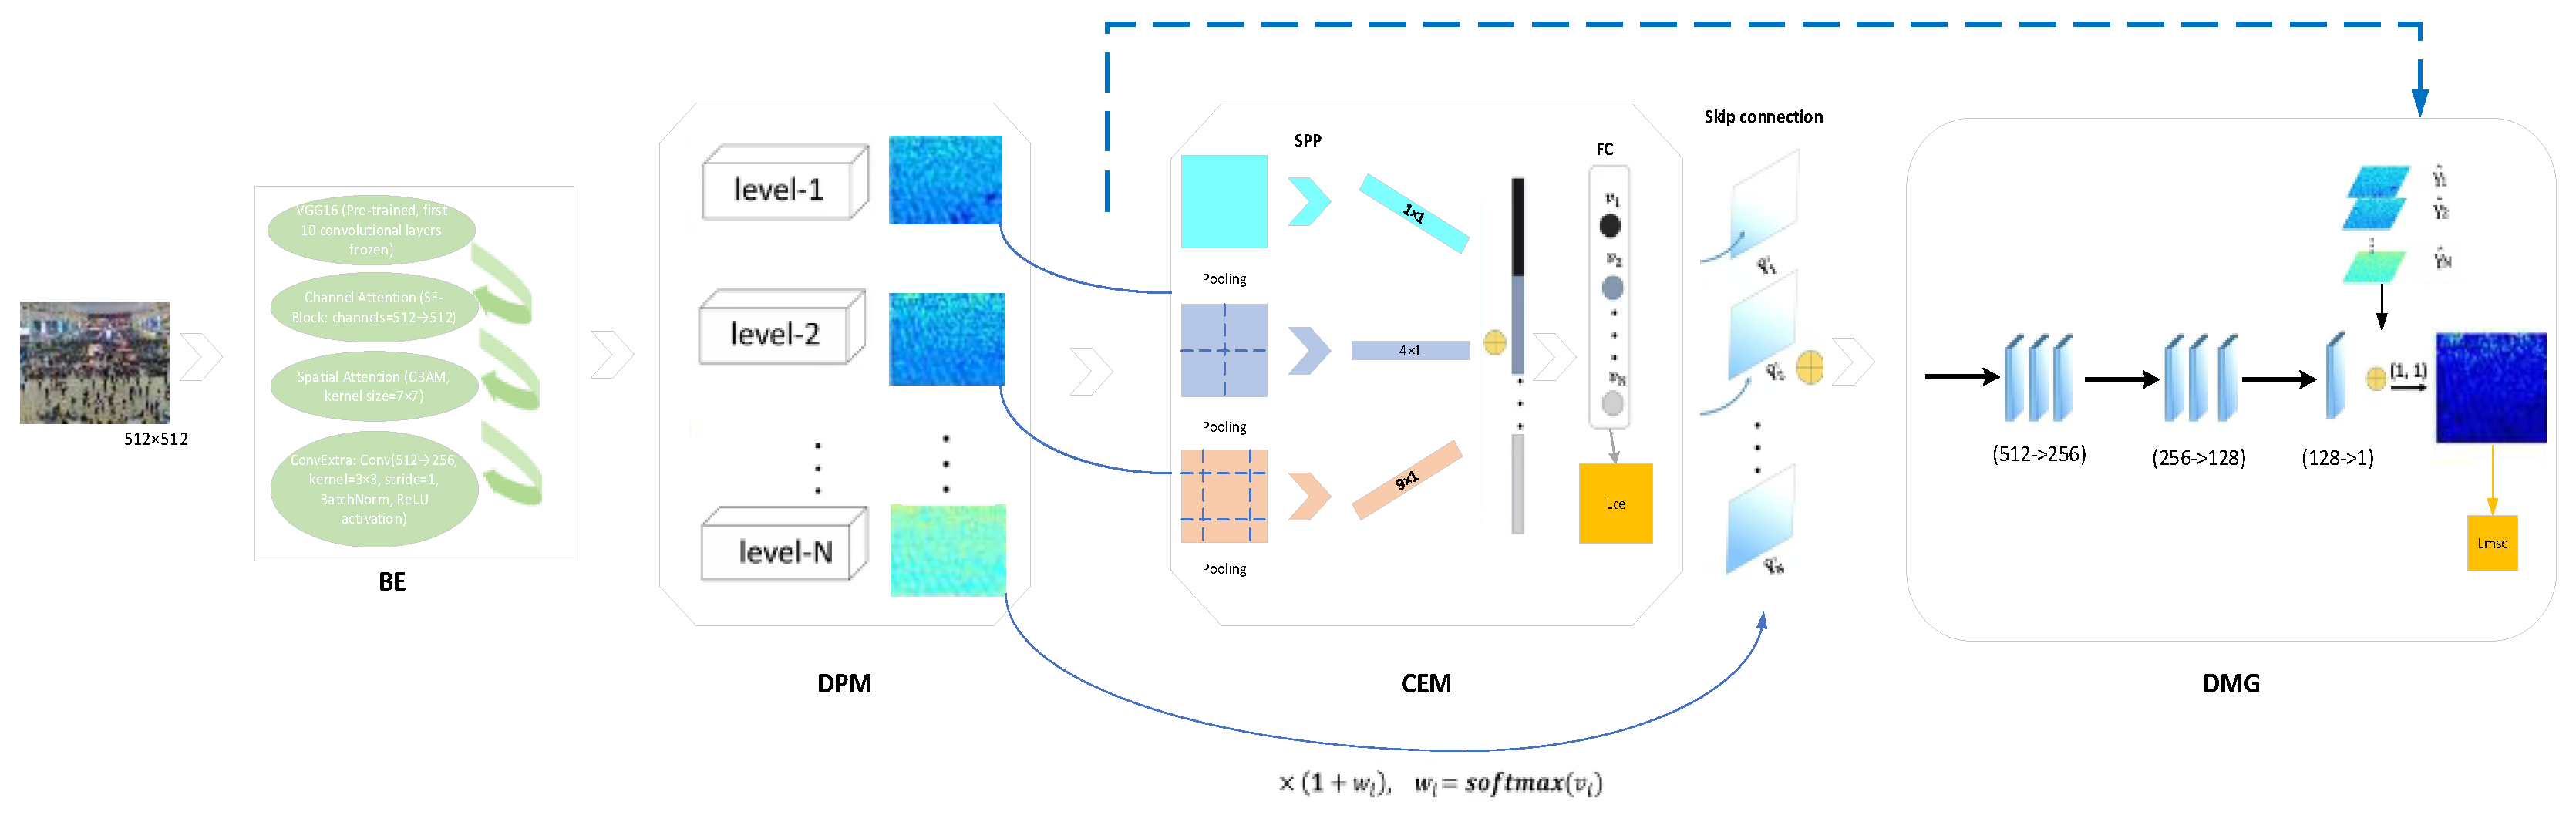
Figure 2.
The Density map predicted by CDNet.
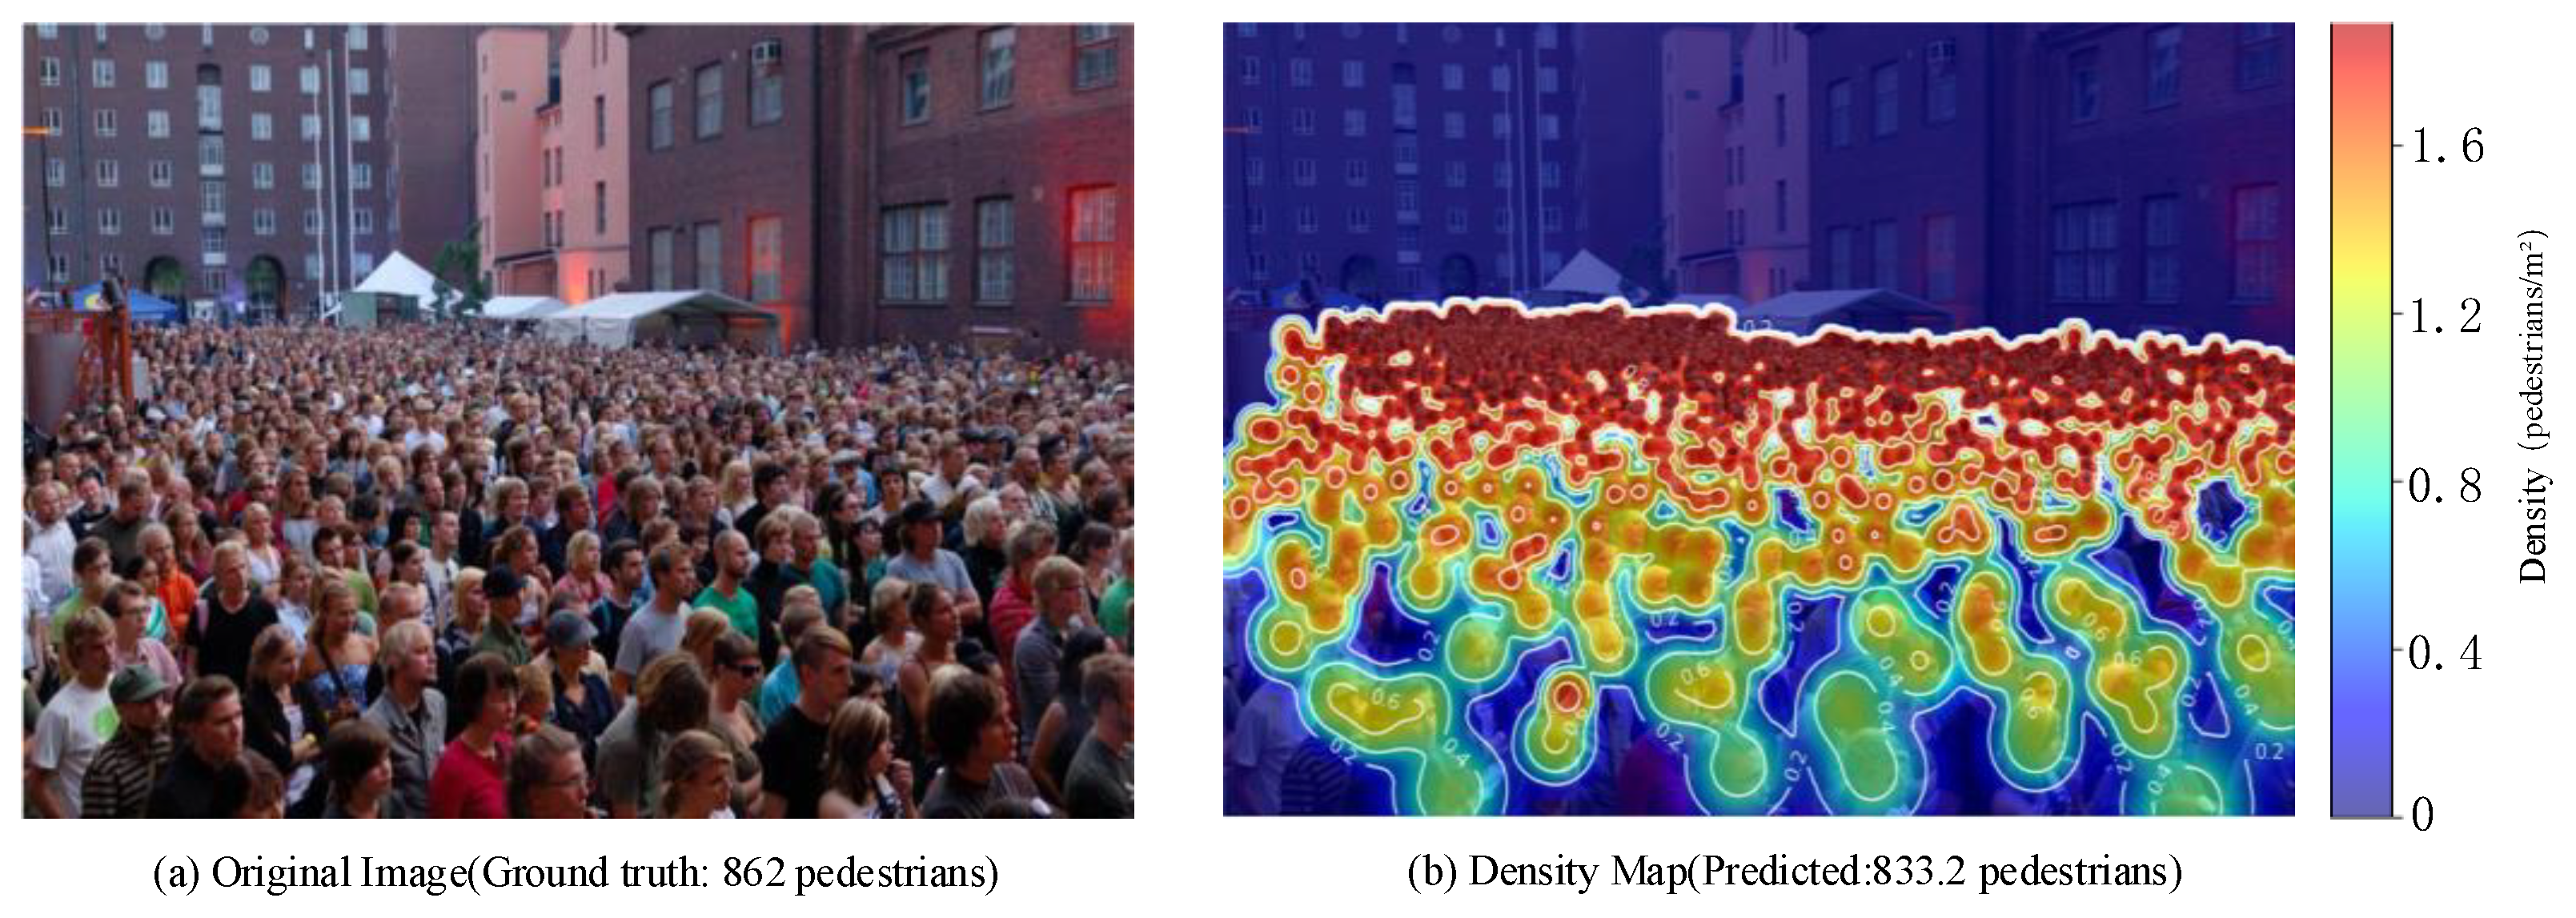
Figure 3.
Density map with pedestrian abnormal trajectory. Note: The blue dot represents the mainstream movement, the red dot represents the countercurrent movement, and the red broken line represents the wandering movement.
Figure 3.
Density map with pedestrian abnormal trajectory. Note: The blue dot represents the mainstream movement, the red dot represents the countercurrent movement, and the red broken line represents the wandering movement.
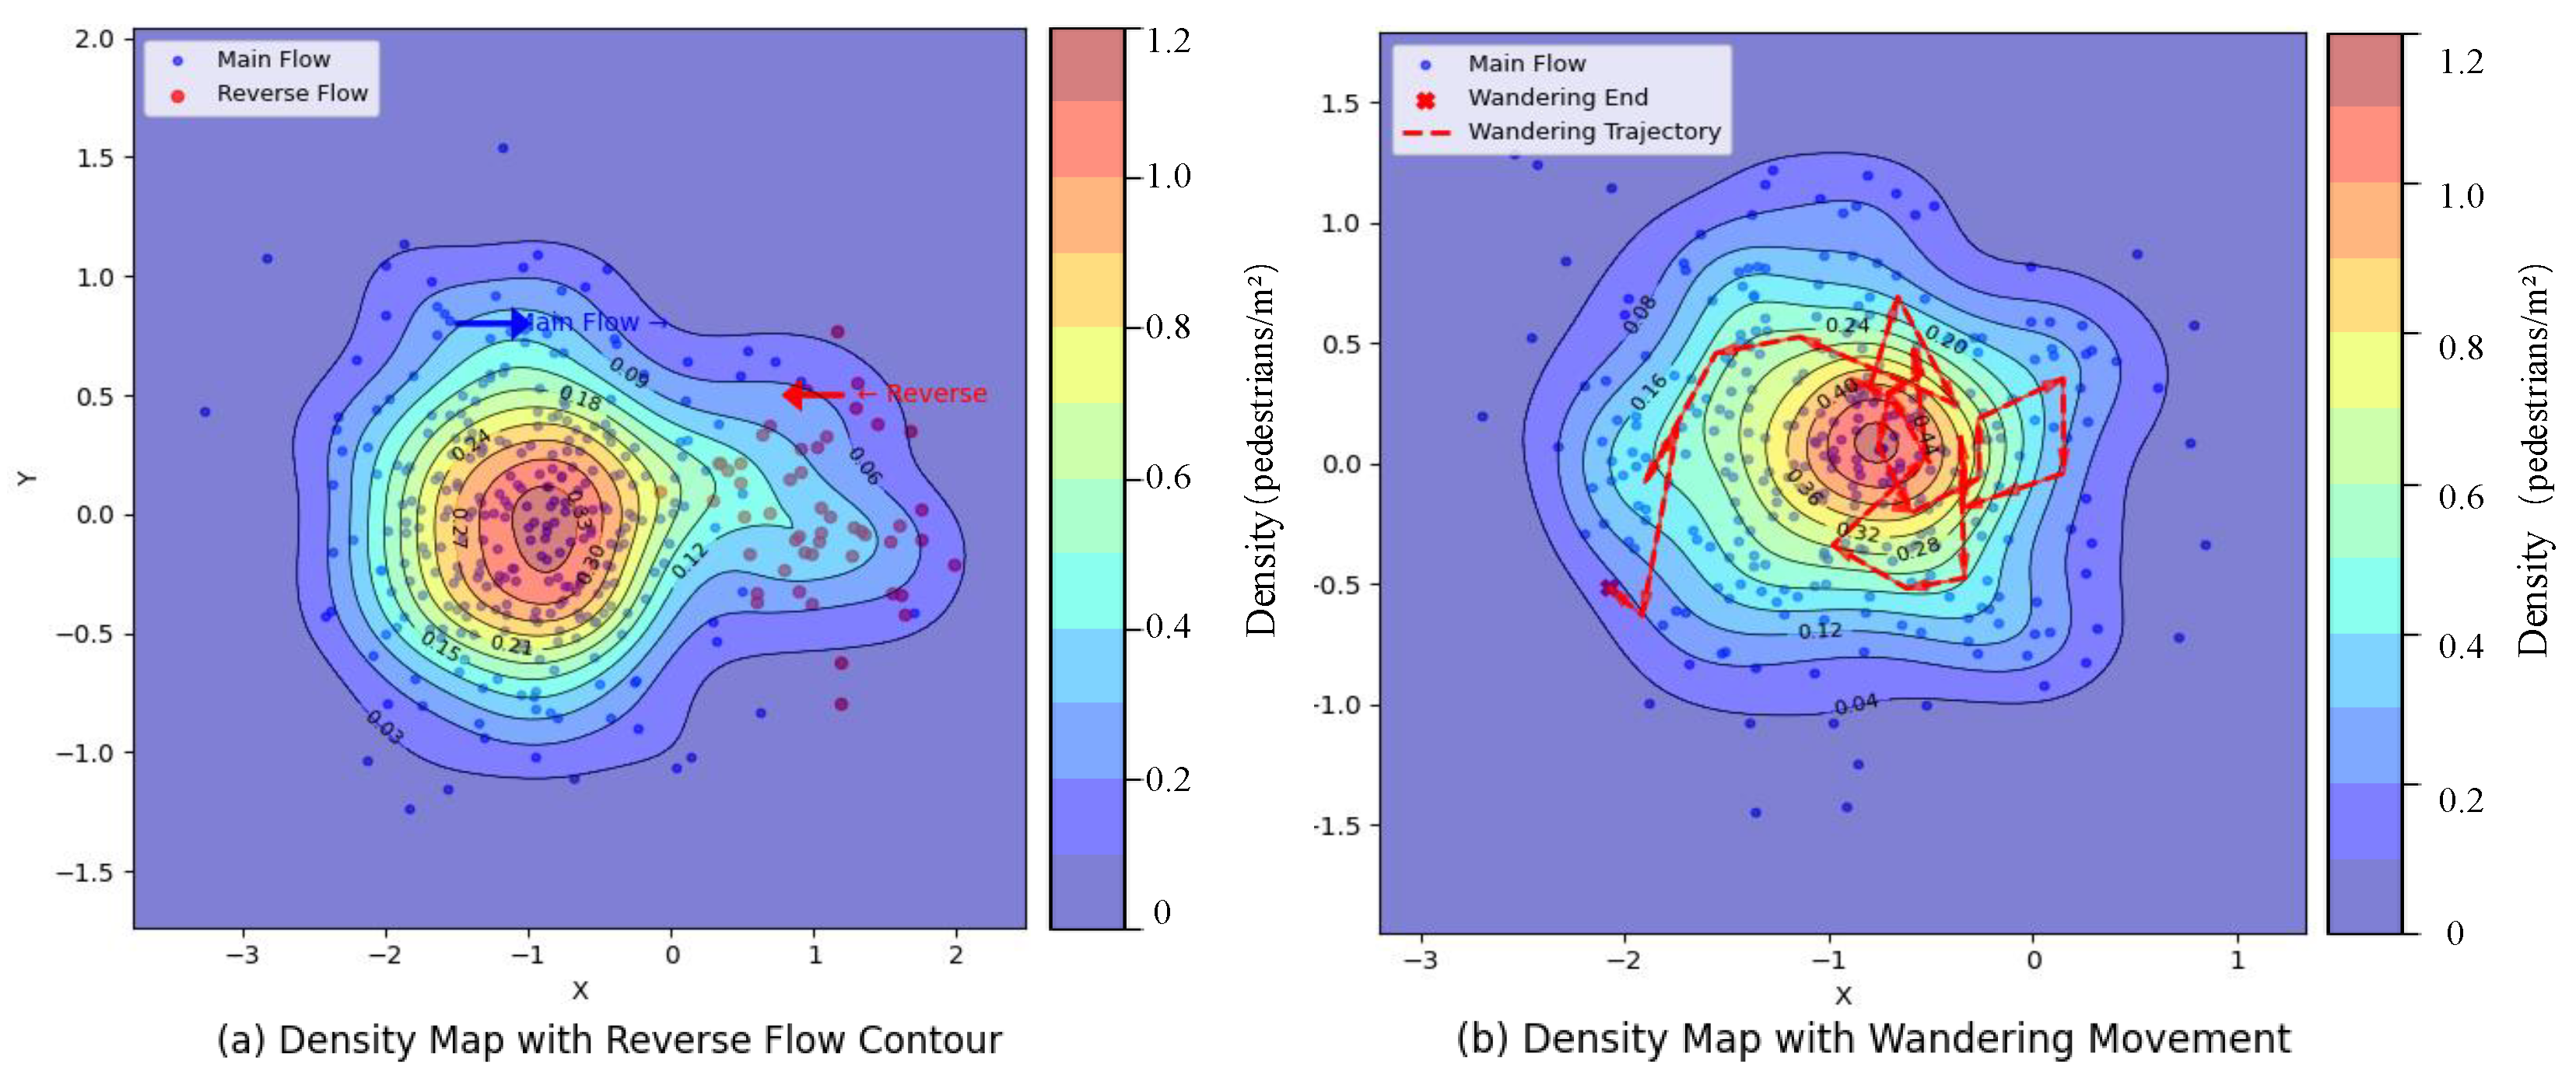
Figure 4.
Description matrix derivation logic diagram of inference network based on panic semantics.
Figure 4.
Description matrix derivation logic diagram of inference network based on panic semantics.
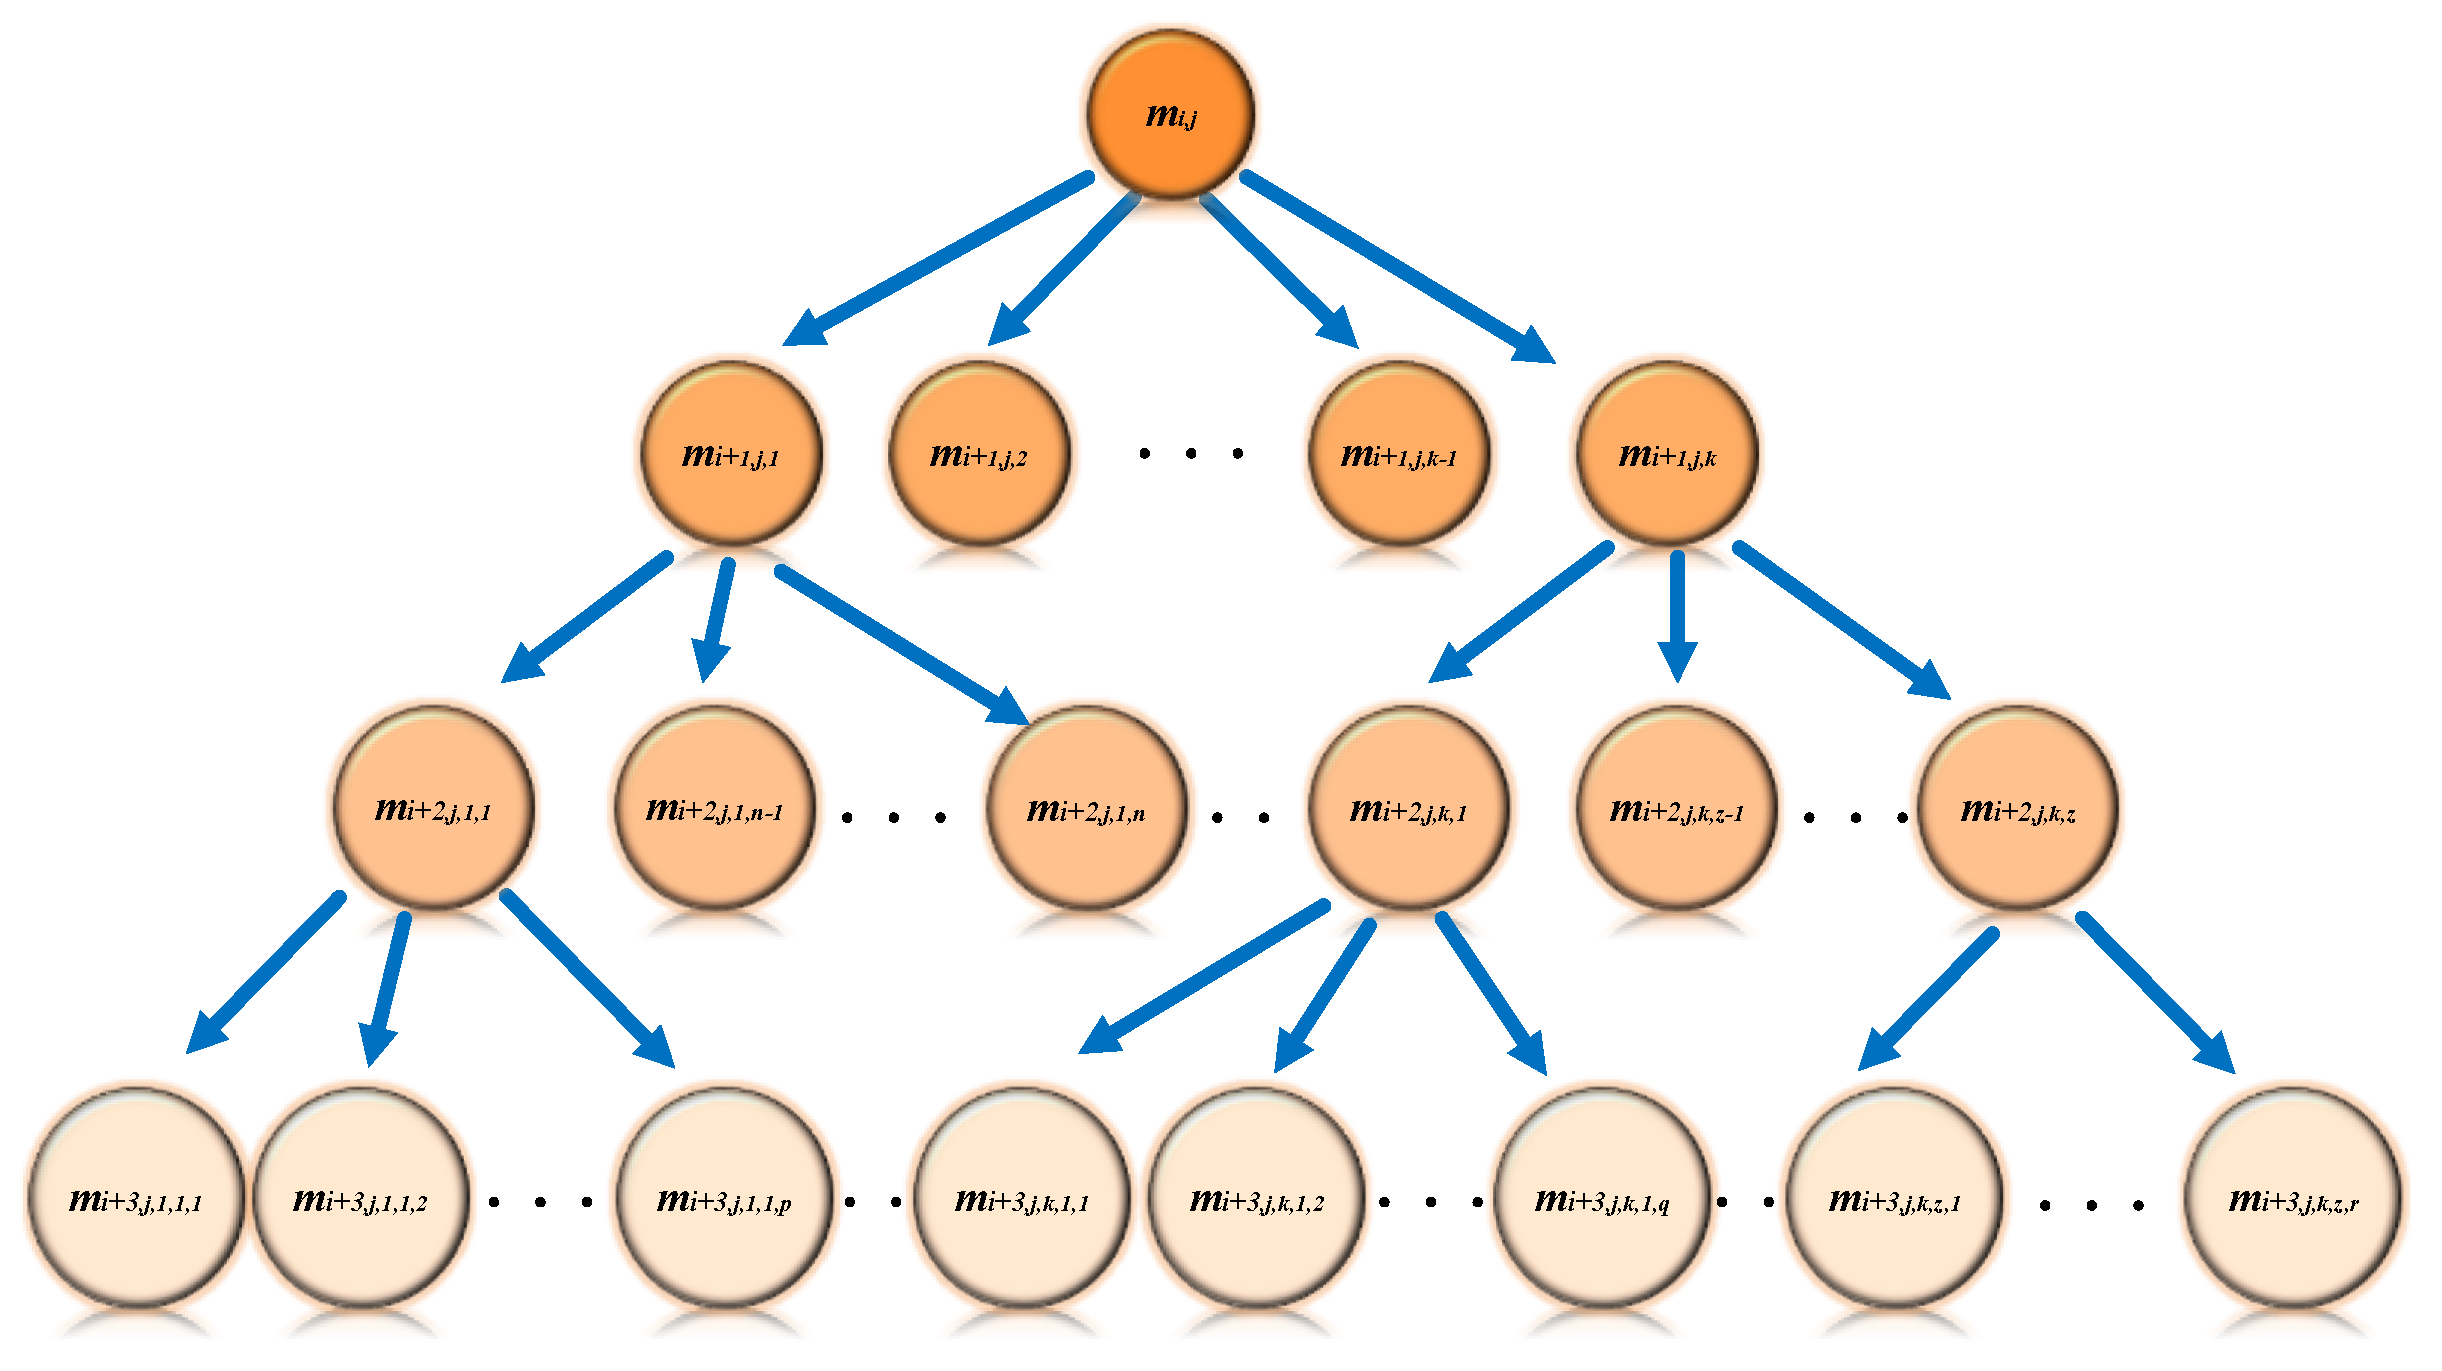
Figure 5.
Inference networks based on panic semantics.
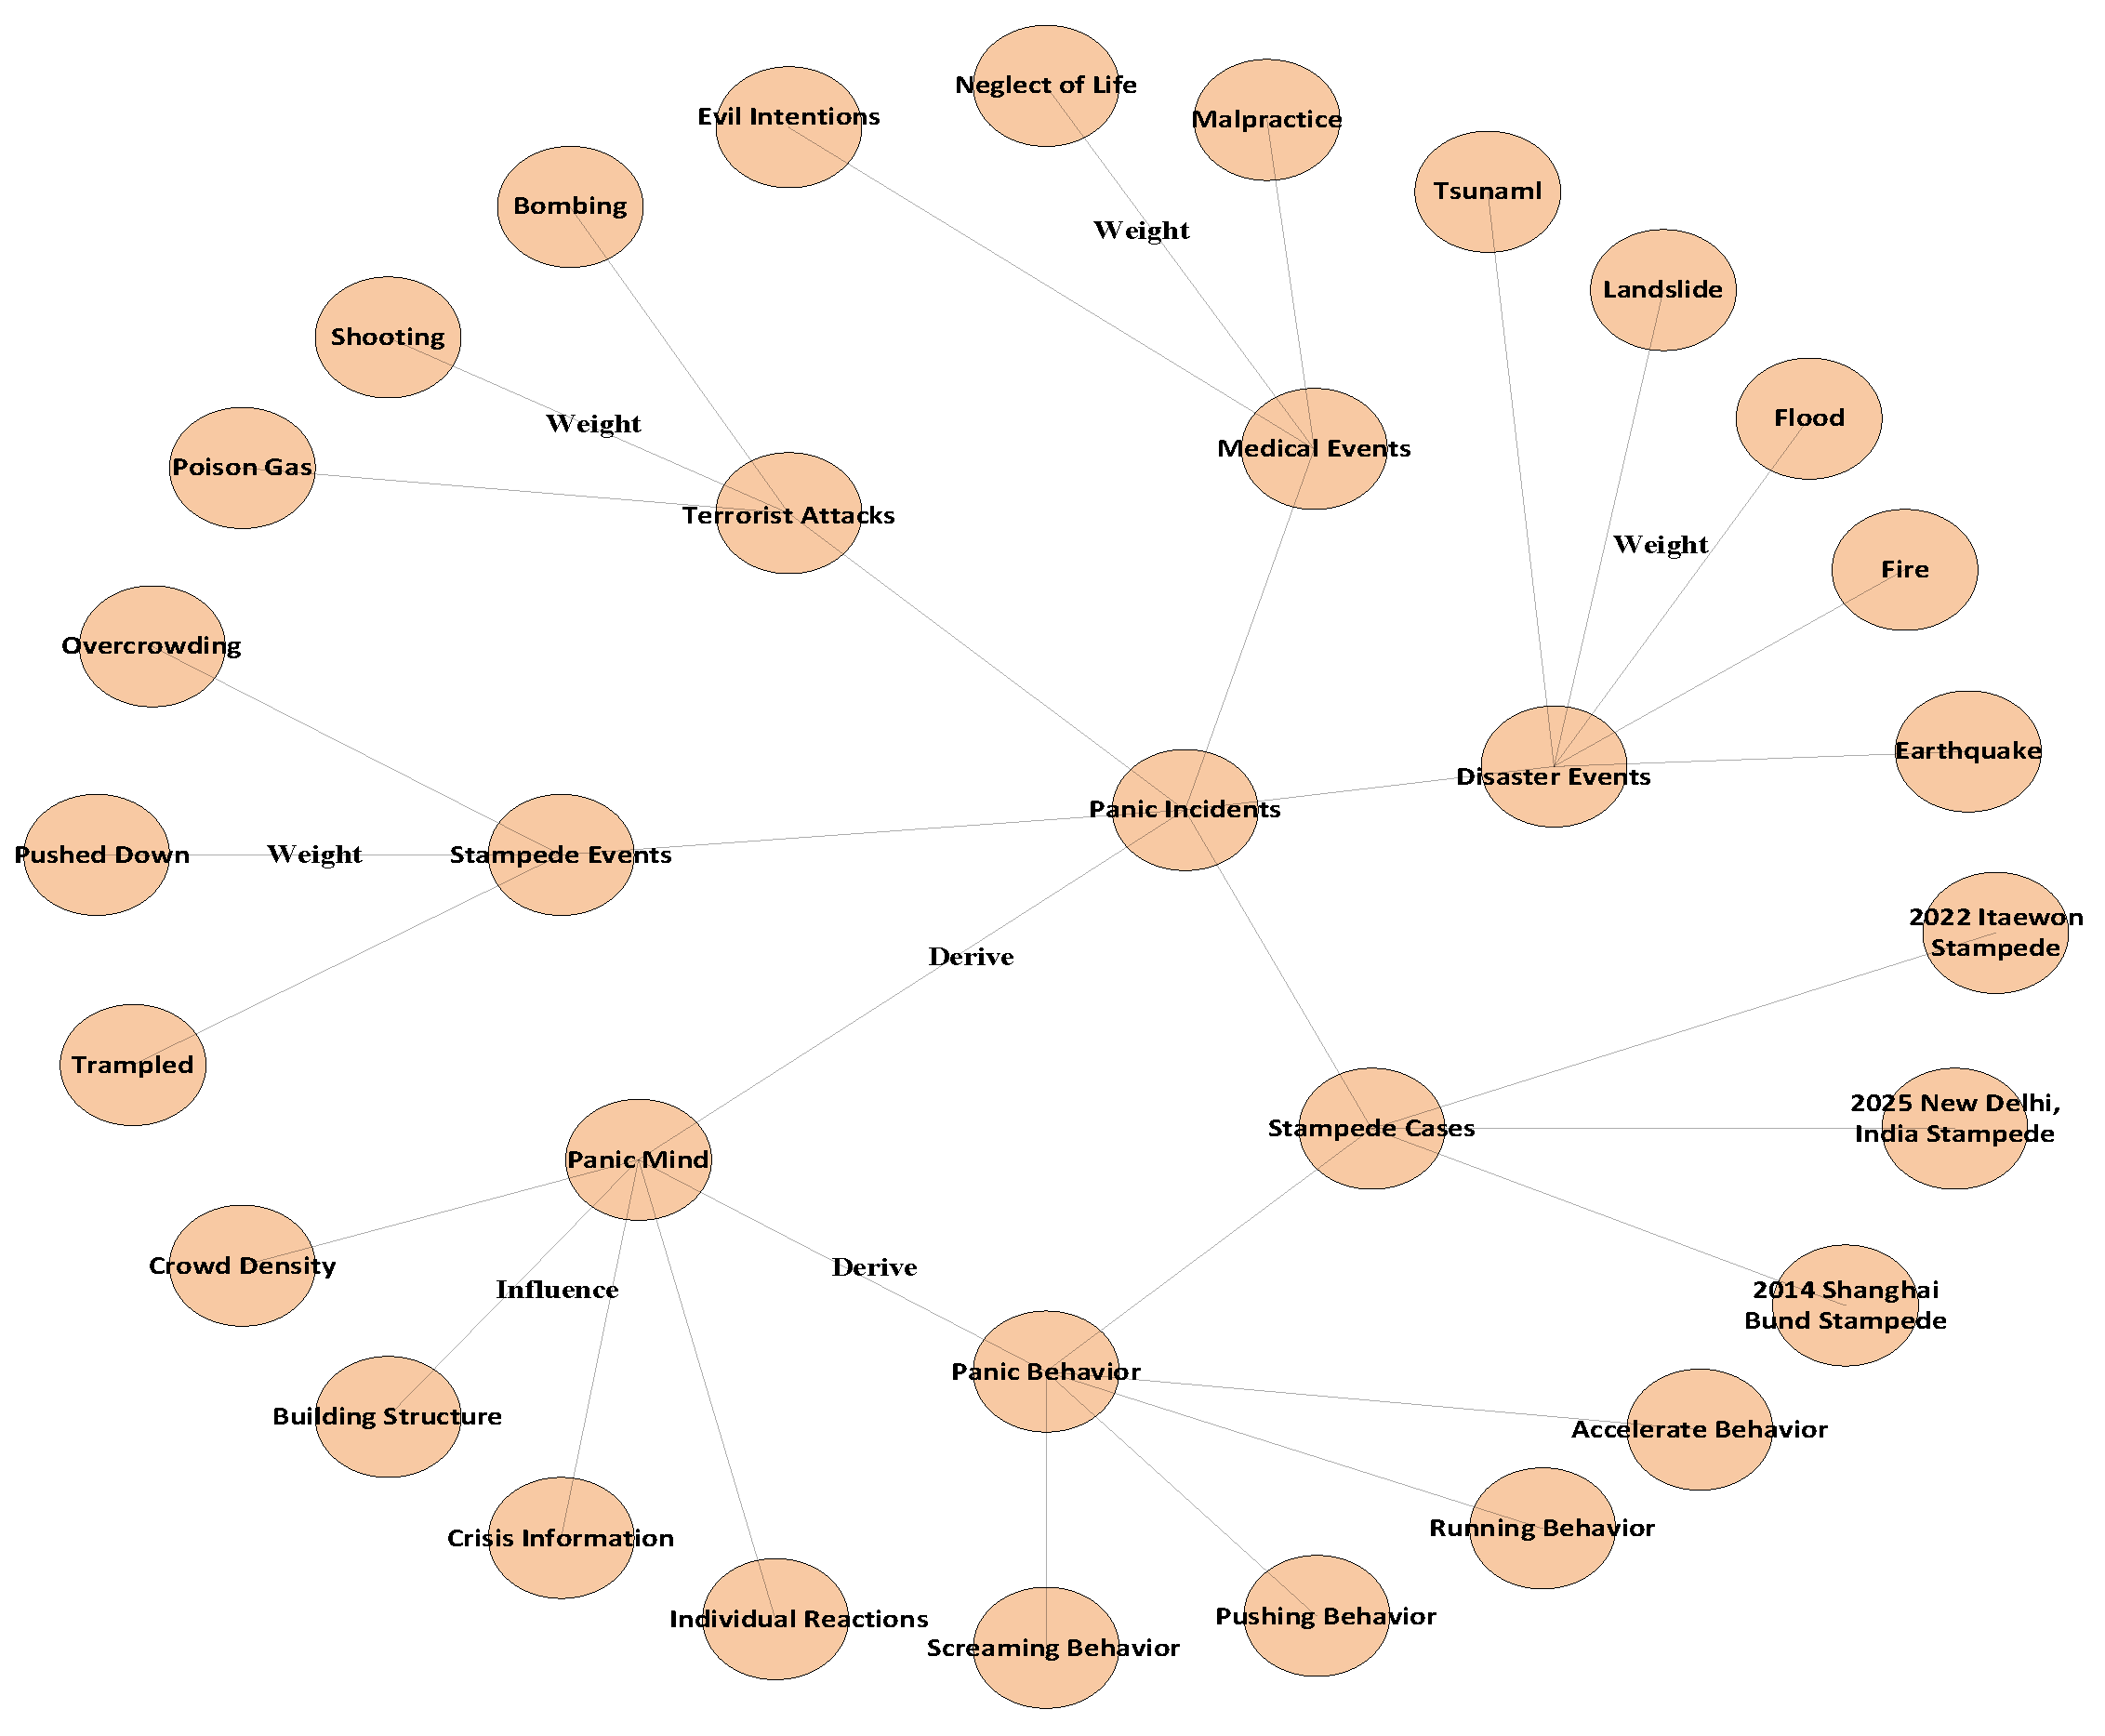
Figure 6.
Pedestrian panic behavior recognition workflow.
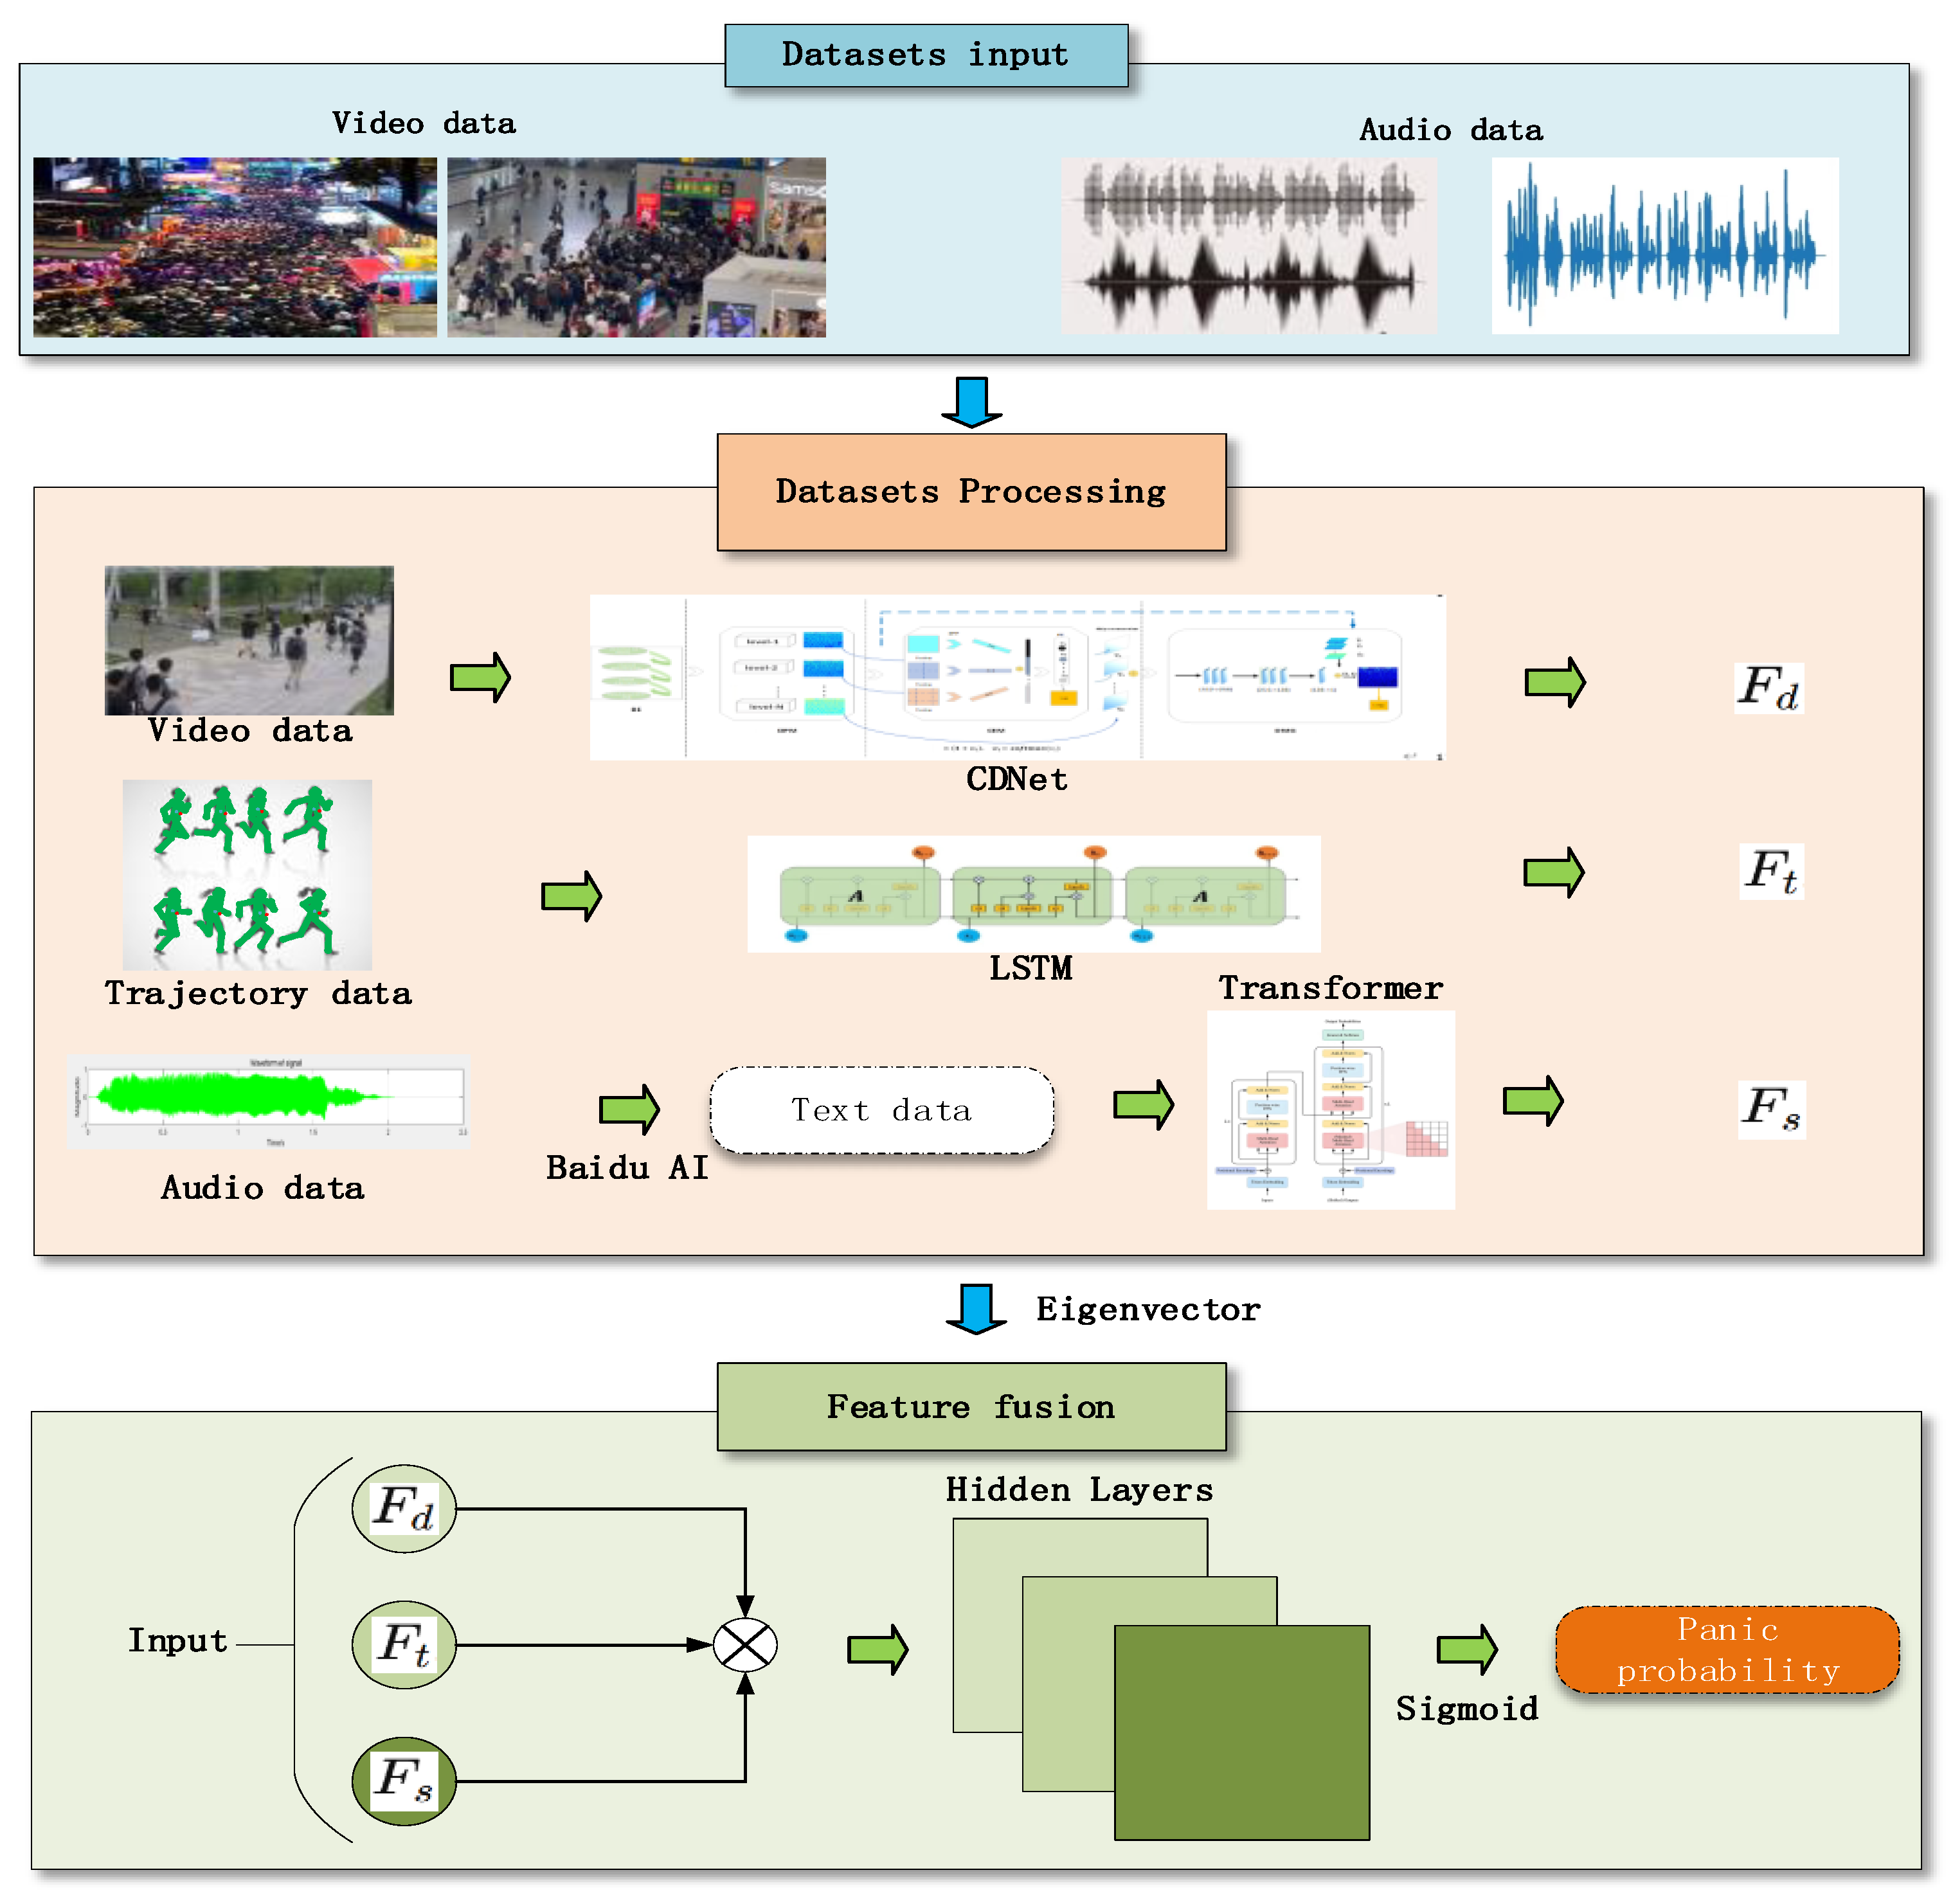
Figure 7.
The real scene of the stampede in Itaewon, South Korea, at around 10:10 p.m. on October 29, 2022. Note that the arrows indicate the direction of the flow of pedestrians, and H and L indicate the high and low areas of the micro-road, respectively.
Figure 7.
The real scene of the stampede in Itaewon, South Korea, at around 10:10 p.m. on October 29, 2022. Note that the arrows indicate the direction of the flow of pedestrians, and H and L indicate the high and low areas of the micro-road, respectively.
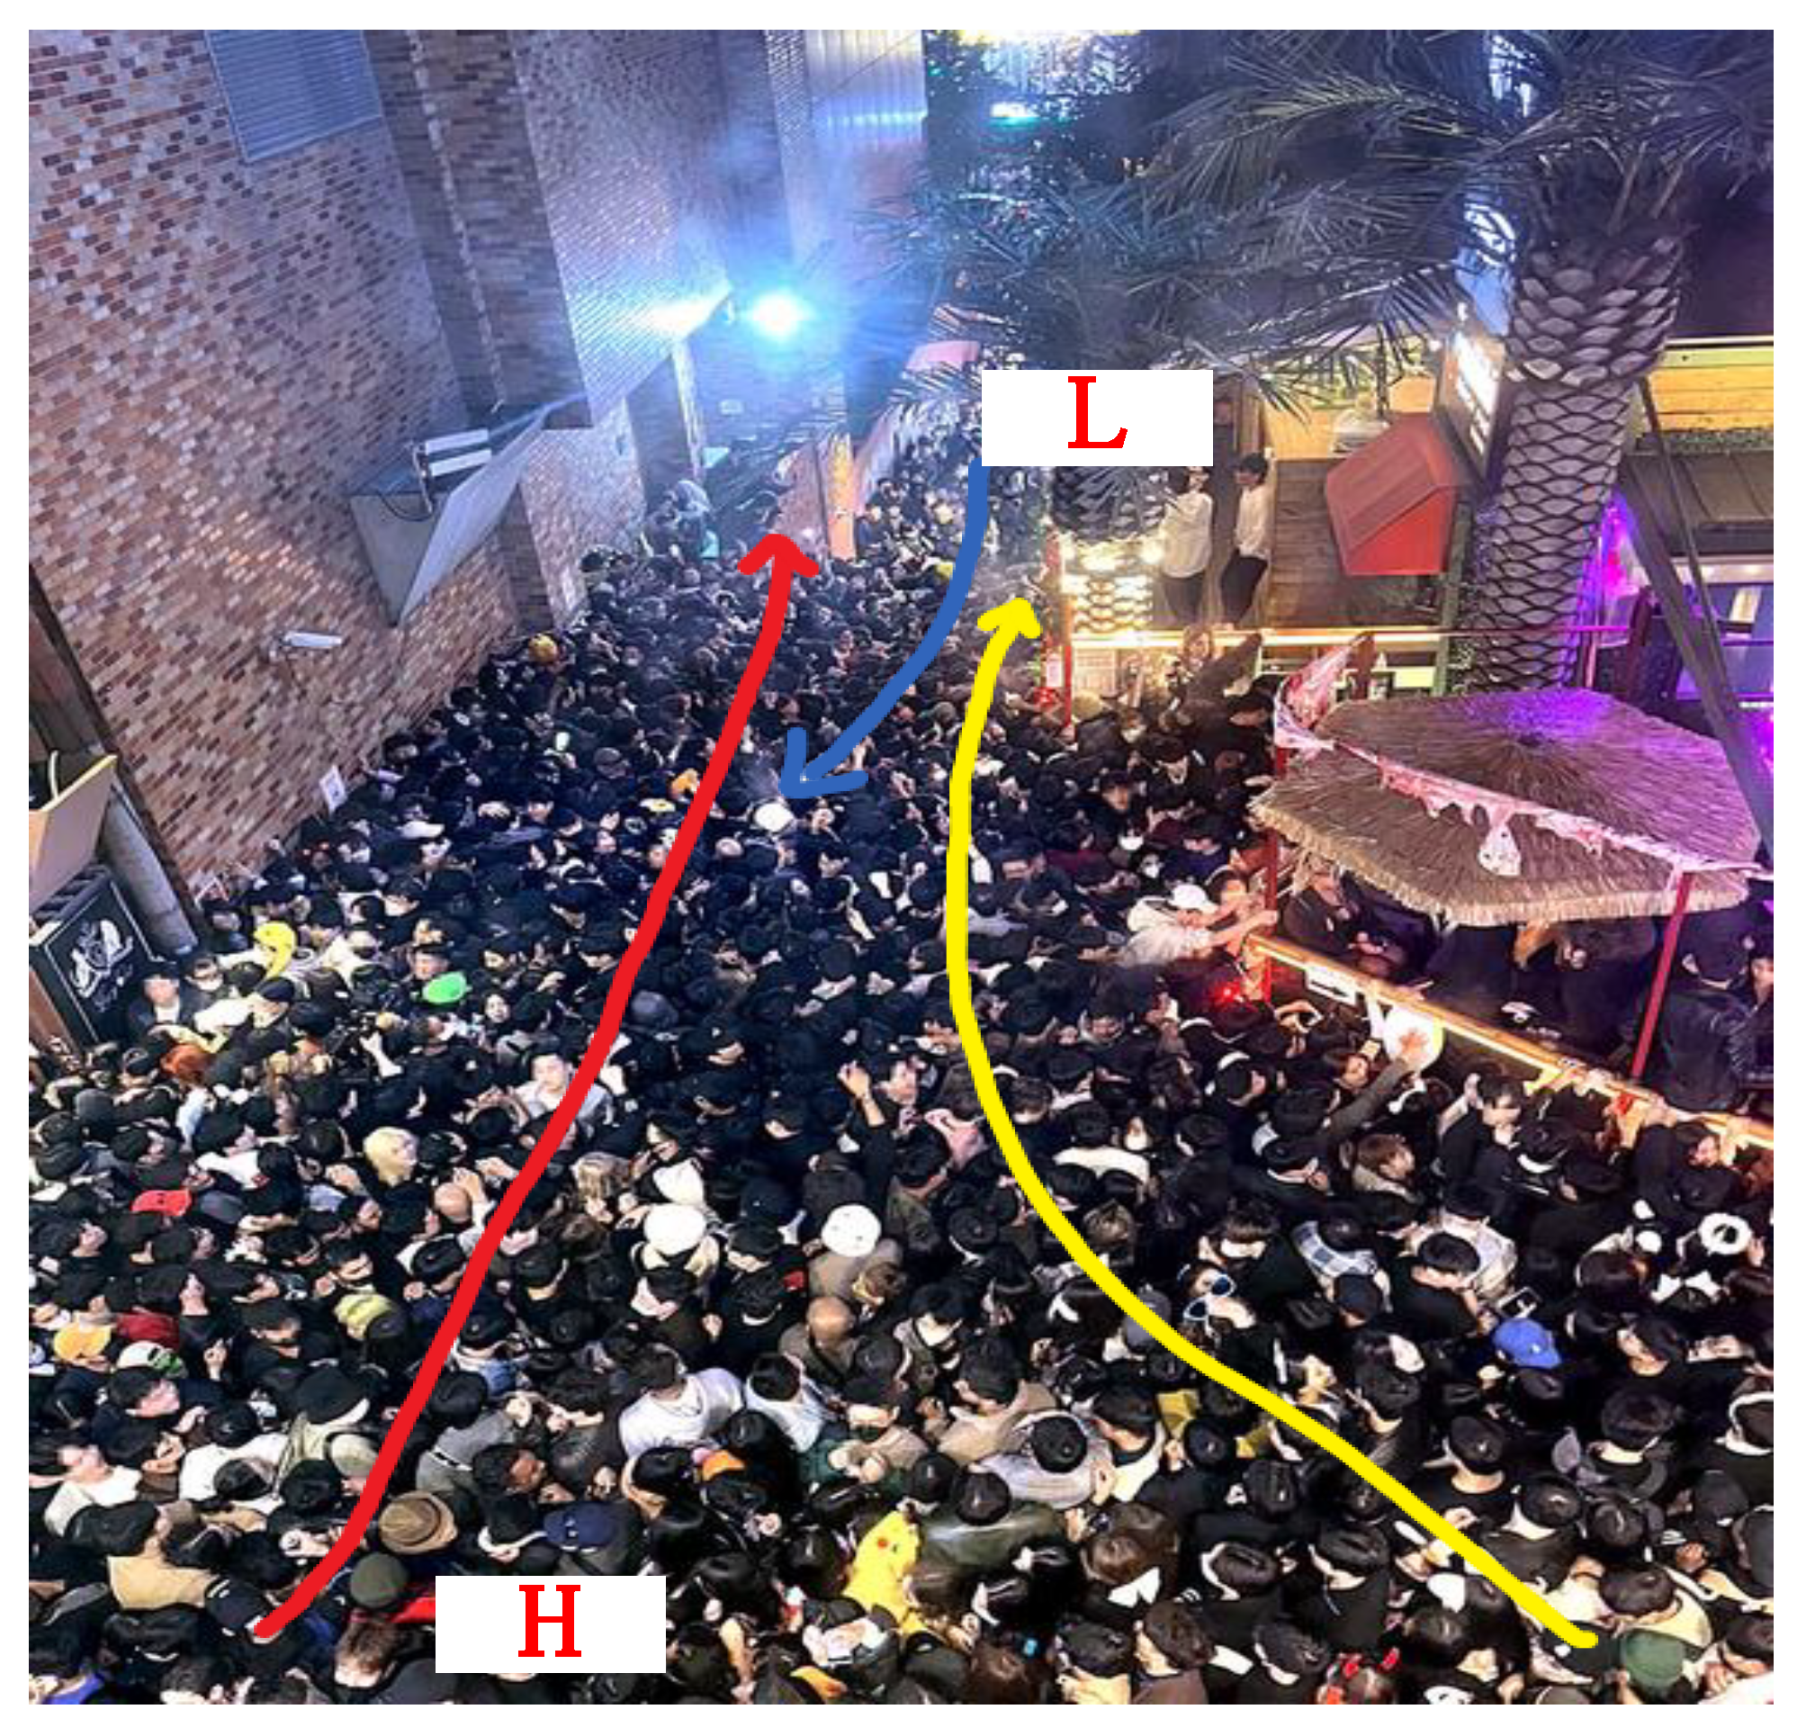
Figure 8.
Microscopic Road Network-Based Panic Area Identification via CDNet and Contour Analysis. (a) Results of crowd counting using CDNet, in which the predicted number of pedestrians is 313.1 and the actual number of pedestrians is 339. (b) Generated heatmap representing population density. (c) Identified panic areas based on contour analysis, where red area is the judged panic area.
Figure 8.
Microscopic Road Network-Based Panic Area Identification via CDNet and Contour Analysis. (a) Results of crowd counting using CDNet, in which the predicted number of pedestrians is 313.1 and the actual number of pedestrians is 339. (b) Generated heatmap representing population density. (c) Identified panic areas based on contour analysis, where red area is the judged panic area.
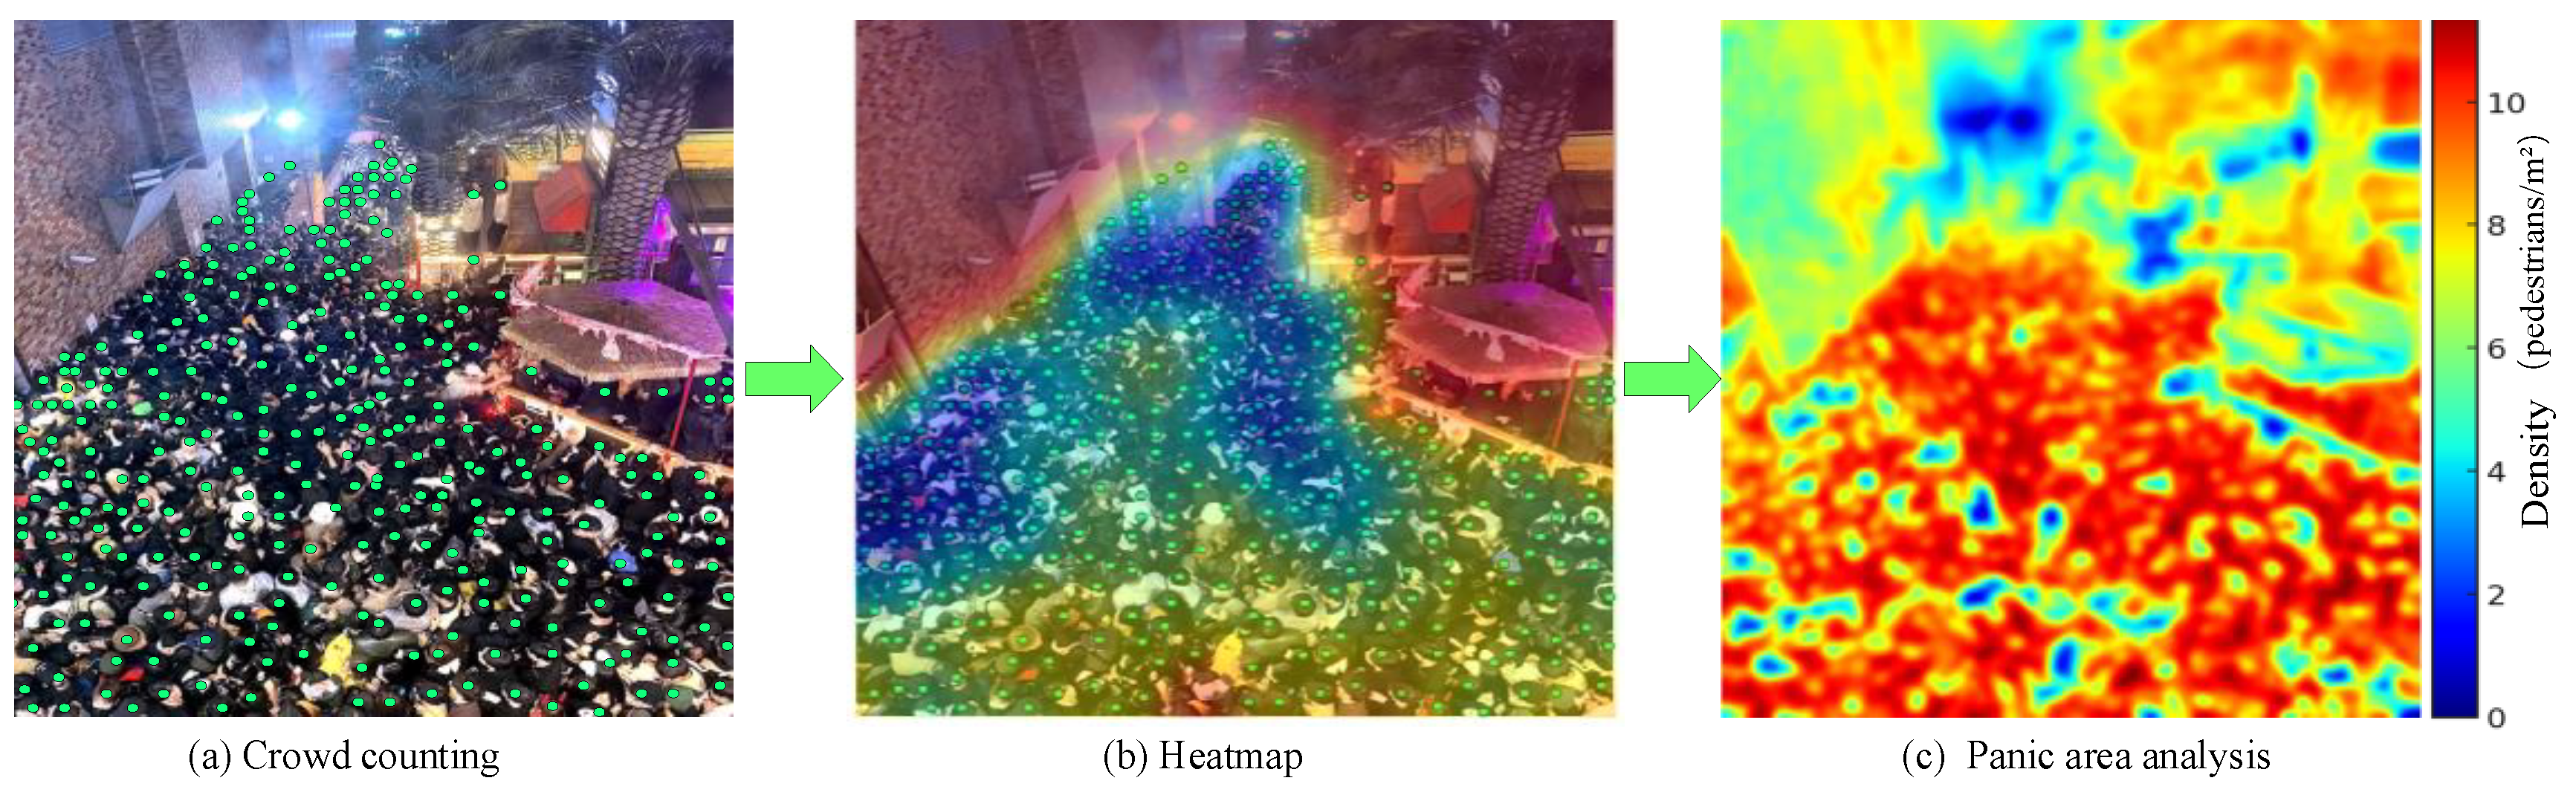
Figure 9.
Result analysis of panic event in the Stampede in Itaewon, South Korea. Note, the steep and non-horizontal transitions of the red dotted panic probability line result from the frame-by-frame computation without temporal smoothing, allowing the model to rapidly respond to sudden panic indicators. Though visually abrupt, these transitions reflect the system's real-time sensitivity and early warning effectiveness.
Figure 9.
Result analysis of panic event in the Stampede in Itaewon, South Korea. Note, the steep and non-horizontal transitions of the red dotted panic probability line result from the frame-by-frame computation without temporal smoothing, allowing the model to rapidly respond to sudden panic indicators. Though visually abrupt, these transitions reflect the system's real-time sensitivity and early warning effectiveness.
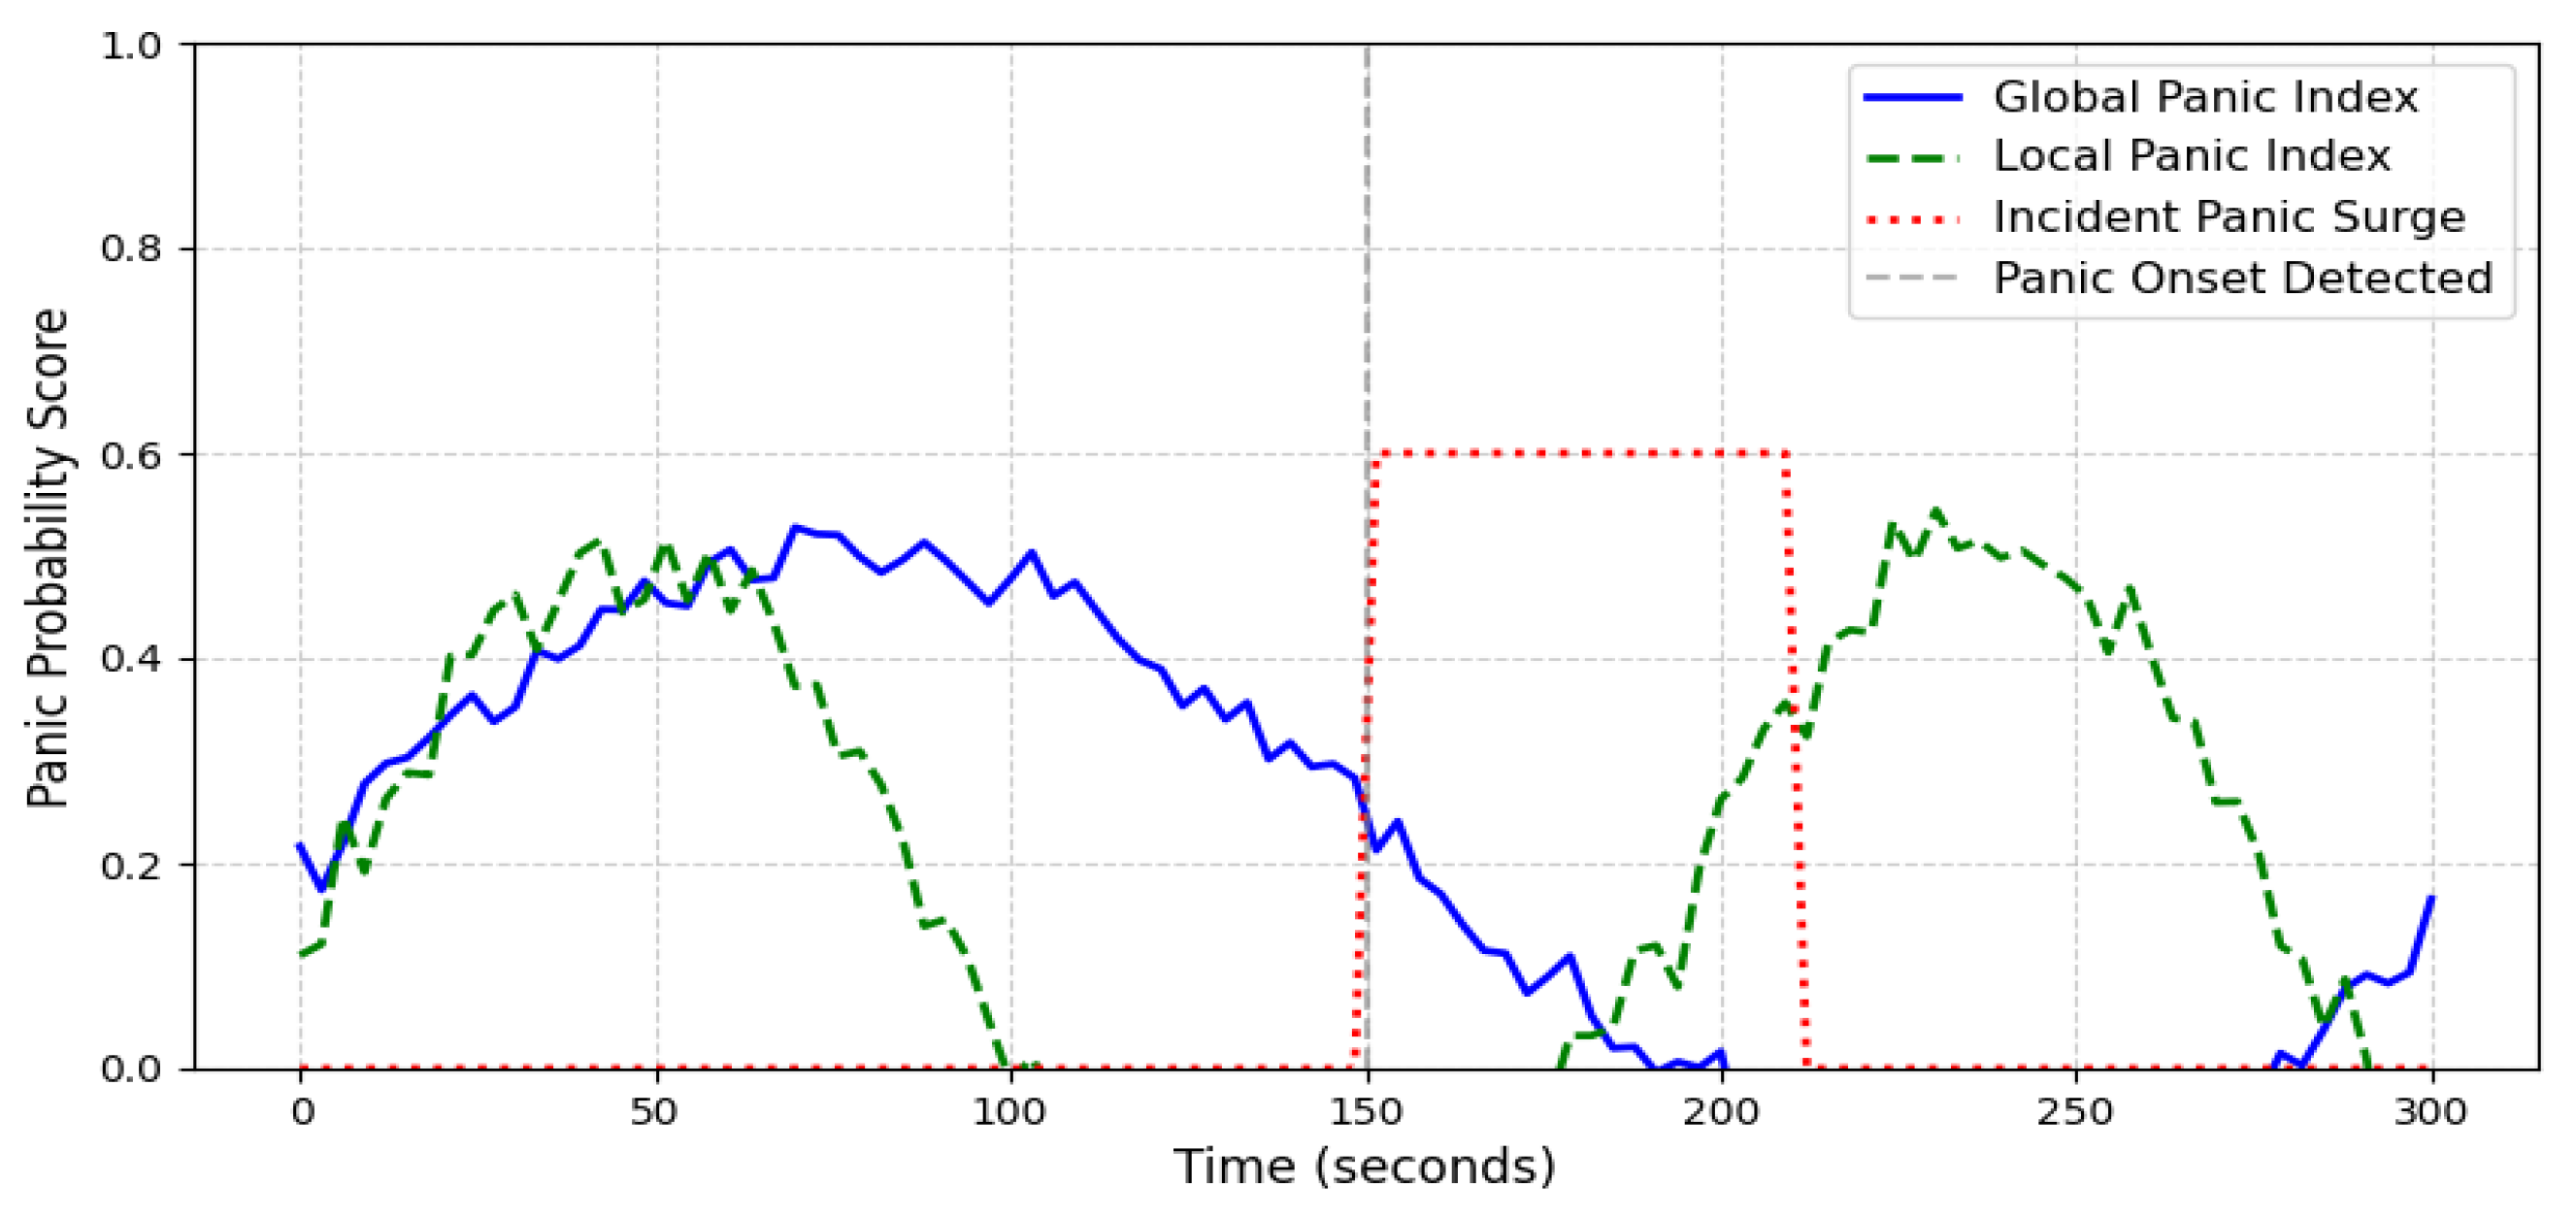

Table 1.
Related methods of abnormal behavior detection.
| NO. | Reference | Method | Data Source | Feature | Susceptible factor |
| 1 | Zhao, R.Y.et al.[18] | Open pose, dynamic centroid model | Experiment Volunteers, a set of falling activity records | Acceleration, mass inertial of human body subsegments, and internal constraints | Simple group behavior patterns |
| 2 | Li N.et al.[22] | Decision tree classifier | Experiment Volunteers, a set of falling activity records | Acceleration, tilting angle, and still time | Environment |
| 3 | D. Pan et al.[23] | Multisensory data fusion with Support Vector Machine (SVM) | Experiments of 100 Volunteers | Acceleration | Multi-noise or multi-source environments |
| 4 | J. Li et al.[24] | Variational abnormal behavior detection (VABD) | UCSD, CUHK, Corridor, ShanghaiTech | Motion consistency | Sensitivity |
| 5 | S. Guo et al.[25] | Improved k-means | UMN | Velocity vector | Sensitivity |
| 6 | Huo, F.Z et al.[26] | Simulation | / | Move probability | Sensitivity |
| 7 | Zhong, S et al.[27] | LK optical flow method | UMN | Intersection density | Environment |
| 8 | CW et al.[28] | CNN and LSTM | Fall Detection Dataset | Fall, down | Real-time |
| 9 | Qiu. J.F. et al.[29] | Partitioned Convolutional Neural Network | / | Cognitive impairment | Simple group behavior patterns |
| 10 | Vin V et al.[30] | Two-stream CNN | Avenue Dataset | Racing, tossing objects, and loitering | False positives |
Table 2.
Statistical table of key segment weights of semantic recognition criterion.
| NO. | Event type | Key word | Turnout | Weight | NO. | Event type | Key word | Turnout | Weight | |||||||||
| 1 | Medical accident | Murder | 152 | 0.51 | 2 | Stampede | Let me out | 13 | 0.04 | |||||||||
| 3 | Medical accident | Stabbing | 76 | 0.25 | 4 | Stampede | Don't push me | 32 | 0.11 | |||||||||
| 5 | Medical accident | Help | 21 | 0.07 | 6 | Stampede | Someone fell | 57 | 0.19 | |||||||||
| 7 | Medical accident | Pay with your life | 38 | 0.13 | 8 | Stampede | Trampled to death | 73 | 0.24 | |||||||||
| 9 | Medical accident | Black-hearted | 2 | 0.01 | 10 | Stampede | Crushed to death | 53 | 0.18 | |||||||||
| 11 | Medical accident | Disregard for human life | 7 | 0.02 | 12 | Stampede | Can't breathe | 50 | 0.17 | |||||||||
| 13 | Medical accident | Misdiagnosis | 4 | 0.01 | 14 | Stampede | Help | 22 | 0.07 | |||||||||
| 15 | Disaster event | Landslide | 32 | 0.11 | 16 | Terrorist attack | Kidnapping | 42 | 0.14 | |||||||||
| 17 | Disaster event | Earthquake | 57 | 0.19 | 18 | Terrorist attack | Explosion | 36 | 0.12 | |||||||||
| 19 | Disaster event | Fire | 28 | 0.09 | 20 | Terrorist attack | Bomb | 48 | 0.16 | |||||||||
| 21 | Disaster event | Mudslide | 23 | 0.08 | 22 | Terrorist attack | Gun | 47 | 0.16 | |||||||||
| 23 | Disaster event | Flood | 45 | 0.15 | 24 | Terrorist attack | Poison gas | 35 | 0.11 | |||||||||
| 25 | Disaster event | Tornado | 42 | 0.14 | 26 | Terrorist attack | Dead body | 26 | 0.09 | |||||||||
| 27 | Disaster event | Tsunami | 73 | 0.24 | 28 | Terrorist attack | Murder | 66 | 0.22 | |||||||||
Table 3.
The statistical distribution of datasets.
| Dataset | Videos | Density(pedestrians/) | Panic Events |
| Stampede in Itaewon | 30 | 8.7 | 47 |
| UCF Crowd | 150 | 2.8 | 24 |
| Simulated Data | 160 | 4.0 | 15 |
Table 4.
Performance Comparison in Ablation Study.
| Model Configuration |
Accuracy (%) |
F1-score (%) |
Inference Speed (FPS) |
| Density-Only | 74.5 | 76.3 | 50 |
| Trajectory-Only | 77.2 | 79.1 | 48 |
| Semantic-Only | 72.8 | 74.9 | 53 |
| Density + Trajectory | 81.6 | 83.4 | 45 |
| Density + Semantic | 78.9 | 80.7 | 47 |
| Trajectory + Semantic | 76.5 | 78.2 | 49 |
| Full Model | 91.7 | 88.2 | 40 |
Disclaimer/Publisher’s Note: The statements, opinions and data contained in all publications are solely those of the individual author(s) and contributor(s) and not of MDPI and/or the editor(s). MDPI and/or the editor(s) disclaim responsibility for any injury to people or property resulting from any ideas, methods, instructions or products referred to in the content. |
© 2025 by the authors. Licensee MDPI, Basel, Switzerland. This article is an open access article distributed under the terms and conditions of the Creative Commons Attribution (CC BY) license (https://creativecommons.org/licenses/by/4.0/).
Copyright: This open access article is published under a Creative Commons CC BY 4.0 license, which permit the free download, distribution, and reuse, provided that the author and preprint are cited in any reuse.