Submitted:
10 April 2025
Posted:
11 April 2025
You are already at the latest version
Abstract
Objectives:
Trauma patients often cannot communicate a preferred hospital destination to emergency medical services (EMS) due to injuries or impaired consciousness. EMS teams, therefore, determine hospital destinations, potentially influencing access to care. This study examines differences in Level 1 trauma admissions between a county hospital (CH) and an academic health center (AHC) within two miles of each other, focusing on transport patterns and their association with patient demographics.
Methods:
We conducted a retrospective review of patient charts and EMS transport records, analyzing demographic data, hospital destinations, EMS pickup locations, and documented reasons for hospital selection.
Results:
Among 1520 patients transported to CH and 625 to AHC, significant differences in transport patterns were observed. White patients were more likely than minority patients to be taken to the nearest hospital (53.1% vs. 46.4%, p=0.003) and less likely to bypass it (21.2% vs. 33.0%, p< 0.001). Minority patients disproportionately bypassed AHC for CH (46.6% vs. 24.6%, p< 0.001), while only 3.8% bypassed CH for AHC. AHC admitted more Black patients (47.4% vs. 37.1%, p< 0.001), while CH admitted more Hispanic patients (10.1% vs. 5.6%, p< 0.001). AHC patients had higher Medicare and Medicaid coverage, whereas CH had more uninsured patients.
Conclusion:
EMS transport patterns reveal disparities in trauma care access linked to race, ethnicity, and insurance status, underscoring the need for equitable EMS protocols and resource allocation.
Keywords:
bias
; trauma
; traumatic injury
; disparities
; demographics
; health equity
; health outcomes
1. Introduction
Efficient and timely transport of trauma patients by emergency medical services (EMS) plays a pivotal role in optimizing outcomes. Amidst urgent trauma situations, there are many instances when EMS providers have the sole decision-making power regarding which facility to take the patient. Trauma patients, frequently incapacitated or unable to articulate a preferred medical facility, place an added responsibility on EMS providers to make a swift and well-informed selection. Past studies have found that EMS services may frequently bypass the nearest medical facility, even when accounting for the nature and severity of injuries.1 The challenge in studying these patterns of transport lies in navigating a complex network of hospitals, each equipped with varying levels of trauma care capabilities, preferred insurance options, and past patient engagement. All these factors can make drawing retrospective conclusions about decision-making difficult. Investigating historical patterns of EMS transport reveals that disparities in outcomes may be influenced by the demographic distribution of trauma patients among various medical facilities. Studies have demonstrated a correlation between patient race/ethnicity and the quality of care provided.2, 3 Additionally, literature indicates that race plays a role in which hospital patients are transported to, even accounting for patients in the same zip code.4, 5
Across the country, governing bodies and municipalities have outlined guidelines for EMS transport to help ensure proper transport is conducted. Most importantly, many guidelines state that EMS providers must take patients to the nearest capable facility, unless there is evidence that the patient will have a better outcome at a different facility.6 An example of this would be the state of Illinois, which mandates that EMS services take patients to “the nearest hospital, regional trauma center or trauma center unless the medical benefits to the patient reasonably expected from the provision of appropriate medical treatment at a more distant facility outweigh the increased risks”. 7 Other guidelines, such as those for the Indianapolis EMS organization, instruct providers to respect patient’s preference in hospital choice, but also adds that “Indianapolis EMS providers reserve the right to transport to a more appropriate location” should they disagree with that preference.8 This highlights the deference given to EMS providers in the ultimate choice of transport destination.
This study aims to use admission data in the city of Indianapolis to compare trauma admissions between a county hospital (CH) and an academic health center (AHC), both Level 1 Trauma Centers two miles from each other in the downtown metro region of Indianapolis, within the same county and city. In addition to their similar scope and regional coverage, both facilities are staffed by physicians mostly employed by the same academic system (Indiana University Health) and both are heavily involved in physician and student training programs in the city. As such, apart from the funding mechanisms and ownership of the facilities, the level of care should be nearly identical between the two hospitals in this paper, although no specific study has been conducted comparing outcomes. We are interested in identifying any differentiating factors between patients that are transported to these hospitals. Moreover, we examine the likelihood of EMS to transport the patient to the closer facility after excluding patients transported to either facility preferentially due to formalized protocols. To our knowledge, this manuscript represents the first in the literature to directly compare characteristics of trauma admissions between a county hospital and an academic health center covering a similar geographic area in a major U.S. city.
2. Methods
2.1. Study Design
This study was conducted as a retrospective analysis of transport patterns in Indianapolis, IN, USA from January 1, 2022 to December 31, 2022. We obtained the census of completed EMS patient transports to both Indiana University Health Methodist Hospital (an AHC) and Sidney & Lois Eskenazi Hospital (a CH). The study used data collected through the trauma registry at each hospital, as guided by the American College of Surgeons certification program, and the electronic medical record (EMR) system that included the run sheets for EMS. The relevant patient data was retrieved, including injury type, insurance status, race/ethnicity, reason for transport, and location of pickup. Any additional information, such as patient spoken language, was obtained through individual patient chart review. Google Maps was used to determine whether the patient was transported to the nearest of the two hospitals.
2.2. Data Collection
Data collection involved systematically reviewing EMS census data as well as patient charts to compile demographic data on each patient. The EMS census data was provided directly by the receiving hospitals. To ensure data accuracy and completeness, overlapping information was cross-checked with patient charts at each of the receiving hospitals. To simplify and standardize the determination regarding whether EMS bypassed either of the facilities in its transport, a procedure using Google Maps was formulated. The algorithm is outlined in Figure 1 below. Patient transports were categorized as either “yes” (patient was taken to closest facility), “no” (patient was taken to further facility), or “negligible” (described in detail below).
The patient pickup location was determined using the street address when available. If no street address was provided, the closest intersection was used (commonly in MVCs). When neither was available, the zip code and scene description (e.g., a highway or interstate) were used to approximate the location. The drive time and distance from the pickup location to the two hospitals were then compared. If the drive time to one hospital exceeded the other by more than 3 minutes, this was considered a significant difference, and distance was not further analyzed. For drive time differences under 3 minutes, the closer facility was determined based on distance in road miles. Differences under 3 minutes in drive time and under 2 miles in distance were classified as negligible. This threshold was chosen because the two hospitals are only 2 road miles apart. Additionally, many transports enter the city from an interstate exit about 4–5 minutes closer to AHC than CH, but still within 2 miles of both hospitals. The 3-minute cutoff ensured that cases like these, where a simple distance difference exists, were not misclassified as negligible.
2.3. Data Analysis
The collected demographic data and patient transport categorizations were analyzed using SPSS version 29.0.1.0. We used chi-square testing or Fisher’s exact test (when entries were less than 5) with statistical significance determined by p < 0.05. A set of exclusion criteria were developed to eliminate confounding variables before undertaking transport analysis of patients transported to AHC and CH. The criteria for exclusion were the following: patients with expressed preference for a facility, law enforcement-influenced transport, instances of diversion, or burn injury. CH is the only facility in the area with a dedicated burn center. As such, we wanted to exclude these possible confounding factors, which could influence transport by some EMS teams.
3. Results
3.1. Demographic Data
The study included 1520 patients from CH and 625 patients from AHC. Demographic, transportation, and insurance parameters were compared between the two groups, see Table 1. The mean age of CH patients was 40.1±17.4 years, compared to 44.7±20.6 years for the AHC patients (p<0.001). A significant difference in gender distribution was observed (p=0.003) with a greater proportion of males transported to CH as compared to AHC (73.4% vs 67.0%, p=0.003). The distribution of patients’ race and ethnicity differed significantly between the two facilities (p<0.001). A greater proportion of Non-Hispanic White (50.1% vs 45.0%, p=0.049) and Hispanic patients were transported to CH (10.1% vs 5.6%, p<0.001), while a greater proportion of Black patients were transported to AHC (47.4% vs 37.1%, p<0.001). English was the predominant primary language spoken in both patient populations. A higher proportion of Spanish speakers were taken to CH (7.3% vs. 2.7%, p<0.001). CH had a higher proportion of patients with an Injury Severity Score (ISS) from 1-9 (59.2% vs. 53.6%, p=0.01) and a lower proportion of patients with a score from 31-75 (4.8% vs 7.8%, p=0.006).
Transport company and police status/custody also exhibited significant differences between the two facilities. Indianapolis EMS was responsible for 82.4% of patients taken to AHC, vs 57.9% at CH (p < 0.001). A significantly higher proportion of transports to CH compared to ACH were carried out by Wayne Township (14.5% vs 3.7%, p<0.001). Patients in police custody were always taken to CH, as per historical preference.
Many significant differences were noted regarding patient insurance status. Notably, AHC exhibited a higher proportion of Medicare (18.4%) and Medicaid (22.2%) beneficiaries compared to CH (10.9% and 12.8%, respectively, p<0.001). Conversely, CH treated a greater proportion of patients with commercial insurance or self-payers in contrast to AHC. AHC treated a significantly larger proportion of patients with “other'' government insurance (20.2%) compared to CH (2.0%, p<0.001). An important note is that all patients without insurance status on file at the time of transport were coded as “self-pay.” Additionally, all marketplace plans not specified at Medicaid/Medicare were recorded as “Other Commercial.” As we are assessing the potential bias due to factors present at the time of transport, this does not present a major limitation.
3.2. Transport Data
Out of 1520 patients transported to CH, 1356 fit the inclusion criteria to undergo transport analysis and 584/625 patients transported to AHC met inclusion criteria for transport analysis, see Table 2 and Figure 2. More White patients were transported to the nearest hospital than minority patients (53.1% vs 46.4%) and less White patients bypassed the nearest hospital than minority patients (21.2% vs 33.0%, p < 0.001). Table 3 and Figure 3 display hospital specific transport patterns. Minorities were more likely to bypass AHC and be admitted to CH than White patients (46.6% vs 24.9%, p < 0.001); meanwhile only 3.8% of minorities bypassed CH to be admitted to AHC. Between White and minority patients, a higher percentage of minorities were transported to AHC when AHC was the closer facility (68.3% vs 82.1%, p<0.001).
4. Discussion
The consequences of implicit and systemic bias in emergent medical situations have been documented. Manifestations of bias present in situations ranging from geographic location of injury to equipment overestimation of pulse oximetry readings among Black patients.9, 10 Previous studies have demonstrated that racial minorities in the United States are more likely than White patients to receive care at hospitals that rank lower in multiple metrics, correlating with well-established rates of worse clinical outcomes among these racial groups.11,12,13 Prior studies have found that race and health insurance impact rates of appendiceal ruptures presenting at hospitals. Despite clear evidence of these disparities, the literature is unclear as to the extent of bias on the part of healthcare personnel versus the impact of systemic and socioeconomic disparities on those outcomes.
Recently, attention has turned to the impact of emergency medical services in potentially maintaining systemic disparities in patient care by transporting patients to different facilities based on their race or other demographic factors. Hanchate, et al found a striking rate of EMS bypassing the nearest facility in transport when the patient was of a racial minority as compared to when the patient was White.5 These non-White patients were more likely to be transported to a safety-net hospital than their White counterparts. Similarly, Pack, et al found that black and Hispanic patients were more likely to be transported to a different facility than White patients from the same area.4 However, both studies noted that patient preference may be a major confounding variable in their analysis. To our knowledge, this study represents the first direct comparison of patients transported by EMS with confounders removed between similar facilities serving much of the same geographic area.
In the analysis of trauma admissions between CH and AHC, demographic variations, such as age, gender, insurance status, and injury severity, were evident between the two hospitals. Overall, the demographic makeup of patients transported to CH was 50.1% white, 37.1% black, 10.1% Hispanic, and 1.6% Asian, as compared to AHC, with 45.0% white, 47.4% black, 5.6% Hispanic, and 1.0% Asian. For reference, according to the 2020 census, the demographic makeup of Marion County was 51.8% white, 30% black, 11.6% Hispanic, and 4.4% Asian.16 These discrepancies between the demographics and patient transport patterns by EMS to each facility could be explained by a variety of factors, ranging from community reputation of either facility to access afforded by public transit.
Such differences in the observed patient populations at each facility in Table 1 may indicate differences in transport patterns, however, these data were analyzed without applying transport inclusion criteria. As such, a significant proportion of patients were transported to either institution over the other due to factors that could be considered valid, and not due to implicit bias. Examples of such instances include the potential confounding factors listed under the methods section.
It’s important here to note that according to official policy, traditional diversion status was no longer in effect for these facilities for the year of 2022. Instead, an “alternate destination protocol” was created to encourage EMS to balance transports between these two facilities. In regards to this protocol, the Chief of the Indianapolis EMS provided the following explanation; “The IEMS (and overall Marion County) protocol allows transport to the most appropriate facility of the patient's choice. If a patient is unable [to express a choice], then it is up to the EMS providers to decide where to take the patient provided it is an appropriate destination for the condition. Essentially, if the patient doesn’t have the ability to choose, the crews will make that determination. The reason they choose [one facility] over the other is often not due to any specific data or metrics, [rather it could be] traffic related, a “feeling” [the drivers] have about one center over the other, etc.” After careful review of EMS documentation, we determined that there was indeed no recorded or documented evidence of any protocol favoring one institution over another in these cases. Further explanation from the EMS providers yielded the following explanation; “When they refer to “protocol” [in documentation] they are referring to the requirement that the patient meets trauma alert criteria, and therefore must go to a [Level 1] trauma center. There is no “protocol” dictating one hospital over the other [for EMS crews]. The only patients with EMS documentation indicating a diversion, and thus warranting exclusion, were patients that were enroute to another facility that diverted them to either AHC or CH.”
The most significant disparities were observed in patient race and ethnicity when transport patterns and rates of nearest facility bypassing during transport were analyzed. Several confounding variables (as listed in methods section) were removed for the analysis, suggesting continued potential biases in the transport process. The data in Table 2 and Table 3 show that a higher proportion of minorities bypassed the AHC to be admitted to the CH compared to White patients. The converse did not hold, where more minorities bypassed the CH to be admitted to the AHC. While there are many potential explanations for this disparity, the elimination of confounders and the focus on the binary choice between two nearby but distinct institutions indicates that implicit or systemic racial or socioeconomic bias may have played a role in determining the destination facility by EMS. Additionally, the findings are consistent with prior research in similar cities showing higher rates of EMS bypass of nearest hospital destinations in Black and Hispanic patients, which could be explained by the historic concentration of Black patients in a small subset of American hospitals.17 Table 1 shows that CH was more likely to have patients that were self pay or no insurance based on designation over the AHC. Such as, Black patients being more likely than White patients to be transferred to public hospitals and lack of patient insurance being associated with lower instances of ED transfer.18,19 While the indications and decision-making in instances of ED transfer differ from those involved in the initial transport to the ED, the potential for implicit bias exhibited by decision-makers regarding patients’ race, ethnicity, or insurance status could similarly be a contributing factor.
This study is part of a small but growing emphasis on disparities in trauma transport. The data described provide valuable insight into differences that exist in trauma transport, and these findings should prompt review of health systems procedures to ensure that biases are not impacting patient care. However, this study had certain major limitations that make definitive conclusions difficult. Chief among these is the fact that this study did not interview or collect data on EMS personnel responsible for transporting patients and their decision-making, which limits the ability to understand why trauma patients were transported to CH or AHC in the heat of the moment. This is seen with the fact that patient transport patterns to AHC or CH differed among the various EMS providers that service the two facilities. The differences between EMS transport patterns could be structural (ambulance equipment or other specifications, etc), logistical (due to paperwork, system compatibility, etc), or even due to driver idiosyncrasies (driver more familiar with route to one facility over the other, etc), but determining such factors is extremely difficult.
The two institutions state that there are no variations in transport protocol that would be expected to produce the findings we describe. Many of the physicians staffed at these hospitals work at both facilities and are held to the same high standards for excellence in patient care. Additionally, the complicated system that directs transport patterns between these two facilities when other hospitals are on diversion is complex and difficult to analyze retrospectively. The fact that an “alternate destination protocol” was in place and yet not specifically recorded in any EMS documentation makes analyzing its potential effects difficult. The retrospective nature of this study imparts its own inherent bias on the analysis. There are instances when the sample sizes were small for the analysis, thus making drawing definitive conclusions difficult. Future directions could include analyzing data over a longer period. Interviewing additional EMS personnel, administrators, and drafters of the transport protocol could shed more insight into decision making.
5. Conclusions
This study is among the first to analyze the association between patient demographics and transport patterns by emergency medical services. Our study further differentiates itself by specifically comparing admission between two Level 1 trauma centers both serving the same major U.S. city. We found that transport patterns for White vs minority patients differed between those arriving at the county hospital and academic health center. We found that minority patients are more likely to bypass the closer AHC and be transported to CH. This study adds to the findings of previous studies that have demonstrated disparities in transport patterns that correlate with differences in patient demographics. Further studies are needed to investigate biases in trauma transport and understand the complexity of EMS providers’ decision-making. However, understanding that trauma transport exists in the larger context of a healthcare system which has historically disadvantaged minorities is vital to approaching this topic. It is likely that any resultant disparities are influenced by a confluence of systemic barriers, socioeconomic factors, and implicit bias. Further understanding of disparities in trauma transport is therefore just one piece of the puzzle that could help us implement changes to minimize biases and work toward creating a more equitable healthcare system.
References
- Hanchate AD, Baker WE, Paasche-Orlow MK, Feldman J. Ambulance diversion and ED destination by race/ethnicity: evaluation of Massachusetts’ ambulance diversion ban. BMC Health Services Research. 2022;22(1). [CrossRef]
- Jha AK, Orav EJ, Li Z, Epstein AM. Concentration and Quality of Hospitals That Care for Elderly Black Patients. Archives of Internal Medicine. 2007;167(11):1177. [CrossRef]
- Jha AK, Orav EJ, Zheng J, Epstein AM. The Characteristics And Performance Of Hospitals That Care For Elderly Hispanic Americans. Health Affairs. 2008;27(2):528-537. [CrossRef]
- Pack CE, Partain AT, Crowe RP, Brown LH. Ambulance Transport Destinations In The US Differ By Patient Race And Ethnicity. Health Affairs. 2023;42(2):237-245. [CrossRef]
- Hanchate AD, Paasche-Orlow MK, Baker WE, Lin MY, Banerjee S, Feldman J. Association of Race/Ethnicity With Emergency Department Destination of Emergency Medical Services Transport. JAMA Network Open. 2019;2(9):e1910816. [CrossRef]
- Department of Health and Human Services. OIG Compliance Program Guidance for Ambulance Suppliers. Federal Register. March 24, 2003. 2003;68:15251. https://oig.hhs.gov/documents/compliance-guidance/800/032403ambulancecpgfr.pdf.
- Emergency Medical Services (EMS) Systems Act. Ilga.gov. Published 2024. https://www.ilga.gov/legislation/ilcs/ilcs3.asp?ActID=1226.
- Indiana Emergency Medical Services FAQ. Health and Hospital Corporation. Published 2024. https://indianapolisems.org/faq.
- Ventura CAI, Denton EE, Asack BR. Implications of systemic racism in emergency medical services: On prehospital bias and complicity. eClinicalMedicine. 2022;50(101525). [CrossRef]
- Bickler PE, Feiner JR, Severinghaus JW. Effects of Skin Pigmentation on Pulse Oximeter Accuracy at Low Saturation. Anesthesiology. 2005;102(4):715-719. [CrossRef]
- Dimick J, Ruhter J, Sarrazin MV, Birkmeyer JD. Black Patients More Likely Than Whites To Undergo Surgery At Low-Quality Hospitals In Segregated Regions. Health Affairs. 2013;32(6):1046-1053. [CrossRef]
- Popescu I, Cram P, Vaughan-Sarrazin MS. Differences in Admitting Hospital Characteristics for Black and White Medicare Beneficiaries With Acute Myocardial Infarction. Circulation. 2011;123(23):2710-2716. [CrossRef]
- Roizen MF. Neighborhoods Matter: Use of Hospitals With Worse Outcomes Following Total Knee Replacement by Patients From Vulnerable Populations. Yearbook of Anesthesiology and Pain Management. 2008;167(2):9-10. [CrossRef]
- Guagliardo, MF. Guagliardo MF. Racial and Ethnic Disparities in Pediatric Appendicitis Rupture Rate. Academic Emergency Medicine. 2003;10(11):1218-1227. [CrossRef]
- Pieracci FM, Eachempati SR, Barie PS, Callahan MA. Insurance Status, but Not Race, Predicts Perforation in Adult Patients with Acute Appendicitis. Journal of The American College of Surgeons. 2006;205(3):445-452. [CrossRef]
- U.S. Census Bureau QuickFacts: Marion County, Indiana. www.census.gov. https://www.census.gov/quickfacts/marioncountyindiana.
- Hanchate AD, Qi D, Stopyra JP, Paasche-Orlow MK, Baker WE, Feldman J. Potential bypassing of nearest emergency department by EMS transports. Health Services Research. 2021;57(2). [CrossRef]
- Hsuan C, Vanness DJ, Zebrowski A, et al. Racial and ethnic disparities in emergency department transfers to public hospitals. Health Services Research. 2024;59(2). [CrossRef]
- Ward MJ, Sayeh Nikpay, Shermeyer A, et al. Interfacility Transfer of Uninsured vs Insured Patients With ST-Segment Elevation Myocardial Infarction in California. JAMA network open. 2023;6(6):e2317831-e2317831. [CrossRef]
Figure 1.
Transport Analysis Algorithm.
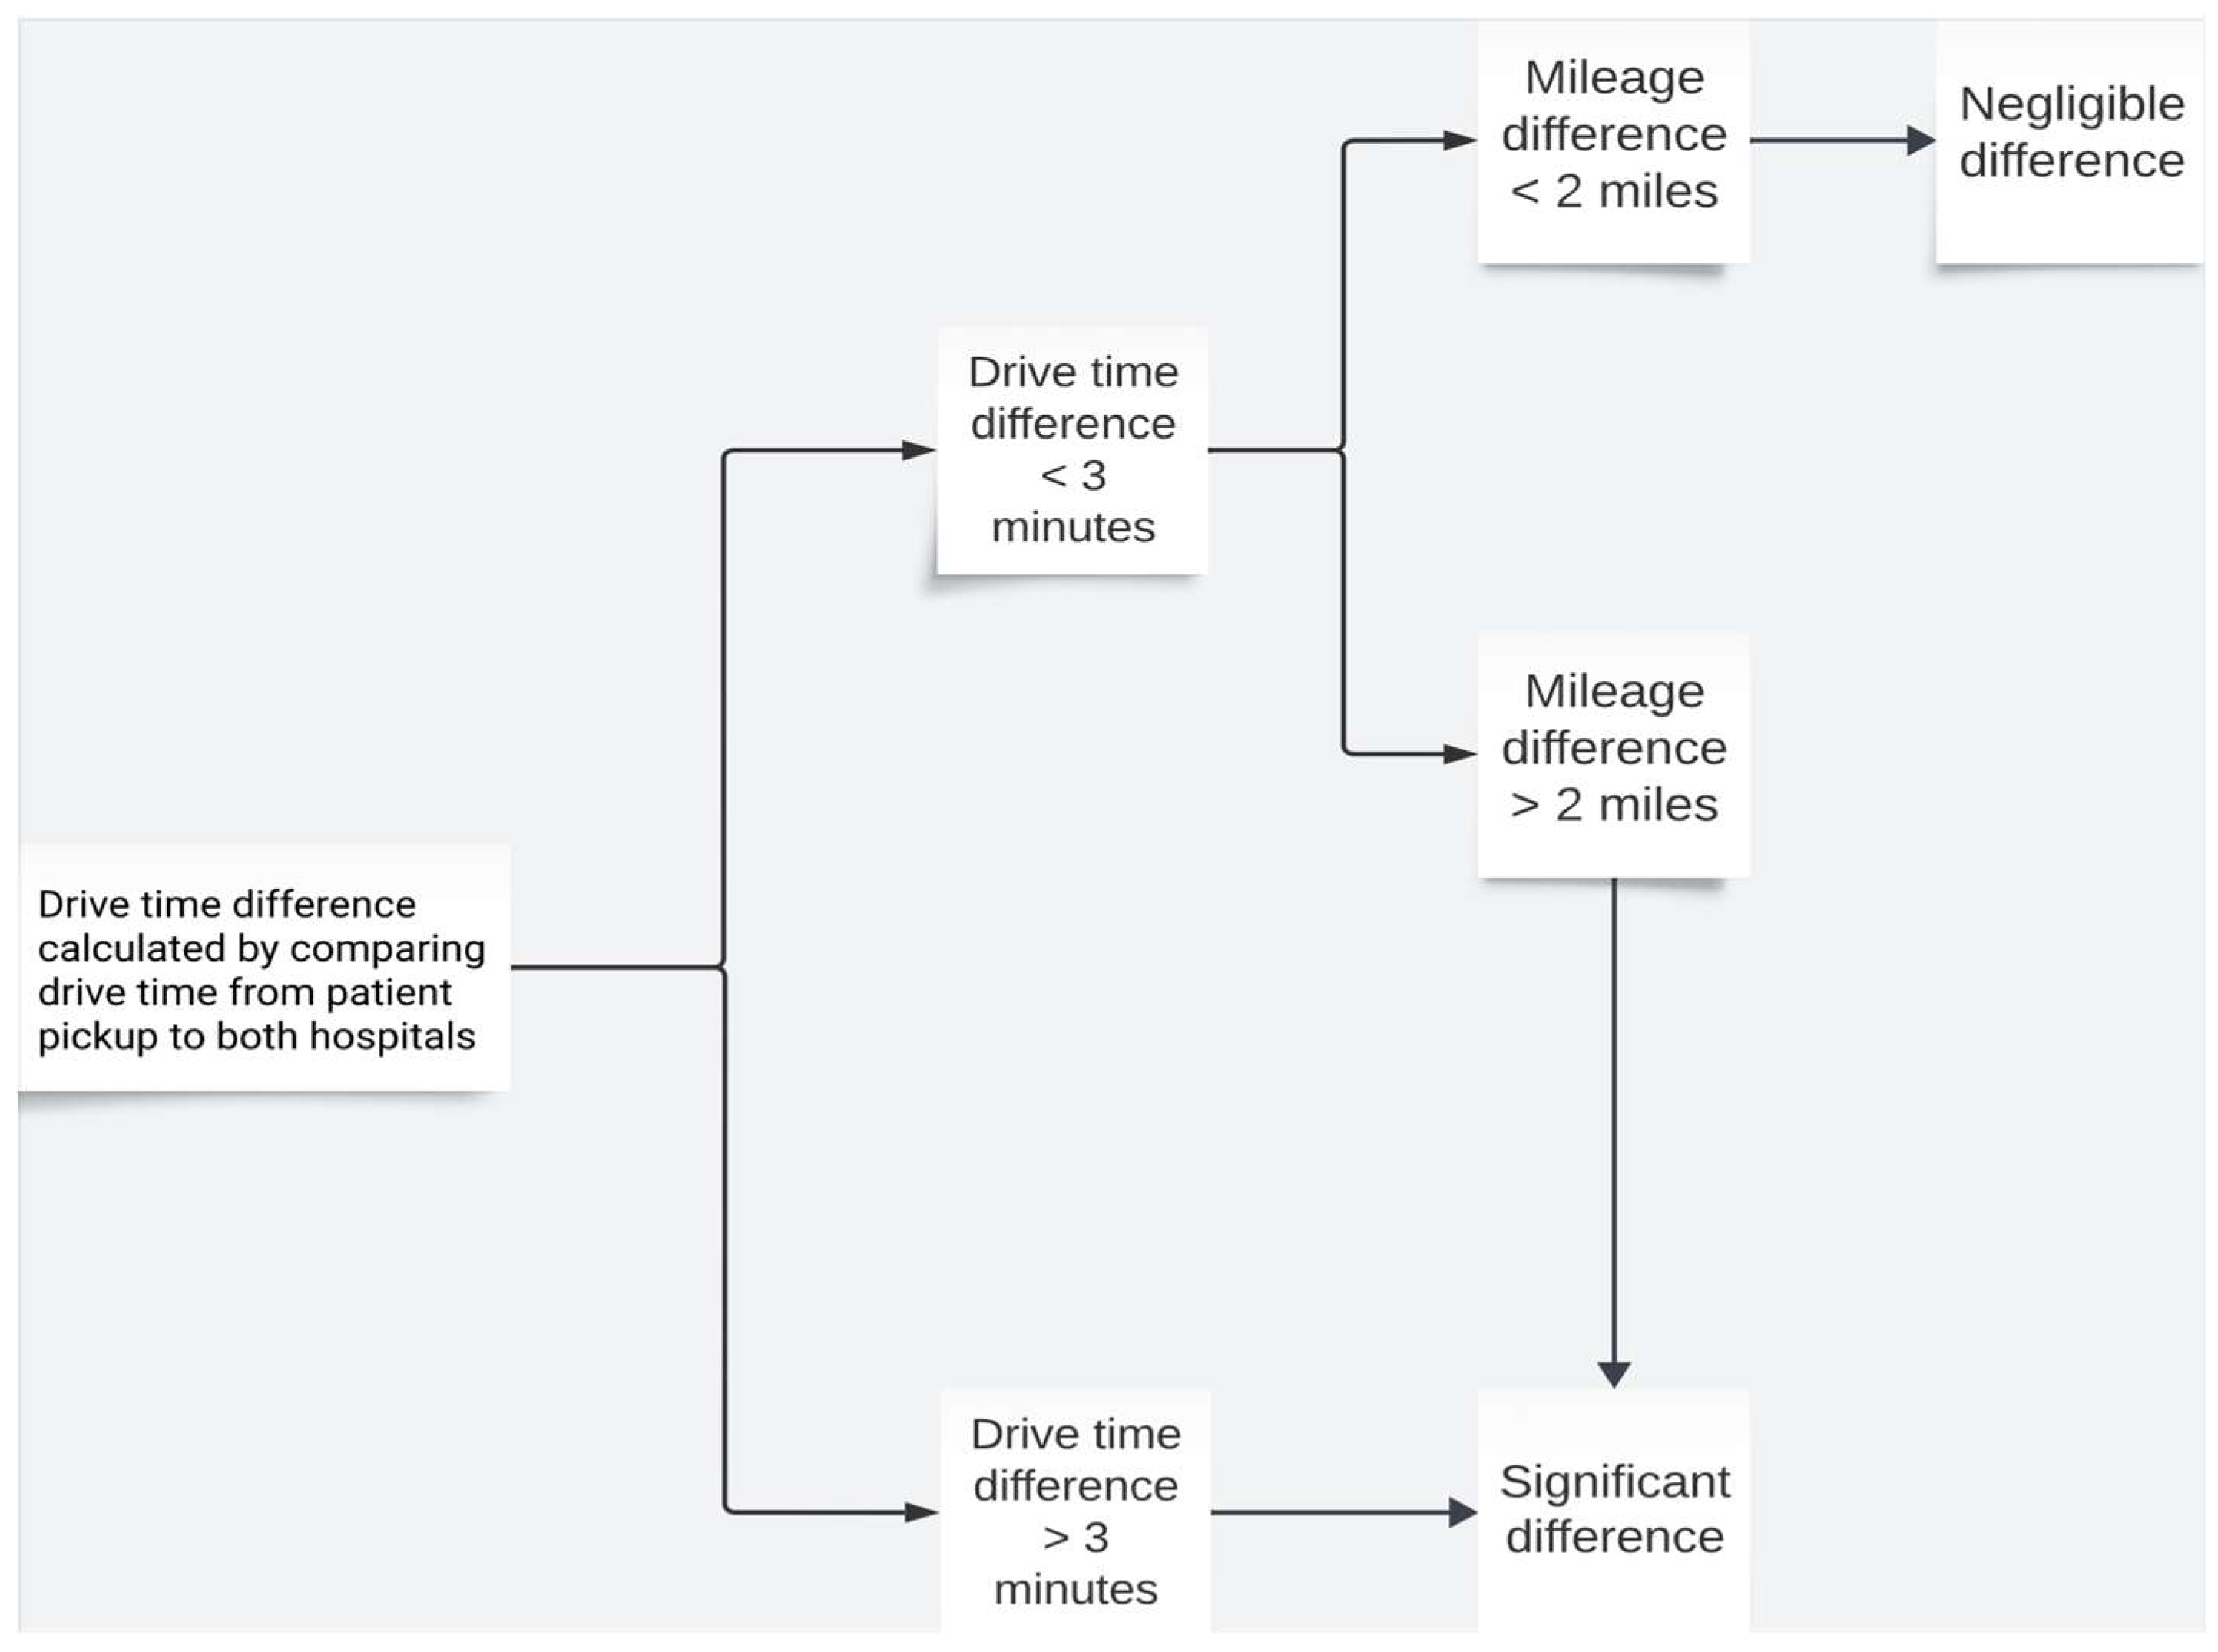
Figure 2.
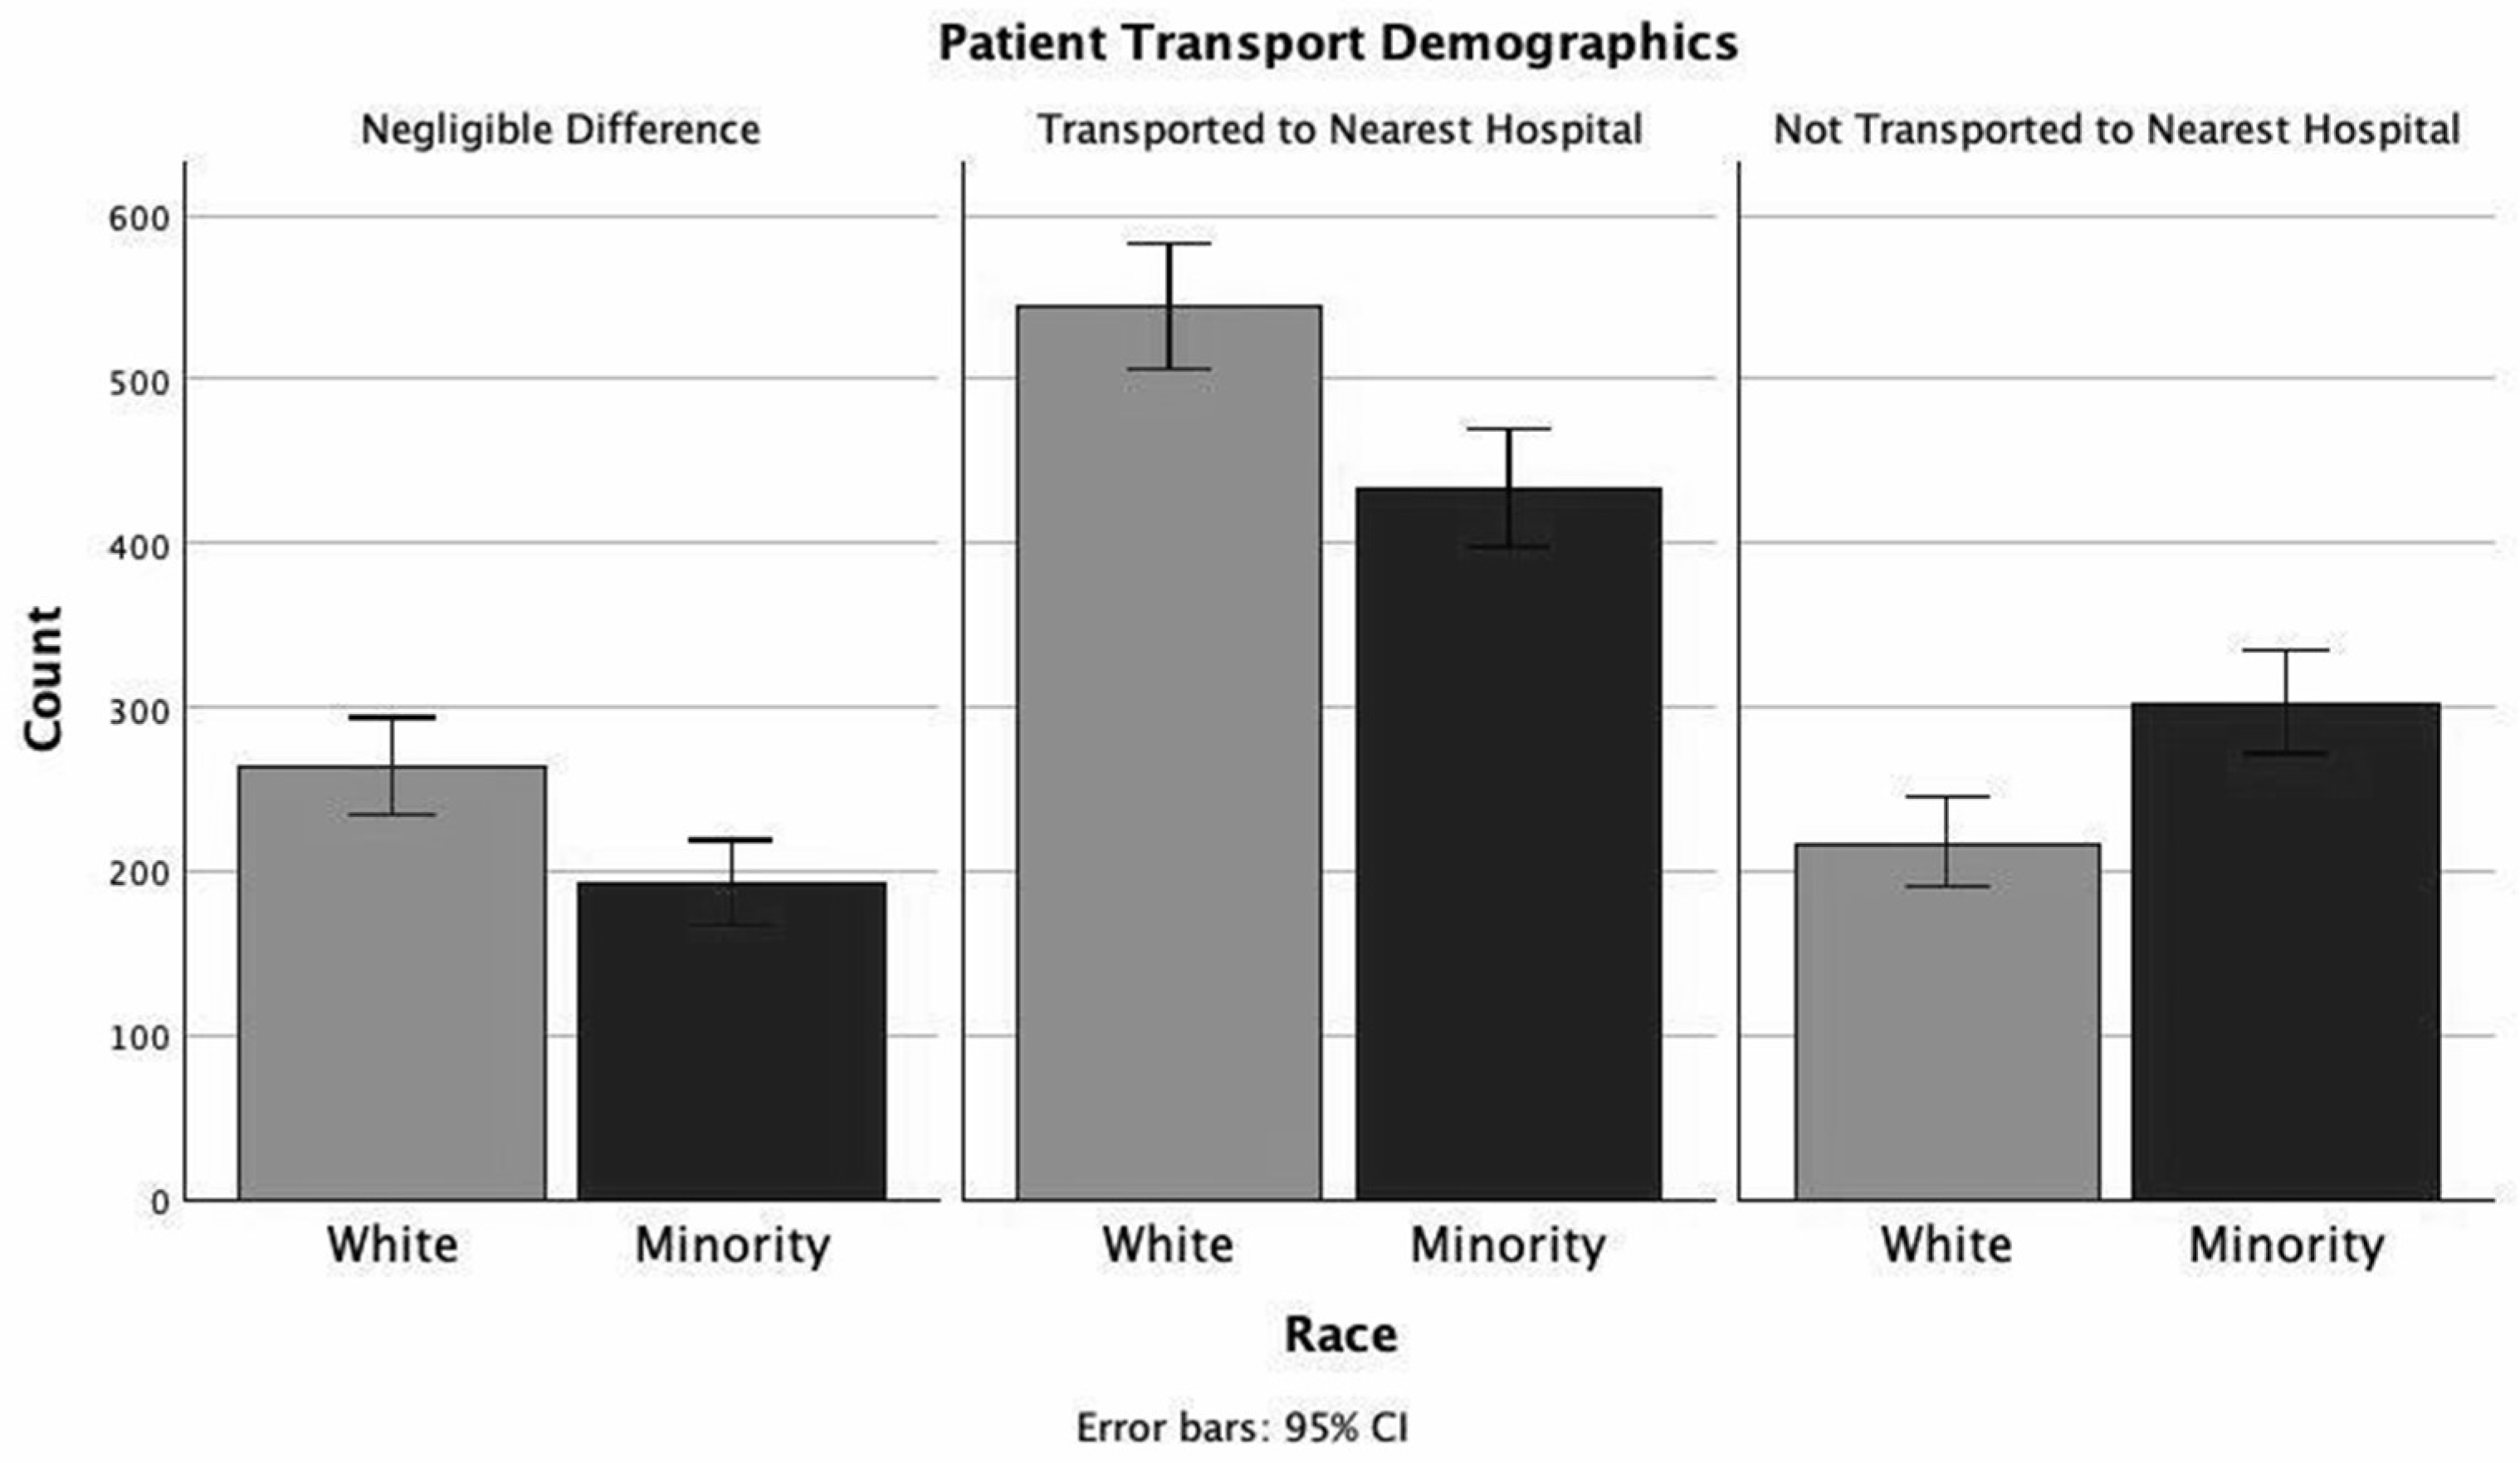
Figure 3.
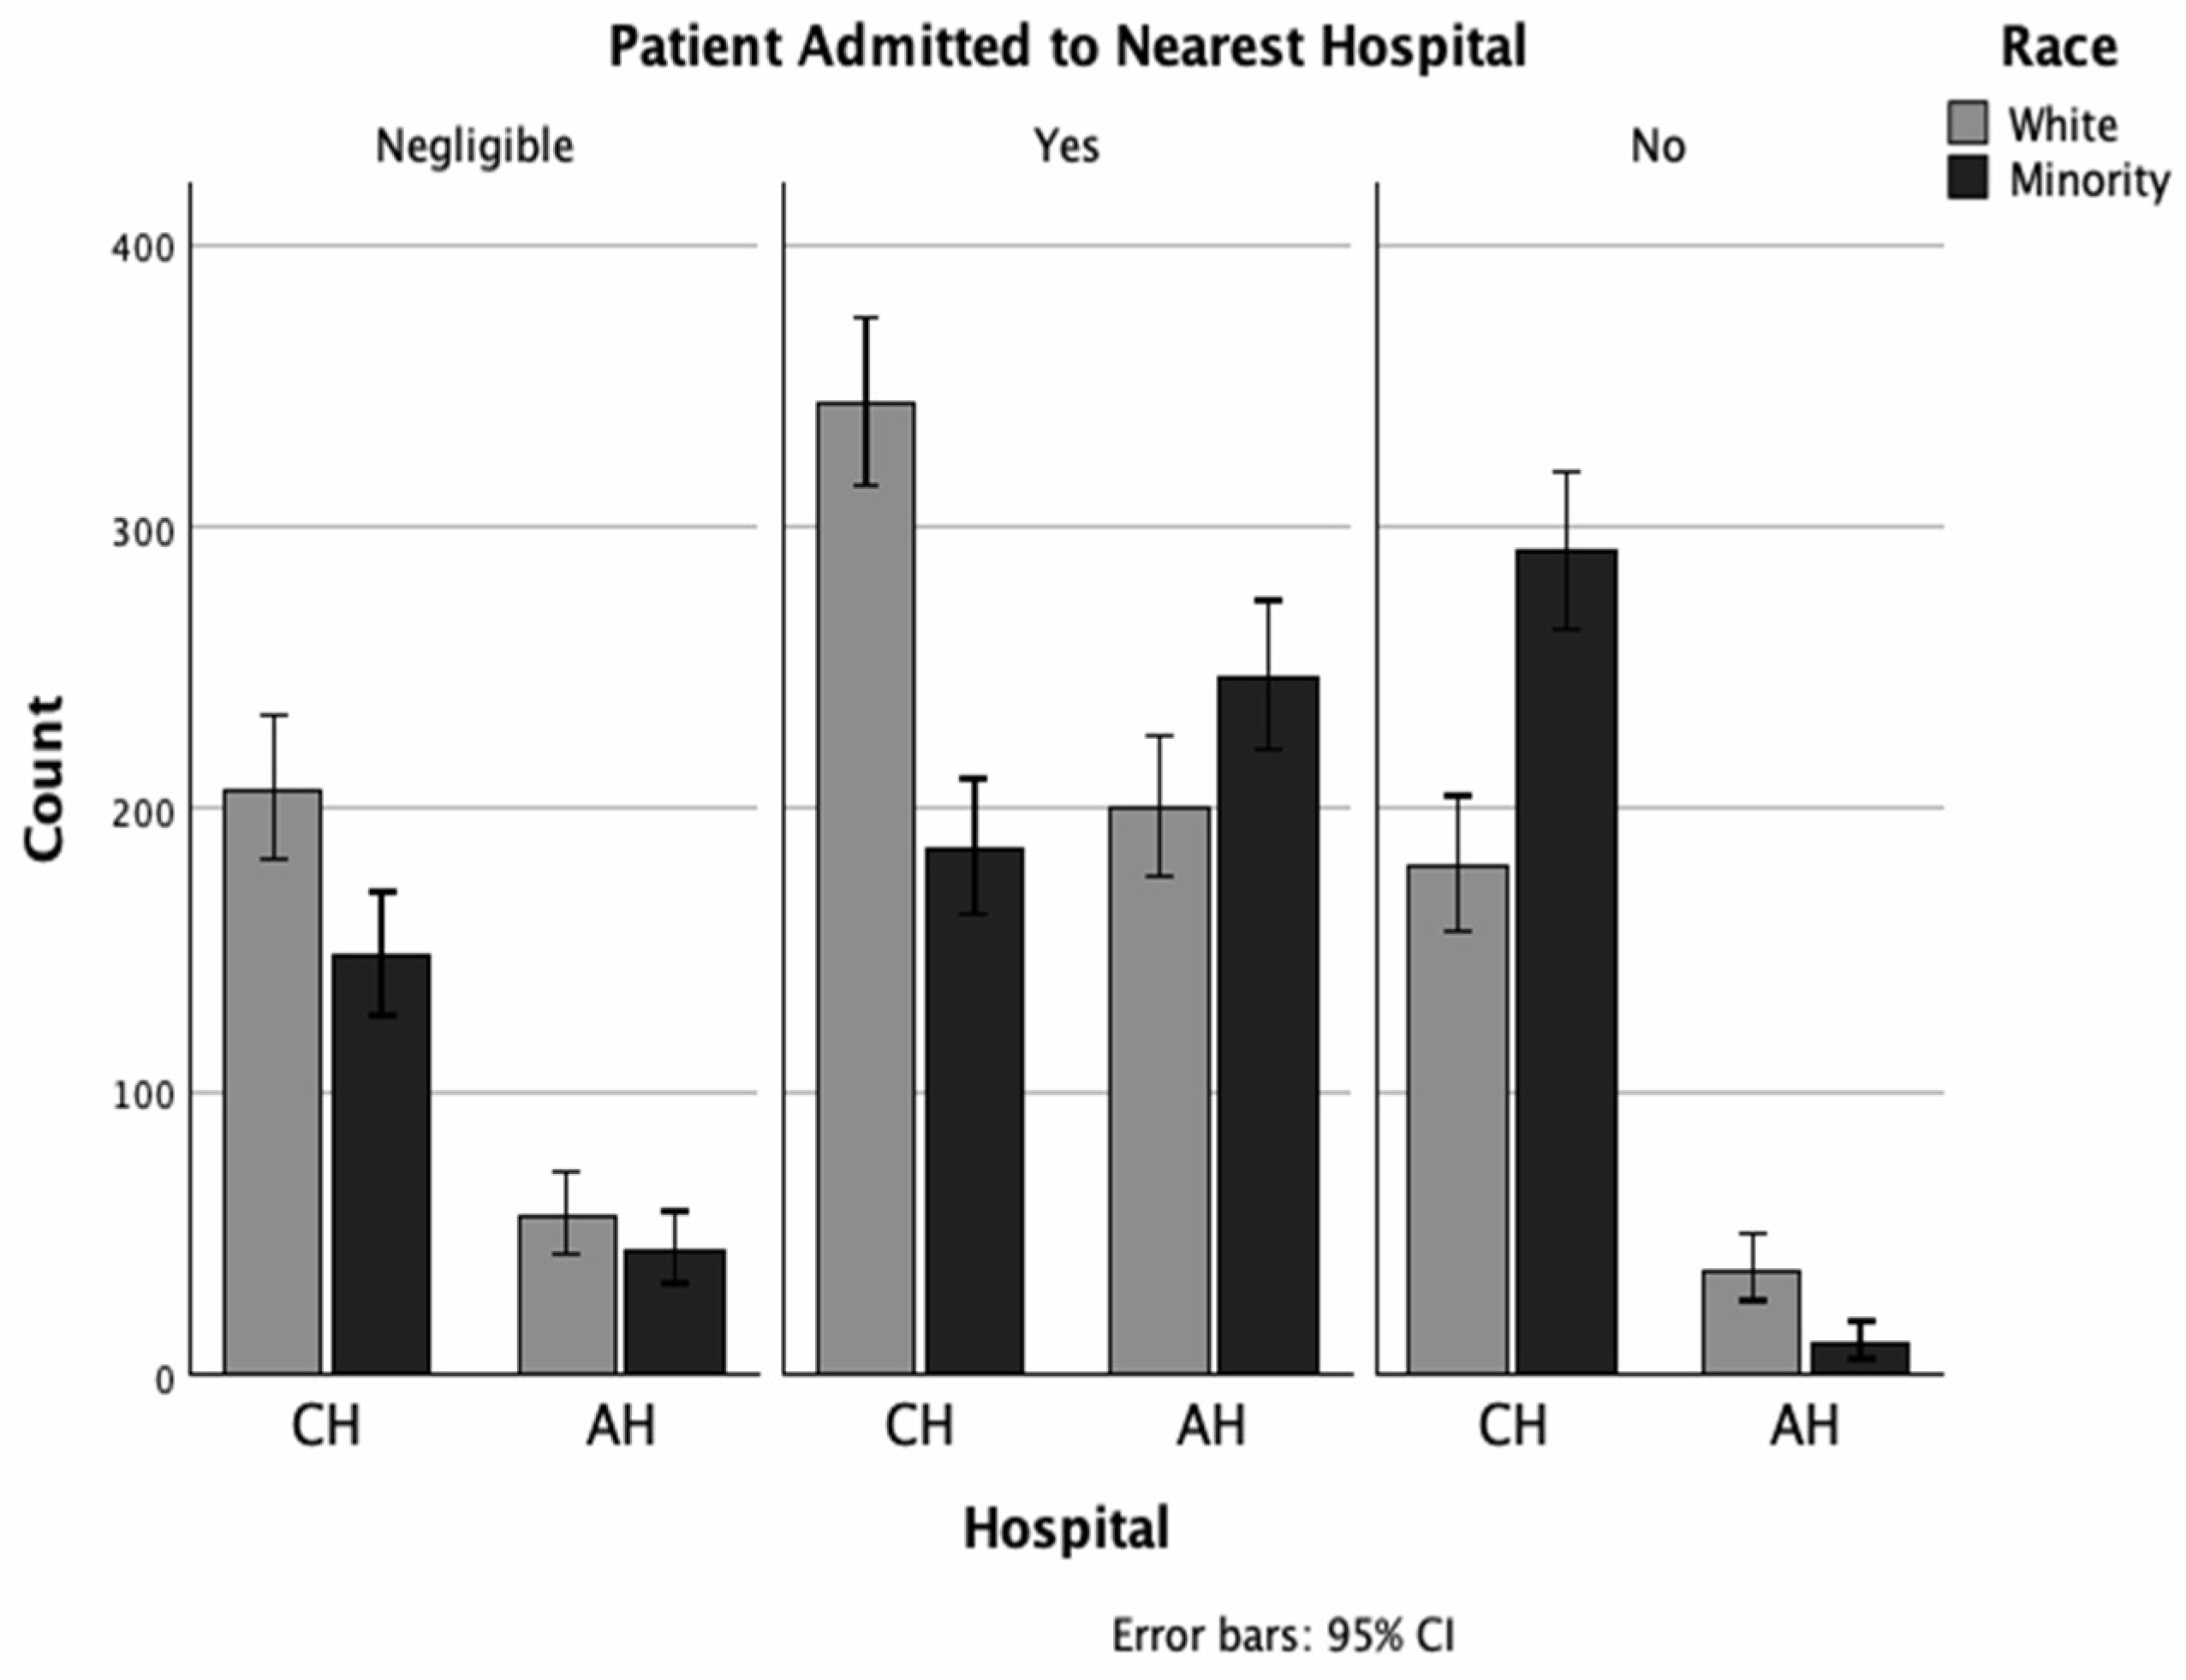

Table 1.
Demographics, transportation, insurance.
| CH (N=1520) | AHC (N=625) | p-value | |
|---|---|---|---|
| N (%) | N (%) | ||
| Age, years (Mean ± SD) | 40.1 ± 17.4 | 44.7 ± 20.6 | <0.001 |
| Sex | 0.003 | ||
| Male | 1116(73.4) | 419 (67.0) | |
| Female | 404 (26.6) | 206 (33.0) | |
| Race/Ethnicity | <0.001 | ||
| Non-Hispanic White | 761 (50.1) | 281 (45.0) | 0.049 |
| Black | 564 (37.1) | 296 (47.4) | <0.001 |
| American Indian | 5 (0.3) | 0 (0.0) | 0.153 |
| Asian | 24 (1.6) | 6 (1.0) | 0.277 |
| Native Hawaiian or Pacific Islander | 9 (0.6) | 0 (0.0) | 0.055 |
| Hispanic | 154 (10.1) | 35 (5.6) | <0.001 |
| Other or Unknown | 3 (0.2) | 7 (1.1) | |
| Primary Language | <0.001 | ||
| English | 1377 (90.6) | 553 (88.5) | <0.001 |
| Spanish | 111 (7.3) | 17 (2.7) | <0.001 |
| Mandarin | 0 (0) | 0 (0.0) | NA |
| Cantonese | 0 (0) | 0 (0.0) | NA |
| Arabic | 1 (0.1) | 0 (0.0) | 0.537 |
| Haitian Creole | 12 (0.8) | 2 (0.3) | 0.264 |
| French | 0 (0) | 0 (0.0) | NA |
| Other | 19 (1.3) | 53 (8.5) | |
| Injury Severity | 0.009 | ||
| 1 to 9 | 900 (59.2) | 335 (53.6) | 0.01 |
| 10 to 15 | 237 (15.6) | 99 (15.8) | 0.924 |
| 16 to 30 | 256 (16.8) | 123 (19.7) | 0.129 |
| 31 to 75 | 73 (4.8) | 49 (7.8) | 0.006 |
| Unknown | 54 (3.6) | 19 (3.0) | |
| Mechanism of Injury | 0.082 | ||
| Blunt | 1082 (71.2) | 429 (68.6) | |
| Penetrating | 406 (26.7) | (193 (30.9) | |
| Unknown | 32 (2.1) | 3 (0.5) | |
| Transport Company | <0.001 | ||
| Indianapolis EMS | 880 (57.9) | 515 (82.4) | <0.001 |
| Wayne Township | 220 (14.5) | 23 (3.7) | <0.001 |
| City of Lawrence | 68 (4.5) | 32 (5.1) | 0.532 |
| Other Known | 343 (22.6) | 54 (8.6) | <0.001 |
| Unknown | 9 (0.6) | 1 (0.2) | |
| Police Status/Custody | <0.001 | ||
| Detention | 7 (0.5) | 0 (0) | 0.093 |
| Incarcerated | 23 (1.5) | 0 (0) | 0.002 |
| Custody | 70 (4.6) | 0 (0) | <0.001 |
| None | 1420 (93.4) | 609 (97.4) | <0.001 |
| Unknown | 0 (0) | 16 (2.6) | |
| Insurance Status | <0.001 | ||
| Uninsured | 3 (0.2) | 2 (0.3) | 0.599 |
| Medicare | 165 (10.9) | 115 (18.4) | <0.001 |
| Medicaid | 194 (12.8) | 139 (22.2) | <0.001 |
| Commercial | 882 (58.0) | 147 (23.5) | <0.001 |
| HIP | 0 (0) | 22 (3.5) | <0.001 |
| VA/Tricare | 14 (0.9) | 0 (0) | 0.016 |
| Selfpay | 220 (14.5) | 74 (11.8) | 0.027 |
| “Other” Government | 30 (2.0) | 126 (20.2) | <0.001 |
| Unknown | 12 (0.8) | 0 (0) |
Table 2.
Patient Transport Pattern Demographics.
| n = 1940 | p-value | <0.001 | |
|---|---|---|---|
| White (1024) | Minority (916) | P value | |
| Transported to Nearest Hospital | 544 (53.1%) | 425 (46.4%) | 0.003 |
| Not Transported to Nearest Hospital | 217 (21.2) | 302 (33.0%) | <0.001 |
| Negligible Difference | 263 (25.7) | 189 (20.6%) | 0.009 |
Table 3.
Patient Admitted to Nearest Hospital.
| CH (n = 1356) | p-value | <0.001 | |
| White (731) | Minority (625) | P value | |
| Yes | 344 (47.1%) | 186 (29.8%) | <0.001 |
| No | 180 (24.6%) | 291 (46.6%) | <0.001 |
| Negligible | 207 (28.3%) | 148 (23.7%) | 0.053 |
| AHC (n = 584) | p -value | <0.001 | |
| White (293) | Minority (291) | ||
| Yes | 200 (68.3%) | 239 (82.1%) | <0.001 |
| No | 37 (12.6%) | 11 (3.8%) | <0.001 |
| Negligible | 56 (19.1%) | 41 (14.1%) | 0.103 |
Disclaimer/Publisher’s Note: The statements, opinions and data contained in all publications are solely those of the individual author(s) and contributor(s) and not of MDPI and/or the editor(s). MDPI and/or the editor(s) disclaim responsibility for any injury to people or property resulting from any ideas, methods, instructions or products referred to in the content. |
© 2025 by the authors. Licensee MDPI, Basel, Switzerland. This article is an open access article distributed under the terms and conditions of the Creative Commons Attribution (CC BY) license (http://creativecommons.org/licenses/by/4.0/).
Copyright: This open access article is published under a Creative Commons CC BY 4.0 license, which permit the free download, distribution, and reuse, provided that the author and preprint are cited in any reuse.


