Submitted:
09 April 2025
Posted:
10 April 2025
You are already at the latest version
Abstract
Background: In glaucoma screening programs, a large proportion of patients remain free of open angle glaucoma (OAG) or have no need of IOP lowering therapy within 10 years of fol-low-up. Is it possible to identify a large proportion of patients already at the initial exam and thus to safely exclude them already at the initial exam? Methods: A total of 6889 subjects re-ceived a complete ophthalmological examination, including objective optic nerve head and quantitative disc measurements at the initial exam and after an average follow-up period of 11.1 years, complete data were available of 585 individuals. Two neuronal network models were trained and extensively tested. To allow the models to refuse to make a prediction in doubtful cases, a reject option was applied. Results: The first prediction model for the first endpoint ‘re-maining free of OAG within 10 years’ rejected to make a prediction in 46.4% of all subjects. In the remaining cases (53.6%), 271/271 (=100%) were correctly predicted. A prediction for the second endpoint ‘remaining free of OAG and no IOP lowering therapy within 10 years’ was rejected in 57% and in the remaining cases (43%), 253/253 (=100%) received a correct prediction. Conclusion: Most importantly, no eye was predicted false-negatively or false-positively. 43% of all eyes can safely be excluded from a glaucoma screening program for up to 10 years if one wants to be cer-tain that the eye remains free of OAG and will not have any need for a IOP lowering therapy. The corresponding model significantly reduces the screening amount and work load of oph-thalmologists. In the future, better predictors and models may enlarge the number of patients with a safe prediction to further economize time and health care budgets in glaucoma screening.
Keywords:
Glaucoma
; machine learning
; neuronal network
; screening
; prediction
1. Introduction
Glaucoma is a leading cause for irreversible blindness [1]. Worldwide, it is estimated that about 66.8 million people have visual impairment from glaucoma, with 6.7 million suffering from blindness. Intraocular pressure (IOP) is the most important - because modifiable - risk factor for the development and progression of this disease [2]. Glaucoma is mostly asymptomatic until late in the disease when visual problems arise [3]. However, with early treatment, it is often possible to protect the eyes against serious vision loss [2]. Therefore, an early diagnosis should be aimed. Because of a lack of symptoms in the early disease stage of glaucoma in most patients, this only can be done with screening programs. The most common subgroup of glaucoma in Europe is the open angle glaucoma (OAG). It is well known in glaucoma research that age, IOP, PEX and topographic disc parameter are univariate risk factors for predicting OAG.
A major aim in glaucoma research is to combine these risk factors in a multivariable fashion and to make predictions on personalized level. Machine learning algorithms like neural networks are capable to personalize diagnosis for patients on an individual level although several issues are still not resolved [4,5,6]. Because no such tools are currently in use to predict 10 year occurrence of OAG, we investigated to which extent a reliable prediction is feasible.
Several univariable risk factors for the development of OAG are well known, such as age [4], increased IOP [4], PEX [5] and topographic disc parameters such a cup-to-disc ratio (C/D) [4]. For example, age was found as an important risk factor of having OAG, but it is still unclear how precisely it affects the progression of OAG over time in relation and combination with other risk factors. Even if all these univariable risk factors are available at a single exam in one point in time, it is difficult to diagnose OAG in certain cases, so why should we even consider an attempt to make a prediction over such a long period of 10 years?
There are mainly three reasons why models with a reject options should be used. 1) It is well known that patients with no or a small number of risk factors are highly likely of remaining OAG-free over a long period. For example, subjects at the age ≤ 50 yrs and an IOP ≤ 18mmHg and a cup-to-disc ratio (C/D) ≤ 0.2 are highly likely to remain OAG free over many years [3,10,11]. So the basic idea is to identify a – hopefully as large as possible – subpopulation at the initial exam which will remain free of OAG at the 10 yr follow-up. 2) Studies are demonstrating that 10-yr OAG incidence is quite low ranging from 0.7 to 2.2% [4,5,6,7,8,9,10]. Hence, most patients remain free of OAG within 10 yrs which makes a prediction OAG freeness easier as compared to incidences around 50%. 3) The third and by far most important reason refers to the so called ‘reject option’ of the model. It is definitely not necessary to identify every single eye which remains stable. Usually, one expects that the model makes a prediction for every single patient. However, to reduce the screening amount, it is sufficient to identify a hopefully large subpopulation of patients with eyes which remain stable. If the prediction is too difficult and the prediction model is ‘in doubt’, it is still better to reject a prediction instead of making a false positive or false negative prediction. Patients who do not receive a prediction are sent to the glaucoma specialist as usual. This so-called ‘reject option’ is crucial and a highly desirable advantage, because the models are not ‘forced to make a prediction’. In other words: if the model has enough evidence, then it makes a prediction, otherwise it rejects to make a prediction and asks the glaucoma expert to make a final decision (or to make no prediction at all). Obviously, there is a price to be paid to end up, because we have to accept that a large proportion of eyes does not receive a prediction. On the other hand, the reject option substantially increases the accuracy of the model of those patients who receive a prediction. This allows the identification a large proportion of patients such that the corresponding eye can safely be excluded and thus a large amount of time and efforts in screening studies can be saved. All definitions, endpoints, methods and results refer to right eyes as machine learning algorithms expect to strictly distinguish between right and left eyes. New models for left eyes can be trained and tested using the same methods.
It is the aim of this paper to answer the following questions under consideration of the principal of a very high accuracy: 1) Which of these endpoints shows reasonable results? 2) How are the performances of the neural network models in terms of accuracy? How many receive a false negative or false positive prediction? 3) To which extend do these models help to reduce daily working load, i.e. how many eye receive a prediction and in how many cases is the algorithm in doubt? 4) How can these approaches be improved in the next future?
2. Materials and Methods
The Salzburg-Moorfields-Collaborative-Glaucoma Study (SMCGS) was initialized in 1996 and is embedded into a large 25-year glaucoma blindness prevention program in Austria, Europe. The SMCGS is a retrospective monocentric population-based longitudinal cohort study. This study mainly focuses on providing information to and identification of glaucoma suspects and offering timely and adequate treatment in clear-cut cases of glaucoma.
2.1. Definition of Definite OAG
We defined glaucoma as progressive optic neuropathy leading to a loss of retinal nerve fibers and glia cells, with characteristic alterations on the optic nerve head and with or without corresponding functional alterations in visual field examination [12]: a) optic nerve head (ONH): notching, rimming, arbitrary chosen subjective cup-to-disk-ratio (C/D) more or 0.45, or C/D asymmetry between the two eyes >=0.3 not explainable through other diseases; b) visual field: glaucomatous visual field defects corresponding to optic disc changes; c) open anterior chamber angle [12]. Inclusion criteria: age ≥ 40 years, no OAG or other type of glaucoma, best spectacle corrected visual acuity > 6/9, refractive range from –6.00 to +4.00 diopters with the difference in refraction between both eyes < 3.00 diopters. Exclusion criteria: pseudophakia, IOP lowering therapy at the initial examination, eye diseases potentially leading to visual field defects or a secondary increase of intraocular pressure, contraindication against beta blockers, systemic corticosteroid therapy or pregnancy.
During more than 27 years of study duration up 24 ophthalmologists and 7 ophthalmic assists specially trained on study protocol performed the ophthalmic examinations and graded each patient. The SMCGS data collection stated on the 1st December 1996. Baseline:the ophthalmic assists, were responsible for oral education and SMCGS, questionnaire interview, best corrected visual acuity measurement (BCVA) with the Early Treatment Diabetic Retinopathy Study (EDTRS) chart, subjective refraction, visual field examination (VF; Motion-Sensitivity-Test (MST), Humphrey Frequency Doubling Technology Perimetry (FDT, Humphrey FDT matrix, Humphrey Instruments Inc., San Leandro, CA, USA), Humphrey Field Analyzer II or II-I [HFA, Humphrey Instruments Inc., San Leandro, CA, USA]), central corneal thickness (CCT) with ultrasound pachymetry (Pocket II, Quantel Medical, Cournon d’Auvergne Cedex, France) and structural imaging (Confocal scanning laser ophthalmoscopy was carried out using TopSS® (Fa. LDT, San Diego, USA)). Subsequent all subjects underwent a standardized eye examination with intraocular pressure (IOP) assessment in miosis and mydriasis with Goldmann applanation tonometry (Haag Streit, Koeniz, Switzerland), gonioscopy to exclude angle-closure, slit lamp anterior segment examination, and dilated fundus slit lamp biomicroscopy for optic disc assessment with a Volk 90 D lens including subjective C/D. Recorded TopSS® values included C/D-ratio, total contour area, effective area, neuroretinal rim area, half depth area, half depth volume, and volume below. If results were abnormal or inconclusive in VF-examination at baseline, a second confirmation testing was made for clarification.
2.2. Definition of Endpoints
We defined two different endpoints: (E1): freeness of OAG (with or without IOP lowering therapy) and endpoint 2 (E2): composite endpoint, i.e. freeness of OAG + no IOP lowering therapy. If a patient 1) still wants to join the screening program and 2) is accepting receiving an IOP lowering therapy if possibly necessary and 3) is only interested whether an OAG will occur, then endpoint E1 is best. Endpoint E2 is suitable to inform and safely exclude the patient from a screening program. We here want to point out that in E1 and E2, ocular hypertension (OHT) might develop (in case of E1 with a possibly necessary IOP lowering treatment), but not OAG.
Age, IOP [13,14], PEX [15] and 8 optic nerve head parameters (TopSS®) were used as continuous predictors for endpoint E1 and E2.
10 years follow-up
Patients free of glaucoma (OAG or other type of glaucoma) at the baseline visit were followed up, only. All examinations were carried out like at baseline examination. According to the results of the baseline examination, patients were scheduled for interim visits additionally in the first decade. Complete data of the baseline visit and the 10 years visit was used to train and validate the machine learning models.
2.3. Statistical Methods and Model Development
Data were cleaned for inaccurate or missing data resulting in data of 585 patients with full records of each predictor as well as the outcome variable. Univariable logistic regression models were used to estimate the odds ratios of each individual predictor with 95% confidence intervals.
2.4. Machine Learning Algorithms, Training and Testing
Multilayer perceptron neural networks, nearest neighbors classifiers, Bayes classifiers, raondom forest models and support vector machines were trained and tested. Full sample (n=585) was randomly split into a training sample (n=486) and test sample (n=117). No data of the test sample was used for model training. Adaptive moment estimation was used as stochastic gradient descent method. To mitigate overfitting, early stopping approach and 10-fold cross-validation were used. L2-regularization techniques were also used. All neural networks were firstly trained and crossvalidated in a training sample (n=468) and finally tested in an independent randomly selected test sample (n=117) to ensure generalization to new previously unseen eyes. Additionally, early stopping, batch normalization layers and L2-regularization techniques were used [16]. To allow the algorithm to refuse a prediction (‘if it is in doubt’), the ‘reject option’ was applied ([16]). This means that 2 cut-offs for the posterior probabilities instead of 1 cut-off were firstly chosen in the training sample and then applied and tested in the test sample. Finally, to assess model performances, the percentages of predicted subjects and total correct predicted cases were computed in the training and test samples and compared whether the networks generalize well to new, previously unseen data.
2.5. Feature Selection
Potential risk factors were selected as input variables, which are listed in Table 2. Allthough some of these risk factors were not significant, it turned out that after application of a genetic algorithm and the reject ooption (as described in the next subsection), these predictors were still useful to limit the number of recjected cases.
2.6. Reject Option
From a clinical point of view, - most importantly-, we wanted to avoid false negative predictions for both endpoints. This means for endpoint E1 to predict that the patient will not suffer of OAG within 10 years although he or she develops OAG within this time. In case of endpoint E1, a false negative prediction may lead to irreversible eye damage or even blindness. In case of the endpoint E2, the same scenario would occur or that no medication would have been administered which also could result in OAG or blindness. The predictors, however, do not have enough predictive power to achieve this goal for the whole cohort. Thus, it was reasonable to allow the algorithms to apply a ‘reject option’ in doubtful cases. This was achieved by applying two cut-offs (instead of only one) to the aposteriori probabilities. The advantage of this approach is that it minimizes the number of false negative and false positive predictions. This important advantage comes at the cost that a large number of cases does not receive a prediction. We recommend that patients who do not receive a prediction, should still join a glaucoma screening program in order to receive medical expert knowledge.
3. Results
In the original screening study, 6889 subjects were screened and 976 subjects were examined ten years later. Finally, after application of all inclusion and exclusion criteria and removal of all missing data, n=585 right eyes with complete data were included.
3.1. Overview of Demographic Data at Baseline
21 right eyes from 585 subjects developed OAG (3.6%, 95% CI: 2.2%-5.4%), i.e. fulfilled endpoint E1. Within our data set, OAGs included 6 primary open angle glaucoma (1.03%), 3 pseudoexfoliation glaucoma (0.51%), 0 pigmentary glaucoma (0%), and 12 normal tension glaucoma (2.05%) (Table 1).

Table 1.
Overview of baseline demographic data of n = 585 subjects with complete data at baseline and 10 year follow-up1.
Table 1.
Overview of baseline demographic data of n = 585 subjects with complete data at baseline and 10 year follow-up1.
| Mean | SD | -95% CI | +95% CI | |
|---|---|---|---|---|
| Age (y) | 58.9 | 8.1 | 58.8 | 59.6 |
| Follow-up (years) | 11.1 | 1.1 | 10.99 | 11.2 |
| IOP (mmHg) | 15.3 | 3.2 | 15.1 | 15.6 |
| Total Contour Area (mm2) | 2.23 | 0.44 | 2.20 | 2.27 |
| Effective Area (mm2) | 0.96 | 0.39 | 0.93 | 0.99 |
| Neuroretinal Rim Area (mm2) | 1.28 | 0.33 | 1.25 | 1.31 |
| Half Depth Area (mm2) | 0.38 | 0.21 | 0.36 | 0.40 |
| Half Depth Volume (mm3) | -0.06 | 0.057 | -0.066 | -0.057 |
| Volume Below (mm3) | -0.26 | 0.19 | -0.27 | -0.24 |
| Cup-To-Disc Ratio | 0.42 | 0.14 | 0.41 | 0.43 |
| N | Percentage -95% CI 95% CI | |||
| Endpoint E1: OAG2 at 10 year FU |
21/585 | 3.6% 2.23% 5.43% | ||
| Endpoint E2: OAG2 at 10 year FU or IOP lowering therapy within 10 yrs |
41/585 | 7% 5.1% 9.4% | ||
1) All results refer to right eyes. 2) OAGs included 6 primary open angle glaucoma (1.03%), 3 pseudoexfoliation glaucoma (0.51%), 0 pigmentary glaucoma (0%), and 12 normal tension glaucoma (2.05%).
3.2. Overview of Demographic Data at 10 Year FU
41 of 585 eyes had OAG or at least one or more IOP lowering eye therapy within 10 years (endpoint E2), which corresponds to a 10-yr incidence of 7% (5.1-9.4%). Differences between those who fulfill endpoint E2 or not and corresponding univariable prediction power of possible candidate predictors are given in Table 2.
Table 2.
Univariable odds ratios and descriptive statistics of various predictors for composite endpoint E2: freeness of OAG and having no IOP lowering therapy within 10 yrs.
Table 2.
Univariable odds ratios and descriptive statistics of various predictors for composite endpoint E2: freeness of OAG and having no IOP lowering therapy within 10 yrs.
| Free of OAG and no IOP lowering therapy 10 yr FU (n=544) |
OAG or IOP lowering therapy at 10 yr FU (n=41) |
|||||
|---|---|---|---|---|---|---|
| Mean | Std | Mean | Std | Odds ratio | p-value | |
| Age (yrs) | 58.84 | 7.96 | 60.7 | 7.29 | 1.02 (0.99-1.08) | 0.161 |
| IOP (mmHg) | 15.1 | 2.83 | 18.5 | 4.27 | 1.33 (1.21-1.46) | < 0.00011* |
| PEX | 12/532 | 2.2% | 3/38 | 7.3% | 3.5 (0.6-13.7) | 0.0272* |
| Effective Area (mm2) | 0.95 | 0.40 | 1.08 | 0.32 | 2.37 (1.02-5.5) | 0.0421* |
| Neuroretinal Rim Area (mm2) | 1.29 | 0.32 | 1.19 | 0.18 | 0.38 (0.13-1.09) | 0.071 |
| Half Depth Area (mm2) | 0.37 | 0.21 | 0.44 | 0.20 | 4.0 (1.01-15.8) | 0.0471* |
| Half Depth Volume (mm3) | -0.06 | 0.06 | -0.07 | 0.05 | 0.08 (0.008-7.09) | 0.261 |
| Volume Below (mm3) | -0.25 | 0.18 | -0.31 | 0.20 | 0.23 (0.05-0.996) | 0.0471* |
| Cup-To-Disc Ratio/0.1 unit change | 0.42 | 0.14 | 0.48 | 0.12 | 1.46 (1.11-1.92) | 0.0061* |
1) Independent t-test 2) Fisher’s Exact test (one sided), odds ratios are based on univariable logistic regression models.
3.2 An overview performance, advantages and disadvantages of both machine learning models with both endpoints E1 and E2 is given in Table 3. Model M1 and M2 demonstrate excellent results with a sufficient large proportion of eyes receiving a prediction. Most importantly, no eye was predicted false-negatively or false-positively.
3.3. Illustration of the Models with Real Data
To better illustrate the models, typical data in a glaucoma screening setting are provided at the initial exam and illustrates the predictions, decisions and observations made by model M2 for endpoint E2 (Table 4). On the left side, we see the predictors evaluated at the initial exam: age, IOP, effective area, neuroretinal rim area, volume below, half depth area, half depth volume, C/D and PEX. On the right side, we see the predictions of the machine learning model M2 for endpoint E2 at the initial exam and corresponding observations of both endpoints made at the 10-year follow-up. Eyes highlighted in green were identified by the prediction model and every single eye was correctly predicted. Eyes highlighted in gray did not receive a prediction, because the algorithm was ‘in-doubt’ and rejected to make a prediction (i.e. the corresponding eye was ‘filtered out’). For endpoint E2, 332 eyes (57%) were filtered out and did not receive a prediction, 253 (43%) of all eyes received a prediction and 57% did not receive a prediction. In summary, 253 out of 253 eyes were correctly predicted (100%) which means that no eye was predicted false-negatively or false-positively.
3.4. Illustration for the Need of Reject Option
To better understand why a large amount of eyes had to be filtered out and also the difficulty of predicting endpoint E2, we provide a deeper insight how close both data clouds (endpoint E2 yes/no) are closely sticked together and illustrate the overlap between both data distributions (Figure 1). As indicated there is a large overlap between both distributions indicating the difficulty of identification of eyes which can accurately be predicted and eyes which have to be rejected at the initial exam to make predictions for the future.
4. Discussion
This study provides a complete new and safe approach for identifying a large subpopulation of eyes remaining free of open angle glaucoma without need of IOP lowering therapy within 10-years. The most important benefit of model M2 is that 43% of the eyes in the screening population can safely be excluded already at the initial exam, i.e. no predicted eye received a false-positive or false negative prediction. It is important to emphasize that this accuracy could only be achieved by allowing the algorithm to refuse to make a prediction which occurred in 57% of all eyes. Therefore there is no need further to examine eyes who receive a prediction in regard for OAG screening purpose within the next 10 years and corresponding time, efforts and costs can be efficiently be saved. This implies that this eye is no longer within a screening program and thus will not receive an IOP lowering therapy. This was key point and crucial why endpoint E2 focuses not only on OAG, but also included that the eye does not receive an IOP lowering therapy.
4.1. Discussion of Model M1
This model is the right choice, however, for patients who are willing to remain in a glaucoma screening program. In this case, the eye will still obtain IOP lowering therapy – if necessary. Therefore, endpoint E1 was defined as remaining free of OAG (with an adequate IOP lowering therapy if ocular hypertension arises). IOP lowering therapy was not included as compared to endpoint E2.
4.2. Discussion of Model M2
In this model, the patient will receive the pleasant information if he will remain free of OAG within 10 years which is an important subjective relief for the person. The worst case which may happen is that a patient who receives a prediction will receive an IOP lowering therapy within 10 years. But still he or she can expect to remain free of OAG.
4.3. PEX as Risk Factor and how it Was Handled by the Models
Additionally, we analyzed how the models handled patients with PEX. There were 570 eyes without PEX, 44% received a prediction. All predictions were correct. 15 eyes had PEX and the algorithm rejected to make a prediction in all 15 eyes. This suggests that PEX as risk fact that deserves special attention by the glaucoma expert.
4.4. Implication for Practical Purposes
An implementation of this identification system in a computer system can be done in daily practice: This can be done by measuring age, IOP, PEX and optic nerve head measurements. The model can be implemented into any database such that the predictions can be done automatically.
Of course, we do not screen for all known sight threatening diseases, but for one major cause for visual impairment. Therefore, we also refer to personal responsibility and suggest that subjects should be screened anyway due to the risk for other eye threatening diseases. We suggest that the remaining patients without a prediction should be screened more closely meshed.
4.5. Outlook and Further Developments
We have many ideas to further improve the models in the future: First of all, is to test and analyse more candidate predictor variables based on image data, e.g. GDx®, OCT®, HRT II® or other structural imaging methods. Modern deep learning methods based on convolutional neural nets (CNN) such as Inception net, VGGNet, ResNet have already demonstrated utility in assessment of various disease processes including cataracts, glaucoma, age-related macular degeneration, and diabetic retinopathy [19,20]. Of course, these methods should also be applied – especially in combination with clinical data – for the prediction of the above addressed endpoints.
Another option is to establish prediction models for subgroups of OAG or related diseases. Also, we ask ourselves if we should increase or decrease the follow-up time (e.g. to 5 yrs or 15 yrs). We here are providing models for the development of the most common subform of glaucoma (OAG), which is per se only one of the major reasons for irreversible impairment of visual function and blindness worldwide. Enrolling our idea to the other subgroups of glaucoma and the other major reasons for irreversible impairment may reduce the burden for routine-screenings tremendously.
4.6. Strengths and Limitations of This Study
4.6.1. Strengths
The most important strength of this study is that it provides methods for safely excluding 43% of all eyes already at the initial exam and to correctly predict OAG freeness and freeness of IOP lowering therapy for 10 years. This significantly decreases the amount of practical screening efforts in daily work. Another strength is that the models are not only theoretical concepts/ideas/suggestions, they can easily be implemented in any data base and should then be applied in daily practise. The large sample size of about 600 eyes is also an important strength of the study. A large sample size is important to end up with statistically sound models as it is emphasized from mathematical statistics and machine learning theory. It is important to train and independently validate the models in large samples to avoid overlearning and to provide accurate predictions when the models are confronted with new, previously unseen data (generalization). Another strength of the study refers to the sample: right and left eyes were carefully distinguished and were not merged. This would artificially increase the sample size, but in that case, data independency of data may be destroyed. In this case, prediction models may run in danger to predict new, previously unseen data.
4.6.2. Limitations
Optic nerve head measurements were done using TopSS® (Laser Diagnostic Technologies) which is out-dated. However, for this study with such a long FU over 10 years, it was necessary to use this method to achieve a sufficient large sample size. As described in the methods section, visual field examinations were done using various different methods. In large cohort studies as ours, this is a common drawback within a long study period of more than 20 years which implies that no uniform data source for visual field was available. We strongly support the above procedure of examining only cases where a shallow chamber is observed as the vast majority of ophthalmologists in practice performs gonioscopy only in case of a suspect configuration of the anterior segment. When comparing results of different glaucoma screening programs, it is important to consider to which population the results are finally referred to. It is important to point out that data for these models were sampled in an European sample. It is well known that ethnicity and race are risk factors for glaucoma and therefore we suggest application of these model in Caucasian patients only.
5. Conclusions
43% of all eyes can safely be excluded from a glaucoma screening program for up to 10 years if one wants to be certain that the eye remains free of OAG and will not have any need for a IOP lowering therapy. We suggest the application of this model to inform the patient 10 years ahead and to safely exclude the identified eye from further screening within this period. This has a positive impact on reducing the enormous working and screening amount of ophthalmologists. We suggest the applications of these neural network models for screening purposes to decide which eyes can be safely excluded and which eyes should be followed-up more closely meshed and sent to a glaucoma expert. This filtering system and identification method will economize time and health care budgets for glaucoma screening in the future.
Author Contributions
Conceptualization, W.H. and M.L.; methodology, W.H.; software, W.H.; validation, W.H.; formal analysis, W.H.; investigation, W.H, M.L, M.H, H.R.; resources, W.H, M.L, M.H, H.R.; data curation, W.H.; writing—original draft preparation, W.H, M.L, M.H, H.R.; writing—review and editing, W.H, M.L, M.H, H.R.; visualization, W.H.; supervision, H.R.; project administration, H.R.; funding acquisition, H.R. All authors have read and agreed to the published version of the manuscript. All authors have not published or submitted any related papers from the same study elsewhere. All authors meet all four criteria for authorship in the ICMJE recommendations. This original manuscript or parts of it has not been published before. The manuscript was neither previously rejected nor evaluated in any form by another journal. We hereby declare that we had full access to all the data in the study and take responsibility for the integrity of the data and the accuracy of the data analysis as well as the decision to submit the publication.
Funding
This study was supported financially by the Government of Salzburg (grant number: 9/1-60,712/1-1996), Austria. Adele Rabensteiner Stiftung. We would also like to thank the ’Fonds Gesundes Oesterreich’ and the ‘Hauptverband der Sozialversicherungsträger‘ of Austria for their generous support.
Institutional Review Board Statement
The study was supported and approved by the Health administration council of the Federal State of Salzburg and conforms to the provisions of the Declaration of Helsinki in 1995. The study was approved by a local ethic committee (No 1120/2024). This study follows the CONSORT-AI Extension guidelines and the SPIRIT-AI guidelines.
Conflicts of Interest
HR and ML are consultants of Allergan Plc., WH and MH have nothing to disclose. There is no conflict of the authors in regard to collection of data, design of the study, in the collection, analyses or interpretation of data, in the writing of the manuscript or in the decision to publish the results.
References
- Kashiwagi K., Kogure S., Mabuchi F., et al. Change in visual acuity and associated risk factors after trabeculectomy with adjunctive mitomycin C. Acta Ophthalmol 2016;94:561-570.
- Heijl A., Leske M.A.C. et al. Reduction of Intraocular Pressure and Glaucoma Progression. Results From the Early Manifest Glaucoma Trial. Arch Ophthalmol 2002;120:1268-1279.
- Quigley, H.A. Glaucoma. The Lancet 2011; 1367-1377.
- Tonti E, Tonti S, Mancini F, Bonini C, Spadea L, D’Esposito F, Gagliano C, Musa M, Zeppieri M. Artificial Intelligence and Advanced Technology in Glaucoma: A Review. J Pers Med. 2024 Oct 16;14(10):1062. [CrossRef] [PubMed] [PubMed Central]
- Wu JH, Lin S, Moghimi S. Application of artificial intelligence in glaucoma care: An updated review. Taiwan J Ophthalmol. 2024 Sep 13;14(3):340-351. [4] Gordon M.O., Beiser J.A. Brandt J.D., Heuer D.K., Higginbotham E.J., Johnson C.A., Keltner J.L., Miller J.P., Parrish R.K. 2nd, Wilson MR, Kass MA. The Ocular Hypertension Treatment Study. Baseline factors that predict the onset of primary open-angle glaucoma. Arch Ophthalmol 2002;120:714-720. [CrossRef] [PubMed] [PubMed Central]
- Ravindranath R, Stein JD, Hernandez-Boussard T, Fisher AC, Wang SY; SOURCE Consortium. The Impact of Race, Ethnicity, and Sex on Fairness in Artificial Intelligence for Glaucoma Prediction Models. Ophthalmol Sci. 2024 Aug 14;5(1):100596. [CrossRef] [PubMed] [PubMed Central]
- de Voogd S., Ikram M.K., Wolfs R.C., Jansonius N.M., Hofman A., de Jong P.T. Incidence of open-angle glaucoma in a general elderly population: the Rotterdam Study. Ophthalmology. 2005;112(9):1487-1493.
- Mukesh B.N., McCarty C.A., Rait J.L., Taylor H.R. Five-year incidence of open-angle glaucoma: the visual impairment project. Ophthalmology. 2002; 109(6):1047-1051.
- Leske M.C., Wu S.Y., Honkanen R., et al. Nine-year incidence of open-angle glaucoma in the Barbados Eye Studies. Ophthalmology. 2007;114(6):1058-1064.
- Bengtsson, B.O. Incidence of manifest glaucoma. Br J Ophthalmol. 1989;73(7):483-487.
- Kroese M., Burton H., Vardy S., Rimmer T., McCarter D. Prevalence of primary open angle glaucoma in general ophthalmic practice in the United Kingdom. Br J Ophthalmol. 2002;86(9):978-980.
- Hitzl W., Hornykewycz K., Grabner G., Reitsamer H.A. On the relationship between age and prevalence and/or incidence of primary open-angle glaucoma in the „Salzburg-Moorfields Collaborative Glaucoma Study. Klin Monatsbl Augenheilkd. 2007;224(2):115-9.
- Coleman A.L. and Miglor S. Risk factors for glaucoma oneset and progression. Surv Ophthalmol 2008 Nov;53 Suppl1:S3-10.
- European Glaucoma Society. Terminology and Guidelines for Glaucoma. IInd Edition, Editrice DOGMA S.r.l, 2003.
- Oskarsdottir S.E., Heijl A., Bengtsson B. Predicting undetected glaucoma according to age and IOP: a prediction model developed from a primarily European-derived population. Acta Ophthalmol. 2019;97(4):422-426.
- Ekstrom, C. Elevated intraocular pressure and pseudoexfoliation of the lens capsule as risk factors for chronic open-angle glaucoma. A population-based five-year follow-up study. Acta Ophthalmol (Copenh) 1993;71:189–195.
- Ekström C., Alm A. Pseudoexfoliation as a risk factor for prevalent open-angle glaucoma.Acta Ophthalmol. 2008 Jun 19.
- Bishop C. M., Neural networks for pattern recognition (1995), Oxford university press Inc., United States.
- Hill, T. & Lewicki, P. (2007). STATISTICS Methods and Applications. StatSoft, Tulsa, OK.
- Wolfram Research, Inc., Mathematica, Version 13, Champaign, IL (2022).
- Li Z., He Y., Keel S., Meng W., Chang R.T., He M. Efficacy of a Deep Learning System for Detecting Glaucomatous Optic Neuropathy Based on Color Fundus Photographs Ophthalmology. 2018;125(8):1199-1206.
- Asaoka R., Murata H., Hirasawa K., Fujino Y., Matsuura M., Miki A., Kanamoto T., Ikeda Y., Mori K., Iwase A, Shoji N, Inoue K., Yamagami J., Araie M. Using Deep Learning and Transfer Learning to Accurately Diagnose Early-Onset Glaucoma From Macular Optical Coherence Tomography Images. Am J Ophthalmol. 2019;198:136-145.
Figure 1.
Scatterplot of C/D ratio and neuroretinal rim area (mm2) of 585 eyes suggesting the need of a reject option. All eyes were free of OAG without receiving IOP lowering eye therapy at the initial exam. Red dots indicate eyes fulfilling endpoint E2 (freeness of OAG + no IOP lowering therapy within 10 yrs of FU) at the 10 year FU, blue dots indicate eyes which do not fulfil endpoint E2 at the 10 yr FU. Eyes with values in the left part of the figure (‘low risk region’) are very likely to remain free of OAG and having no IOP lowering therapy within 10 yrs whilst eyes in the right region (‘high risk region’) are at high risk for developing a OAG or will receive an IOP lowering therapy within 10 years of FU. It is precisely the main task of neural networks to identify regions of low risk in the space of all input variables (including age, IOP, optic nerve head parameters and PEX), simultaneously.
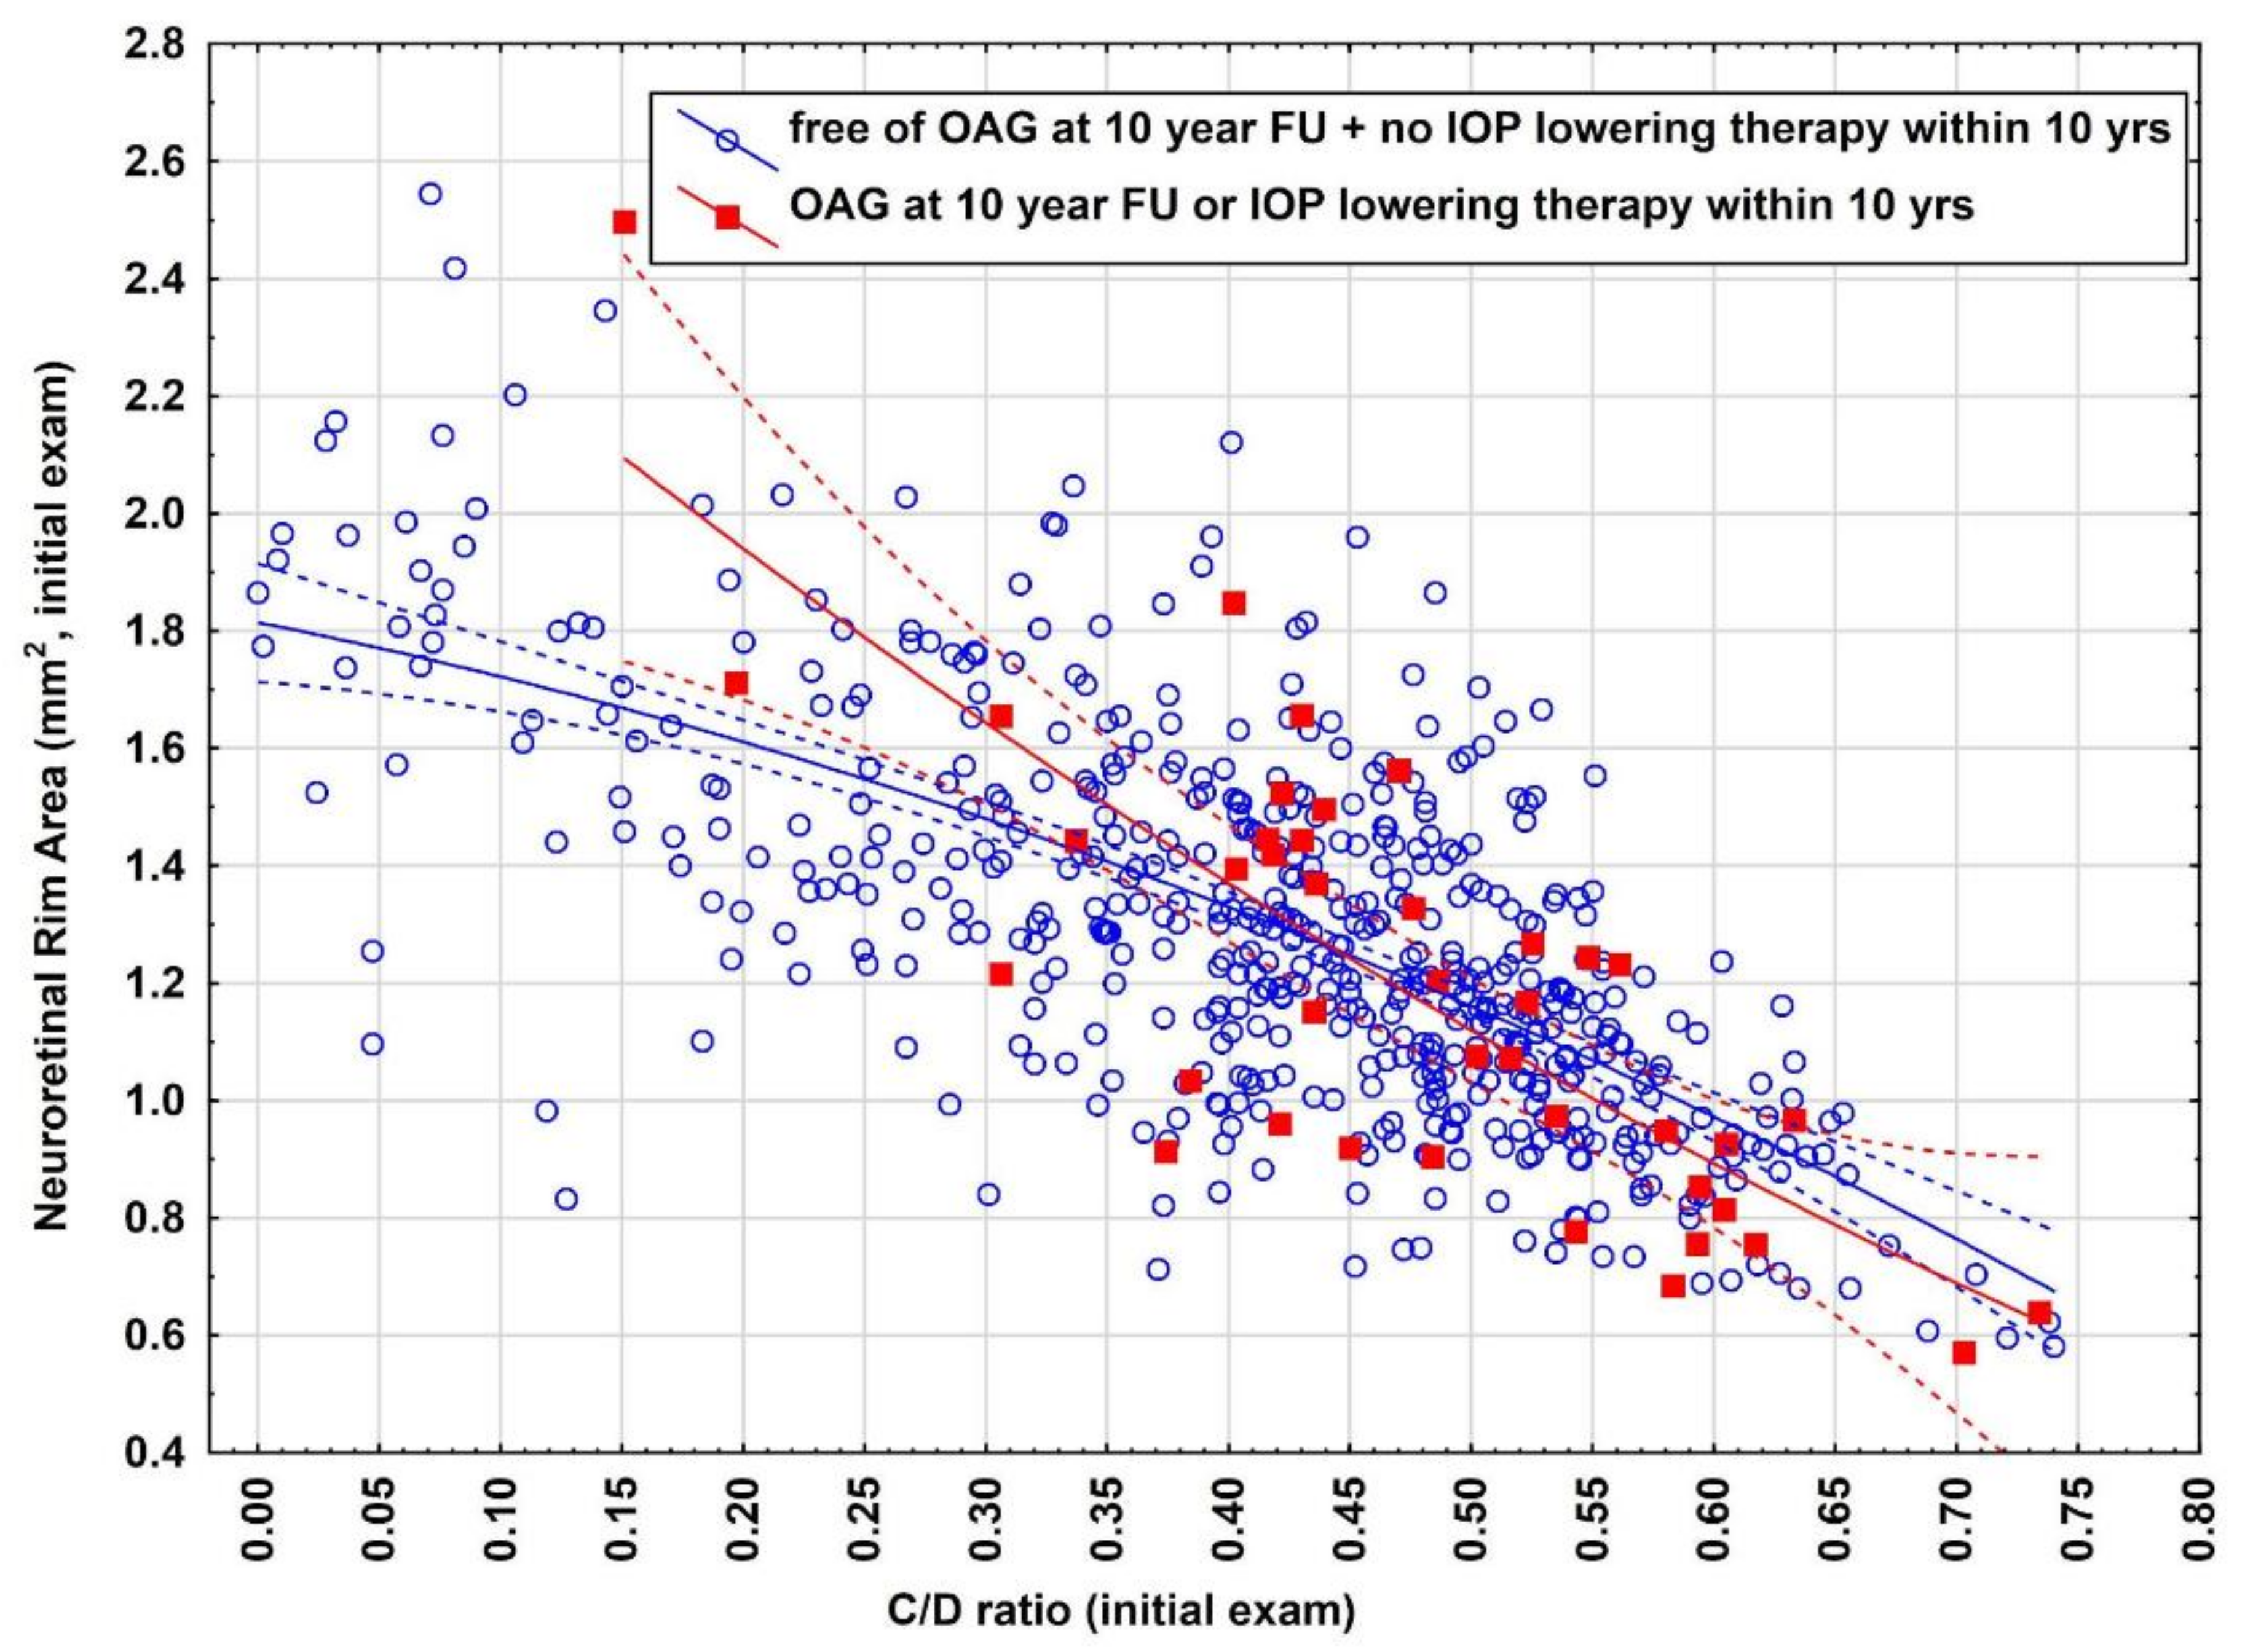
Table 3.
Overview performance, advantages and disadvantages of two predictive machine learning models with endpoints E11 and E22.
Table 3.
Overview performance, advantages and disadvantages of two predictive machine learning models with endpoints E11 and E22.
| Endpoint | Percentage of eyes filtered out/received a prediction (%) | Performances of the models3 (n/%) |
Advantages | Disadvantages | Remarks |
|---|---|---|---|---|---|
| E11 | 53.6%/46.4% | 271/271 (100%) | 46.4% of all eyes can safely be excluded from a glaucoma screening program for up to 10 years if one wants to be certain that the eye remains free of OAG. This significantly reduces the screening amount of ophthalmologists. |
53.6% did not receive a prediction. Eyes receiving IOP lowering therapy were not filtered out. |
This model is designed for patients in a glaucoma screeing setting within a hospital, if the patient wants to remain within the screening program and IOP lowering therapy can be continued. |
| E22 | 57%/43% | 253/253 (100%) | 43% of all eyes can safely be excluded from a glaucoma screening program for up to 10 years if one wants to be certain that the eye remains free of OAG and will not have any need for a IOP lowering therapy. This also significantly reduces the screening amount. |
57% did not receive a prediction. | Eyes can safely be excluded from the OAG screening program, especially if the patient wants to leave the screening program. |
1) Endpoint 1 (E1): remaining free of OAG within 10 yrs 2) Endpoint 2 (E2) composite endpoint: remaining free of OAG + no IOP lowering therapy within 10 yrs of FU. 3) Performances measured in the training and test sample.
Table 4.
Illustration of prediction model for endpoint E2 based on real data at the initial exam, predicted and observed endpoints at 10-year follow-up. Identified eyes (green) received a prediction by the model and can safely be excluded from the screening program. Eyes without a prediction (gray) should be send to a glaucoma expert. Patients who suffered of OAG or needed IOP lowering therapy are highlighted in red. No predictions were done in these cases. 332 eyes (57%) were filtered out and did not receive a prediction, 253 (43%) of all eyes received a prediction. 253 out of 253 eyes were correctly predicted (100%). Most importantly, no eye was predicted false-negatively.
| Initial exam | Predictions of endpoint E2 made at initial exam | Observed endpoint E2 at the 10 yr FU |
||||||||
|---|---|---|---|---|---|---|---|---|---|---|
| Age | IOP1 | EA2 | NR3 | VB4 | HDA5 | HD6 | C/D7 | PEX8 | ||
| 62 | 12 | 0.85 | 1.22 | -0.15 | 0.19 | -0.02 | 0.41 | No | No prediction | Free of OAG/no IOP low. therapy |
| 63 | 14 | 0.66 | 1.46 | -0.15 | 0.24 | -0.03 | 0.31 | No | Free of OAG/no IOP low. therapy | Free of OAG/no IOP low. therapy |
| 56 | 15 | 1.49 | 1.18 | -0.35 | 0.60 | -0.07 | 0.56 | No | Free of OAG/no IOP low. therapy | Free of OAG/no IOP low. therapy |
| 61 | 15 | 1.22 | 0.76 | -0.52 | 0.48 | -0.11 | 0.62 | No | No prediction | OAG |
| 66 | 14 | 1.41 | 1.10 | -0.34 | 0.50 | -0.09 | 0.56 | No | Free of OAG/no IOP low. therapy | Free of OAG/no IOP low. therapy |
| 42 | 17 | 0.51 | 1.73 | -0.10 | 0.19 | -0.03 | 0.23 | No | Free of OAG/no IOP low. therapy | Free of OAG/no IOP low. therapy |
| 54 | 14 | 0.85 | 0.91 | -0.13 | 0.32 | -0.02 | 0.49 | No | No prediction | OAG |
| 69 | 13 | 0.96 | 1.14 | -0.18 | 0.39 | -0.05 | 0.46 | No | Free of OAG/no IOP low. therapy | Free of OAG/no IOP low. therapy |
| 66 | 14 | 1.13 | 1.21 | -0.31 | 0.34 | -0.06 | 0.48 | No | Free of OAG/no IOP low. therapy | Free of OAG/no IOP low. therapy |
| 70 | 14 | 1.09 | 1.44 | -0.17 | 0.27 | -0.028 | 0.43 | Yes | No prediction | IOP low. therapy |
| 59 | 18 | 0.83 | 1.18 | -0.21 | 0.22 | -0.04 | 0.41 | No | Free of OAG/no IOP low. therapy | Free of OAG/no IOP low. therapy |
| 62 | 15 | 0.99 | 1.21 | -0.45 | 0.39 | -0.12 | 0.45 | No | No prediction | Free of OAG/no IOP low. therapy |
| 57 | 12 | 0.50 | 1.39 | -0.06 | 0.20 | -0.01 | 0.27 | No | Free of OAG/no IOP low. therapy | Free of OAG/no IOP low. therapy |
| 58 | 13 | 1.16 | 0.97 | -0.65 | 0.66 | -0.22 | 0.54 | No | No prediction | Free of OAG/no IOP low. therapy |
| 57 | 16 | 1.25 | 0.94 | -0.41 | 0.69 | -0.12 | 0.57 | No | No prediction | Free of OAG/no IOP low. therapy |
| 62 | 12 | 1.21 | 1.25 | -0.64 | 0.70 | -0.19 | 0.49 | No | No prediction | Free of OAG/no IOP low. therapy |
1) Intraocular eye pressure (mmHg), 2) effective area (mm2), 3) neuroretinal rim area (mm2), 4) volume below (mm3), 5) half depth area (mm2), 6) half depth volume (mm3), 7) cup-to-disc area, 8) pseudoexfoliation syndrome. .
Disclaimer/Publisher’s Note: The statements, opinions and data contained in all publications are solely those of the individual author(s) and contributor(s) and not of MDPI and/or the editor(s). MDPI and/or the editor(s) disclaim responsibility for any injury to people or property resulting from any ideas, methods, instructions or products referred to in the content. |
© 2025 by the authors. Licensee MDPI, Basel, Switzerland. This article is an open access article distributed under the terms and conditions of the Creative Commons Attribution (CC BY) license (http://creativecommons.org/licenses/by/4.0/).
Copyright: This open access article is published under a Creative Commons CC BY 4.0 license, which permit the free download, distribution, and reuse, provided that the author and preprint are cited in any reuse.


