

Submitted:
06 April 2025
Posted:
08 April 2025
You are already at the latest version
Abstract
Amidst escalating global environmental challenges, ecological development has become crucial for sustaining human well-being and planetary health. China, with its ambitious ecological civilization agenda, is at the forefront of this transition. This paper calculated the Gross Ecosystem Product (GEP) for China from 2005 to 2020 and employed the Dagum Gini coefficient to analyze regional ecological disparities.Results show that GEP grew steadily from 47.17 trillion yuan in 2005 to 74.40 trillion yuan in 2020, but this growth lagged behind GDP expansion. Regulation Services, though dominant, exhibited the slowest growth, hindering full realization of ecological product values. Regional disparities were prominent, with the western region having higher GEP but lower per unit area value, indicating inefficiencies in value realization. Eastern regions excelled in material and Cultural Services but had lower regulating service values. These findings underscore the need for balanced ecological development policies that enhance ecosystem regulation, reduce regional inequalities, and optimize ecological product value realization for sustainable growth.
Keywords:
Ecological Green Development Level
; Gross Ecosystem Product (GEP)
; Regulation Services
; Sustainable Development
; China
1. Introduction
Environmental challenges are escalating globally, posing significant threats to human well-being and planetary health. The interdependence between human activities and natural ecosystems has become increasingly evident, highlighting the urgent need for sustainable development practices. In this context, ecological development, which emphasizes the harmonious coexistence of humans and nature, has gained prominence as a critical pathway towards a more sustainable future.
China, given its rapid economic growth and vast ecological diversity, plays a pivotal role in global sustainability efforts. The country has recognized the importance of balancing economic development with ecological conservation and has implemented various policies and initiatives to promote ecological civilization. This shift towards green development not only aligns with international sustainability goals but also reflects China's commitment to addressing pressing environmental issues domestically.
Research has extensively explored how the value of ecological products is realized across diverse ecosystems, considering the roles of governments, businesses, and households [1,2]. Nevertheless, these studies offer an incomplete assessment of the comprehensive development status of regional ecosystems. In contrast to existing literature that emphasizes the ability to realize biophysical values of ecological product through proxy variables like ecological capital investment, ecological transfer payments in the economic realm, or water yield and ecosystem area in the ecological sphere [3,4,5], there are inherent limitations. The key challenge lies in integrating various regional ecosystems, quantifying their functional capacities, and accurately converting these capacities into monetary values. Addressing this challenge is essential for accurately measuring the overall development level of regional ecosystems, which is vital for unlocking the value of ecological products and achieving harmonious coexistence between humans and nature in the modern era.
Numerous research institutions and scholars, both domestically and internationally, have conducted extensive and in-depth studies on regional GEP. At the international level, the United Nations Statistics Division first introduced a concept called Ecological Domestic Product (EDP) in the System of Environmental-Economic Accounting (SEEA) published in 1993. Building on this, Costanza et al. (1997) expanded a classification standards for ecosystem value accounting [6]. Leveraging this framework, the United Kingdom undertook a comprehensive ecosystem assessment encompassing England, Scotland, Northern Ireland, and Wales in 2011. G. Stoneham et al. (2012) subsequently provided a systematic overview of land and ecosystem accounting practices within the SEEA framework [7]. In addition, Joshi, A. P et al. (2025) also measured GEP of Uttarakhand, India [8]. Domestically, following China's initial release of a green GDP accounting report in 2006, Peng Tao and Wu Wenliang (2010) conducted an in-depth analysis of the challenges and obstacles in national-level green GDP accounting [9]. Wang Nujie et al. (2010) estimated the service value of various ecosystems using Costanza's classification standards and ecosystem areas [10]. Using this methodology, Ma Guoxia et al. (2017) and Wang Jinnan et al. (2018) calculated the GEP of China's provincial-level terrestrial ecosystems for 2015 [11,12]. However, these studies did not delve deeply into the relevance and coordination aspects.
In 2013, Ouyang Zhiyun et al. introduced the novel concept of "Gross Ecosystem Product" (GEP), which holistically evaluates the biophysical and economic worth of goods and final services supplied by ecosystems across three dimensions: Material Product Supply, Regulation Services, and Cultural Services. Following Ouyang Zhiyun's approach, a multitude of studies emerged, each concentrating on a single-year accounting of specific nature reserves, national parks, cities, or county administrative regions [13,14,15,16,17,18,19,]. These studies offered fresh insights and methodologies for assessing ecosystem value. Nevertheless, owing to data constraints, comprehensive research at the national level remains scarce.
This paper develops a performance assessment framework for terrestrial ecosystems, focusing on ecological advantages, utilizing the Technical Guidelines for Accounting of Terrestrial Ecosystem Gross Product (GEP) published by the Ministry of Ecology and Environment. We compute the GEP for all provinces, municipalities, and counties in China spanning from 2005 to 2020, employing a range of ecological metrics. Furthermore, we determine the intra- and inter-provincial Gini coefficients for all provinces and cities with the Dagum Gini coefficient. We gauge the country's potential for sustainable ecological development through two lenses: GEP and ecological-green harmony.
The primary contributions of this paper as follows. Firstly, in terms of research methodology, this paper encompasses nearly all ecological functions within China's terrestrial ecosystems, utilizes county-level data from 2005 to 2020, and assesses the ecological coordination among diverse regions, thereby establishing a practical groundwork for examining ecological green development across various provinces, municipalities, and counties in China. Secondly, from a research perspective, this paper examines two dimensions: GEP and regional green harmonious development. It comprehensively evaluates regional GEP through three lenses-ecological resource endowment, capacity to actualize the biophysical values of ecological products, and ecological governance proficiency—thereby enriching the measurement research framework. Thirdly, concerning the organic integration and sustainable advancement of ecosystems, this study employs kernel density estimation as well as spatial Moran's I to investigate temporal and spatial dynamics, internal coordination mechanisms, and pathways for sustainable development in realizing the value of ecological products across various cities. Lastly, it identifies the challenges encountered by prefecture-level cities in fostering favorable ecological conditions for Chinese-style modernization and offers practical insights and decision-making support.
The paper is organized as follows: Section 2 introduces the theoretical framework and the data for China's Ecological Green Development Level. Section 3 presents measure results. Section 4 outlines spatial econometric analysis and robustness testing. Section 5 reports conclusions and policy recommendations.
2. Materials and Methods
The measurement of China's ecological green development level is divided into two parts: one is the calculation of the absolute value of ecosystem gross domestic product (GEP), and the other is the measurement of the coordination level of ecological green regions. The calculation of GEP is based on The Technical Guideline on Gross Ecosystem Product (GEP) published by the Research Center for Eco Environmental Sciences (CAS) in 2020.
The theoretical framework presented in this paper is illustrated in Figure 1:
2.1. Ecosystem Services Theory
GEP is a cornerstone concept in ecological accounting, highlighting the total monetary and biophysical value of diverse final products that ecosystems offer to humanity. It stems from the notion of ecosystem services, which encompasses the multitude of advantages humans derive from ecosystems, including the supply of material goods, regulatory functions, cultural amenities, and foundational support services (Wu Yang et al., 2021; Song Liu & Changwen Dai, 2021). Material goods signify items that can be directly exchanged in the market, whereas regulatory services pertain to functions that enhance the human living environment, like climate moderation and air purification. Cultural Services impart non-tangible benefits to humans via spiritual encounters, knowledge attainment, leisure activities, and entertainment. Foundational support services, meanwhile, represent the essential functions ecosystems provide to uphold other services. This theoretical construct provides an indispensable foundation for a comprehensive and systematic evaluation of ecosystems' integrated value.
The Guidelines enhance the theory of ecological accounting through the lens of ecosystem services, employing techniques like the market valuation approach, replacement cost method, shadow project method, and travel cost approach to quantify the monetary and biophysical value of ecological products, while adhering to principles of scientific rigor, practicality, comprehensiveness, and transparency. The assessment of ecological green regional coordination is grounded in the Gini coefficient. The indicators and the specific calculation method and corresponding data sources utilized in this paper shown in the appendix Table A1, A2 and A3, respectively.
2.2. Statistical Inequality Theory
The measurement of the coordination level of ecological green regions based on Dagum Gini coefficient. The Dagum Gini coefficient is an indicator that improves and corrects the traditional Gini coefficient by introducing more parameters and decomposition methods, enabling it to more accurately reflect the degree of inequality in income or resource allocation and to decompose overall inequality into multiple components for detailed analysis.
In this paper, the Dagum Gini coefficient is employed to measure disparities in GEP. The specific formula for the overall Gini coefficient, G, is as follows:
where denotes the number of regions, here referring to the three major regions of Eastern, Central, and Western China, thus ; n represents the number of prefecture-level cities; () indicates the number of prefecture-level cities in region (); () signifies the GEP of the i-th (r-th) city in region (); and denotes the mean of GEP.
The formula for the within-group Gini coefficient is:
The formula for the between-group Gini coefficient is:
where () represents the mean GEP of region ().
2.3. Database and Data Source
(1)Weather Data
This paper extensively utilizes weather data, which includes information on temperature, evaporation, wind speed, and snow depth. These databases cover all cities in China from 2000 to 2020, with the majority of the data available in vector formats or as grid images. The data sources are China's official climate monitoring platforms, such as the National Geographical System Science Data Center and the National Tibetan Plateau Data Center. These platforms collect and store climate information on a monthly, annual, or even daily basis for each monitoring point. This comprehensive climate information tracking provides a valuable resource for analyzing the eco-climate state of prefecture-level cities.
Notably, similar data has been used in analogous research all over the world. For example, Bosch J M and Hewlett J D (1982) calculated water yield in Coweeta, North Carolina, using precipitation and evaporation data [20]. Similarly, Zhou G et al. (2015) assessed the impact of climate and land cover on global water yield patterns using the same data [21]. Although there is less research on floods and windbreaks compared to water yield research, Stuerck J et al. (2014) estimated flood regulation services in Europe using precipitation, evaporation, and watershed data, while Nedkov S and Burkhard B (2012) mapped flood regulation ecosystem services in Etropole, Bulgaria [22,23].
(2)Geological Data
In addition to weather data, this paper also integrates a significant amount of geological data, such as land cover data, world soil data, NDVI data, Net Primary Productivity (NPP) data, elevation data, and vegetation cover index. These data are sourced from the geospatial data cloud platform in China and the World Soil Database, which measures the content of various elements in the soil in China. Of particular note is the Land-Cover Data, provided by the School of Remote Sensing and Information Engineering at Wuhan University, which records the area of various ecosystems, including forests, lakes, and cities, in various regions of China since 2000.
Comparable geological datasets have been extensively used in research worldwide. HH Bennett (1939) was among the first to investigate the factors influencing soil conservation [24]. Lal R (2014) later used the World Soil Database (HWSD) to assess the relationship between soil conservation and ecosystem services [25]. Huang J et al. (2013) used NDVI data to predict rice yields, while Huang J et al. (2017) estimated crop yields for food security [26,27]. Cramer W et al. (1999) found a relationship between climate change and NPP [28].
(3)Economic Data
The economic indicators used in this paper are primarily sourced from the Statistical Yearbooks published annually by local cities. These datasets mainly provide various population and economic indicators for each city, such as GDP, employment, and consumption. In this paper, tourism income and the added value of the primary industry are primarily used to measure the ability to harness the biophysical values of ecological products and Cultural Services. Similarly, the United States has a wealth of economic data that has been used in comparable research endeavors, although the specific datasets and methodologies may vary based on the research question and context.
3. Results
3.1. Measure Results of China's Ecological Green Development Level
This section seeks to uncover the fundamental trends and address the hurdles associated with the progression of China's gross ecological product (GEP). We evaluate the extent of ecological green development and its structural transformations in in China spanning from 2005 to 2020, utilizing the GEP framework. Furthermore, it pinpoints and analyzes the obstacles faced in fostering China's ecological prosperity.
3.1.1. Inadequate Realization of GEP
(1) Compared to GDP, GEP growth is sluggish.
Table 1 presents the absolute levels of China's GEP for selected years, and Figure 2 shows the tendency of China's GEP during the sample period.
Overall, the growth of China's GEP has been gradual year on year, with a significantly slower pace compared to that of the Gross Domestic Product (GDP), suggesting a limited ability to harness the biophysical values of ecological products. Between 2005 and 2020, China's GEP rose from 47.17 trillion yuan to 74.40 trillion yuan, marking an overall increase of 57.71% and an annual average growth rate of 3.18%. When juxtaposed with the national GDP's annual average growth rate of 12.05%, GEP's growth appears notably slower. A study conducted by Ma et al. (2017), utilizing Costanza's (1997) ecosystem service theory, estimated China's total GEP in 2015 to be 72.81 trillion yuan, a figure that aligns closely with the findings of this paper [11].
Within the three components of GEP, the monetary value of Regulation Services constitutes the largest share yet exhibits the slowest rate of increase. This sluggish improvement in ecosystem regulatory functions poses the greatest obstacle to the rapid expansion of the nation's GEP and the ability to realize the biophysical values of ecological products.
As illustrated in Table 1 and Figure 3, the monetary value of China's Material Product Supply rose from 2.14 trillion yuan in 2005 to 6.91 trillion yuan in 2020, marking a substantial increase of 223.13% and exhibiting an average annual growth rate of 8.26% throughout the study period. In terms of Regulation Services, the monetary value climbed from 43.55 trillion yuan in 2005 to 48.72 trillion yuan in 2020, reflecting a modest increase of 11.9% and an average annual growth rate of merely 0.88%, highlighting the sluggish growth and limited contribution of ecosystem regulation. The influence of government policies and other anthropogenic factors has been relatively minor [29]. Regarding Cultural Services, the monetary value surged from 1.48 trillion yuan in 2005 to 18.77 trillion yuan in 2020, demonstrating an astonishing increase of 1166.41% and an average annual growth rate of 18.63%. This study estimates the monetary value of Regulation Services for Alxa City in 2014 at 45.28 billion yuan, which aligns closely with the 47.749 billion yuan figure calculated by Wang Liyan et al. (2017) using an identical methodology for the same city and year [15].
To explore the root reasons for the stagnant growth in the monetary value of Regulation Services, Figure 3 depicts the general pattern of changes in the biophysical value of key regulatory functions at the city level. The limited supply of ecological assets within urban areas, especially the minor annual shifts in the distribution of various land use types, presents a hurdle to elevating the monetary value of these services. Furthermore, regulatory functions such as water retention, soil preservation, sandstorm mitigation, and climate modulation are impacted by yearly variations in elements like rainfall, sunlight exposure, temperature levels, and wind velocity [29]. As a result, the biophysical value of each regulatory function displays a certain level of unpredictability and oscillation, but a general trend of improvement can still be observed.
(3) Incomplete regulating functioning of other ecosystem types except for forest ecosystems.
There are significant gaps in the efficiency of realizing the value of different ecosystem types, and regions have not fully leveraged the unique functional advantages of each ecosystem. As shown in Table 2, among different ecosystem types, forest ecosystems have the highest monetary value of Regulation Services, with an average annual value of 38.15 trillion yuan during the sample period. Wetland and grassland ecosystem monetary values are close, at 4.01 and 4.13 trillion yuan, respectively. Farmland has the lowest value at 0.58 trillion yuan. It is noteworthy that the area of farmland ecosystems is even larger than that of forest ecosystems, but its output value is much lower than that of forest ecosystems. This is related to its primary function in terrestrial ecosystems, which is to provide Material Product Supply. Therefore, under the premise of ensuring adequate Material Product Supply, appropriate conversion of farmland to forests and grasslands is an important measure to increase regional GEP. Wang Liyan et al. (2017) calculated that the GEP of forest ecosystems in Alxa City accounted for 61.99% of the total value in 2014, followed by wetland ecosystems, then grassland, shrub, and farmland ecosystems [15]. This is close to the calculation results of this paper, which show that the forest ecosystem value accounted for 63.73% of the total value in 2014.
3.1.2. Incoordinated Ecological Green Development Among Regions
(1) Provincial Differences.
China exhibits considerable provincial differences in GEP and the ability to realize the biophysical value of ecological products.Based on the provincial average monetary values, as shown in Table 3, Inner Mongolia has the highest GEP score, reaching 555.7 billion yuan, while Tianjin’s, Ningxia’s, and Hainan’s score lower than 10 billion yuan. The monetary value per unit area can be served for assessing a region's capability to realize biophysical values of ecological product. Overall, Inner Mongolia also demonstrates the strongest capability in this regard, followed by coastal provinces such as Zhejiang, Fujian, Guangxi and Hainan; whereas provinces like Shanxi and Ningxia exhibit the weakest capabilities, with values of 1.64 and 1.38 yuan per square meter, respectively. The provincial calculation results in this chapter align closely with the national results calculated by Ma Guoxia et al. (2017) [11].
(2)Regional differences.
There are notable disparities in GEP across the eastern, central, and western regions of China. The results are depicted in Figure 4. Although the western region boasts a higher GEP, its growth rate lags behind, and its GEP per unit area is the lowest, signaling the weakest capacity to actualize the biophysical values of ecological products. In terms of the overall GEP magnitude, the western region outstrips both the central and eastern regions, owing to its extensive ecological resources and expansive territory. The GEP magnitudes of the central and eastern regions are comparable, yet both fall short of the national average. When considering GEP per unit area, the western region trails behind, whereas the eastern region leads the way. Despite the western region's abundance of ecological resources and expansive ecosystem area, it struggles to harness these advantages to actualize the biophysical values of ecological products. Regarding the mean annual growth rate, the western region's GEP exhibits the slowest growth, at 3.15%, while the eastern and central regions' GEP growth rates are nearly identical, reaching 3.33% and 3.36% respectively, indicating a notable surge in GEP and an enhanced capacity to realize ecological product values. The data underscores distinct spatial variations in ecological development levels among these regions.
Among the three components of GEP, the western region, which prides itself on abundant ecological resources, demonstrates a superior biophysical value in Regulation Services yet lacks the capacity to supply cultural and material products. As illustrated in Figure 5, the eastern region takes the lead in the monetary worth of Material Product Supply, with the central region trailing closely behind, both approaching the national average, whereas the western region falls short. This discrepancy stems from the fact that, although the western region is rich in ecological resources, it predominantly comprises forest, shrub, and lake ecosystems, with scarce farmland and grassland ecosystems crucial for material product provision in comparison to the eastern and central regions. In the sphere of Cultural Services' monetary worth, the eastern region stands at the forefront, while the central and western regions are almost on par but below the national benchmark. This can be attributed to the advanced economic development of the eastern region, especially in coastal cities with a thriving cultural tourism industry. When it comes to the monetary worth of regulatory services, the western region notably exceeds the national average, followed by the central region, with the eastern region lagging behind. Despite the fluctuating trends observed across all three regions, when accounting for the ecosystem area in each, the western region showcases the lowest monetary worth per unit area for regulatory services, with the eastern region taking the lead and the central region aligning snugly with the national average. This underscores the underutilization of the biophysical value of ecological products in the western region.
Figure 6 displays the within-group Gini coefficients for GEP across China and its three major regions. There are significant disparities in the capability to realize biophysical values of ecological product between regions, highlighting inequality issues. Overall, the average Gini coefficient for China during the sample period is as high as 0.452, ranging from 0.405 to 0.501. The intra-regional differences in China show an overall trend of "fluctuating decline" over time, with the degree of difference decreasing during the sample period, at an average annual rate of 1.04%. This reflects a gradual reduction in spatial differences in China's GEP, with high-quality development promoting gradual coordination and balanced ecological development across regions.
From the perspective of intra-group disparities among the three major regions, inequality is particularly pronounced in the western region. The mean intra-group Gini coefficients for the eastern, central, and western regions during the sample period are 0.416, 0.428, and 0.500, respectively, and their temporal trends align with the national pattern. Despite having the highest GEP, the western region also boasts the highest Gini coefficient, highlighting the greatest internal variations. This can be attributed to the diverse and abundant ecosystems in the western region, coupled with substantial differences in the provinces' ability to harness biophysical values of ecological products. In 2008, the intra-group Gini coefficients of the eastern and central regions were similar, and while both exhibited a decreasing trend subsequently, the eastern region's decline was notably steeper than that of the central region. This indicates that cities in the eastern region have effectively embraced the principle of ecological harmony and development, utilizing their regional strengths to minimize disparities in the realization of biophysical values of ecological products among cities.
The differences between different regions are shown in Figure 7. Overall the average differences in GEP levels between the "eastern-central," "eastern-western," and "central-western" regions were 0.423, 0.468, and 0.473, respectively, with the average differences involving the western region being larger. From a temporal perspective, from 2005 to 2020, the between-group Gini coefficients showed an overall trend of fluctuating decline, indicating that differences in the capability to realizing biophysical values of ecological product among regions are gradually narrowing.
3.2. Spatial Econometric Analysis and Robustness Testing
To enhance the credibility of this study, this paper employs spatial econometric methods to conduct robustness testing on the spatio-temporal characteristics of the accounting results.
3.2.1. Dynamic Evolution of GEP– Based on Kernel Density Estimation
In order to provide a more intuitively depiction of the absolute disparities during the sample period, we employ kernel density estimation to illustrate the dynamic progression of absolute differences in GEP across the country. This method generates dynamic distribution plots that reveal the evolutionary pattern of absolute GEP differences and highlight their magnitude and changing features. The detailed formula is as follows:
Where represents the kernel density function, describing the weights of all sample points within the neighborhood , and denotes the bandwidth for kernel density estimation. This paper adopts the optimal bandwidth method and uses a Gaussian kernel function to estimate the regional differences, with specific expression as follows:
Kernel density estimation reveals the distribution characteristics of sample data across regions, providing detailed descriptions of key attributes such as the distribution location, peak distribution characteristics, distribution spread, and number of peaks of the density curve, thereby capturing the dynamic evolution and changing characteristics of GEP. This paper uses prefecture-level city data while excluding the samples of Beijing, Chongqing, Shanghai, and Tianjin, with results illustrated in Figure 8:
Overall, the kernel density curves for GEP and its three major dimension indicators exhibit a gradual downward trend and an overall rightward shift, reflecting a positive growth trend in GEP levels in most regions of the country and indicating good ecological development. In terms of the peak distribution pattern, the peak height fluctuates with a "gradual decline" during the sample period. Except for regulatory services, the peaks decline and broaden, with the kernel density curves gradually flattening out, indicating a decentralized trend in the distribution of GEP levels across regions.
When examining the three major dimension indicators comprising GEP, the kernel density curves for material products provision and Cultural Services share similar waveform, with significant rightward shifts and gradually decreasing peak heights, accompanied by shortened right tails. This suggests that the levels of material products provision and Cultural Services in cities have increased annually during the sample period, while the inter-provincial gaps have narrowed year by year. Regulation Services show insignificant changes over time, with only a slight decline in peak height, indicating minimal variation in regulatory service levels among prefecture-level cities during the sample period. This may be attributed to the difficulty in significantly altering the areas of various ecosystems within prefecture-level cities in the short term, resulting in insignificant changes in most regulatory functions.
The results of kernel density estimation are generally consistent with the differences in GEP quantified by the Dagum Gini coefficient.
3.2.2. Spatial Correlation of GEP– Based on Spatial Moran's I
Entities located in closer geographical vicinity demonstrate a stronger level of interconnectedness, indicating the presence of spatial dependence or spatial autocorrelation in the measured values of a specific attribute across various spatial units. This research utilizes Spatial Moran's I to investigate both the overall and localized spatial autocorrelation of GEP across 273 cities in China, aiming to determine if there exists a spatial relationship in GEP values between these spatial entities.
This paper constructs global and local Moran's I indices, with the formula for the global Moran's I index as follows:
Where is the variance, is the mean, and and represent the GEP of different prefecture-level cities, respectively; n denotes the number of spatial units (i.e., prefecture-level cities), and is the spatial weight matrix reflecting the spatial connections between cities. The values of the global Moran's I index range from [-1,1]. When its value approaches 1, it indicates a higher degree of spatial agglomeration of China's GEP, with spatial positive correlation; when its value approaches -1, it suggests greater spatial variability of China's GEP, with spatial negative correlation; when its value is close to 0, it implies no spatial correlation of China's GEP, presenting a random spatial distribution. Simultaneously, this paper introduces two spatial matrices: one is the proximity weight matrix, where the spatial weight matrix takes a value of 1 when a city is geographically adjacent to another, and 0 otherwise. The second is the distance weight matrix, taking the reciprocal of the shortest highway mileage between cities.
Furthermore, to delve deeper into the spatial agglomeration effect of GEP among cities in China and discern potential different spatial correlation forms due to positional differences among spatial units, this paper introduces the local Moran's I index, with the formula as follows:
The figures for the local Moran's I index are not confined to the interval between -1 and 1. If the index value notably exceeds 0, it signifies that neighboring spatial units share comparable observed values, indicating a pattern of "high-high" clustering or "low-low" clustering; conversely, if the index value is markedly below 0, it denotes that adjacent spatial units exhibit contrasting observed values, pointing to a pattern of "high-low" clustering or "low-high" clustering.
The results of the global Moran's I index are shown in Table 4:
According to Table 4, the global Moran's I indices calculated based on both the proximity weight matrix and the distance weight matrix are significantly positive at the 1% statistical level. This demonstrates that China's GEP exhibits significant positive spatial correlation and strong spatial agglomeration effects across the board. That is, prefecture-level cities with relatively low GEP levels are adjacent to at least one other prefecture-level city with similarly low GEP levels, and those with relatively high GEP levels are adjacent to at least one other with similarly high GEP levels. Additionally, under the binary contiguity matrix, the global Moran's I index fluctuates within the range [0.349,0.481], and under the distance weight matrix, it fluctuates within the range [0.066,0.102]. This indicates that the global Moran's I index values are generally stable under different spatial weights, suggesting that the spatial correlation of China's GEP possesses certain long-term robustness.
The local Moran's I index calculations cover only the years 2005, 2010, 2015, and 2020, utilizing the distance spatial matrix. The scatter plot results are shown in Figure 9:
The x-axis and y-axis of the Moran's I scatter plot depict the standardized GEP and its spatial lag (i.e., the weighted mean of surrounding units relative to the observed value), respectively. The inclination of the diagonal line signifies the annual global Moran's I index value. The first quadrant signifies a high-high positive association, the second quadrant indicates a low-high negative association, the third quadrant denotes a low-low positive association, and the fourth quadrant represents a high-low negative association. Given that all global Moran's I indices for China's multi-ecosystem GEP are positive, the primary focus of this study's observations lies within the first and third quadrants of the scatter plot. Figure 9 illustrates that, over the years, the majority of provinces are situated within these key observation zones, strongly indicating the enduring significance of the positive spatial correlation in China's GEP.
4. Discussion
This research calculates the ecological green development index for provinces, municipalities, and prefectures across China, covering the period from 2005 to 2020, using the GEP and Dagum Gini coefficient. The results of this calculation are corroborated by kernel density estimation and the spatial Moran's I index, to investigate the temporal and spatial trends as well as regional variations in GEP. The primary conclusions are as follows:
Firstly, the expansion of GEP is gradual, and the ability to harness the biophysical worth of ecological goods is insufficient. The yearly mean growth rate of nationwide GEP stands at merely 3.18%, markedly below the concurrent annual average GDP growth rate of 12.05%. This suggests that while GEP has risen, its growth trajectory is sluggish and does not align with the rate of economic advancement, highlighting a disparity between ecological preservation and economic progress.
Secondly, ecosystem regulatory service functions are severely constrained by ecological resources and natural climate conditions. Among the three components of GEP, regulatory service value accounts for the highest proportion but has the slowest growth rate. This is mainly due to the limited endowment of ecological resources and the randomness and volatility of natural climate factors.
Thirdly, there is a lack of coordination in green development across ecological zones, and pronounced ecological disparities exist among various regions. Notable variations are observed in the provinces of China regarding their ability to harness the biophysical values of ecological products. The ecological progress in the eastern, central, and western areas is not synchronized. While the western region boasts a higher monetary value for Regulation Services compared to the central and eastern regions, its growth pace lags behind.
Looking ahead, several implications emerge from this study. First, policies should prioritize enhancing ecosystem regulation to ensure long-term ecological sustainability. This could involve investments in conservation and restoration projects, particularly for Regulation Services like water conservation and carbon sequestration.
Second, addressing regional inequalities in GEP realization is crucial. Policies could focus on improving the efficiency of ecological product value realization in the western region, possibly through mechanisms like payment for ecosystem services (PES) schemes or eco-compensation programs that transfer benefits from regions that benefit from ecological services to those that provide them.
Third, , future research should explore the dynamic relationship between GEP and GDP, examining how changes in one affect the other. Additionally, more detailed spatial analyses could provide deeper insights into the factors influencing GEP distribution and disparities.
In conclusion, this study provides valuable insights into China's ecological green development, highlighting both achievements and challenges. By focusing on GEP and regional disparities, it contributes to the broader discourse on sustainable development and offers actionable recommendations for policymakers and researchers alike.
Author Contributions
Conceptualization, Yu Xi and Yang Hanshuo; methodology, Yu Xi and Shi Yao; software, Yu Xi; validation, Yu Xi, Yang Hanshuo and Shi Yao.; formal analysis, Yang Hanshuo.; investigation, Shi Yao; resources, Shi Yao; data curation, Yu Xi; writing—original draft preparation, Yu Xi; writing—review and editing, Yang Hanshuo; visualization, Shi Yao; supervision, Shi Yao; project administration, Yu Xi; funding acquisition, Yang Hanshuo. All authors have read and agreed to the published version of the manuscript.”.
Funding
This work was supported by the Major Projects of National Social Science Fund of China [22ZDA108]; Key Project of Cultivating Representative Achievements of Graduate Students in Southwestern University of Finance and Economics [JGS2024017].
Data Availability Statement
The data presented in this study are available on request from the corresponding author.
Conflicts of Interest
The authors declare no conflicts of interest.
Appendix A

Table A1.
Definition of Indicators of GEP.
| Indicator | Indicator Description |
|---|---|
| Material Product Supply | Ecosystems in China's districts and counties provide a wide range of material products including agricultural, forestry, animal husbandry, fishery products, and ecological energy. The biophysical value of these products are derived from the statistical yearbooks of respective districts and counties. The monetary value of material services is determined using the market value method. |
| Water Conservation | Water conservation services refer to the ecosystem's ability to intercept, store, and infiltrate precipitation, thereby enhancing soil moisture, regulating storm runoff, replenishing groundwater, and increasing the availability of water resources. The biophysical value of water conservation is calculated using the Integrated Valuation of Ecosystem Services and Trade-offs model (InVEST model), specifically its Water Yield module. The monetary value of water conservation, primarily manifested in its economic benefit for water storage and retention, is assessed using the shadow engineering approach. |
| Soil Conservation | Soil conservation involves protecting the soil from erosion, increasing soil resilience, and reducing soil loss through various ecosystem components such as forest canopies, litter, and root systems. The biophysical value of soil conservation is calculated using the InVEST model's Soil Retention module, which incorporates elevation data, rainfall erosivity factor, soil erodibility factor, land use data, biophysical tables, parameters, and watershed boundaries to generate raster data on potential and actual soil erosion for various ecosystems nationwide. The monetary value of soil conservation is assessed using the replacement cost method, which considers the reduction in non-point source pollution and sediment deposition. |
| Sand Storm Prevention | Sand storm prevention refer to the ecosystem's ability to mitigate soil loss and sandstorm hazards caused by strong winds. The physical quantity of windbreak and sand fixation is calculated using the Revised Wind Erosion Equation (RWEQ). The value of sand storm prevention is assessed using the restoration cost method, which considers the cost of rehabilitating degraded sandy land or restoring vegetation. |
| Flood Regulation and Storage | Flood regulation and storage refers to the natural ecosystem's ability to absorb large amounts of precipitation and transit water, store flood peak water volume, reduce and delay flood peaks, thereby mitigating the threats and losses caused by flood peaks during the flood season. This study follows the approach of Rao Enming et al. (2015) and Wang Liyan et al. (2017) to examine the function of lakes and marshes in regulating and storing floodwater to mitigate flood threats. The physical quantity of flood regulation is calculated based on the area of various ecosystems, using the following formula: This study employs the shadow engineering method, using the construction cost of reservoirs to calculate the monetary value of flood regulation regulation and storage by natural ecosystems: |
| Air Purification | Air purification refers to the ecosystem's ability to absorb, filter, block, and decompose air pollutants (such as SO₂, NOx, particulate matter, etc.), thereby improving the atmospheric environment. In this study, only the ecosystem's ability to absorb SO₂, NOx, and dust are considered to calculate the biophysical value of air purification.[30,31,32,33,34] This study uses the replacement cost method to calculate the value of air purification by considering the cost of industrial air pollutant treatment.[35] |
| Water Purification | Water purification refers to the ability of aquatic ecosystems such as lakes, rivers, and marshes to adsorb, degrade, and transform water pollutants, thereby purifying the aquatic environment. In this study, the purification capacity of ecosystem for COD, total nitrogen and total phosphorus is considered to calculate the biophysical value of water purification.[36] Similar to air purification, this study uses the replacement cost method to calculate the monetary value of water purification by considering the cost of water pollutant treatment: |
| Carbon Sequestration | Carbon sequestration refers to the ecosystem's ability to absorb atmospheric CO₂, synthesize organic matter, and store carbon in plants or soils. This study calculates the biophysical value of terrestrial ecosystem carbon sequestration using the Net Ecosystem Productivity (NEP) method.[37] The monetary value of ecosystem carbon sequestration can be calculated using the market value method and the carbon market trading price. |
| Oxygen Provision | The oxygen release function of ecosystems refers to the plants' ability to release oxygen during photosynthesis, thereby maintaining atmospheric oxygen stability and improving the human living environment. This study calculates the biophysical value of oxygen release capacity using the NEP method based on the chemical equation of photosynthesis: The monetary value of ecosystem oxygen provision is calculated using the market value method and the industrial oxygen production price: |
| Climate Regulation | Climate regulation services refer to the ecosystem's ability to absorb solar energy through vegetation transpiration and water surface evaporation, thereby lowering temperature, increasing air humidity, and improving human living comfort. This study uses the biophysical value of total energy consumed by ecosystem transpiration and evaporation as the physical quantity of climate regulation. This study employs the replacement cost method, using the electricity consumption required for artificial temperature and humidity regulation to calculate the monetary value of ecosystem climate regulation. |
| Tourism and Landscapes | Ecosystems in various districts and counties in China provide humans with the functions of leisure tourism and landscape appreciation. The physical quantity and value of these services are derived from the statistical yearbook data of each district and county. The monetary value of cultural services is calculated using the method of monetary market value and tourism revenue. |
Table A2.
Measurement Method for GEP.
| Function |
Secondary Indicators |
Indicator Formula |
Formula Description |
| Material Product Supply | Agricultural ; Forestry ; Animal Husbandry ; Fishery ; Other Product; Ecological Energy |
represents the biophysical value represents the output (kg) of the i-th product denotes the unit price (CNY/kg) of the i-th product. |
|
| Regulation Services | Water Conservation |
is the monetary value of water conservation (CNY/a) represents the biophysical value within the assessment area (m³/a) denotes the construction and maintenance cost per unit storage capacity of a reservoir (CNY/m³). |
|
| Soil Conservation |
|
is the biophysical value of soil conservation (t/a) R represents the rainfall erosivity factor K denotes the soil erodibility factor L and S are the slope length and steepness factors (dimensionless) C and P are the vegetation cover and management factor and soil conservation practice factor (dimensionless) is the total monetary value of soil conservation (CNY/a) represents the monetary value of reducing sediment deposition (CNY/a) denotes the monetary value of reducing non-point source pollution (CNY/a). |
|
| Sand Storm Prevention |
|
is the biophysical value of sand storm prevention (t/a) WF represents the climatic factor (kg/m) EF denotes the soil erodibility factor SCF is the soil crusting factor K is the surface roughness factor, C is the vegetation cover factor. is the monetary value of sand storm prevention (CNY/a) denotes the soil bulk density (t/m³) h is the thickness of sand covering the soil (m) C represents the cost of sand control engineering per unit area (CNY/m²). |
|
| Flood Regulation and Storage |
= |
is the biophysical value of flood regulation and storage (m³) is the flood regulation capacity of lakes (m³) is the flood regulation capacity of marshes (m³). is the total marsh area (km²) h is the soil water storage depth in marsh wetlands ρ is the soil bulk density of marsh wetlands (g/cm³) is the density of water (g/cm³) F is the soil saturated water content of marsh wetlands (dimensionless) E is the natural water content of marsh wetlands before flooding (dimensionless). is the total marsh area (km²) H is the surface water storage height in marsh wetlands is the monetary value of ecosystem flood regulation (CNY) is the construction cost per unit storage capacity of the reservoir |
|
| Air Purification |
|
is the biophysical value of air purification capacity of the ecosystem (kg) is the unit area purification capacity of the j-th air pollutant by the i-th type of ecosystem (kg/km²), i represents the ecosystem type (forest, shrubland, grassland; dimensionless) Aᵢ is the area of the i-th type of ecosystem (km²), and j represents the type of air pollutant (SO₂, NOx, dust)(dimensionless). is the monetary value of air purification by the ecosystem (CNY) is the treatment cost of the j-th air pollutant (CNY/t). |
|
| Water Purification |
|
is the biophysical value of water purification capacity (kg) is the monetary value of water purification by the ecosystem (CNY/a) is the treatment cost of the j-th water pollutant (CNY/t) |
|
| Carbon Sequestration |
|
is the biophysical value of carbon sequestration capacity of the terrestrial ecosystem (t) NEP is calculated based on the NPP and the conversion coefficient provided in the guidelines. is monetary the value of ecosystem carbon sequestration (CNY) is the carbon price |
|
| Oxygen Provision |
|
is the biophysical value of oxygen release capacity of the ecosystem (t·O₂) is the carbon sequestration capacity of the terrestrial ecosystem (t·CO₂) is the monetary value of ecosystem oxygen provision (CNY/a) is the industrial oxygen production price |
|
| Climate Regulation |
|
is the biophysical value of energy consumed by ecosystem transpiration and evaporation (kW·h) is the energy consumed by ecosystem vegetation transpiration (kW·h) is the energy consumed by wetland ecosystem evaporation (kW·h). is the monetary value of ecosystem climate regulation (CNY/a) is the local electricity price (CNY/kW·h) |
|
| Cultural Services | Tourism and Landscapes |
is the monetary value of cultural services(CNY) is the monetary value of tourism (CNY) is the monetary value of landscapes (CNY) |
Table A3.
Data and Database.
|
Secondary Indicator |
Data | Database (Data Source) |
| Product Supply | Value-added | China County Statistical Yearbook (County Bureau of Statistics) |
| Water Conservation | Precipitation | Monthly Precipitation and Evapotranspiration Data (National Geographical System Science Data Center) |
| Evapotranspiration | ||
| Root depth | Bedrock Depth Data [38-39] | |
| Plant-available water content |
World Soil Database (National Tibetan Plateau Data Center) | |
| Land use | CLCD Data (School of Remote Sensing and Information Engineering, Wuhan University) |
|
| Watershed boundary | Elevation Data (Geospatial Data Cloud) | |
| Soil Conservation | Slope data | |
| Rainfall erosivity factor | Annual Precipitation Data (National Geographical System Science Data Center) | |
| Soil erodibility factor | World Soil Database (National Tibetan Plateau Data Center) | |
| Land use | CLCD Data (School of Remote Sensing and Information Engineering, Wuhan University) |
|
| Watershed boundary | Elevation Data (Geospatial Data Cloud) | |
| Sand Storm Prevention | Wind force factor | Daily Wind Speed Data, Precipitation, Evapotranspiration Data (National Geographical System Science Data Center) |
| Soil moisture | ||
| Snow cover factor | China's Long Time Series Snow Depth Dataset (National Tibetan Plateau Data Center) |
|
| Soil erodibility factor | World Soil Database (National Tibetan Plateau Data Center) | |
| Soil crusting factor | ||
| Vegetation cover factor | China's Annual Vegetation (NDVI) Data (Chinese Academy of Sciences Resource and Environment Science Data Platform) |
|
| Surface roughness factor | Elevation Data (Geospatial Data Cloud) | |
| Flood Regulation and Storage | Lake area | CLCD Data (School of Remote Sensing and Information Engineering, Wuhan University) |
| Lake region | China Lake Records (The Technical Guideline on Gross Ecosystem Product) | |
| Air purification | Forest, shrubland, and grassland area | CLCD Data (School of Remote Sensing and Information Engineering, Wuhan University) |
| Absorption capacity of atmospheric pollutants | Literature [30-34;40-42] | |
| Water Purification | Wetland area | CLCD Data (School of Remote Sensing and Information Engineering, Wuhan University) |
| Absorption capacity of water pollutants | Literature [34;36] | |
| Carbon Sequestration | Net ecosystem productivity (NEP) | Net Primary Productivity (NPP) (Google Earth Engine platform) |
| NPP conversion factor | Conversion Factors of Provinces and Cities (The Technical Guideline on Gross Ecosystem Product) |
|
| Oxygen Provision | NEP | Net primary Productivity (NPP) (Google Earth Engine platform) |
| Climate Regulation | Forest, shrubland, and grassland area | CLCD Data (School of Remote Sensing and Information Engineering, Wuhan University) |
| Number of days with max daily temperature above 26°C | Daily Temperature Data and Monthly Evapotranspiration Data (National Geographical System Science Data Center) |
|
| Water surface evaporation | CLCD Data (School of Remote Sensing and Information Engineering, Wuhan University) |
|
| Tourism and Landscapes | Tourism revenue | China County Statistical Yearbook (County Bureau of Statistics) |
References
- Liu J Y, Mou D G. Research progress of ecological product value and its realization mechanism. Ecol. Econ, 2020, 36: 207-212.
- Gao X, Lin Y, Xu W, et al. Research progress on the value realization of ecological products. Acta Ecol. Sin, 2020, 40: 24-33.
- Wang B. The value realization of rural ecological products from the perspective of common prosperity: basic logic and value realization path choice. Chinese Rural Economy, 2022, (6): 129-143.
- Zhu H, Chen X L, Yin D. Transforming “green water and green mountains” into “golden mountains and silver mountains”: Research on the stage, path and system of the value realization of rural ecological products in underdeveloped areas. Journal of Management World, 2023, 39(8): 74-91.
- Tingting X. Achieving a sustainable balance: Strategies for environmental protection and economic development in key national ecological function zones. World Econ, 2024, 47: 34-63.
- Costanza R, d'Arge R, De Groot R, et al. The value of the world's ecosystem services and natural capital. nature, 1997, 387(6630): 253-260. [CrossRef]
- Stoneham G, O'Keefe A, Eigenraam M, et al. Creating physical environmental asset accounts from markets for ecosystem conservation. Ecological Economics, 2012, 82: 114-122. [CrossRef]
- Joshi A P, Joshi S, Sudhanshu R K, et al. Deciphering Uttarakhand's human efforts towards the ecology through Gross Environment Product (GEP) calculations. Environmental and Sustainability Indicators, 2025, 25: 100578. [CrossRef]
- Peng T, Wu W L. Green GDP accounting: further research and discussion in the context of low-carbon development. China Popu. Resour. Environ, 2010, 20(12): 81-86.
- Wang N, Liu J, Wu D, et al. Regional eco-compensation based on ecosystem service assessment: A case study of Shandong Province. Shengtai Xuebao/Acta Ecologica Sinica, 2010, 30(23): 6646-6653.
- Ma G X, Yu F, Wang J N, et al. Measuring gross ecosystem product (GEP) of 2015 for terrestrial ecosystems in China. China Environ. Sci, 2017, 37(4): 1474-1482.
- Wang J, Ma G, Yu F, et al. Study on China’s Gross Economicecological Product Accounting in 2015. China Population, Resources and Environment, 2018, 28(2): 1.
- Song C S, Ouyang Z Y. Gross Ecosystem Product accounting for ecological benefits assessment: A case study of Qinghai Province. Acta Ecol. Sin, 2020, 40(10): 3207-3217.
- Geng J, Ren B N. Application of the gross ecosystem product accounting theory on rural ecological civilization assessment in Hainan Province: A case study of Wenmen Village in Sanya. Acta Ecol. Sin, 2020, 40: 3236-3246.
- Liyan W, Yi X, Zhiyun O, et al. Gross ecosystem product accounting in the national key ecological function area: an example of Arxan. China Population, Resources and Environment, 2017, 27(3): 146-154.
- Yang J, Huang X. 30 m annual land cover and its dynamics in China from 1990 to 2019. Earth System Science Data Discussions, 2021, 2021: 1-29.
- Hu Q, Lu C, Chen T, et al. Evaluation and analysis of the gross ecosystem product towards the sustainable development goals: A case study of Fujian Province, China. Sustainability, 2023, 15(5): 3925. [CrossRef]
- Zhou X, Wang Q, Zhang R, et al. A spatiotemporal analysis of Hainan Island’s 2010–2020 gross ecosystem product accounting. Sustainability, 2022, 14(23): 15624.
- Liu Y, Yang T, Tian L, et al. Ada-XG-CatBoost: A combined forecasting model for gross ecosystem product (GEP) prediction. Sustainability, 2024, 16(16): 7203. [CrossRef]
- Bosch J M, Hewlett J D. A review of catchment experiments to determine the effect of vegetation changes on water yield and evapotranspiration. Journal of hydrology, 1982, 55(1-4): 3-23. [CrossRef]
- Zhou G, Wei X, Chen X, et al. Global pattern for the effect of climate and land cover on water yield. Nature communications, 2015, 6(1): 5918. [CrossRef]
- Stürck J, Poortinga A, Verburg P H. Mapping ecosystem services: The supply and demand of flood regulation services in Europe. Ecological Indicators, 2014, 38: 198-211.
- Nedkov S, Burkhard B. Flood regulating ecosystem services—Mapping supply and demand, in the Etropole municipality, Bulgaria. Ecological Indicators, 2012, 21: 67-79. [CrossRef]
- Bennett H H. Soil conservation. 1939.
- Lal R. Soil conservation and ecosystem services. International soil and water conservation research, 2014, 2(3): 36-47.
- Huang J, Wang H, Dai Q, et al. Analysis of NDVI data for crop identification and yield estimation. IEEE Journal of Selected Topics in Applied Earth Observations and Remote Sensing, 2014, 7(11): 4374-4384.
- Huang J, Wang X, Li X, et al. Remotely sensed rice yield prediction using multi-temporal NDVI data derived from NOAA's-AVHRR. PloS one, 2013, 8(8): e70816.
- Cramer W, Kicklighter D W, Bondeau A, et al. Comparing global models of terrestrial net primary productivity (NPP): overview and key results. Global change biology, 1999, 5(S1): 1-15.
- Dong T, Zhang L, Xiao Y, et al. Assessment of ecological assets and gross ecosystem product value in Ordos City. Acta Ecol. Sin, 2019, 39(9): 3062-3074.
- Han S Y, Tian D L, Yan W D, et al. Evaluation of Eco-Service Functions of Major Forest Types in Hunan Province. J. Cent. South Univ. For. Technol, 2009, 29: 6-13.
- Wu YaoXing W Y X, Kang WenXing K W X, Guo QingHe G Q H, et al. Functional value of absorption and purgation to atmospheric pollutants of urban forest in Guangzhou. 2009.
- Yong Z, Shuren L, Zhiping Y. The Effect of Greenland on absorbed dust and its assessment method. JOURNAL-HUAZHONG AGRICULTURAL UNIVERSITY, 2002, 21(6): 582-586.
- Jia J M, Luo W, Du T T, et al. Valuation of changes of ecosystem services of Tai Lake in recent 10 years. Acta Ecol. Sin, 2015, 35: 2255-2264.
- Yin F N. A study on the function of Lake Dongting’s Wetland in removing pollutants. J. Subtrop. Resour. Environ, 2004, 19: 1-5.
- Zhou P, Zhou X, Zhou D Q. A survey of studies on estimating CO2 mitigation costs. Manag. Rev, 2014, 26: 20-27.
- Zhang B, Gao J, Xie G, et al. Preliminary evaluation of air temperature reduction of urban green spaces in Beijing. Shengtai Xuebao/Acta Ecologica Sinica, 2012, 32(24): 7698-7705.
- Zhou Z X, Li J, Feng X M. The value of fixing carbon and releasing oxygen in the Guanzhong-Tianshui economic region using GIS. Acta Ecol. Sin, 2013, 9: 2907-2918.
- Yan F, Shangguan W, Zhang J, et al. Depth-to-bedrock map of China at a spatial resolution of 100 meters. Scientific Data, 2020, 7(1): 2.
- Li G, Zhao W, Wei Y, et al. Evaluation on the influence of natural forest protection program on forest ecosystem service function in changbai mountain. Acta Ecol. Sin, 2015, 35: 984-992.
- Li Q, Sun G N. Study on Annual Changes and Synchronousness of Atmosphere Pollution Reduction by Woodland and Grassland in Xi’an. Syst. Sci. Compr. Stud. Agric, 2008, 24: 73-77.
- Yuan Z K, Tian D L, Yuan S B. Research on SO2 cleansing ability of the air of forest biology system and S absorbed potentia. Hunan For. Sci. Technol, 2005, 32: 1-4.
- Ma X H, Sun G N, Ren Z Y. The values of vegetation purified air and its measure in Xin’an city. J. Arid. Land Resour. Environ, 2002, 4: 83-86.
Figure 1.
Framework for China's Ecological Green Development Level.
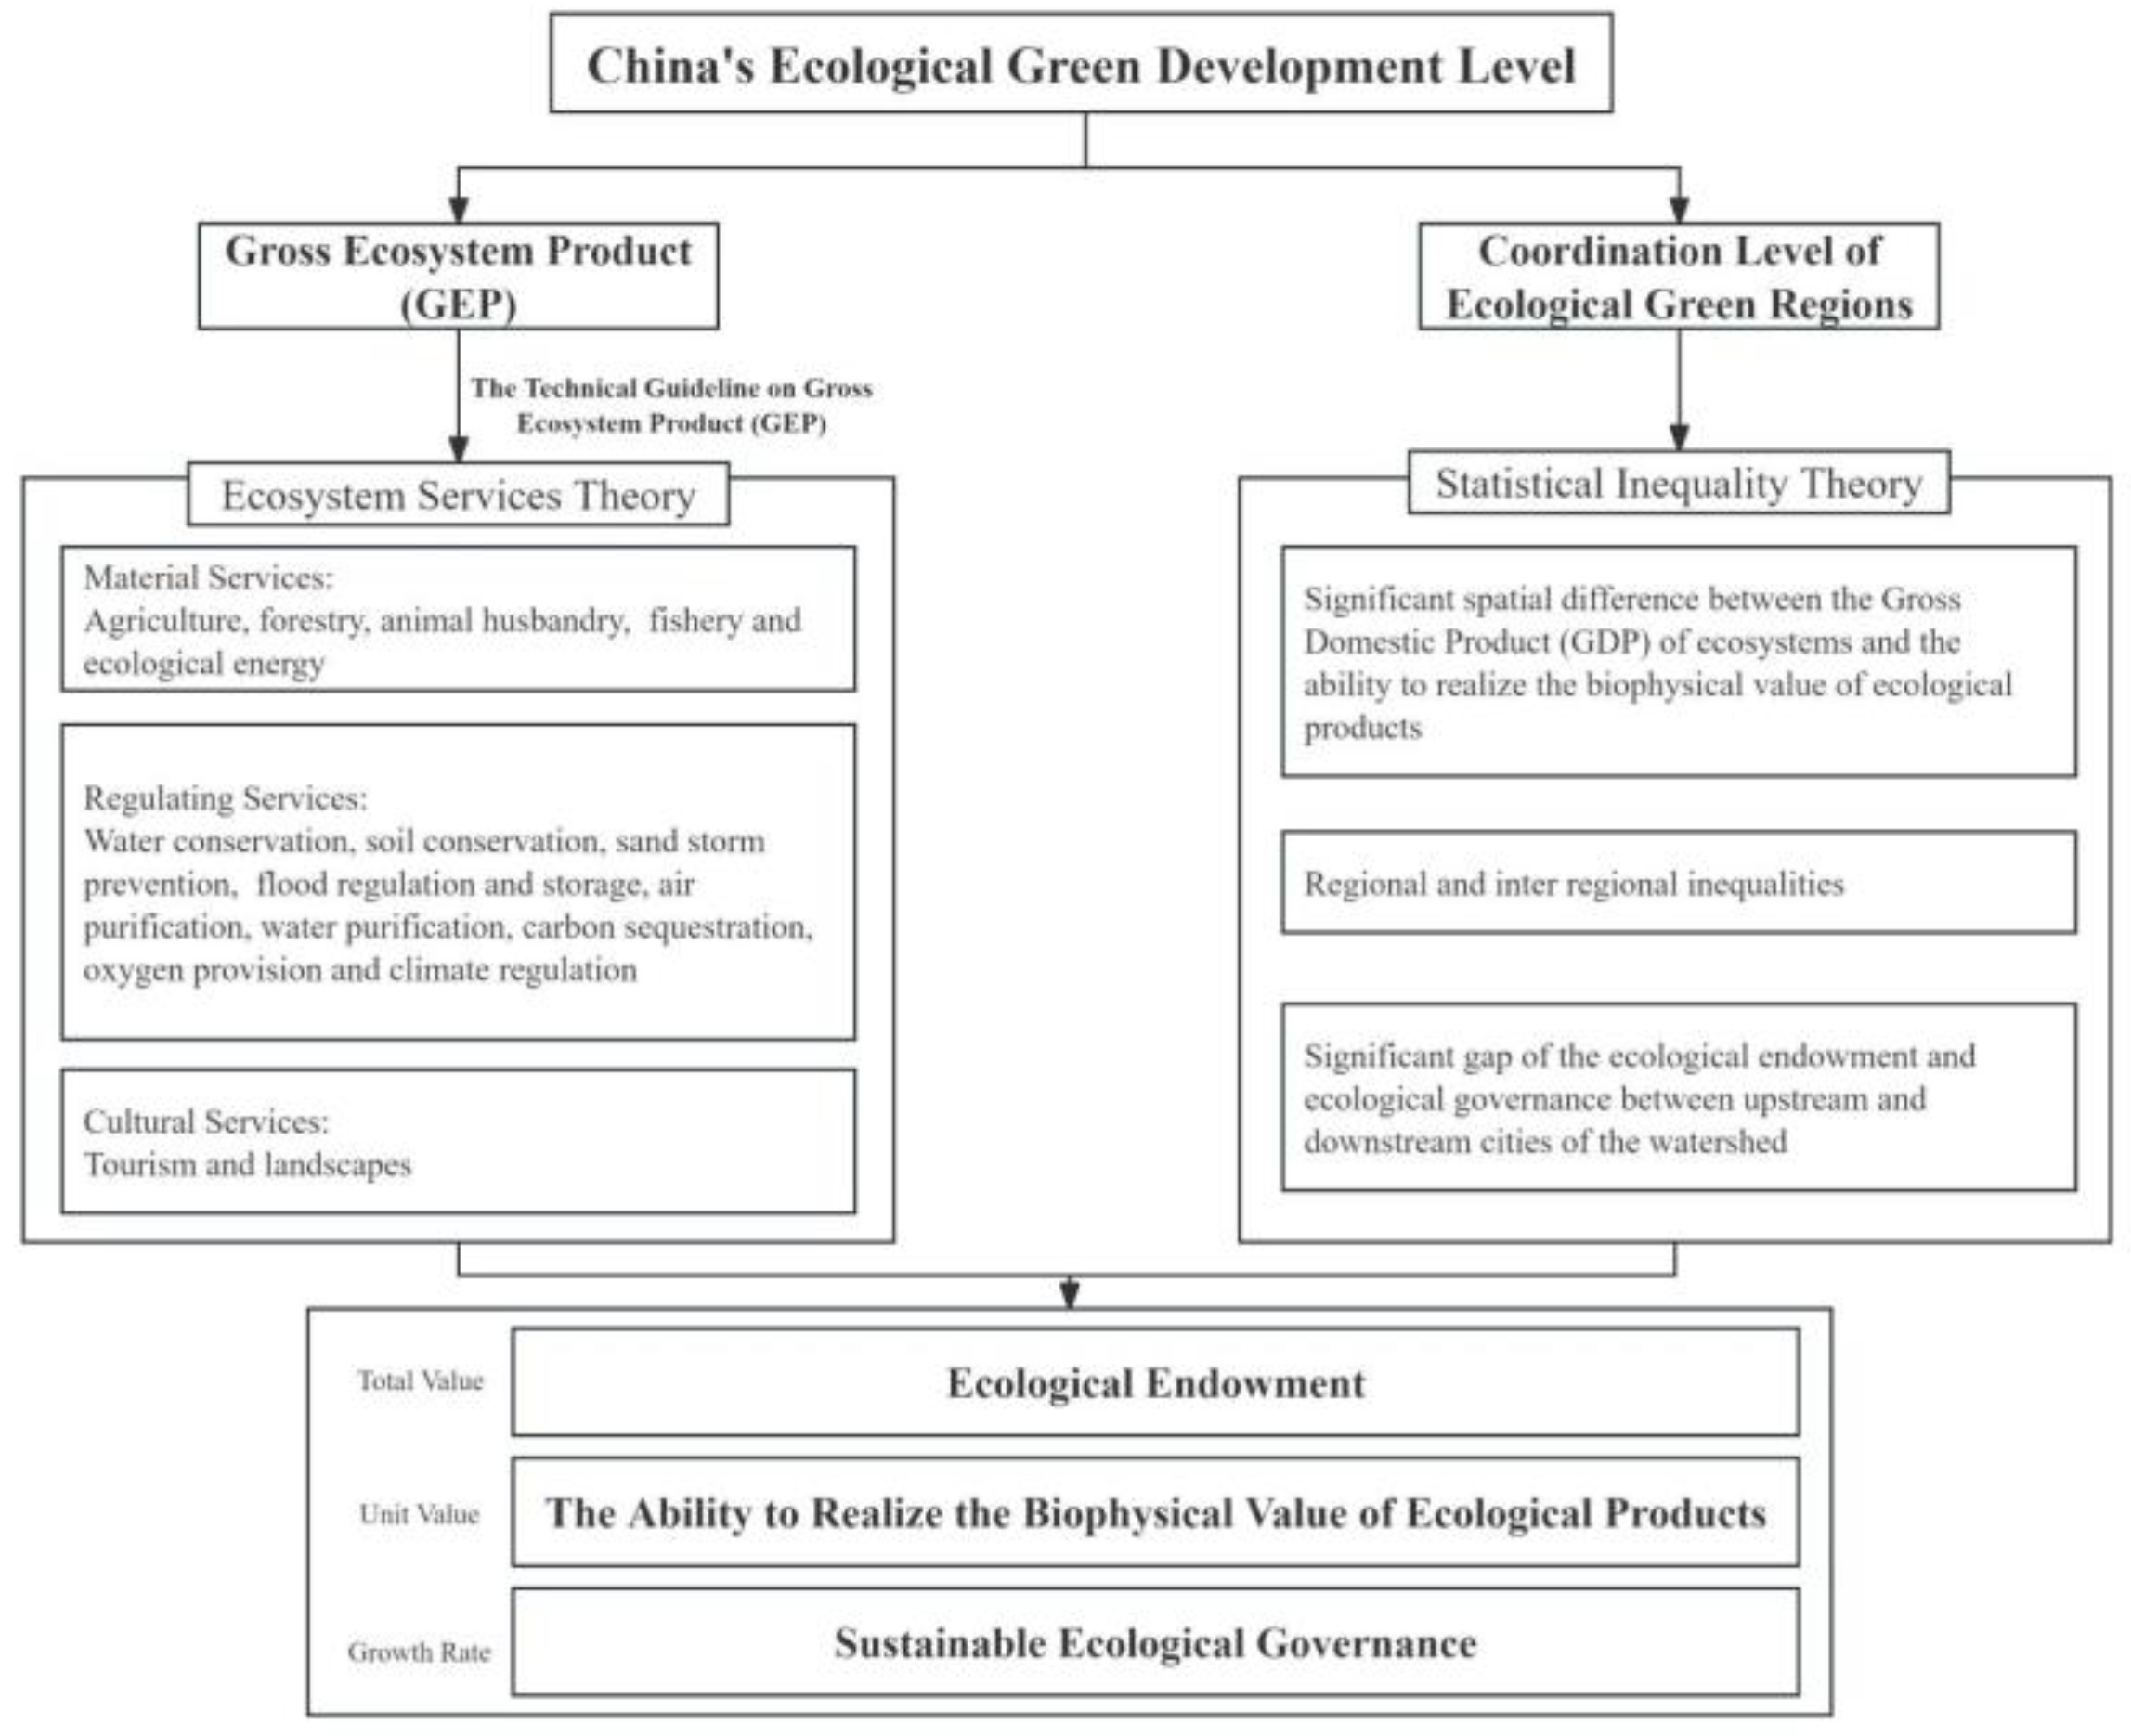
Figure 2.
Trend of GEP and its Subordinate Indicators in National Level (The units of all monetary value are in "trillion yuan").
Figure 2.
Trend of GEP and its Subordinate Indicators in National Level (The units of all monetary value are in "trillion yuan").
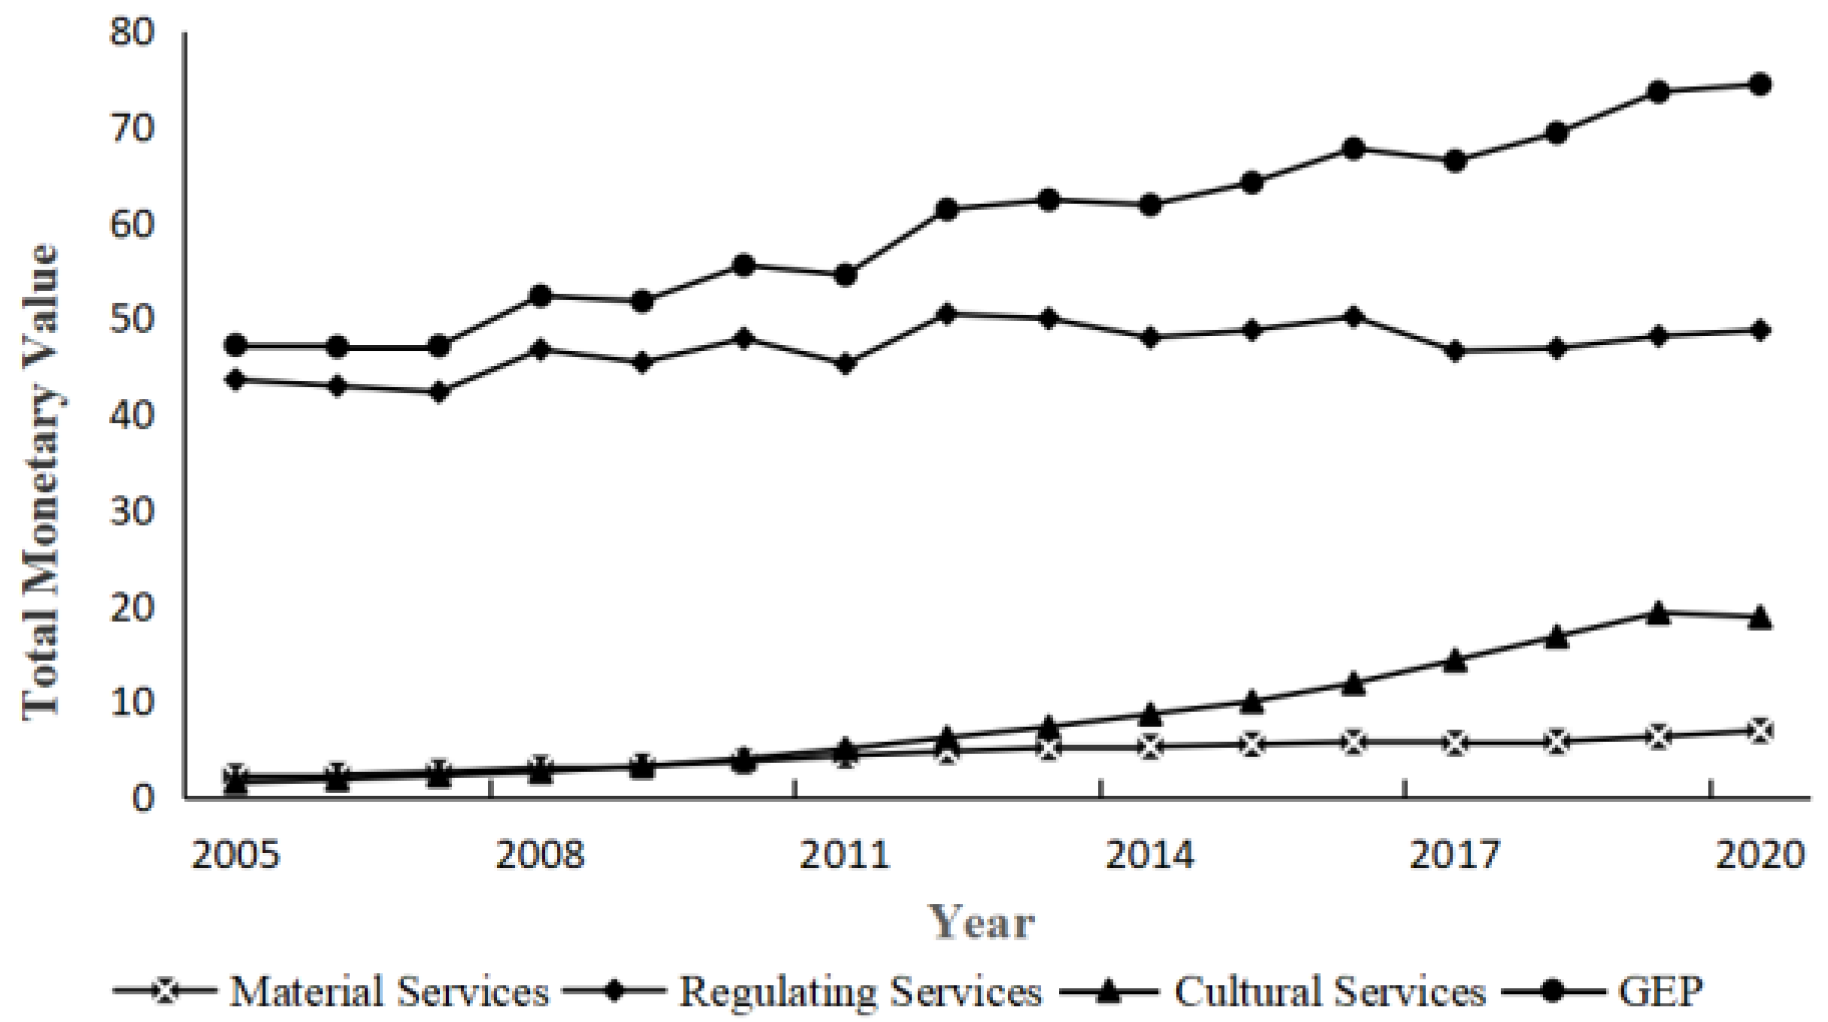
Figure 3.
Trend of Subordinate Indicators in Regulation Services in China ( The units of all monetary value are in "trillion yuan").
Figure 3.
Trend of Subordinate Indicators in Regulation Services in China ( The units of all monetary value are in "trillion yuan").
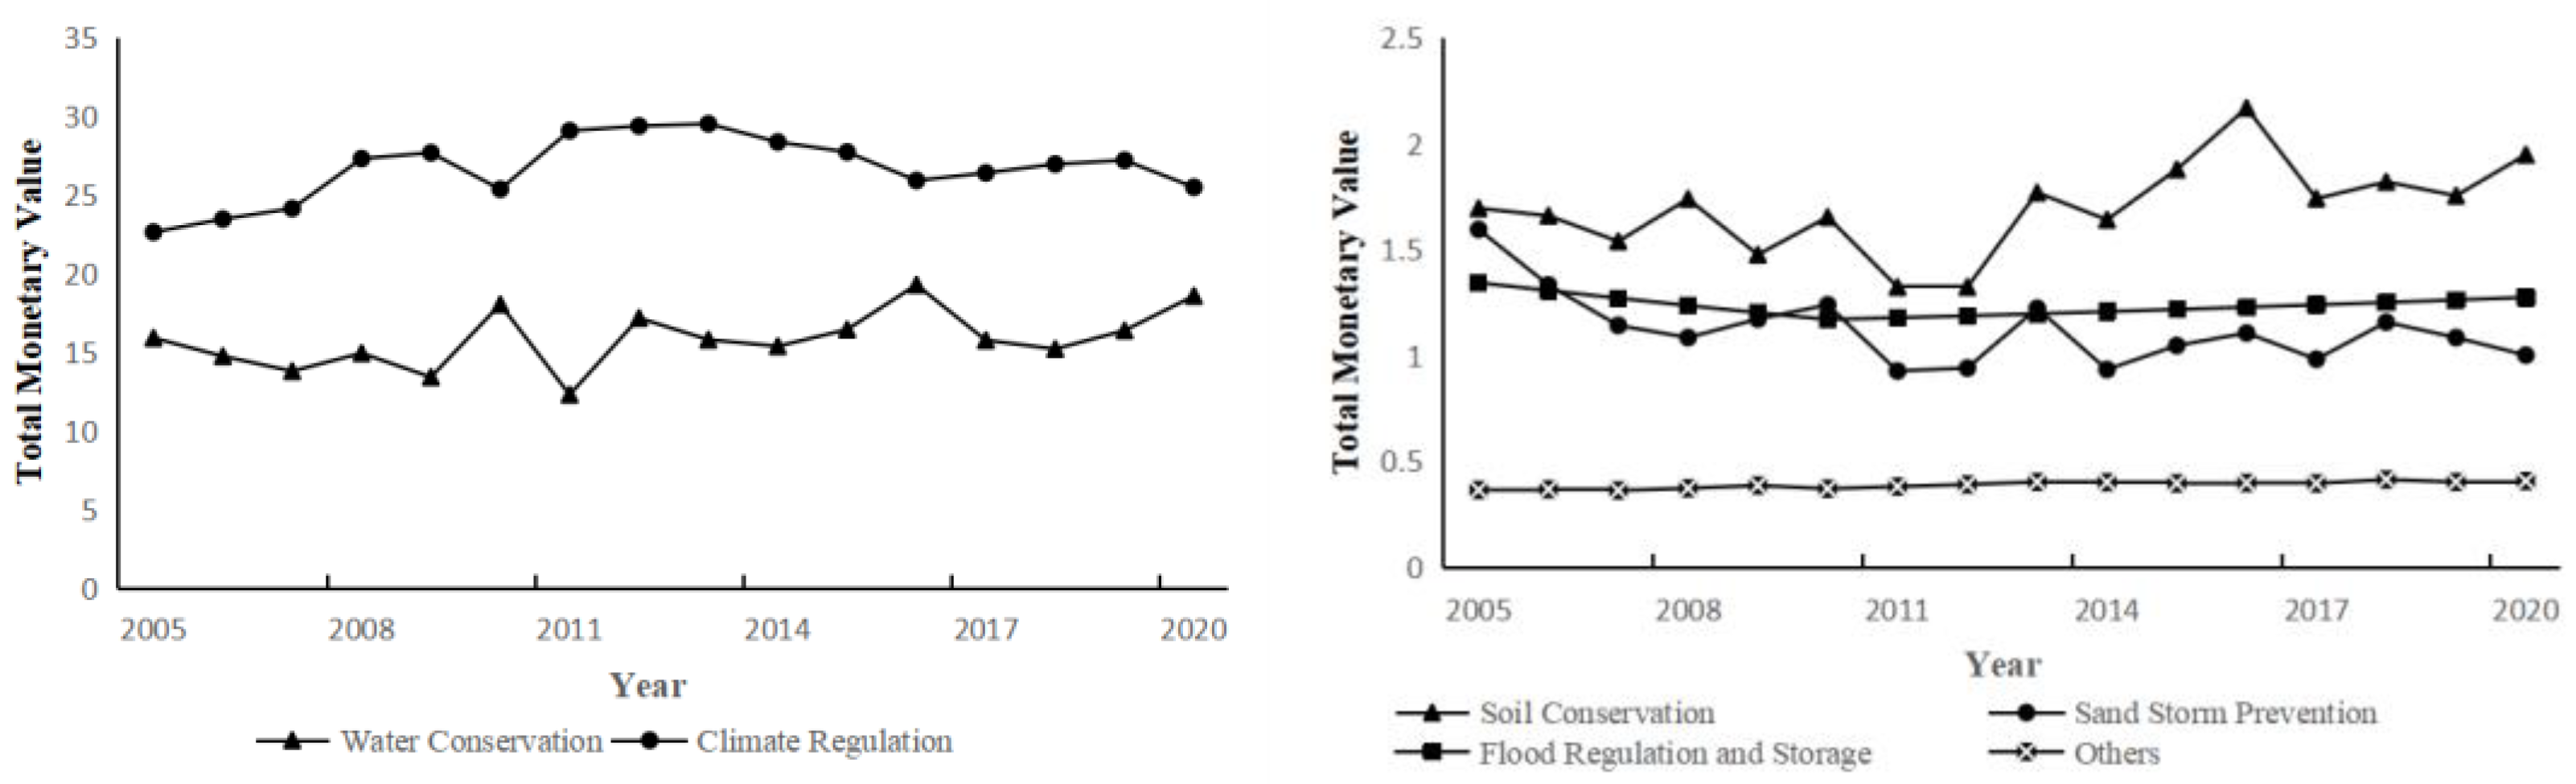
Figure 4.
Trend of GEP in the Western, Central and Eastern Region in City Level (The monetary value is the average GEP of the cities within this region. The units of GEP are in "Hundred million yuan" and the units of GEP per unit area are in "yuan per square meter".).
Figure 4.
Trend of GEP in the Western, Central and Eastern Region in City Level (The monetary value is the average GEP of the cities within this region. The units of GEP are in "Hundred million yuan" and the units of GEP per unit area are in "yuan per square meter".).
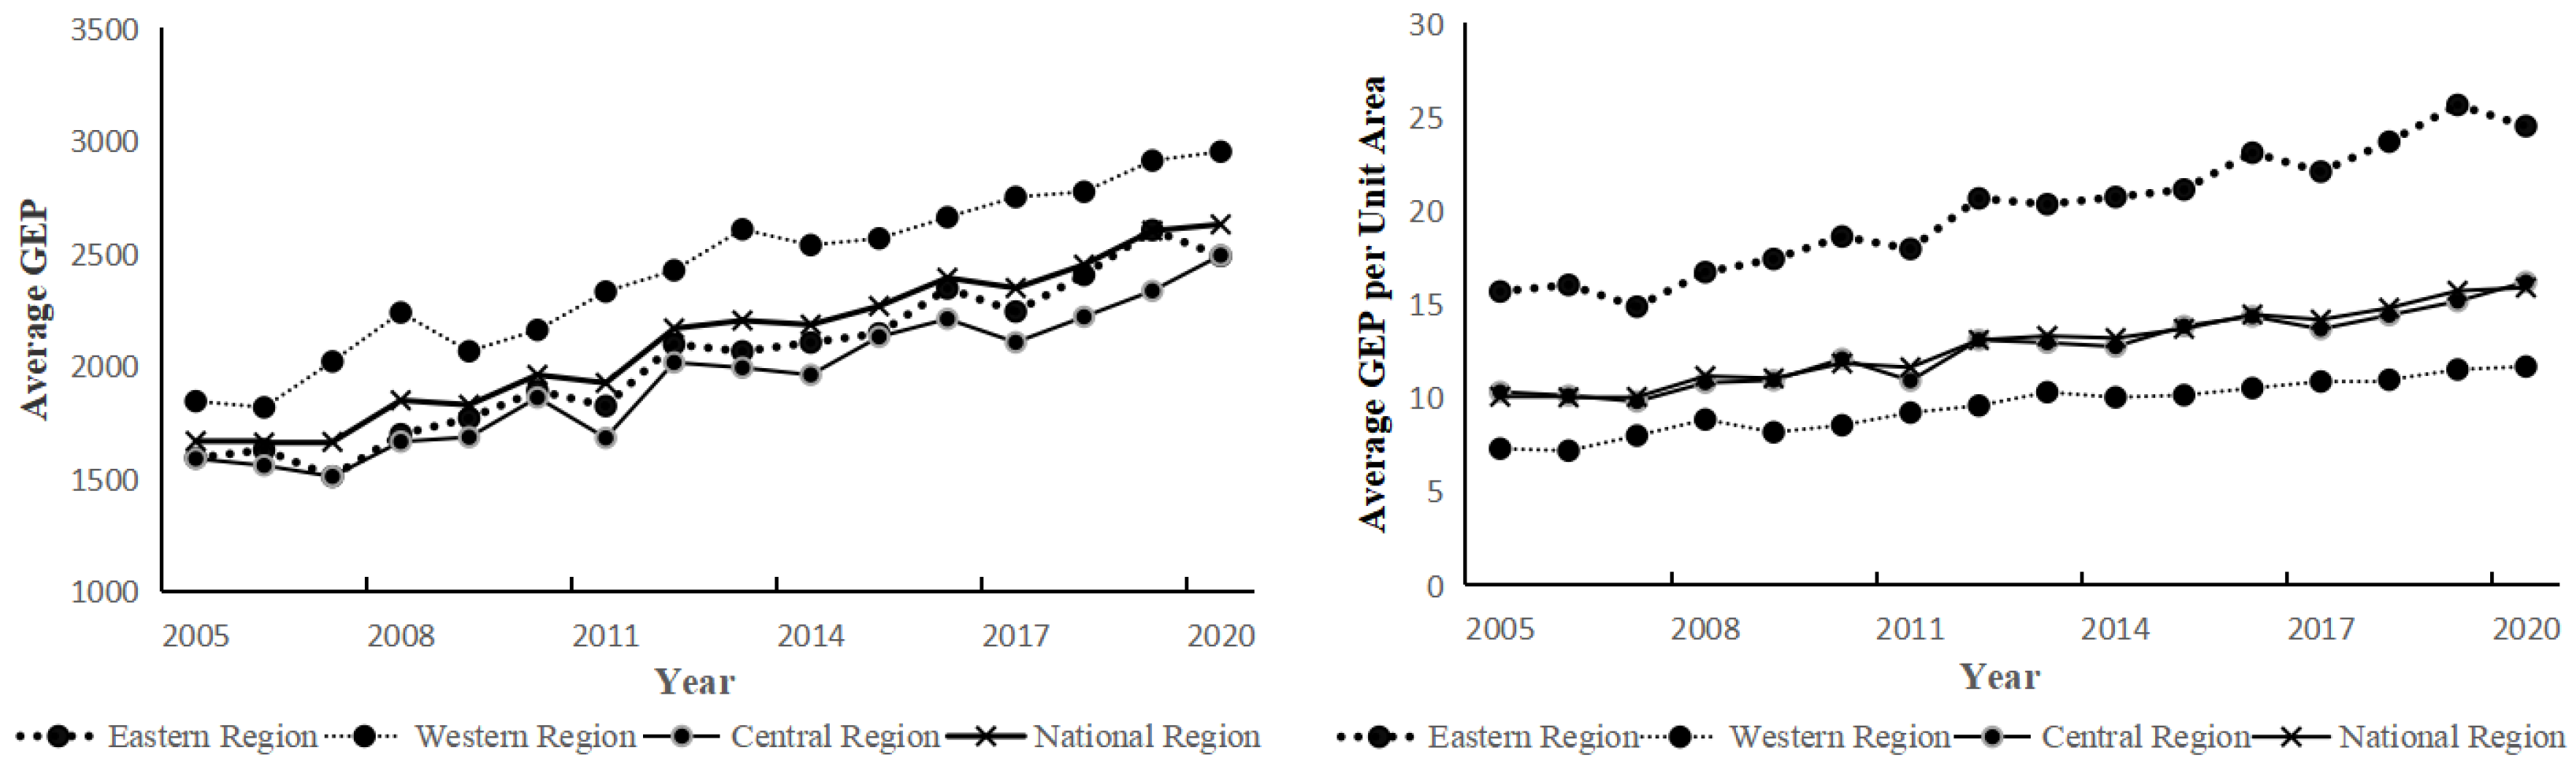
Figure 5.
Trend of Subordinate Indicators of GEP in the Western, Central and Eastern Region (Those monetary value is the average level of the cities within this region. The units of Material Product Supply, Regulation Services and Cultural Services are in "Hundred million yuan" and the units of monetary value of Regulation Services per unit area are in "yuan per square meter".)
Figure 5.
Trend of Subordinate Indicators of GEP in the Western, Central and Eastern Region (Those monetary value is the average level of the cities within this region. The units of Material Product Supply, Regulation Services and Cultural Services are in "Hundred million yuan" and the units of monetary value of Regulation Services per unit area are in "yuan per square meter".)
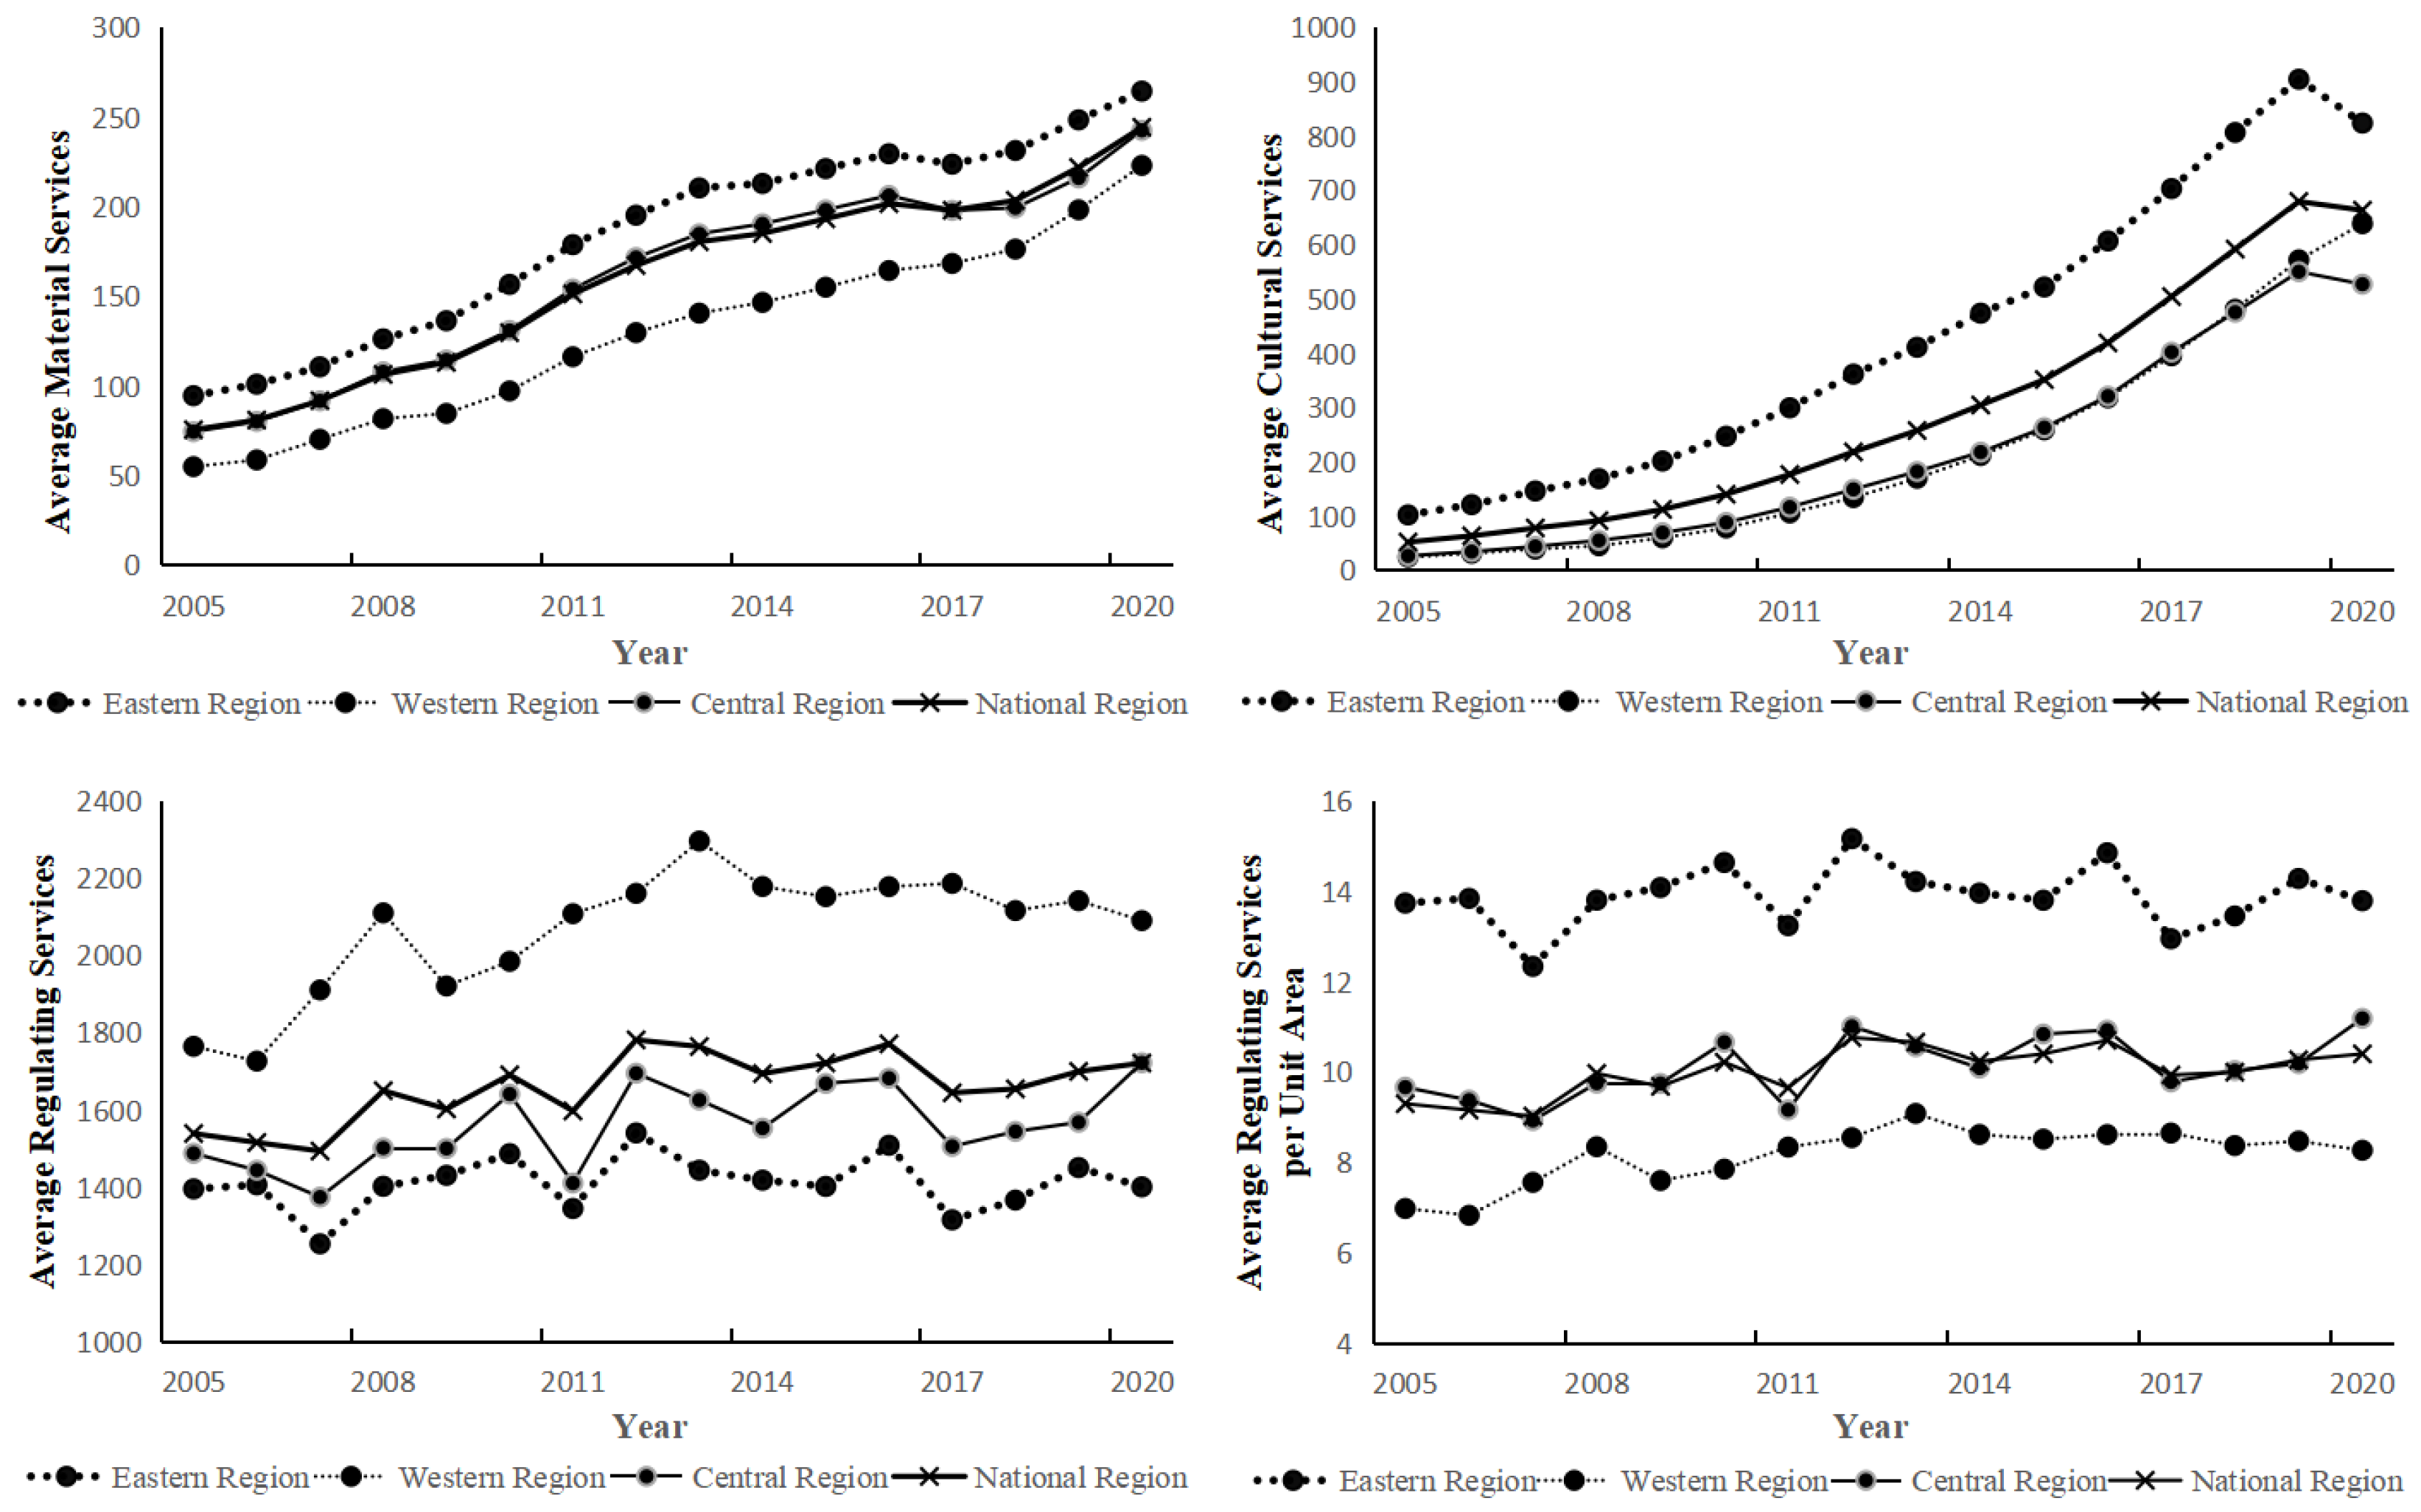
Figure 6.
Between-Group Gini Coefficientt between the Western, Central and Eastern Region.
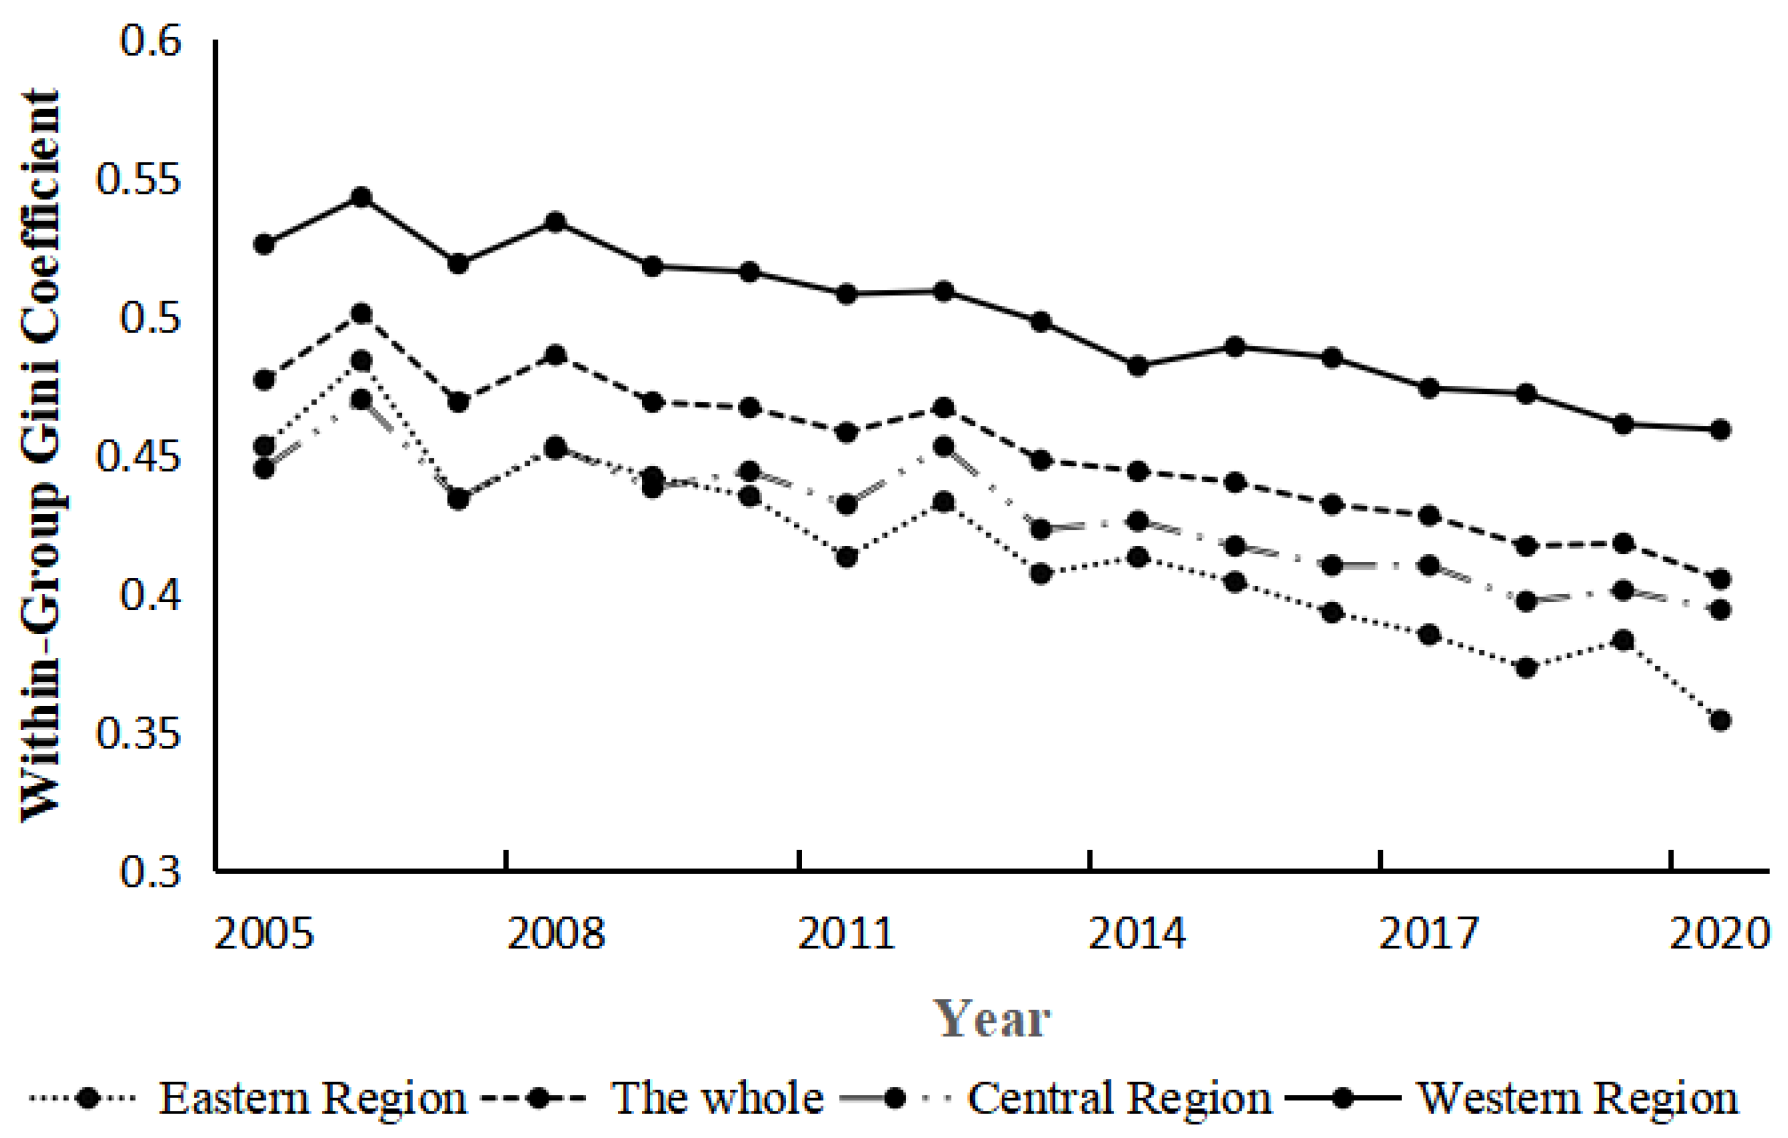
Figure 7.
Between-Group Gini Coefficientt between the Western, Central and Eastern Region.
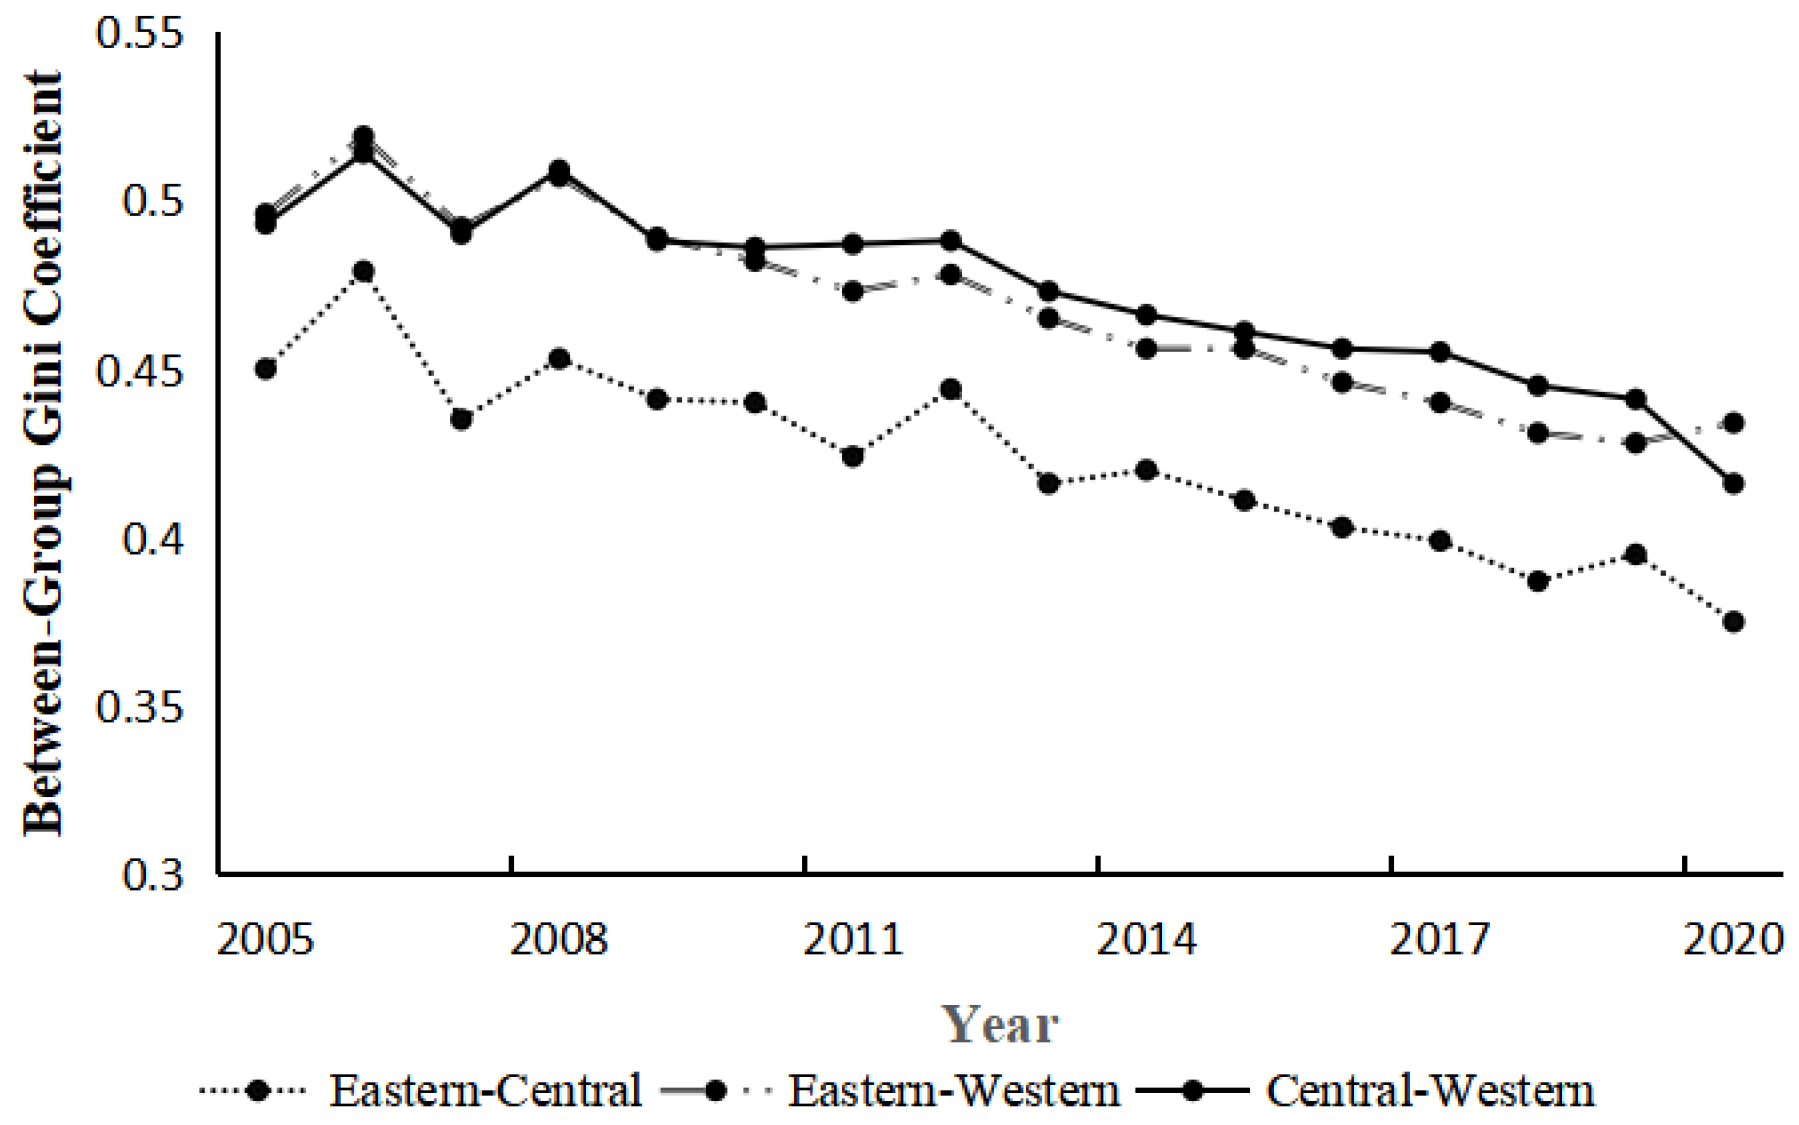
Figure 8.
Kernel Density Estimation of GEP and its Subordinate Indicators in National Level.
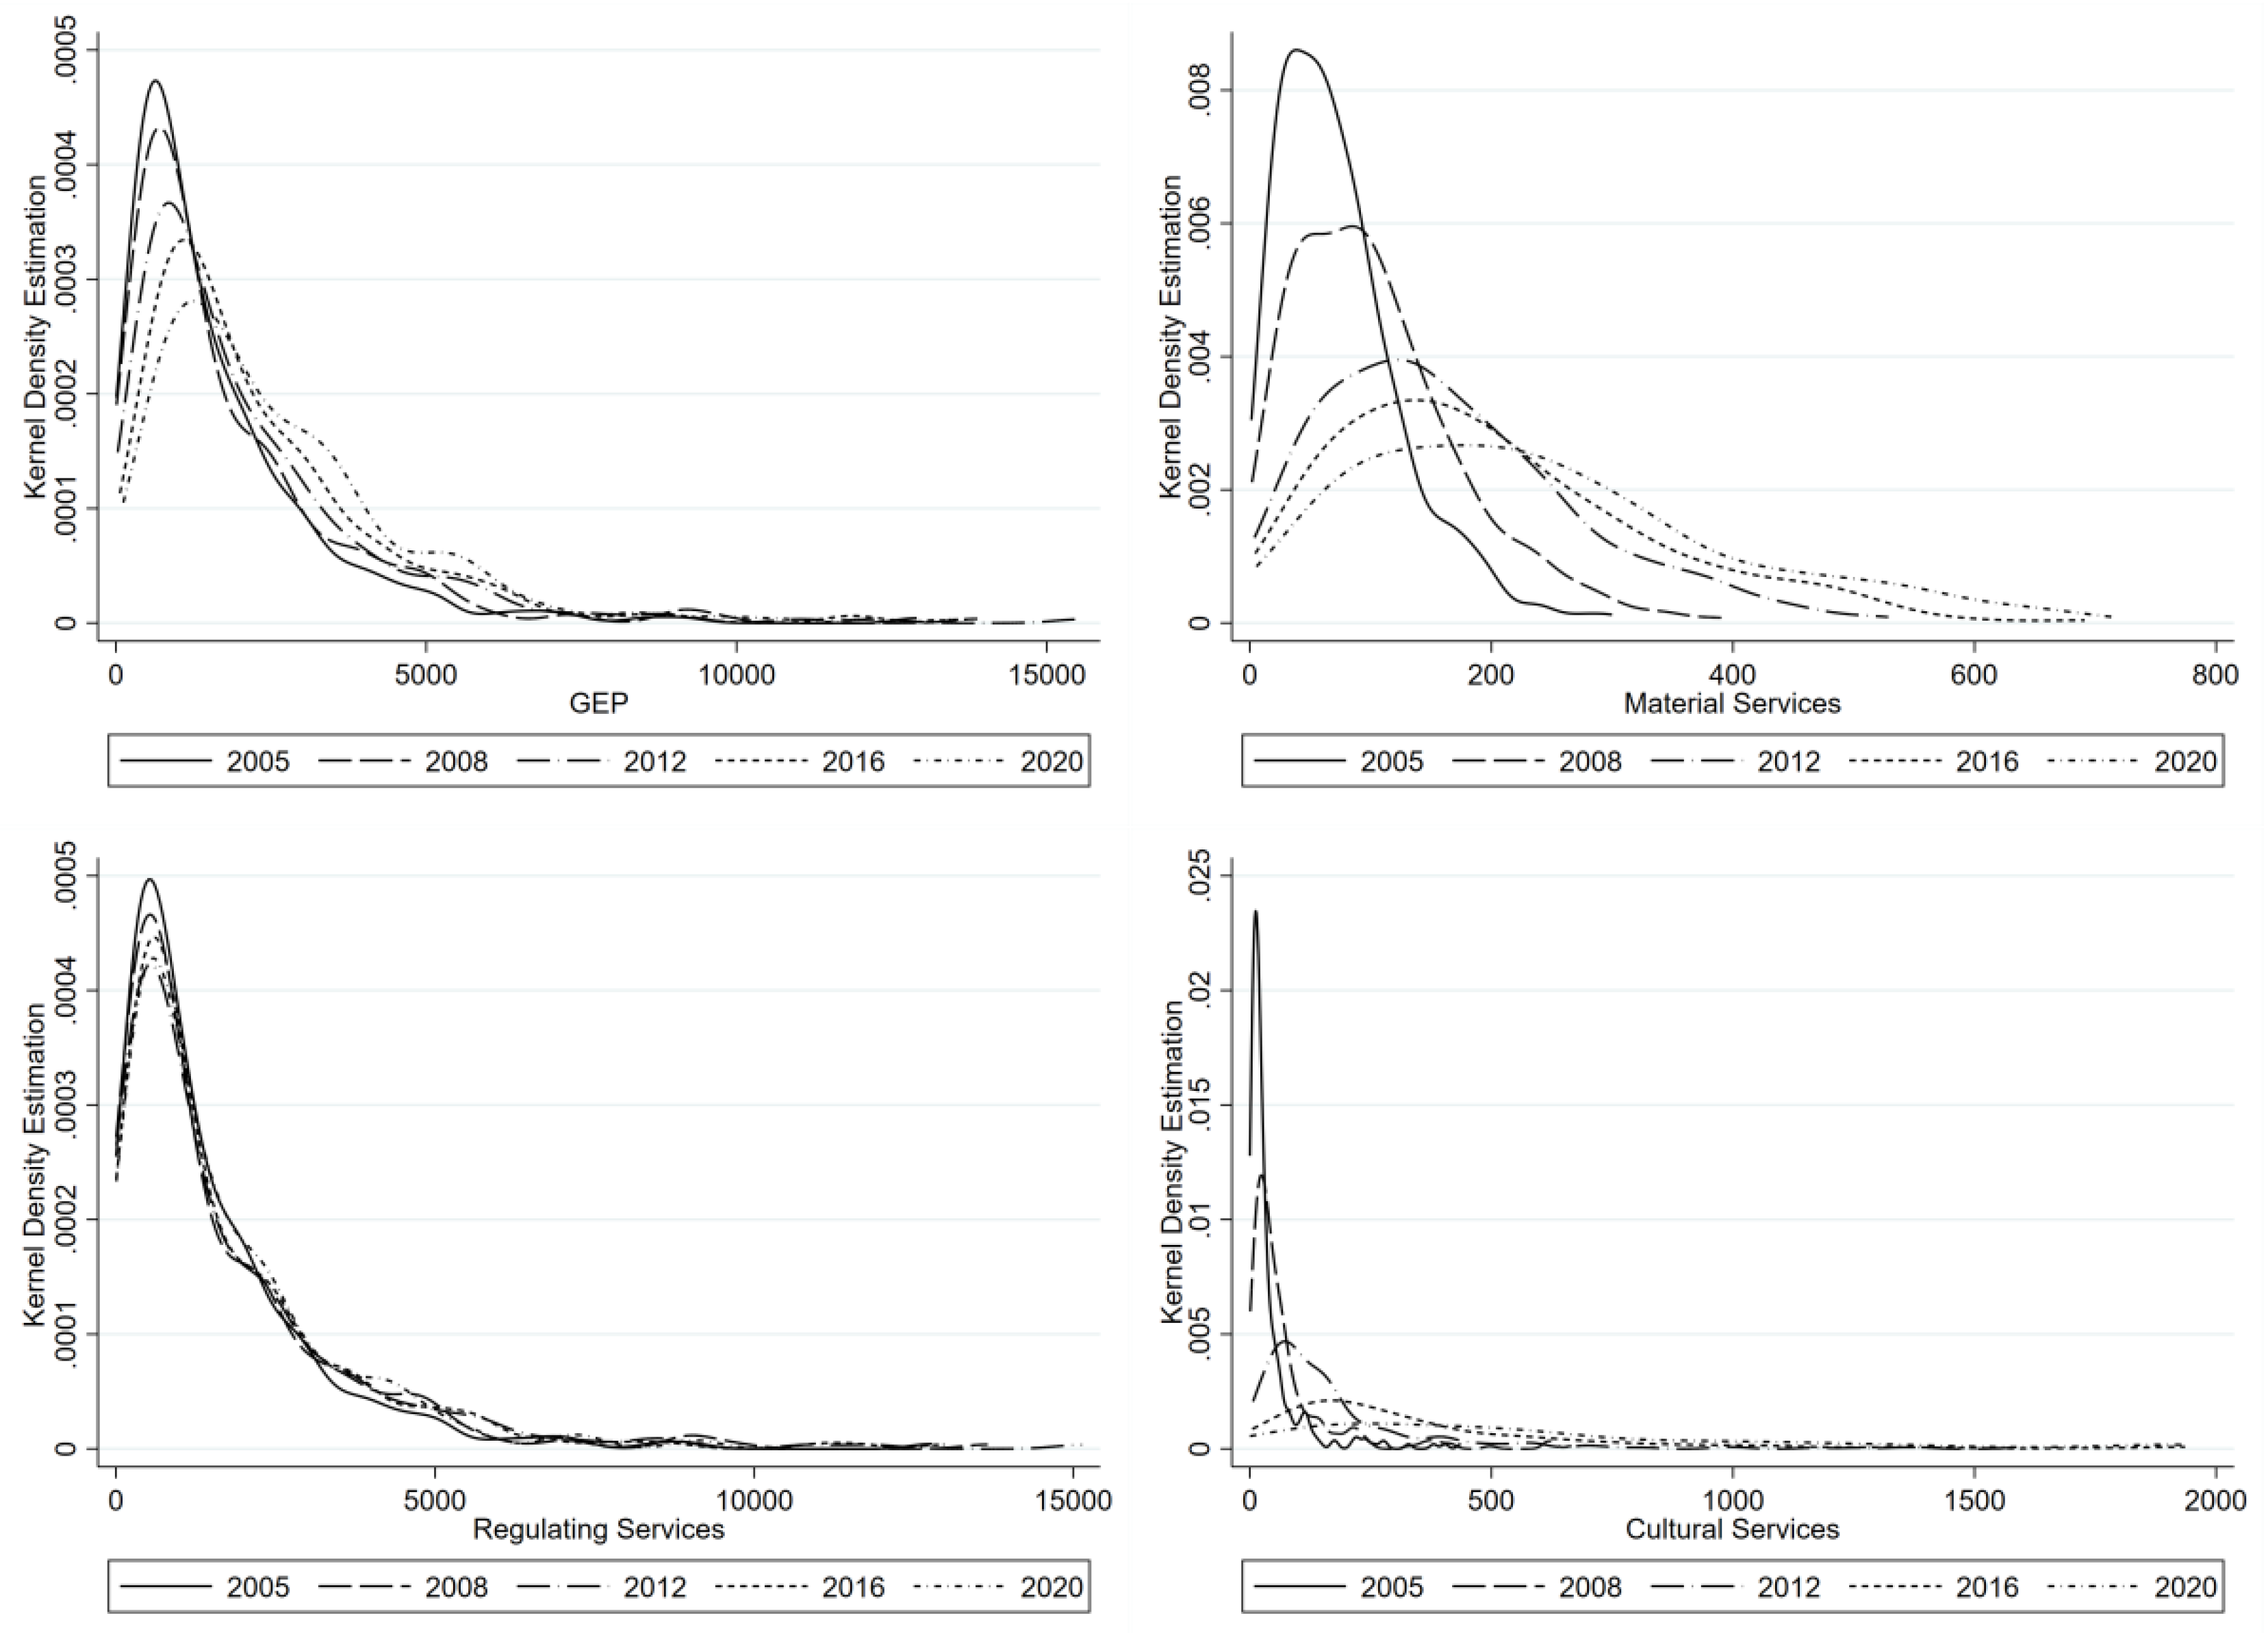
Figure 9.
Scatter plot of Moran’s I.
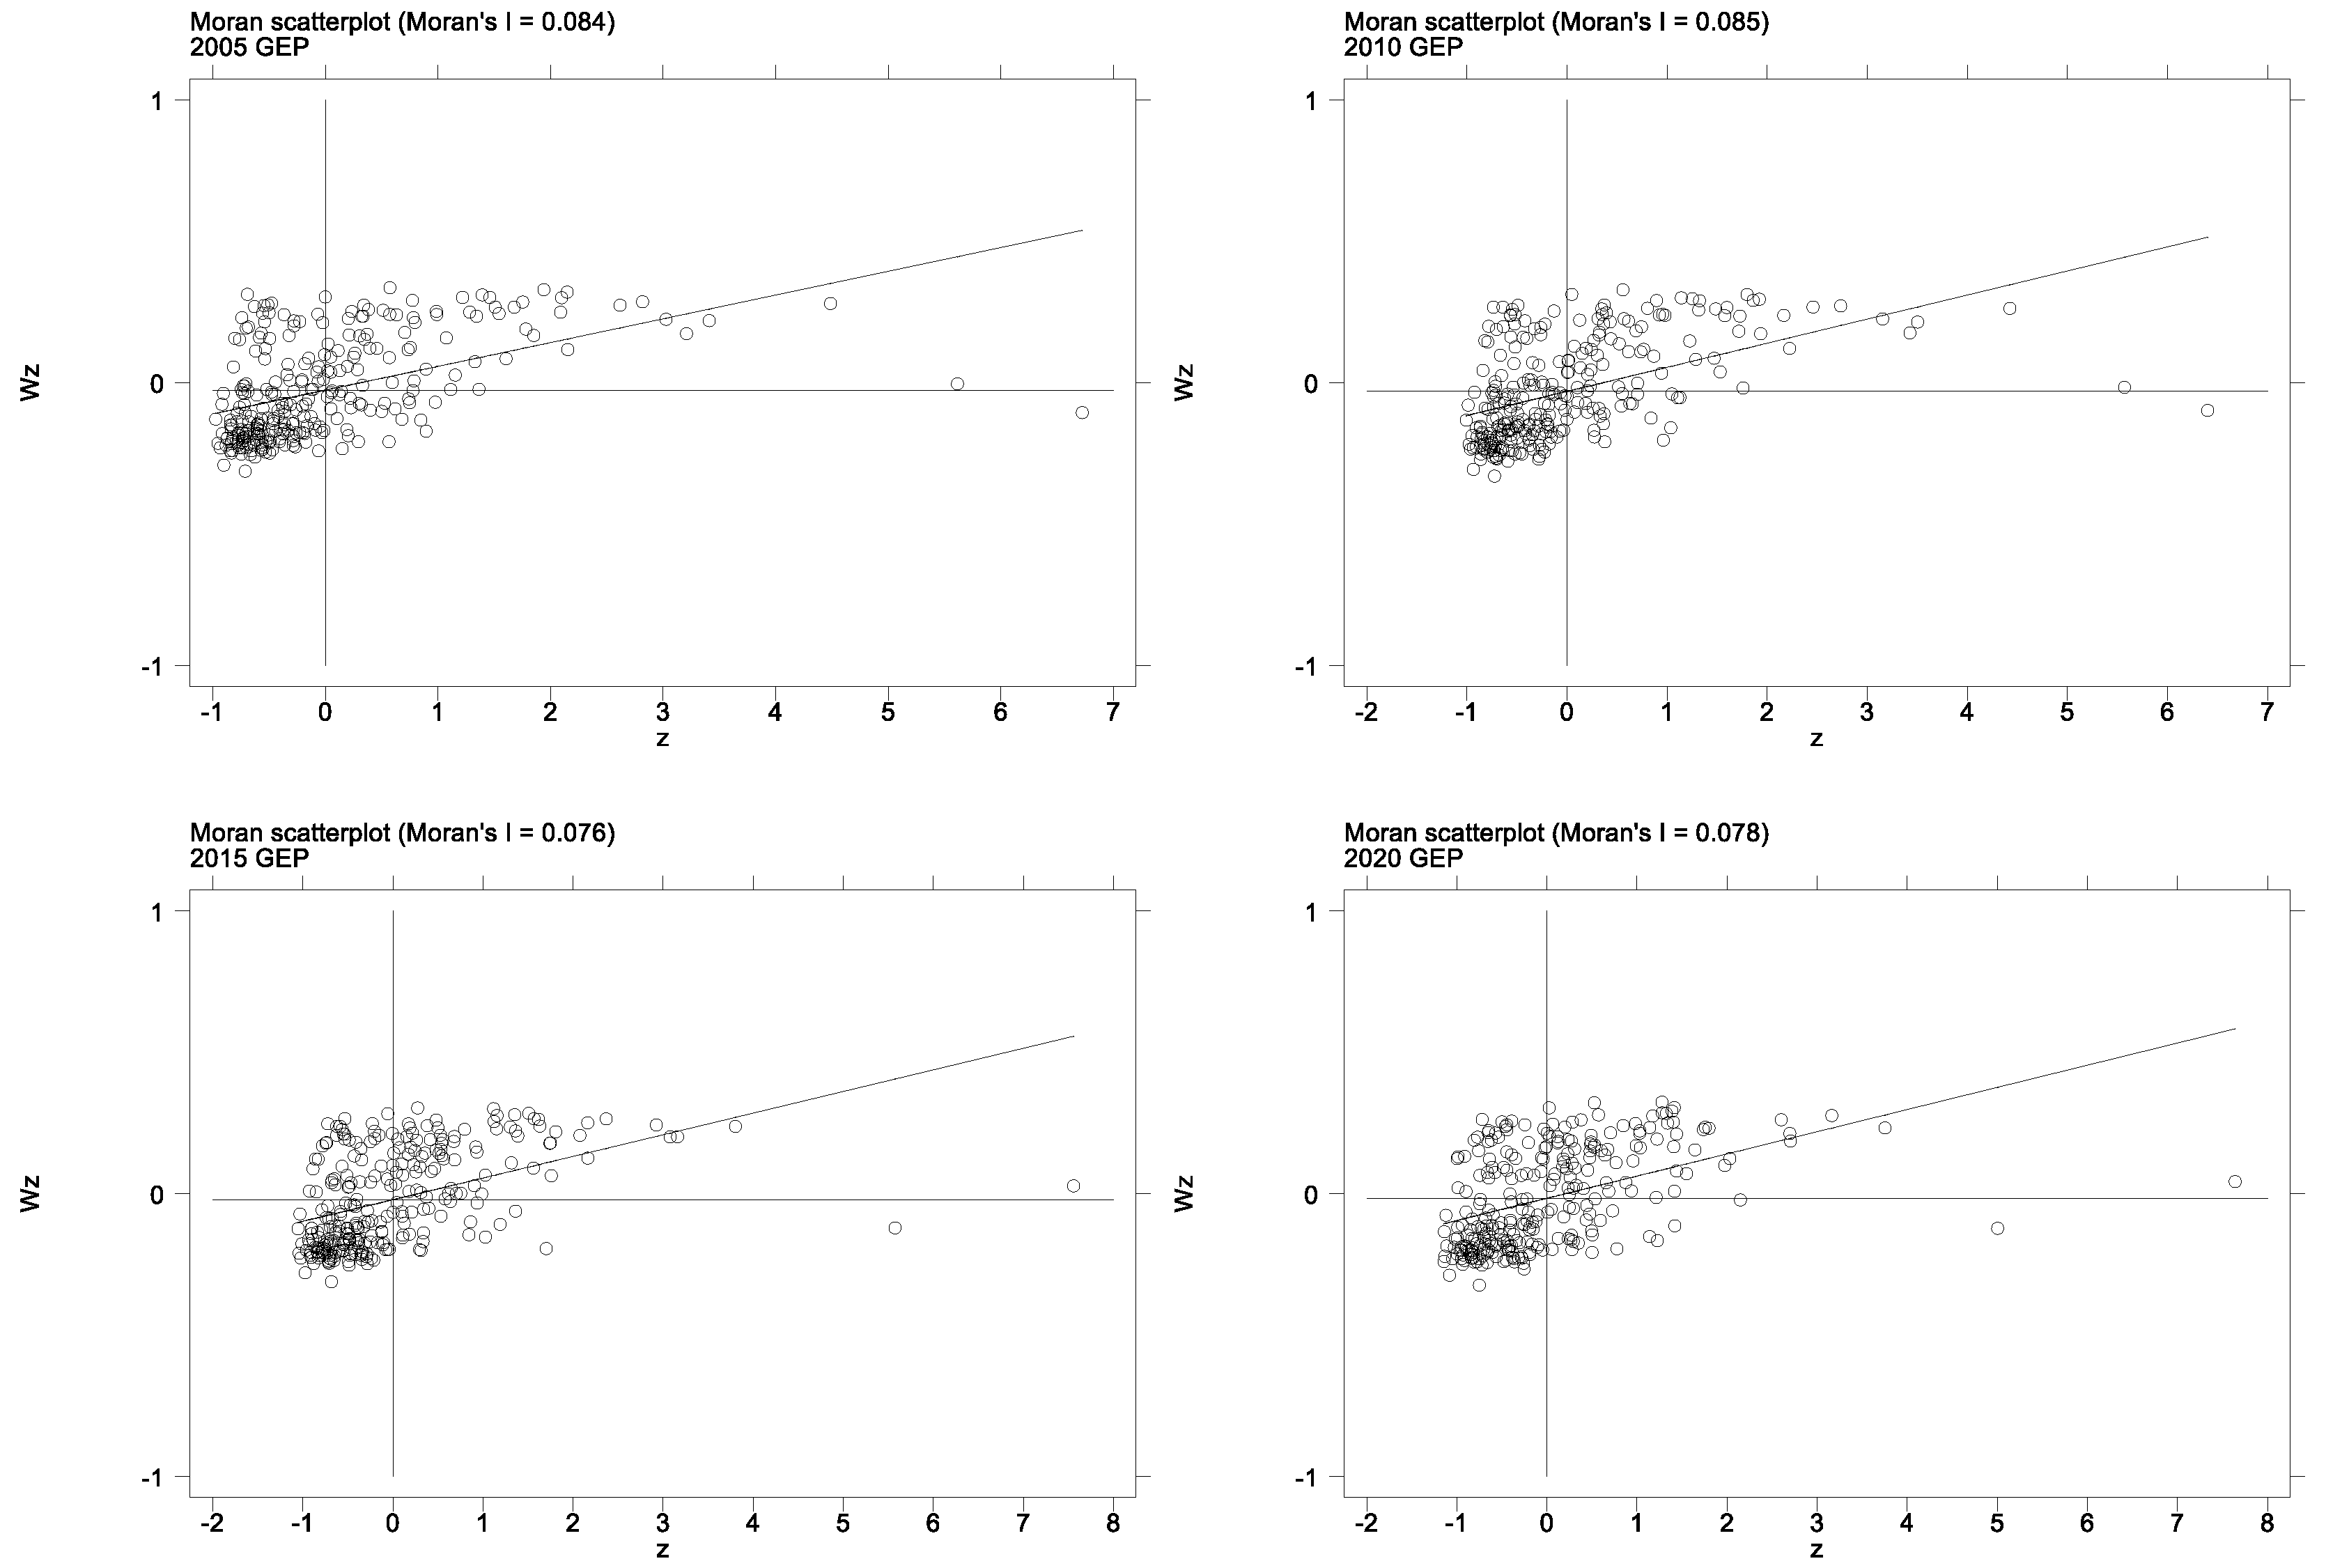
Table 1.
The Total Value of Indicators (trillion yuan).
| Year | GEP | GDP | Material Product Supply | Regulation Services | Cultural Services |
|---|---|---|---|---|---|
| 2005 | 47.17 | 18.60 | 2.14 | 43.55 | 1.48 |
| 2008 | 52.31 | 32.12 | 3.01 | 46.70 | 2.60 |
| 2011 | 54.49 | 48.34 | 4.28 | 45.21 | 5.00 |
| 2014 | 61.81 | 64.44 | 5.24 | 47.95 | 8.62 |
| 2015 | 64.14 | 68.56 | 5.47 | 48.72 | 9.95 |
| 2017 | 66.41 | 83.09 | 5.60 | 46.54 | 14.27 |
| 2020 | 74.40 | 100.55 | 6.91 | 48.72 | 18.77 |
Note: The units of all index are "trillion yuan". The Gross Ecological Product (GEP), the monetary value of material products provided, the monetary value of Regulation Services, and the monetary value of Cultural Services are calculated by the author, while the Gross Domestic Product (GDP) data is sourced from the National Bureau of Statistics.
Table 2.
Monetary Value of Regulation Services for Ecosystems (trillion yuan).
| Year | Forest ecosystem | Wetland ecosystem | Grassland ecosystem | Farmland ecosystem | |||||
| Monetary Value | Area | Monetary Value | Area | Monetary Value | Area | Monetary Value | Area | ||
| 2005 | 34.53 | 229.95 | 4.44 | 13.74 | 3.91 | 191.52 | 0.61 | 287.18 | |
| 2008 | 38.08 | 231.71 | 3.87 | 14.03 | 4.07 | 189.34 | 0.60 | 287.31 | |
| 2011 | 36.76 | 232.55 | 3.58 | 14.25 | 4.34 | 188.73 | 0.46 | 286.23 | |
| 2014 | 39.39 | 231.67 | 3.90 | 14.44 | 4.03 | 190.19 | 0.56 | 283.84 | |
| 2017 | 39.11 | 233.60 | 4.71 | 14.41 | 4.10 | 188.44 | 0.70 | 281.93 | |
| 2020 | 34.53 | 229.95 | 4.44 | 13.74 | 3.91 | 191.52 | 0.61 | 287.18 | |
Note: The monetary value of each ecosystem is measured in "trillion yuan," and the area is measured in "ten thousand square kilometers." The values are calculated by the author, and the areas of each ecosystem are derived from land use data. This table only lists the ecosystem categories most relevant to ecosystem regulation and service functions, with forest ecosystems including both woodland and shrubland.
Table 3.
Monetary Value of Indicators in Each Province (hundred billion yuan).
| Province | GEP | Regulation Services | Value per Area |
Province | GEP | Regulation Services | Value per Area |
| Beijing | 4.76 | 1.31 | 7.57 | Hubei | 25.42 | 20.01 | 13.97 |
| Tianjin | 0.41 | 0.23 | 3.04 | Hunan | 41.17 | 35.18 | 19.60 |
| Hebei | 15.50 | 9.47 | 4.94 | Guangdong | 28.37 | 25.67 | 3.44 |
| Shanxi | 0.58 | 0.45 | 1.64 | Guangxi | 58.63 | 53.21 | 25.39 |
| Inner Mongolia | 55.57 | 46.35 | 29.64 | Hainan | 0.73 | 0.53 | 27.82 |
| Liaoning | 15.78 | 10.45 | 6.68 | Chongqing | 1.70 | 1.36 | 2.57 |
| Jilin | 11.28 | 8.42 | 5.09 | Sichuan | 29.10 | 21.03 | 11.69 |
| Heilongjiang | 25.44 | 22.04 | 4.91 | Guizhou | 8.85 | 6.45 | 12.21 |
| Shanghai | 3.26 | 0.35 | 7.01 | Yunnan | 31.35 | 28.68 | 16.45 |
| Jiangsu | 19.12 | 9.04 | 9.23 | Tibet | 11.51 | 8.19 | 5.12 |
| Zhejiang | 28.62 | 20.68 | 21.98 | Shanxi | 20.69 | 17.21 | 8.46 |
| Anhui | 20.92 | 15.64 | 12.00 | Gansu | 10.16 | 8.79 | 2.24 |
| Fujian | 34.77 | 30.45 | 27.82 | Qinghai | 2.29 | 0.25 | 2.45 |
| Jiangxi | 40.61 | 35.82 | 23.47 | Ningxia | 0.66 | 0.34 | 1.38 |
| Shandong | 18.10 | 9.33 | 6.04 | Xinjiang | 14.91 | 12.05 | 15.64 |
| Henan | 17.45 | 10.48 | 6.57 |
Note: The units of all index are "hundred billion yuan". The monetary value of Regulation Services per unit area are "yuan per square meter". Provinces are sorted by province code.
Table 4.
The Results of Global Moran's I.
| Year | Proximity Weight Matrix | Distance Weight Matrix | ||
| I | Z | I | Z | |
| 2005 | 0.425*** | 10.646 | 0.084*** | 0.005 |
| 2006 | 0.481*** | 11.984 | 0.102*** | 0.005 |
| 2007 | 0.357*** | 9.099 | 0.066*** | 0.005 |
| 2008 | 0.441*** | 11.056 | 0.089*** | 0.005 |
| 2009 | 0.449*** | 11.166 | 0.092*** | 0.005 |
| 2010 | 0.431*** | 10.788 | 0.085*** | 0.005 |
| 2011 | 0.374*** | 9.48 | 0.067*** | 0.005 |
| 2012 | 0.429*** | 10.735 | 0.085*** | 0.005 |
| 2013 | 0.395*** | 9.956 | 0.075*** | 0.005 |
| 2014 | 0.379*** | 9.572 | 0.077*** | 0.005 |
| 2015 | 0.382*** | 9.642 | 0.076*** | 0.005 |
| 2016 | 0.391*** | 9.806 | 0.083*** | 0.005 |
| 2017 | 0.367*** | 9.254 | 0.078*** | 0.005 |
| 2018 | 0.353*** | 8.892 | 0.071*** | 0.005 |
| 2019 | 0.375*** | 9.408 | 0.079*** | 0.005 |
| 2020 | 0.349*** | 8.809 | 0.078*** | 0.005 |
Note:The I value, also known as Global Moran's I value, is an indicator that measures the spatial autocorrelation of the entire region, ∗∗∗ significant at the 1% level; ∗∗ significant at the 5% level; ∗ significant at the 10% level. The Z-value is a standard score used to measure the difference between observed values and expected values (i.e. values under a random distribution). It reflects the degree to which Global Moran's I deviates from the null hypothesis (i.e. the data is randomly distributed).
Disclaimer/Publisher’s Note: The statements, opinions and data contained in all publications are solely those of the individual author(s) and contributor(s) and not of MDPI and/or the editor(s). MDPI and/or the editor(s) disclaim responsibility for any injury to people or property resulting from any ideas, methods, instructions or products referred to in the content. |
© 2025 by the authors. Licensee MDPI, Basel, Switzerland. This article is an open access article distributed under the terms and conditions of the Creative Commons Attribution (CC BY) license (http://creativecommons.org/licenses/by/4.0/).
Copyright: This open access article is published under a Creative Commons CC BY 4.0 license, which permit the free download, distribution, and reuse, provided that the author and preprint are cited in any reuse.