Submitted:
02 April 2025
Posted:
03 April 2025
You are already at the latest version
Abstract
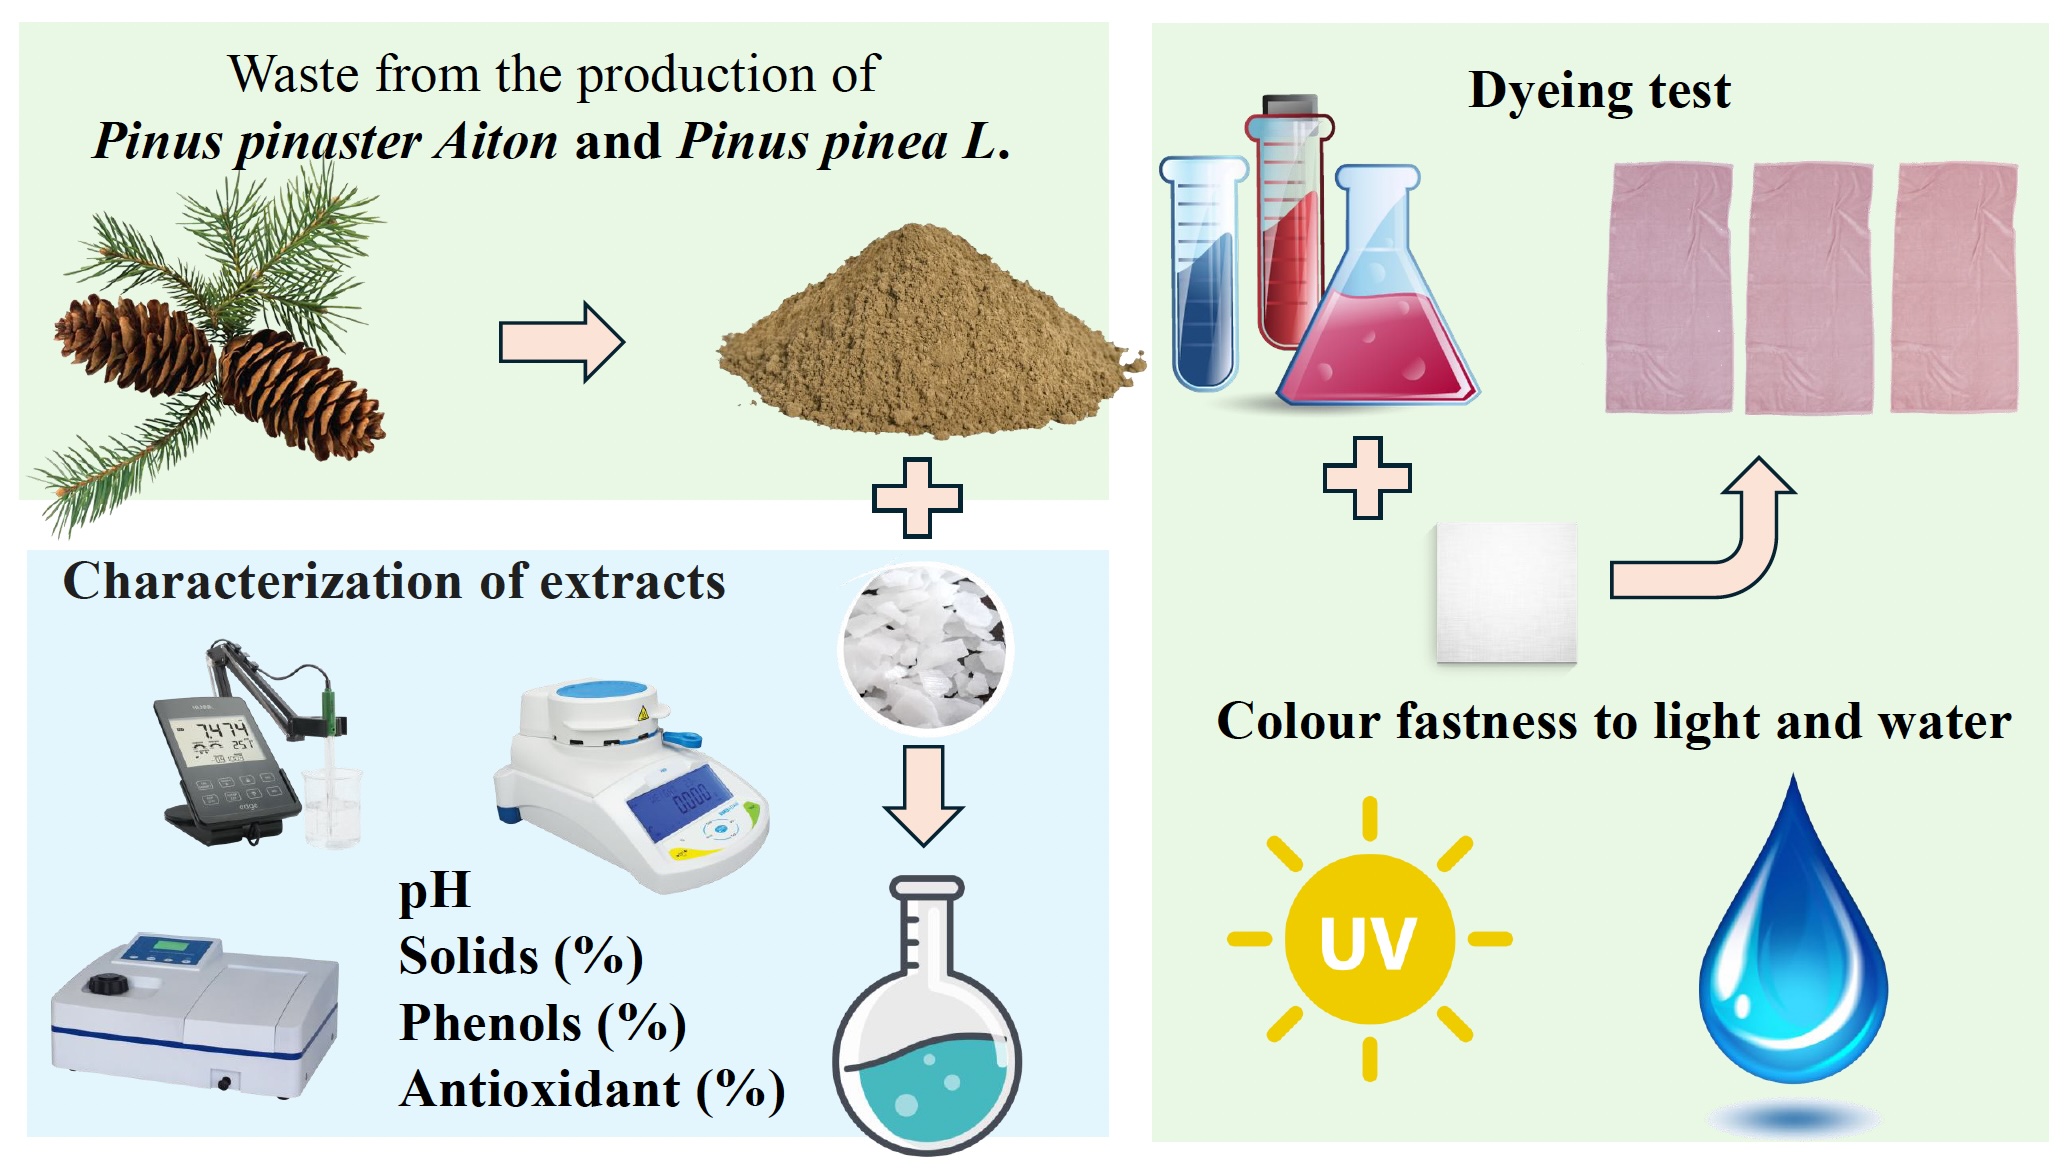
The pine cone is an important forest product for the Portuguese economy. However, it is associated with environmental impacts, such as the generation of waste and the increased risk of forest fires. The objective of this research is to valorise waste from the production of Pinus pinaster Aiton in the form of natural dyes. The pine cone extracts were characterised in different alkaline solutions (1%, 5% and 10% NaOH) in order to evaluate the dyeing process on cotton knitwear, using the CIELab coordinates. The dyed samples were also subjected to light and water fastness tests. The extracts showed an increase in solids content with increasing alkalinity and a reduction in antioxidant content. The phenol content increased in the extract with 5% but decreased with the 10% concentration. All the dyes expressed a pink colour, but with different shades. About the L* coordinate (luminosity), the colours became lighter as the NaOH increased. n the a* coordinate, all the samples had a reddish colour and, in the b* coordinate, all the samples had a yellowish colour. About light and water fastness, all the samples lost colour, but in the water test it was not noticeable.
Keywords:
Forest waste
; Pine cone
; Natural dyes
; Valorisation
; Cotton dyeing
1. Introduction
The use of Pinus pinaster Aiton pine cones as a raw material for natural textile dyes is a sustainable and innovative alternative for forest management. This pine cone is common in several regions of Portugal, where pine forests cover approximately 1 million hectares, making it the second largest forest formation in the country. In 2015, Pinus pinaster Aiton occupied 713.300 hectares, equivalent to 22.1% of mainland Portugal's forest area. It is estimated that this area will increase to between 727.000 and 789.000 hectares by 2030 [1]. These species are of great economic and social importance to Portugal, as they are widely used by various sectors of industry. Among the main economic activities in the Portuguese forestry sector, pine cone production stands out. The pine cone production of Pinus pinaster averages 1188.2 kg/ha, with a total of 602.7 thousand tonnes per year [1]. Despite its economic importance, it also produces a significant amount of forestry waste. In terms of waste production, this species has an estimated annual production of around 543.867 tonnes [2]. These residues, when discarded in the forest, significantly increase the ignition potential of the forest floor. In studies, forest residues with pine cones added ignited 94% of the time, compared to only 17% without cones. The presence of cones results in higher flame heights and longer flaming durations, indicating greater fire intensity [3]. According to Borges et al. (2021) [4] pine cones are highly flammable and burn more quickly than the leaves of other species due to their lower moisture content, emphasising that this biomass when discarded contributes to the accumulation of combustible material in forest areas, increasing the risk of fires. Effective forest management, including the removal or valorisation of residual biomass such as pine cones, is essential for mitigating fire risks. In Portugal there is already a ‘BioValchar’ project exploring the possibility of converting this biomass into biochar, which can be used to improve soil quality and reduce fire risk [5].
Pine bark is also often discarded contains high levels of polyphenols, a lignocellulosic material with high added value and potential for several applications [6]. It is estimated that around 15% of the mass of pine cones results in unused residual biomass [7]. With around 37% cellulose, the bark is viable for extracting microfibrillated cellulose (MFC) [8]. It can also provide tannins for use in resins and foams [9]. These valorisations reduce waste and promote a circular economy by converting it into useful products. Despite these possibilities, many forestry products, namely pine cones, are still discarded without significant economic or environmental benefit [10]. The extraction of textile dyes from this material makes the most of a little-used waste and reduces the environmental impact of the textile industry, which usually uses synthetic dyes. This practice supports cleaner production in the textile industry, one of the most polluting in the world, responsible for 10% of greenhouse gas emissions and almost 20% of drinking water contamination. In the European Union, the sector ranks fourth in environmental and climate impact and third in water and soil consumption, according to a global life cycle assessment [11].
The importance of natural dyes lies mainly in their ability to reduce the environmental impact of textile production. These materials break down more easily than synthetic dyes, reducing long-term pollution in water and soil, thus highlighting their importance in sustainable textile production [12]. It is also important to notice that they replace hazardous chemicals, minimising waste and reducing water consumption, thus promoting sustainable practices and contributing to ecological solutions in dyeing processes [13]. Studies on natural dyes from marigold flowers offer alternatives to synthetic dyes, reducing environmental damage. The use of these dyes, together with mordants such as lime, favours sustainability in textile dyeing practices [13]. Natural dyes can be derived from a variety of sources, including plants, minerals and animals, and chemically are compounds such as flavonoids and tannins [14]. Depending on their chemical composition, these colourants can be water-soluble, stable to water and light, characteristics that make them suitable for textile applications. Compounds such as tannins and anthraquinones can also act as mordants, increasing their functionality [15,16,17]. Colours obtained from natural dyes include yellow (isoflavones), orange (aurones), red and blue (anthocyanins), as well as shades of brown, grey, black and blue [15,17].
In addition to the ecological benefits, the valorisation of pine cones can boost local economy and open up new opportunities for rural and small-scale producers. The forest sector, including pine cone harvesting, can generate employment opportunities in rural areas, contributing to local economies [18]. The use of pine cones is in line with sustainable forest management, which is essential for maintaining biodiversity [18]. Small producers can diversify their sources of income by incorporating pine cone products selling, reducing their dependence on traditional timber markets [19]. Collecting and trading these pine cones for processing into natural dyes can encourage sustainable production practices in line with the principles of the circular economy and the bioeconomy. Involving local communities in the pine cone market can foster social cohesion and the collective management of forest resources [18].
Faced with environmental challenges such as forest fires and pollution in the textile industry, it is crucial to look for alternatives that balance ecological preservation and economic development. This study investigates the potential of natural dyes to replace chemicals, valuing underused resources and promoting innovative practices in the textile industry. The aim is to demonstrate the potential of pine cone waste in Portugal as a raw material for natural dyes, promoting its value and supporting the sustainable management of forest waste.
2. Materials and Methods
This study used waste pine cones from the production of Pinus Pinaster Aiton pine cones. The pine cones were collected in December 2022, in Viseu—Portugal region. The samples were dried in an oven at 65 °C, ground in a cutting mill (RETSCH SM 300) and strained in a sieve shaker (RETSCH S200), with the 500 µm to 2 mm particle sizes selected for the tests. The dye was extracted from this material, and the pH, solids content, phenol and antioxidant content were quantified in the extracts before the fabric dyeing. An interlock (2740/3) 100% cotton from Tintex-textiles® was used as the textile substrate. All the experimental procedures for extraction and dyeing process characterisation were carried out in triplicate.
2.1. Dye Extraction
To extract dyes from plants, the use of sodium hydroxide (NaOH) solutions as a solvent is the method most used by the textile industry, but it depends on the type of dye and the chemical properties of the plant. NaOH is mainly used due to its ability to disrupt plant cell walls and solubilize compounds [20] that have an acidic or slightly polar character [21], such as flavonoids, anthocyanins and chlorophylls. Three extractions were carried out, each with a different concentration of NaOH, 1%, 5% and 10%, based on the mass of the residue used in the test. First, 40 g of shredded pine cones were placed in a 500 mL flask, together with extractable solutions and distilled water relative to mass and humidity. Then, these mixtures were placed in a thermostatic bath at 70 °C for 1 hour with ultrasound. After cooling, they were decanted and kept at 4 °C to avoid contamination or deterioration.
2.2. Dye Characterisation
The pH measurement (pH 8, from the XS brand) was performed by soaking the extracts in distilled hot water, 1:20, after filtration. The solids content of the extracts was analysed using a moisture analysis with infrared heating (MB120 OHAUS EUROPE GMBH), according to equation 1, where TS is the solid content and Ta the moisture content:
O evaluates the phenolic compounds in the extracts, the adapted Folin-Ciocalteu spectrophotometric method was used with gallic acid as reference [22] using a Perkin-Elmer UV-VIS, model T-9100, spectrophotometer. It was possible to calculate the phenol content (%) according to equations 2 and 3, where Ce is the extract concentration (g/L), Ved is the volume of diluted extract (L), Ve the extract volume (L) and Cag is the concentration of gallic acid obtained by the calibration curve:
To determine the antioxidant capacity of the extract, a colorimetric method was carried out with 2,2-Diphenyl-1-picrylhydrazyl (DPPH) [23]. The reaction was monitored by the decay of DPPH at 517 nm, in the Spectro-photometer (Perkin-Elmer UV-VIS, model T-9100), in the presence of the antioxidant ascorbic acid, in known concentration. The antioxidant content was calculated according to equation 4, where Caa is the concentration of ascorbic acid (mg/L) obtained by the calibration curve and Ce is the solids concentration of in the analysed extract solution (g/L):
Fourier transform infrared spectroscopy (FTIR) (FTIR-UATR Two Spectrophotometer from PerkinElmer) was used for materials characterisation, namely, to evaluate the extraction process and characterise the extracts. The spectra were obtained using the software PerkinElmer Spectrum Version 10.4.1, selecting the wavenumbers between 4000 cm-1 and 400 cm-1, with a resolution of 4 cm-1, with 10 scans for each sample.
2.3. Dyeing Test
For the dyeing test, the discontinuous method was used. The dyeing of the cotton knit samples was carried out using only the pinecone extracts as dyes, with a liquor ratio of 1/15 (mass of dry textile product/mass of dyeing solution). Cotton knit samples of 5 ± 0.5 g were mixed with the dyeing liquor (2% g dry extract/g textile sample) in a 500 mL beaker and placed in a heating bath at 60 °C for 30 minutes. Once the dyeing stage was finished, the dyed textile samples were washed first with cold water, then, with water at 40 ± 5 °C and with the soap agent Cottoblanc STM (CHT, Tübingen, Germany) [24] followed by cold water.
2.4. Quality Control of the Dying Process
To quantitatively evaluate the dyeing process, measurements were made on cotton fabrics dyed with the pine cone extracts, using a spectrophotometer (CM-25cg Konica Minolta), evaluating the reflectance of the surface as a function of the wavelength of the emitted radiation. The spectrophotometric method applied to fabrics coloured with natural dyes has proven to be a reliable tool for accurate quantification of colour intensity [25]. Results were evaluated according to CIELab coordinates, as described in ISO 105A05:1996 [26].
2.5. Colour Fastness to Light and Water
The light fastness test was completed in the Q-SUN xenon arc test chamber following ISO 105-B02:2014 [27]. In this method, ΔE was calculated, which consists of the colour difference between the initial samples and those exposed to artificial light (full spectrum sunlight), as described by ISO 105—A05:1996 [26]. The standard ISO 105-E01:2013 [28] was used for the water fastness. For the evaluation of the fabric colour variation, a spectrophotometer CM-25cg Konica Minolta was also used. In this method, ΔE* was also calculated, according to ISO 105—A05: 1996 [26].
3. Results
3.1. Pine Cone Extract Analysis
To carry out the research proposal, three alkaline extractions were carried out on pine cone production waste, which was characterised and tested to assess its potential for dyeing cotton meshes. As can be seen in, an increase in pH can be observed with increasing concentrations of NaOH, which was expected as sodium hydroxide is a strong base. The pH of extracts is one of the main factors affecting the reactivity of dyes and the shade and yield of the dyeing process [29]. The sodium hydroxide solutions used as solvents in the extractions maintain an alkaline pH, which is positive as it increases the stability of the dye and consequently promotes good dyeing results [29]. A gradual increase in the solids content of the extracts can be observed as the alkalinity of the extraction solution increases. Sodium hydroxide is a base strong enough to form salts with phenols, the phenolates, and consequently increase the solids content in the samples [30]. At alkaline pH, phenolic compounds and flavonoids, which are commonly found in plant extracts, tend to undergo structural modifications that increase the availability of colouring molecules, resulting in more intense hues, although they may be less stable to light and washing. Alkaline conditions can induce autoxidation and dimerization of flavonoids, leading to the formation of higher molecular weight species that may alter their colour properties [31].

Table 1.
Characterisation of pine cone extracts.
| Solvent concentration (NaOH) | pH | Solids (%) | Phenols (%) | Antioxidant (%) | ||||
|---|---|---|---|---|---|---|---|---|
| M | SD | M | SD | M | SD | M | SD | |
| 1% | 9.9 | 0.01 | 1.0 | 0.01 | 2.3 | 1.2 | 23.2 | 0.2 |
| 5% | 12.3 | 0.01 | 1.2 | 0.01 | 12.1 | 0.5 | 11.7 | 0.2 |
| 10% | 12.8 | 0.01 | 1.6 | 0.01 | 9.4 | 0.4 | 10.3 | 0.01 |
1Note: M – Mean SD – Standard deviation
The content of phenolic compounds is characteristic of the dye that influences dyeing, that is, the reactivity of the dye with the cotton mesh. Phenolic compounds are classified by their original structure, their biological function and their chemical nature. They are divided into classes, according to their number of phenolic rings and the structures that connect these rings, namely phenolic acids, flavonoids, lignans, stilbenes and other phenolic compounds (tannin) [31]. The by-product of the pine cone is a material rich in polyphenols [32], such as tannins and flavonoids and these are chromophore molecules [33] responsible for the natural dye in textile dyeing. Tannins are polyphenols with variable molecular weight, which differ from most other natural phenolic compounds [34]. They are compounds soluble in hot water that could precipitate proteins from solutions and are widely used in the tanning industry. In addition to being natural dyes, they help in the affinity of cotton mesh with other dyes. When mixed with other natural dyes they rise to different shades such as yellow, brown, grey and black. Tannins are generally classified into two groups: hydrolysable (pyrogallol) and condensed (proanthocyanidins). The former group is characterised as having a portion of sugar and organic acids and upon hydrolysis produce gallic acid and ellagic acid. Condensed tannins are the most abundant in the tree bark [16].
In Figure 1 it is possible to observe that extracts obtained with 1% NaOH contain (M 2.3% SD 1.2) phenolic compounds, however, when the alkalinity of the extraction solution increases, to 5% of NaOH, the phenolic content value practically increases fivefold (M 12.1% SD 0.5). With the 10% NaOH extraction solution, there was a decrease in the number of phenols (M 9.4% SD 0.2). According to Filho et al. [34], tannins in alkaline solutions show a positive relationship with increasing concentrations of NaOH up to 8%. In fact, of all the extractions, the one carried out with the 5% NaOH solution had the highest percentage of phenols. Concentrations above 8% of NaOH induce some degradation reactions that can influence the decomposition of phenolic compounds [35].
Antioxidants, even in small concentrations, delay or inhibit the action of oxidant agents on the remaining compounds present in the extract [36,37]. Their role is to capture free radicals and inhibit or interrupt oxidative reactions [38]. These compounds may be ascorbic acid (vitamin C), carotenoids and/or phenolic compounds. Antioxidants are divided into two groups: the ones that can prevent oxidation that occurs with free radicals, donating a hydrogen atom or electrons to stabilise the substance, and the second group, molecules that inhibit oxygen reactions and convert hydroperoxides into non-radical species, also absorbing UV radiation. There are more than 8000 phenolic compounds in plants which act as antioxidants [39]. The results show that with the increase of NaOH in the extraction solution there was a decrease in the content of antioxidants extracted (Figure 1). Pine cones are rich in flavonoids, with high representativity of the bioflavonoid class. Flavonoids are powerful antioxidants, capable of preventing deterioration due to the action of free radicals in extract [40].
3.2. Materials Characterisation by FTIR
3.2.1. FTIR Analysis of the Original Pine Cone and the Extracted Pine Cone
To assess the extractable components of pine cone waste, a comparative FTIR analysis was carried out on the pine cone waste and the pine cone extracted with 1% NaOH, dried (60 ◦C). The spectra obtained were normalised at 1028 cm-1, the range in which cellulose is the main component. The pine cone spectra are shown in Figure 2. Comparing the original and extracted pine cones, it is possible to observe a reduction in transmittance at the 2920 and 2850 cm-1 peak in the extracted pine cone, due to extraction with NaOH which intensifies the chemical modifications of the lignocellulosic structure, making the extracts richer in compounds with CH2 bonds [41]. Increased NaOH concentrations lead to the release of aliphatic compounds from lignin [42]
The peaks around 1750-1600 cm-1 are in an important spectral zone for phenolic compounds, as they are characteristic of aromatic C=C vibrations, C=O stretching vibrations of acid groups, quinonoid rings of quinones and conjugated ketones [43,44]. It can be seen that the samples have peaks in these bands, particularly the phenolic compounds, which have C=C vibrations in the aromatic ring [44].
The peaks in the bands in the 1300-1020cm-¹ range in both samples correspond to C-O stretching vibrations in ethers or hemiacetals, or C-O in alcohols, polysaccharides or lignin. In aromatic compounds, bands in this range can be associated with deformation vibrations of the aromatic ring. The deformation modes of the benzene ring (or other aromatic rings) are common in the 1300 to 1400 cm-¹ range [44].
3.2.2. FTIR Comparative Analysis of the Three Extracts (1%, 5%, 10% NaOH).
According to the spectrum obtained for the extracts with different concentrations of NaOH (Figure 3), dried at (60 ◦C). The spectra obtained were normalised in the 1600 cm-1 band, which is the range where polyphenols are theoretically the majority compound. The bands at 2920-2850 cm-¹ correspond to the stretching vibrations of methyl (-CH₃) and methylene (-CH₂-) groups [43]., present in aliphatic chains and organic compounds in the pine cone's lignocellulosic matrix [42].The increase in transmittance in these bands indicates a greater presence of methylene and methyl groups, resulting from the partial degradation of lignin and hemicellulose under alkaline treatment. High concentrations of NaOH intensify the chemical modifications to the lignocellulosic structure, making the extracts richer in aliphatic compounds. Alkaline treatment breaks down the cell wall, increasing the availability of soluble organic compounds such as modified lignin and dissolved polysaccharides [42].
The transmittance range of 1420-1200 cm-¹ is associated with C-O stretching and C-H and C-H₂ deformation in polysaccharides [44]. Phenolic groups and aromatic bonds in lignin involve vibrations in the aromatic structure. The reduction in transmittance indicates the degradation of hemicellulose and lignin with increasing NaOH concentration, due to the breaking of chemical bonds by the alkaline treatment [42].
The bands between 1000-1200 cm-¹ are attributed to C-O-C stretching (glycosidic bonds) and C-O stretching (alcohols and ethers) [45] present in cellulose and hemicellulose, as well as phenolic groups and aromatic bonds in lignin The continuous presence of peaks in this range suggests that structures rich in C-O-C and C-O bonds, such as cellulose, lignin and some polysaccharides, remain even after alkaline treatment [42]. This indicates that although NaOH partially degraded the lignocellulose, some chemical bonds of these compounds are still present in the alkaline extracts of the pine cone.
The peaks in the 1200-1000 cm⁻¹ bands, present in the three samples, are generally related to C-O stretching ethers, but also due to deformation vibrations in aromatic compounds, which change depending on the structure of the substance Several antioxidants and phenolic compounds, such as certain flavonoids, have ethers and alcohols in their structure, such as quercetin and rutin, which have ether bonds and hydroxyl groups. Some polyphenols, such as cate-chins, have phenolic groups that act similarly to alcohols [46].
The band at 780 cm-¹ is generally associated with out of plane deformation of C-H bonds in aromatic structures (such as lignin's benzene rings), phenolic groups attached to aromatic rings and vibrations of lignin's aromatic skeleton [44]. Alkaline treatment with NaOH promotes the partial breaking of lignin's ester and ether bonds, releasing phenolic units and more exposed aromatic groups. This can result in an increase in the intensity of the band at 780 cm-1, since more aromatic structures contribute to this absorption. The increase in the band at 780 cm-1 after the addition of NaOH indicates structural modifications in the lignin, including greater exposure of aromatic and phenolic groups due to partial degradation of the lignocellulosic structure. This behaviour confirms that alkaline treatment directly influences the chemistry of pine cone biomass, favouring the release of modified lignin compounds [42]
3.3. Cotton Dyeing Test
It was established that the application of the NaOH extractable solutions resulted in the acquisition of a pink hue by fabric specimens. However, it was observed that the colour exhibited variability in intensity across the samples, with the extracts obtained from higher alkalinity solutions demonstrating a slight reduction in intensity. The L* value for 1% NaOH extract was recorded as (M 71.1, SD 1.3), while for 10% NaOH extract, it was (M 74.5, SD 1.4) (Table 2). The behaviour of the specimens dyed with 5% NaOH extractables was found to be very similar to that of the 1% ones. The intensity of the colour is dependent on some factors, including the pH, type and concentration of phenols, their degree of polymerization, temperature, and bath time [47] According to Chatlopadhyay [48], certain dyes exhibit enhanced reactivity with cotton in an alkaline environment; however, if the pH is excessively high, fixation diminishes due to the negative charge of the cotton mesh, resulting in incompatibilities. Consequently, as the NaOH concentration increases, the pH of the extracts also rises, avoiding the adhesion of the pinecone extract dye to the fabric. The light colour is a common drawback of natural dyes when their molecules exhibit low affinity for textiles. This phenomenon occurs due to the ionisation of the cellulosic hydroxyl groups in the cotton mesh that encounter water, resulting in negative charges that repel the dye molecules [48]. A visual analysis of the tanned specimens revealed non-uniform dyeing, characterised by the presence of white spots. These spots may be attributed to inadequate dissolution or diffusion of the dyes within the bath (Figure 4).
All the samples presented a* coordinate positive, representing a reddish tone (Table 2) due to the tannins. They are widely used to produce red dyes [48]. In coordinate b*, all samples were positive, that is, they expressed a yellowish hue. However, among the samples dyed with pine cone extract, the one with the concentration of 1% NaOH (M13.3, SD 1.1) was more yellowish and the sample dyed with 10% NaOH (M 10.3, SD 0.5) became less yellow. As emphasized by Jadhav [49] compounds belonging to the flavonoid class, such as flavanones and flavanols, are responsible for the yellow colour [50].
1Note: M – Mean; SD – Standard deviation.
One method to measure a dye's ability to tint materials is the evaluating of the relative colour strength which quantifies the absorbed electromagnetic radiation in the visible region (350 to 750 nanometres). This parameter relates the absorption (K) and scattering (S) coefficients of a dyed sample, relatively to a standard, at the same wavelength. The ratio K/S is calculated from reflectance (R), according to Kubelka-Munk equation [51] . Figure 5 shows the colour strength variation of fabrics dyed with different dyes extracted with different NaOH concentrations (1%, 5%, 10%) across a range of wavelengths (350–750 nm). It is noticed a higher colour strength with the samples dyed with 1% and 5% extracts, but all with a peak in the visible region around 520 nm, corresponding to a colour perceived likely magenta or reddish to the human eye. At this wavelength, higher K/S values indicate higher colour strength, namely a darker ap-appearance of the fabric, showing that not only the pigments are important for the dyeing process, but also other organic compounds, like antioxidants, to allow a better tinting of the specimen. The K/S values at this wavelength are 0.62, 0.60 and 0.45 for samples dyed with 1%, 5%, 10% extracts, respectively. Values of K/S above 1 point out to strong colour strength for deep or dark colours, between 0.5–1.0, medium colour strength and below 0.5, lighter colours. Again, and comparing with the previous data for L*, a* and b*, it is noticed that the colours are not dark, but with the specimens dyed with 10% extracts, becoming lighter.
3.4. Colour Fastness Test to Light
During use, textiles are exposed to external factors, such as light, water, and sweat, among others that imply colour degradation. Colour fastness refers to the resistance of textile colours to external factors and is one of the main reasons for quality flaws and consumer satisfaction. Increasing durability allows longer-life products, avoiding the generation of waste and the promotion of circular economy, namely reuse, rental and repair services for textiles, thus creating new business opportunities [52].
Light fastness tests are carried out to measure the changes in the dyed fabric when exposed to artificial light that simulates sunlight. In this process, light energy is absorbed by the dyed molecules that are broken down or rearranged, especially in the un-saturated groups of the chromophores, changing their interaction with electromagnetic radiation and therefore their appearance. This mechanism is different for each cotton mesh and dye, mainly due to the oxidation of dyes when exposed to light and temperatures [53].
In the lightfastness tests, the colorimetric properties L*, a*, and b* were evaluated after the dyed fabrics were exposed to stress factors, and the corresponding differences (ΔL*, Δa*, Δb*) were analysed for each parameter (Table 3). Under all light exposure conditions, the ΔL* values were positive, indicating a lightening of the fabric colours. Samples dyed with extracts obtained using 10% NaOH showed the greatest fading, reflected in a higher ΔL* value (M = 7.4; SD = 0.7). Conversely, fabrics dyed with extracts prepared with 1% NaOH exhibited the smallest colour intensity changes, with a significantly lower ΔL* (M = 5.5. SD 0.4). These results suggest a direct relationship between the NaOH concentration used during extraction and the colour stability under light exposure. With increasing NaOH concentration, a greater sensitivity of the samples to exposure to light was observed. This effect was characterized by an increase in Δb* values, indicating a more yellowish tone, and a reduction in Δa* values, reflecting a decrease in the reddish tone.
This result can be visually observed in dyed knit samples, where differences in colour intensity and tone are evident after exposure to light. In samples dyed with extracts obtained using 10% NaOH, a more pronounced lightening can be seen, reducing further colour wear. This change is consistent with the elevated ΔL* values, reflecting a significant loss of initial saturation. On the other hand, the fabrics dyed with extracts prepared with 1% NaOH maintained a visual appearance closer to the original colour, with less lightening and greater uniformity, corroborating the lower ΔL* values (Figure 6). These contrasts reinforce the brightness between the NaOH concentration used in the removal process and the visual stability of the colours in the dyed fabrics. Flavonoids are susceptible to photodegradation under alkaline conditions, with varying rates depending on the specific compound [53].
The values observed for ΔE*, the overall colour fastness to light, were between 2 and 10, which means that the difference in colour before and after light irradiation on the fabric, it is perceptible through close observation [54], which means that the difference in colour before and after light irradiation on the fabric, it is noticeable at first glance. As before, the dyed fabrics with 10% NaOH extractive noticed the greater change, (M 6.7, SD 0.5) the dyed with 1% NaOH extractive had the smallest chromatic difference (M 5.1, SD 0.1) (Figure 7).
The colour strength shows a significant decrease in the samples after their exposure to light (Figure 8), with lower values of K/S through all the spectra. Namely, it is noticed the disappearance of the shoulder around 520 nm, again with the specimens dyed with 1% and 5% extracts with similar behaviour. The colour strength, given by K/S, decreased to 0.37, 0.36 and 0.20, showing again the consequences in the dye degradation in the colour fastness to light.
3.5. Colour Fastness Test to Water
Another external factor that greatly influences the colour resistance of the cotton mesh is water. For this reason, the colour fastness test on water was carried out. As in the light fastness test, the samples were analysed in the spectrophotometer, before and after the fastness test, as previously described. In all samples, ΔL* was positive, showing lighter colours after immersion in water. Samples dyed with pine cone extract with 1% NaOH showed less variability in colour intensity (M 0.2, SD 0.7) (Table 4). The variation in red/green tones, indicated by Δa*, presents negative values, meaning a very subtle loss of the red tone. Regarding Δb*, all samples showed positive results, indicating a more yellowish tone. The results from all three coordinates indicate that the samples were somewhat affected by water as the NaOH concentration increased upon dye extraction. The variability of colour fastness to water occurs because the cellulosic cotton mesh in contact with water forms negative charges that repel the dye molecules [55].
When visually analysing the dyed fabrics after exposure to water, no significant differences in relation to the original colour are noticeable to the naked eye (Figure 9).
The total chromatic variation, ΔE*, in the samples immersed in water, was lower than that obtained in the light fastness tests, meaning that the pine cone dyes are more resistant to water than light. The ΔE* (Figure 10) of all samples were less than or equal to 1, which in the human eye visual perception metric indicates that the differences in colours are not perceptible by human eyes (line presented in the graphic of [54].
4. Conclusions
This study investigates the valorisation waste pine cones from the production of Pinus Pinaster Aiton into natural dyes for cotton dyeing, obtained by alkaline extraction with different percentages of NaOH. The dyeing process produced soft, pleasant colours and different shades, depending on the concentrations of NaOH used in the extraction. However, the effect on the intensity of the colour produced was found to be uneven, with the colour becoming lighter as the NaOH concentrations increased. Sodium hydroxide was found to influence the chemical composition of the extract and, consequently, the dyeing process. This reaction can be attributed to the difference in pH, which is responsible for the reduction and/or increase in the state of aggregation of the dye molecules induced by the presence of high concentrations of electrolyte. It was found that as the alkalinity of the extraction solution increased, the content of solids and phenols increased, but the opposite trend was noted for antioxidants, which are compounds that help protect and stabilise the colour. Analysis of the surface by FTIR revealed the removal of functional groups rich in hydroxyl groups from the pine cone, such as phenols, and extracts richer in organic acids, flavonoids, catechins and antioxidants.
The experiment involved the dyeing of cotton knit with extracts obtained from varying concentrations of NaOH, ranging from 1% to 10%. The results demonstrated that the specimen dyed with the 1% NaOH extract exhibited a darker appearance and a more intense yellow hue. In contrast, the cotton mesh treated with 5% NaOH extracts demonstrated a reddish tint, while those treated with 10% NaOH extracts showed a less yellowish colouration. The red shade attained in all dyeing solutions was found to be similar. In terms of dye fastness to light, all samples exhibited sensitivity to the photo-degradation process, with a noticeable chromatic shift. The samples underwent a transition from a reddish hue to a greenish and yellowish tone. In water fastness, a loss of colour was observed, imperceptible to the human eye. Samples dyed with the extract from pine cone waste demonstrated sensitivity to artificial light, while exhibiting enhanced resistance to water.
The present study demonstrated that the dye extraction process with a 1% NaOH solution yielded superior outcomes in terms of the dyeing process and in the resistance to light and water fastness tests, thus promoting a more environmentally friendly process for the valorisation of pine cone waste. The research conducted indicated that extracts from the pine cone by-product are a promising source for use as a natural dye for cotton dyeing. These lignocellulosic materials are renewable, abundantly available, and unfortunately wasted, and therefore can be obtained at relatively low costs from a wide variety of resources, such as forest waste.
This is an innovative and sustainable approach to forest management, as in addition to utilising pine cone waste, this process helps to reduce the biomass available, which reduces the risk of forest fires. Transforming waste into high-value products, such as natural dyes, not only reduces environmental effects, but also strengthens the circular economy and encourages more sustainable production practices. In addition, replacing synthetic dyes with natural alternatives reduces the pollution linked to the textile industry, benefiting both the environment and human health. The implementation of this solution could boost public policies that encourage the bioeconomy in Portugal and encourage collaboration between industry and academia in optimising processes for extracting and fixing natural textile dyes.
Author Contributions
For Conceptualization, Anna Barreto, Luisa Carvalho and Isabel Brás; Data curation, Anna Barreto, Isabel Brás, Jorge Martins and Luisa Carvalho; Formal analysis, Anna Barreto, Luisa Carvalho, Jorge Martins and Isabel Brás; Funding acquisition, Luisa Carvalho and Jorge Martins; Investigation, Anna Barreto; Methodology, Anna Barreto, Jorge Martins, Nuno Ferreira, Luisa Carvalho and Isabel Brás; Project administration, Luisa Carvalho; Resources, Luisa Carvalho and Isabel Brás; Supervision, Luisa Carvalho and Isabel Brás; Validation, Anna Barreto, Luisa Carvalho and Isabel Brás; Visualization, Anna Barreto, Isabel Brás and Luisa Carvalho; Writing – original draft, Anna Barreto, Luisa Carvalho and Isabel Brás; Writing – review & editing, Luisa Carvalho and Isabel Brás.
Funding
Project TRUEHUE (SI I&DT—Projects in co-promotion, POCI-01-0247-FEDER-047183) in the scope of Portugal 2020, co-funded by FEDER (Fundo Europeu de Desenvolvimento Regional) under the framework of POCI (Programa Operacional Competitividade e Internacionalização); national funds through FCT/MCTES (PIDDAC): LEPABE, UIDB/00511/2020 (DOI: 10.54499/UIDB/00511/2020)and UIDP/00511/2020 (DOI: 10.54499/UIDP/00511/2020) and ALiCE, LA/P/0045/2020 (DOI: 10.54499/LA/P/0045/2020).
Acknowledgments
The authors gratefully acknowledge the funding by: Project TRUEHUE (SI I&DT—Projects in co-promotion, POCI-01-0247-FEDER-047183) in the scope of Portugal 2020, co-funded by FEDER (Fundo Europeu de Desenvolvimento Regional) under the framework of POCI (Programa Operacional Competitividade e Internacionalização); national funds through FCT/MCTES (PIDDAC): LEPABE, UIDB/00511/2020 (DOI: 10.54499/UIDB/00511/2020)and UIDP/00511/2020 (DOI: 10.54499/UIDP/00511/2020) and ALiCE, LA/P/0045/2020 (DOI: 10.54499/LA/P/0045/2020). Furthermore, we would like to thank the CISED Research Centre and the Polytechnic Institute of Viseu for their support.
Conflicts of Interest
The authors declare no conflicts of interest.
Abbreviations
The following abbreviations are used in this manuscript:
| pH | Potential of Hydrogen |
| K | Absorption |
| S | Scattering |
| DPPH | 2,2-Diphenyl-1-picrylhydrazyl |
| NaOH | Sodium hydroxide |
| pH | Potential of Hydrogen |
| FTIR | Fourier transform infrared spectroscopy |
| R | Reflectance |
| TS | Solid Content |
| Ta | the moisture content |
| Ta | the moisture content |
| Ved | volume of diluted extract |
| Ve | extract volume |
| Cag | concentration of gallic acid |
References
- 6º Inventário Florestal Nacional (IFN6). Available online: https://www.icnf.pt/api/file/doc/0f0165f9df0d0bbe (accessed 2024-10-24).
- Gabinete de Planeamento, Políticas e Administração Geral (GPP). Linhas Estratégicas dos Setores de Produção Primária no Contexto do Desenvolvimento da Estratégia Nacional para a Bioeconomia Sustentável 2030: Relatório Principal; GPP: Lisboa, 2021. Available online: https://www.gpp.pt/ (accessed 2024-10-24).
- Kreye, J.K.; Varner, J.M.; Dugaw, C.J.; Cao, J.; Szecsei, J.; Engber, E.A. Pine cones facilitate ignition of forest floor duff. Can. J. For. Res. 2013, 43, 512–516. [Google Scholar] [CrossRef]
- Borges, C.H.A.; Souto, P.C.; Neto, J.H.D.N.; Souto, J.S.; Araujo, E.C.G.; Silva, T.C. Combustibility of fuel material for forest species. Sci. Electron. Arch. 2021, 14, 14–17. [Google Scholar] [CrossRef]
- Silva, F. C.; Santos, M.; Moura, J.; Boas, A. C. V.; Matos, M. A.; Tarelho, L. A. C. Preventing Wildfires through Smart Management and Valorisation of Residual Forest Biomass into Biochar: Experiences from the BioValChar Project. IX International Conference on Forest Fire Research. Coimbra, Portugal. 2022, 1507-1512. [CrossRef]
- Lima, E.C.; Royer, B.; Vaghetti, J.C.; Brasil, J.L.; Simon, N.M.; dos Santos, A.A.; Pavan, F.A.; Dias, S.L.; Benvenutti, E.V.; da Silva, E.A. Adsorption of Cu(II) on Araucaria angustifolia wastes: Determination of the optimal conditions by statistic design of experiments. J. Hazard. Mater. 2007, 140, 211–220. [Google Scholar] [CrossRef] [PubMed]
- Rezende, Stephany Cunha de. Valorisation of pine nut bark, a by-product of the Araucaria angustifolia seed, for the production of polymeric materials. Bachelor's degree, Federal Technological University of Paraná, Bragança, 2016.
- Kumar, A.; Gupta, V.; Gaikwad, K.K. Microfibrillated cellulose from pine cone: extraction, properties, and characterization. Biomass- Convers. Biorefinery 2021, 13, 1–8. [Google Scholar] [CrossRef]
- Feng, S.; Cheng, S.; Yuan, Z.; Leitch, M.; Xu, C.C. Valorization of bark for chemicals and materials: A review. Renew. Sustain. Energy Rev. 2013, 26, 560–578. [Google Scholar] [CrossRef]
- Martínez, J. Caracterización del Rendimiento y Propiedades Físicas de la Piña y el Piñón. Jornadas técnicas de frutos secos. Madrid, Espanha, 2008.
- Manshoven, S.; Christis, M.; Vercalsteren, A.; Arnold, M.; Nicolau, M.; Lafond, E. Textiles and the Environment in a Circular Economy; European Topic Centre on Waste and Materials in a Green Economy: Mol, Belgium, 2019. Available online: https://www.eea.europa.eu/en/analysis/publications/textiles-in-europes-circular-economy.
- Hoque, M.B.; Oyshi, T.H.; Hannan, A.; Haque, P.; Rahman, M.; Shahid, A.; Sheikh, S. Unraveling the ecological footprint of textile dyes: A growing environmental concern. Pollut. Study 2024, 5. [Google Scholar] [CrossRef]
- Shams, T.; Ruma, N.J.; Basit, A. Assessing the financial and environmental impact of natural dyes and mordants: ROI and sustainability metrics in sonication-assisted dyeing. Open Access Res. J. Sci. Technol. 2024, 12, 124–135. [Google Scholar] [CrossRef]
- Patil, S.; Athalye, A. Sustainable Coloration Technologies. Department of Fibers and Textile Processing Technology. Indian J. Fibre Text. Eng. 2024, 4, 1–8. [Google Scholar] [CrossRef]
- Yusuf, M.; Shabbir, M.; Mohammad, F. Natural Colorants: Historical, Processing and Sustainable Prospects. Nat. Prod. Bioprospecting 2017, 7, 123–145. [Google Scholar] [CrossRef]
- Bhat, T.K.; Singh, B.; Sharma, O.P. Microbial degradation of tannins – A current perspective. Biodegradation 1998, 9, 343–357. [Google Scholar] [CrossRef]
- de Araújo, M.E.M. Natural dyestuffs from Antiquity to modern days. Conserv. Patrim. 2006, 3-4, 39–51. [Google Scholar] [CrossRef]
- Lopes, A. F. F. The Economic Value of Portuguese Pine and Eucalyptus Forests. Masters, NOVA – School of Business and Economics, Lisboa, Portugal, 2013.
- Santos, A.; Simões, R.; Pereira, H.; Anjos, O. Alternative species for the forest industry as forms of diversify the landscape. II Simposio Iberoamericano de Gestión y Economía Forestal, Barcelona, Espanha, 2004.
- Muhamad, I. I.; Hassan, N. D.; Mamat, S. N. H.; Nawi, N. M.; Rashid, W. A.; Tan, N. A. Extraction Technologies and Solvents of Phytocompounds From Plant Materials: Physicochemical Characterization and Identification of Ingredients and Bioactive Compounds From Plant Extract Using Various Instrumentations. In Ingredients Extraction by Physicochemical Methods in Food; Grumezescu, A. M., Holban, A. M., Eds.; Handbook of Food Bioengineering; Academic Press 2017; 523–560. [CrossRef]
- Shahidi, F.; Ambigaipalan, P. Phenolics and polyphenolics in foods, beverages and spices: Antioxidant activity and health effects–A review. Journal of functional foods 2015, 18, 820–897. [Google Scholar] [CrossRef]
- Guyot, S.; Marnet, N.; Laraba, D.; Sanoner, P.; Drilleau, J.-F. Reversed-Phase HPLC following Thiolysis for Quantitative Estimation and Characterization of the Four Main Classes of Phenolic Compounds in Different Tissue Zones of a French Cider Apple Variety (Malus domestica Var. Kermerrien). J. Agric. Food Chem. 1998, 46, 1698–1705. [Google Scholar] [CrossRef]
- Rodrigues, E.; Pietta, P. G.; Facco, E. M. P.; Fett, R.; Costa, A. C. O.; Gonçalves, G. A. Phenolic Compounds and Antioxidant Activity of Vitis labrusca and Vitis vinifera Cultivars. Food Science and Technology 2007, 27(2), 394-400. [CrossRef]
- Product COTOBLANC STM—CHT Group—special chemicals. Available online: https://solutions.cht.com (accessed 2024-10-25).
- Ghanean, S.; Afjeh, M. G. Application of Derivative Spectrophotometry to Determine the Relation Between Color Intensity and Dye Concentration of Madder. Progess Color Colorants Coat. 2016, 9, 183–194. [Google Scholar] [CrossRef]
- International Organization for Standardization. ISO 105-A05:1996 – Textiles – Tests for Colour Fastness – Part A05: Instrumental Assessment of Change in Colour for Determination of Grey Scale Rating; ISO: Geneva, 1996.
- International Organization for Standardization. ISO 105-B02:2014 – Textiles – Tests for Colour Fastness – Part B02: Colour Fastness to Artificial Light: Xenon Arc Fading Lamp Test; ISO: Geneva, 2014.
- International Organization for Standardization. ISO 105-E01:2013 – Textiles – Tests for Colour Fastness – Part E01: Colour Fastness to Water; ISO: Geneva, 2013.
- Cheng, T.-H.; Liu, Z.-J.; Yang, J.-Y.; Huang, Y.-Z.; Tang, R.-C.; Qiao, Y.-F. Extraction of Functional Dyes from Tea Stem Waste in Alkaline Medium and Their Application for Simultaneous Coloration and Flame Retardant and Bioactive Functionalization of Silk. ACS Sustain. Chem. Eng. 2019, 7, 18405–18413. [Google Scholar] [CrossRef]
- Lv, S.; Lin, X.; Gao, Z.; Hou, X.; Zhou, H.; Sun, J. Phenol Liquefaction of Waste Sawdust Pretreated by Sodium Hydroxide: Optimization of Parameters Using Response Surface Methodology. Molecules 2022, 27, 7880. [Google Scholar] [CrossRef]
- Jurasekova, Z.; Domingo, C.; Garcia-Ramos, J.V.; Sanchez-Cortes, S. Effect of pH on the chemical modification of quercetin and structurally related flavonoids characterized by optical (UV-visible and Raman) spectroscopy. Phys. Chem. Chem. Phys. 2014, 16, 12802–12811. [Google Scholar] [CrossRef]
- Cordenunsi, B.R.; Nascimento, J.R.O.D.; Genovese, M.I.; Lajolo, F.M. Influence of Cultivar on Quality Parameters and Chemical Composition of Strawberry Fruits Grown in Brazil. J. Agric. Food Chem. 2002, 50, 2581–2586. [Google Scholar] [CrossRef]
- Weigl-Kuska, M.; Kandelbauer, A.; Hansmann, C.; Pöckl, J.; Müller, U.; Grabner, M. Application of Natural Dyes in the Coloration of Wood. In Handbook of Natural Colorants 2009, 278–313. [Google Scholar] [CrossRef]
- Filho, J.M.P.; Vieira, E.d.L.; Silva, A.M.d.A.; Cezar, M.F.; Amorim, F.U. Efeito do tratamento com hidróxido de sódio sobre a fração fibrosa, digestibilidade e tanino do feno de jurema-preta (Mimosa tenuiflora. Wild). Rev. Bras. de Zootec. 2003, 32, 70–76. [Google Scholar] [CrossRef]
- Rodrigues, E.; Pietta, P. G.; Facco, E. M. P.; Fett, R.; Costa, A. C. O.; Gonçalves, G. A. Phenolic Compounds and Antioxidant Activity of Vitis labrusca and Vitis vinifera Cultivars. Food Science and Technology 2007, 27(2), 394-400. [CrossRef]
- Silva, M.L.C.; Costa, R.S.; Santana, A.D.S.; Koblitz, M.G.B. Phenolic compounds, carotenoids and antioxidant activity in plant products. Semin. Agrar. 2010, 31, 669–681. [Google Scholar] [CrossRef]
- Fernandes, V.C.; Queiroz, C.R.A.d.A.; Almeida, E.S.; Melo, C.M.T. Phenolic content and antioxidant activity of medicinal plants. Res. Soc. Dev. 2023, 12. [Google Scholar] [CrossRef]
- Goyal, S.; Thirumal, D.; Singh, S.; Kumar, D.; Singh, I.; Kumar, G.; Sindhu, R. K. Basics of Antioxidants and Their Importance. Antioxidants 2024, 1–20. [Google Scholar] [CrossRef]
- Rani, D. J. Antioxidant Activity and Phytochemical Composition of the Selected Fruits. IGI Global 2024, 1–19. [Google Scholar] [CrossRef]
- Arvanitoyannis, I.S.; Ladas, D.; Mavromatis, A. Potential uses and applications of treated wine waste: a review. Int. J. Food Sci. Technol. 2006, 41, 475–487. [Google Scholar] [CrossRef]
- Lopes, W.A.; Fascio, M. Flow chart for infrared spectra interpretation of organic compounds. Quimica Nova 2004, 27, 670–673. [Google Scholar] [CrossRef]
- Xu, J.-D.; Li, M.-F.; Sun, R.-C. Successive Fractionations of Hemicelluloses and Lignin from Sorghum Stem by Sodium Hydroxide Aqueous Solutions with Increased Concentrations. BioResources 2018, 13, 2356–2373. [Google Scholar] [CrossRef]
- Gong, Y.; Chen, X.; Wu, W. Application of fourier transform infrared (FTIR) spectroscopy in sample preparation: Material characterization and mechanism investigation. Adv. Sample Prep. 2024, 11. [Google Scholar] [CrossRef]
- Stuart, B. Infrared Spectroscopy: Fundamentals and Applications; Wiley: Chichester, West Sussex, England; Hoboken, NJ, 2004.
- Colthup, N. B.; Daly, L. H.; Wiberley, S. E. Introduction to Infrared and Raman Spectroscopy; Academic Press: Nova Iorque, 1964. [Google Scholar]
- Barraza-Garza, G.; Castillo-Michel, H.; de la Rosa, L.A.; Martinez-Martinez, A.; Pérez-León, J.A.; Cotte, M.; Alvarez-Parrilla, E. Infrared Spectroscopy as a Tool to Study the Antioxidant Activity of Polyphenolic Compounds in Isolated Rat Enterocytes. Oxidative Med. Cell. Longev. 2016, 2016, 9245150–9245150. [Google Scholar] [CrossRef] [PubMed]
- Pandey, K.B.; Rizvi, S.I. Plant polyphenols as dietary antioxidants in human health and disease. Oxid. Med. Cell. Longev. 2009, 2, 270–278. [Google Scholar] [CrossRef] [PubMed]
- Daberao, A. M.; Kolte, P. P.; Turukmane, R. N. Cotton Dying with Natural Dye. Int. J. Res. Sci. Innov. 2016, 3(8), 157–161. [Google Scholar]
- Chatlopadhyay, D. P. Cationization of Cotton for Low-Salt or Salt-Free Dyeing. Indian Journal of Fibre & Textile Research 2001, 26(1):108-115.
- Jadhav, A.S. Flavonoids and Fruit Coloration: A Comprehensive Review of Biochemical Pathway and Environmental Interactions. Int. J. Res. Appl. Sci. Eng. Technol. 2024, 12, 1027–1033. [Google Scholar] [CrossRef]
- Goltz, D.; Ahmadi, S.; Crawford, J.; Craig, D. Photochemical properties of selected flavonol dyes: Effects on their separation using capillary electrophoresis. J. Liq. Chromatogr. Relat. Technol. 2016, 39, 768–774. [Google Scholar] [CrossRef]
- Clark, M. Handbook of Textile and Industrial Dyeing: Principles, Processes and Types of Dyes; Woodhead Publishing: Cambridge, 2011.
- Jurasekova, Z.; Domingo, C.; Garcia-Ramos, J.V.; Sanchez-Cortes, S. Effect of pH on the chemical modification of quercetin and structurally related flavonoids characterized by optical (UV-visible and Raman) spectroscopy. Phys. Chem. Chem. Phys. 2014, 16, 12802–12811. [Google Scholar] [CrossRef]
- Comissão Internacional de Iluminação (CIE)—Conselho Internacional de Ciência. International Science Council. Available online: https://pt.council.science/member/cie-commission-internationale-de-leclairage/ (accessed 2024-10-25).
Figure 1.
Solids, phenols and antioxidants content of Pine cone extracts.
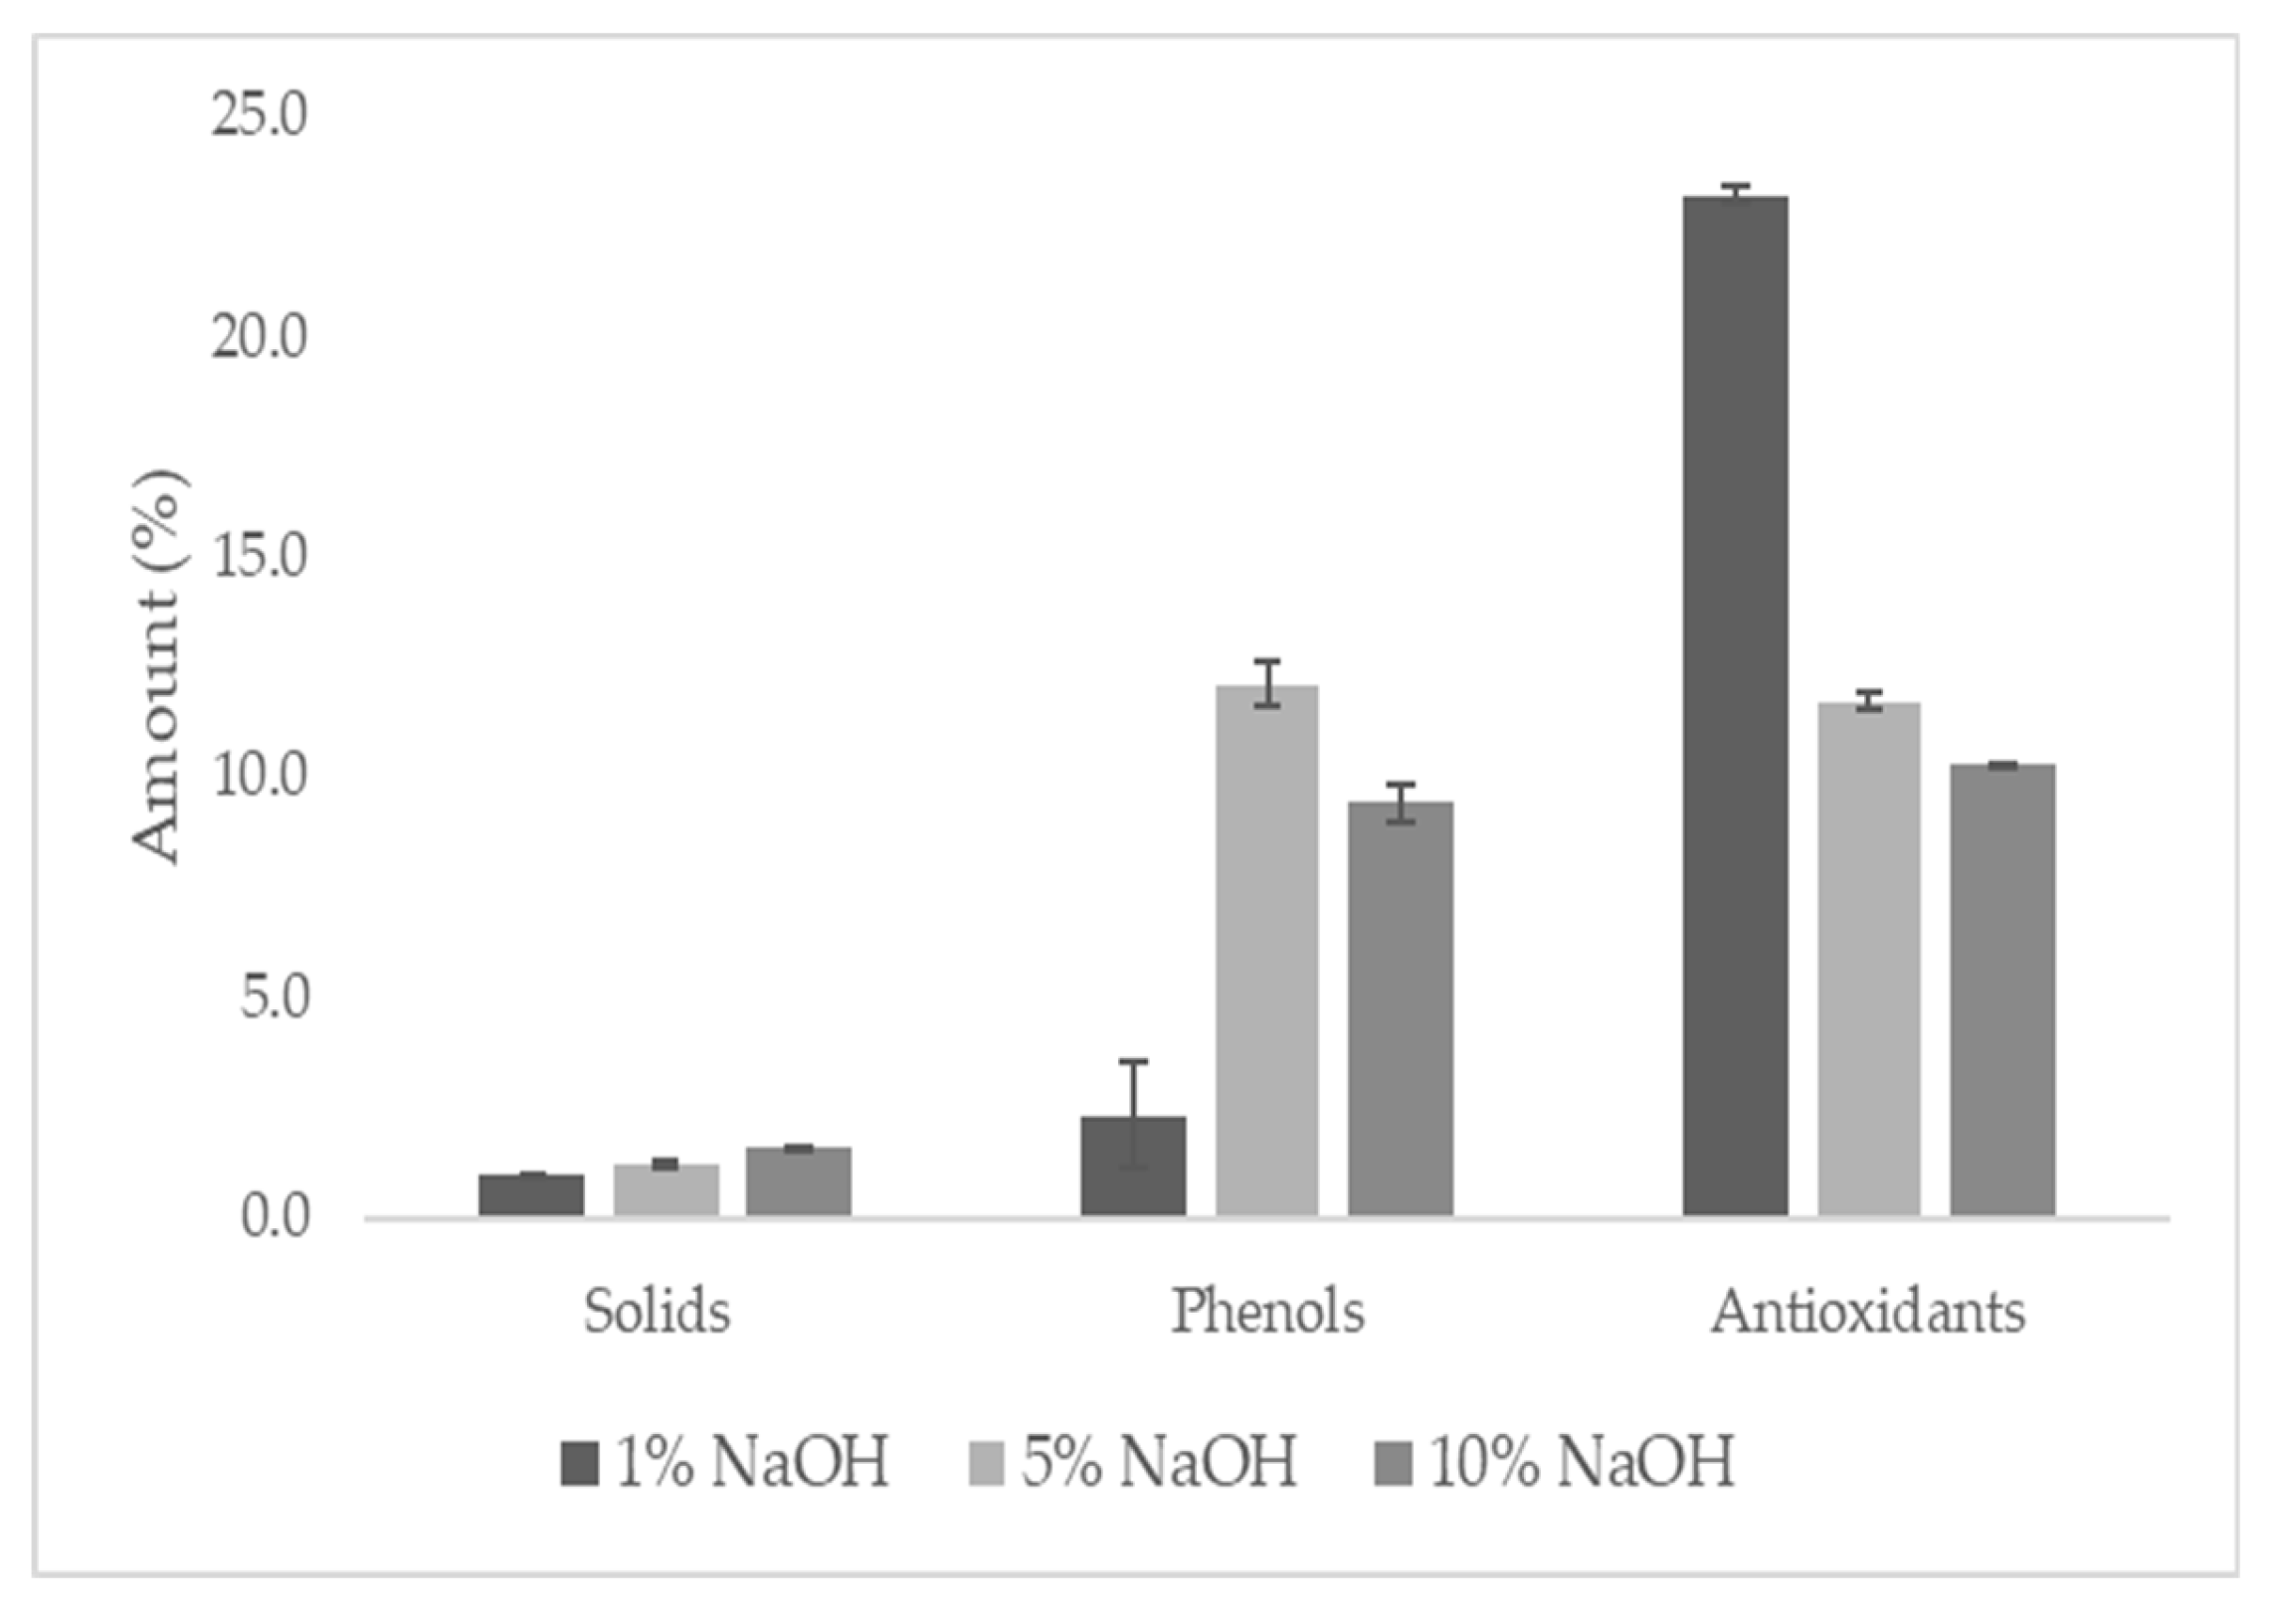
Figure 2.
-FTIR spectra of the original pine cone and the pine cone extracted with 1% NaOH.
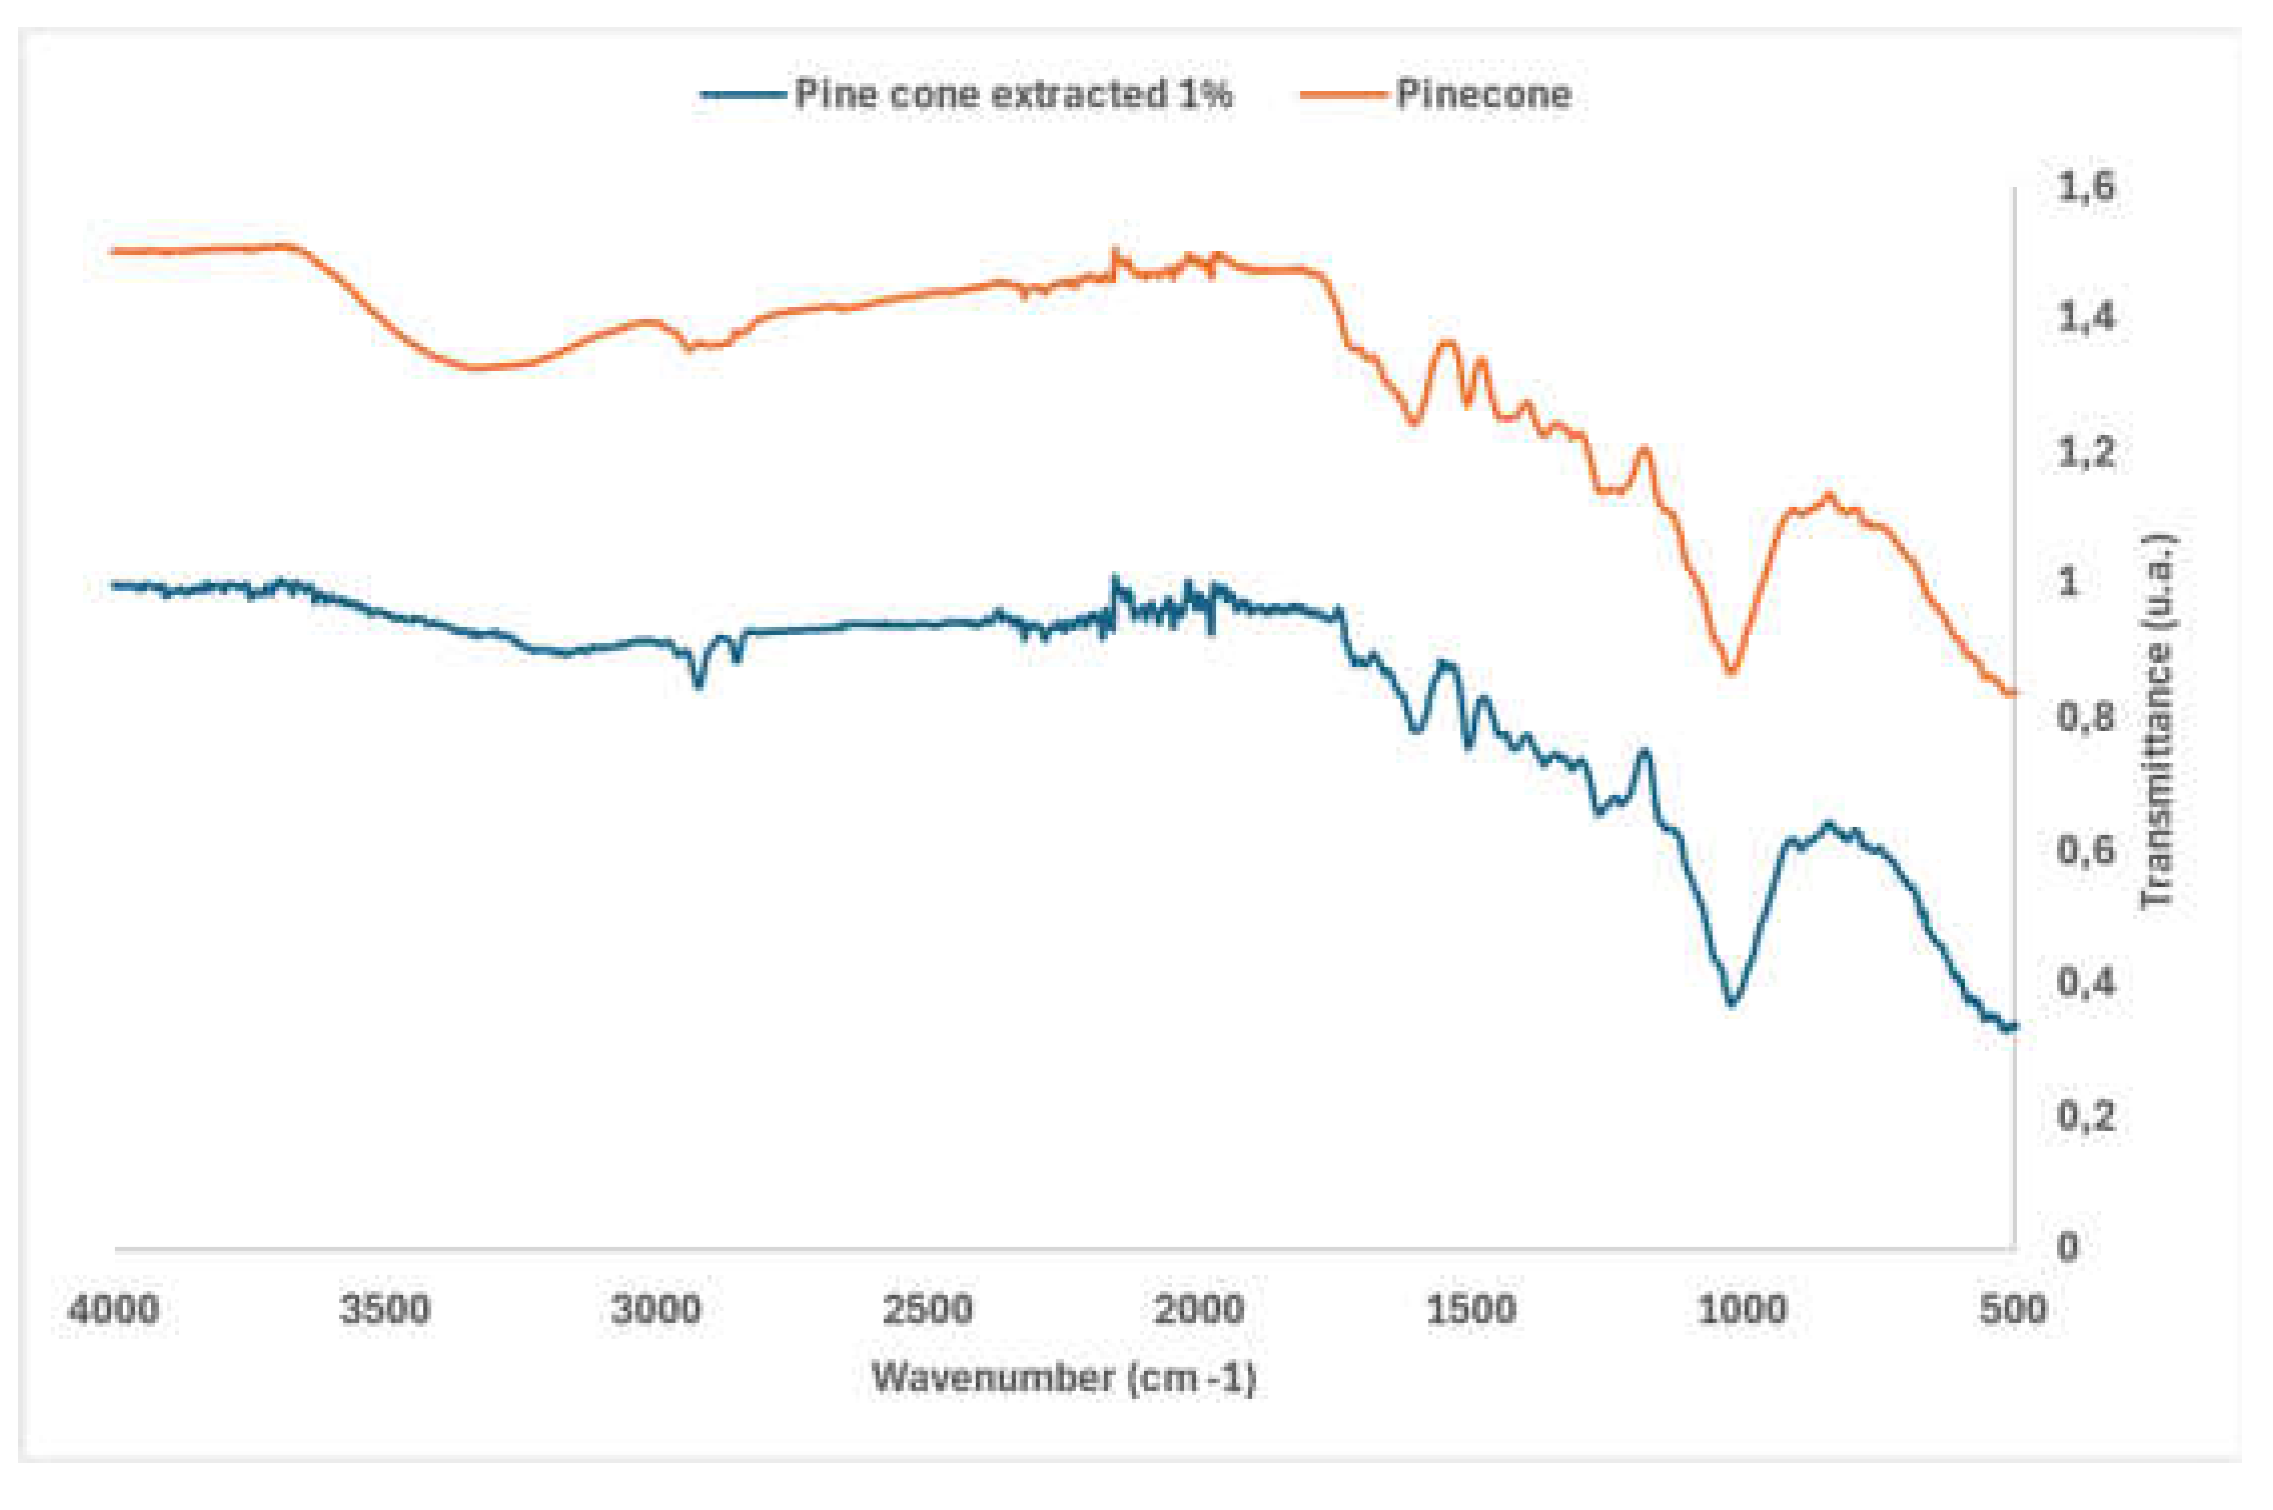
Figure 3.
FTIR spectra for the extracts obtained with 1%, 5% and 10% NaOH.
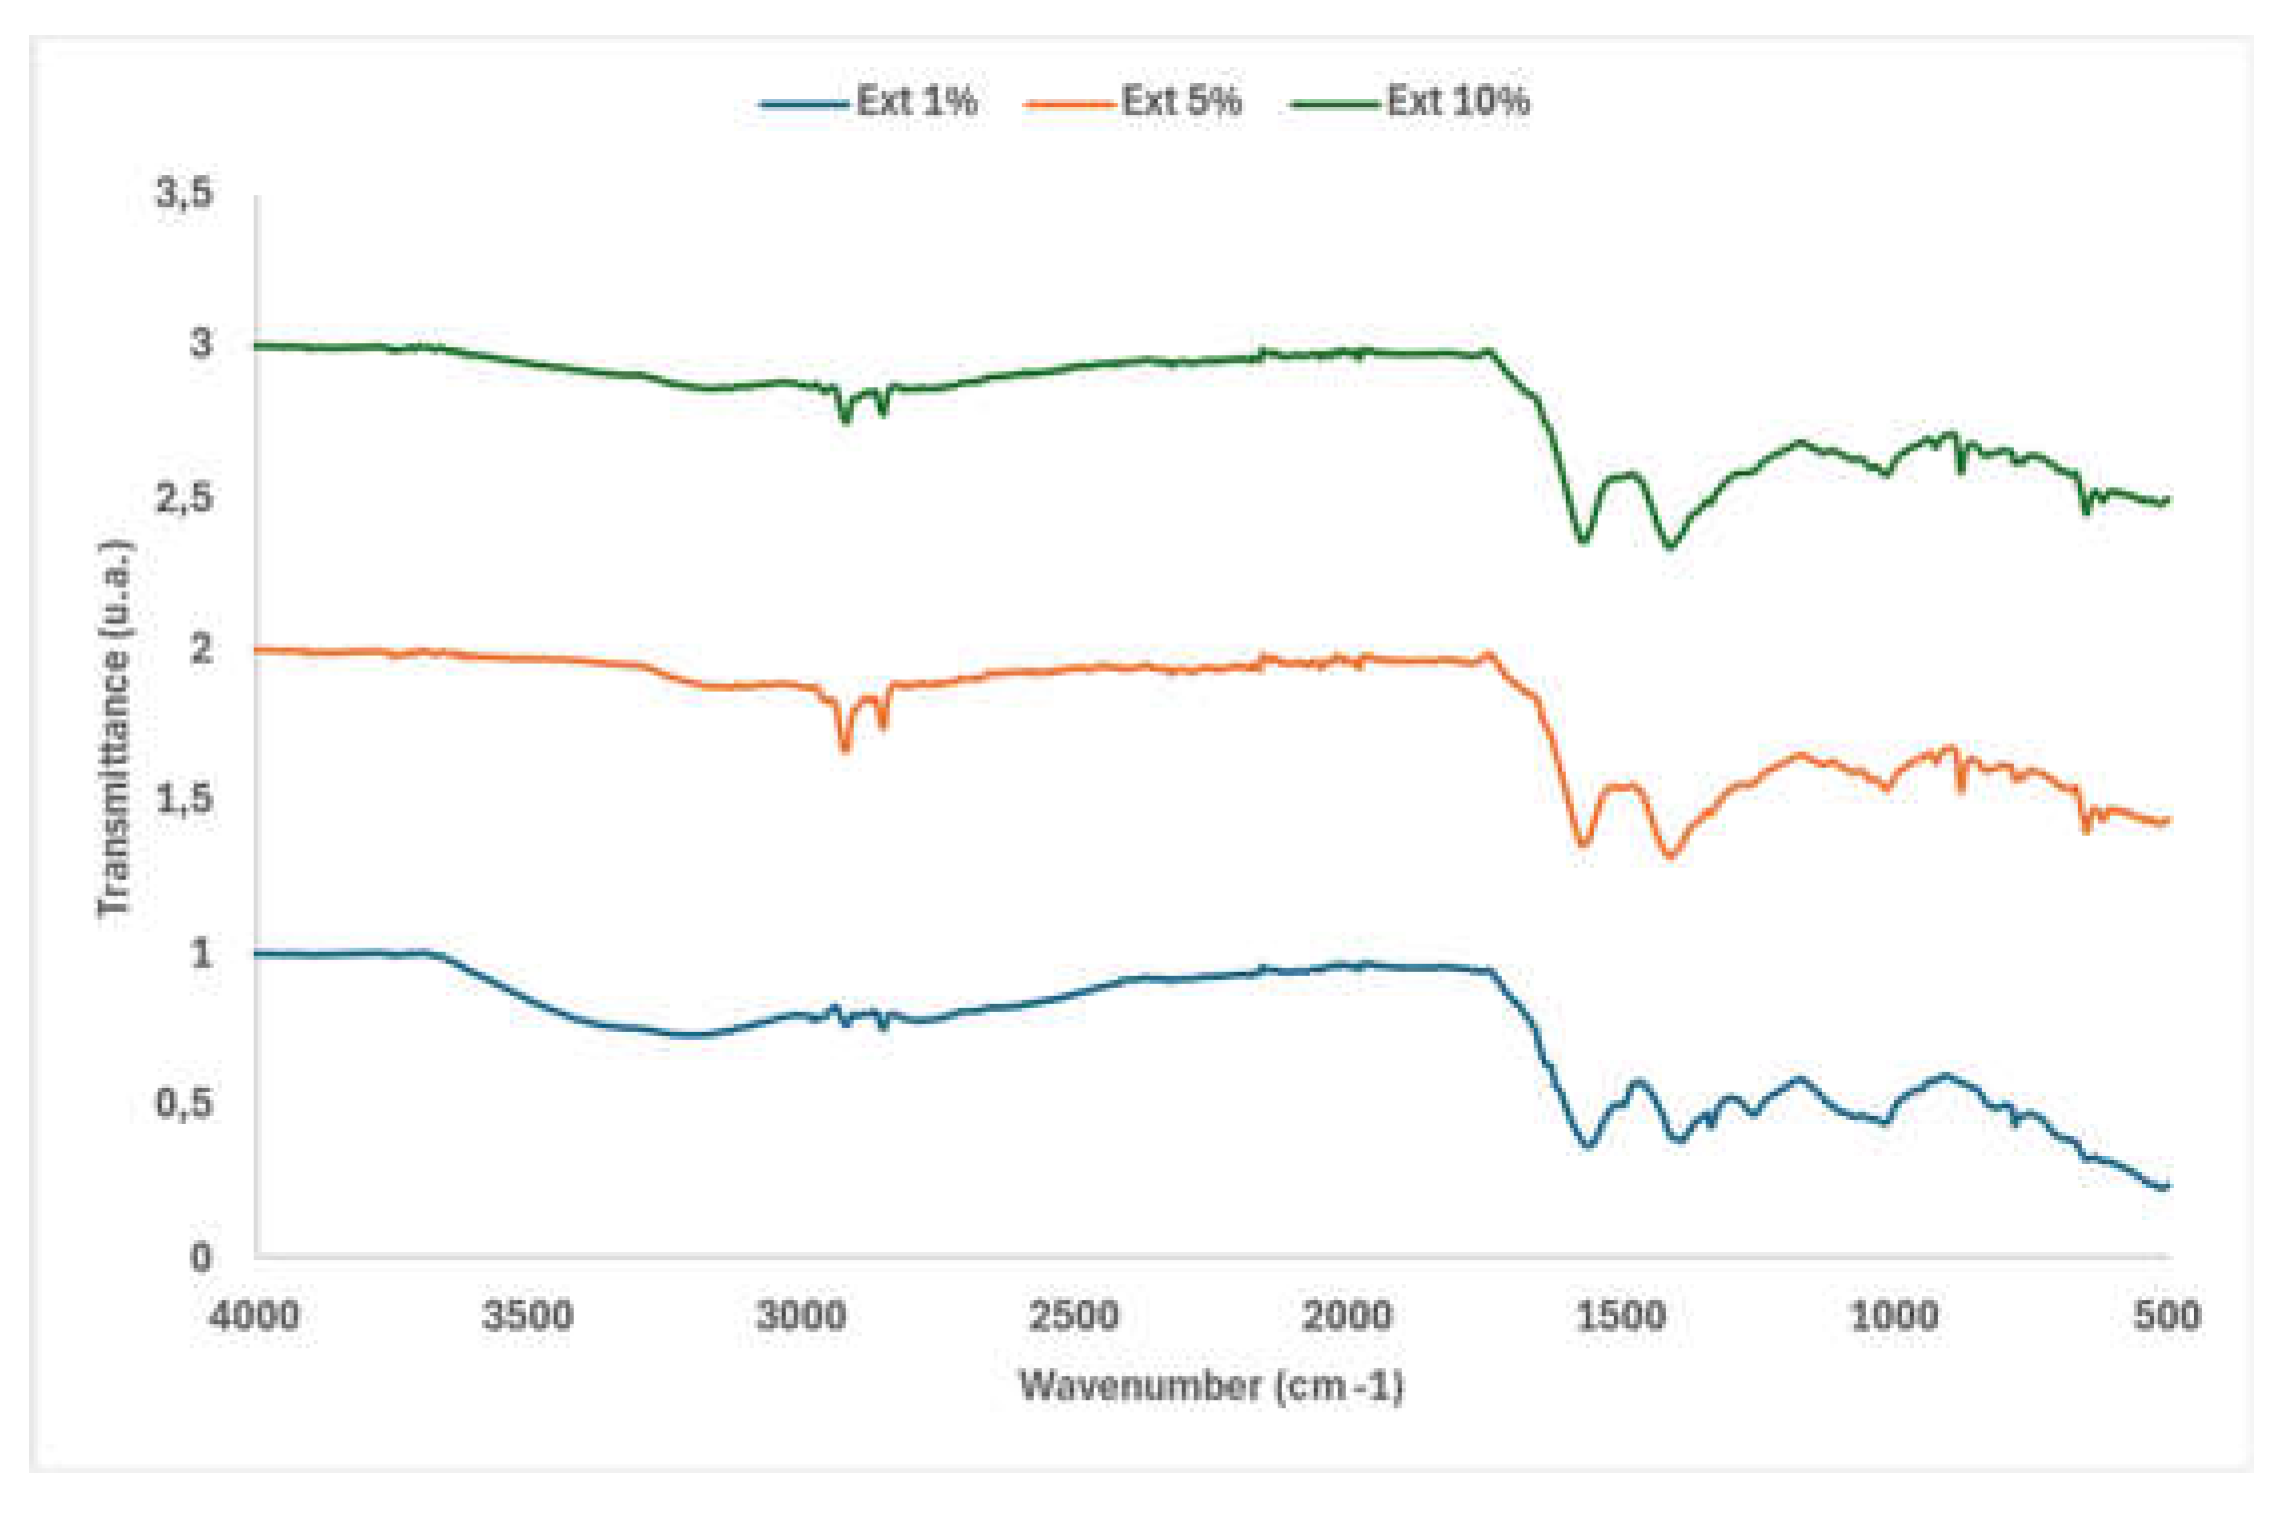
Figure 4.
Cotton mesh dyed with pine cone extracts (1%, 5%, 10% NaOH).
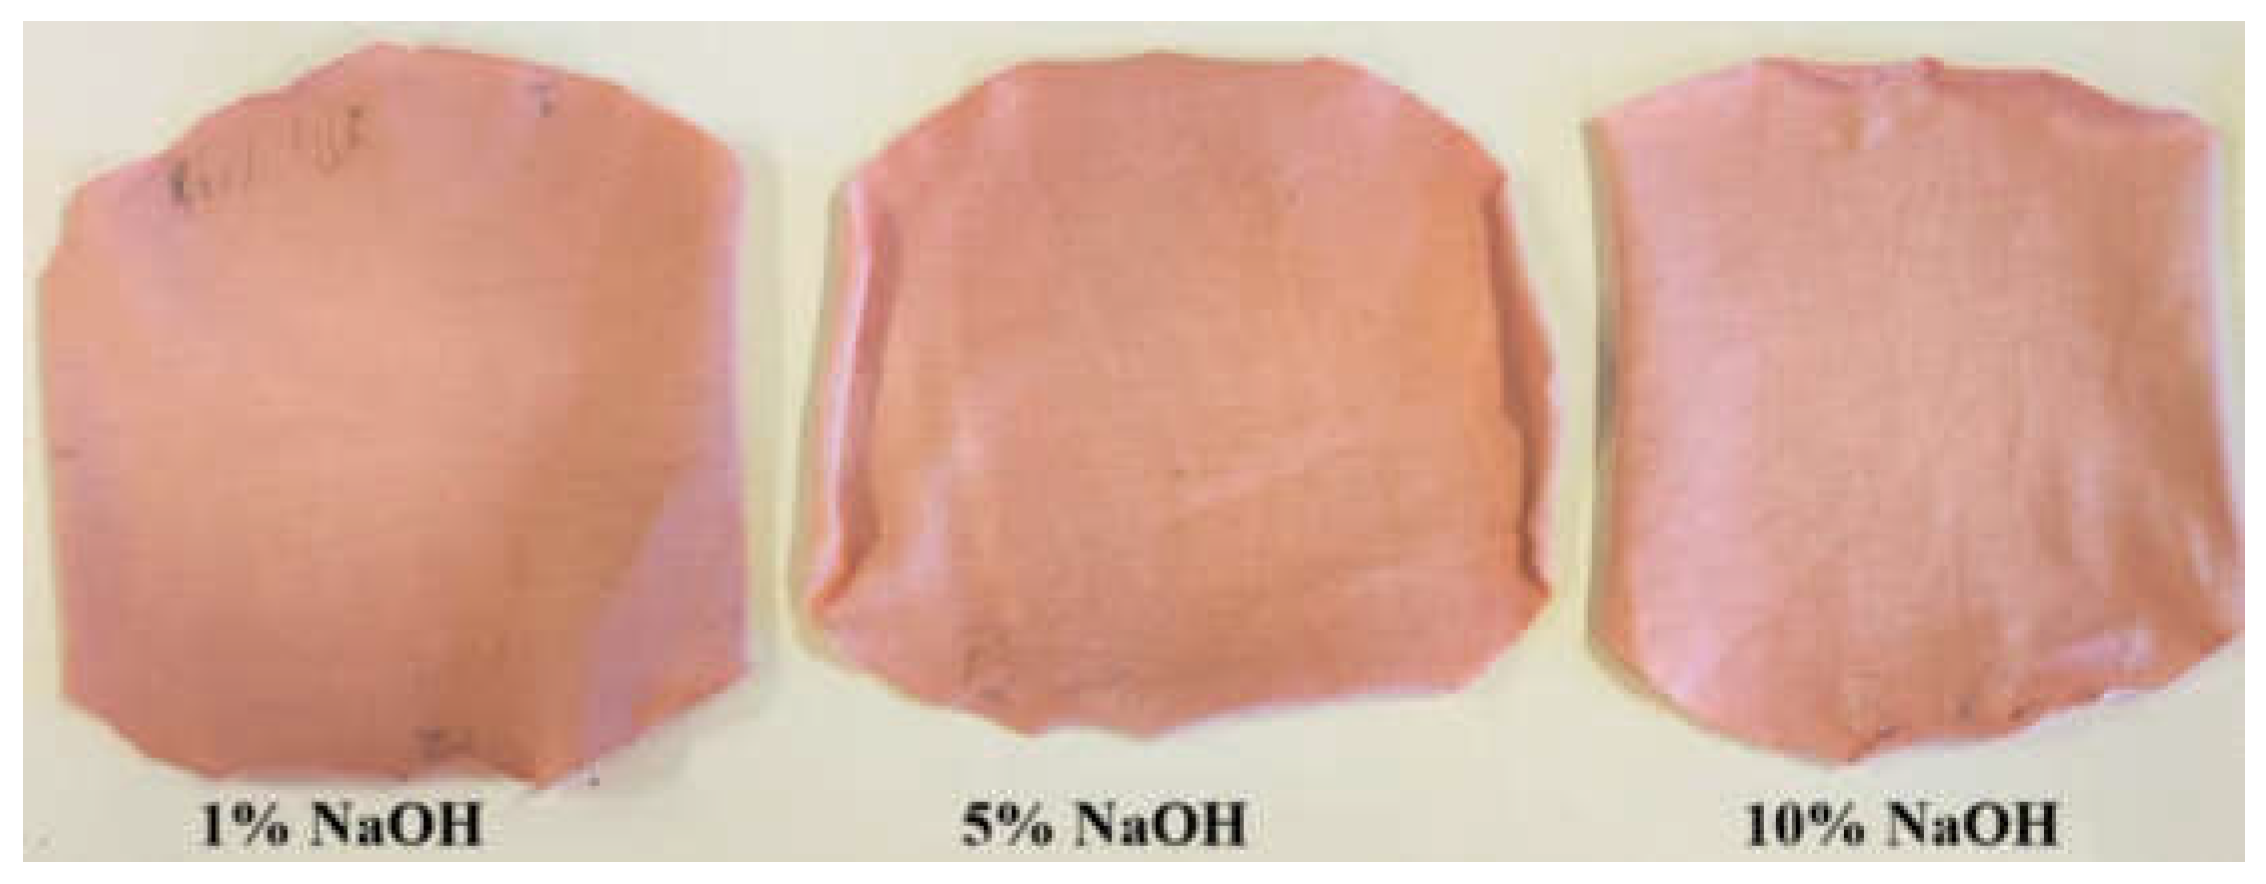
Figure 5.
Colour strength of cotton meshes dyed with the pine cone waste extract obtained with different concentrations of NaOH. P 1% extraction with 1% NaOH; P 5% extraction with 5% NaOH; P 10% extraction with 10% NaOH.
Figure 5.
Colour strength of cotton meshes dyed with the pine cone waste extract obtained with different concentrations of NaOH. P 1% extraction with 1% NaOH; P 5% extraction with 5% NaOH; P 10% extraction with 10% NaOH.
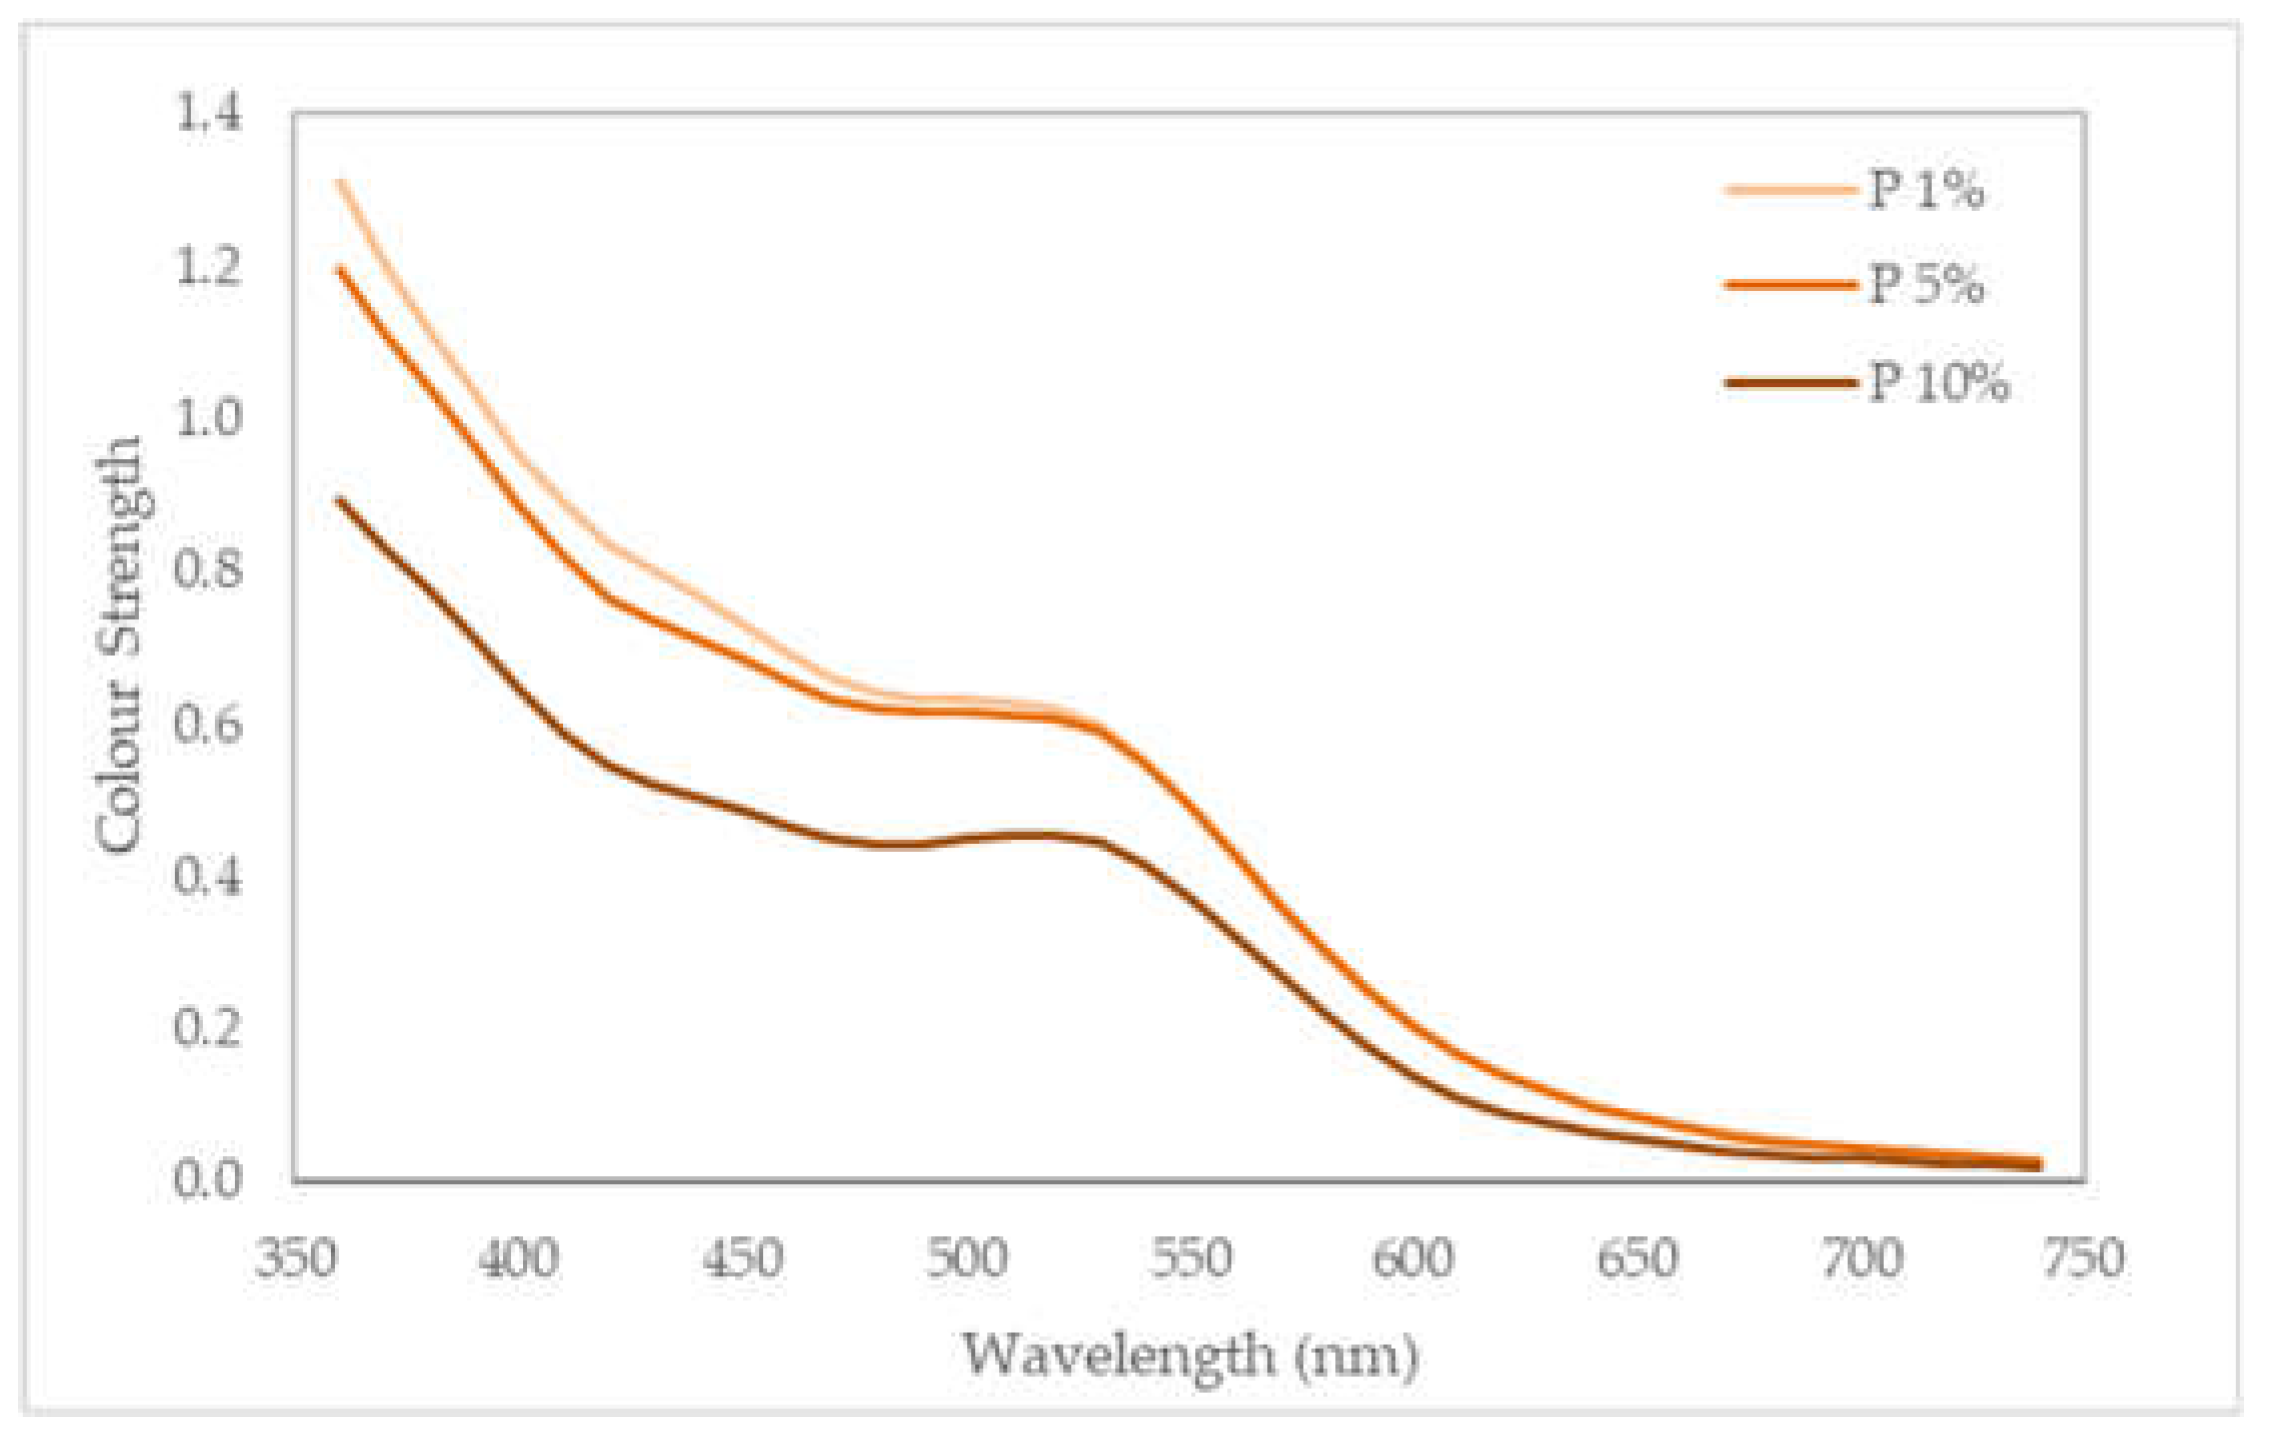
Figure 6.
Cotton knits dyed with different concentrations of NaOH (1%, 5%, 10%) after wear caused by the light fastness test.
Figure 6.
Cotton knits dyed with different concentrations of NaOH (1%, 5%, 10%) after wear caused by the light fastness test.
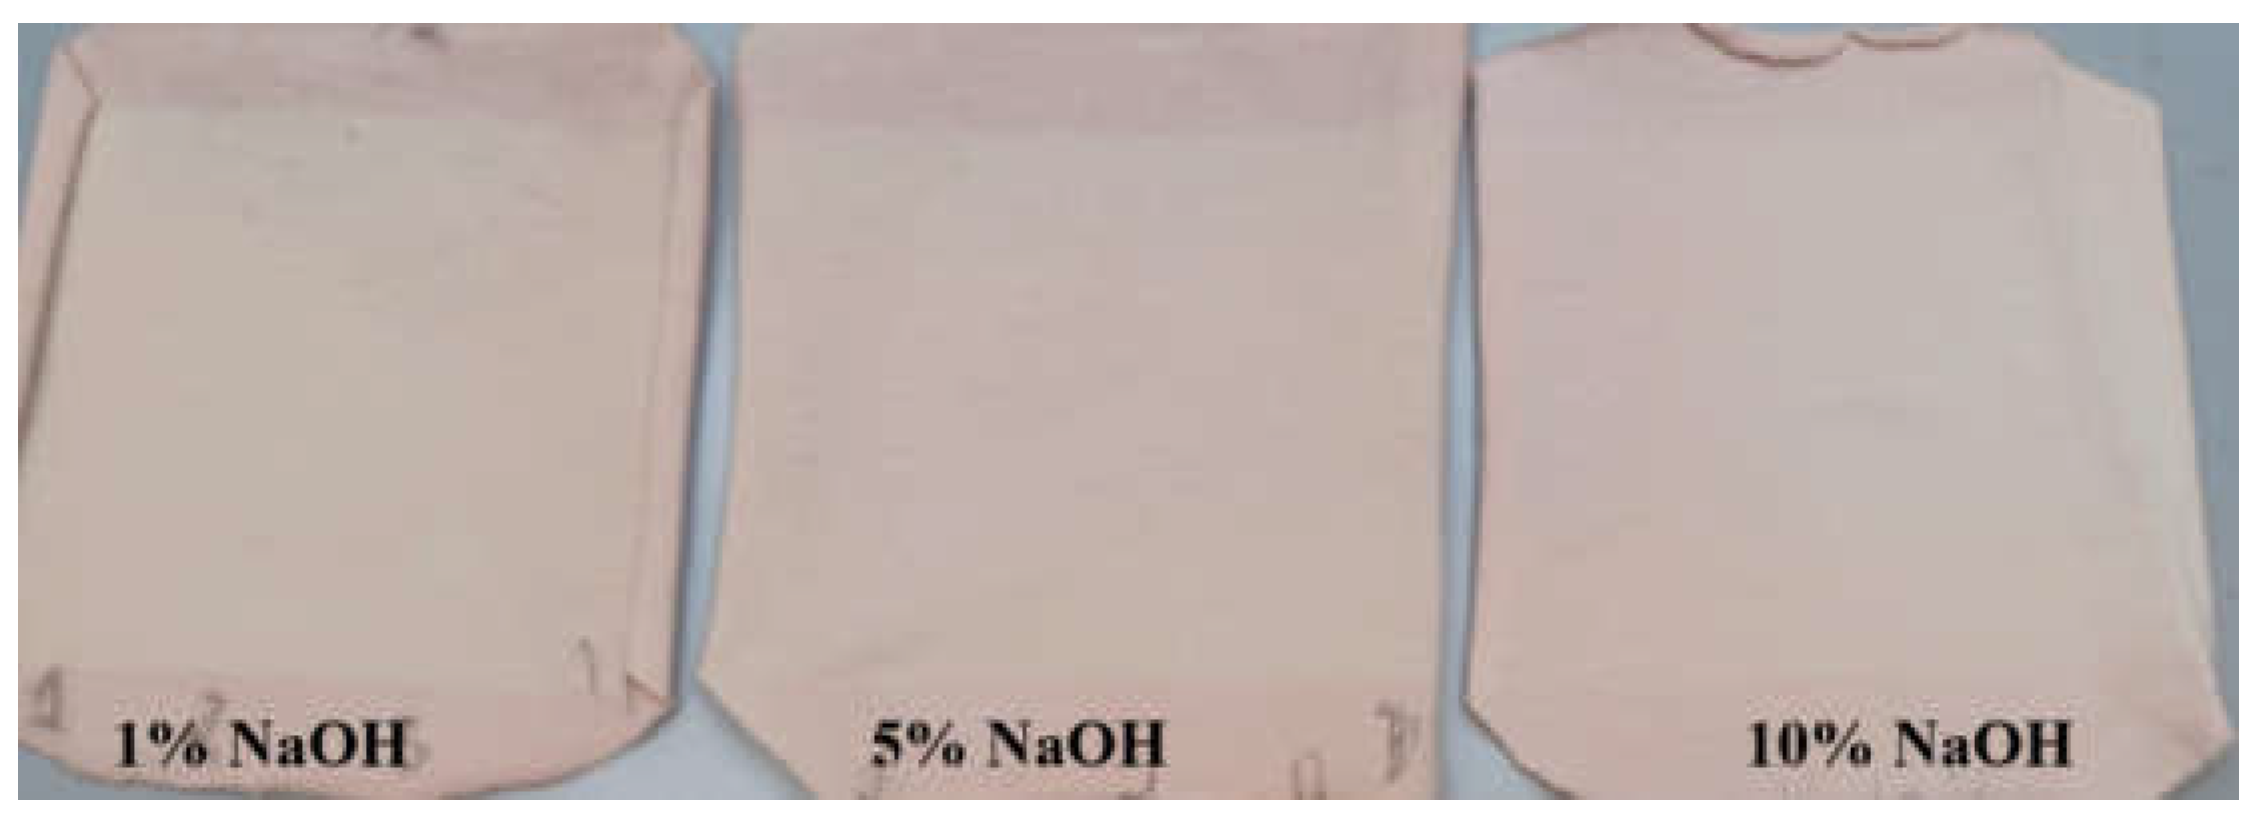
Figure 7.
Analysis of the ΔE* of colour fastness to light.
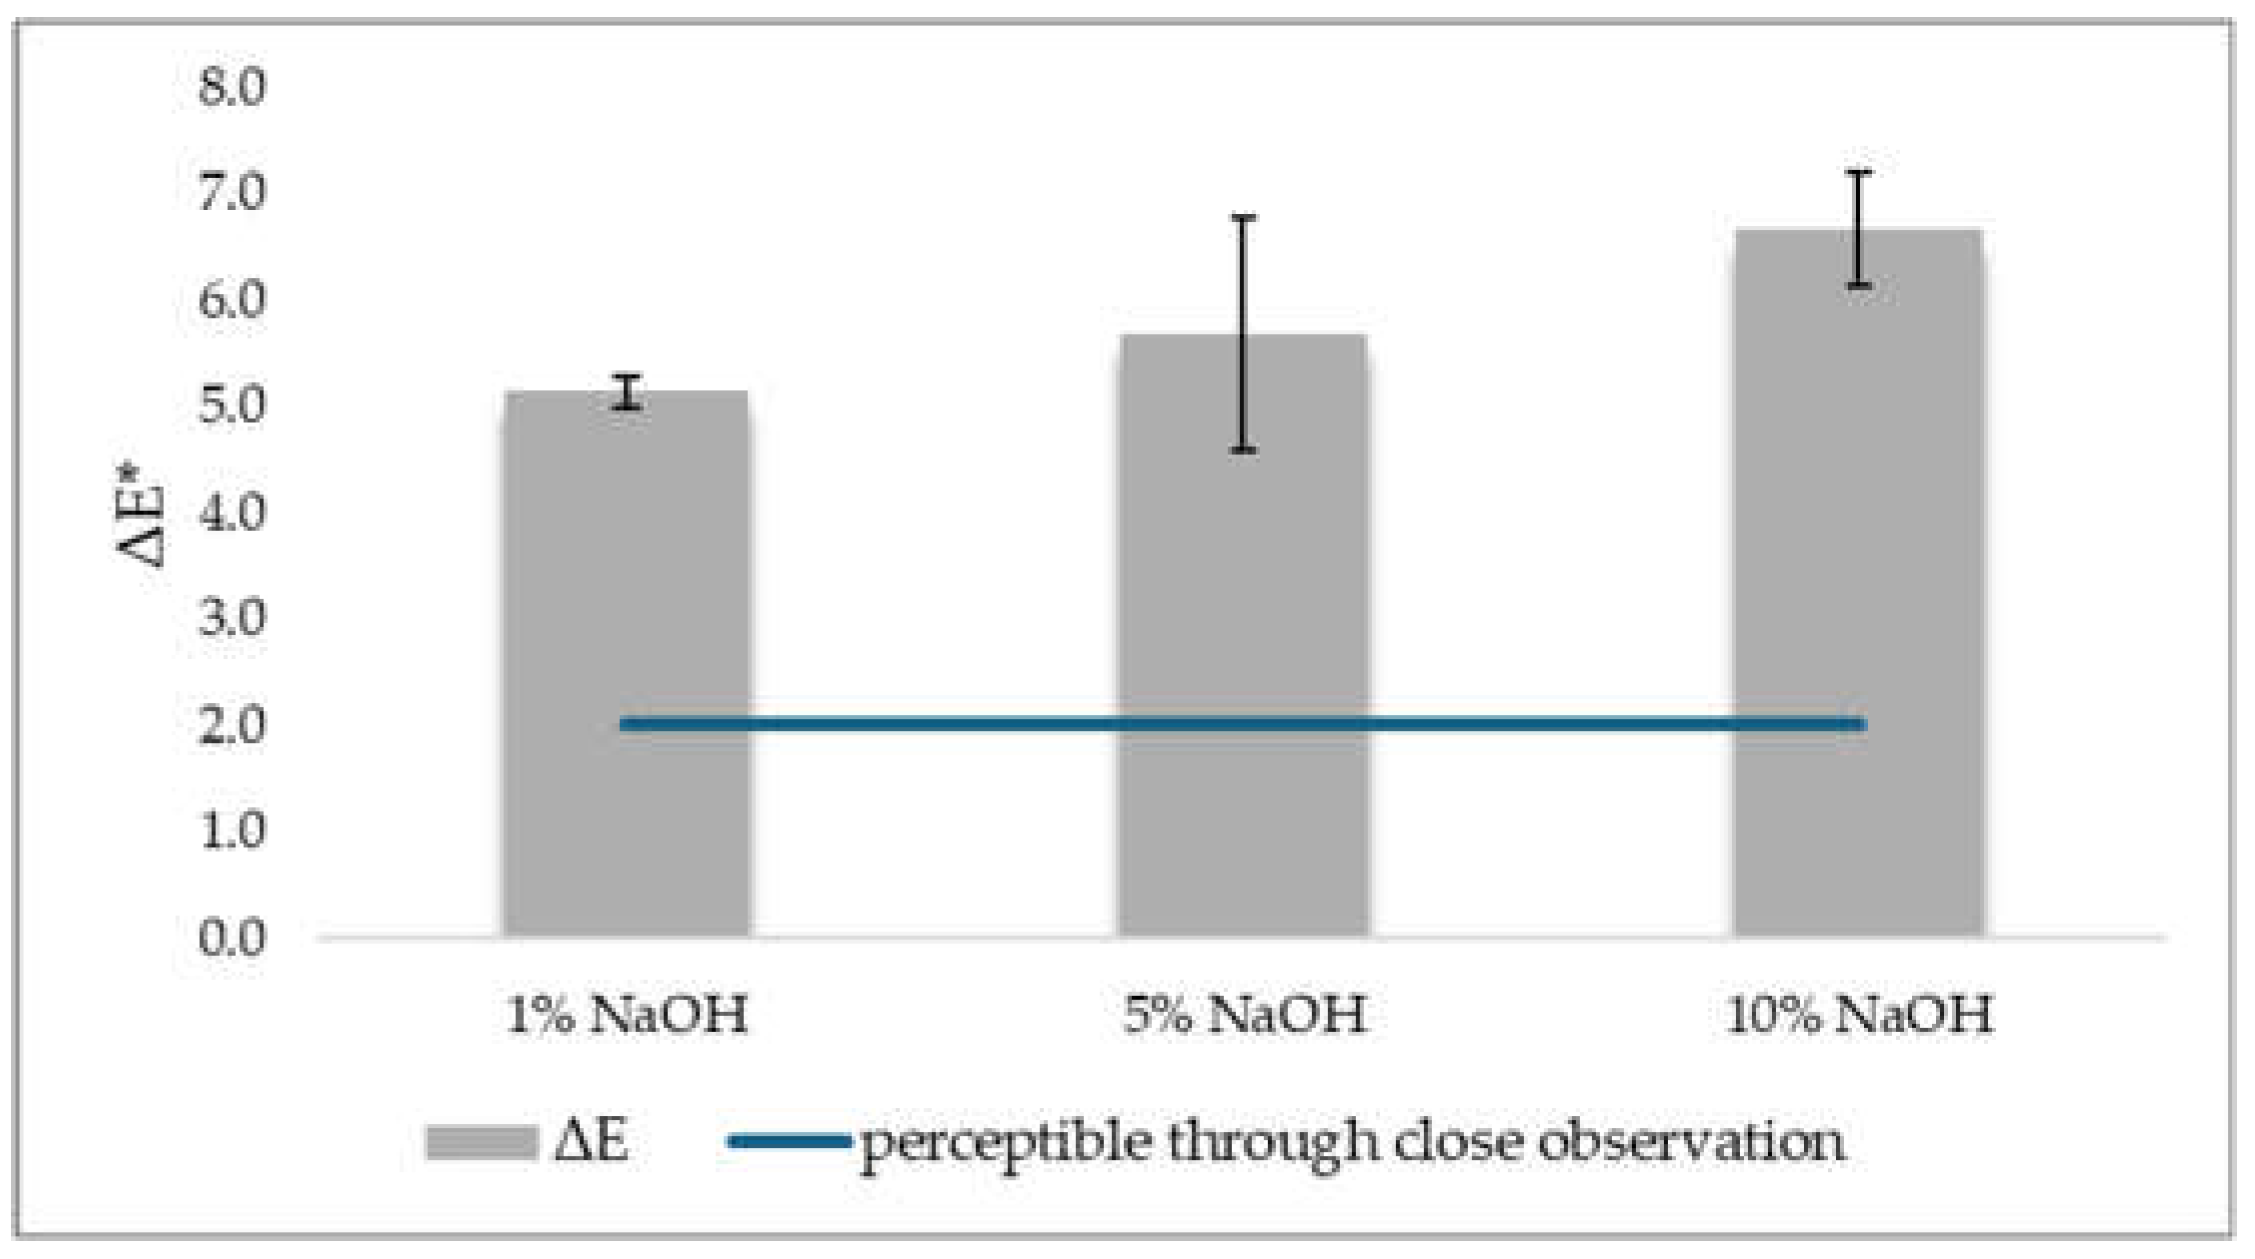
Figure 8.
Colour intensity of cotton meshes dyed with the pine cone waste extract obtained with different concentrations of NaOH. P 1% extraction with 1% NaOH; P 5% extraction with 5% NaOH; P 10% extraction with 10% NaOH, and cotton meshes dyed with the pine cone waste extract obtained with different concentrations of NaOH exposed to the light fastness test. P 1%F extraction with 1% NaOH; P 5% F extraction with 5% NaOH; P 10% F extraction with 10% NaOH.
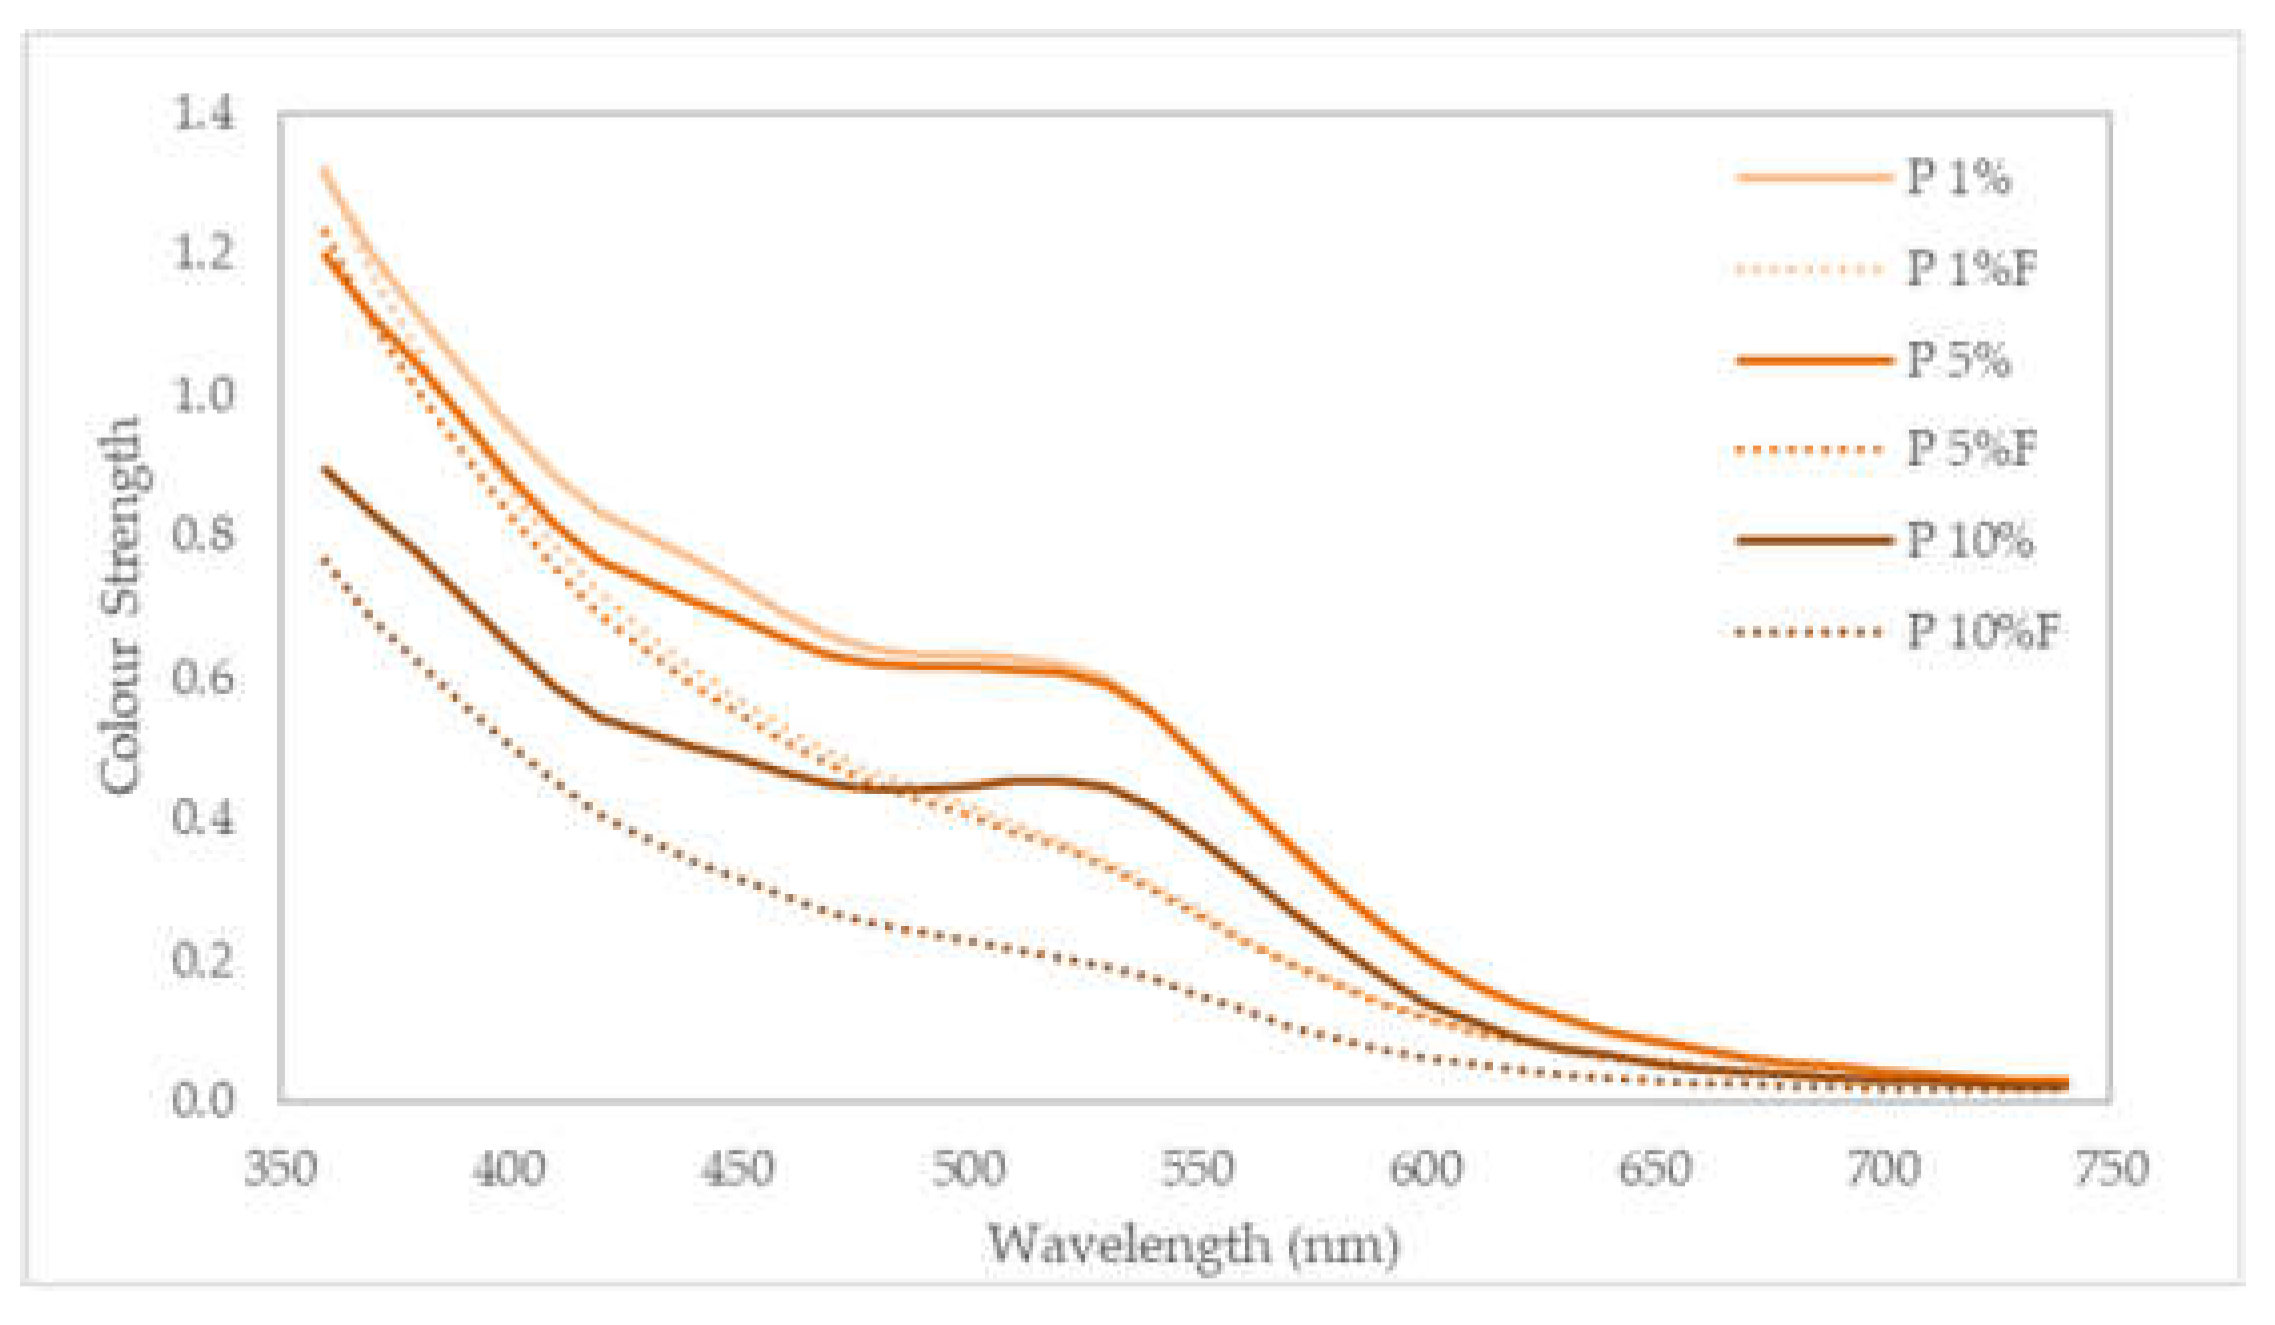
Figure 9.
Cotton mesh dyed with different concentrations of NaOH (1%, 5%, 10% NaOH) after wear caused by the water fastness test.
Figure 9.
Cotton mesh dyed with different concentrations of NaOH (1%, 5%, 10% NaOH) after wear caused by the water fastness test.
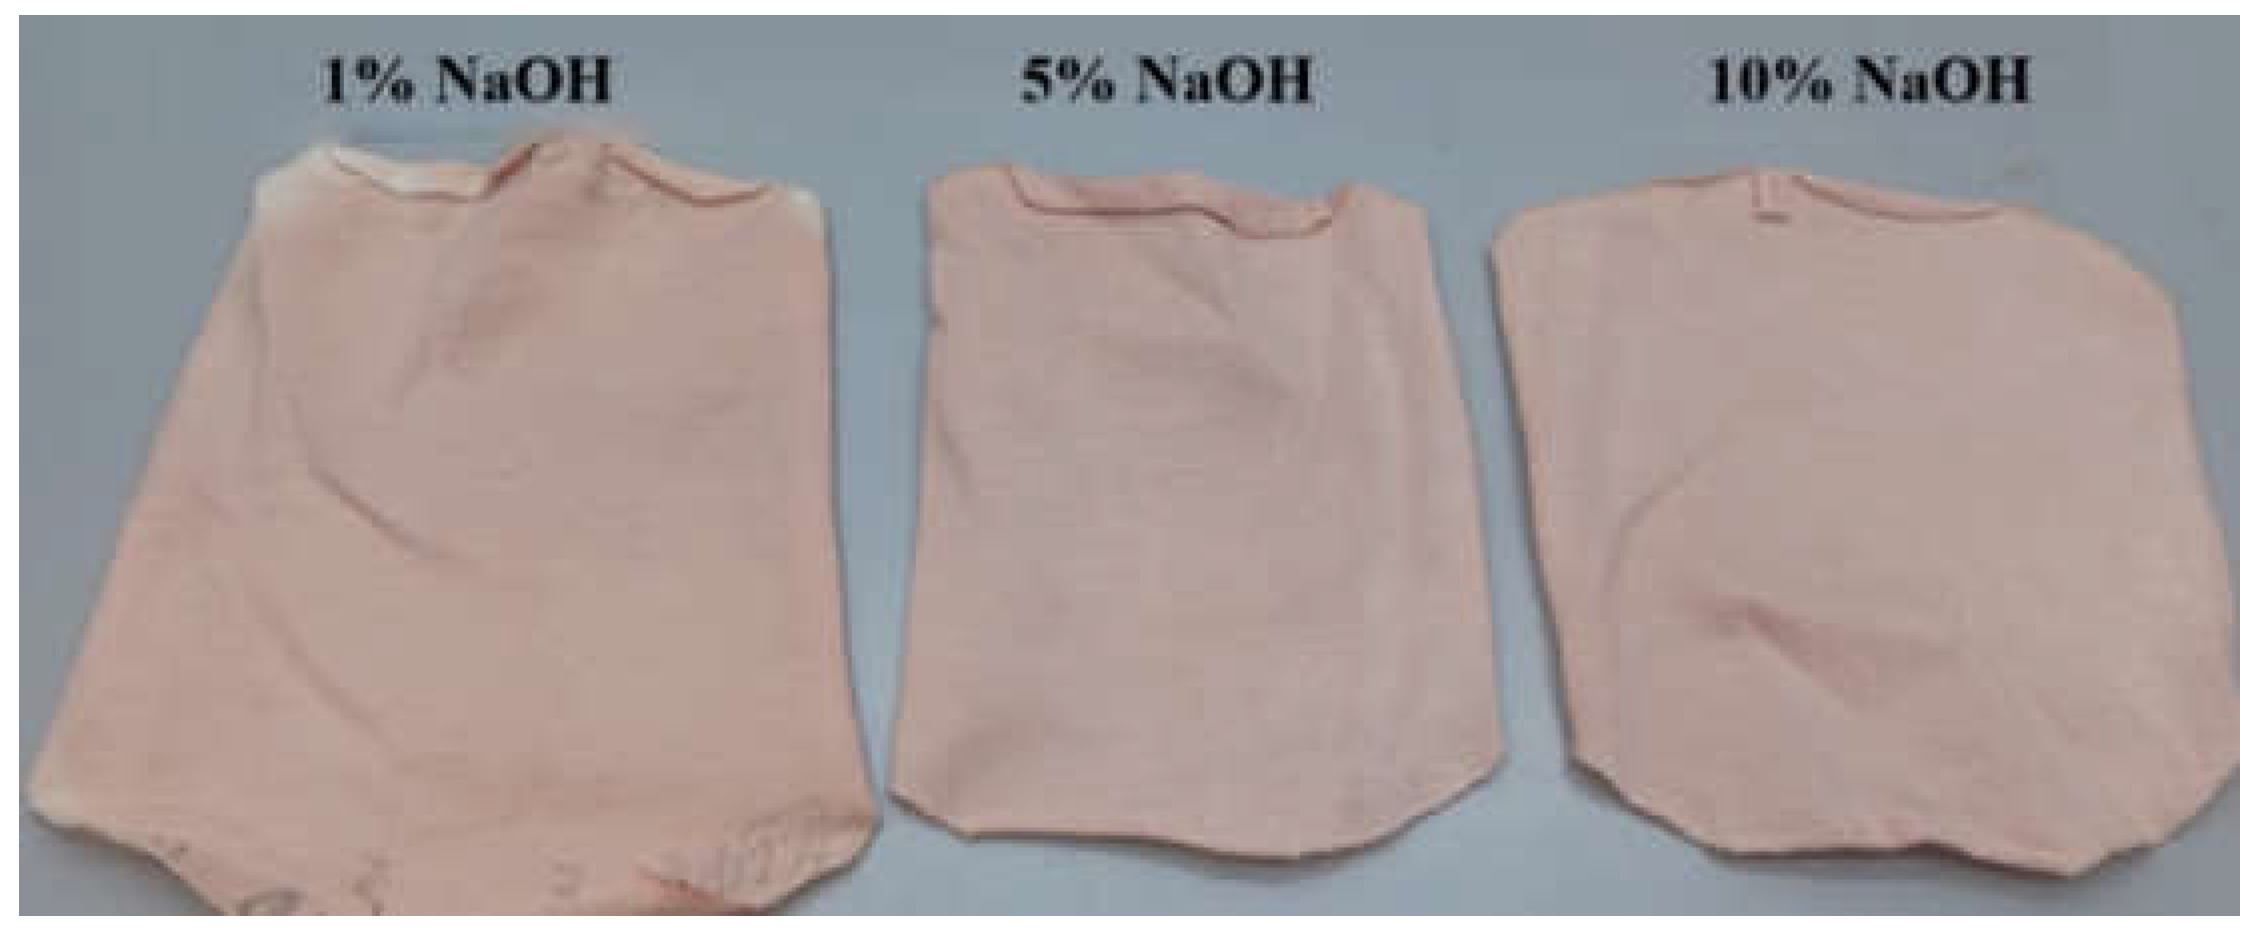
Figure 10.
Analysis of ΔE* of color fastness to water.
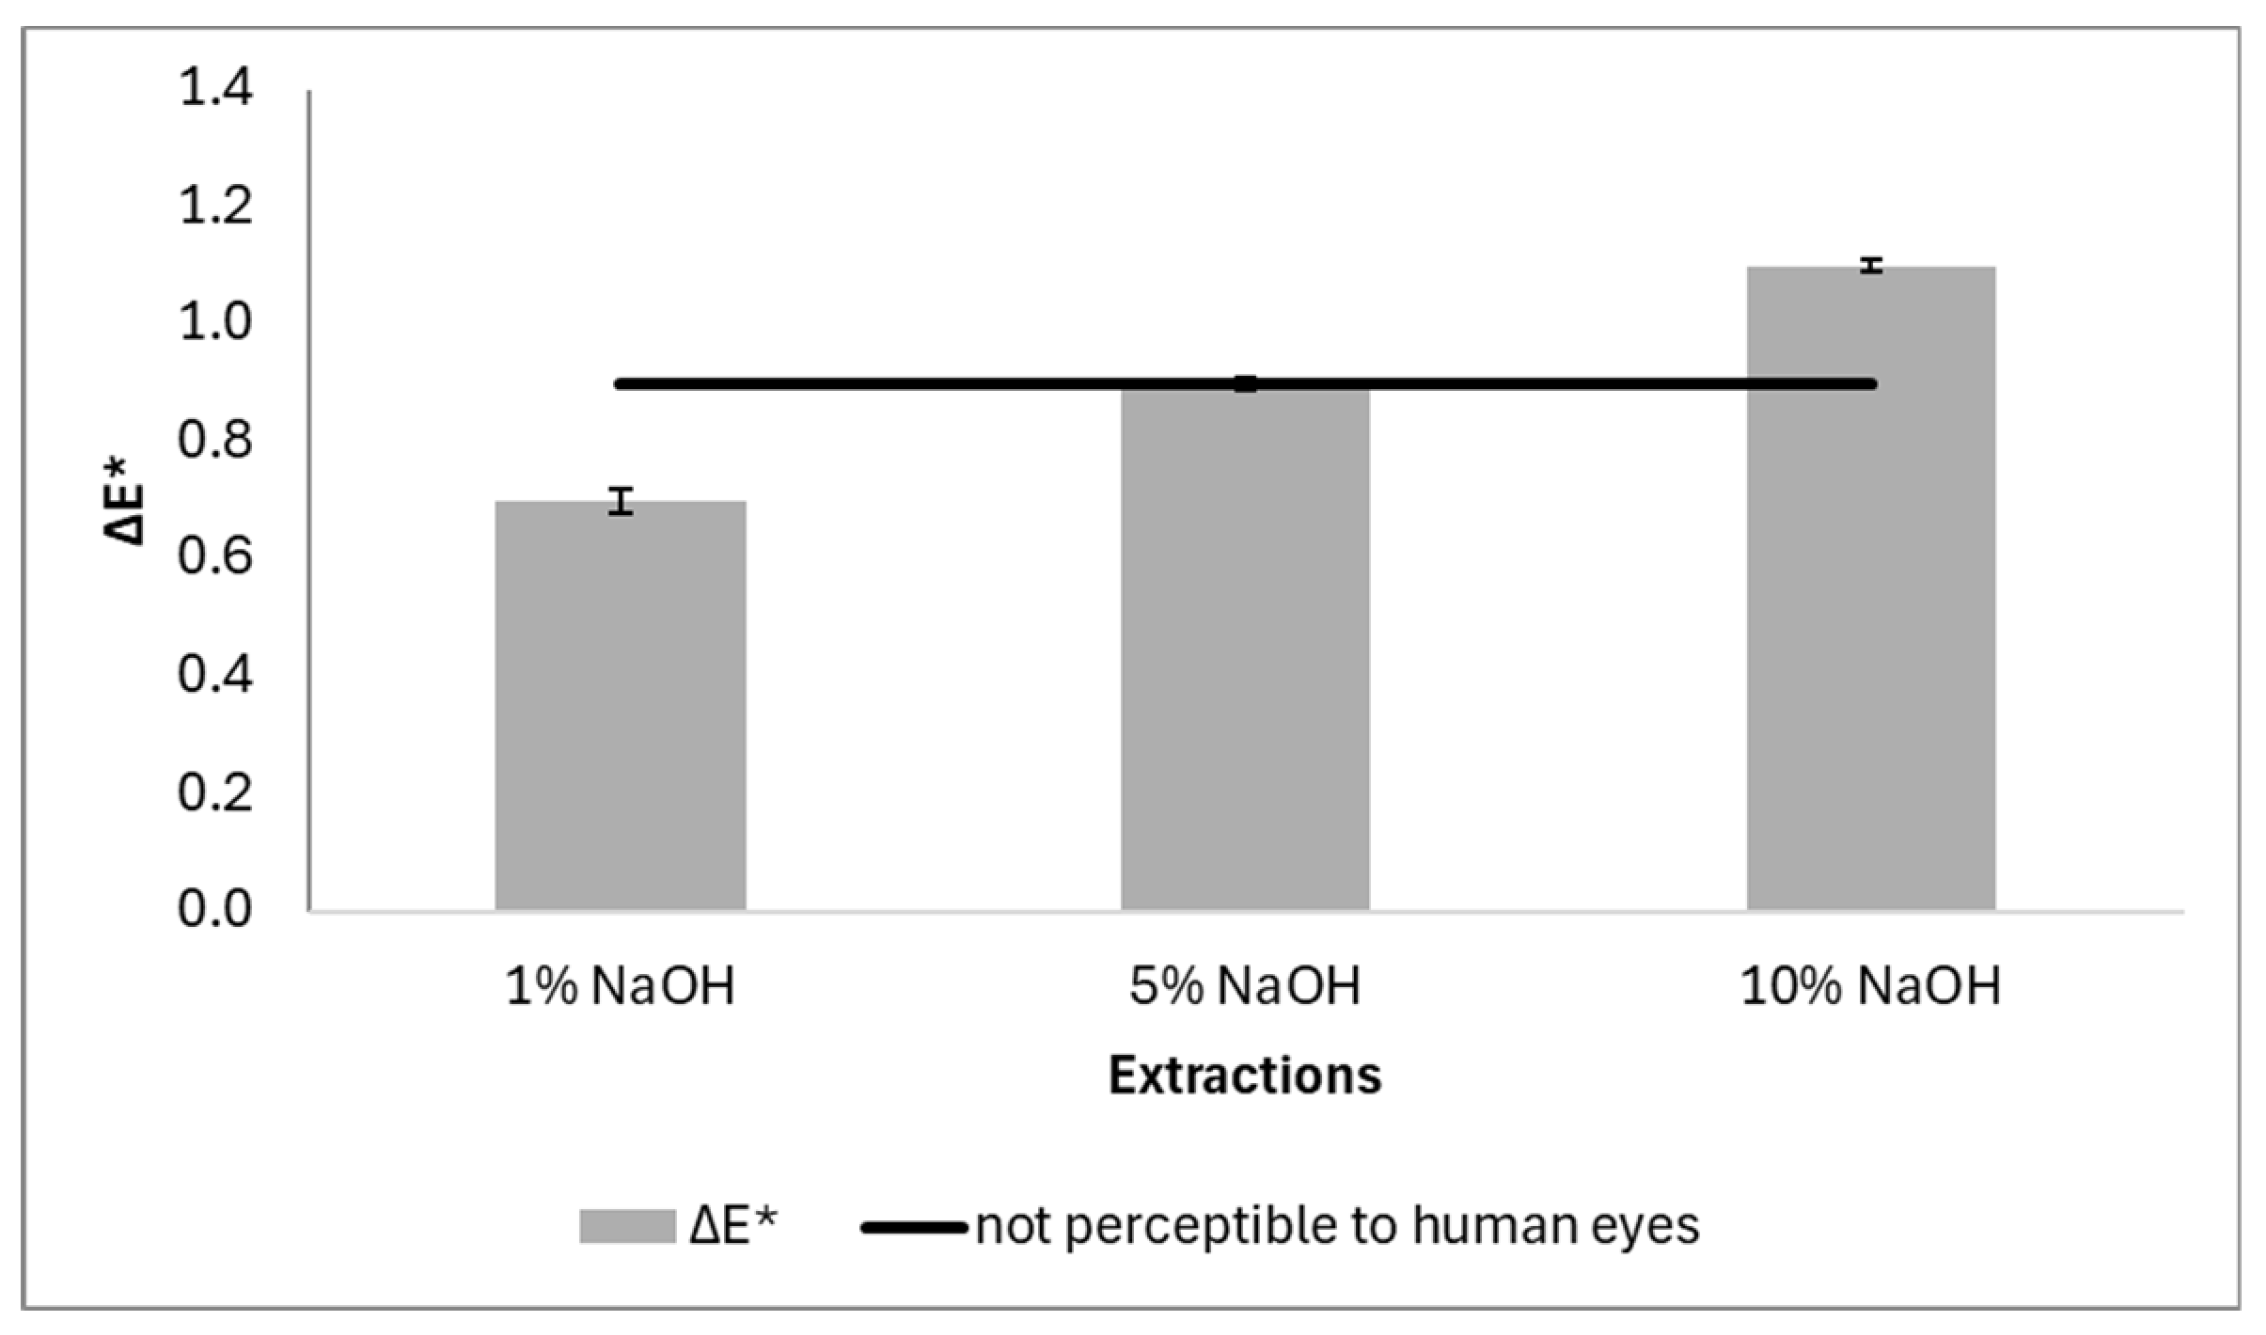
Table 2.
Colour characteristics after dyeing with pine cone extracts obtained with different concentrations of NaOH.
Table 2.
Colour characteristics after dyeing with pine cone extracts obtained with different concentrations of NaOH.
| Dyeing | L* | a* | b* | |||
| M | SD | M | SD | M | SD | |
| 1% | 71.0 | 1.3 | 13.6 | 0.6 | 13.3 | 1.1 |
| 5% | 71.1 | 1.1 | 13.7 | 0.2 | 12.0 | 0.7 |
| 10% | 74.5 | 1.4 | 13.4 | 0.5 | 10.3 | 0.5 |
Table 3.
Variation of L*, a*, b* and E* in the colour fastness to light.
| Dyeing | ΔL* | Δa* | Δb* | ΔE* | ||||
| M | SD | M | SD | M | SD | M | SD | |
| 1% | 5.5 | 0.4 | -4.1 | 0.4 | 3.7 | 0.3 | 5.1 | 0.1 |
| 5% | 5.7 | 1.9 | - 4.2 | 0.5 | 4.6 | 0.8 | 5.7 | 1.1 |
| 10% | 7.4 | 0.7 | - 5.7 | 0.4 | 3.8 | 0.5 | 6.7 | 0.5 |
1Note: M –Mean; SD – Standard deviation
Table 4.
Variation of L*, a*, b* and E* in the colour fastness to water.
| Dyeing | ΔL* | Δa* | Δb* | ΔE* | ||||
| M | SD | M | SD | M | SD | M | SD | |
| 1% | 0.2 | 0.7 | -0.2 | 0.4 | 0.8 | 0.1 | 0.7 | 0.2 |
| 5% | 1.2 | 0.2 | -0.3 | 0.1 | 0.9 | 0.3 | 0.9 | 0.1 |
| 10% | 1.2 | 0.2 | -0.4 | 0.1 | 1.1 | 0.1 | 1.1 | 1.1 |
1Note: M – Mean; SD – Standard deviation.
Disclaimer/Publisher’s Note: The statements, opinions and data contained in all publications are solely those of the individual author(s) and contributor(s) and not of MDPI and/or the editor(s). MDPI and/or the editor(s) disclaim responsibility for any injury to people or property resulting from any ideas, methods, instructions or products referred to in the content. |
© 2025 by the authors. Licensee MDPI, Basel, Switzerland. This article is an open access article distributed under the terms and conditions of the Creative Commons Attribution (CC BY) license (http://creativecommons.org/licenses/by/4.0/).
Copyright: This open access article is published under a Creative Commons CC BY 4.0 license, which permit the free download, distribution, and reuse, provided that the author and preprint are cited in any reuse.


