Submitted:
18 March 2025
Posted:
19 March 2025
You are already at the latest version
Abstract
(1) Background: The misuse of transformation technology using medical images is a critical problem that can endanger patients’ lives, and detecting manipulation via a deep learning model is essential to address issues of manipulated medical images that may arise in the healthcare field. (2) Methods: The dataset was divided into a real fundus dataset and a manipulated dataset. The fundus image manipulation detection model uses a deep learning model based on a Convolution Neural Network (CNN) structure that applies a concatenate operation for fast computation speed and reduced loss of input image weights. (3) Results: According to the fundus image manipulation detection model’s results, for the real data, the four lesions had average sensitivity = 0.98, precision = 1.00, and F1-score = 0.99. For the manipulated data, the average sensitivity = 1.00, precision = 0.84, and F1-score = 0.92. The average Area Under the Curve (AUC) for the four lesions was 0.988, which is relatively high. Subsequently, to confirm whether the fundus image manipulation detection model can operate effectively in actual clinical environments, the model’s outcomes were compared with those of five ophthalmologists. For real data, the four lesions showed an average sensitivity = 0.93, precision = 0.96, and F1-score = 0.95, whereas for manipulated data, the average sensitivity = 0.71, precision = 0.61, and F1-score = 0.65. The four lesions also had an average AUC = 0.822, which was lower than the results of the fundus image manipulation detection model across all metrics. (4) Conclusions: This study presents the possibility of addressing and preventing problems caused by manipulated medical images in the healthcare field. The proposed approach for detecting manipulated fundus images through a deep learning model demonstrates higher performance than that of ophthalmologists, making it an effective method.
Keywords:
deep learning
; fundus image
; manipulation
; concatenate
; medical image
1. Introduction
The advancement of image processing techniques using deep learning has led to a surge of research across various fields [1]. Among these techniques, image transformation technology employs an AI model to modify images through generation, alteration, and feature addition [2]. Such technology can facilitate the restoration of severely damaged images or enable digital mapping from satellite photographs, making it possible to augment deficient training datasets for deep learning models. Moreover, a research institute at the University of Lübeck in Germany published a paper on an AI system that demonstrated outstanding performance in cancer diagnosis by leveraging image transformation techniques [3]. In the study by Frid-Adar et al. [4], a Generative Adversarial Network(GAN) model was used to create synthetic medical images in order to address the difficulty of acquiring medical data. By using GAN-based data augmentation, the performance of a Convolutional Neural Network (CNN) for liver lesion classification was improved. They compared CNN performance when trained with both original and generated data, and finally validated the synthetic liver lesion images through specialist evaluation. Similarly, in the work of Lee et al. [5], research was carried out on generating mammography images via GAN to overcome limitations in medical research, such as anonymization of sensitive patient information and high labeling costs. Thus, image transformation technology has been applied to constructive purposes—especially in medical fields with limited data availability—leading to many studies on the manipulation or generation of medical images [4,5,6,7].
Although various approaches have been proposed to address difficulties in obtaining clinical data, few have focused on preventing the misuse of these techniques. Recently, image transformation technology has triggered numerous controversies under the name “Deep-Fake” [8,9]. This emerging possibility of misuse is especially concerning in the medical field, where the malicious use of transformation techniques poses a critical risk to patient safety. Furthermore, the abuse of image manipulation technology can lead to a variety of serious problems.
As of 2017, the precision medicine market stands at 47.47 billion USD, growing at an annual rate of 13.3%. Alongside the sector’s expansion, the number of clinical trial approvals required to validate the clinical efficacy of emerging medical products is steadily rising [10]. Image transformation technology could be misused to falsify patient eligibility or clinical conditions, thereby circumventing transparent testing and validation efforts [11]. Moreover, because Institutional Review Board (IRB) approval is mandatory for most medical research, it is possible for manipulated medical images to be inappropriately submitted for institutional clearance. With the rapid digitalization of societal systems, including healthcare reimbursement, the potential for manipulating or fabricating clinical images to claim unwarranted insurance coverage also increases [12]. In fact, advanced image transformation techniques that blur the distinction between real and artificially generated medical data can be exploited to fabricate or alter medical documentation [11,13].
Such manipulation technology affects not only the medical industry but also any sector that relies on image-based data, thereby posing significant social challenges. Although numerous studies on image transformation have emerged, relatively few have focused on detecting these fabricated images. Given the rising prevalence of fake images and the potentially fatal consequences of image manipulation in medicine, conducting research on the detection of manipulated images has become a critical priority.
In this study, we propose a model designed to detect manipulated medical images in the healthcare domain. Specifically, we focus on detecting alterations in fundus images generated through a previously developed deep learning model and comparing the performance of our detection approach against expert evaluations by ophthalmologists.
2. Previous Research
In a previous study [14], we proposed a deep learning based medical image generation model to address the difficulties involved in securing adequate medical data, especially given the relative scarcity of abnormal lesion data compared to normal data, by focusing on fundus images.
This earlier work utilized the “Ocular Disease Intelligent Recognition” dataset from Kaggle [15] to compile training data for four categories of fundus images: normal, diabetic retinopathy, glaucoma, and macular degeneration. To ensure data consistency and quality, a systematic screening and preprocessing procedure was performed, yielding a final set of 356 high-quality fundus images.
The image generation model introduced in the previous study employed a Res U-Net architecture, which combines a U-Net structure with Residual Blocks (Figure 1). This approach effectively generated images that closely resembled the original data, outperforming the conventional U-Net. In the quantitative evaluation of image similarity (Table 1), the Res U-Net model excelled over the standard U-Net in three metrics—Root Mean Square Error (RMSE), Structural Similarity Index Map (SSIM), and Fréchet inception distance (FID)—showing a particularly remarkable eightfold improvement in FID, which indicates a notable enhancement in image quality.
Moreover, to verify the clinical effectiveness of the generated images, ophthalmologists were asked to assess them. The images produced by the Res U-Net model appeared visually very similar to genuine fundus images, to the extent that about 30% of the samples could not be reliably distinguished as original or regenerated. These findings suggest that the Res U-Net approach offers even greater potential than a conventional U-Net for clinical application as a reliable medical image generation model.
While our previous research confirmed the feasibility of generating fundus images through deep learning, it did not explore the possibility of these generated images being misused. Recognizing the mounting social concerns over deepfake technology and its potential malicious use in healthcare, we extended our work to investigate methods for detecting deep learning– manipulated fundus images.
3. Data Configuration
For the detection of manipulated fundus images in this study, we used real and manipulated fundus images derived from over 6,000 raw images in the “Ocular Disease Intelligent Recognition” dataset [15] previously employed in our work. Additionally, to develop a detection model capable of handling various manipulation techniques, we included manipulated images generated by a Cycle GAN in our training. This step was taken to prevent an artificially inflated detection performance that might occur if the manipulated images were solely derived from the original image features. Moreover, since clinical settings may present a broad spectrum of manipulated data, we assembled the model’s dataset using a variety of image sources. For Cycle GAN training, we used Kaggle’s “MESSIDOR-2 DR Grades” and “Glaucoma Detection” datasets, both of which consist of fundus images and accompanying physician annotations [16,17].
Table 2 summarizes the dataset used to train and test our deep learning model for detecting manipulated fundus images. For the Normal category, we used 350 real images and 214 manipulated images; for Glaucoma, 203 real images and 125 manipulated; for Diabetic Retinopathy, 398 real images and 147 manipulated; and for Macular Degeneration, 217 real images and 129 manipulated. In total, we used 1,168 real images and 615 manipulated images. Among these, the test set consisted of randomly selected data: 90 real images and 10 manipulated images for each category, including Normal and all three disease groups.
4. Manipulated Fundus Image Detection Model
Our manipulated fundus image detection model takes as input both genuine fundus images, sized 256 × 256 × 3, and manipulated images generated by a separate manipulation model. The model architecture is a CNN that incorporates a Concatenate operation to achieve fast computation while mitigating the loss of weight information from the input images. Its relatively simple structure allows for rapid yet precise detection.
Figure 2 illustrates the structure of the detection model. Apart from the first layer and the final flattening layer, the network comprises four layers, each containing two 2D convolutional layers, a concatenate layer, and a pooling layer. As input images move through the pooling and convolutional layers, the model extracts salient features of the fundus images. Similar to the contraction path in U-Net, the feature map size is halved at each stage, while the number of channels is doubled. To address the issue of weight loss that grows with each additional deep-learning layer, the model integrates a concatenate layer that connects to the previous pooling layer.
After completing the operations in the fifth layer, the tensor assumes a shape of 8 × 8 × 128, which is then passed on to the flattening layer. Here, the data are converted into a one-dimensional array, forming a flattened matrix of 8,192 elements. Through subsequent fully connected layers, the number of elements in the flattened matrix is progressively reduced. Ultimately, the model classifies each fundus image as either genuine or manipulated.
Our detection model is designed to minimize feature loss during the convolution process, which is critical because detecting manipulated images hinges on both raw pixel values and the differences among them. Consequently, the concatenate layer helps preserve these essential feature values.
Developed to prevent the misuse of image generation technologies in healthcare, this detection model can rapidly determine whether medical data have been manipulated, and it is engineered to handle various types of manipulated content that may appear in actual clinical practice.
5. Result
5.1. Performance of the Manipulated Fundus Image Detection Model
In this study, we used 1,168 real fundus images and 615 manipulated fundus images to verify the detection performance of the fundus image manipulation detection model. Of these, 808 real fundus images and 575 manipulated fundus images were used for model training, while 360 real fundus images and 40 manipulated fundus images were used for model testing. In the case of the test data, the same number was constructed in all lesions for comparison of the results with the detection test by an ophthalmologist to be described later.
To quantitatively evaluate the fundus image manipulation detection model, four metrics derived from the confusion matrix were used: sensitivity, precision, F1-score, and Area Under the Curve (AUC). Sensitivity indicates how well an AI model identifies true positives in statistical classification; in a study such as this one, aimed at detecting manipulated data, incorrect classification results can cause serious problems, thus sensitivity is indispensable. Precision represents how accurately the model’s predicted positives match actual positives, and by calculating precision, we can establish the reliability of the AI model’s classification performance. This must be computed to improve and enhance the model’s classification performance. The F1-score, which is the harmonic mean of precision and sensitivity, is used to reduce distortions that may arise between the two metrics. In this study, since the number of manipulated data points is smaller than that of real data, a group-based quantitative evaluation is necessary, and thus the F1-score is used. Lastly, the AUC is widely employed in classification studies as it provides a comprehensive performance metric over all possible classification thresholds.
Table 3 shows the results for sensitivity, precision, and F1-score among the model’s detection metrics for manipulated fundus images. In detecting real data, the Normal category achieves a sensitivity of 0.98, a precision of 1.00, and an F1-score of 0.99. Glaucoma and Macular Degeneration record sensitivity 0.99, precision 1.00, and F1-score 0.99, respectively. For Diabetic Retinopathy, the sensitivity is 0.96, precision 1.00, and F1-score 0.98. All disease categories’ detection results for real data approach 1.00 in these metrics, indicating that the fundus image manipulation detection model in this study provides excellent performance on real data.
In the detection results for manipulated fundus images, Normal shows a sensitivity of 1.00, a precision of 0.83, and an F1-Score of 0.91. Glaucoma shows a sensitivity of 1.00, a precision of 0.91, and an F1-Score of 0.95. In the case of diabetic retinopathy, sensitivity is 1.00, precision is 0.71, and F1-Score is 0.83. Macular degeneration shows a sensitivity of 1.00, a precision of 0.91, and an F1-Score of 0.99.
Among these detection results, the Normal and diabetic retinopathy images show lower values compared to other lesions. However, the difference is not significant, and glaucoma and macular degeneration exhibit high metric values.
Table 4 shows the AUC results for the fundus image manipulation detection model. The Normal category’s AUC is 0.989, Glaucoma and Macular Degeneration are both 0.994, and Diabetic Retinopathy is 0.978. Contrary to the lower values recorded for Normal and Diabetic Retinopathy in the manipulated-data detection results of Table 3, each lesion’s detection performance in the manipulation detection model exceeds a 97% detection rate. In particular, Glaucoma achieves a high detection rate of 99.4%, which demonstrates that this fundus image manipulation detection model can accurately distinguish between real fundus images and manipulated images.
5.2. Detection Results of Manipulated Fundus Images by Ophthalmologists
In this study, to verify whether the fundus image manipulation detection model can function effectively in actual clinical settings, we conducted a detection test for manipulated fundus images with ophthalmologists. For each lesion, the data requested comprised 45 original fundus images and 5 manipulated fundus images, and the ophthalmologists were asked to identify manipulated images from a randomly mixed set. A total of five ophthalmologists participated, each affiliated with a different institution. Because the detection of manipulated fundus images takes place in diverse clinical environments, it is possible to compare and rigorously evaluate the clinical effectiveness of the fundus image manipulation detection model.
In detecting manipulated fundus images, no patient information for the manipulated images was provided, and the same procedure was applied for the real fundus images. This was intended to minimize the impact that missing patient information could have on the ophthalmologists’ detection of manipulated fundus images. Each metric was expressed as an average of the detection scores of the five ophthalmologists. This is because it is more important to grasp the average detection ability than to assess each ophthalmologist’s individual capacity for detecting manipulated images.
Table 5 presents the sensitivity, precision, and F1-score results among the detection metrics for the manipulated fundus images evaluated by ophthalmologists. For real data detection, Normal shows a sensitivity of 0.91, precision of 0.98, and F1-score of 0.94. Glaucoma shows a sensitivity of 0.92, precision of 0.95, and F1-score of 0.93. In the case of diabetic retinopathy, sensitivity is 0.93, precision is 0.96, and F1-score is 0.94. Macular degeneration shows a sensitivity of 0.97, precision of 0.96, and F1-score of 0.97. Although the indices for each lesion in detecting real data are all high, they are somewhat lower than the detection performance of the manipulation detection model proposed in this study.
Regarding the detection of manipulated fundus images, Normal shows a sensitivity of 0.88, precision of 0.67, and F1-score of 0.76. Glaucoma shows a sensitivity of 0.60, precision of 0.45, and F1-score of 0.51. In the case of diabetic retinopathy, sensitivity is 0.64, precision is 0.61, and F1-score is 0.61. Macular degeneration shows a sensitivity of 0.72, precision of 0.74, and F1-score of 0.72. Compared with the manipulation detection model, the ophthalmologists’ results for detecting manipulated data are lower overall, and the difference is particularly large for glaucoma and diabetic retinopathy.
Table 6 shows the AUC results among the ophthalmologists’ detection outcomes for manipulated fundus images. Normal shows an AUC of 0.895, while Glaucoma exhibits the lowest figure at 0.762. Diabetic retinopathy shows an AUC of 0.788, indicating a similar detection performance to glaucoma, and macular degeneration shows an AUC of 0.844. Overall, the ophthalmologists’ manipulated fundus image detection results reveal lower AUC values compared to the manipulation detection model.
6. Discussion
In this study, we conducted research on the possibility of detecting manipulated medical images using a deep learning model, aiming to resolve the issue of medical image manipulation that can arise in the healthcare domain. We performed our experiments based on fundus images generated by a previously studied deep learning model, and then compared and verified the results of the manipulation detection model with those of 5 ophthalmologists.
When examining the detection results of the manipulated fundus image model using both manipulated and real data, the real data showed an average sensitivity of 0.98, precision of 1.00, and F1-score of 0.99 for four lesion types. For the manipulated data, the four lesions showed an average sensitivity of 1.00, precision of 0.84, and F1-score of 0.92. In addition, the average AUC for these four lesions was 0.988, which is a high value, and each lesion exhibited a detection performance of over 97%.
After comparing the four metrics used to quantitatively evaluate the fundus image manipulation detection model, this study’s fundus image manipulation detection model showed generally high values across all lesions. While the Normal and Diabetic Retinopathy images among the manipulated data displayed relatively lower values in sensitivity, precision, and F1-score, the AUC result, which indicates the detection rate of the manipulation detection model, was high for every lesion. Therefore, it is judged that this fundus image manipulation detection model is not affected by manipulation methods such as Cycle GAN or Res U-Net and exhibits excellent performance in detecting manipulated fundus images.
Afterward, this study compared the results of the fundus image manipulation detection model with those of ophthalmologists to verify whether the model could function effectively in actual clinical settings. For real data, the four lesions showed an average Sensitivity of 0.93, Precision of 0.96, and F1-Score of 0.95. For manipulated data, the four lesions showed an average Sensitivity of 0.71, Precision of 0.61, and F1-Score of 0.65. In addition, the average AUC for the four lesions was 0.822, which was lower than the results of the fundus image manipulation detection model for all metrics. In the case of real data, the performance was similar to the model proposed in this study, but each metric for manipulated data was lower by about 0.29 in Sensitivity, 0.23 in Precision, 0.27 in F1-Score, and 0.166 in AUC.
It appears that factors such as missing patient information or the relatively low quality of certain fundus images played a role. Because detection was conducted without knowledge of image manipulation using a deep learning model, the lack of clear criteria for manipulation detection also seems to have contributed to the low detection rate.
Through this study, we confirmed that the fundus image manipulation detection model shows excellent performance, but there are several limitations, which we plan to address in future research. First, we utilized three open datasets to train the fundus image manipulation detection model and used data manipulated through Cycle GAN and Res U-Net. Although we used three datasets and two manipulation methods for application in real clinical environments, it is necessary to employ datasets gathered from actual multicenter settings rather than only open datasets, and to conduct research with a broader variety of manipulated data than those presented here. Second, our research is limited to detecting manipulation in fundus images among medical imaging data. Because medical imaging data can be acquired in numerous ways, issues with manipulated medical data can occur in any field, so it is important to establish manipulation detection technologies for various areas. Third, the relatively low detection performance by ophthalmologists may have been caused by the low quality of certain manipulated fundus images. This means that manipulated images must be generated at the same level of image quality as those collected in actual clinical settings, and through this, accurate comparison of detection performance becomes possible.
7. Conclusions
In this study, research was conducted to detect manipulated fundus images through a deep learning model in order to address and prevent problems that may arise from image manipulation technology in the medical field. The results of the fundus image detection model were also compared with those of an ophthalmologist. First, the dataset used in the study was divided into real fundus data and manipulated data. To build a model capable of detecting fundus images manipulated in various ways, we included fundus images generated by Res U-Net from a previous study and fundus images generated by Cycle GAN, comprising a total of 1,168 real data and 615 manipulated data. After that, the fundus image manipulation detection model used in this study is a deep learning model with a CNN structure that applies the concatenate operation. The model for detecting manipulated fundus images was designed for fast computation speed and to reduce the loss of input image weights.
According to the results of the fundus image manipulation detection model, for real data, the four lesions showed an average Sensitivity of 0.98, Precision of 1.00, and F1-Score of 0.99, while for manipulated data, the four lesions showed an average Sensitivity of 1.00, Precision of 0.84, and F1-Score of 0.92. In addition, the four lesions had an average AUC of 0.988, which was a high value. After that, in order to verify whether the fundus image manipulation detection model could function effectively in actual clinical settings, the study compared its results with those of an ophthalmologist based on the manipulation detection model’s outcomes. In the case of real data, the four lesions showed an average Sensitivity of 0.93, Precision of 0.96, and F1-Score of 0.95, while for manipulated data, they showed an average Sensitivity of 0.71, Precision of 0.61, and F1-Score of 0.65. In addition, the four lesions had an average AUC of 0.822, which was lower than the results of the fundus image manipulation detection model in all metrics. Therefore, it can be said that the manipulation detection model in this study is not affected by manipulation methods such as Cycle GAN or Res U-Net and shows excellent manipulation detection performance for fundus images.
Author Contributions
Conceptualization, H.J.S. and Y.S.K.; methodology, H.J.S. and Y.S.K.; software, H.J.S. and J.H.H.; validation, Y.S.C.; formal analysis, H.J.S. and J.H.H.; investigation, H.J.S. and Y.S.K.; resources, H.J.S. and J.H.H.; data curation, H.J.S. and J.H.H.; writing—original draft preparation, H.J.S.; writing—review and editing, H.J.S. and Y.S.K.; visualization, H.J.S. supervision, Y.S.K.; project administration, Y.S.K.; funding acquisition, Y.S.K.; All authors have read and agreed to the published version of the manuscript.
Funding
This research was supported by a grant of the Information and Communications Promotion Fund through the National IT Industry Promotion Agency (NIPA), funded by the Ministry of Science and ICT (MSIT), Republic of Korea.
Institutional Review Board Statement
Not applicable.
Informed Consent Statement
Not applicable.
Data Availability Statement
The dataset used in this study, “Ocular Disease Intelligent Recognition”, “MESSIDOR-2 DR Grades”, “Glaucoma Detection”, is publicly available from Kaggle and does not involve directly identifiable patient data.
Conflicts of Interest
The authors declare no conflicts of interest.
References
- Dhamo, H.; Farshad, A.; Laina, I.; Navab, N.; Hager, G.D.; Tombari, F.; Rupprecht, C. Semantic image manipulation using scene graphs. In Proceedings of the IEEE/CVF conference on computer vision and pattern recognition; 2020; pp. 5213–5222. [Google Scholar]
- Zhu, J.Y.; Park, T.; Isola, P.; Efros, A.A. Unpaired image-to-image translation using cycle-consistent adversarial networks. In Proceedings of the IEEE international conference on computer vision; 2017; pp. 2223–2232. [Google Scholar]
- Uzunova, H.; Ehrhardt, J.; Jacob, F.; Frydrychowicz, A.; Handels, H. Multi-scale gans for memory-efficient generation of high resolution medical images. In Medical Image Computing and Computer Assisted Intervention–MICCAI 2019: 22nd International Conference, Shenzhen, China, 13-17 October 2019; pp. 112-120.
- Frid-Adar, M.; Diamant, I.; Klang, E.; Amitai, M.; Goldberger, J.; Greenspan, H. GAN-based synthetic medical image augmentation for increased CNN performance in liver lesion classification. Neurocomputing 2018, 321, 321–331. [Google Scholar] [CrossRef]
- Lee, H.S.; Song, H.J.; Her, Y.D. A Study on the Image Generation with Residual U-Net Generator of CycleGAN in Digital Breast Tomography. Journal of Knowledge Information Technology and Systems 2023, 18, 1633–1641. [Google Scholar]
- Iqbal, T.; Ali, H. Generative adversarial network for medical images (MI-GAN). Journal of medical systems 2018, 42, 231. [Google Scholar] [CrossRef] [PubMed]
- Fan, C.; Lin, H.; Qiu, Y. U-Patch GAN: A medical image fusion method based on GAN. Journal of Digital Imaging 2023, 36, 339–355. [Google Scholar] [CrossRef] [PubMed]
- Westerlund, M. The emergence of deepfake technology: A review. Technology Innovation Management Review 2019, 9, 39–52. [Google Scholar] [CrossRef]
- Tolosana, R.; Vera-Rodriguez, R.; Fierrez, J.; Morales, A.; Ortega-Garcia, J. Deepfakes and beyond: A survey of face manipulation and fake detection. Information Fusion 2020, 61, 131–148. [Google Scholar] [CrossRef]
- Number of clinical trial registrations by location, disease, phase of development, age and sex of trial participants (1999-2024). https://www.who.int/observatories/global-observatory-on-health-research-and-development/monitoring/number-of-trial-registrations-by-year-location-disease-and-phase-of-development.
- Kim, H.; Jung, D.C.; Choi, B. W. Exploiting the vulnerability of deep learning-based artificial intelligence models in medical imaging: adversarial attacks. Journal of the Korean Society of Radiology 2019, 80, 259–273. [Google Scholar] [CrossRef]
- Significance and Characteristics of Health Insurance System. https://www.nhis.or.kr/nhis/policy/wbhada01000m01.do.
- Mirsky, Y.; Mahler, T.; Shelef, I.; Elovici, Y. {CT-GAN}: Malicious Tampering of 3D Medical Imagery using Deep Learning. In 28th USENIX Security Symposium (USENIX Security 19), 2019; pp. 461-478.
- Kim, Y.S. A Study on the Performance Comparison of the Fundus Image Generation Model. Mathematical Statistician and Engineering Applications 2022, 71, 527–537. [Google Scholar]
- Ocular Disease Recognition: Right and left eye fundus photographs of 5000 patients. https://www.kaggle.com/andrewmvd/ocular-disease-recognition-odir5k.
- MESSIDOR-2 DR Grades: Adjudicated DR Severity, DME, and Gradability for the MESSIDOR-2 fundus dataset. https://www.kaggle.com/google-brain/messidor2-dr-grades.
- Glaucoma Detection: OCT Scans. https://www.kaggle.com/sshikamaru/glaucoma-detection.
Figure 1.
Res U-Net Model Configuration proposed in the previous study [14].
Figure 1.
Res U-Net Model Configuration proposed in the previous study [14].
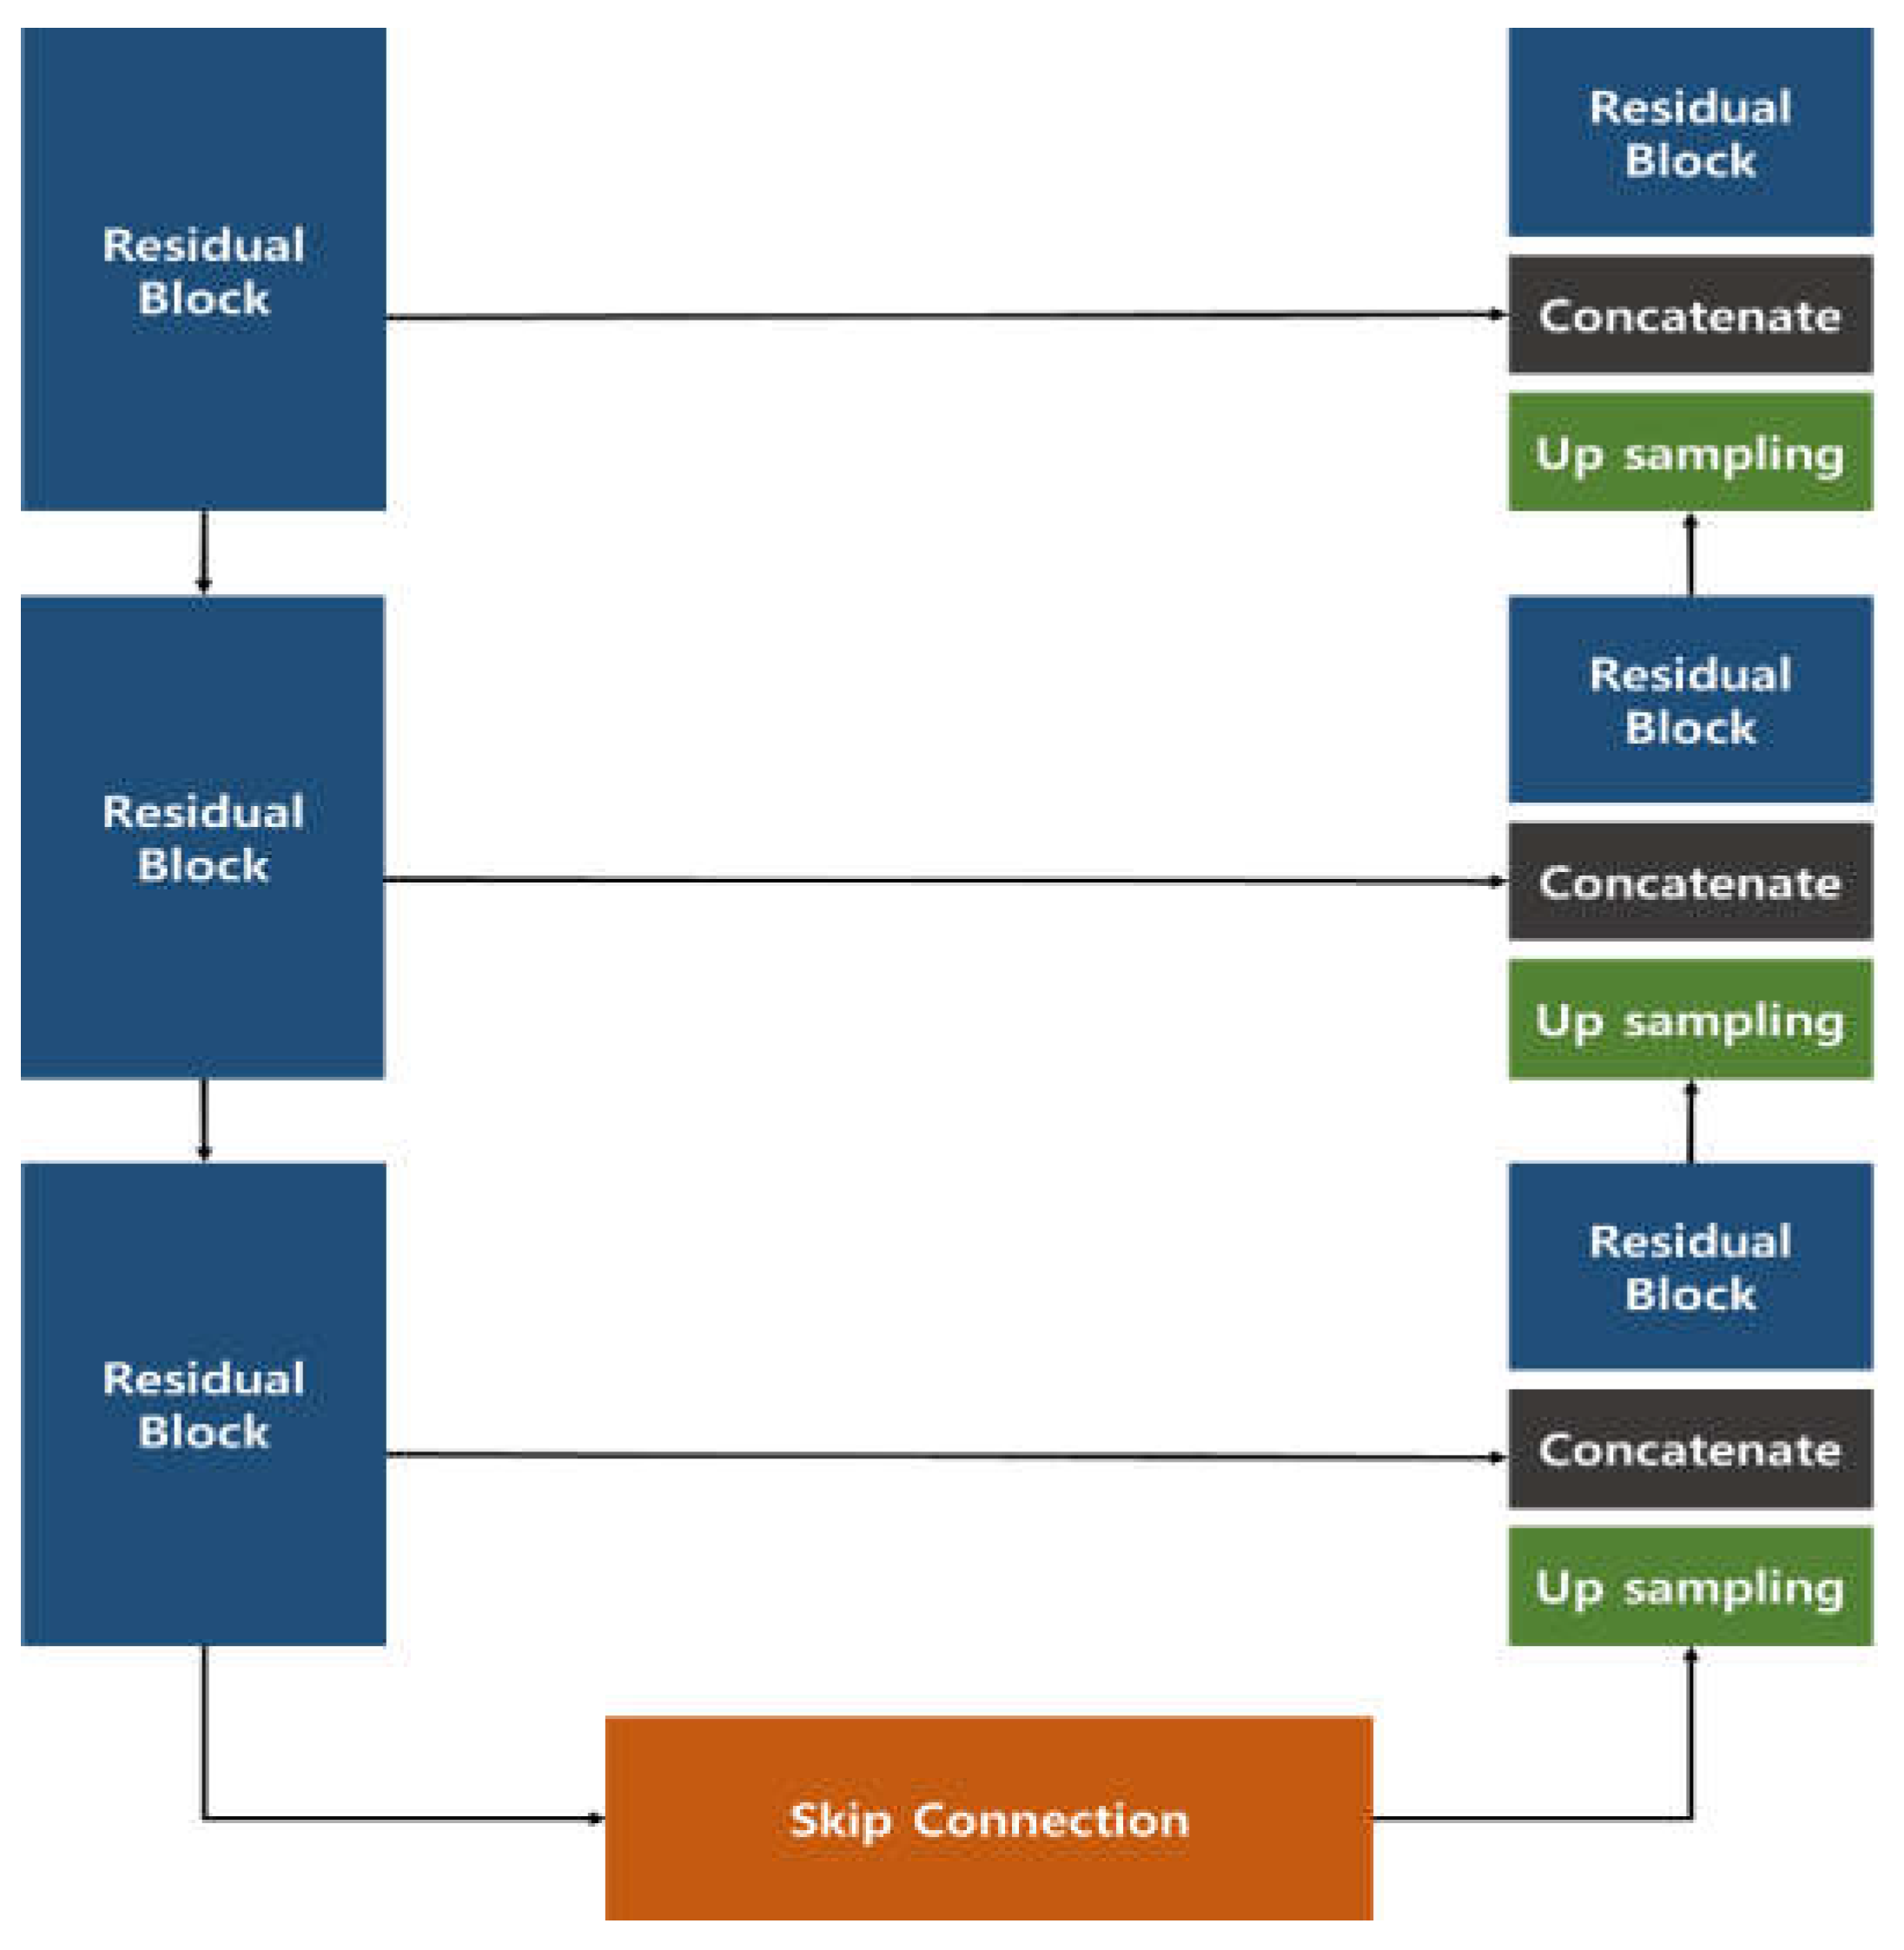
Figure 2.
Structure of the fundus image manipulation detection model.
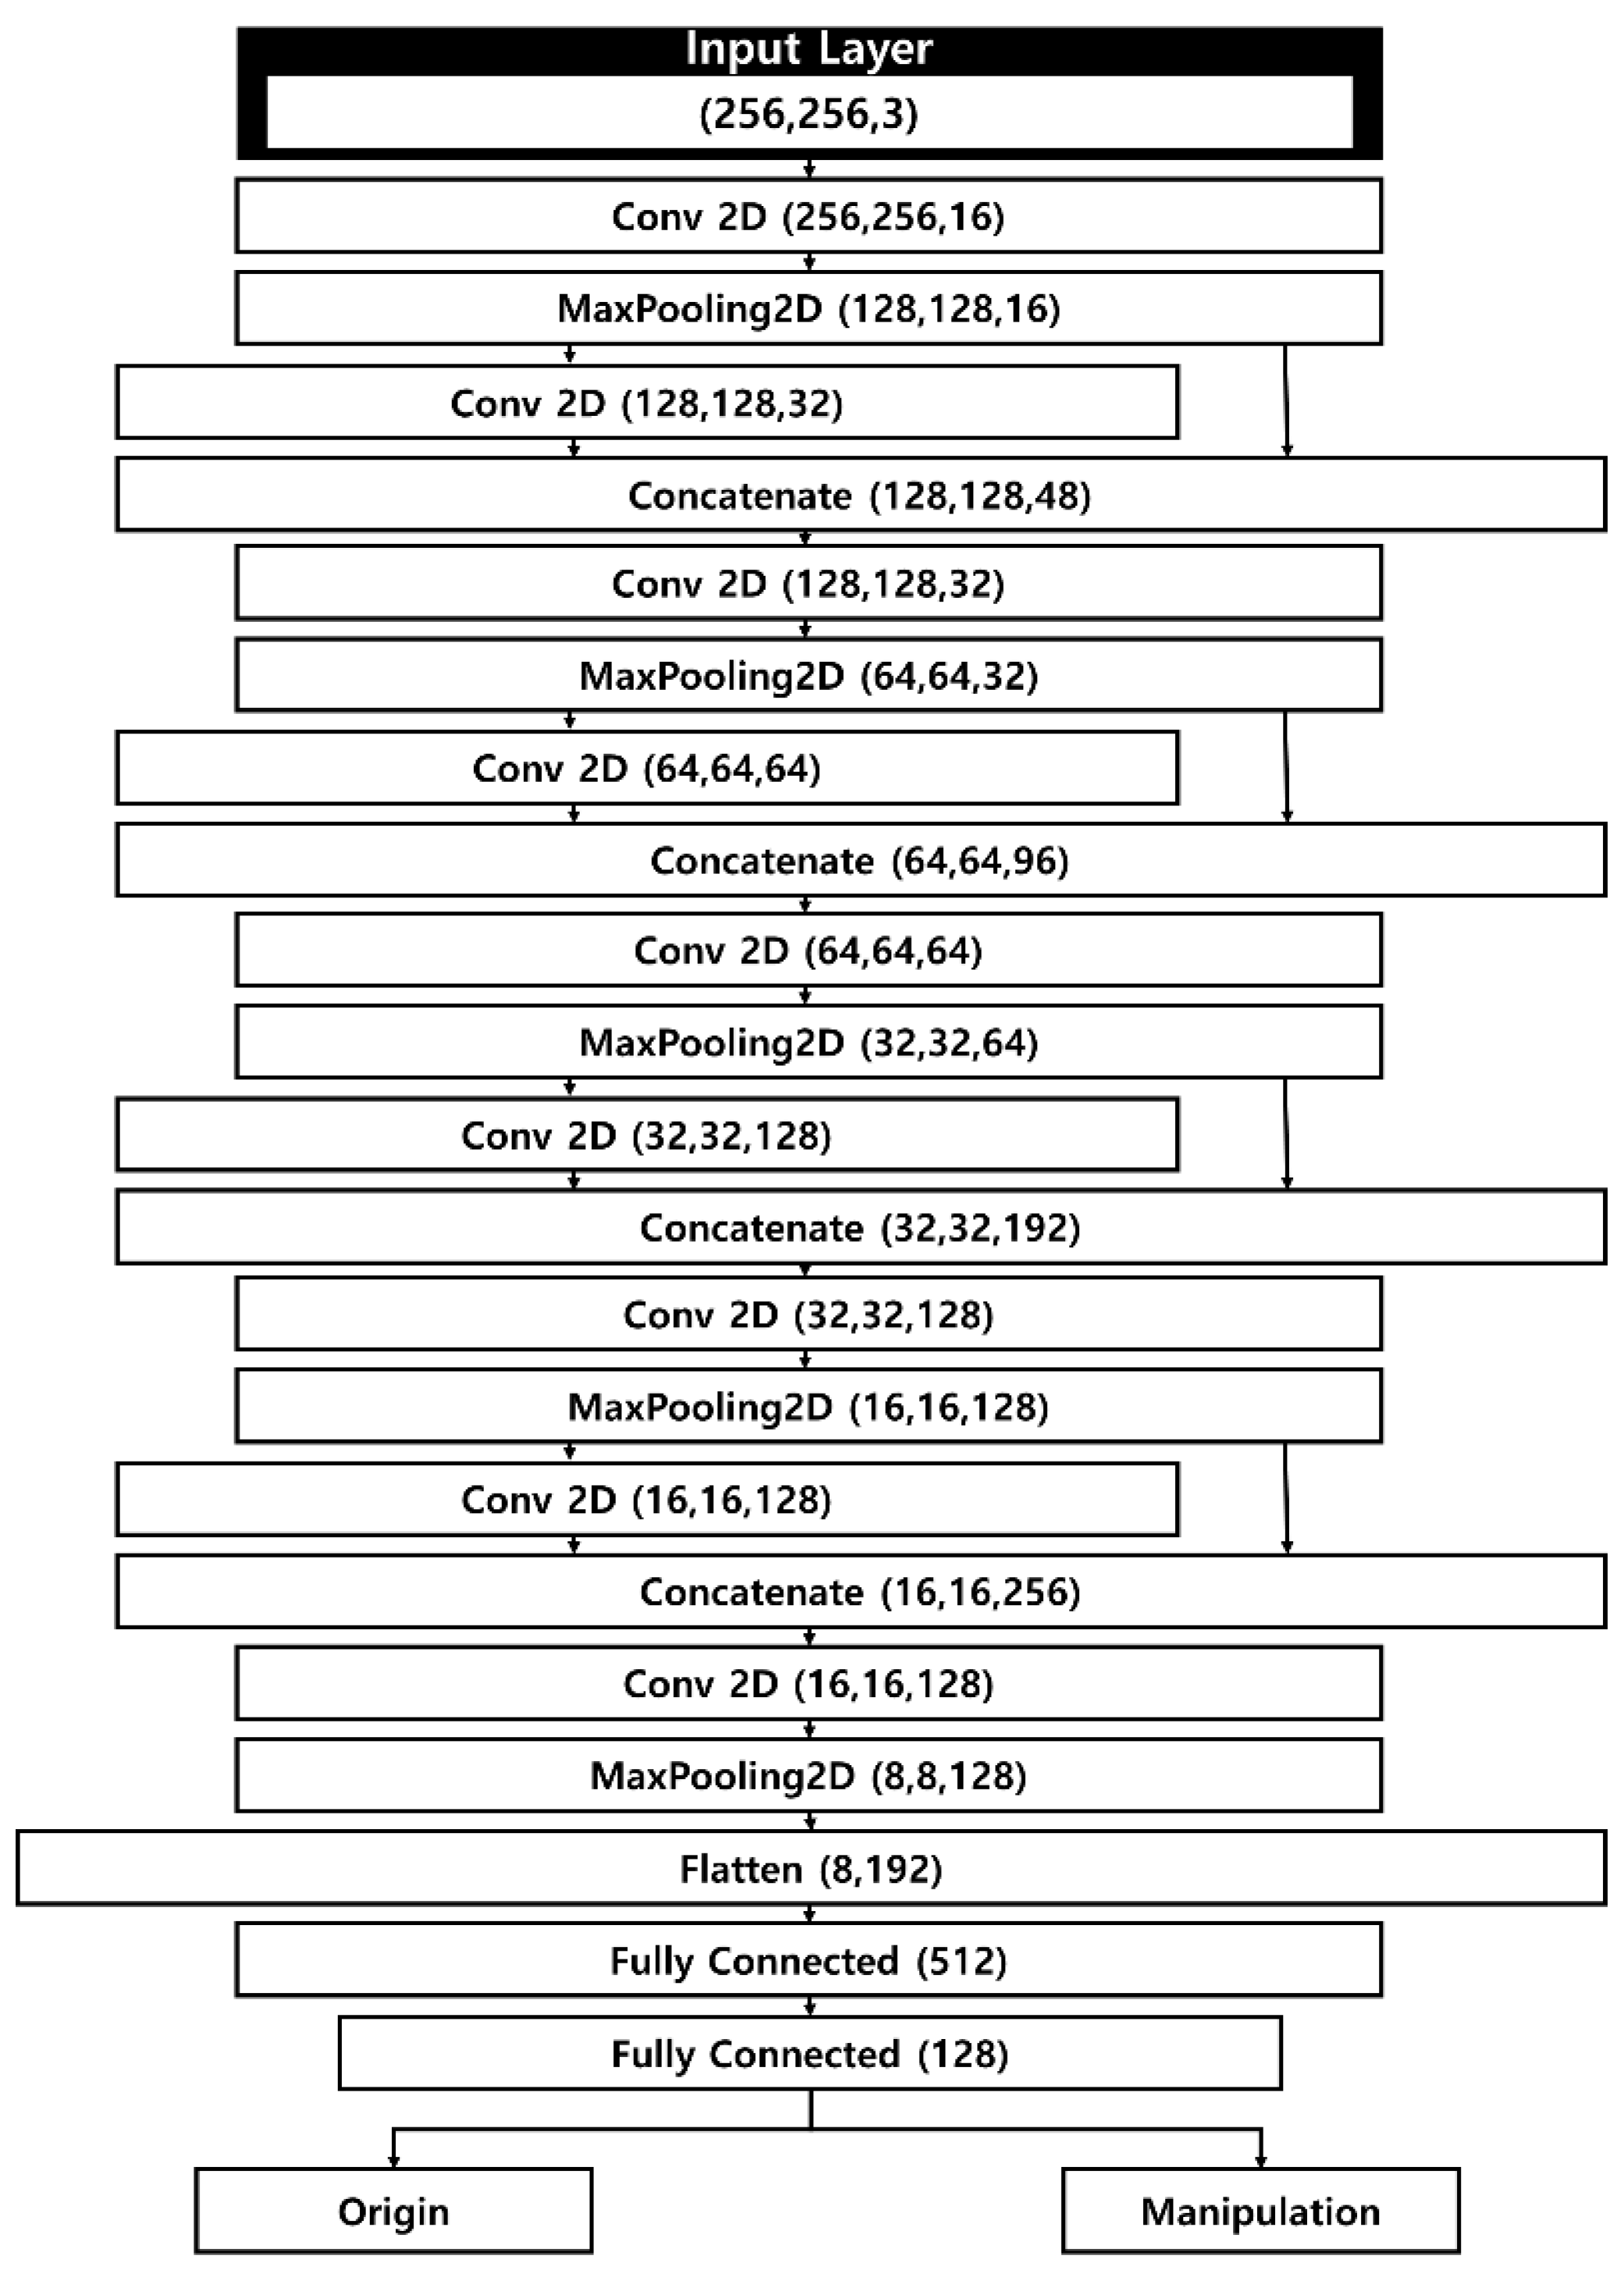

Table 1.
Image similarity evaluation from the previous study [14].
Table 1.
Image similarity evaluation from the previous study [14].
| RMSE | SSIM | FID | ||
|---|---|---|---|---|
| Res U-Net | Normal | 15.38 | 0.94 | 6.37 |
| Glaucoma | 27.94 | 0.75 | 63.48 | |
| Diabetic Retinopathy |
20.09 | 0.90 | 20.66 | |
| Macular Degeneration |
30.4 | 0.84 | 38.09 | |
| U-Net | Normal | 38.58 | 0.65 | 254.32 |
| Glaucoma | 39.93 | 0.65 | 310.90 | |
| Diabetic Retinopathy |
36.76 | 0.61 | 284.28 | |
| Macular Degeneration |
37.78 | 0.64 | 253.49 | |
Table 2.
Composition of the fundus image manipulation detection dataset.
| Real Data | Manipulation Data | |
|---|---|---|
| Normal | 350 (Train:260,Test:90) |
214 (Train:204,Test:10) |
| Glaucoma | 203 (Train:113,Test:90) |
125 (Train:115,Test:10) |
| Diabetic Retinopathy |
398 (Train:308,Test:90) |
147 (Train:137,Test:10) |
| Macular Degeneration |
217 (Train:127,Test:90) |
129 (Train:119,Test:10) |
| Total | 1,168 (Train:808,Test:360) |
615 (Train:575,Test:40) |
Table 3.
Results of the fundus image manipulation detection model (Sensitivity, Precision, F1-Score).
Table 3.
Results of the fundus image manipulation detection model (Sensitivity, Precision, F1-Score).
| Sensitivity | Precision | F1-Score | ||
|---|---|---|---|---|
| Real Data | Normal | 0.98 | 1.00 | 0.99 |
| Glaucoma | 0.99 | 1.00 | 0.99 | |
| Diabetic Retinopathy |
0.96 | 1.00 | 0.98 | |
| Macular Degeneration |
0.99 | 1.00 | 0.99 | |
| Manipulation Data | Normal | 1.00 | 0.83 | 0.91 |
| Glaucoma | 1.00 | 0.91 | 0.95 | |
| Diabetic Retinopathy |
1.00 | 0.71 | 0.83 | |
| Macular Degeneration |
1.00 | 0.91 | 0.99 | |
Table 4.
Results of the fundus image manipulation detection model (AUC).
| Normal | Glaucoma | Diabetic Retinopathy | Macular Degeneration | |
| AUC | 0.989 | 0.994 | 0.978 | 0.994 |
Table 5.
Detection results of manipulated fundus images by ophthalmologists (Sensitivity, Precision, F1-Score).
Table 5.
Detection results of manipulated fundus images by ophthalmologists (Sensitivity, Precision, F1-Score).
| Sensitivity | Precision | F1-Score | ||
|---|---|---|---|---|
| Real Data | Normal | 0.91 | 0.98 | 0.94 |
| Glaucoma | 0.92 | 0.95 | 0.93 | |
| Diabetic Retinopathy |
0.93 | 0.96 | 0.94 | |
| Macular Degeneration |
0.97 | 0.96 | 0.97 | |
| Manipulation Data | Normal | 0.88 | 0.67 | 0.76 |
| Glaucoma | 0.60 | 0.45 | 0.51 | |
| Diabetic Retinopathy |
0.64 | 0.61 | 0.61 | |
| Macular Degeneration |
0.72 | 0.74 | 0.72 | |
Table 6.
Detection results of the fundus image manipulation detection model by ophthalmologists (AUC).
Table 6.
Detection results of the fundus image manipulation detection model by ophthalmologists (AUC).
| Normal | Glaucoma | Diabetic Retinopathy | Macular Degeneration | |
| AUC | 0.895 | 0.762 | 0.788 | 0.844 |
Disclaimer/Publisher’s Note: The statements, opinions and data contained in all publications are solely those of the individual author(s) and contributor(s) and not of MDPI and/or the editor(s). MDPI and/or the editor(s) disclaim responsibility for any injury to people or property resulting from any ideas, methods, instructions or products referred to in the content. |
© 2025 by the authors. Licensee MDPI, Basel, Switzerland. This article is an open access article distributed under the terms and conditions of the Creative Commons Attribution (CC BY) license (http://creativecommons.org/licenses/by/4.0/).
Copyright: This open access article is published under a Creative Commons CC BY 4.0 license, which permit the free download, distribution, and reuse, provided that the author and preprint are cited in any reuse.


