
Submitted:
19 March 2025
Posted:
19 March 2025
You are already at the latest version
Abstract
Extreme wind waves occurring during storms are a major natural hazard for the maritime economy on the one hand and a driver of various natural processes, e. g. the erosion of coastlines, on the other. Assessing the extreme values of wind wave heights and their long-term trends is crucial for coastal and offshore engineering and climate change studies. This study is dedicated to the values and long-term trends of extreme wave heights in the Black Sea. A 73-years long reanalysis is applied for the study. In order to additionally validate the reanalysis, data on wave heights form the Saral/AltiKa satellite altimeter is used. 19 locations along the coastline of the Black Sea are selected for the analysis of wind wave data. Maximal significant wave heights exceed 8.5 m along the southwestern coast of the Crimean Peninsula. Besides, 99.9th, 99th and 95th percentiles of significant wave heights are assessed. The long-term linear trends of these values are in general not statistically significant except of one location in case of maximal significant wave heights and two locations in case of 95th percentile of significant wave heights.
Keywords:
Black Sea
; wind waves
; coastal areas
; Black Sea Waves Reanalysis
; extreme values
; long-term trends
1. Introduction
Wind waves occurring on the surface of any water body are one of the most obvious effects of the interaction between the hydrosphere and the atmosphere. They are responsible for the exchange of energy between these two mediums and also contribute to changes of the properties of the water surface, e. g. the albedo and roughness. In near-shore areas, wind waves can cause the transformation of coast and bottom relief and transport sediments. In turn, this influences the benthic and coastal ecosystems.
The Black Sea is an important area for both natural and socio-economical reasons. Having the only connection to the World Ocean via the narrow Bosphorus strait, it is one of the largest semi-enclosed basins in the world. Therefore, the large-scale processes occurring in the ocean have only a limited impact on the Black Sea. In particular, the gravity waves observed in the Black Sea (e. g. wind waves and swell) are generated only by local winds and do not experience any influence from swell waves coming from other seas.
Regarding the importance of the Black Sea for the economies of the surrounding countries, one can state that it is intensely used for shipping and recreation. Besides, oil & gas are extracted on several offshore platforms, and fishing and aquaculture are present as well. All these branches of industry are vulnerable to extreme wind waves; therefore, the studies of various aspects of storm waves on the Black Sea are crucial both for science and industry.
An enormous number of research devoted to these issues was made in recent decades. For instance, [1] studied the patterns and variability of storms in the western Black Sea during 1948–2010 and concluded, that despite some quasi-decadal variability, there are no significant long-term trends in the storminess. An assessment of wind wave climate over nearly the same time period, but for the entire Black Sea showed an increase of storm activity in the 1960s–1970s, what is linked to negative phases of the North-Atlantic Oscillation (NAO) [2]. On the other hand, evidence exist that the NAO is predominantly influencing the average values of significant wave height (SWH), whereas maximal values are affected by other indices of atmospheric circulation, namely the Atlantic Multidecadal Oscillation (AMO) and the Pacific decadal oscillation (PDO) [3]. Moreover, [4] argue that the wave climate of the Black Sea has a strong dependency on the East Atlantic / Western Russia (EA/WR) index. Another study analyzed the linear trends of mean and maximal significant wave heights along the coasts of the Black Sea during 1979–2009 [5]. According to its results, there are significantly decreasing trends of mean SWH in the southwestern part of the Black Sea and significantly increasing trends of this parameter off Sochi in the northeastern Black Sea; regarding annual maximal SWH, there are no significant trends. The relation between various teleconnection patterns and the storminess in a particular region of the Black Sea, namely the Danube delta, was assessed in [6]. While most studies deal with extreme wave parameters such as the SWH, wave length etc., [7] focused on the trends of SWH and their spatial distribution across the Black Sea over a 38-years long period and concluded that the annual average SWH is increasing in the eastern part of the sea, while in the western areas there is a negative trend of this parameter. Finally, it is also useful to assess the storm tracks in order to understand typical propagation patterns of these extreme events [8].
Some studies are focused on studying the aspects of wind waves in limited areas of the Black Sea. For instance, [9] studied the extreme waves along the Russian coast of the Black Sea between the Kerch Strait and Sochi based on numerical modeling. They assessed the impact of wind waves and swell to the total field of storm waves and concluded, that the contribution of these processes is not homogenous – wind waves are predominant in the northern part of the studied area, whereas swell dominates in its southern part. Another modeling study of wave conditions in the western Black Sea is described in [10]. This study is remarkable because the use of several nested computational grids. According to their results, maximal significant wave heights in the western Black Sea may exceed 10 m. Several research is devoted to the assessments of extreme wave conditions according to instrumental measurements at key locations [11,12], including the assessment of “killer waves”, which are manifestations of nonlinear processes [13].
Another frequently used approach are case studies of extraordinary storms, which caused severe damage to coastal and offshore infrastructure and shipping, and their atmospheric background. For instance, an analysis of the November 2007 storm, which caused several shipwrecks in the Kerch Strait is given in [2] and [14]. In November 2023, two storms occurred in the Black Sea and affected its south-western and eastern coasts [15,16].
Several papers focus not only on the wind waves by themselves, but on their interaction with other environmental processes. Thus, in the vicinity of the Danube delta wind waves interact with currents caused by river runoff [17] and the shoreline leading to its transformation [18]. In the northeastern Black Sea, the sandy Anapa bay-bar is strongly affected by wind waves and alongshore currents caused by them [19,20]. An assessment of the shoreline changes, which are driven by wind waves and other factors along the entire coasts of the Black Sea is described in [21].
Finally, some research is devoted to assessments of possible future changes of the Black Sea’s wave climate under various Representative Concentration Pathways (RCP) scenarios [22,23].
In this study, a 73-years long hindcast database covering the period between 1950 and 2022 is applied to assess the extreme wave heights and their long-term trends in 19 key locations along the coastline of the Black Sea. The relatively long temporal extent of the hindcast along with its optimal validation parameters increases the trust and scientific significance of this research.
2. Materials and Methods
There are numerous methods to measure and assess the parameters of wind waves [24]. Many of them were applied for the Black Sea. Thus, descriptions of instrumental measurements carried out by wave buoys or laser altimeters are given in [11,12,25,26]. Such instrumental measurements are reliable due to their high accuracy, but they represent only the wave conditions corresponding to the location and time of the installation of the corresponding measuring device. In order to get long-term or basin-scale data, the most optimal method is numerical modeling forced by atmospherical reanalyses. In case of the Black Sea, the most widely used wind wave models are SWAN [27,28] and WaveWatch, which are commonly forced by winds from the NCEP/NCAR [29,30], NCEP CFSR [31], NCEP CFSv2 [32] or ERA5 [33] reanalyses. Moreover, modern reanalyses contain data on wind waves as well. However, their spatial and/or temporal resolution isn’t always optimal for research purposes. High-resolution data on wind waves can be found in specialized regional reanalyses.
The main source of data for this study is the «Black Sea Waves Reanalysis» (BLKSEA_MULTIYEAR_WAV_007_006; for brevity, the abbreviation BSWR for “Black Sea Waves Reanalysis” will be used hereafter) [34]. Data for the period between January 1st, 1950, and December 31st, 2022 was extracted.
This reanalysis contains data on various parameters of wind waves and swell on the Black Sea, which are calculated using the spectral third-generation wave model WAM (Cycle 6). The performance of this model is described in, e. g. [35,36,37]. The atmospheric reanalysis ERA5 [33] is used as forcing. The timestep of BSWR coincides with the timestep of ERA5 and is 1 hour. The spatial resolution of BSWR is 1/40° (approx. 2.5 km); data is provided on a rectangular grid. The total amount of grid nodes is 74518. Whitecapping and wave transformation in coastal areas are considered.
A validation is crucial for any modeling product since it is the only way to be sure that the model gives adequate results. In this study, following validation metrics are used: the bias, the correlation coefficient (R), the Scatter index (SI), the mean absolute error (MAE), the root-mean-square error (RMSE). The formulas of these statistical parameters are given in, e. g. [38]. The BSWR was initially validated against satellite altimetry and in situ buoy observations [34]. The main parameters of this validation are given in Table 1.
In order to get an independent assessment of the BSWR’s quality, it was compared against the Saral/Altika satellite altimeter data (phases A and B) [39]. The altimeter data was accessed via the Radar Altimeter Database System [40]. The timespan of these measurements is between March 2013 and December 2022. Following measurements were excluded from the initial altimeter database according to recommendations given in [41]:
- measurements with standard deviation of SWH exceeding 0.4 m;
- measurements carried out less than 10 km offshore;
- measurements with SWH below 0.1 m.
Afterwards, satellite measurements with a time difference below 15 minutes from the reanalysis term were selected (e. g., satellite measurements carried out between 13:45 and 14:15 were compared against reanalysis data corresponding to 14:00). The closest reanalysis node to the observation point was selected. Thus, 83920 pairs of SWH values from the BSWR and satellite altimeter were used for validation. The principal statistic parameters of this validation are given in table 2.
A scatter plot of simultaneous SWH values from the BSWR and from the Saral/Altika altimeter is shown in Figure 1. The linear regression shows a slight underestimation of SWH by the reanalysis. It is most expressed at higher SWH values. This is, however, a common issue for modelling studies [2,38].
The quality of data produced by numerical models usually slightly varies from season to season. The seasonal variability of the main statistical parameters used for SWH validation is shown in Figure 2. Thus, the mean bias varies from -0.03 m in November till 0.07 m in April; the MAE is between 0.13 m in May and 0.21 m in February; the RMSE is between 0.17 m in May and 0.29 m in February; the SI is between 0.21 m in December and 0.32 m in August. The correlation coefficient (R) varies between 0.87 and 0.93, whereas minimal R values correspond to calmer months (May till August). The number of observations varied between 6353 and 7875 for each month.
According to these statistical estimates, the quality of BSWR exceeds several previous modelling datasets, e.g. that presented in [38]. In the latter case the correlation coefficients turned out to be lower (0.76–0.85 depending on the SWH measurement instrument).
In order to assess the spatial variability of wind wave extremes, 19 points located in the coastal areas of the Black Sea were selected. The points were selected in a way to achieve a relatively regular coverage of the Black Sea coastline. They also correspond to areas of high natural or anthropogenic significance (e. g., river deltas, straits, ports, offshore drilling units etc.). These points’ coordinates are given in Table 3; their location is also shown in Figure 3. Some of these locations were previously used for analysis in [38]. For the points, not the reanalysis nodes closest to the coast were selected, but those located at a certain distance offshore in order to take into account possible local effects (e. g. the bora winds and corresponding waves in Gelendzhik).
3. Results and Discussion
3.1. Spatial Distribution of Extreme Wave Heights
First, the spatial variability of extreme wave heights will be described and discussed. Figure 4 shows the spatial distribution of extreme wave heights across the coastal areas of the Black Sea. Regarding the maximal SWH, highest values correspond at Khersones and Katziveli – 9.5 and 8.5 m, respectively. Maximal SWH within the 7–8 m diapason corresponds to adjacent points in the NW part of the Black Sea (Karkinit platform and Tarlhankut), along the coast in the NE part of the sea between Meganom and Gelendzhik, as well as at Bosphorus on the opposite SW edge of the basin. Lowest maximal SWH values correspond to the SE part of the Black Sea; thus, this value at Giresun is 4.58 m.
The spatial distribution of the 99.9th, 99th and 95th percentiles of SWH differs from that of the maximal SWH. Thus, highest values of the 99.9th percentile of SWH correspond to the SW and W coasts of the Black Sea – they are 4.53 and 4.42 m at Bosphorus and Gloria, respectively. Remarkable high values of this parameter – 4.22 and 4.16 m – correspond to Gelendzhik (NE coast) and Khersones (N coast). On the other hand, lowest values of the 99.9th percentile of SWH correspond to the SE coast of the sea, which coincides with the distribution of the maximal SWH. Thus, the value of this parameter at Giresun is 2.78 m.
Highest values of the 99th percentile of SWH also correspond to Bosphorus and Gloria (3.26 and 3.16 m, respectively). Unlike the distribution of 99.9th percentile of SWH, in this case the distribution along the N and NE coasts of the Black Sea is more uniform without local maxima. Another slight difference is the location of minimal values of the 99th percentile of SWH – it corresponds to Sochi (1.94 m).
Regarding the distribution of the 95th percentile of SWH, its highest values correspond to Gloria (W coast; 2.21 m) and Bosphorus (SW coast; 2.21 m). Local maxima are also observed along the N and NE coasts at the Karkinit platform (2.07 m) and the Kerch Strait (2.02 m). Just as in case of the 99th percentile of SWH, minimal values of the 95th percentile correspond to Sochi (1.29 m).
Thus, the distribution pattern of maximal SWH values and its highest percentiles are different. Whereas highest maximal SWH are observed at Khersones and Katziveli on the SE edge of the Crimean Peninsula, these points are quite moderate in terms of the percentiles. On the other hand, highest values of the percentiles usually correspond to points in the western nearshore area (Bosphorus and Gloria). This difference can be explained by the fact that the SE edge of the Crimean Peninsula is affected by storm waves generated by winds blowing across the entire Black Sea and thus having an enormous fetch, which is crucial for the development of wind waves having SWH over 9 m. However, such events are relatively rare. On the other hand, the SW area of the Black Sea is frequently affected by atmospheric circulation causing relatively high waves, which leads to higher values of the percentiles in this area. One can compare this explanation with previous assessments of spatial distribution of maximal SWH values and the duration of extreme waves. For example, [38] determined three areas with maximal SWH values in the Black Sea – the SW part of the sea adjacent to the Bosphorus Strait, an area along the N coast of the Sea approximately between Khersones and Utrish, and an offshore area in the SE part of the sea. On the other hand, [2] assessed the duration of extreme high waves (in their case, with SWH ≥ 4 m) and concluded, that such waves are most frequent in a quite compact area in the western part of the Black Sea.
3.2. Spatial Distribution of Extreme Wave Heights’ Linear Trends
Besides the extreme parameters, which were discussed previously, it is useful and interesting to assess the long-term trends of these values. Analyzing a 72-years long dataset gives a good opportunity to do so. In this section, a description of the linear trends of maximal SWH values and the percentiles of SWH will be given alongside with an assessment of the significance of these trends.
Figure 5 shows the distribution of linear trends of maximal SWH values and their 99.9th, 99th and 95th percentiles. In most points, a positive trend of maximal SWH is revealed. However, a significant positive trend is revealed only at Zonguldak in the SW area of the Black Sea. At several points in the NW part of the sea (between Galata and the Karkinit platform) and along the SE coast (Hopa and Giresun) an unsignificant decreasing trend is identified.
In case of the 99.9th percentile of SWH, the linear trends at all points are not significant. The trend direction is the same as in case of maximal SWH except of two points located on the southern coast of the Crimean Peninsula – Katziveli and Meganom.
In case of the 99th percentile of SWH, all trends are not significant as well. The trends are negative at all points except of 4 locations in the eastern part of the sea – the points between Gelendzhik and Sirius.
Finally, in case of the 95th percentile of SWH al trends are negative except of a single point – Utrish. Besides, the negative trend observed at Bosphorus is significant at 90 % confidence level, and the negative trend observed at the Karkinit platforms is significant at the 95 % confidence level.
The values of the linear trends are given in Table 4. Among the maximal SWH, the highest positive trend is observed at Zonguldak (0.79 cm/year); this trend is also significant at 90 % confidence level. The lowest trend corresponds to Galata (-0.31 cm/year); this trend is not significant. Regarding the 99.9th percentile of SWH, the highest and lowest trends also correspond to Zonguldak (0.44 cm/year) and Galata (-0.38 cm/year), respectively. In case of the 99th percentile of SWH, the values of linear trends are between-0.20 cm/year at Bosphorus and 0.06 cm/year at Sochi. In case of the 95th percentile of SWH, the lowest trends correspond to Bosphorus (-0.20 cm/year) and Karkinit platform(-0.18 cm/year); these trends are significant at 90 % and 95 % confidence levels, respectively. The only positive trend in this case corresponds to Utrish (0.02 cm/year); however, this trend is not significant.
3.3. Assessing Monthly Extreme Wave Heights’ Linear Trends
Besides assessing the trends of annual extreme SWH
values, it is interesting and useful to assess their monthly values as well
since it can determine specific periods, where the changes in wave conditions
are most expressed. Diagrams showing the value and significance of the monthly
trends of maximal SWH and their 99.9th, 99th and 95th percentiles are shown on Figure 6. Regarding the maximal SWH (Figure 6a), significant increasing trends
correspond to Bosphorus (point # 16) in January and February, and to Zonguldak
(point # 15) in December. The values of these trends are 0.85–1.05 cm/year. On
the other hand, most expressed significant decreasing trends correspond to
points located along the N and NE coasts of the Black Sea – Khersones,
Katziveli, Kerch Strait and Utrish (points 3, 4, 6, 7). The values of the
linear trends in this case are -0.96 – -0.78 cm/year. Besides, significant
negative trends were also derived at multiple locations during summer months
(June till August). Relatively high, but statistically not significant
increasing trends correspond to the N and NE coastal areas in spring; such
trends are most expressed at Utrish (point # 7) and Gelendzhik (point # 8) in
March. Another season with predominantly increasing trends of maximal SWH is
autumn.
The pattern of linear trends of the 99.9th percentile of SWH (Figure 6b) is the same as in case of maximal SWH; moreover, the difference in the values of these trends is neglectable and does not exceed 0.01 cm/year.
In case of the 99th percentile of SWH (Figure 6c), the pattern of the trends is slightly different. Statistically significant increasing trends in this case correspond to Bosphorus (point # 16) in February and Zonguldak and Bosphorus (points # 15 and 16, respectively) in December. The values of these trends are within the 0.68–1.05 cm/year range. Most expressed significant decreasing trends were recorded in Katziveli (point #4) and at the Kerch Strait (point # 6) in January – they are -0.78 and -0.63 cm/year, respectively. Besides them, significant decreasing trends correspond to Utrish in January and Bosphorus in March, as well as to numerous locations in summer (June till August).
The trends are less expressed in case of the 95th percentile of SWH (Figure 6d). Thus, the highest increasing trend in this case is 0.39 cm/year; it corresponds to Gelendzhik (point # 8) in September. Other significant increasing trends are corresponding to Tuapse and Danube in September and to Galata in August. On the other hand, the lowest decreasing trend corresponds to Bosphorus (point # 16) in March; its value is -0.63 cm/year.
Thus, one can conclude that an increase in SWH extreme parameters is observed in the nearshore areas along the SW coast of the Black Sea in winter. On the other hand, a decreasing trend corresponds to January and is located in the NE coastal areas of the sea.
The values of these monthly trends and their statistical significance level is listed in Supplementary Table 1. Multiannual timeseries of annual and monthly extreme wave parameters and their linear trends in the coastal points are shown on supplementary figures 1–76.
3.3. Discussion of Results and Conclusion
The results and conclusions of this study contribute to our understanding of the climate and variability of the wind waves’ extreme parameters on the Black Sea. This section is devoted to a brief comparison of my results with those of previous studies.
The spatial distribution of extreme SWH parameters (Figure 4) generally agrees with most of the previous studies. Thus, highest SWH values corresponding to points Khersones and Katziveli match the pattern of maximal SWH distribution described in [38]. According to the latter study, highest SWH are observed in three areas of the Black Sea – the SW and SE offshore areas and an area along the Northern coast approximately between Khersones and Utrish. However, according to [38], highest SWH values in the Black Sea do not exceed 8.5 m, whereas in the present study highest SWH values at Katziveli are 9.5 m. According to [5], highest SWH values are observed close to Bosphorus (up to 8.29 m) and off Khersones (7.36 m), which confirms the previously described pattern. The differences in the maximal SWH values are, probably, due to different reanalyses used to force the numerical wave models and various setup parameters of these models.
Regarding the linear trends of the extreme SWH values, the most similar previous study is described in [5]. That study focused on annual maximal and average SWH values, as well as on corresponding wind speeds, and concluded, that there are no significant linear trends of maximal SWH. The results presented in this study generally agree with [5], but a significant increasing linear trend of annual maximal SWH was found at Zonguldak in the SW part of the Black Sea. Moreover, this study complements the understanding of extreme wave trends by describing not only their annual parameters, but also the monthly values.
A further step in this research can be related to assessing the multiannual variability of the trends. In that case, the long-term trends described in this paper will be supplemented by specific periods with expressed increase or decrease of extreme wave heights.
Supplementary Materials
The following supporting information can be downloaded at the website of this paper posted on Preprints.org. Figure S1: title; Table S1: Monthly values (in cm/year) and significance level of linear trends of maximal SWH and 99.9th, 99th, and 95th percentiles of SWH at the selected coastal points in the Black Sea; Figures S1-S19: Timeseries of annual and monthly maximal SWH values and their linear trends at the coastal locations; Figures S20–S38: Timeseries of annual and monthly 99.9th percentiles of SWH values and their linear trends at the coastal locations; Figures S39–S57: Timeseries of annual and monthly 99th percentiles of SWH values and their linear trends at the coastal locations; Figures S58–S76: Timeseries of annual and monthly 95th percentiles of SWH values and their linear trends at the coastal locations.
Funding
This study was supported by the Russian Science Foundation, project No. 23-17-01018 (https://rscf.ru/project/23-17-01018/).
Data Availability Statement
The raw data supporting the conclusions of this article will be made available by the author on request.
Acknowledgments
The use of the Black Sea Waves Reanalysis produced by the Helmholtz-Zentrum Hereon is gratefully acknowledged. The author is grateful to the RADS for providing data of the AltiKa altimeter. Finally, the coastline shapefile used on Figure 4 and 5 was produced by the Flanders Marine Institute [48].
Conflicts of Interest
The author declares no conflicts of interest. The funders had no role in the design of the study; in the collection, analyses, or interpretation of data; in the writing of the manuscript; or in the decision to publish the results.
References
- Valchev, N.N.; Trifonova, E.V.; Andreeva, N.K. Past and Recent Trends in the Western Black Sea Storminess. Nat. Hazards Earth Syst. Sci. 2012, 12, 961–977. [Google Scholar] [CrossRef]
- Arkhipkin, V.S.; Gippius, F.N.; Koltermann, K.P.; Surkova, G.V. Wind Waves in the Black Sea: Results of a Hindcast Study. Nat. Hazards Earth Syst. Sci. 2014, 14, 2883–2897. [Google Scholar] [CrossRef]
- Saprykina, Y.; Kuznetsov, S.; Valchev, N. Multidecadal Fluctuations of Storminess of Black Sea Due to Teleconnection Patterns on the Base of Modelling and Field Wave Data. In; Springer Singapore, 2019; pp. 773–781. ISBN 9789811331190.
- Causio, S.; Federico, I.; Jansen, E.; Mentaschi, L.; Ciliberti, S.A.; Coppini, G.; Lionello, P. The Black Sea Near-Past Wave Climate and Its Variability: A Hindcast Study. Front Mar Sci 2024, 11, 1–16. [Google Scholar] [CrossRef]
- Akpınar, A.; Bingölbali, B. Long-Term Variations of Wind and Wave Conditions in the Coastal Regions of the Black Sea. Nat. Hazards 2016, 84, 69–92. [Google Scholar] [CrossRef]
- Zăinescu, F.I.; Tătui, F.; Valchev, N.N.; Vespremeanu-Stroe, A. Storm Climate on the Danube Delta Coast: Evidence of Recent Storminess Change and Links with Large-Scale Teleconnection Patterns. Nat. Hazards 2017, 87, 599–621. [Google Scholar] [CrossRef]
- Aydoğan, B.; Ayat, B. Spatial Variability of Long-Term Trends of Significant Wave Heights in the Black Sea. Appl. Ocean Res. 2018, 79, 20–35. [Google Scholar] [CrossRef]
- Bernardino, M.; Rusu, L.; Guedes Soares, C. Evaluation of Extreme Storm Waves in the Black Sea. J. Oper. Oceanogr. 2020, 1–15. [Google Scholar] [CrossRef]
- Divinsky, B.V.; Saprykina, Y.V. Extreme Wind Waves on the Northeastern Shelf of the Black Sea. Dokl. Earth Sci. 2024, 517, 1224–1233. [Google Scholar] [CrossRef]
- Bingölbali, B.; Akpınar, A.; Jafali, H.; Vledder, G.P. Van Downscaling of Wave Climate in the Western Black Sea. Ocean Eng. 2019, 172, 31–45. [Google Scholar] [CrossRef]
- Saprykina, Y. Climatic Variability of Wave Heights in the Shelf Zone of the North-Eastern Part of the Black Sea According Field Data. Reg Stud Mar Sci 2024, 79, 103808. [Google Scholar] [CrossRef]
- Bilyay, E.; Ozbahceci, B.O.; Yalciner, A.C. Extreme Waves at Filyos, Southern Black Sea. Nat. Hazards Earth Syst. Sci. 2011, 11, 659–666. [Google Scholar] [CrossRef]
- Ivanov, V.; Dotsenko, S.; Shokurov, M.; Malinovsky, V.; Dulov, V.; Kuznetsov, S.; Saprykina, Y.; Polnikov, V. Risk Assessment of Encountering Killer Waves in the Black Sea. Geogr. Environ. Sustain. 2012, 5, 84–111. [Google Scholar] [CrossRef]
- Bukhanovskij, A.W. , Lopatukhin, L.I., Chernisheva, E.S., and Kolesov, A.M. The storm on the Black Sea on 11 November 2007 and statistics of extreme storms of the sea. Proc. Russ. Georg. Soc. 2009, 141, 71–80. (in Russian). [Google Scholar]
- Dulov, V.A.; Yurovskaya, M.V.; Fomin, V.V.; Shokurov, M.V.; Yurovsky, Y.Y.; Barabanov, V.S.; Garmashov, A.V. Extreme Black Sea Storm in November, 2023. Phys. Oceanogr. 2024, 31, 295–316. [Google Scholar]
- Yurovskaya, M.V.; Shokurov, M.V.; Barabanov, V.S.; Yurovsky, Y.Y.; Kudryavtsev, V.N.; Kamenev, O.T. Wind and Wave Hindcast and Observations During the Black Sea Storms in November 2023. Pure Appl Geophys 2024, 181, 3149–3171. [Google Scholar] [CrossRef]
- Rusu, E. Modelling of Wave-Current Interactions at the Mouths of the Danube. J Mar Sci Technol 2010, 15, 143–159. [Google Scholar] [CrossRef]
- Dan, S.; Stive, M.J.F.; Walstra, D.J.R.; Panin, N. Wave Climate, Coastal Sediment Budget and Shoreline Changes for the Danube Delta. Mar Geol 2009, 262, 39–49. [Google Scholar] [CrossRef]
- Krylenko, V.V. Seashore Dynamics of the Anapa Bay-Bar. Oceanol. (Wash D C) 2015, 55, 742–749. [Google Scholar] [CrossRef]
- Divinsky, B.V.; Kosyan, R.D. Influence of the Climatic Variations in the Wind Waves Parameters on the Alongshore Sediment Transport. Oceanologia 2020, 62, 190–199. [Google Scholar] [CrossRef]
- Tătui, F.; Pîrvan, M.; Popa, M.; Aydogan, B.; Ayat, B.; Görmüș, T.; Korzinin, D.; Văidianu, N.; Vespremeanu-Stroe, A.; Zăinescu, F.; et al. The Black Sea Coastline Erosion: Index-Based Sensitivity Assessment and Management-Related Issues. Ocean Coast Manag 2019, 182. [Google Scholar] [CrossRef]
- Chirosca, A.M.; Rusu, L. Projections of Wind and Wave Climate on the Main Routes of the Mediterranean and Black Seas. J Ocean Eng Mar Energy 2025, 149–167. [Google Scholar] [CrossRef]
- Çakmak, R.E.; Amarouche, K.; Akpınar, A.; Otay, E.N. Projected Changes in Wave Storm Patterns near Key Ports and Shipping Routes in the Black Sea. Ocean Coast Manag 2025, 261, 107537. [Google Scholar] [CrossRef]
- Holthuijsen, L.H. Waves in Oceanic and Coastal Waters; Cambridge University Press, 2007; ISBN 9780521860284.
- Myslenkov, S.; Chernyshova, A. Comparing Wave Heights Simulated in the Black Sea by the SWAN Model with Satellite Data and Direct Wave Measurements. Russ. J. Earth Sci. 2016, 16, 1–12. [Google Scholar] [CrossRef]
- Amarouche, K.; Akpınar, A.; Rybalko, A.; Myslenkov, S. Assessment of SWAN and WAVEWATCH-III Models Regarding the Directional Wave Spectra Estimates Based on Eastern Black Sea Measurements. Ocean Eng. 2023, 272, 113944. [Google Scholar] [CrossRef]
- Booij, N.; Ris, R.C.; Holthuijsen, L.H. A Third-Generation Wave Model for Coastal Regions 1. Model Description and Validation. J Geophys Res Ocean. 1999, 104, 7649–7666. [Google Scholar] [CrossRef]
- Ris, R.C.; Holthuijsen, L.H.; Booij, N. A Third-Generation Wave Model for Coastal Regions: 2. Verification. J Geophys Res Ocean. 1999, 104, 7667–7681. [Google Scholar] [CrossRef]
- Kalnay, E.; Kanamitsu, M.; Kistler, R.; Collins, W.; Deaven, D.; Gandin, L.; Iredell, M.; Saha, S.; White, G.; Woollen, J.; et al. The NCEP/NCAR 40-Year Reanalysis Project. Bull Am Meteorol Soc 1996, 77, 437–471. [Google Scholar] [CrossRef]
- Kistler, R.; Kalnay, E.; Collins, W.; Saha, S.; White, G.; Woollen, J.; Chelliah, M.; Ebisuzaki, W.; Kanamitsu, M.; Kousky, V.; et al. The NCEP-NCAR 50-Year Reanalysis: Monthly Means CD-ROM and Documentation. Bull Am Meteorol Soc 2001, 82, 247–267. [Google Scholar] [CrossRef]
- Saha, S.; Moorthi, S.; Pan, H.-L.; Wu, X.; Wang, J.; Nadiga, S.; Tripp, P.; Kistler, R.; Woollen, J.; Behringer, D.; et al. The NCEP Climate Forecast System Reanalysis. Bull Am Meteorol Soc 2010, 91, 1015–1058. [Google Scholar] [CrossRef]
- Saha, S.; Moorthi, S.; Wu, X.; Wang, J.; Nadiga, S.; Tripp, P.; Behringer, D.; Hou, Y.T.; Chuang, H.Y.; Iredell, M.; et al. The NCEP Climate Forecast System Version 2. J Clim 2014, 27, 2185–2208. [Google Scholar] [CrossRef]
- Hersbach, H.; Bell, B.; Berrisford, P.; Hirahara, S.; Horányi, A.; Muñoz-Sabater, J.; Nicolas, J.; Peubey, C.; Radu, R.; Schepers, D.; et al. The ERA5 Global Reanalysis. Q. J. R. Meteorol. Soc. 2020, 146, 1999–2049. [Google Scholar] [CrossRef]
- Staneva, J. , Ricker, M., & Behrens, A. (2022). Black Sea Waves Reanalysis (CMEMS BS-Waves, EAS4 system) (Version 1) [Data set]. Copernicus Monitoring Environment Marine Service (CMEMS). [CrossRef]
- Staneva, J.; Behrens, A.; Wahle, K. Wave Modelling for the German Bight Coastal-Ocean Predicting System. J Phys Conf Ser 2015, 633, 3–9. [Google Scholar] [CrossRef]
- Staneva, J.; Alari, V.; Breivik, Ø.; Bidlot, J.R.; Mogensen, K. Effects of Wave-Induced Forcing on a Circulation Model of the North Sea. Ocean Dyn 2017, 67, 81–101. [Google Scholar] [CrossRef]
- Staneva, J.; Wahle, K.; Koch, W.; Behrens, A.; Fenoglio-Marc, L.; Stanev, E.V. Coastal Flooding: Impact of Waves on Storm Surge during Extremes – A Case Study for the German Bight. Nat. Hazards Earth Syst. Sci. 2016, 16, 2373–2389. [Google Scholar] [CrossRef]
- Gippius, F.N.; Myslenkov, S.A. Black Sea Wind Wave Climate with a Focus on Coastal Regions. Ocean Eng. 2020, 218, 108199. [Google Scholar] [CrossRef]
- Steunou, N.; Desjonquères, J.D.; Picot, N.; Sengenes, P.; Noubel, J.; Poisson, J.C. AltiKa Altimeter: Instrument Description and In Flight Performance. Mar. Geod. 2015, 38, 22–42. [Google Scholar] [CrossRef]
- Radar Altimeter Database System. Available online: http://rads.tudelft.nl/rads/rads.shtml (accessed on 19 March 2025).
- Abdalla, S.; Janssen, P.A.E.M.; Bidlot, J.R. Altimeter near Real Time Wind and Wave Products: Random Error Estimation. Mar. Geod. 2011, 34, 393–406. [Google Scholar] [CrossRef]
- Polonsky, A.; Evstigneev, V.; Naumova, V.; Voskresenskaya, E. Low-Frequency Variability of Storms in the Northern Black Sea and Associated Processes in the Ocean–Atmosphere System. Reg Env. Change 2014, 14, 1861–1871. [Google Scholar] [CrossRef]
- Silvestrova, K.; Myslenkov, S.; Puzina, O.; Mizyuk, A.; Bykhalova, O. Water Structure in the Utrish Nature Reserve (Black Sea) during 2020–2021 According to Thermistor Chain Data. J Mar Sci Eng 2023, 11. [Google Scholar] [CrossRef]
- Ostrovskii, A.G.; Emelianov, M.V.; Kochetov, O.Y.; Kremenetskiy, V.V.; Shvoev, D.A.; Volkov, S.V.; Zatsepin, A.G.; Korovchinsky, N.M.; Olshanskiy, V.M.; Olchev, A.V. Automated Tethered Profiler for Hydrophysical and Bio-Optical Measurements in the Black Sea Carbon Observational Site. J Mar Sci Eng 2022, 10. [Google Scholar] [CrossRef]
- Rusu, L. Application of Numerical Models to Evaluate Oil Spills Propagation in the Coastal Environment of the Black Sea. J. Environ. Eng. Landsc. Manag. 2010, 18, 288–295. [Google Scholar] [CrossRef]
- Mann, H.B. Nonparametric Tests Against Trend. Econometrica 1945, 13, 245. [Google Scholar] [CrossRef]
- Kendall, M.G. Rank Correlation Methods; Griffin: London, 1975. [Google Scholar]
- Marineregions.org. Available online: https://www.marineregions.org (accessed on 19 March 2025).
Figure 1.
Scatter-plot of SWH values from the BSWR and from the Saral/Altika altimeter.
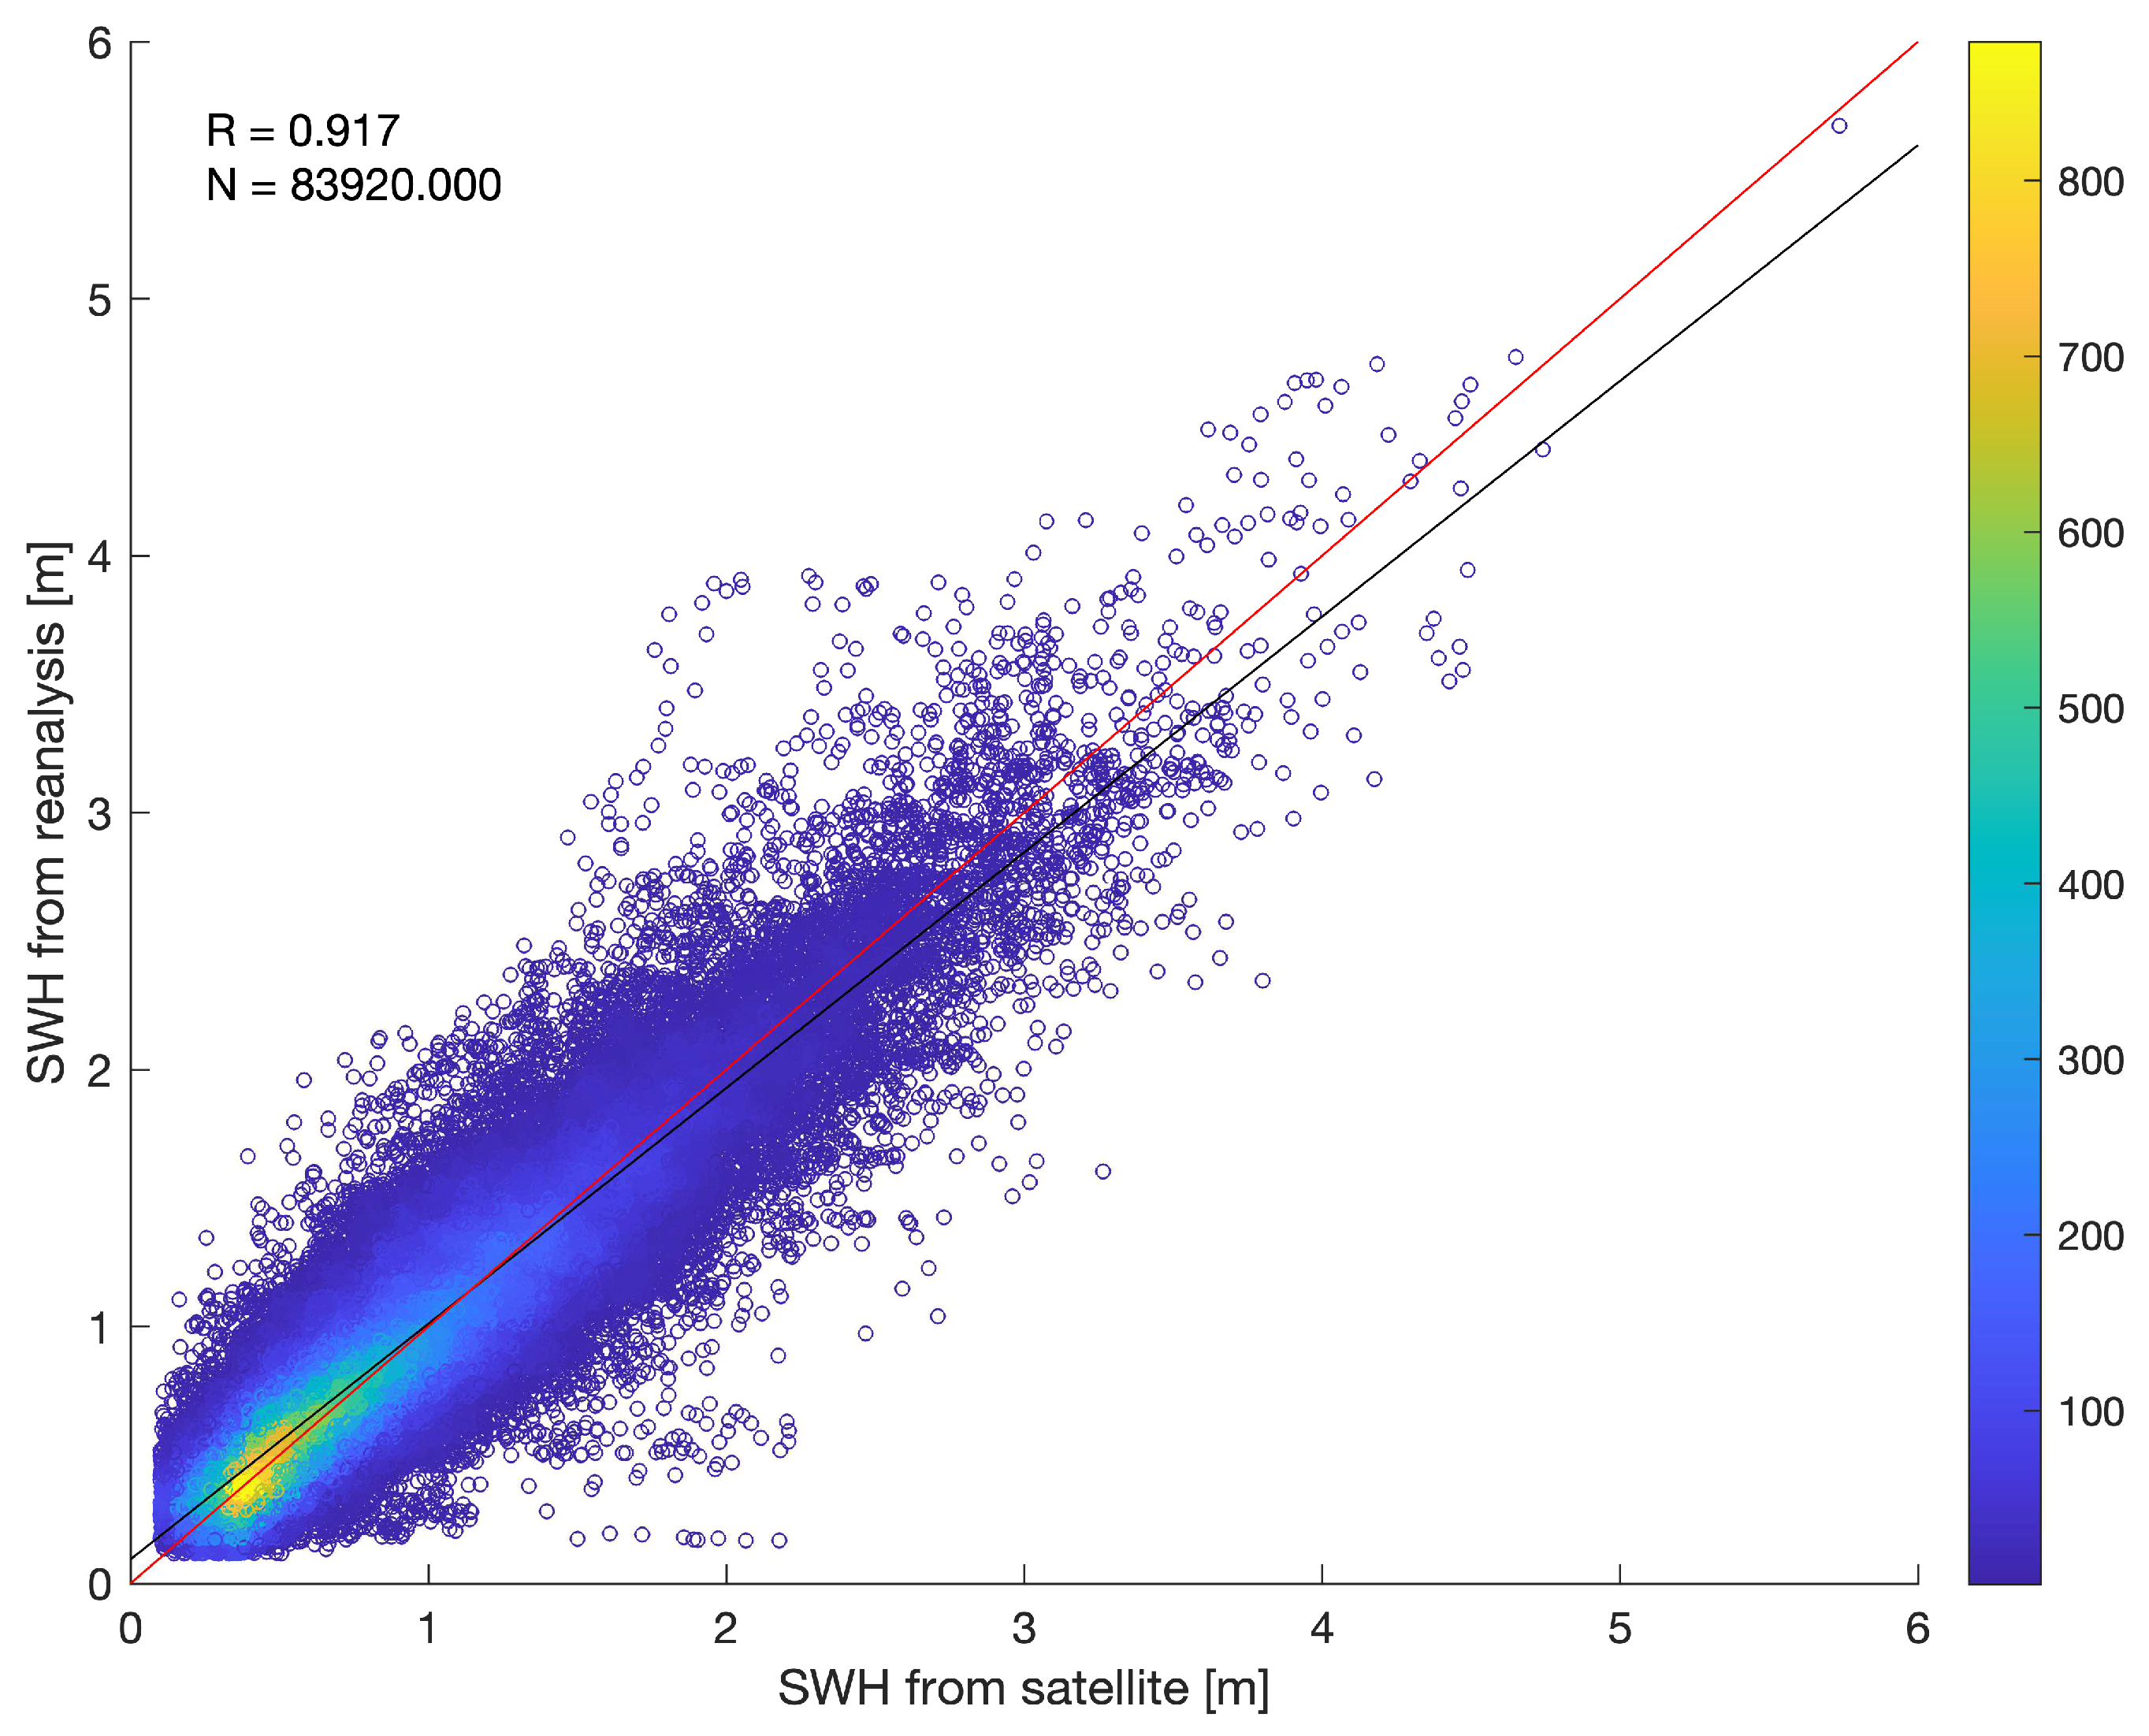
Figure 2.
Monthly distribution of the main statistical parameters for SWH validation. Upper panel: bias, MAE, RMSE, SI. Middle panel: R. Lower panel: N (number of observations).
Figure 2.
Monthly distribution of the main statistical parameters for SWH validation. Upper panel: bias, MAE, RMSE, SI. Middle panel: R. Lower panel: N (number of observations).
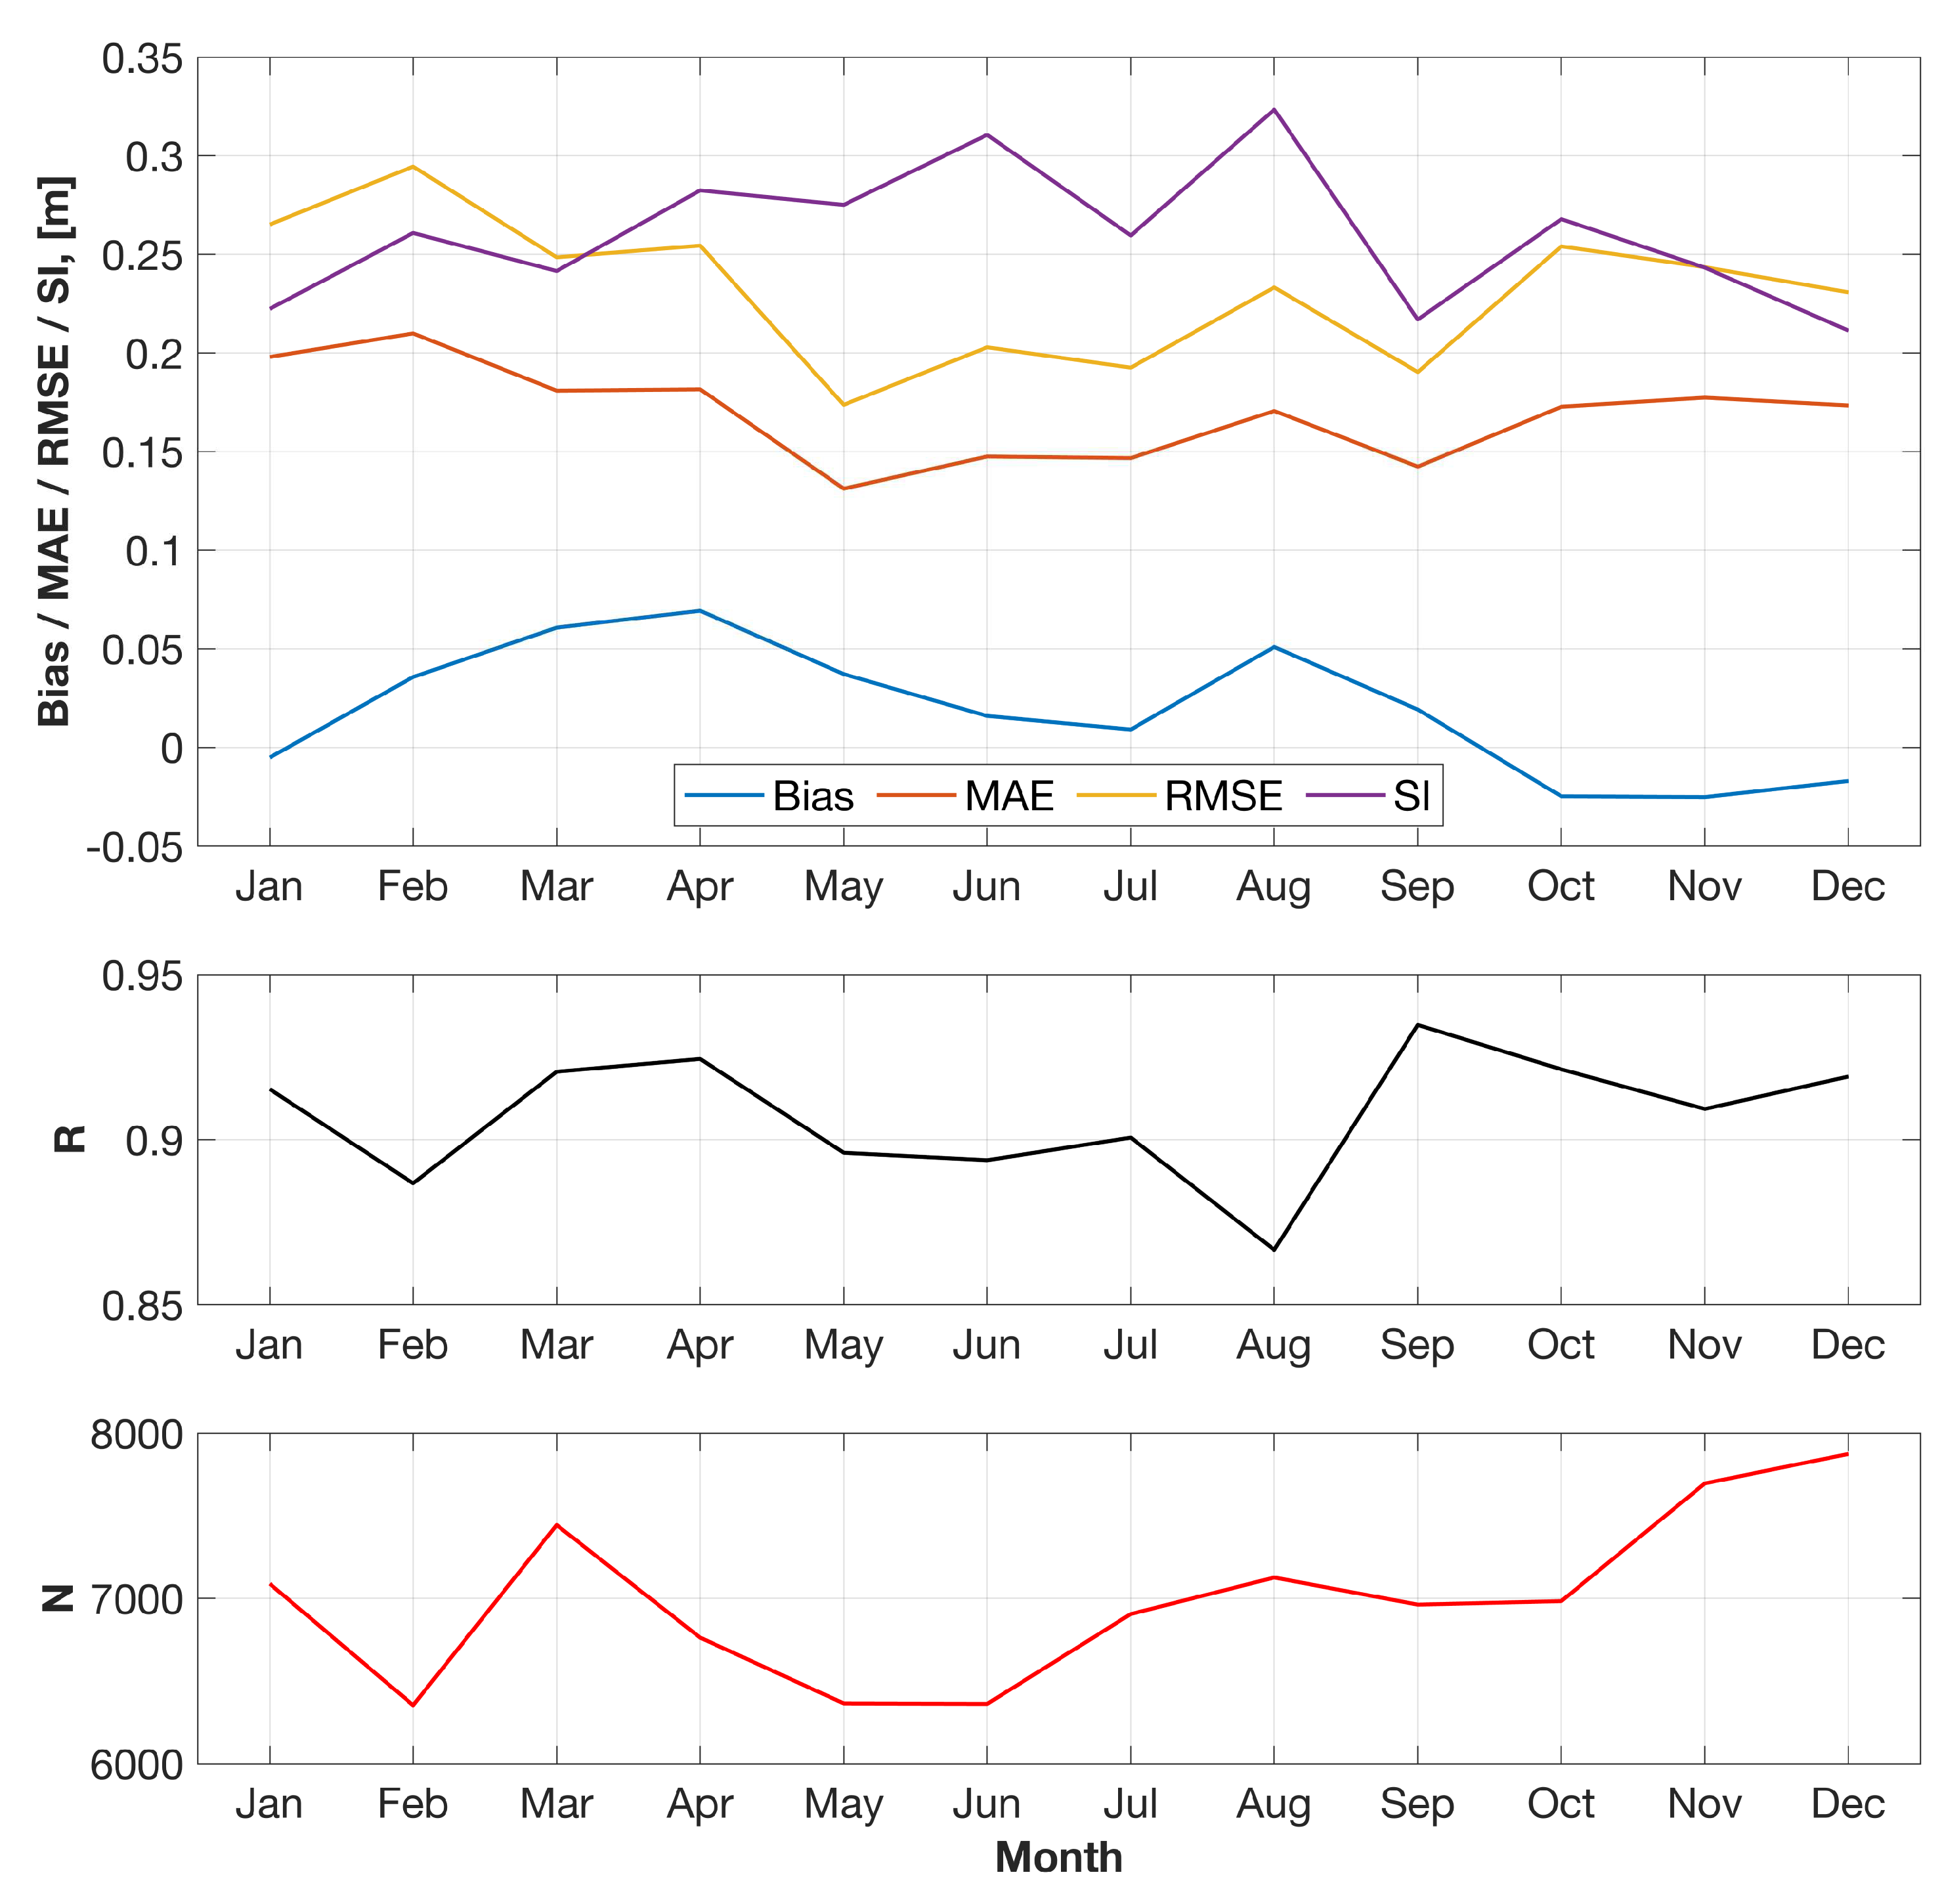
Figure 3.
Location of coastal points considered in this study.
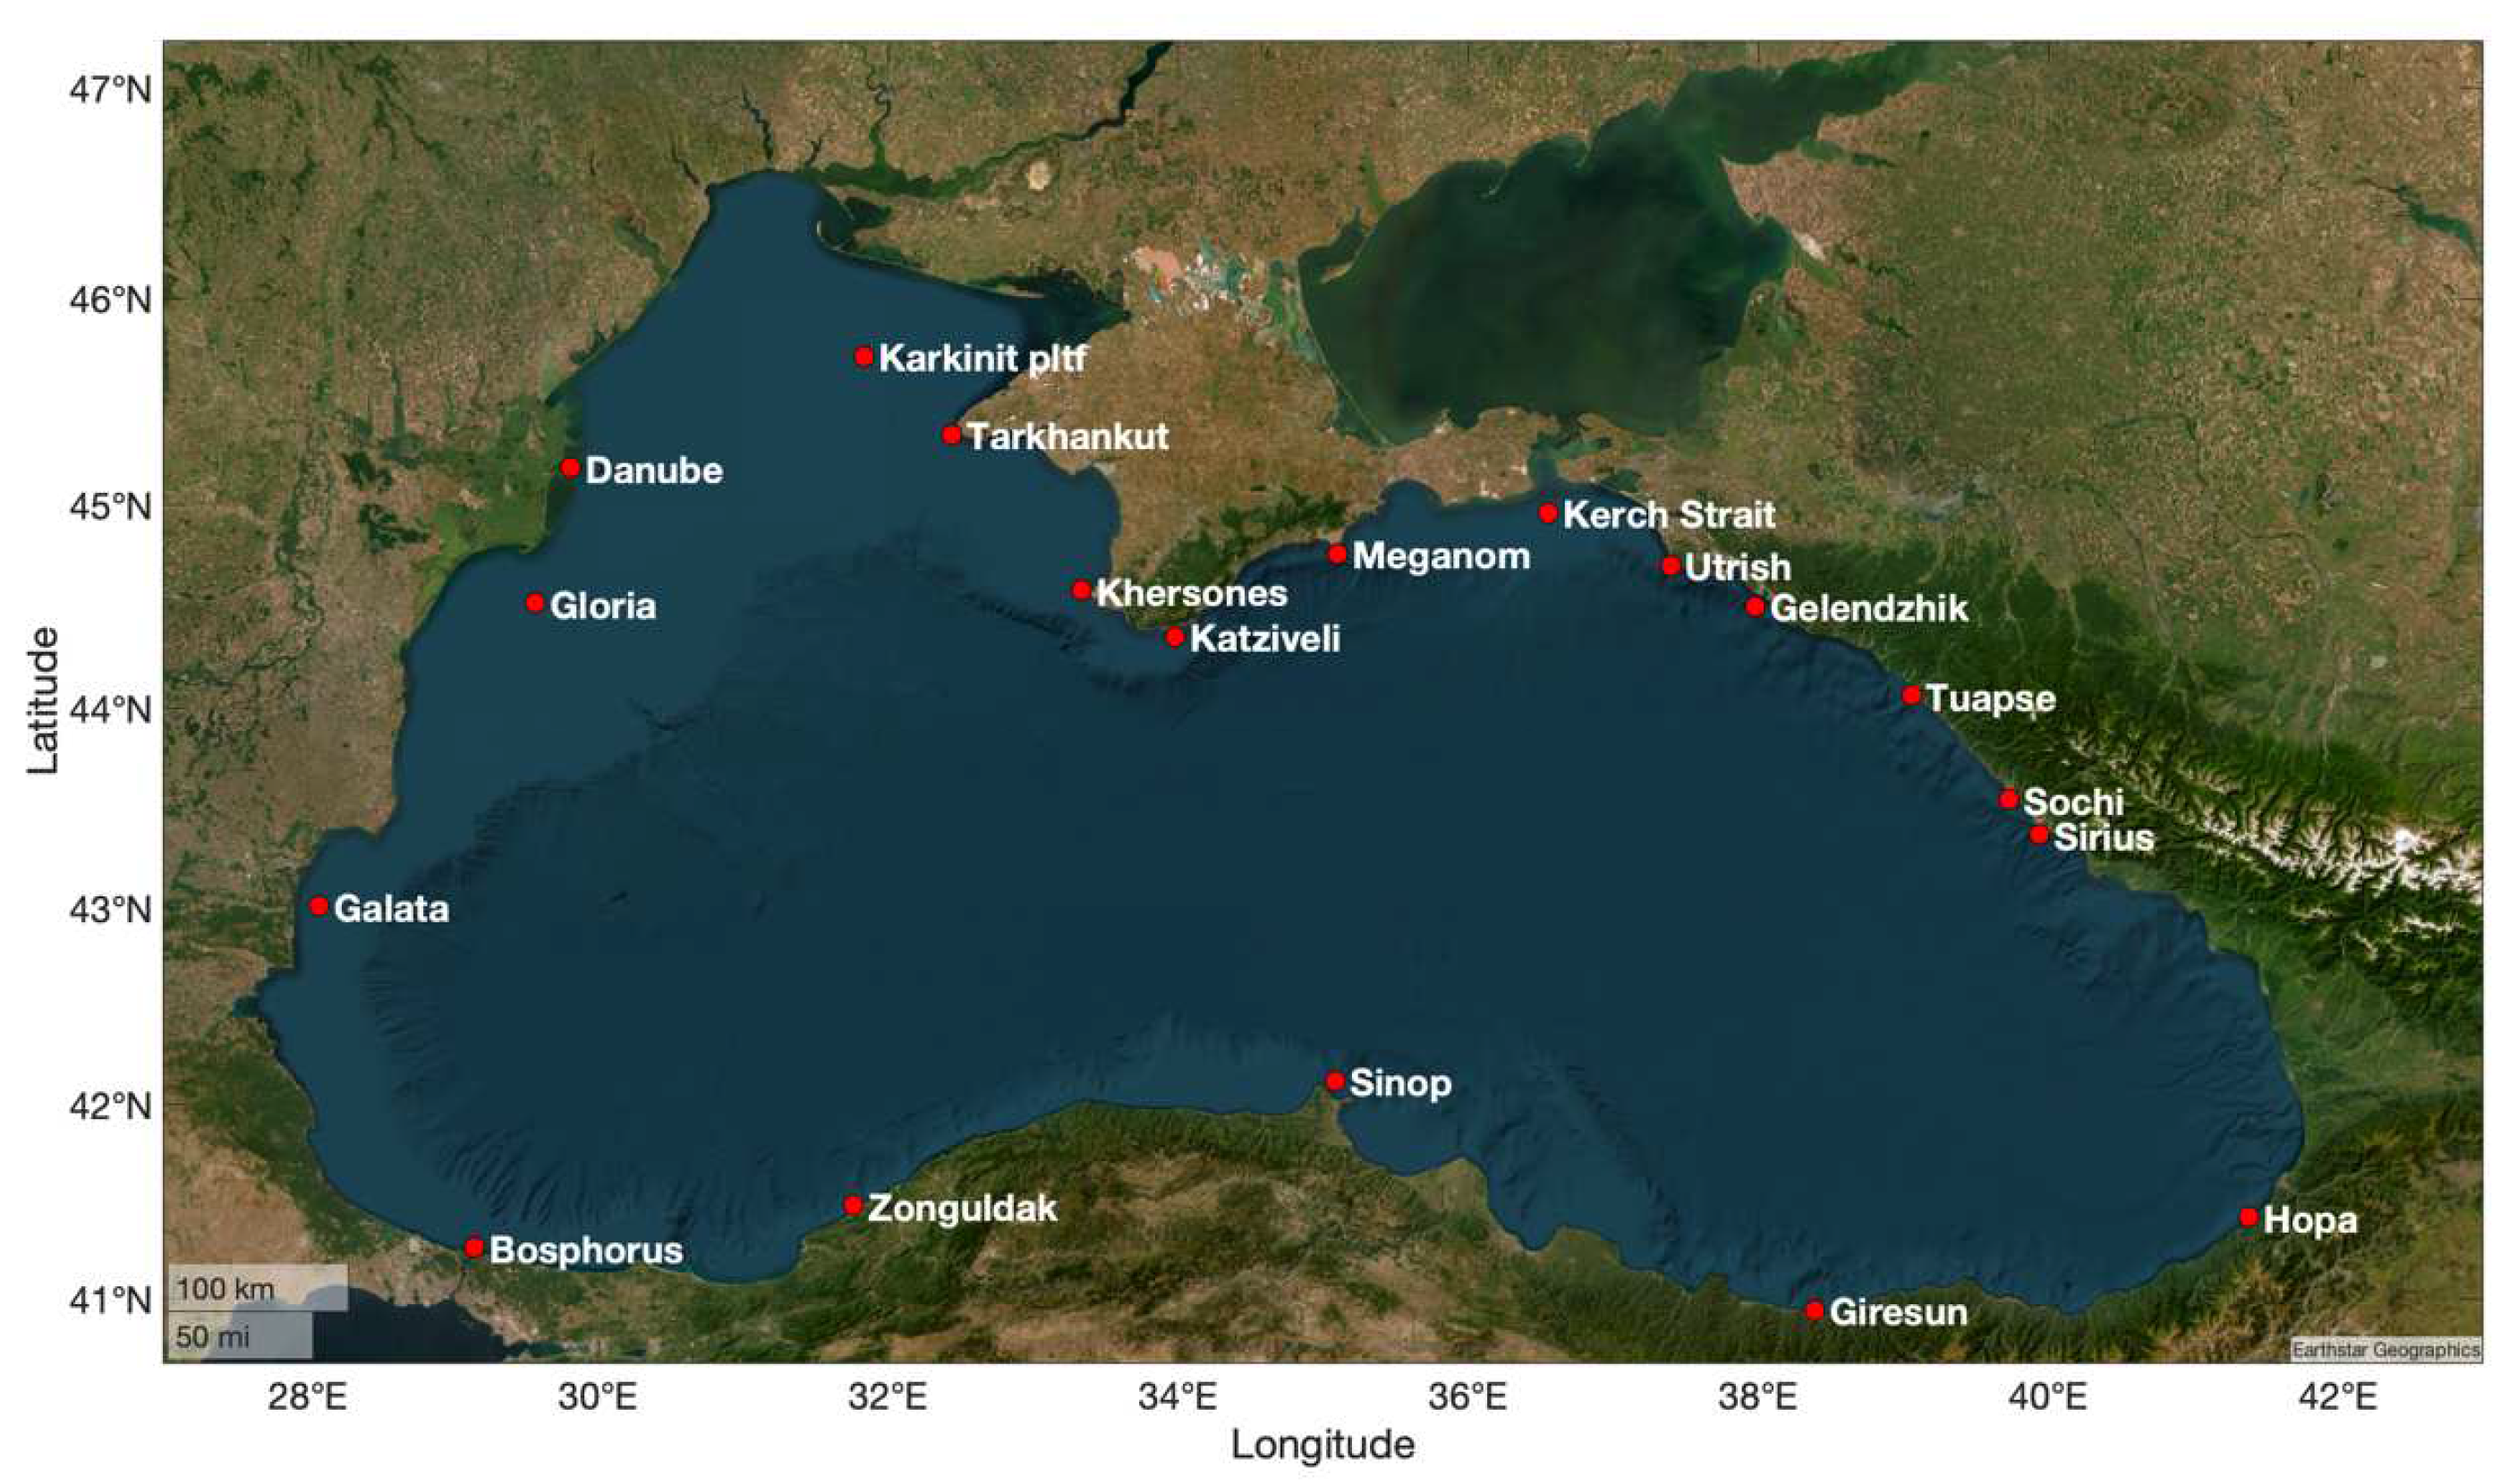
Figure 4.
Spatial distribution of maximal SWH values (top left panel), 99.9th percentile of SWH values (top right panel), 99th percentile of SWH values (bottom left panel) and 95th percentile of SWH values (bottom right panel) at the selected coastal points in the Black Sea.
Figure 4.
Spatial distribution of maximal SWH values (top left panel), 99.9th percentile of SWH values (top right panel), 99th percentile of SWH values (bottom left panel) and 95th percentile of SWH values (bottom right panel) at the selected coastal points in the Black Sea.
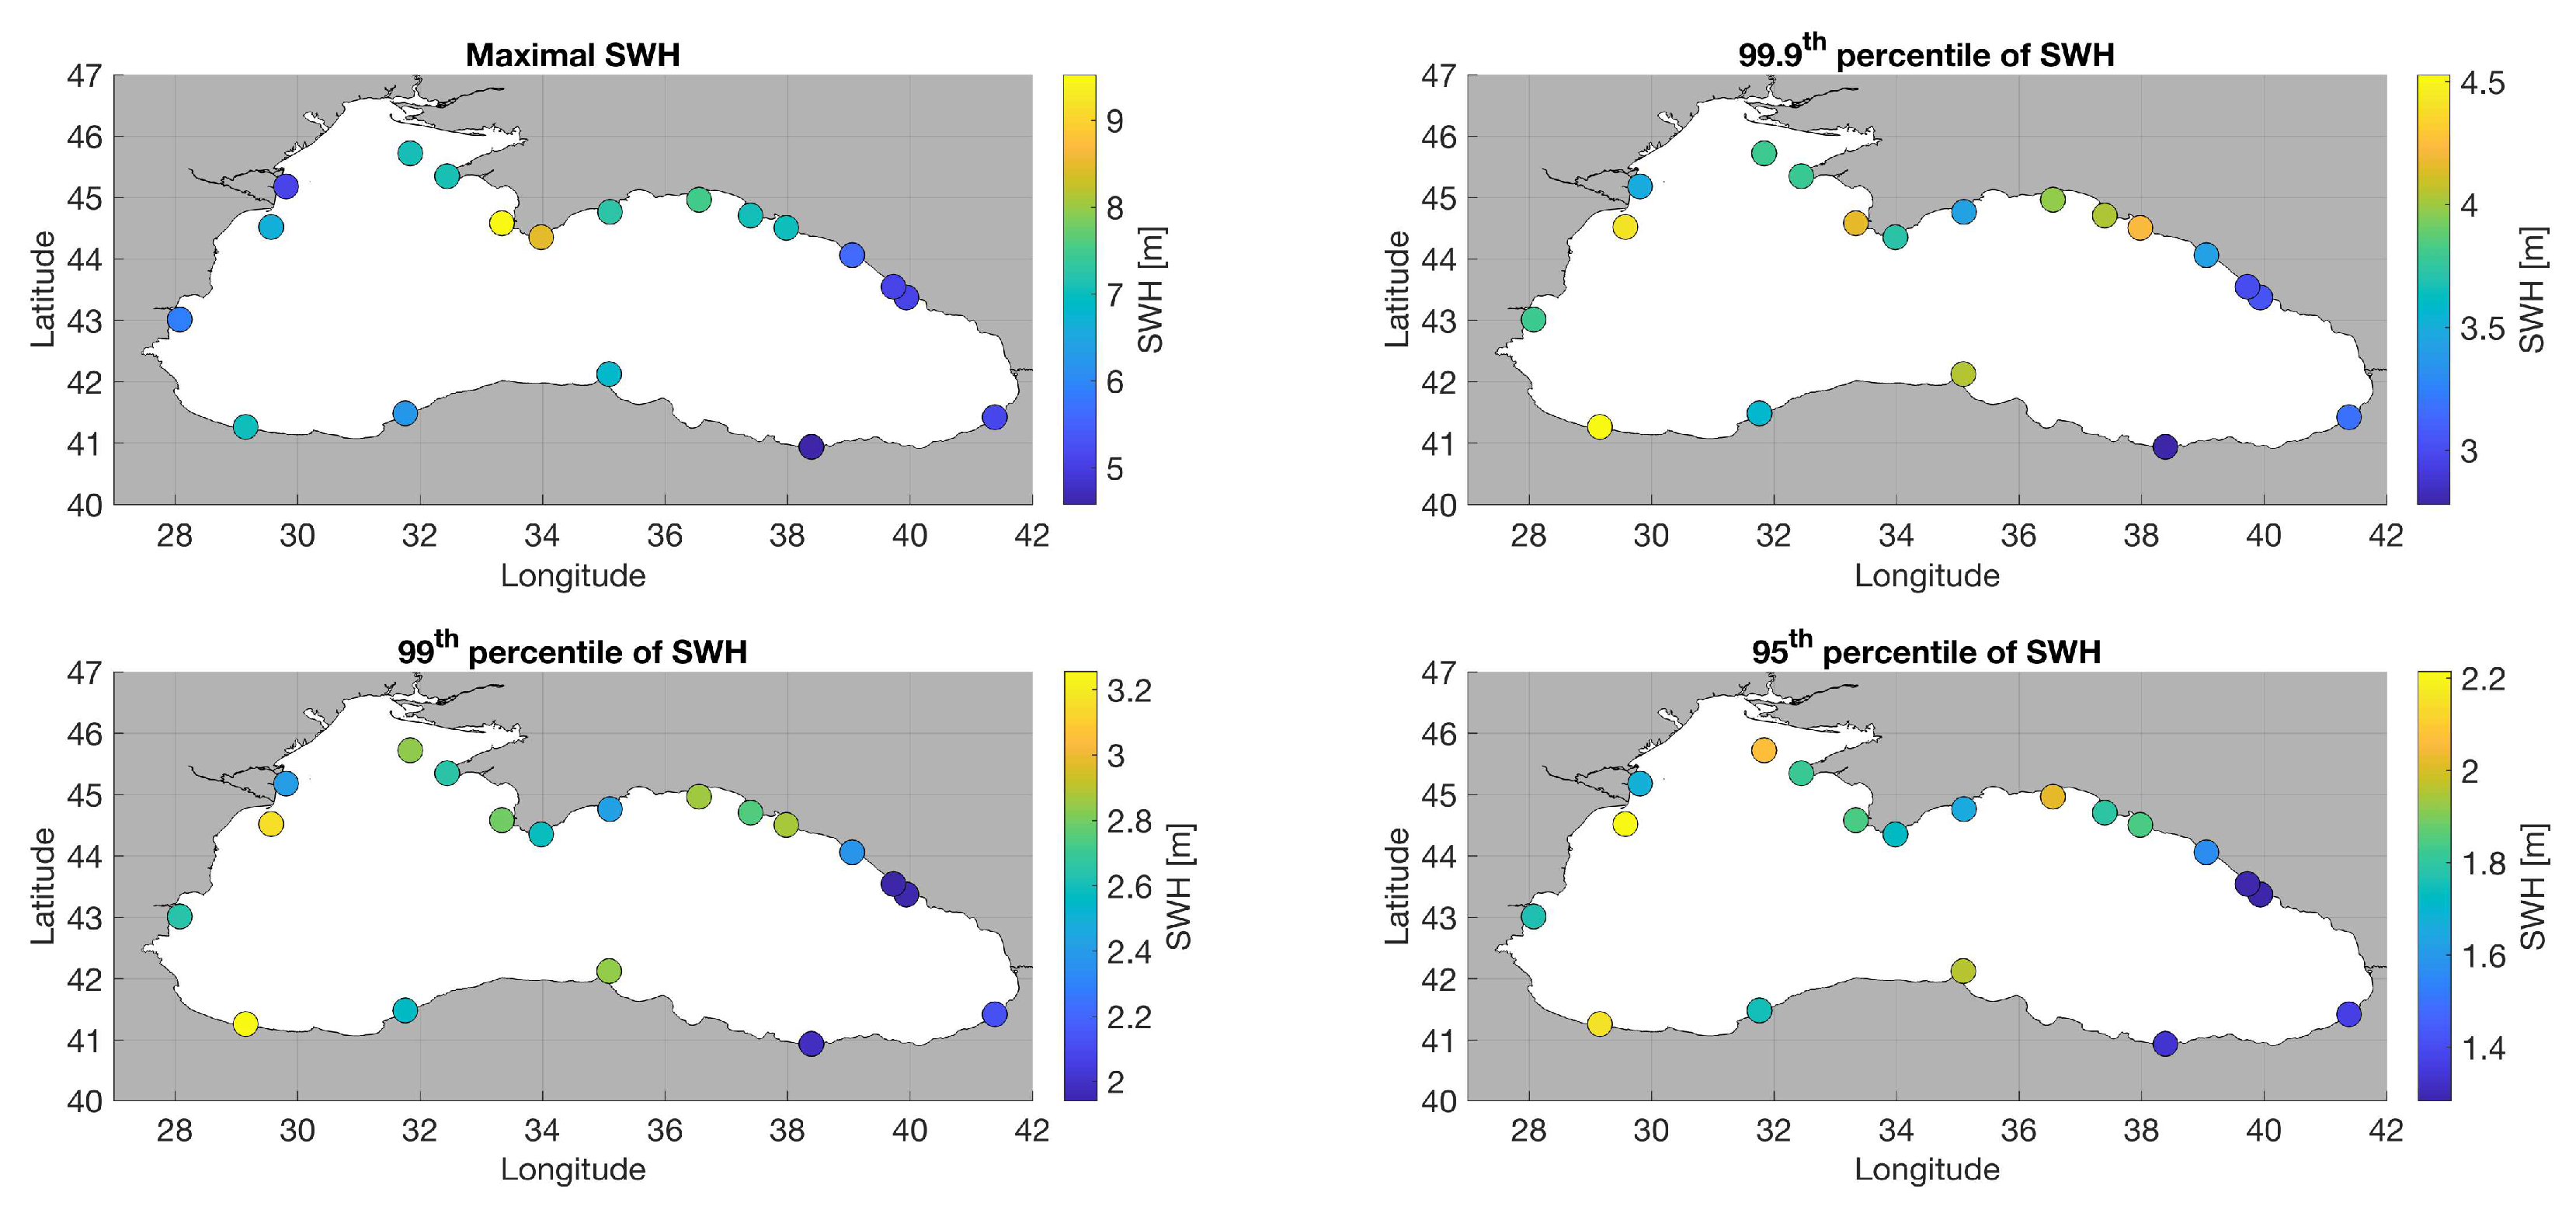
Figure 5.
Spatial distribution of linear trends of maximal SWH values (top left panel), 99.9th percentile of SWH values (top right panel), 99th percentile of SWH values (bottom left panel) and 95th percentile of SWH values (bottom right panel) at the selected coastal points in the Black Sea. Green upward-looking triangles denote positive trends; red downward-looking triangles denote negative trends. Cyan-filled triangles denote trends significant at 90 % confidence level; blue-filled triangles denote trends significant at 95 % confidence level.
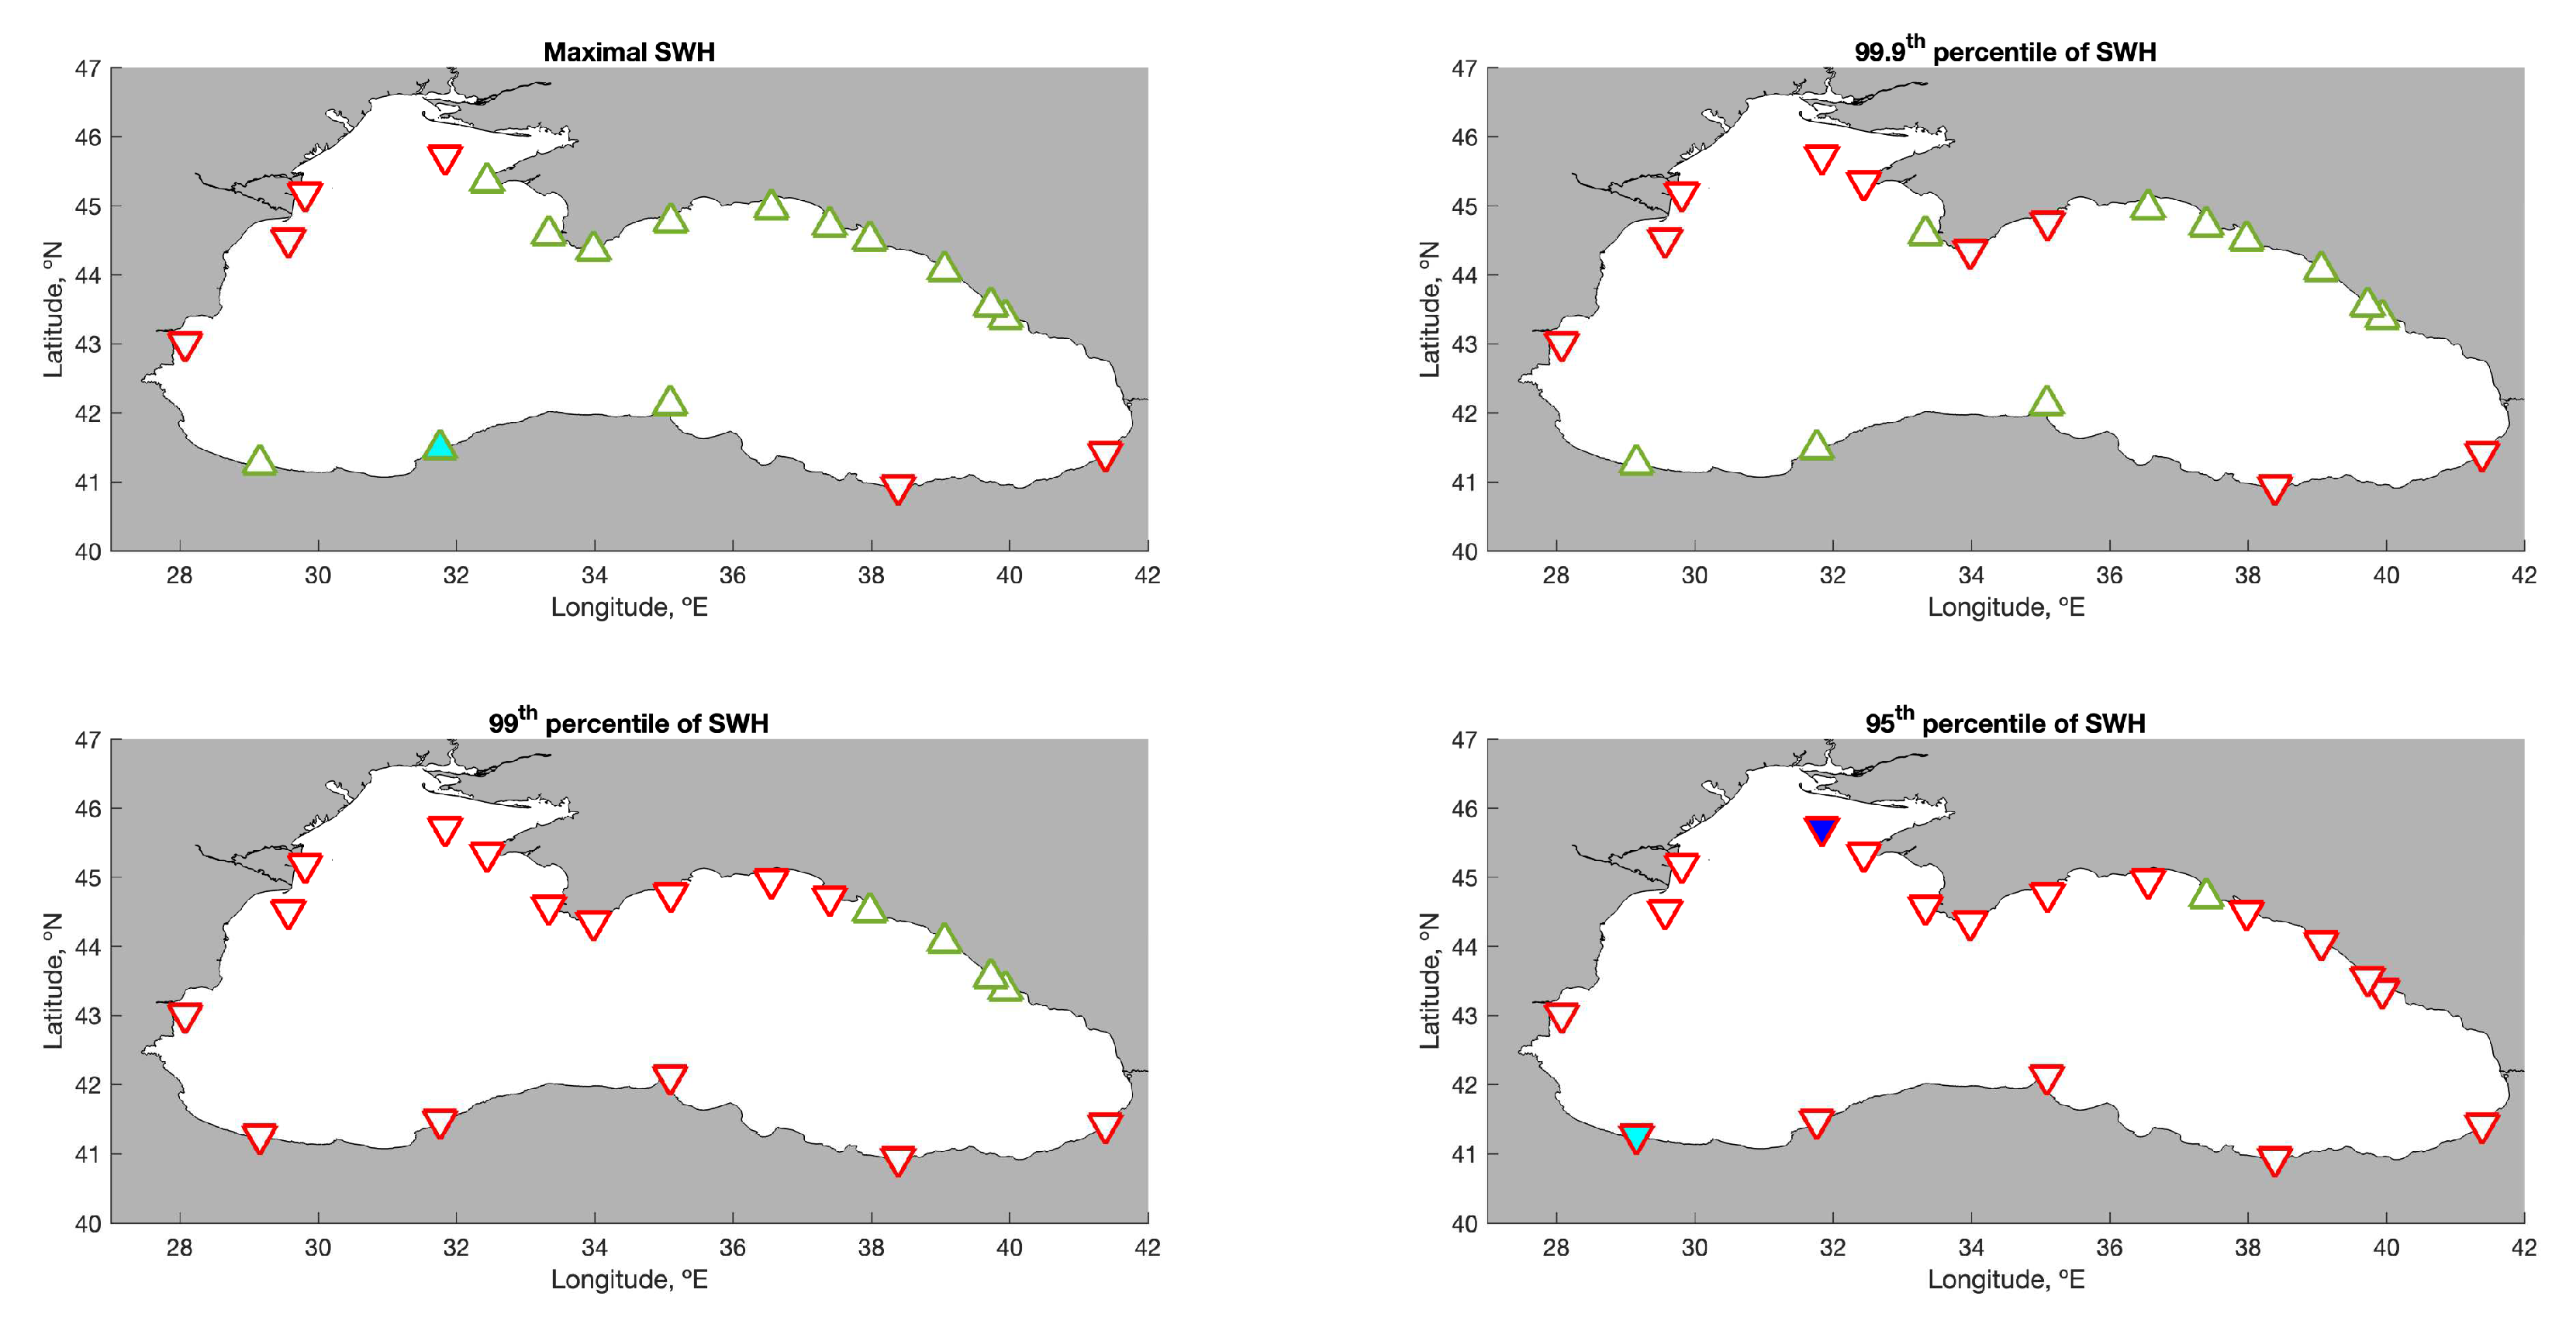
Figure 6.
Distribution of monthly linear trends values among the points in the coastal areas of the Black Sea. Refer to Table 3 for point numbers. Linear trends, which are significant at any of the 90 %, 95 % or 99 % confidence levels, are marked by squares. Not significant linear trends are marked by circles. The value of the trend is marked by the color of the symbol. (a) maximal SWH; (b) 99.9th percentile of SWH; (c) 99th percentile of SWH; (d) 95th percentile of SWH.
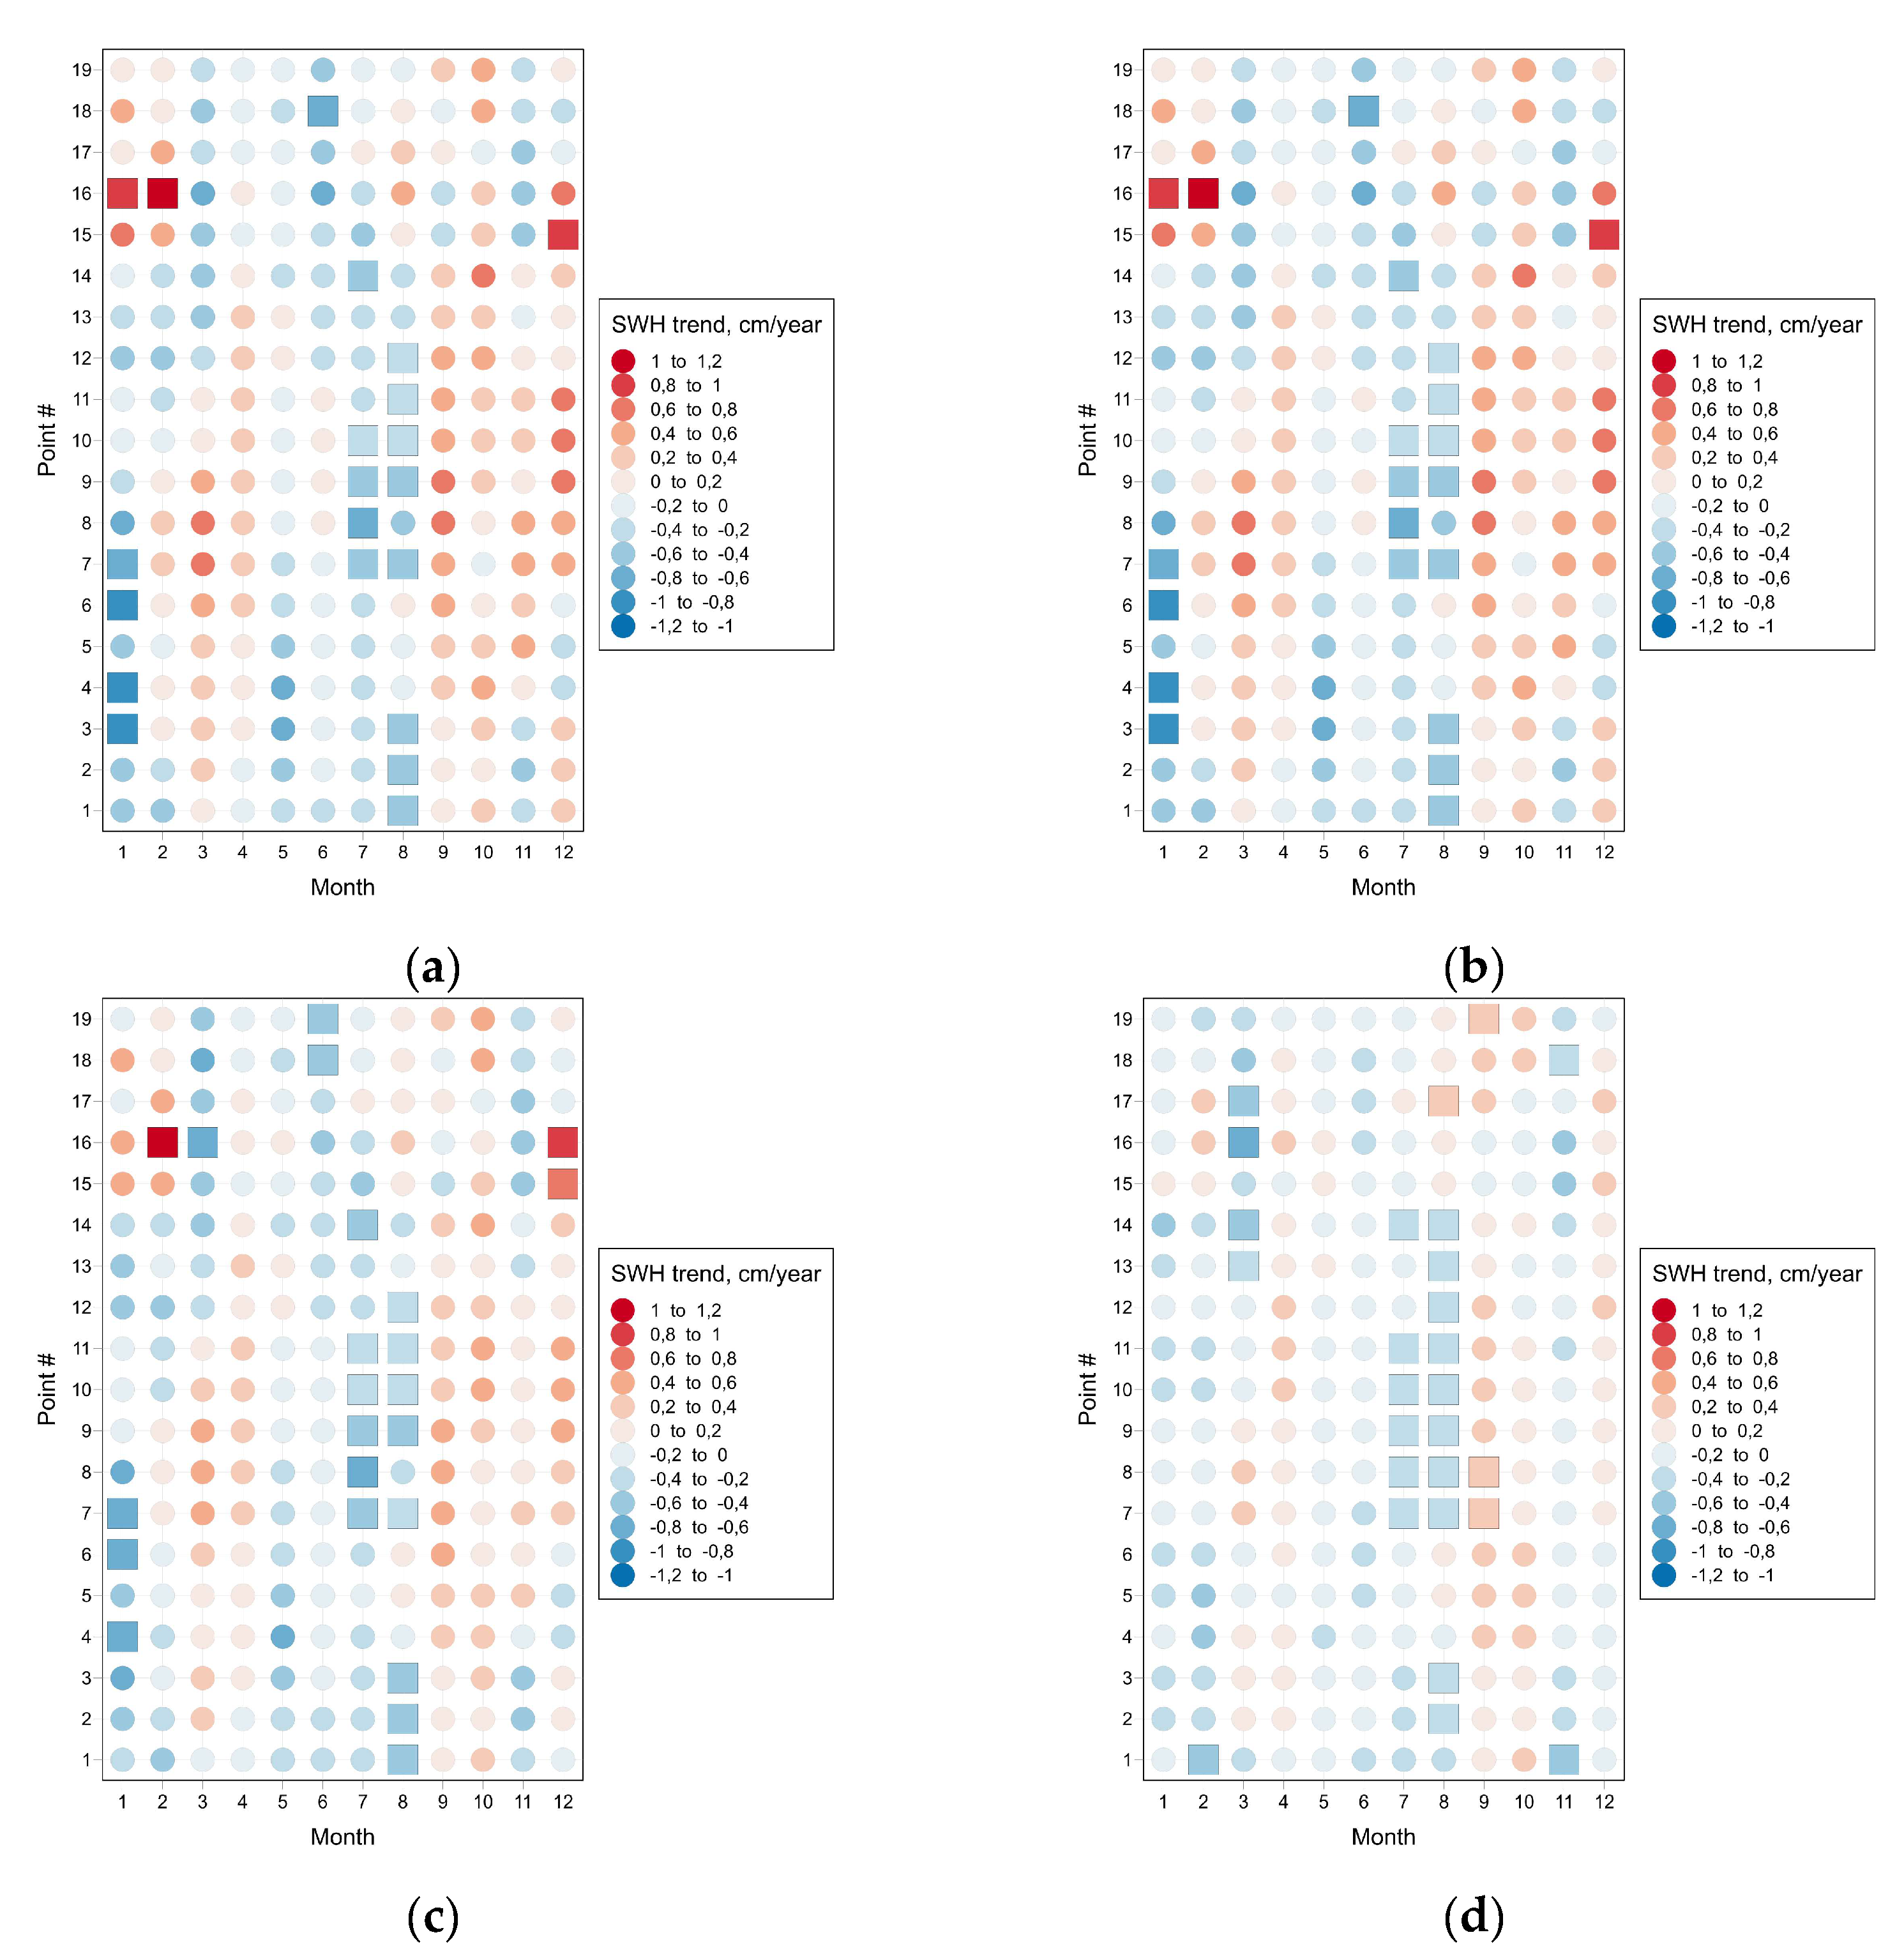

Table 1.
Main parameters of BSWR validation according to [34].
Table 1.
Main parameters of BSWR validation according to [34].
| Parameter | Jason satellite altimetry | in situ buoy measurements |
| R | 0.94 | 0.96 |
| MAE | 0.02 m | 0.12 m |
| SI | 0.21 m | 0.21 m |
Table 2.
Main parameters of BSWR validation against Saral/Altika altimeter.
| Parameter | Value |
| R | 0.92 |
| MAE | 0.17 m |
| SI | 0.26 m |
| RMSE | 0.23 m |
| Bias | 0.02 m |
Table 3.
Coordinates of coastal points considered in this study.
| Point # | Point name | Latitude, N | Longitude, E | Specific feature |
| 1 | Karkinit pltf. | 45.7231 | 31.8378 | Offshore oil & gas extraction; previously used in [38]. |
| 2 | Tarkhankut | 45.3460 | 32.4433 | Westernmost point of the Crimean Peninsula |
| 3 | Khersones | 44.5833 | 33.3343 | Vicinity of a major harbor (Sevastopol); key point for several previous studies (e. g., [42]). |
| 4 | Katziveli | 44.3557 | 33.9787 | Vicinity of southernmost point of the Crimean Peninsula; key point for several previous studies (e. g., [13]); previously used in [38]. |
| 5 | Meganom | 44.7633 | 35.0979 | Approximately equal distance between adjacent points |
| 6 | Kerch Srait | 44.9639 | 36.5532 | Intense shipping route connecting the Black Sea and the Sea of Azov; previously used in [38]. |
| 7 | Utrish | 44.7078 | 37.3953 | Vicinity of the maritime natural reserve «Utrish»; key point for several previous studies (e. g., [26,43]). |
| 8 | Gelendzhik | 44.5053 | 37.9783 | Major resort area; key point for several previous studies (e. g., [9,44]); previously used in [38]. |
| 9 | Tuapse | 44.0637 | 39.0567 | Major port and industrial area |
| 10 | Sochi | 43.5476 | 39.7275 | Major resort area; previously used in [38]. |
| 11 | Sirius | 43.3712 | 39.9387 | Major port and resort area; vicinity of several river mouths (Mzymta and Psou). |
| 12 | Hopa | 41.4233 | 41.3833 | Major city and port; key point for several previous studies (e. g., [10]); previously used in [38]. |
| 13 | Giresun | 40.9393 | 38.3891 | Major city and port; previously used in [38]. |
| 14 | Sinop | 42.1233 | 35.0867 | Major city and port; key point for several previous studies (e. g., [10]); previously used in [38]. |
| 15 | Zonguldak | 41.4829 | 31.7596 | Major city and port; previously used in [38]. |
| 16 | Bosphorus | 41.2665 | 29.1520 | Intense shipping route connecting the Black Sea and the Sea of Marmara; previously used in [38]. |
| 17 | Galata | 43.0124 | 28.0759 | Major city and port (Varna); previously used in [38]. |
| 18 | Gloria | 44.5200 | 29.5700 | Offshore oil & gas extraction; key point for several previous studies (e. g., [10,45]); previously used in [38]. |
| 19 | Danube | 45.1828 | 29.8111 | Delta of the Black Sea’s most significant river; key point for several previous studies (e. g., [6,17,18]). |
Table 4.
Values (in cm/year) and significance level of linear trends of annual values of maximal SWH and 99.9th, 99th, and 95th percentiles of SWH at the selected coastal points in the Black Sea.
Table 4.
Values (in cm/year) and significance level of linear trends of annual values of maximal SWH and 99.9th, 99th, and 95th percentiles of SWH at the selected coastal points in the Black Sea.
| Point # | Point name | Maximal SWH trend | 99.9th percentile of SWH trend | 99th percentile of SWH trend | 95th percentile of SWH trend | ||||
| value | Significance level | value | Significance level | value | Significance level | value | Significance level | ||
| 1 | Karkinit pltf. | -0.12 | no | -0.30 | no | -0.20 | no | -0.18 | 95 % |
| 2 | Tarkhankut | 0.00 | no | -0.09 | no | -0.16 | no | -0.07 | no |
| 3 | Khersones | 0.34 | no | 0.01 | no | -0.09 | no | -0.08 | no |
| 4 | Katziveli | 0.34 | no | 0.00 | no | -0.12 | no | -0.13 | no |
| 5 | Meganom | 0.24 | no | -0.06 | no | -0.11 | no | -0.10 | no |
| 6 | Kerch Strait | 0.29 | no | 0.16 | no | -0.05 | no | -0.08 | no |
| 7 | Utrish | 0.11 | no | 0.19 | no | 0.00 | no | 0.02 | no |
| 8 | Gelendzhik | 0.30 | no | 0.20 | no | 0.00 | no | -0.01 | no |
| 9 | Tuapse | 0.46 | no | 0.39 | no | 0.00 | no | -0.03 | no |
| 10 | Sochi | 0.35 | no | 0.34 | no | 0.06 | no | -0.07 | no |
| 11 | Sirius | 0.42 | no | 0.35 | no | 0.04 | no | -0.08 | no |
| 12 | Hopa | -0.11 | no | -0.13 | no | -0.07 | no | -0.02 | no |
| 13 | Giresun | -0.01 | no | -0.08 | no | -0.07 | no | -0.11 | no |
| 14 | Sinop | 0.32 | no | 0.20 | no | -0.13 | no | -0.16 | no |
| 15 | Zonguldak | 0.79 | 90 % | 0.44 | no | -0.09 | no | -0.12 | no |
| 16 | Bosphorus | 0.28 | no | 0.42 | no | -0.07 | no | -0.20 | 90 % |
| 17 | Galata | -0.31 | no | -0.38 | no | -0.08 | no | -0.10 | no |
| 18 | Gloria | -0.01 | no | -0.05 | no | -0.12 | no | -0.09 | no |
| 19 | Danube | -0.12 | no | -0.20 | no | -0.13 | no | -0.09 | no |
Disclaimer/Publisher’s Note: The statements, opinions and data contained in all publications are solely those of the individual author(s) and contributor(s) and not of MDPI and/or the editor(s). MDPI and/or the editor(s) disclaim responsibility for any injury to people or property resulting from any ideas, methods, instructions or products referred to in the content. |
© 2025 by the authors. Licensee MDPI, Basel, Switzerland. This article is an open access article distributed under the terms and conditions of the Creative Commons Attribution (CC BY) license (http://creativecommons.org/licenses/by/4.0/).
Copyright: This open access article is published under a Creative Commons CC BY 4.0 license, which permit the free download, distribution, and reuse, provided that the author and preprint are cited in any reuse.


