
Submitted:
18 March 2025
Posted:
18 March 2025
You are already at the latest version
Abstract
We propose and validate three linear regression models, using maximum air temperature and retrievals of LST of the MYD21A1D data product (LSTMYD21A1D) as response and predictor variables, for the three major biomes in the São Francisco River Basin as defined by the Instituto Brasileiro de Geografia e Estatística (IBGE) in the Map of Biomes of Brazil (MBB), which is often used to support public policies. A dataset of 94,544 observations of ground-based measurements and retrievals of LST is used to build the models. The efficacy and performance of the models are tested by means of cross-validation and of benchmarking with the linear regression model for the entire basin, regardless the type of biomes. The three proposed linear regression models indicated that LSTMYD21A1D explains well the variations in air Tmax for all the types of biomes in the SFRB (R2: from 0.46 to 0.54). The results of the cross-validation revealed that the three models were equally good at providing estimates of air Tmax across the basin (RMSE < 2.66oC and MAE < 2.14oC), even though they were built with subsets of data sampled in a specific biome. The benchmark test indicated that the models, when applied to their specific biome, provide better estimates of air temperature than the regression model for the entire basin.
Keywords:
satellite-based air temperature
; São Francisco river basin
; land surface temperature
; biomes
1. Introduction
The components of the land-surface water and energy balances are the drivers of expected threats from climate change in the upcoming decades. They have proven to be closely associated with significant environmental and socio-economic vulnerabilities that have resulted in historical and diverse changes in land use [1,2], especially in arid and semiarid regions, where access to water is limited. This is the case for the São Francisco River basin (SFRB) [3], the largest Brazilian drainage basin, which is particularly important due to its hydroelectric potential and for being the primary source of water to the Brazilian semiarid [2]. The basin covers about 639,219 with an extension of 2,863 km along diverse climatic regions that contains large areas of native forest and biodiversity [4]. As most of the surface water is transported from the land surface into the atmosphere in the Brazilian semiarid, land surface temperature and air temperature play a major role in the amount of surface water in the SFRB. Therefore, it is extremely important to monitor the land surface temperature and to track at which extent it can affect the air temperature in the SFRB in order to better understand the changes in vegetation, biodiversity, surface water and the built-up areas across the basin [5].
The Instituto Nacional de Meterologia (INMET) maintains a network of conventional and automatic weather stations to measure several meteorological variables, inclunding near-surface air temperature. Nevertheless, its density of weather stations across the country is a limiting factor for geospatial analysis [6,7,8,9,10]. Remote sensing is a source of information for obtaining short-term spatial and temporal data, which have grown in importance for the analysis of spatial patterns of temperature [11,12]. As more remotely sensed data from satellites, with global coverage, were made available, more studies were conducted to build and validate relationships between remote sensed data and ground-based measurements from INMET [13,14,15,16]. A recent geospatial analysis carried out by [17] presented statistics and comparisons between maximum air temperature and land surface temperature (LST) from the Atmospheric Infrared Sounder (AIRS) and the Moderate Resolution Imaging Spectroradiometer (MODIS) onboard Aqua satellite over Brazil. Their study used the MODIS land cover map to explain the spatial heterogeneity of sensible heat flux, LST and air temperature, however neither relationships were build across the dominant classes of land cover nor across the major river basins of Brazil, where most of the surface water converges to (hence, where most of water conflicts are).
The demand for water from the São Francisco River is expected to rapidly increase as the implementation of the Projeto de Integração do rio São Francisco, a project of a system of diversion canals aimed at preventing water shortages in some regions of the Brazilian semiarid, is about to be completed [18]. There is an urgent need to elaborate means of quantifying the components of land surface energy and water for SFRB using the land cover database provided by the Brazilian ministry for the environment, as it is likely to be the one used for regulating water use and for making water policies. Thus, this study proposes models to estimate maximum air temperature from retrievals of land surface temperature of the MYD21A1D data product () across the three types of biomes, outlined by the Brazilian government’s environmental agency, of the Bralizilian largest drainage basin. While we are aware that more complex models have been developed to estimate maximum air temperature from all sorts of satellite data products using statistical frameworks, machine learning and artifical neural networks [19,20,21,22,23], we rather use a simpler approach with linear regression models as we intend to focus on the unique objective of this study: to validate the well established relationship between remote sensed LST and ground-based air temperature for the policy-making land cover database over the SFRB. Also, we explore whether the models differ across the biomes.
The remainder of this paper is structured as follows: in the data and method section, we provide an overview of the SFRB biomes, remote data sources their processing and analysis. In the result section, we present the used datasets, the regression analysis and cross validation. In the discussion and conclusion sections, we present an analysis of the highlights of the results.
2. Data and Methods
2.1. Types of Biome in the SFRB
Land surface temperature and air temperature have proven to be closely related to the type of land use/cover. In this study, we hypothesize that SFRB is divided into three major types of land cover based on the Map of Biomes of Brazil (MBB) - or Mapa de Biomas do Brasil, in Portuguese -, which are: Caatinga, Cerrado and Mata Atlântica.
The MBB is a product created from a partnership between the Instituto Brasileiro de Geografia e Estatística (IBGE) and the Ministério do Meio Ambiante (MMA). To elaborate this map, IBGE and MMA assumed each biome as a region of the Brazilian land surface with a specific combination of fauna and flora with common past ecological and evolutionary cirscumstances, under the same geoclimatic conditions, that results to the present-day biological diversity.
A short description of each biome as well as their climate is given in this section, as they are the major drivers of change in the relationships between land surface temperature and air temperature proposed by this study.
Caatinga is characterized by different types of landscapes despite its semiarid climate. This is because its type of vegetation is drought tolerant and grows with very little rain, that usually fall scattered over the area assigned to Caatinga in the MBB.
Cerrado is considered to be a mix of woodland and grassland, with trees widely spaced over the landscape. It could be thought as a savanna with a larger biological diversity than Caatinga. The overall climate in the Cerrado is tropical with notable long dry seasons.
Mata Atlântica is located along the coast, where the overall rainfall received is associated with coastal land-sea interaction. Despite Mata Atlântica is under the same tropical climate than Cerrado, it is wetter, which favours its richness of biological variation. This biome is the most impacted by human activities as it is estimated to be home to more than 50% of the current population of Brazil.
Figure 1 illustrates the distribution of the three biomes in the SFRB.
2.2. MODIS LST Data
Land surface temperature (LST) is currently measured, with global coverage, by a Moderate Resolution Imaging Spectroradiometer (MODIS) aboard two satellites orbiting Earth, the Terra and the Aqua. While Terra’s orbit passes from north to south across the Equator in the morning, Aqua’s orbit passes from south to north over the Equator in the afternoon, offering two remotely-sensed LST every one to two days. Each MODIS provides high radiometric sensitivity in 36 spectral bands for several uses, being the thermal infrared (TIR) bands 31 and 32, imaged at a nominal resolution of 1 km, primarily used for LST data products. LST is retrieved by physical-based algorithms that convert the TIR bands received by MODIS to LST data products.
We used LST data from the new MODIS LST and emissivity data product, retrieved by the MOD21 algorithm, which combines a temperature emissivity separation algorithm with an improved water vapor scaling atmospheric correction scheme to prevent cold bias over arid and semiarid regions, such as the ones over the SFRB. The data products retrived by the MOD21 algorithm include a swath (scene) level-2 daily product, and daily and eight-day level 3 gridded products. The level of each data product identifies their level of data preprocessing, with the first level (level 1) indicating that the product has not been manipulated.
We chose the land surface temperature/emissivity daily level 3 global 1km sin grid day data product from the Aqua/MODIS, the MYD21A1D. It uses the spectral bands 29, 31 and 32 for retrieval of LST data. Its preprocessing consisted of averaging cloud free observations with good LST accuracies for day granules (i.e. only granules during daylight hours). Usually, the maximum daily temperature of the land surface occurs during daylight hours under cloud free conditions. The choice for the Aqua/MODIS over the Terra/MODIS was due to the specifications of their orbit, since Aqua/MODIS’s overpass time is at 13:30 local time against the 10:30 local time overpass time of the Terra/MODIS, we hypothesize that Aqua/MODIS’s measurements reflects better the effects of the peak of the sun’s solar irradiance - which is around noon - on the LST better than Terra/MODIS. That said, the MYD21A1D is likely to have retrieves of LSTs much closer to the maximum daily temperature of the land surface. These factors make retrieves of LST from the MYD21A1D the most suitable LST data to explore the relationships between maximum air temperature and maximum land surface temperature proposed here.
The entire MODIS archive is regularly reprocessed for overall improvement and revisions. We used the version 6.1.
Retrievals of LST data from the MYD21A1D product were downloaded from NASA’s Land Processes Distributed Active Archive Center (LP DAAC). Aqua satellite was launched in 2002. Thus, the data used in this study spans from the very first observation available at LP DAAC (on July 4, 2002) to present at a nominal resolution of 1 km and a temporal resolution of 1 day.
2.3. Site-Based Data
The Instituto Nacional de Meteorologia (INMET) maintains over a million of data records from weather stations nationwide in the Banco de Dados Meteorológicos (BDMEP), following the standards and requirements formulated by World Meteorological Organization (WMO) for climate observations.
BDMEP uses a web-based portal for data selection based on the frequency of observations, the type of weather station, the geographic region, time frame as well as the INMET identification number for the weather station. We selected and downloaded all the daily observations of maximum air temperature in the São Francisco River basin (SFRB) for the period of record spanning from July 4 2002 to present, when MODIS/Aqua data is also available. In total, 48 weather stations met this filtering criteria.
2.4. Data Processing
MYD21A1D is produced at resolution of 1 km on a tiled grid of sinusoidal projection. To extract the MYD21A1D data product, we identified the tiles that the drainage area of the SFRB falls in. The tile coordinate system has two axes, one vertival and one horizontal, with the origin at the upper left corner of the grid, which divides the entire world into 35 horizontal components (columns) by 17 vertical components (rows). The drainage area of the SFRB overlaps five tiles of the grid, which are: h13v11, h13v10, h14v10, h13v9 and h14v9, with h and v standing for horizontal and vertical components of the grid. Once the tiles were identified, we used them to tailor the process of downloading and extracing the LST dataset of the MYD21A1D data product (i.e. the layer LST_1KM). Then, we merged the five tiles into one single tile. The MOD21A1 algorithm sorting process removes all observations that are not cloud free and have poor land surface temperature and emissivity accuracies, plus it also removes tiles having coverage less than 15%. We figured out that some cells across the tiles could still have missing data, that is more evident in the tiles with observation coverage close to (but less than) the threshold of 15%. So we assigned missing values to these cells too.
MYD21A1D is produced on a daily basis, so we used the geographic position of the 48 weather stations to extract daily values of LST from the MYD21A1D data product. This process result to 48 time series of daily retrievals of LST from MODIS/Aqua across the São Francisco River basin. Retrievals of LST were converted from MODIS/Aqua digital values to the Celsius scale, which is the scale adopted for their records of air temperature, by multiplying the digital values from MODIS/Aqua dataset by the scale factor of 0.02, given in the MODIS data user guide to convert LST digital values to the Kelvin scale, and then by subtracting the result by 273.15.
The data processing for the records of daily maximum air temperature from the weather stations consisted of removing the missing values from the time series, which result to a dataset of 245,753 observations.
At last, we identified which retrievals of MODIS/Aqua match to their corresponding record of maximum air temperature from the weather stations. The pairs of data that had at least one missing value were dropped from the regression analysis.
2.5. Regression Analysis
We used linear regressions to model the relationships between the retrievals of MODIS/Aqua and maximum air temperature. Measurements of maximum air temperature were used as the response variable whereas the retrievals of MODIS/Aqua LST data was the predictor variable. Each linear regression model consists of two regression coefficients that define the best line of fit that minimizes the variance of the dataset. So, a set of eight regression coefficients were defined, being two coefficients for each of the three types of biome in the São Francisco River basin and two more using the entire dataset, regardless the biome. The ability of the regression models was measured by the correlation coefficient () and the residual standard error.
2.6. Cross-Validation
In order to identify whether the bounds of the biome, as defined in the Map of Biomes of Brazil (MBB), impact the predictions of LST, we performed a cross-validation. For this, we set three subsets of data based on the locations of the INMET weather stations and the boundaries of the biomes. Then we validated the regression model, trained on one subset, on the other two subsets and on itself (for reference). Another reference used in the cross-validation is the validation of the regression model trained on all subsets. We used the Root Mean Squared Error (RMSE) and Mean Absolute Error (MAE) to evaluate the models.
3. Results
3.1. Datasets
After the data processing, we selected 48 weather stations from the Banco de Dados Meteorológicos (BDMEP) of the Instituto Nacional de Meterologia (INMET) for April 2002 -present. The selected weather stations were listed and sorted by the biomes in the São Francisco River basin (Table 1). Out of the 48 selected weather stations, 26 are located throughout the biome Caatinga, 19 in the biome Cerrado and 3 in the biome Mata Atlântica. Then, four pairwise datasets were generated from the observations of maximum air temperature from the selected weather stations and their corresponding retrievals of LST from the MYD21A1D data product: one dataset per biome in the São Francisco River basin and a last one with them all combined, resulting to 50,540 data points for the biome Caatinga, 38,238 for the biome Cerrado, 5,766 for the biome Mata Atlântica and 94,544 for all of them combined.
3.2. Regression Analysis
The resulting datasets are presented in the four scatterplots in Figure 2. Each scatterplot includes two lines: the solid line represents the regression linear model, while the dashed line is the line of equality, to measure the divergence of the data points.
A summary of the regression analysis is shown in Table 2. The linear relationships between maximum air temperature and LST data are given by the estimated coefficients of the regression models as:
the linear regression model can be adapted for each biome by replacing the estimates of the variables and provided in Table 2. The same can be done to adapt the overall linear regression model for the São Francisco River basin.
The residual standard error ranged from 2.07 °C, for the regression model for the biome Cerrado, to 2.41 ° C for the regression model for the biome Mata Atlântica. As for the correlation coefficient, values varied from 0.46, for the regression model for the biome Caatinga, to 0.54 for the regression model for the biome Cerrado.
3.3. Cross-Validation
The results of the cross-validation, presented in terms of Root Mean Squared Error (RMSE) and Mean Absolute Error (MAE) between actual data sampled in the biomes of the SFRB and predictions of each of the models, is summarized in Table 3.
As reference, the RMSE and MAE between the predictions of the regression model for the entire basin and the actual data is presented. It provided an average perfomance across the models with RMSE and MAE of 2.15°C and 1.69°C for actual data in the biome Caatinga, 2.09°C and 1.65°C for actual data in the biome Cerrado and 2.53°C and 2.05°C for actual data in the biome Mata Atlântica. Another reference used in the cross-validation is the predictions made by the regression model that was built from its own subset of actual data. They provided the best fit across the models, as the RMSE and MAE between the predictions of the regression model for the biome Caatinga and the actual data in the biome Caatinga were of 2.13°C and 1.67°C; of 2.07°C and 1.63°C for the ones for Cerrado; and of 2.41°C and 1.95°C for the ones for Mata Atlântica.
The RMSE and MAE calculated for the predictions of the regression models built for each of the biomes in the SFRB across all of the combinations of the subsets of actual data in the biomes ranged from 2.11°C to 2.66°C and from 1.65°C to 2.14°C.
4. Discussion
Figure 2 illustrates a general trend, with a positive correlation, for all datasets. This trend is expected as air temperature is closely related to the variations in the land surface temperature due to the surface heat fluxes from Earth surface to the air, especially for maximum daily temperatures. This pattern is evident for the extreme values of maximum LST, as they mostly fall below the line of equality, when land surface is likely to be hotter than air. All the linear regression models captured this pattern from the datasets.
Because all relationships were built from relatively large datasets (up to 94,544 data points), the standard errors of the estimated coefficients were close to 0, which can be thought as a measure of accuracy of the regression coefficients. This reflects to the ability of the retrievals LST from data the MYD21A1D data product to predict the maximum air temperature, which turned out to be statistically significant for a 95% confidence interval (p-value < 0.01 – see Table 2). This means that the retrievals of LST can be used as predictor variables of the maximum air temperatures for all the regression models proposed here for the São Francisco River basin.
The values of residual standard error and correlation coefficient indicated that the regression models are equaly good to predict maximum air temperature from Aqua/MODIS LST data, with the regression model for the biome Cerrado providing slightly better fit. Also, the regression models for the biomes Caatinga and Cerrado yielded similar results to the regression model for the entire basin. This is both due to the fact that most of the data points (88,778 out of the 94,544) is derived from the biomes Cerrado and Caatinga and due to the fact that the São Francisco River basin is dominantly covered by Caatinga and Cerrado.
Despite the average distance of the regression line to the data points for the biome Mata Atlântica to be larger than the other three regression models, likely because its sample size is rather small, the correlation cofficient indicates that the linear relationship for this biome is as strong as the other three linear relationships.
The results from the cross-validation revealed that the models built for the three types of biomes predicted Air for the others biomes in the SFRB as well as the overall regression model for the São Francisco River basin. That is because (1) the biomes Cerrado and Caatinga do not differ much from each other, so LST and air temperature have the same amplitude over the day, and (2) the surroundings of the weather stations at which observations of Air were sampled for the biome Mata Atlântica are long under the effect of urbanization, which lead the range of LST and air temperature to be near to the range of the observations of semiarid regions of the biomes Cerrado and Caatinga.
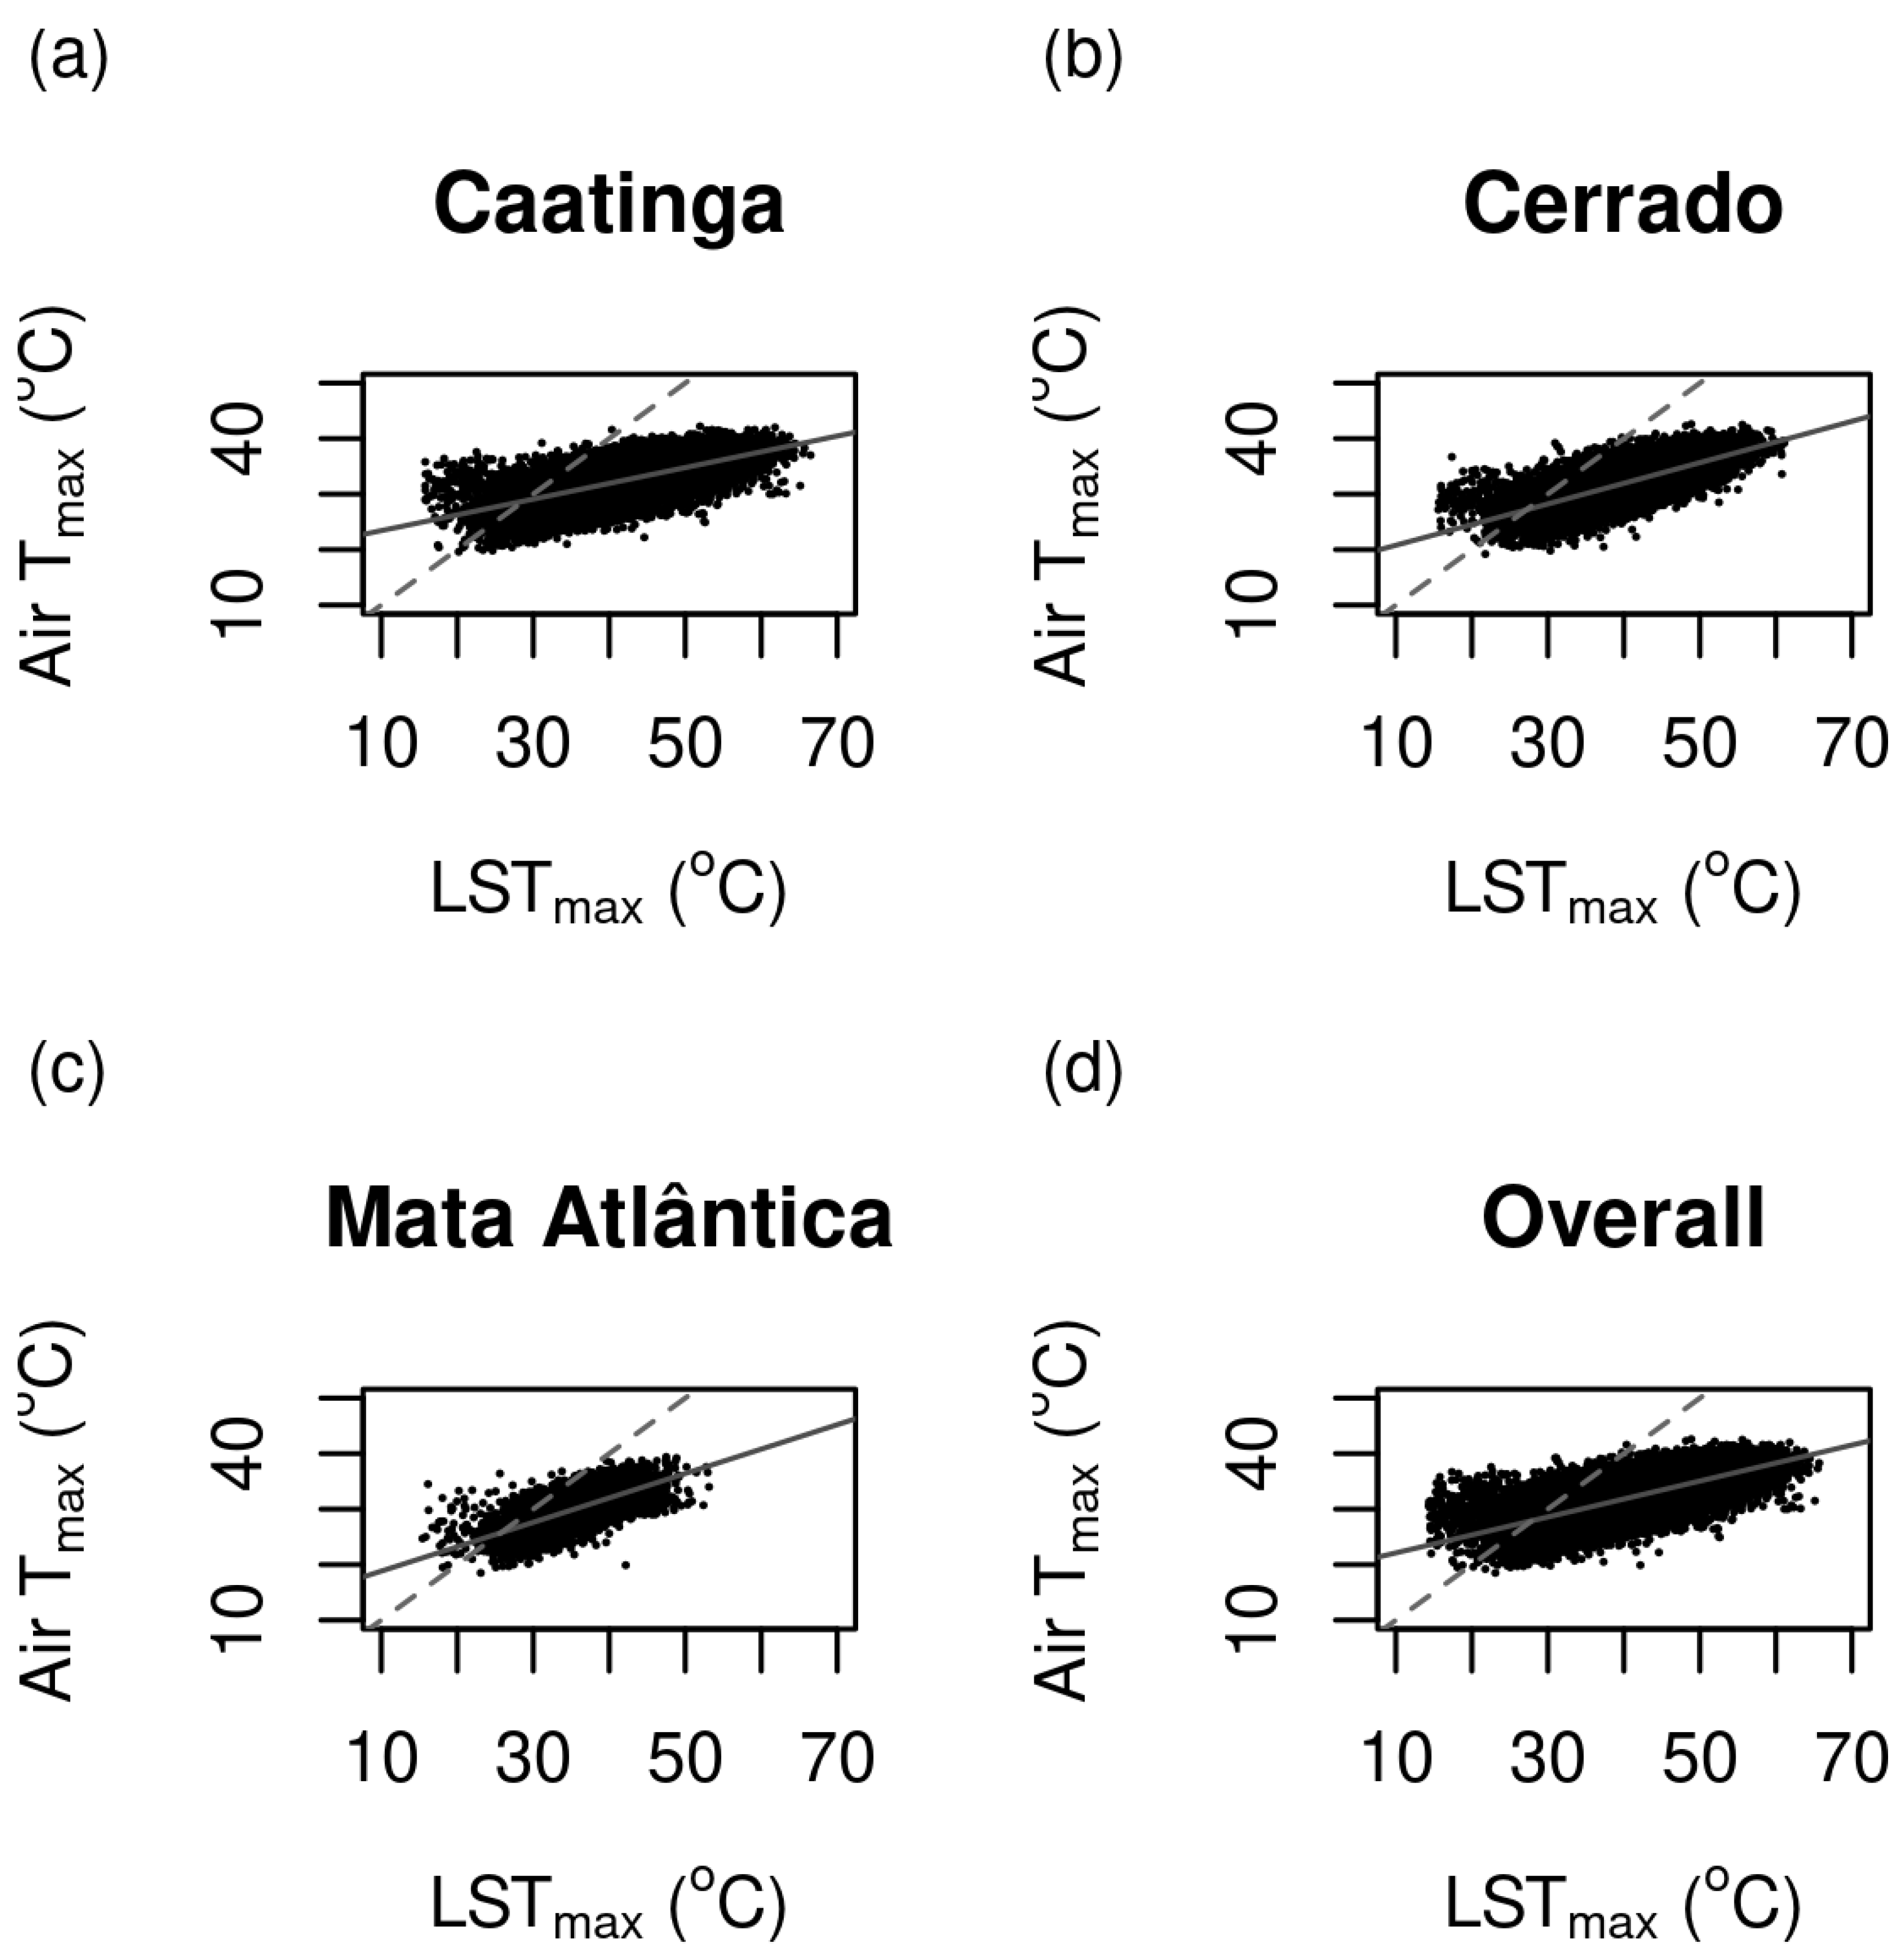
Figure 2.
Comparisons between observations of maximum air temperature at the INMET site-based weather stations () and their corresponding retrievals of LST from the MYD21A1D data product () over the biome (a) Caatinga, (b) Cerrado, (c) Mata Atlântica and (d) all of them combined.
Figure 2.
Comparisons between observations of maximum air temperature at the INMET site-based weather stations () and their corresponding retrievals of LST from the MYD21A1D data product () over the biome (a) Caatinga, (b) Cerrado, (c) Mata Atlântica and (d) all of them combined.
5. Conclusion
We performed a regression analysis with over than 5,000 data points (at least) per dataset, spanning from 2002 to present, that yielded to four linear regression models, which represent the relationships between maximum air temperature and LST from the MYD21A1D data product (): three for each biome in the São Francisco River basin, and one for the entire basin. All the linear regression models showed the positive correlation between extreme values of maximum air temperature (Air ) and land surface temperature, as retrieved from the remote sensing product. The regression models explained, at least, 46% of the variation within the observations of maximum air temperature, which means that could be used as key variable to estimate Air in the São Francisco River basin.
The bounds of the biomes, as proposed in the Map of Biomes of Brazil, not necessarily implied to significant variations in across the São Francisco River basin, so all the four regression models were equally good to provide estimates of Air from .
Author Contributions
Conceptualization, Claudia Marina Rivera Escorcia and Fábio Farias Pereira; methodology, software, investigation and analysis, Fábio Farias Pereira, Mahelvson Bazílio Chaves and Ana Carine de Melo Silva; formal analysis, Ana Carine de Melo and Fábio Farias Pereira; writing—original draft preparation, writing—review and editing and supervision, Claudia Marina Rivera Escorcia and Fábio Farias Pereira; visualization, Fábio Farias Pereira and Mahelvson Bazílio Chaves; funding acquisition, Fábio Farias Pereira. All authors have read and agreed to the published version of the manuscript.
Funding
There was no external funding to carried out the scientific activities presented in this research. However, Fábio Farias Pereira received travel grants from Fundação de Amparo à Pesquisa do Estado de Alagoas (FAPEAL) in the ERC/CONPAP/CNPq N°7/2018 call “Research opportunities in Europe for active PhD researchers from Brazil” to collaborate with europeans researchers, which he used to present the outcome of this research in seminars and workshops. Then, he used the valuable feedbacks to improve the overall quality of this work.
Data Availability Statement
Two datasets were used in the analysis presented in this research. Both datasets were publicly available, by the time we carried the analysis, at https://lpdaac.usgs.gov/products/myd21v061/ for the Aqua/MODIS dataset and at https://bdmep.inmet.gov.br/ for the INMET weather stations.
Abbreviations
The following abbreviations are used in this manuscript:
| MBB | Map of Biomes of Brazil |
| IBGE | Instituto Brasileiro de Geografia e Estatística |
| MMA | Ministério do Meio Ambiente |
| LST | Land surface temperature |
| Land surface temperature from the MYD21A1D data product | |
| Air | Maximum air temperature |
| RMSE | Root Mean Squared Error |
| MAE | Mean Absolute Error |
| SFRB | São Francisco River Basin |
| TIR bands | Thermal infrared bands |
| SIN grid | Sinusoidal grid |
| MODIS | Moderate-Resolution Imaging Spectroradiometer |
| INMET | Instituto Nacional de Meteorologia |
| BDMEP | Banco de Dados Meteorológicos |
| LP DAAC | Land Processes Distributed Active Archive Center |
| ERC | European Research Council |
| CONFAP | Conselho Nacional das Fundações Estaduais de Amparo à Pesquisa |
| CNPq | Conselho Nacional de Desenvolvimento Científico e Tecnológico |
References
- Nova, F.V.P.V.; Torres, M.F.A.; Coelho, M.P. Uso e ocupação da terra e indicadores ambientais de impactos negativos: baixo curso do Rio São Francisco, Estado de Alagoas, Brasil. Boletim de Geografia 2015, 33, 1–14. [Google Scholar]
- Fernandes, M.M.; de Moura Fernandes, M.R.; Garcia, J.R.; Matricardi, E.A.T.; de Souza Lima, A.H.; de Araújo Filho, R.N.; Gomes Filho, R.R.; Piscoya, V.C.; Piscoya, T.O.F.; Cunha Filho, M. Land use and land cover changes and carbon stock valuation in the São Francisco river basin, Brazil. Environmental Challenges 2021, 5, 100247. [Google Scholar]
- Bezerra, B.G.; Silva, L.L.; Santos e Silva, C.M.; de Carvalho, G.G. Changes of precipitation extremes indices in São Francisco River Basin, Brazil from 1947 to 2012. Theoretical and Applied Climatology 2019, 135, 565–576. [Google Scholar] [CrossRef]
- CPRM. Atlas geoquímico da bacia do Rio São Francisco: Minas Gerais. Serviço Geológico do Brasil – CPRM. https://rigeo.cprm.gov.br/handle/doc/20939. Accessed: 2022-10-06.
- Kayet, N.; Pathak, K.; Chakrabarty, A.; Sahoo, S. Spatial impact of land use/land cover change on surface temperature distribution in Saranda Forest, Jharkhand. Modeling Earth Systems and Environment 2016, 2, 1–10. [Google Scholar] [CrossRef]
- Alvares, C.A.; Stape, J.L.; Sentelhas, P.C.; de Moraes Gonçalves, J.L. Modeling monthly mean air temperature for Brazil. Theoretical and applied climatology 2013, 113, 407–427. [Google Scholar] [CrossRef]
- de Souza, A.; dos Santos, C.M.; Ihaddadene, R.; Cavazzana, G.; Abreu, M.C.; de Oliveira-Júnior, J.F.; Pobocikova, I.; de Gois, G.; Lins, T.M.P. Analysis of extreme monthly and annual air temperatures variability using regression model in Mato Grosso do Sul, Brazil. Modeling Earth Systems and Environment 2022, 8, 647–663. [Google Scholar] [CrossRef]
- de Carvalho Alves, M.; Sanches, L.; de Carvalho, L.G. Geostatistical surfaces of climatological normals of mean air temperature in Minas Gerais. Environmental Monitoring and Assessment 2022, 194, 1–21. [Google Scholar] [CrossRef] [PubMed]
- da Rosa, C.E.; Stefanello, M.; Facco, D.S.; Roberti, D.R.; Rossi, F.D.; Nascimento, E.d.L.; Degrazia, G.A. Regional-scale meteorological characteristics of the Vento Norte phenomenon observed in Southern Brazil. Environmental Fluid Mechanics 2022, pp. 1–19.
- de Oliveira Aparecido, L.E.; Lorençone, P.A.; Lorençone, J.A.; de Meneses, K.C.; de Moraes, J.R.d.S.C.; de Farias, M.F.; et al. Soil water seasonal and spatial variability in Northeast Brazil. Environment, Development and Sustainability 2022, 24, 6136–6152. [Google Scholar]
- Xian, G. Satellite remotely-sensed land surface parameters and their climatic effects for three metropolitan regions. Advances in Space Research 2008, 41, 1861–1869. [Google Scholar] [CrossRef]
- Callejas, I.J.; de Oliveira, A.S.; de Moura Santos, F.M.; Durante, L.C.; Nogueira, M.C.d.J.A.; Zeilhofer, P. Relationship between land use/cover and surface temperatures in the urban agglomeration of Cuiabá-Várzea Grande, Central Brazil. Journal of Applied Remote Sensing 2011, 5, 053569. [Google Scholar] [CrossRef]
- Camparotto, L.B.; Blain, G.C.; Giarolla, A.; Adami, M.; de Camargo, M.B. Validation of temperature and rainfall data obtained by remote sensing for the state of São Paulo, Brazil. Revista Brasileira de Engenharia Agrícola e Ambiental 2013, 17, 665–671. [Google Scholar] [CrossRef]
- Caparoci Nogueira, S.M.; Moreira, M.A.; Lordelo Volpato, M.M. Evaluating precipitation estimates from Eta, TRMM and CHRIPS Data in the south-southeast region of Minas Gerais State—Brazil. Remote Sensing 2018, 10, 313. [Google Scholar] [CrossRef]
- Thomas, C.; Wey, E.; Blanc, P.; Wald, L. Validation of three satellite-derived databases of surface solar radiation using measurements performed at 42 stations in Brazil. Advances in Science and Research 2016, 13, 81–86. [Google Scholar] [CrossRef]
- de Aguiar, J.T.; Lobo Jr, M. Reliability and discrepancies of rainfall and temperatures from remote sensing and Brazilian ground weather stations. Remote Sensing Applications: Society and Environment 2020, 18, 100301. [Google Scholar] [CrossRef]
- Liu, J.; Hagan, D.F.T.; Holmes, T.R.; Liu, Y. An Analysis of Spatio-Temporal Relationship between Satellite-Based Land Surface Temperature and Station-Based Near-Surface Air Temperature over Brazil. Remote Sensing 2022, 14, 4420. [Google Scholar] [CrossRef]
- Brito, H.d.; Brito, Y.d.; Assis, W.d.; Ferreira, Y.C.B.; Vasconcelos, R.S.; Rufino, I. Análise temporal da disponibilidade hídrica nos estados beneficiados pela transposição do Rio São Francisco. Revista Caminhos de Geografia 2020, pp. 21–102.
- Janatian, N.; Sadeghi, M.; Sanaeinejad, S.H.; Bakhshian, E.; Farid, A.; Hasheminia, S.M.; Ghazanfari, S. A statistical framework for estimating air temperature using MODIS land surface temperature data. International Journal of Climatology 2017, 37, 1181–1194. [Google Scholar]
- Yang, Y.Z.; Cai, W.H.; Yang, J. Evaluation of MODIS land surface temperature data to estimate near-surface air temperature in Northeast China. Remote Sensing 2017, 9, 410. [Google Scholar] [CrossRef]
- Benali, A.; Carvalho, A.; Nunes, J.; Carvalhais, N.; Santos, A. Estimating air surface temperature in Portugal using MODIS LST data. Remote Sensing of Environment 2012, 124, 108–121. [Google Scholar] [CrossRef]
- Shen, H.; Jiang, Y.; Li, T.; Cheng, Q.; Zeng, C.; Zhang, L. Deep learning-based air temperature mapping by fusing remote sensing, station, simulation and socioeconomic data. Remote Sensing of Environment 2020, 240, 111692. [Google Scholar] [CrossRef]
- dos Santos, R.S. Estimating spatio-temporal air temperature in London (UK) using machine learning and earth observation satellite data. International Journal of Applied Earth Observation and Geoinformation 2020, 88, 102066. [Google Scholar] [CrossRef]
Figure 1.
Distribution of the three biomes and the INMET weather stations in the São Francisco River basin.
Figure 1.
Distribution of the three biomes and the INMET weather stations in the São Francisco River basin.
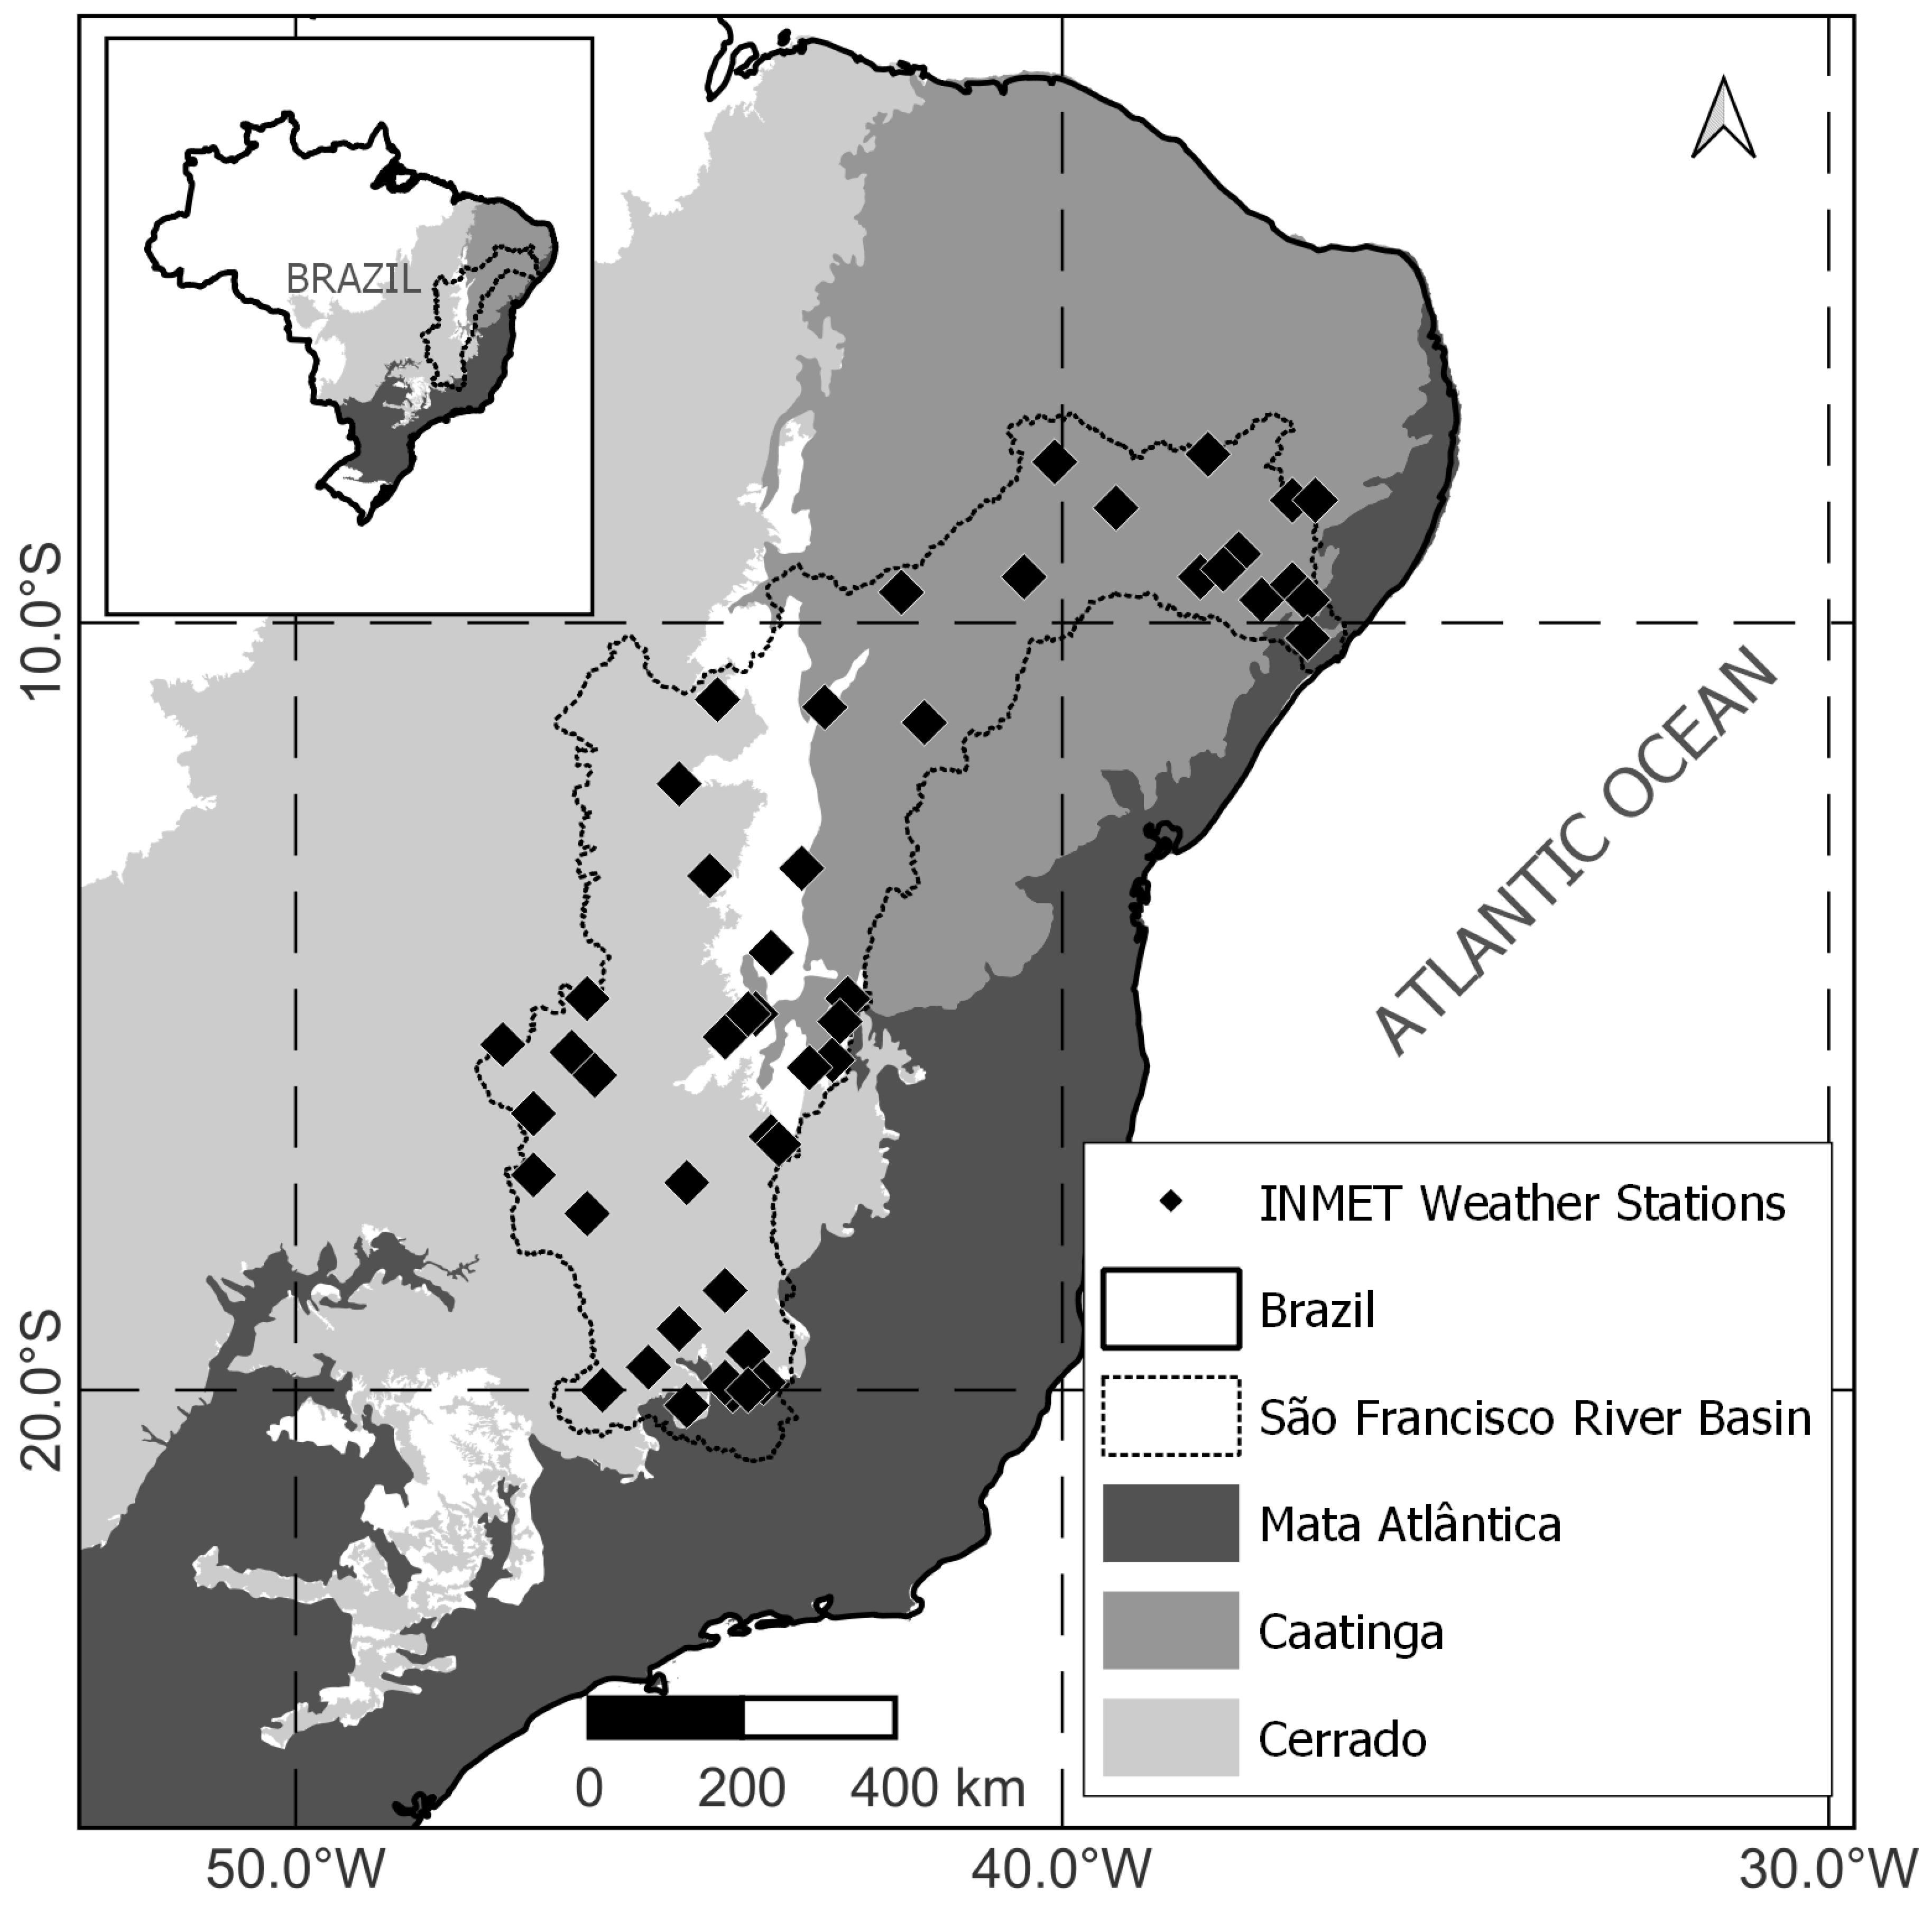

Table 1.
Location and code of the INMET weather stations, sorted by biome.
| Code | Longitude | Latitude | Biome |
|---|---|---|---|
| 82753 | -40.1 | -7.9 | Caatinga |
| 82789 | -38.1 | -7.8 | |
| 82886 | -39.3 | -8.5 | |
| 82890 | -37.0 | -8.4 | |
| 82892 | -36.7 | -8.4 | |
| 82979 | -42.1 | -9.6 | |
| 82983 | -40.5 | -9.4 | |
| 82986 | -38.2 | -9.4 | |
| 82988 | -37.7 | -9.1 | |
| 82989 | -37.9 | -9.3 | |
| 82990 | -37.4 | -9.7 | |
| 82991 | -37.0 | -9.5 | |
| 82995 | -36.8 | -9.7 | |
| 83076 | -44.5 | -11.0 | |
| 83179 | -43.1 | -11.1 | |
| 83182 | -41.8 | -11.3 | |
| 83286 | -44.6 | -13.3 | |
| 83288 | -43.4 | -13.2 | |
| 83338 | -42.8 | -14.9 | |
| 83386 | -44.4 | -15.4 | |
| 83387 | -43.0 | -15.7 | |
| 83388 | -42.9 | -15.2 | |
| 83389 | -44.0 | -15.1 | |
| 83390 | -44.1 | -15.1 | |
| 83395 | -43.3 | -15.8 | |
| 83408 | -43.8 | -14.3 | |
| 83236 | -45.0 | -12.1 | Cerrado |
| 83334 | -46.2 | -14.9 | |
| 83379 | -47.3 | -15.5 | |
| 83383 | -46.4 | -15.6 | |
| 83384 | -46.1 | -15.9 | |
| 83428 | -46.9 | -16.4 | |
| 83437 | -43.8 | -16.7 | |
| 83452 | -43.7 | -16.8 | |
| 83479 | -46.9 | -17.2 | |
| 83481 | -46.2 | -17.7 | |
| 83483 | -44.9 | -17.3 | |
| 83533 | -45.4 | -19.7 | |
| 83536 | -44.4 | -18.7 | |
| 83570 | -45.0 | -19.2 | |
| 83578 | -44.3 | -20.0 | |
| 83581 | -44.4 | -19.9 | |
| 83582 | -46.0 | -20.0 | |
| 83586 | -44.1 | -19.5 | |
| 83635 | -44.9 | -20.2 | |
| 83097 | -36.8 | -10.2 | Mata Atlântica |
| 83587 | -43.9 | -19.9 | |
| 83632 | -44.1 | -20.0 |
Table 2.
Relationships between observations of maximum air temperature at the INMET weather stations, the response variable, and retrievals of LST from the MYD21A1D data product, the predictor variable, for the biomes in the São Francisco River basin. The relationships were built under the fundamental assumption of linearity, so it is given, for each relationship, their constant and slope (as well as their standard error and p-value, in parentheses) that characterize their linear regression model; the number of observations used to build the linear regression models; and the adjusted and the residual standard error for the models.
| Response variable: | ||||
| Maximum air temperature from | ||||
| INMET weather stations | ||||
| Biome | Caatinga | Cerrado | Mata Atlântica | Overall |
| LST data from the | 0. | 0. | 0. | 0. |
| MYD21A1D data product | (0.001) | (0.002) | (0.006) | (0.001) |
| Constant | 20. | 17. | 14. | 18. |
| (0.058) | (0.067) | (0.209) | (0.041) | |
| Observations | 50,540 | 38,238 | 5,766 | 94,544 |
| Adjusted | 0.46 | 0.54 | 0.49 | 0.52 |
| Residual Std. Error | 2.13 | 2.07 | 2.41 | 2.15 |
| Note: | *p-value<0.01 | |||
Table 3.
Results of the cross-validation performed with the subsets of data from the three biomes in the SFRB. Two metris are presented as result of the cross-validation: (1) the Mean Absolute Error (MAE) – in parenthesis – and the Root Mean Squared Error (RMSE). As reference, the RMSE and MAE between the predictions of the regression model for the entire basin and the actual data is presented. It should provide an average perfomance across the models. Also as reference, we include the RMSE and MAE for the predictions of the regression model and the actual subset of data that has been used to generate itself. It should provide a superior performance across the models.
| Actual data in the biome: | |||
| Predictions of the | Caatinga | Cerrado | Mata Atlântica |
| Regression model for the | 2.15 | 2.09* | 2.53* |
| entire basin | (1.69)* | (1.65)* | (2.05)* |
| Regression model for the | 2.13* | 2.14 | 2.66 |
| biome Caatinga | (1.67)* | (1.68) | (2.14) |
| Regression model for the | 2.23 | 2.07* | 2.46 |
| biome Cerrado | (1.76) | (1.63)* | (1.99) |
| Regression model for the | 2.43 | 2.11 | 2.41* |
| biome Mata Atlântica | (1.93) | (1.65) | (1.95)* |
| Note: | * used as reference. | ||
Disclaimer/Publisher’s Note: The statements, opinions and data contained in all publications are solely those of the individual author(s) and contributor(s) and not of MDPI and/or the editor(s). MDPI and/or the editor(s) disclaim responsibility for any injury to people or property resulting from any ideas, methods, instructions or products referred to in the content. |
© 2025 by the authors. Licensee MDPI, Basel, Switzerland. This article is an open access article distributed under the terms and conditions of the Creative Commons Attribution (CC BY) license (http://creativecommons.org/licenses/by/4.0/).
Copyright: This open access article is published under a Creative Commons CC BY 4.0 license, which permit the free download, distribution, and reuse, provided that the author and preprint are cited in any reuse.


