Submitted:
14 March 2025
Posted:
17 March 2025
You are already at the latest version
Abstract
This study investigated how factors such as ownership structure, organizational maturity, corporate governance, and gender diversity influence the sustainability performance of Brazilian companies, as measured by the Corporate Sustainability Index (ISE). It is justified by the gap in integrated research in emerging contexts and the need to understand mechanisms that mitigate structural challenges. The objective was to analyze the interaction of these elements using quantitative methods (Probit and Logit regressions) on secondary data from 564 companies listed on the Brazilian stock exchange (B3) between 2015 and 2022. Results showed that higher foreign participation and organizational maturity are negatively correlated with sustainability, aligning with Agency Theory, which highlights the prioritization of immediate returns. In contrast, inclusive governance (independent members and expanded boards) and gender diversity positively impacted performance, supporting Stakeholder and Critical Mass Theories. However, CEO duality did not prove statistically significant. The contributions are theoretical and practical: they reinforce models that integrate sustainability barriers and facilitators and underscore the need for policies that prioritize diverse boards to mitigate risks in traditional structures. In summary, the research demonstrates that diversity and inclusive governance are essential to overcoming challenges and informing multidisciplinary strategies and public policies.
Keywords:
critical mass theory
; gender diversity
; logistic regressions
1. Introduction
Companies are increasingly seeking metrics and strategies that integrate environmental, social, and corporate governance (ESG) issues [42]. This is essential to maintain competitiveness and ensure long-term results [2,3,33]. These strategies also aim to raise awareness within organizations about practices that promote environmental preservation [19]. Thus, the prosperity of organizations is linked to organizational maturity, which positively impacts environmental and social policies [12,27].
In this context, corporate governance plays a crucial role, as it must meet the demands of various stakeholders, creating value and ensuring organizational sustainability [27]. Stakeholders influence competitive advantage and decisions regarding environmental practices and performance in companies [8]. Therefore, corporate sustainability is based on the Stakeholder Theory, seeking to align sustainable practices with the interests of shareholders and other involved parties, resulting in added value and an improved organizational reputation [3,17,26].
Furthermore, the ownership structure of organizations, which encompasses how they finance their operations, is an important factor in adopting sustainable practices [11]. The growing integration of ESG criteria in investment decisions demonstrates a move toward companies that adopt transparent and sustainable practices [35]. In this context, the role of the board of directors is crucial to evaluate strategies that connect social and environmental policies with the interests of stakeholders [2,33]. Thus, the alignment between sustainability and the interests of stakeholders reflects the practical application of Agency Theory [16].
To face the challenges of integrating ESG criteria, organizations need robust governance structures committed to sustainability [19]. In this scenario, gender diversity, particularly the presence of women on boards, is an increasing trend, enabling a combination of experiences and capabilities in evaluating strategies [3]. Although the presence of women in the corporate environment is growing, significant gaps remain to be filled [3,5].
Several countries have already applied quotas to increase female participation on boards [25,40]. However, studies on female participation still do not present definitive conclusions, showing varied results regarding its positive impact on ethical and social issues [1,3]. On the other hand, some authors suggest that low representation and limited experience may affect the effectiveness of female participation [1,3].
Therefore, the inconsistency and lack of investigations on the relationship between sustainability, ownership structure, and governance, as well as the influence of gender diversity, justifies this study. Thus, the objective of this study is to examine the impacts of ownership structure factors, corporate governance structure, and the influence of gender diversity on sustainability performance in organizations.
As an innovation, this study will apply [21], Critical Mass Theory which suggests that a minimum of 30% female participation or three women on the board can generate significant impacts on decisions [21]. Thus, the study aims to investigate the board characteristics and ownership structures as the foundation for the proposed research [3].
2. Literature Review
2.1. Historical Context of Sustainability
The concept of sustainability emerged in the 1960s, driven by environmental movements. In 1972, the Club of Rome, at the Stockholm Conference, warned about unchecked economic growth in relation to finite resources, marking the starting point for sustainability discussions. In 1987, the Brundtland Report, titled Our Common Future, established sustainable development to meet present needs without compromising the ability of future generations to meet their own needs [7].
This milestone evolved with the United Nations Conference on Environment and Development held in Brazil in 1992, known as Rio 92, which set principles for balanced sustainable development integrating environmental, social, and economic aspects [38]. The introduction of the Triple Bottom Line (TBL) by John Elkington in 1994 expanded the way companies assess their performance, now seeking to measure and report their results in three areas: profit (financial), people (social), and planet (environmental) [15].
In 2015, the UN created the Sustainable Development Goals (SDGs) to be achieved by 2030, reflecting a global approach that considers impacts across economic, social, and environmental dimensions [24]. Therefore, sustainability seeks the interdependence of these dimensions for balanced and sustainable development [14,22,32].
The evolution of sustainability led to studies linking environmental and social factors with corporate governance. [2] investigated how environmental practices impact finances and emphasized the growing role of corporate governance in environmental initiatives [3]. These studies revealed gaps in research regarding ownership structure, board composition, and the influence of gender diversity on CEO decisions and governance [2,3].
2.2. Ownership Structure
The authors [3], analyzed 63 Turkish companies and identified a positive relationship between foreign ownership and sustainability performance, which is corroborated by [12], who observed that governance practices influence sustainability reporting in Latin American groups. This connects governance with the promotion of sustainability across different regions.
The autors, [9,18], highlighted that institutional investors tend to prefer socially and environmentally responsible companies, driven by the increasing demand for sustainability. The autors, [6], add that social and environmental responsibility alleviates pressure from investors, although large companies show less inclination to invest in environmental practices. Thus, social and environmental responsibility is seen as a factor mitigating market risks.
Additionally, organizational maturity is associated with robust environmental and social policies [12,27], reinforcing the role of foreign and institutional investors in supporting the adoption of sustainable practices. Stakeholder Theory complements this analysis, indicating that stakeholders positively influence corporate governance. In light of the contexts presented, the following hypotheses were formulated:
(H1) – There is a positive association between foreign ownership and sustainability performance.
(H2) – The greater the organizational maturity, the higher the sustainability performance.
2.3. Board Composition
The composition of the board of directors aims to suggest decisions that drive corporate sustainability [3,26]. In this sense, the board can understand short-term losses for future gains, thereby enhancing organizational credibility. Additionally, the CEO’s influence on the board may impact sustainability, as per Agency Theory by [16], especially if the CEO also holds the chairmanship, creating power duality [10,33].
Thus, the CEO’s personal attributes, as explored by [6], can interfere with investment decisions, which are often driven by strategic interests, such as maintaining good political relationships. This relationship between the CEO and politics strengthens the adoption of socially responsible investments. Therefore, the CEO’s power dynamics and influence are crucial for defining sustainable practices.
Furthermore, the board size plays an important role in the quality of corporate sustainability practices [12]. The autor’s [3] corroborate this view, stating that sustainable performance is positively influenced by both the size and the proportion of independent directors, emphasizing the importance of robust governance in implementing responsible practices. From this, the following hypotheses were formulated:
(H3) – The composition of independent members has a positive influence on sustainability performance.
(H4) – CEO duality is negatively associated with sustainability performance.
2.4. Gender Diversity on Boards
Several studies connect gender diversity on boards with corporate sustainability performance [3,30,33]. However, some show inconsistent or low significance results [28,40]. Therefore, the impacts vary depending on the context, highlighting the need to further explore the role of gender diversity.
For example, [36], found positive relationships between gender diversity and organizational performance in social, environmental, and governance aspects in US banks. In the European Union, [19], also observed positive correlations between the presence of women on boards and the environmental performance of companies, reinforcing the idea that gender diversity can improve organizational outcomes.
In Italy, the implementation of gender quotas increased the presence of women on boards, but quotas alone did not address gender inequality [25]. This indicates that quantitative inclusion needs to be accompanied by policies that promote genuine integration and leadership opportunities for women, as pointed out by [5], who emphasized the lack of women’s mediation roles on boards.
The autors, [13], in a study of Polish companies, noted that greater female presence on boards contributed to improved quality in financial reporting but emphasized the importance of giving women “voice” to achieve a positive impact. Thus, inclusion must be qualified, which aligns with studies on Critical Mass Theory.
Finally, [39], pointed out that while having one woman on the board improves sustainability performance, the impact diminishes beyond this number. This challenges the Critical Mass Theory [13,21], which posits that three women are ideal for good corporate governance, reflecting the complexity of the issue and the need for further exploration. Based on these issues, the following hypotheses were raised:
(H5) – There is a positive association between the presence of women on the board and sustainability performance.
(H6) – An increase in the number of women on the board has a positive impact on sustainability performance.
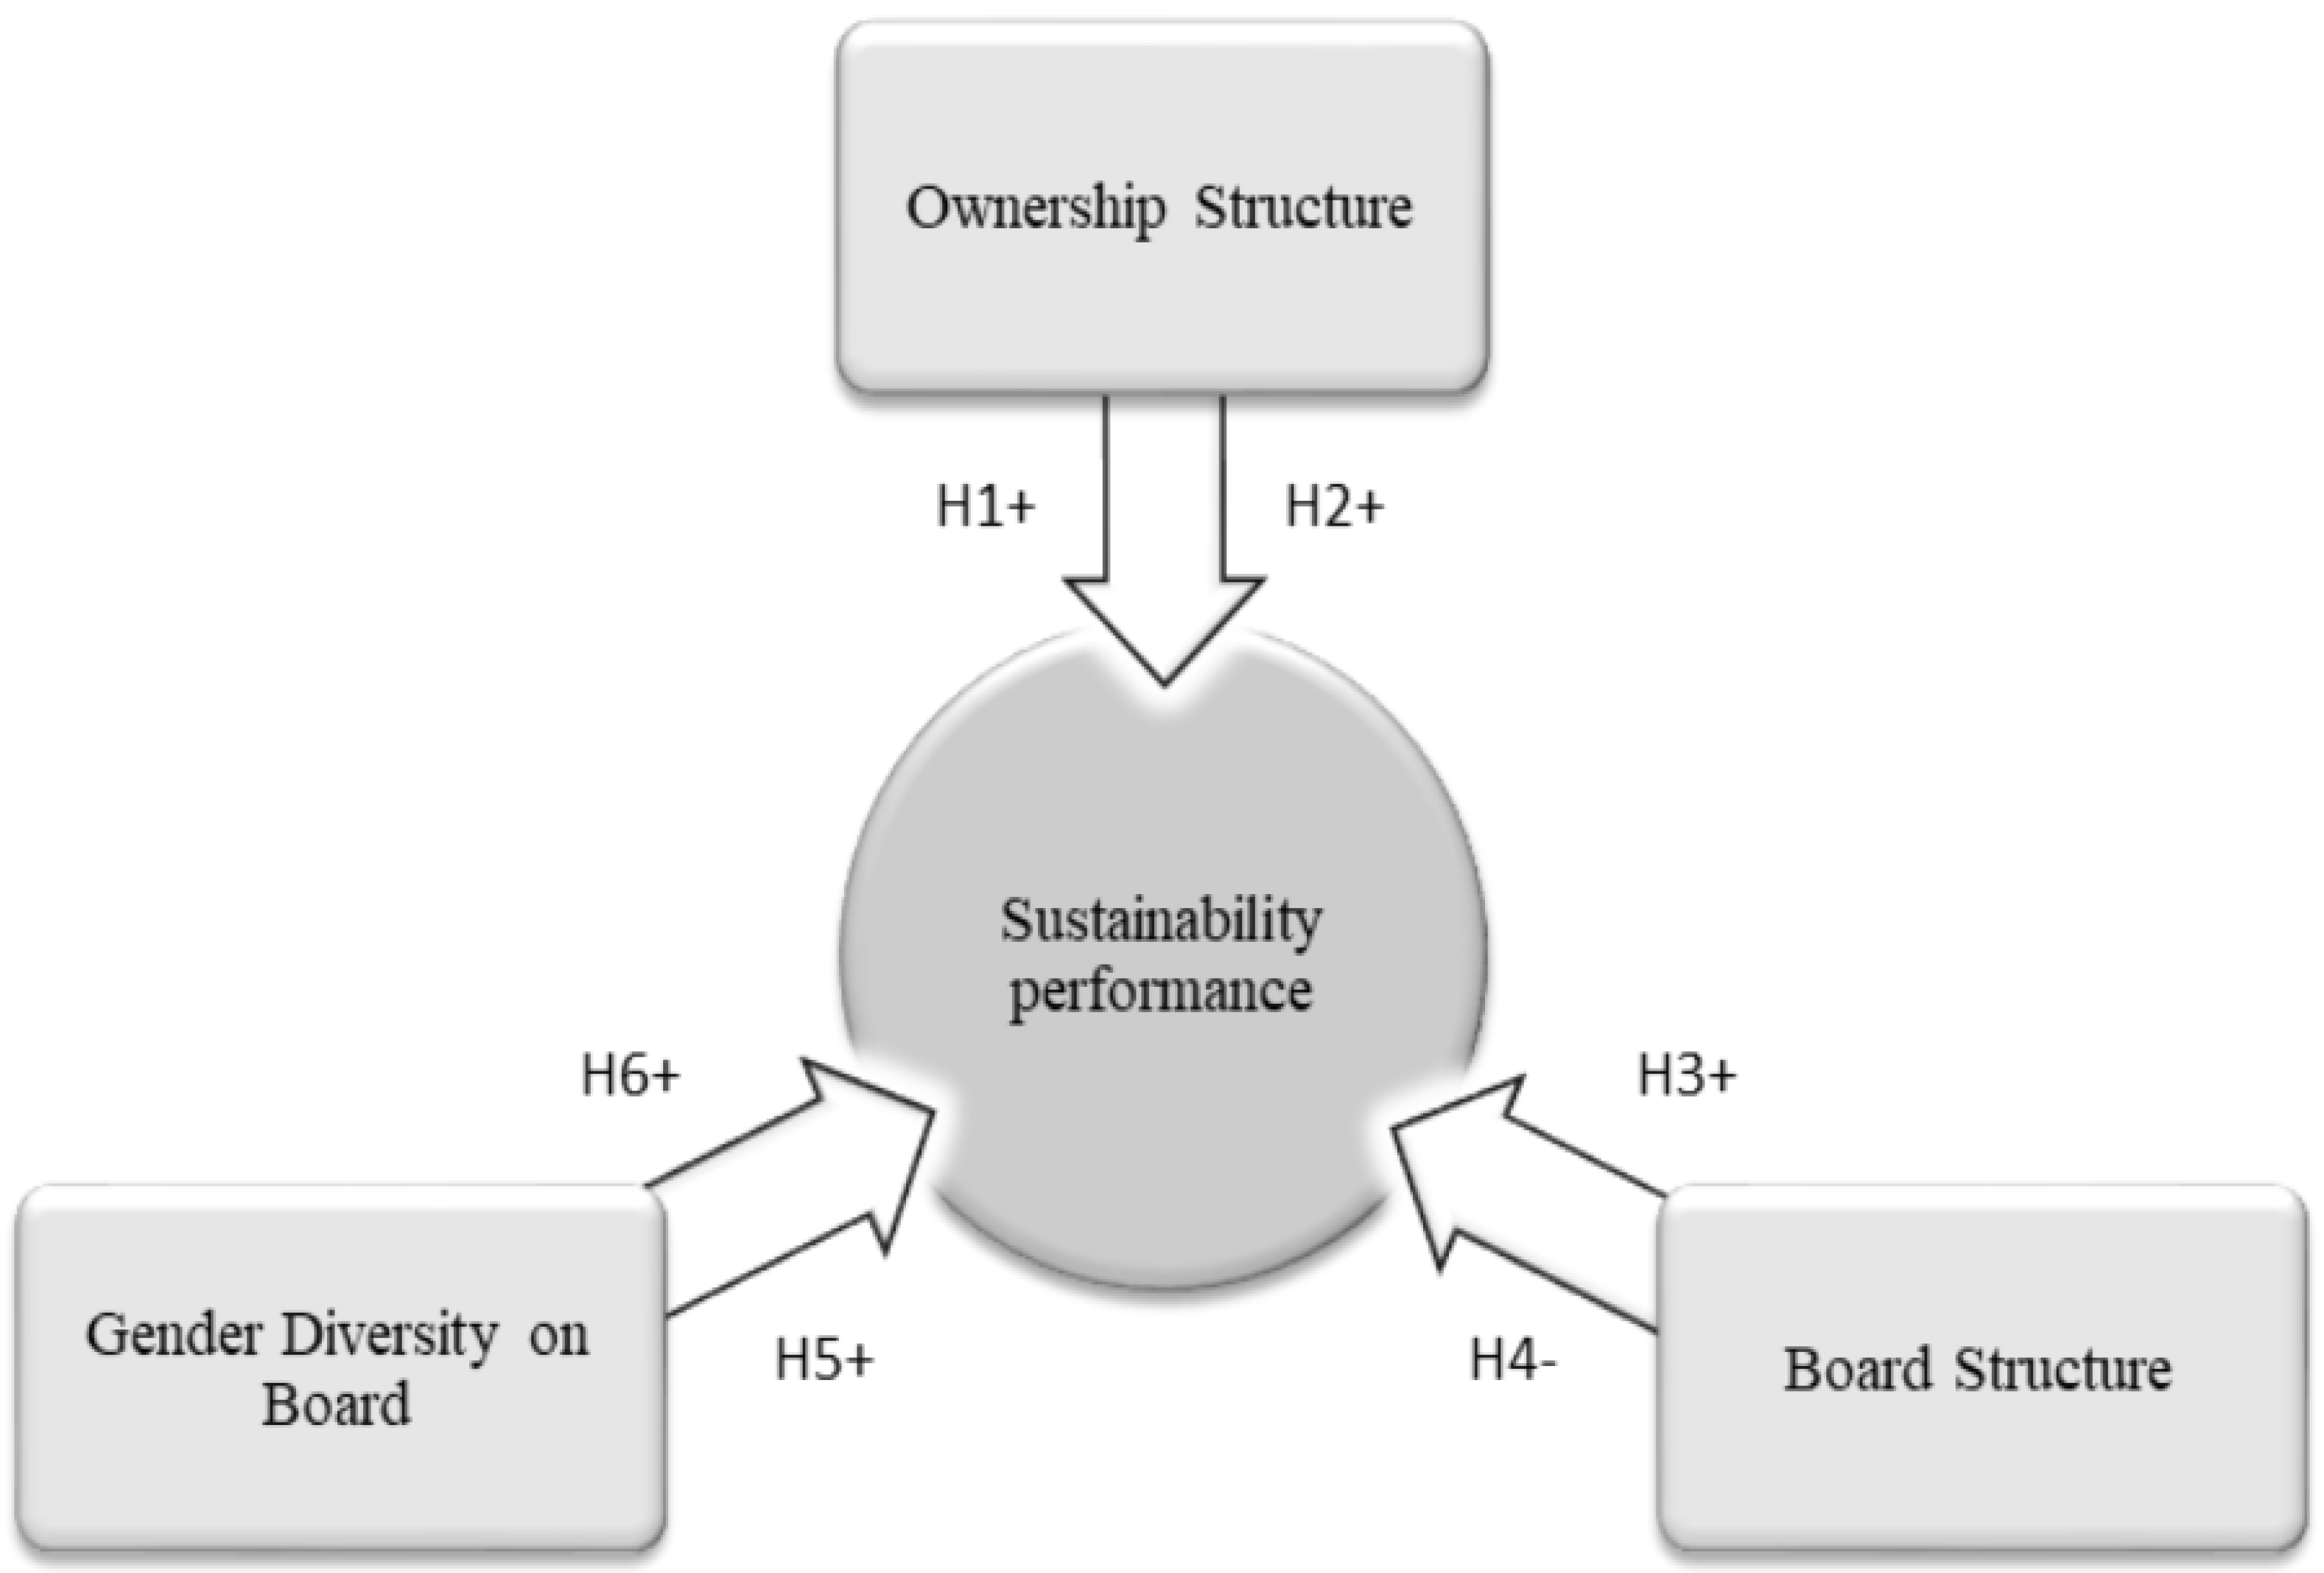
From the theoretical framework, six hypotheses were presented, as shown in Table 1, consisting of Ownership Structure, Board Structure, and Gender Diversity on Boards to explain sustainability performance.
2.5. Structural Model and Distribution of Hypotheses
Based on the theoretical framework, the following factors are presented: Ownership Structure, Board Structure, and Gender Diversity Structure on the Board, along with their indicated impacts on the sustainability performance of organizations. Additionally, the hypotheses are organized according to the influence of each factor and its intensity on sustainable performance.
Figure 1.
- Visualization of factors and distribution of hypotheses. Source: Generated by the author from the theoretical framework. Adapted from [3].
Figure 1.
- Visualization of factors and distribution of hypotheses. Source: Generated by the author from the theoretical framework. Adapted from [3].
3. Materials and Methods
The methodology adopted for this study was quantitative, as applied by [3], utilizing inferential analysis through Probit and Logit logistic regressions to compare results between both methods. The analyzed data comes from secondary sources, collected from consolidated financial statements of publicly traded companies listed on the Brasil Bolsa Balcão (B3). Financial institutions were excluded, as their financial metrics differ significantly compared to companies in most production sectors [3].
The dependent variable data collection was conducted using the Corporate Sustainability Index (ISE) of B3, which annually selects companies with sustainability excellence [4]. The sample consists of 3455 longitudinal observations from 564 companies across different sectors, analyzed between 2015 and 2021. Historical data was obtained using the Economática® platform and adjusted by the Broad Consumer Price Index (IPCA).
3.1. Dependent Variable
The endogenous variable consists of organizations’ participation in the Corporate Sustainability Index (ISE) during the period, treated as a binary variable. If participation occurred in the assessed year, the variable is coded as “1”; otherwise, it is coded as “0.” The Corporate Sustainability Index (ISE) comprises a portfolio listed on B3, including a select group of sustainable companies chosen according to B3 evaluation criteria [23,37].
3.2. Independent Variables
As per [3], the independent variables include ownership structure, with emphasis on Foreign Ownership (PES), reflecting the total shares held by foreign investors. Institutional Ownership (PIN) is defined as the total number of institutional shares in circulation, while Public Ownership (PTN) represents the total number of publicly traded shares. The natural logarithm of the total shares was used as a measurement for these variables [3]. These variables are fundamental for analyzing the impact of ownership structure on corporate governance.
The Board Size (TAC) variable was determined by the number of members on the administrative board, while Independent Board Members (MIC) represents the proportion of independent members relative to the total number of members [3]. Meanwhile, CEO Duality (DCE) is a dummy variable assigned the value “1” when the CEO also chairs the board, and “0” otherwise. This variable is crucial as it may influence strategic decisions [10]. These board structural factors directly impact governance practices.
Female participation on boards is represented by the variable Independent Female Board Members (MCIF), calculated as the total proportion of women on independent boards relative to the total members. The variables reflecting the number of women on the board (TMCF) were split into dummies indicating the presence of one, two, three, or more women on the administrative board during the period [3]. These variables are essential for understanding the influence of gender diversity on corporate decisions.
Organizational Maturity (MAO) is represented by dummies reflecting the company’s age, divided into 20-year intervals [3]. This factor can influence governance, as older organizations tend to have established structures affecting sustainability and innovation practices.
Together, these variables form the basis for analyzing the impact of governance and ownership structure on corporate practices, with a focus on diversity and organizational maturity.
3.3. Control Variables
Control variables are represented by indices derived from financial statements of companies listed on B3, excluding financial institutions [3]. Excluding financial institutions enhances the relevance and precision of the results, avoiding comparisons with financial metrics that significantly differ and because financial institutions do not focus on the operational efficiency of goods and services production [3].
Financial performance, considering the cost of capital replacement, is measured using Tobin’s Q (QTB), calculated as follows [3,20,29,34,41]:
Financial leverage (ALF) indicates how much of the organization is financed by third parties and is calculated as the ratio of total liabilities to total assets [3,29,31,37]:
To investigate organizational growth, authors such as [37], used the natural logarithm of total assets (ATI) recorded at the end of the fiscal year [9,31]. According to [3], the size of organizations should be considered as it may impact board decisions. Table 2 presents a summary of the variables used in this work.
3.4. Econometric Models
To analyze the data and test the hypotheses, Logit and Probit models were applied, where the errors follow logistic and normal distributions, respectively, to ensure result sensitivity [3]. These models allow for robust estimations by analyzing estimated coefficients, robust standard errors, and associated p-values.
Subsequently, the Wald test was performed to verify the individual significance of the independent variables, along with the Hosmer-Lemeshow (HL) test, which evaluates the adequacy of the logistic regression model to the data. This ensures a detailed analysis of the model’s goodness-of-fit.
Finally, the pseudo R² test was applied to measure the explanatory power of the variables within the model. The econometric models consider both individuals (i) and time (t) as per the proposed framework.
where: Y1it = Represents the dependent variable of sustainability related to individual i at time t; β0 = Constant; β = Coefficient related to each variable; it = Change in individual i over time t; Ꜫ = Error related to variation i over time t.
The purpose of the X1it variable in the model is to generate results for the hypotheses, therefore, the arrangement of the variables in the model is as follows:
For hypothesis (H1): X1it = PESit – logarithmic variable related to foreign ownership; PINit – logarithmic variable of institutional ownership; PTNit – logarithmic variable corresponding to negotiated ownership; For hypothesis (H2): X1it = MAOit – variable that measures organizational maturity in 20-year intervals; To validate hypotheses (H3) and (H4): X1it = MICit - variable that represents independent directors; MCIFit – variable that indicates the presence of women on independent boards; DCEit – variable that addresses CEO duality; TACit – variable that refers to the size of the board; To investigate hypotheses (H5) and (H6): X1it = TMCFit – variable that represents the total number of female board members.
The control variables, which were determined in all models, are represented by X2it = QTBit – Tobin’s Q variable; ATIit – Total assets logarithm; ALFit – Financial leverage variable. The variable X3t corresponds to time and the variable X4i corresponds to sectors, all of which were determined in all models.
4. Results
4.1. Descriptive Statistics
The descriptive analysis presented in Table 3 highlights distinct patterns in corporate financial variables. Binary indicators (0 and 1) reveal that traded ownership (PTN) and total asset growth (ATI) exhibit medians exceeding their means, suggesting that most firms experienced below-average growth in these areas during the study period. This aligns with [2], who argue that governance structures often prioritize short-term stability over aggressive asset expansion, particularly in emerging markets. Similarly, [3] emphasize that ownership concentration—common in such contexts—may limit liquidity and asset diversification, reinforcing the observed median-mean disparity.
Conversely, variables like foreign ownership (PES), financial leverage (ALF), and replacement capital costs (QTB) demonstrate medians below their means, indicating above-average reliance on external capital and debt. The autors, [9], link this to institutional investors’ growing influence, as firms in competitive markets often adopt riskier financial strategies to attract foreign investment. The autors, [26], further note that higher leverage reflects strategic responses to capital scarcity, albeit increasing dependency on volatile funding sources—a trend corroborated by [30], who associate such practices with sector-specific sensitivities.
These findings underscore the interplay between governance and financial strategy. For instance, [17], posit that stakeholder-oriented firms balance growth and risk differently than shareholder-focused entities, while [16], highlight the agency costs inherent in dispersed ownership structures. The data thus contextualizes how governance frameworks shape financial resilience, as noted by [31].
4.2. Main Results and Discussions
The Table 4 presents the results which were robustly generated by adjusting the standard errors to avoid potential violations of homoscedasticity. In this way, the table organizes the impacts of factors related to ownership structure, organizational maturity, board structure, and gender diversity on sustainability performance, as measured by the Corporate Sustainability Index (ISE).
The models are arranged into four distinct models spread across eight columns, where the odd-numbered columns represent estimates obtained via the Probit method and the even-numbered columns correspond to the Logit estimates. Thus, each model is tested using two methods, allowing for a horizontal comparison between the probabilistic approaches while also providing a vertical analysis of the coefficients and significance levels for each set of variables [2,3].
In Model 1, the indicators of ownership structure are represented by PES (foreign ownership), PIN (institutional ownership), and PTN (public ownership). The results show that, in both Column 1 and Column 2, PES and PTN have negative and statistically significant coefficients (for example, –1.037 and –1.673 in Column 1, and –1.871 and –2.784 in Column 2). These findings indicate that an increase in the participation of foreign investors and publicly traded companies is associated with lower sustainable performance, which contrasts with Hypothesis H1 that predicted a positive association [3,9].
Given the results of Model 1, Agency Theory can be invoked to explain this phenomenon: foreign and public shareholders may prioritize short-term returns, thereby discouraging long-term sustainable practices [16]. Thus, H1 is not supported by the data, aligning with studies such as [6], which suggest that large corporations may be less inclined to invest in environmental initiatives.
Model 2, which assesses organizational maturity through the variables MAO1 to MAO5, reveals that MAO1 (1 to 20 years) and MAO4 (61 to 80 years) have negative and significant coefficients in both columns (for example, –0.422 and –0.921 in Column 3, and –0.880 and –1.876 in Column 4). These results suggest that more mature companies tend to exhibit lower sustainable performance, contradicting Hypothesis H2, which proposed that organizational maturity would be positively associated with sustainability. These findings corroborate the results of [6,27], who indicate that established companies are less inclined to invest in environmental practices.
In Model 3, Table 4, analyzes board structure, the variables include MIC (the proportion of independent members), MCIF (the proportion of women on the independent board), DCEO (CEO duality), and TAC (board size). It is observed that MCIF presents positive and significant coefficients (1.442 in Column 5 and 2.542 in Column 6), while TAC also shows positive and highly significant results (0.061 and 0.120, respectively). These outcomes align with Stakeholder Theory, which posits that larger boards incorporate a diversity of interests, thereby facilitating sustainable policies [12].
On the other hand, in Model 3 the variable DCEO exhibits negative coefficients (–0.182 and –0.252), although these are not statistically significant. Thus, Hypothesis H3, which asserts that the presence of independent board members has a positive influence on sustainability, is supported, as suggested by [3,12]. Meanwhile, Hypothesis H4, which postulates that CEO duality negatively impacts sustainable performance, is only partially evidenced; although the negative sign is present, the lack of statistical significance prevents a robust conclusion.
Model 4, focused on gender diversity, considers the variables TMCF1, TMCF2, and TMCF3, which indicate the presence of one, two, and three women on the board, respectively. The coefficients for these variables are consistently positive and statistically significant in both columns (for example, TMCF1: 0.473 in Column 7 and 0.926 in Column 8; TMCF2: 1.144 and 2.094; TMCF3: 0.608 and 1.169). In this way, Hypotheses H5 and H6, which suggest a positive association between the presence (and quantitative increase) of women on the board and sustainable performance, are robustly supported. These results are in line with Critical Mass Theory, [21], which contends that three women are necessary for significant influence, and they also align with the evidence presented by [13,39], which highlight the benefits of gender diversity in promoting corporate sustainability.
A general analysis of the models shows that, while factors related to ownership and organizational maturity exhibit negative relationships with sustainability performance, governance elements – especially those pertaining to board composition and diversity – contribute positively to more sustainable practices. In short, the comparison of the models reveals that the negative effects of ownership structure and maturity factors are counterbalanced by the robust positive effects observed in board structure and gender diversity. This finding underscores the importance of effective and inclusive governance as a compensatory mechanism for the challenges faced by more mature organizations or those with ownership structures that, on their own, do not favor sustainability.
In the analysis of the control and robustness variables, total assets (ATI) demonstrated positive coefficients across all the models used, reinforcing the evidence that companies with greater resources tend to invest in sustainable practices [14]. Conversely, the financial leverage variable (ALF) showed negative impacts in all estimations, suggesting that higher indebtedness may limit the capacity for sustainability investments. In contrast, Tobin’s Q (QTB) exhibited a positive and highly significant relationship in Models 2 through 4, indicating that companies with more favorable market evaluations prioritize sustainability. The robustness tests (significant Wald, Pseudo R² between 0.30 and 0.39, and HL > 0.05) confirm the consistency of the models. Furthermore, the similarity between the Probit and Logit results enhances the reliability of the findings.
In summary, the results indicate that hypotheses H1 and H2 were not supported, demonstrating that a higher participation of foreign investors and an elevated degree of organizational maturity are associated with lower sustainable performance [2,3]. On the other hand, hypotheses H3, H5, and H6 were robustly confirmed, showing that the presence of independent members – particularly women – and an increase in board size promote higher sustainable performance, thereby reinforcing the arguments of recent studies.
Furthermore, hypothesis H4, related to CEO duality, did not present statistically significant evidence for its negative impact, suggesting that, despite the theoretical criticisms based on Agency Theory [16], the current data do not robustly support this relationship. Thus, these findings not only confirm the theoretical arguments of [2] and [3] but also point to practical implications for the implementation of governance and diversity strategies, emphasizing the need for an integrated approach to promote sustainability in organizations. The hypothesis results are presented in Table 5.
5. Conclusions
This study aimed to investigate the impacts of factors related to ownership structure, organizational maturity, corporate governance, and gender diversity on corporate sustainability performance, based on the Corporate Sustainability Index (ISE). The research is justified by the scarcity of integrated studies on these relationships, particularly in emerging contexts such as Brazil, and by the need to understand how governance and diversity mechanisms can mitigate challenges associated with ownership structures and organizational maturity. The central objective was to analyze how these elements interact to influence sustainable practices, contributing to the theoretical and practical debate on corporate strategies aligned with sustainability.
The methodology adopted a quantitative approach, using Probit and Logit regression models to analyze secondary data from companies listed on the Brazilian stock exchange (B3) during the period from 2015 to 2021. The sample included 3456 observations from 564 companies. Sustainability performance was operationalized through the ISE, while the independent variables ranged from ownership indicators to the composition of the board of directors.
The results revealed that ownership structures with higher foreign participation and publicly traded shares, as well as organizational maturity, were negatively associated with sustainability. These findings align with Agency Theory, suggesting that short-term priorities may overshadow long-cycle investments. In contrast, governance elements, such as the presence of independent board members and board expansion, were positively associated with sustainability performance, supporting Stakeholder Theory, which emphasizes the diversity of interests in decision-making. Furthermore, gender diversity on the board demonstrated a significant impact, backed by Critical Mass Theory, indicating that female representation enhances the adoption of sustainable practices. However, CEO duality showed no statistical significance, limiting definitive conclusions about its role.
This study provides both theoretical and practical contributions. Theoretically, it reinforces the importance of integrated models that consider both barriers (such as ownership structures) and enablers (such as inclusive governance) for sustainability. Practically, it highlights the need for corporate policies that prioritize diverse and independent boards while warning against the risks of concentrated ownership and excessive maturity without compensatory mechanisms. The findings suggest that effective governance can neutralize negative structural effects, fostering a transition to more sustainable business models.
Among the limitations, the geographic scope restricts the generalizability of the results, and the exclusion of financial institutions, whose dynamics may differ significantly, limits broader applicability. Additionally, qualitative variables, such as organizational culture, were not included, offering avenues for future research. It is recommended to expand the analysis to other countries, include financial sectors, and combine qualitative methods to deepen the understanding of behavioral factors involved.
In summary, this research underscores the complexity of the determinants of corporate sustainability, demonstrating that inclusive governance and gender diversity are essential pillars for overcoming challenges imposed by traditional structures. Its findings provide a valuable framework to guide strategic decisions and public policies, emphasizing the importance of multidisciplinary and adaptive approaches in promoting organizational sustainability.
References
- Abdullah, S.N.; Ismail, K.N.I.K.; Nachum, L. Does Having Women on Boards Create Value? The Impact of Societal Perceptions and Corporate Governance in Emerging Markets. Strateg. Manag. J. 2016, 37, 466–476. [CrossRef]
- Aguilera, R.V.; Aragón-Correa, J.A.; Marano, V.; Tashman, P.A. The Corporate Governance of Environmental Sustainability: A Review and Proposal for More Integrated Research. J. Manag. 2021, 47, 1468–1497. [CrossRef]
- Aksoy, M.; Yilmaz, M.K.; Tatoglu, E.; Basar, M. Antecedents of Corporate Sustainability Performance in Turkey: The Effects of Ownership Structure and Board Attributes on Non-Financial Companies. J. Clean. Prod. 2020, 276, 124284. [CrossRef]
- ISE_B3. Índice de Sustentabilidade Empresarial (ISE B3): Índice de Sustentabilidade Empresarial. 2024. Available online: https://www.b3.com.br/pt_br/market-data-e-indices/indices/indices-de-sustentabilidade/indice-de-sustentabilidade-empresarial-ise-b3.htm.
- Barros, T.D.S.; Kirschbaum, C. Qual a Posição das Mulheres na Rede de Board Interlocking do Brasil? Uma Análise para o Período de 1997 a 2015. Rev. Adm. Empresas 2023, 63. [CrossRef]
- Borghesi, R.; Houston, J.F.; Naranjo, A. Corporate Socially Responsible Investments: CEO Altruism, Reputation, and Shareholder Interests. J. Corp. Finance 2014, 26, 164–181. [CrossRef]
- Burton, I. Report on Reports: Our Common Future. Environ. Sci. Policy Sustain. Dev. 1987, 29, 25–29. [CrossRef]
- Cezarino, L.O.; de Queiroz Murad, M.; Resende, P.V.; Sales, W.F. Being Green Makes Me Greener? An Evaluation of Sustainability Rebound Effects. J. Clean. Prod. 2020, 269, 121436. [CrossRef]
- Chen, T.; Dong, H.; Lin, C. Institutional Shareholders and Corporate Social Responsibility. J. Financ. Econ. 2020, 135, 483–504. [CrossRef]
- Chu, H.L.; Liu, N.Y.; Chiu, S.C. CEO Power and CSR: The Moderating Role of CEO Characteristics. China Account. Finance Rev. 2023, 25, 101–121. [CrossRef]
- Clark, G.L.; Feiner, A.; Viehs, M. From the Stockholder to the Stakeholder: How Sustainability Can Drive Financial Outperformance. SSRN Working Paper 2508281, 2015. [CrossRef]
- Correa-Garcia, J.A.; Garcia-Benau, M.A.; Garcia-Meca, E. Corporate Governance and Its Implications for Sustainability Reporting Quality in Latin American Business Groups. J. Clean. Prod. 2020, 260, 121142. [CrossRef]
- Dobija, D.; Hryckiewicz, A.; Zaman, M.; Puławska, K. Critical Mass and Voice: Board Gender Diversity and Financial Reporting Quality. Eur. Manag. J. 2022, 40, 29–44. [CrossRef]
- Eccles, R.G.; Ioannou, I.; Serafeim, G. The Impact of Corporate Sustainability on Organizational Processes and Performance. Manag. Sci. 2012, 60, 2835–2857. [CrossRef]
- Elkington, J. Partnerships from Cannibals with Forks: The Triple Bottom Line of 21st-Century Business. Environ. Qual. Manag. 1998, 8, 37–51. [CrossRef]
- Fama, E.F.; Jensen, M.C. Separation of Ownership and Control. SSRN Electron. J. 1983, 26, 301–325. [CrossRef]
- Freeman, R.E.; Reed, D.L. Stockholders and Stakeholders: A New Perspective on Corporate Governance. Calif. Manag. Rev. 1983, 25, 88–106. [CrossRef]
- Fu, X.; Tang, T.; Yan, X. Why Do Institutions Like Corporate Social Responsibility Investments? Evidence from Horizon Heterogeneity. J. Empir. Finance 2019, 51, 44–63. [CrossRef]
- García-Martín, C.J.; Herrero, B. Do Board Characteristics Affect Environmental Performance? A Study of EU Firms. Corp. Soc. Responsib. Environ. Manag. 2020, 27, 74–94. [CrossRef]
- Guenster, N.; Bauer, R.; Derwall, J.; Koedijk, K. The Economic Value of Corporate Eco-Efficiency. Eur. Financ. Manag. 2011, 17, 679–704. [CrossRef]
- Konrad, A.M.; Kramer, V.; Erkut, S. The Impact of Three or More Women on Corporate Boards. Organ. Dyn. 2008, 37, 145–164. [CrossRef]
- Kuhlman, T.; Farrington, J. What Is Sustainability? Sustainability 2010, 2, 3436–3448. [CrossRef]
- Lameira, V.D.J.; Ness Jr, W.L.; Quelhas, O.L.G.; Pereira, R.G. Sustentabilidade, Valor, Desempenho e Risco no Mercado de Capitais Brasileiro. Rev. Bras. Gest. Negócios 2013, 15, 76–90. Available online: https://www.scielo.br/j/rbgn/a/98GmMjzrhWjJG9jGVbR38QL/?format=pdf&lang=pt.
- Lee, B.X.; Kjaerulf, F.; Turner, S.; Cohen, L.; Donnelly, P.D.; Muggah, R.; Davis, R.; Realini, A.; Kieselbach, B.; MacGregor, L.S.; Waller, I.; Gordon, R.; Moloney-Kitts, M.; Lee, G.; Gilligan, J. Transforming Our World: Implementing the 2030 Agenda Through Sustainable Development Goal Indicators. J. Public Health Policy 2016, 37(S1), 13–31. [CrossRef]
- Maida, A.; Weber, A. Female Leadership and Gender Gap within Firms: Evidence from an Italian Board Reform. ILR Rev. 2022, 75, 488–515. [CrossRef]
- Med Bechir, C.; Jouirou, M. Investment Efficiency and Corporate Governance: Evidence from Asian Listed Firms. J. Sustain. Finance Invest. 2024, 14, 596–618. [CrossRef]
- Naciti, V. Corporate Governance and Board of Directors: The Effect of a Board Composition on Firm Sustainability Performance. J. Clean. Prod. 2019, 237, 117727. [CrossRef]
- Nguyen, T.H.H.; Ntim, C.G.; Malagila, J.K. Women on Corporate Boards and Corporate Financial and Non-Financial Performance: A Systematic Literature Review and Future Research Agenda. Int. Rev. Financ. Anal. 2020, 71, 101554. [CrossRef]
- Orellano, V.I.F.; Quiota, S. Análise do Retorno dos Investimentos Socioambientais das Empresas Brasileiras. Rev. Adm. Empresas 2011, 51, 471–484. Available online: https://www.scielo.br/j/rae/a/ct34Twsnw3WYg9yN4ZdfdQs/abstract/?lang=pt.
- Qureshi, M.A.; Kirkerud, S.; Theresa, K.; Ahsan, T. The Impact of Sustainability (Environmental, Social, and Governance) Disclosure and Board Diversity on Firm Value: The Moderating Role of Industry Sensitivity. Bus. Strateg. Environ. 2019, 29, 1199–1214. [CrossRef]
- Ribeiro, A.D.D.; Funchal, B. Fatores Determinantes na Incorporação das Organizações ao ISE. Base Rev. Adm. Contab. UNISINOS 2018, 15, 31–41. [CrossRef]
- Robert, K.W.; Parris, T.M.; Leiserowitz, A.A. What Is Sustainable Development? Goals, Indicators, Values, and Practice. Environ. Sci. Policy Sustain. Dev. 2005, 47, 8–21. [CrossRef]
- Romano, M.; Cirillo, A.; Favino, C.; Netti, A. ESG (Environmental, Social and Governance) Performance and Board Gender Diversity: The Moderating Role of CEO Duality. Sustainability 2020, 12, 9298. [CrossRef]
- Sant’Ana, N.L.D.S.; Medeiros, N.C.D.D.; Silva, S.A.D.L.; Menezes, J.P.C.B.; Chain, C.P. Concentração de Propriedade e Desempenho: Um Estudo nas Empresas Brasileiras de Capital Aberto do Setor de Energia Elétrica. Gest. Prod. 2016, 23, 718–732. Available online: https://www.scielo.br/j/gp/a/pD4cpfndVWZYCMB6Yqqhfhx/abstract/?lang=pt.
- Schoenmaker, D. Investing for the Common Good: A Sustainable Finance Framework; Bruegel: Brussels, 2017; p. 80. Available online: https://aei.pitt.edu/88435/1/From-traditional-to-sustainable-finance_ONLINE.pdf.
- Shakil, M.H.; Tasnia, M.; Mostafiz, M.I. Board Gender Diversity and Environmental, Social and Corporate Governance Performance of US Banks: Moderating Role of Environmental, Social and Corporate Governance Controversies. Int. J. Bank Mark. 2021, 39, 661–677. [CrossRef]
- Teixeira, E.A.; Nossa, V.; Funchal, B. O Índice de Sustentabilidade Empresarial (ISE) e os Impactos no Endividamento e na Percepção de Risco. Rev. Contab. Fin. 2011, 22, 29–44. Available online: https://www.scielo.br/j/rcf/a/Npy4byt4mpTnHbnw4Yy6zLw/?format=pdf&lang=pt.
- United Nations, D.L. Agenda 21: Programme of Action for Sustainable Development, Rio Declaration on Environment and Development, Statement of Forest Principles: The Final Text of Agreements Negotiated by Governments at the United Nations Conference on Environment and Development (UNCED), 3–14 June 1992, Rio de Janeiro, Brazil. Digital Library UN 1993. https://digitallibrary.un.org/record/170126.
- Valls Martínez, M.D.C.; Martin Cervantes, P.A.; Cruz Rambaud, S. Women on Corporate Boards and Sustainable Development in the American and European Markets: Is There a Limit to Gender Policies? Corp. Soc. Responsib. Environ. Manag. 2020, 27, 2642–2656. [CrossRef]
- Zalata, A.M.; Ntim, C.G.; Alsohagy, M.H.; Malagila, J. Gender Diversity and Earnings Management: The Case of Female Directors with Financial Background. Rev. Quant. Finance Account. 2022, 58, 101–136. [CrossRef]
- Ziegler, A.; Schröder, M. What Determines the Inclusion in a Sustainability Stock Index? A Panel Data Analysis for European Firms. Ecol. Econ. 2010, 69, 848–856. [CrossRef]
- Zournatzidou, G.; Ragazou, K.; Sklavos, G.; Sariannidis, N. Examining the Impact of Environmental, Social, and Corporate Governance Factors on Long-Term Financial Stability of the European Financial Institutions: Dynamic Panel Data Models with Fixed Effects. Int. J. Financ. Stud. 2025, 13, 3. [CrossRef]

Table 1.
– Structure and hypotheses.
| Hypotheses | Expected sign | |
| H1 | There is a positive association between foreign ownership and sustainability performance. | + |
| H2 | The greater the organizational maturity, the higher the sustainability performance. | + |
| H3 | The composition of independent members has a positive influence on sustainability performance. | + |
| H4 | CEO duality is negatively associated with sustainability performance. | - |
| H5 | There is a positive association between the presence of women on the board and sustainability performance. | + |
| H6 | An increase in the number of women on the board has a positive impact on sustainability performance. | + |
Source: Author-generated based on the theoretical framework.
Table 2.
- Summary of variables.
| Variable | Division | Acronyms | Description |
| Dependent | Sustainability Index | ISE | Dummy for Sustainability (ISE) |
| Independent | Ownership Structure | PES; PTN; PIN | Logarithms of foreign, traded, and institutional ownership. |
| Organizational Maturity | MAO1 - MAO6 | Dummies for organizational maturity (20-year intervals). | |
| Board Members | MIC; MCIF, TAC | Proportion of independent members and women on independent boards. | |
| CEO Duality | DCE | Dummy for CEO duality. | |
| Female Representation | TMCF1 - TMCF4 | Dummies for one, two, three, or more women on the board. | |
| Control | Economic-Financial Variables | ATI; QTB; ALF; SET; ANO | Logarithm of total assets, Tobin’s Q, financial leverage, sector, and year. |
Source: Author-generated.
Table 3.
- Descriptive analysis of variables.
| Variable | Description | Mean | Median | Stand. Dev. | Max | Min |
| 1. ISE | Sustainability Index | 0.04 | 0 | 0.21 | 1 | 0 |
| 2. PES | Log of foreign | 4.71 | 4.59 | 0.87 | 8.0 | 3.1 |
| 3. PIN | Log of institutional | 4.67 | 4.59 | 0.77 | 5.1 | -4.6 |
| 4. PTN | Log of publicly traded | 4.92 | 5.08 | 1.06 | 9.6 | 1.3 |
| 5. MAO1 | Maturity from 1 to 20 | 0.36 | 0 | 0.48 | 1 | 0 |
| 6. MAO2 | Maturity from 21 to 40 | 0.20 | 0 | 0.40 | 1 | 0 |
| 7. MAO3 | Maturity from 41 to 60 | 0.19 | 0 | 0.39 | 1 | 0 |
| 8. MAO4 | Maturity from 61 to 80 | 0.13 | 0 | 0.34 | 1 | 0 |
| 9. MAO5 | Maturity from 81 to 100 | 0.05 | 0 | 0.22 | 1 | 0 |
| 10. MAO6 | Maturity over 100 years | 0.06 | 0 | 0.23 | 1 | 0 |
| 11. MIC | Independent members on the board | 0.18 | 0 | 0.30 | 1.1 | 0 |
| 12. MCIF | Women on the independent board | 0.02 | 0 | 0.06 | 0.7 | 0 |
| 13. DCE | CEO duality | 0.22 | 0 | 0.41 | 1 | 0 |
| 14. TAC | Total members board | 3.02 | 0 | 3.65 | 15 | 0 |
| 15. TMCF1 | One woman board | 0.07 | 0 | 0.25 | 1 | 0 |
| 16. TMCF2 | Two women board | 0.02 | 0 | 0.15 | 1 | 0 |
| 17. TMCF3 | Three women board | 0.01 | 0 | 0.09 | 1 | 0 |
| 18. TMCF4 | More than three women | 0.00 | 0 | 0.03 | 1 | 0 |
| 19. ATI | Log of total assets | 6.25 | 6.37 | 1.03 | 9.11 | -1.2 |
| 20. QTB | Tobin’s Q | 0.38 | 0.00 | 2.14 | 59.03 | -1.4 |
| 21. ALF | Financial leverage | 0.82 | 0.60 | 2.29 | 55.50 | 0.00 |
Source: Generated by the author from research data.
Table 4.
- Results of logistic regressions.
| Independent variables | Model 1. | Model 2 | Model 3 | Model 4 | |||||
| 1 | 2 | 3 | 4 | 5 | 6 | 7 | 8 | ||
| PES (Foreign ownership) | -1.037** | -1.871** | |||||||
| PIN (Institutional ownership) | 0.097 | 0.160 | |||||||
| PTN (Public ownership) | -1.673** | -2.784** | |||||||
| MAO1 (Maturity 1-20 years) | -0.422** | -0.880** | |||||||
| MAO2 (Maturity 21-40 years) | -0.003 | 0.067 | |||||||
| MAO3 (Maturity 41-60 years) | -0.276* | -0.470 | |||||||
| MAO4 (Maturity 61-80 years) | -0.921*** | -1.876*** | |||||||
| MAO5 (Maturity 81-100 years) | 0.185 | 0.132 | |||||||
| MIC (Independent board members) | 0.144 | 0.348 | |||||||
| MCIF (Female independent board) | 1.442** | 2.542** | |||||||
| DCE (CEO duality) | -0.182 | -0.252 | |||||||
| TAC (Board size) | 0.061*** | 0.120*** | |||||||
| TMCF1(One woman on board) | 0.473*** | 0.926*** | |||||||
| TMCF2 (Two women on board) | 1.144*** | 2.094*** | |||||||
| TMCF3 (Three women on board) | 0.608** | 1.169** | |||||||
| QTB (Tobin’s Q) | -0.645 | -1.008 | 0.129*** | 0.242*** | 0.122*** | 0.233*** | 0.105*** | 0.199*** | |
| ATI (Log of total assets) | 2.942*** | 5.085*** | 1.480*** | 2.764*** | 1.155*** | 2.175*** | 1.077*** | 2.229*** | |
| ALF (Financial leverage) | -3.007** | -5.315** | -0.041 | -0.105 | -0.097 | -0.239 | -0.033 | -0.074 | |
| Teste Wald | 34.79** | 28.08** | 349.28*** | 332.85*** | 281.73*** | 236.23*** | 318.00*** | 299.01*** | |
| Pseudo R2 | 0.30 | 0.31 | 0.37 | 0.36 | 0.38 | 0.36 | 0.39 | 0.37 | |
| Teste HL | 0.64 | 0.94 | 0.69 | 0.36 | 0.23 | 0.87 | 0.14 | 0.04 | |
Source: Generated by the author from research data. Note: Distribution of p-values: (*) p-value < 0.10; (**) p-value < 0.05; (***) p-value < 0.01
Table 5.
- Hypotheses results.
| Structures | Hypotheses | Expected Sign | Observed Sign | Results | |
| Ownership Structure | H1 | There is a positive association between foreign ownership and sustainability performance. | + | - | Not supported |
| H2 | The greater the organizational maturity, the higher the sustainability performance. | + | - | Not supported | |
| Board Structure | H3 | The composition of independent members has a positive influence on sustainability performance. | + | + | Supported |
| H4 | CEO duality is negatively associated with sustainability performance. | - | - | Not supported | |
| Gender Diversity on Board | H5 | There is a positive association between the presence of women on the board and sustainability performance. | + | + | Supported |
| H6 | An increase in the number of women on the board has a positive impact on sustainability performance. | + | + | Supported |
Source: Generated by the author based on the theoretical framework and results obtained.
Disclaimer/Publisher’s Note: The statements, opinions and data contained in all publications are solely those of the individual author(s) and contributor(s) and not of MDPI and/or the editor(s). MDPI and/or the editor(s) disclaim responsibility for any injury to people or property resulting from any ideas, methods, instructions or products referred to in the content. |
© 2025 by the authors. Licensee MDPI, Basel, Switzerland. This article is an open access article distributed under the terms and conditions of the Creative Commons Attribution (CC BY) license (http://creativecommons.org/licenses/by/4.0/).
Copyright: This open access article is published under a Creative Commons CC BY 4.0 license, which permit the free download, distribution, and reuse, provided that the author and preprint are cited in any reuse.


