
Submitted:
10 March 2025
Posted:
11 March 2025
You are already at the latest version
Abstract
The visual environment of landscape views in historic districts faces challenges from high population density and tall modern buildings. This study takes the Historic Districts of Macau as an example, collecting eye-tracking data from 30 residents and tourists and data from 237 questionnaires to verify the differences in visual behavior and place-identity emotions of different visual elements and to explore the correlation between landscape visual perception and place identity. The results show that: (1) Residents and tourists exhibit the same visual behavior when viewing the same landscape images, but there are significant differences in their place-identity psychology. (2) There are significant differences in the visual behavior of different visual elements in landscape images. In particular, the visual elements of landmark buildings have significant visual attractions, but the proportion of landmark buildings in visual elements is low. (3) The visual aesthetic evaluation factors of 13 landscape elements, including the color vividness of landmark buildings, the color vividness of water, the color vividness of mountains, and the color vividness of landmark buildings, have a significant impact on the sense of place identity in historic districts. In addition, the method of combining eye-tracking and psychometric measurement used in this study can effectively evaluate the urban landscape visual experience. The research results help to understand the attractiveness of important landscape views in historic districts and provide data support and reference for the visual control and protection of historic district landscapes.
Keywords:
visual elements
; place identity
; landscape
; population differences
; historic districts
1. Introduction
With the rapid growth of the global urbanization process, the urban population density is increasing dramatically. The landscape views in historic districts are blocked by modern tall buildings. In the face of the decline in the quality of the visual environment caused by uncontrolled rapid urban development for urban heritage protection, UNESCO has proposed the theory and methods of urban historical landscape (Centre, n.d.). However, the perception evaluation of important landscape views in historic districts remains an urgent problem in the coordinated development and protection of historic cities. Constructing a visual environment aesthetic evaluation system with perception as the core has become a major research topic in the field of urban historical heritage protection and planning in recent years (M. Liu and Nijhuis 2020). The use and satisfaction of urban landscape architecture physical space mediate the psychological health of the public (Hadavi 2017). The construction of the aesthetic evaluation system of the visual environment with perception as the core has become the core research issue in the fields of urban architecture, urban landscape architecture and planning in recent years (Q. Liu et al. 2021), and visual perception accounts for approximately 80% of all types of human perceptions, and the visual system is the most important way for humans to obtain external information (Gholami et al. 2021). The evaluation results of the study on urban streets and buildings also provide a corresponding basis for the visual control of urban landscape architecture (Fu et al. 2023). In the changing urban landscape, we need to understand which elements in urban landscape architecture can attract the attention of viewers from urban viewing platforms and the psychological impact of their aesthetic evaluation of the visual elements of urban landscape architecture on place identity.
2. Literature Review
With improvements in ergonomic technology, eye-tracking experiments provide a scientific means to explore human emotions based on physiological indicators (Scott et al. 2017), Such experiments can help identify visual behaviour characteristics and patterns in people’s perception of public landscape visual element [8]. In urban park landscape architecture research, based on the fixed time and counting of eye-tracking experimental data, it was found that the proportion of landscape architecture elements affects the evaluation of the landscape architecture space (J. Li et al. 2020), and in terms of mountain landscape architectures, it was found that artificial visual elements attract more attention than natural elements(Guo et al. 2021). In the field of forest research, it has been found that the visual behavior of the public towards the elements is different due to the different spatial elements of the forest landscape architecture (Zhou et al. 2022). In summary, most scholars focus on visual perceptions and behavioural preferences in relation to landscape architectures such as forests, mountains and urban parks. However, the association between the perception of physical visual elements of the environment and the effect of place identity is very limited [12], However, the mechanism by which the objective environment that generates visual perception evaluation affects the viewer’s place identity is still unclear. Most of the research on the public’s perception of urban landscape architecture focuses on comparing natural and artificial visual elements, while ignoring the differences in evaluation objects [13]. In this study, due to the length of stay and purpose in the historic district, the public is divided into two main groups: residents and tourists. We explore the differences in visual behavior of different populations towards the important view landscapes of the same historic district. Therefore, the following hypotheses are proposed:
Hypothesis H1.
Different populations have different perception behaviors towards important landscapes and different landscape elements in historic districts.
Topophilia is the emotional connection between people and the natural environment in which they live (Brian F. Blake 1974). In the 1980s, environmental psychology introduced the concept of “place identity”—the ‘socialized self in the objective world’. The theory of place identity has been empirically studied in relation to urban living space and tourist space, and in terms of theoretical dimension, established studies have confirmed the correlation between place identity and familiarity, sense of belonging, environmental preferences, intimacy, cultural atmosphere and stimulation of former memories, etc. Rather than existing on the same temporal plane, identification processes drive other affective and conative elements that underlie people attachments to physical environments (Kyle, Jun, and Absher 2014). People’s aesthetic evaluation of the visual environment is an important link between them and the environment. Most of the research on place identity and emotion around the environment uses the interview method to evaluate people’s emotional tendencies visit the environment (Tenzer and Schofield 2023). In a crowd of people looking at the landscape architecture, residents and tourists engage in social interactions, and their perception of the urban landscape architecture and culture has a significant impact on their urban place identity [17]. The psychology of place identity has a positive impact on the resilience of the urban landscape architecture (Menatti et al. 2019).
Since the 1980s, the evaluation of visual quality has mainly focused on the aesthetic evaluation of visual perception, and the evaluation object changes from a single nature evaluation system to a pluralistic human-nature emotional relationship evaluation system. In recent years, street view images have been used to evaluate visual quality through research methods such as machine learning and deep learning (Zhao, Lu, and Lin 2024), and the experimental approach to assessing the specific role of the visual and auditory environment in the city in influencing human emotions (Jiang et al. 2021). However, the impact mechanism between visual aesthetic evaluation and place identity is still unclear. We explore the differences and impact effects between the aesthetic evaluation and place identity of different populations towards the important landscapes of the same historic district. Therefore, the following hypotheses are proposed (Figure 1):
Hypothesis H2.
There are differences in the place—identity emotions of residents and tourists towards the important landscapes of the same historic district.
Hypothesis H3.
There is a significant impact relationship between the perception evaluation of landscape views in historic districts and place—identity emotions.
3. Method
3.1. Study Scope and Stimulus Images
Located on the southeastern coast of China, Macao has the highest population density in the world (‘Statistics -- Statistics and Census Service’, n.d.). It has a urban history of more than 400 years. The Historic Centre of Macau and its buffer zone are located in the core area of the city, accounting for 12.9% of the area of the Macau Peninsula. Its urban form has a unique and super—compact style, especially in the Historic Centre of Macau (Zhang, Lai, and Jim 2017).
The purpose of this study is to define the landscape views of Macau based on the overall urban planning of the Macau Special Administrative Region [23]. Viewing points are selected by using the planning vision, the public vision of on—site research, and the corridor distribution. According to the category of observation objects, it is divided into 4 themes, and there are 12 important view landscapes in total (Table 1).
We categorized the main visual environmental elements seen from each observation deck. The classification of buildings was based on the height of the buildings according to the latest version of China’s Unified Standard for Civil Building Design [24]. Buildings with a height of no more than 27 m are low-rise buildings, buildings with a height of 27–100 m are high-rise buildings and buildings with a height of more than 100 m are super high-rise buildings. We classified the landscape architecture views according to the viewing objects and summarized the main environmental visual elements (Figure 2, Table 1).
Landscape photographs can be used as input for eye-tracking experiments and can effectively replace the visual perception of the real environment (L. Liu et al. 2022). Moreover, the use of photographs as stimuli for eye-tracking experiments can eliminate the influence of any external conditions, such as light intensity and seasonal changes (Gao et al. 2021). Therefore, experimental images were taken in similar weather conditions using a Canon RP camera with a 16 mm lens, and the height of the photographer’s eyes was approximately 1.4 m. A total of 168 horizontal landscape architecture images were taken from observation decks in Macao, and five experts were invited to classify them. The experts selected certain images that were then encoded. The size of the images was standardized, with a length-to-width ratio of 16:9. The resolution was 6000 × 3374 dpi. Because the weather was an uncontrollable factor in the environment, research on the perception of the sky’s visual elements was not within the scope of this study, and the sky in the images was uniformly replaced by a white area (Figure 3).
3.2. Eye Tracking Experiments
3.2.1. Participants
During the study, 30 members of the public who had visited observation decks in Macao were selected and divided into two groups, residents (n = 15) and tourists (n = 15), according to their purpose in visiting and the length of their stay. Two eye-tracking experiments were conducted at the lab. All participants saw the image samples for the first time, and all had uncorrected or corrected visual acuity of 1.0 or higher with no colour weakness or colour blindness. The participants were aged 20–40. Their academic majors were architecture-related (n = 12) and non architecture-related (n = 18), and they had professional backgrounds in industrial design, physics, chemistry, computer science, fine arts, etc. The participants were allowed to freely view the scene, as this is the most natural and common way to view the landscape architecture (A. S.-H. Huang and Lin 2020).
3.2.2. Experimental Protocol
Considering the interference effect of light on eye-tracking experiments, the experiment was conducted in the laboratory. Curtains were used throughout the experiment to block out outdoor light sources, and the laboratory light environment was adjusted and controlled by internal lighting. The eye-tracking experiments were conducted with the aid of the Tobii Pro Fusion, manufactured by the Swiss company, and images of the experimental material were displayed on a 23.8-inch screen (1920 × 1080 dpi, 600 Hz) in the lab.
To begin, participants were in a laboratory with a capacity of more than 40 people, and the experimenter explained the purpose, procedures, and requirements of the experiment to the participants individually before the start of each eye movement experiment, with no conversation between participants. Once participants understood the experiment, they were invited to sit in a comfortable chair and were assisted by the experimenter in calibrating the eye-tracker to make sure that it was calibrated accurately, and then nine sample images of the study site were displayed. Each image sample was displayed for 20 s with a 2 s gap between images between images, was used to alleviate eyestrain and ensure visual focus adjustment.
Each session lasted approximately 30 min, with approximately 4 min of introduction and preparation before the experiment, approximately 6 min for the eye-tracking experiment and approximately 20 min for the questionnaire content (Figure 4).
3.2.3. Drawing AOIs
The relationship between visual behaviour and the visual environment was explored using areas of interest (AOIs). The AOIs in the samples were determined according to the main fixed elements of the images in order to analyse the spatial and visual elements of the image samples used. The visual elements in the environment around the the observation decks in Macao were divided into features such as landmarks, low-rise buildings, high-rise buildings, skyscraper buildings, green plants, water, mountains, roads, and so on (Figure 5).
3.2.4. Data Index Selection
Gaze-point location indicates the coordinates of the point of interest that the subject focuses on in a single picture; gaze frequency indicates the subject’s interest level in the area of interest in a single picture; gaze duration indicates the subject’s difficulty in perceiving the difficulty of a landscape architecture feature; the values of gaze frequency and gaze duration are considered to be attractiveness (L. Liu et al. 2022). To explore the visual behaviour characteristics of the residents and tourists in relation to the AOIs in the images, a number of eye-tracking indicators were analysed. Six indicators were selected to study the visual perceptual behaviour of the participants—total fixation time (TFD), fixation count (FC), time before first fixation (TFF), time to first fixation (FFD), average fixation duration (AFD) and view count (VC) ([27]. Table S1). These metrics were used to identify the characteristics of viewer visual behaviour towards visual elements of the urban overlook landscape.
3.3. Visual Aesthetics and Place Identity Scale
3.3.1. Questionnaire Design
After the eye-tracking experiment and retrospective interviews, the same nine real-life images used in the eye-tracking experiment were used to evaluate the aesthetics of different visual elements. The colour labels of the visual elements were divided by the AOIs, combined with the dimension of place identity, the degree of identification of tourists and residents was psychologically measured. The questionnaire took the residents and tourists as the subjects and preliminarily screened the visual elements according to the distribution of eye movement. Moreover, we invited six experts in the field of architecture to classify and describe the visual elements of the overlook landscapes, and we selected eight evaluation indicators—the proportion of coordination, form richness, neatness and aesthetics, colour vividness, change difference and so on—to evaluate the visual aesthetics of the landscape architecture viewed from urban observation decks (N. Li et al. 2022).This was combined with the five-point liker-style Psychological Scale of Place Identity, which was used by the residents and tourists (Boley et al. 2021),it consisted of statements or questions followed by five answer statements (Supplementary Materials: Table S2).
3.3.2. Participants
A total of 250 participants were selected at observation decks in Macao, including 30 participants from the eye-tracking experiment, and 250 questionnaires were distributed, 225 of which were online. The questionnaire collection was from 1 November 2023 to 30 December 2023. A total of 237 valid questionnaires were collected, with a response rate of 94.8%.
3.3.3. Data Analysis
The data were analysed using SPSS 21.0 (IBM Corp., Armonk, NY, USA) and plotted using Origin 2022 (OriginLab Corp., Northampton, MA, USA) and Adobe Photoshop (Adobe Inc., San Jose, CA, USA). The procedure was as follows.
(1) One-way analysis of variance (ANOVA) was used to analyse the differences in the visual behaviour indicators and to determine the differences between different groups of people on the same viewing platform for the same image and different visual element eye-movement indicators. An independent sample t-test and univariate analysis were conducted, and H1 was verified.
(2) The visual aesthetic evaluation and psychometric measurement of different scenes were carried out using the questionnaire data. Reliability and validity analyses and an independent sample t-test were carried out to determine the psychological differences among different groups of people in relation to the place with the same overall landscape architecture. The aim was to verify H2.
(3) Correlation analysis and multiple regression equations were used to determine the correlation between the aesthetic evaluation indexes of different visual elements and place identity, and H3 was verified.
4. Results and Analysis
4.1. Eye Tracking Heat Map Distribution and Analysis
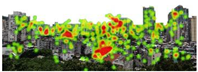
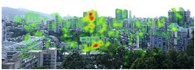
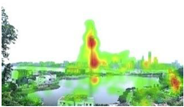
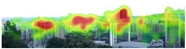
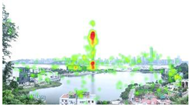
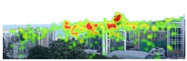
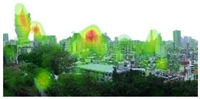
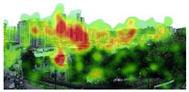
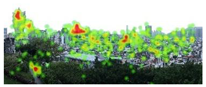
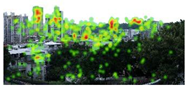
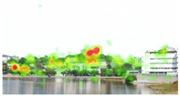
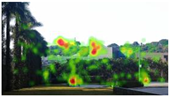
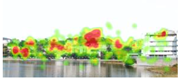
The eye-tracking data collected using Tobii Pro Lab (v1.194) were analysed to generate an eye-movement heat map of the images, and the most important visual elements according to the residents and tourists were analysed and screened using notation (Z. Li et al. 2021).
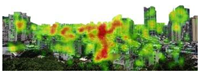
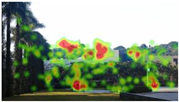
Taking the thermal distribution of Figure A-01 as an example, the visual elements of landmark buildings, high-rise buildings, super high-rise buildings and water systems in the figure have a high degree of attention; the colours are dark red and orange–red, and the ‘●’ symbol is used. The lower buildings and mountains are considered but are not obvious. The colours include light green spots, and the ‘◎’ symbol is used. Green plants and roads do not receive significant attention. There is no heat distribution and no light green spots, and the ‘○’ symbol is used. Taking the heat distribution of Figure A-02 as an example, there are no visual elements of landmark buildings in the figure, and the ‘╳’ symbol is used. The explanation of the identification situation for other heat maps is the same, and the visual elements corresponding to the visual hotspots in the image are identified similarly (Table 2).
Comparing the eye-movement heat distribution maps of residents and tourists, the visual elements that residents pay attention to are more concentrated, and the focus is on the visual center of the image and the visual elements of the buildings with a regional identity. Meanwhile, the visual elements that tourists pay attention to are more scattered, but the attention paid to different visual elements tends to be consistent. Looking at the heat distribution map of the landscape architecture image eye-movement experiment performed on the observation decks in Macao, the visual elements concentrated on are landmarks, skyscraper buildings, high-rise buildings, water and other visual elements, and the colors are dark red and orange.
Using the eye-tracking heat map and the visual element markers corresponding to hotspots, a preliminary screening of visual elements was carried out. The visual element of roads was marked with an ‘○’ symbol and an ‘╳’ symbol in the nine images, indicating that the residents and tourists paid less attention to roads. We screened out landmark buildings, low-rise buildings, high-rise buildings, super high-rise buildings, water systems and mountains. Seven visual elements, including green plants, were used to support the ANOVA and the results of the perceptual identity questionnaires.
4.2. Perceptual Behavior of Visual Elements
4.2.1. Visual Behavior of Different Groups of Viewers
The eye-movement index of one image was randomly selected from the landscape architecture images viewed by each group on the observation decks, and six eye-movement indicators of the residents (n = 15) and tourists (n = 15) were analysed. Finally, the eye-tracking experiment data for the three landscape architecture images of A-01, B-02 and C-02 were selected as the data sources. According to the experimental results for different groups of participants on the same observation deck (Supplementary Materials, Table S1), SPSS 21.0 (IBM Corp.) software was used to perform an independent sample t-test (Figure 6, Supplementary Materials: Table S3), and the significance of the six visual behaviors in the two groups was compared.
From the data in Table S3, the F-value (i.e., the Levene F-statistic) has a p-value > 0.05 for six variables, and these six eye-tracking data all show the same variance. In the two-tailed test, the p-value is also >0.05; combined with the F-statistic, this suggests that the visual behaviour of the two groups towards the same landscape architecture elements has no significant difference, and the visual behaviour characteristics of the same view are maintained.
4.2.2. Eye Movement Indicators of Different Visual Elements
A multivariate model with the proportion of visual elements as a covariate was used to analyse the influence of the visual element types on visual behaviour and to determine the differences. Again, we selected the eye-tracking experiment data of A-01, B-02 and C-02 as the data sources and used SPSS 21.0 (IBM Corp.) to conduct a one-way ANOVA for the six eye-movement indicators of seven visual elements in the landscape architecture image: landmark buildings, low-rise buildings, high-rise buildings, super high-rise buildings, water systems, mountains and green plants. We then conducted a least significant difference multiple comparison test and obtained statistical data results (Figure 7, Supplementary Materials: Table S4).
From the data in the Table S4 and Figure 7, it can be seen that among the eye-movement indicators of the visual elements of different landscape architecture images seen from the observation decks, the TFD and AFD showed a significant difference at the 0.01 level (p < 0.01); the three indicators of FC, FFD and VC showed a significant difference at the 0.05 level (p < 0.05). There was no significant difference in the TFF (p > 0.05).
Of the eye-movement indicators of the different visual elements, the visual elements of super high-rise buildings and landmark buildings had the strongest significance. From the perspective of the AFD and FC eye-tracking indicators, the mean values of the visual elements of super high-rise buildings and landmark buildings were higher. This indicates that it was most difficult for participants to extract data from super high-rise buildings and landmark buildings, as this required a greater cognitive load. The overall trends of the FFD, TFF, AFD and VC eye- tracking indicators are essentially consistent with the TFD trend, and they are also consistent with the distribution results of the eye-tracking heat map.
In summary, the analysis of the eye-tracking indicators revealed differences in the data of the TFD, FC, FFD, AFD and VC among the visual behaviour indicators of the viewers when looking at urban landscape architectures (p < 0.05). Therefore, we can verify that H2 is valid.
4.3. Questionnaire Data Results and Analysis
4.3.1. Questionnaire Validity Test
The data of 237 questionnaires were imported into SPSS 21.0 for reliability and validity testing. The reliability of the four dimensions of the questionnaire was monitored, and a Cronbach’s a value of >0.7 was found, indicating that the overall reliability of the questionnaire was good. A Kaiser–Meyer–Olkin (KMO) test revealed a KMO value = 0.978 > 0.8 and a p-value (Sig.) = 0.000 < 0.05 with high significance. The questionnaire passed the BART spherical test of the KMO check sum.
4.3.2. The Psychological in Place Identity of Different Groups of Viewers
A total of 237 questionnaires were used as data sources to divide the participants into residents (n = 126) and tourists (n = 111), and an independent sample t-test was used to compare the significance of the identity psychology between the two groups visit the same landscape architecture and place (Figure 8).
Looking at the data in the Figure 8, among the seven measurement indicators of place identity emotion for nine spots on the landscape architecture, the mean value of the resident group is greater than that of the tourist group. This indicates that the average value of residents’ place identity emotion relating to the landscape architecture is higher than that of tourists. However, based on the independent samples t-test, the six place identity sentiment indicators’ p-value > 0. 05 However, the familiarity index < 0.05, so there was a significant difference in the familiarity index in the place identity between residents and tourists in the process of viewing the same landscape, and there was no significant difference in other indicators.
4.3.3. Psychological Correlation with Place Identity
In order to verify the validity of H3, a two-variable Pearson correlation analysis was carried out between the aesthetic evaluation scores of the different visual elements of the landscape architecture seen from the observation decks and the psychological dimensions of place identity; the results are shown in Figure 9. Moreover, the aesthetic evaluation indexes and data for visual elements with a direct correlation with the psychology of place identity were screened out (Figure 9, Supplementary Materials: Table S5).
(1) There were 10 visual aesthetic evaluation indexes with a 0.05 level of significance for place identity psychology and 6 visual evaluation factors with a 0.01 level of significance for place identity psychology.
(2) From the perspective of the visual element categories, the aesthetic perception of green plant visual elements had the strongest psychological correlation with place identity (0.754); the intimacy correlation coefficient between the colour vividness of green plants and the psychological dimension of place identity was the highest (0.834); and the number of evaluation indicators with a correlation between water visual elements and place identity psychology was the highest. There is a significant positive correlation between natural visual elements and place identity.
(3) From the perspective of the evaluation factor categories, the visual aesthetic evaluation index of decorative sophistication and the psychological correlation coefficient of place identity were negative. Therefore, the visual aesthetic evaluation of decorative sophistication had a negative correlation with place identity psychology. The correlation coefficients between the other significance evaluation factors and place identity psychology were positive; therefore, the seven types of visual aesthetic evaluation indexes (e.g., proportion coordination, form richness, neatness and colour vividness) had a positive correlation with place identity psychology.
(4) Among the 16 aesthetic evaluation indexes of visual elements that correlated with the psychology of place identity, the correlation coefficients of the colour vividness of green plants and the colour vividness of water were >0.7, indicating that there was a strong positive correlation between these two items. The correlation coefficients between the remaining 14 visual element aesthetic evaluation indexes and place identity psychology were within 0.3–0.7, indicating that these 14 aesthetic evaluation indicators had a strong correlation with the psychological notion of identity.
4.3.4. Multiple Linear Regression Results and Analysis
In order to verify the most common visual elements that affect the psychology of identity and their significance in the landscape architectures viewed from different urban observation decks, multiple linear regression analysis was used. The dependent variable was the identity attitude, that is, the ‘sense of identity with the city’. The independent variables were the data of eight visual elements and 56 visual aesthetic evaluation indicators corresponding to each visual element, and the model summary, ANOVA results and coefficient results (Table 3) were obtained, and the following equation for the multiple regression equation is obtained.
Y = 0.573 × x1 + 0.316 × x2 + 0.515 × x3 + 0.169 × x4 + 0.617 × x5 + 0.223 × x6 + 0.799 × x7 + 0.094 × x8 + 1.021 × x9–3.10
From the results of the overall regression model data given in the above table, the following outcomes can be delineated.
(1) F = 14.251 and p-value = 0.009 < 0.05, which means that the model shows significance at the level of 0.05. It passes the F test and is linearly correlated with the dependent variable. Thus, the model is verified.
(2) The adjusted R² takes into account the number of arguments used to predict the target variable and can determine whether adding new variables to the model will increase the fit. The adjusted R² value was 0.726, indicating that nine influencing factors could explain 72% of the change in identity psychology. That is, 72.6% of the attachment emotion was caused by these nine influencing factors, and the model fit was average.
(3) The Durbin–Watson (D–W) value = 2.006, which is close to 2, indicating that there is no autocorrelation and that the model has data independence.
According to the significance and correlation coefficients of the independent and dependent variables, the following conclusions can be reached.
(1) Among the independent variables, the color brightness of green plants (p = 0.000 < 0.01, B = 1.021), the color vividness of mountains (p = 0.000 < 0.01, B = 0.799), the color vividness of water (p = 0.000 < 0.01, B = 0.617), the color vividness of landmarks (p = 0.000 < 0.01, B = 0.573), the color brightness of skyscraper buildings (p = 0.000 < 0.01, B = 0.515), the color brightness of high-rise buildings (p = 0.001 < 0.05, B = 0.316), the proportional coordination of mountains (p = 0.001 < 0.01, B = 0.223), and the morphological richness of green plants (p = 0.007 < 0.01, B = 0.094) were highlighted. There was a significant positive correlation between the evaluation factors of these nine visual elements and identity psychology.
(2) The correlation coefficient of the evaluation of decorative delicacy is less than 0, but the p value is more than 0.05, and the correlation coefficient is less than 0.3, therefore, although there is a negative correlation between decorative delicacy and the identity of place of each visual element, the influence is small. Overall, the results of multiple linear regression are consistent with the results of correlation analysis.
5. Discussion
5.1. Visual Aesthetic Evaluation and Psychological Verification of Place Identity
In the analysis of the eye-tracking visual behaviour data, the public showed a strong interest in and visual preference for artificial elements, particularly recognizable landmark buildings and skyscraper buildings, which provides support for similar results obtained in research on visual preference behaviour relating to mountain landscape architectures (Guo et al. 2021). In previous studies, the perceptions of a landscape supporting autonomy, relatedness, and competence are associated with identification, dependence, and emotional connection with that landscape (Landon et al. 2021), and the proportion of artificial visual elements in the urban environment of the historic urban area is much higher than that of natural visual elements. However, the visual aesthetic perception of natural elements such as water, mountains, and green plants has a more significant impact on the psychological perception of place identity, which is also supported by the study of visual perception among different groups of tourists (J. Huang et al. 2022) and cyclists (He et al. 2021). It has also been shown in studies of visual perception in different populations that people experience a more positive psychological impact of natural landscape elements (Deng et al. 2020). From the visual behaviours to emotional cognition, the viewers display great subjectivity in expressing different emotions.
The most important feature of the landscape in the Historic Centre of Macao is the diversity of colours, and the most common colours in urban architecture and landscape architecture in 60 districts of Macao were identified through eye-tracking experiments and data collection (Pohsun Wang et al. 2023). The results show the effect of color vividness on the psychological meaning of different visual elements. According to the eye-tracking data and questionnaire data of different populations, the artificial visual elements in the landscape of the historic urban area accounted for the main proportion. Landmark buildings and supertall buildings are more visually appealing to the public.
For the landscape of the Historic Centre of Macao, although the eye movement experiment found that the visual behavior of different groups of people towards the landmark buildings is significant and visually attractive, compared with the photos of the Guia Mountain in the Outer Harbour Waterway in the 50s of the 20th century, as shown in the Figure 10, it is found that the important sight of the Historic Centre of Macao is affected by the super high-rise buildings, and the proportion of landmark buildings in the picture is relatively small or even less than 1%. The lighthouse landmark can only be seen from a wide location, and the former outer harbor cannot be seen from the Guia Lighthouse. In 2008, the Macau government promulgated the first visual landscape control regulation after the inscription of the Historic Centre of Macao as a World Heritage Site, “Setting the Maximum Allowable Altitude for Buildings to be Constructed in the Area Around the Guia Lighthouse”, which set the height limit for buildings around the Guia Light-house at 60 m and relaxed to 90 m in 2015, but UNESCO warned against this, and finally the developer cooperated with the government to take the initiative to reduce the height of the building and abandon the height of 90 m [23]. In this study, the analysis of visual behavior and the measurement of place identity provide data support for the control of building height within the important line of sight in the historic urban area.
5.2. Limitations and Future Work
While this study uncovered an interesting phenomenon and provided a new perspective on enhancing urban identity, there are some limitations. In future research, it will be necessary to greatly increase the number of subjects and include subjects from different cultural backgrounds, social and economic classes, and geographical regions to strengthen the universality and representation of research results(W. Liu et al. 2025).
In future work, there is a need to explore in more depth the differences in participants’ affective attitudes related to their own identity features in the environment. Previous research has found that women are more interested in the landscape architecture as a whole, whereas men are more interested in parts of the landscape architecture with prominent human architectural features, complex colours and open spaces [37]. In addition to using eye tracking, wearing physiological sensing devices, carrying GPS location devices, and human behaviour recognition are all useful methods for capturing behavioural data. These behavioural metrics data can be processed by artificial neural networks and visual quality models can be built to support decision making. Therefore, future research will require deep intersections with other disciplines to provide data to inform landscape architecture theory development and guide urban overlook landscape architecture planning and management.
6. Conclusions
During the eye-movement experiment of viewing the landscape architecture images of Macao seen from the observation decks in Macao, there was no significant difference between the visual behaviour of residents and tourists looking at the same landscape architecture images. However, in the analysis of the behaviour data of different visual elements in the landscape architecture, the TFD, AFD, FC, FFD and VC showed significant differences (p < 0.05). It was found that the eye-movement behaviour related to the visual elements of landmark buildings and super high-rise buildings was the most significant, indicating that H1 is valid.
According to the analysis of the psychological measurement questionnaire data of residents and tourists viewing the same landscape architecture from the same platform, We know that the average level of place identity is higher than that of tourists, and there are significant differences in familiarity indicators (p < 0.05), indicating that H2 holds true.
Combining visual aesthetic evaluation and identity psychometric results, By correlation and multiple linear regression analysis, buildings, thevaluation of visual elements of high density cities in Macao is related with site identification, And the color brightness of green plants, the color vividness of mountains, the color vividness of water, the color vividness of landmarks, the color brightness of skyscraper buildings, the color brightness of high-rise buildings, the proportional coordination of mountains, and the morphological richness of green plants. The nine evaluation factors of visual elements show a significant positive correlation with the psychology of place identity. Regarding the visual evaluation factor, there is a negative correlation between decorative refinement and identity psychology. However, the influence effect was not significant, indicating that H3 holds true.
This study is of significance in improving viewers’ perceptions and evaluation of urban landscapes. Using an eye-tracking experiment, the visual elements of building facade and street style that were the most important to the public were extracted, and combined with the evaluation of the visual elements, an aesthetic evaluation of the landscape architecture seen from existing observation decks was performed. The ability of the visual landscape architecture to stimulate viewers’ sense of urban identity was explored using a place identity psychological scale, and the research results can serve as a basis for urban landscape architecture planning and tourism management. In future research on the visual environment of architecture, eye-tracking experiments can be applied to virtual reality scenes to compare viewers’ evaluation of the visual environment of the landscape architecture before and after a change.
Supplementary Materials
The following supporting information can be downloaded at the website of this paper posted on Preprints.org, Table S1: Eye-tracking indexes for different landscape elements. Table S2: Visual aesthetic and place identity evaluation scale. Table S3: Average of resident and visitor eye movement indicator data. Table S4: One-way ANOVA of eye movement indexes for different visual elements. Table S5: Coefficient of correlation between visual perception and place identity.
Funding
This research was funded by the Science and Technology Development Fund of the Macao Special Administrative Region, grant number: 0036/2022/A. Philosophy and Social Science Planning Projects in Shanxi Province, grant number: 2023YY103.
Institutional Review Board Statement
The study was conducted in accordance with the Declaration of Helsinki, and approved by the Institutional Ethics Committee of City University of Macau (protocol code 2024-RE-24, 10 APR 2024)
Informed Consent Statement
Informed consent was obtained from all subjects involved in the study. Written informed consent has been obtained from the patient(s) to publish this paper.
Data Availability Statement
The original contributions presented in this study are included in the article/supplementary material. Further inquiries can be directed to the corresponding author(s).
Conflicts of Interest
The authors declare no conflict of interest.
References
- UNESCO World Heritage convention. 44 COM 7B.141—Decision. Available online: https://whc.unesco.org/en/decisions/7856/ (accessed on 21 January 2025).
- Liu, M.; Nijhuis, S. Mapping landscape spaces: Methods for understanding spatial-visual characteristics in landscape design. Environ. Impact Assess. Rev. 2020, 82, 106376. [Google Scholar] [CrossRef]
- Hadavi, S. Direct and Indirect Effects of the Physical Aspects of the Environment on Mental Well-Being. Environ. Behav. 2017, 49, 1071–1104. [Google Scholar] [CrossRef]
- Liu, Q.; Zhu, Z.; Zeng, X.; Zhuo, Z.; Ye, B.; Fang, L.; Huang, Q.; Lai, P. The impact of landscape complexity on preference ratings and eye fixation of various urban green space settings. Urban For. Urban Green. 2021, 66, 127411. [Google Scholar] [CrossRef]
- Gholami, Y.; Taghvaei, S.H.; Norouzian-Maleki, S.; Mansouri Sepehr, R. Identifying the stimulus of visual perception based on Eye-tracking in Urban Parks: Case Study of Mellat Park in Tehran. J. For. Res. 2021, 26, 91–100. [Google Scholar] [CrossRef]
- Fu, H.; Wang, P.; Zhou, J.; Zhang, S.; Li, Y. Investigating Influence of Visual Elements of Arcade Buildings and Streetscapes on Place Identity Using Eye-Tracking and Semantic Differential Methods. Buildings 2023, 13, 1580. [Google Scholar] [CrossRef]
- Scott, N.; Zhang, R.; Le, D.; Moyle, B. A review of eye-tracking research in tourism. Curr. Issues Tour. 2017, 22, 1244–1261. [Google Scholar] [CrossRef]
- Amati, M.; Ghanbari Parmehr, E.; McCarthy, C.; Sita, J. How eye-catching are natural features when walking through a park? Eye-tracking responses to videos of walks. Urban For. Urban Green. 2018, 31, 67–78. [Google Scholar] [CrossRef]
- Li, J.; Zhang, Z.; Jing, F.; Gao, J.; Ma, J.; Shao, G.; Noel, S. An evaluation of urban green space in Shanghai, China, using eye tracking. Urban For. Urban Green. 2020, 56, 126903. [Google Scholar] [CrossRef]
- Guo, S.; Sun, W.; Chen, W.; Zhang, J.; Liu, P. Impact of Artificial Elements on Mountain Landscape Perception: An Eye-Tracking Study. Land 2021, 10, 1102. [Google Scholar] [CrossRef]
- Zhou, S.; Gao, Y.; Zhang, Z.; Zhang, W.; Meng, H.; Zhang, T. Visual Behaviour and Cognitive Preferences of Users for Constituent Elements in Forest Landscape Spaces. Forests 2022, 13, 47. [Google Scholar] [CrossRef]
- Justulin Zacarias, E.F.; Gasparetto Higuchi, M.I. Overview of studies on place identity. Novos Cad. NAEA 2021, 24, 57–72. [Google Scholar]
- Liu, L.; Qu, H.; Ma, Y.; Wang, K.; Qu, H. Restorative benefits of urban green space: Physiological, psychological restoration and eye movement analysis. J. Environ. Manag. 2022, 301, 113930. [Google Scholar] [CrossRef]
- Brian, F. Blake Topophilia: A Study of Environmental Perception, Attitudes and Values. By Yi-Fu Tuan. J. Leis. Res. 1974, 6, 323–325. [Google Scholar] [CrossRef]
- Kyle, G.T.; Jun, J.; Absher, J.D. Repositioning Identity in Conceptualizations of Human–Place Bonding. Environ. Behav. 2014, 46, 1018–1043. [Google Scholar] [CrossRef]
- Tenzer, M.; Schofield, J. People and places: Towards an understanding and categorisation of reasons for place attachment—Case studies from the north of England. Landsc. Res. 2023, 49, 340–358. [Google Scholar] [CrossRef]
- Lin, Z.; Chen, Y.; Filieri, R. Resident-tourist value co-creation: The role of residents’ perceived tourism impacts and life satisfaction. Tour. Manag. 2017, 61, 436–442. [Google Scholar] [CrossRef]
- Menatti, L.; Subiza-Pérez, M.; Villalpando-Flores, A.; Vozmediano, L.; San Juan, C. Place attachment and identification as predictors of expected landscape restorativeness. J. Environ. Psychol. 2019, 63, 36–43. [Google Scholar] [CrossRef]
- Zhao, X.; Lu, Y.; Lin, G. An integrated deep learning approach for assessing the visual qualities of built environments utilizing street view images. Eng. Appl. Artif. Intell. 2024, 130, 107805. [Google Scholar] [CrossRef]
- Jiang, B.; Xu, W.; Ji, W.; Kim, G.; Pryor, M.; Sullivan, W.C. Impacts of nature and built acoustic-visual environments on human’s multidimensional mood states: A cross-continent experiment. J. Environ. Psychol. 2021, 77, 101659. [Google Scholar] [CrossRef]
- Statistics—Statistics and Census Service. (n.d.). Government of Macao Special Administrative Region Statistics and Census Service. Available online: https://www.dsec.gov.mo/en-US/Statistic?id=101 (accessed on 17 February 2024).
- Zhang, H.; Lai, P.Y.; Jim, C.Y. Species diversity and spatial pattern of old and precious trees in Macau. Landsc. Urban Plan. 2017, 162, 56–67. [Google Scholar] [CrossRef]
- Zheng, J. The Cultural Construction and Conservation Dilemma of Architectural CulturalHeritage in the Later World Heritage Era of Macao World Architecture; The Cultural Affairs Bureau of the Macao Special Administrative Region Government: Macao, China, 2019; Volume 11, pp. 44–49. Available online: https://www.culturalheritage.mo/Survey/sgchm2017/cn/ (accessed on 13 December 2024).
- Announcement of the Ministry of Housing and Urban-Rural Development on the Issuance of the National Standard “Unified Standard for Civil Building Design”. (n.d.). Available online: https://www.mohurd.gov.cn/gongkai/zhengce/zhengcefilelib/201905/20190530_240715.html (accessed on 9 January 2024).
- Gao, Y.; Sun, X.M.; Zhang, T.; Zhan, H. Analysis on the characteristics of eye movement and the evaluation of psychological perception for forest waterscape space. IOP Conf. Ser. Earth Environ. Sci. 2021, 626, 012007. [Google Scholar] [CrossRef]
- Huang, A.S.-H.; Lin, Y.-J. The effect of landscape colour, complexity and preference on viewing behaviour. Landsc. Res. 2020, 45, 214–227. [Google Scholar] [CrossRef]
- Van Loo, E.J.; Caputo, V.; Nayga, R.M.; Seo, H.-S.; Zhang, B.; Verbeke, W. Sustainability labels on coffee: Consumer preferences, willingness-to-pay and visual attention to attributes. Ecol. Econ. 2015, 118, 215–225. [Google Scholar] [CrossRef]
- Li, N.; Zhang, S.; Xia, L.; Wu, Y. Investigating the Visual Behavior Characteristics of Architectural Heritage Using Eye-Tracking. Buildings 2022, 12, 1058. [Google Scholar] [CrossRef]
- Boley, B.B.; Strzelecka, M.; Yeager, E.P.; Ribeiro, M.A.; Aleshinloye, K.D.; Woosnam, K.M.; Mimbs, B.P. Measuring place attachment with the Abbreviated Place Attachment Scale (APAS). J. Environ. Psychol. 2021, 74, 101577. [Google Scholar] [CrossRef]
- Li, Z.; Sun, X.; Zhao, S.; Zuo, H. Integrating eye-movement analysis and the semantic differential method to analyze the visual effect of a traditional commercial block in Hefei, China. Front. Archit. Res. 2021, 10, 317–331. [Google Scholar] [CrossRef]
- Landon, A.C.; Woosnam, K.M.; Kyle, G.T.; Keith, S.J. Psychological Needs Satisfaction and Attachment to Natural Landscapes. Environ. Behav. 2021, 53, 661–683. [Google Scholar] [CrossRef]
- Huang, J.; Liang, J.; Yang, M.; Li, Y. Visual Preference Analysis and Planning Responses Based on Street View Images: A Case Study of Gulangyu Island, China. Land 2022, 12, 129. [Google Scholar] [CrossRef]
- He, H.; Li, J.; Lin, X.; Yu, Y. Greenway Cyclists’ Visual Perception and Landscape Imagery Assessment. Front. Psychol. 2021, 12, 541469. [Google Scholar] [CrossRef]
- Deng, L.; Li, X.; Luo, H.; Fu, E.-K.; Ma, J.; Sun, L.-X.; Huang, Z.; Cai, S.-Z.; Jia, Y. Empirical study of landscape types, landscape elements and landscape components of the urban park promoting physiological and psychological restoration. Urban For. Urban Green. 2020, 48, 126488. [Google Scholar] [CrossRef]
- Wang, P.; Song, W.; Zhou, J.; Tan, Y.; Wang, H. AI-Based Environmental Color System in Achieving Sustainable Urban Development. Systems 2023, 11, 135. [Google Scholar] [CrossRef]
- Liu, Wei, Ziyan Hu, Yinan Fei, Jiaqi Chen, and Changlong Yu. ‘Eye Tracking and Semantic Evaluation for Ceramic Teapot Product Modeling’. Applied Sciences 2025, 15, 46. [CrossRef]
- Wang, P.; Yang, W.; Wang, D.; He, Y. Insights into Public Visual Behaviors through Eye-Tracking Tests: A Study Based on National Park System Pilot Area Landscapes. Land 2021, 10, 497. [Google Scholar] [CrossRef]
Figure 1.
Conceptual framework between crowd, visual element evaluation, and place identity.
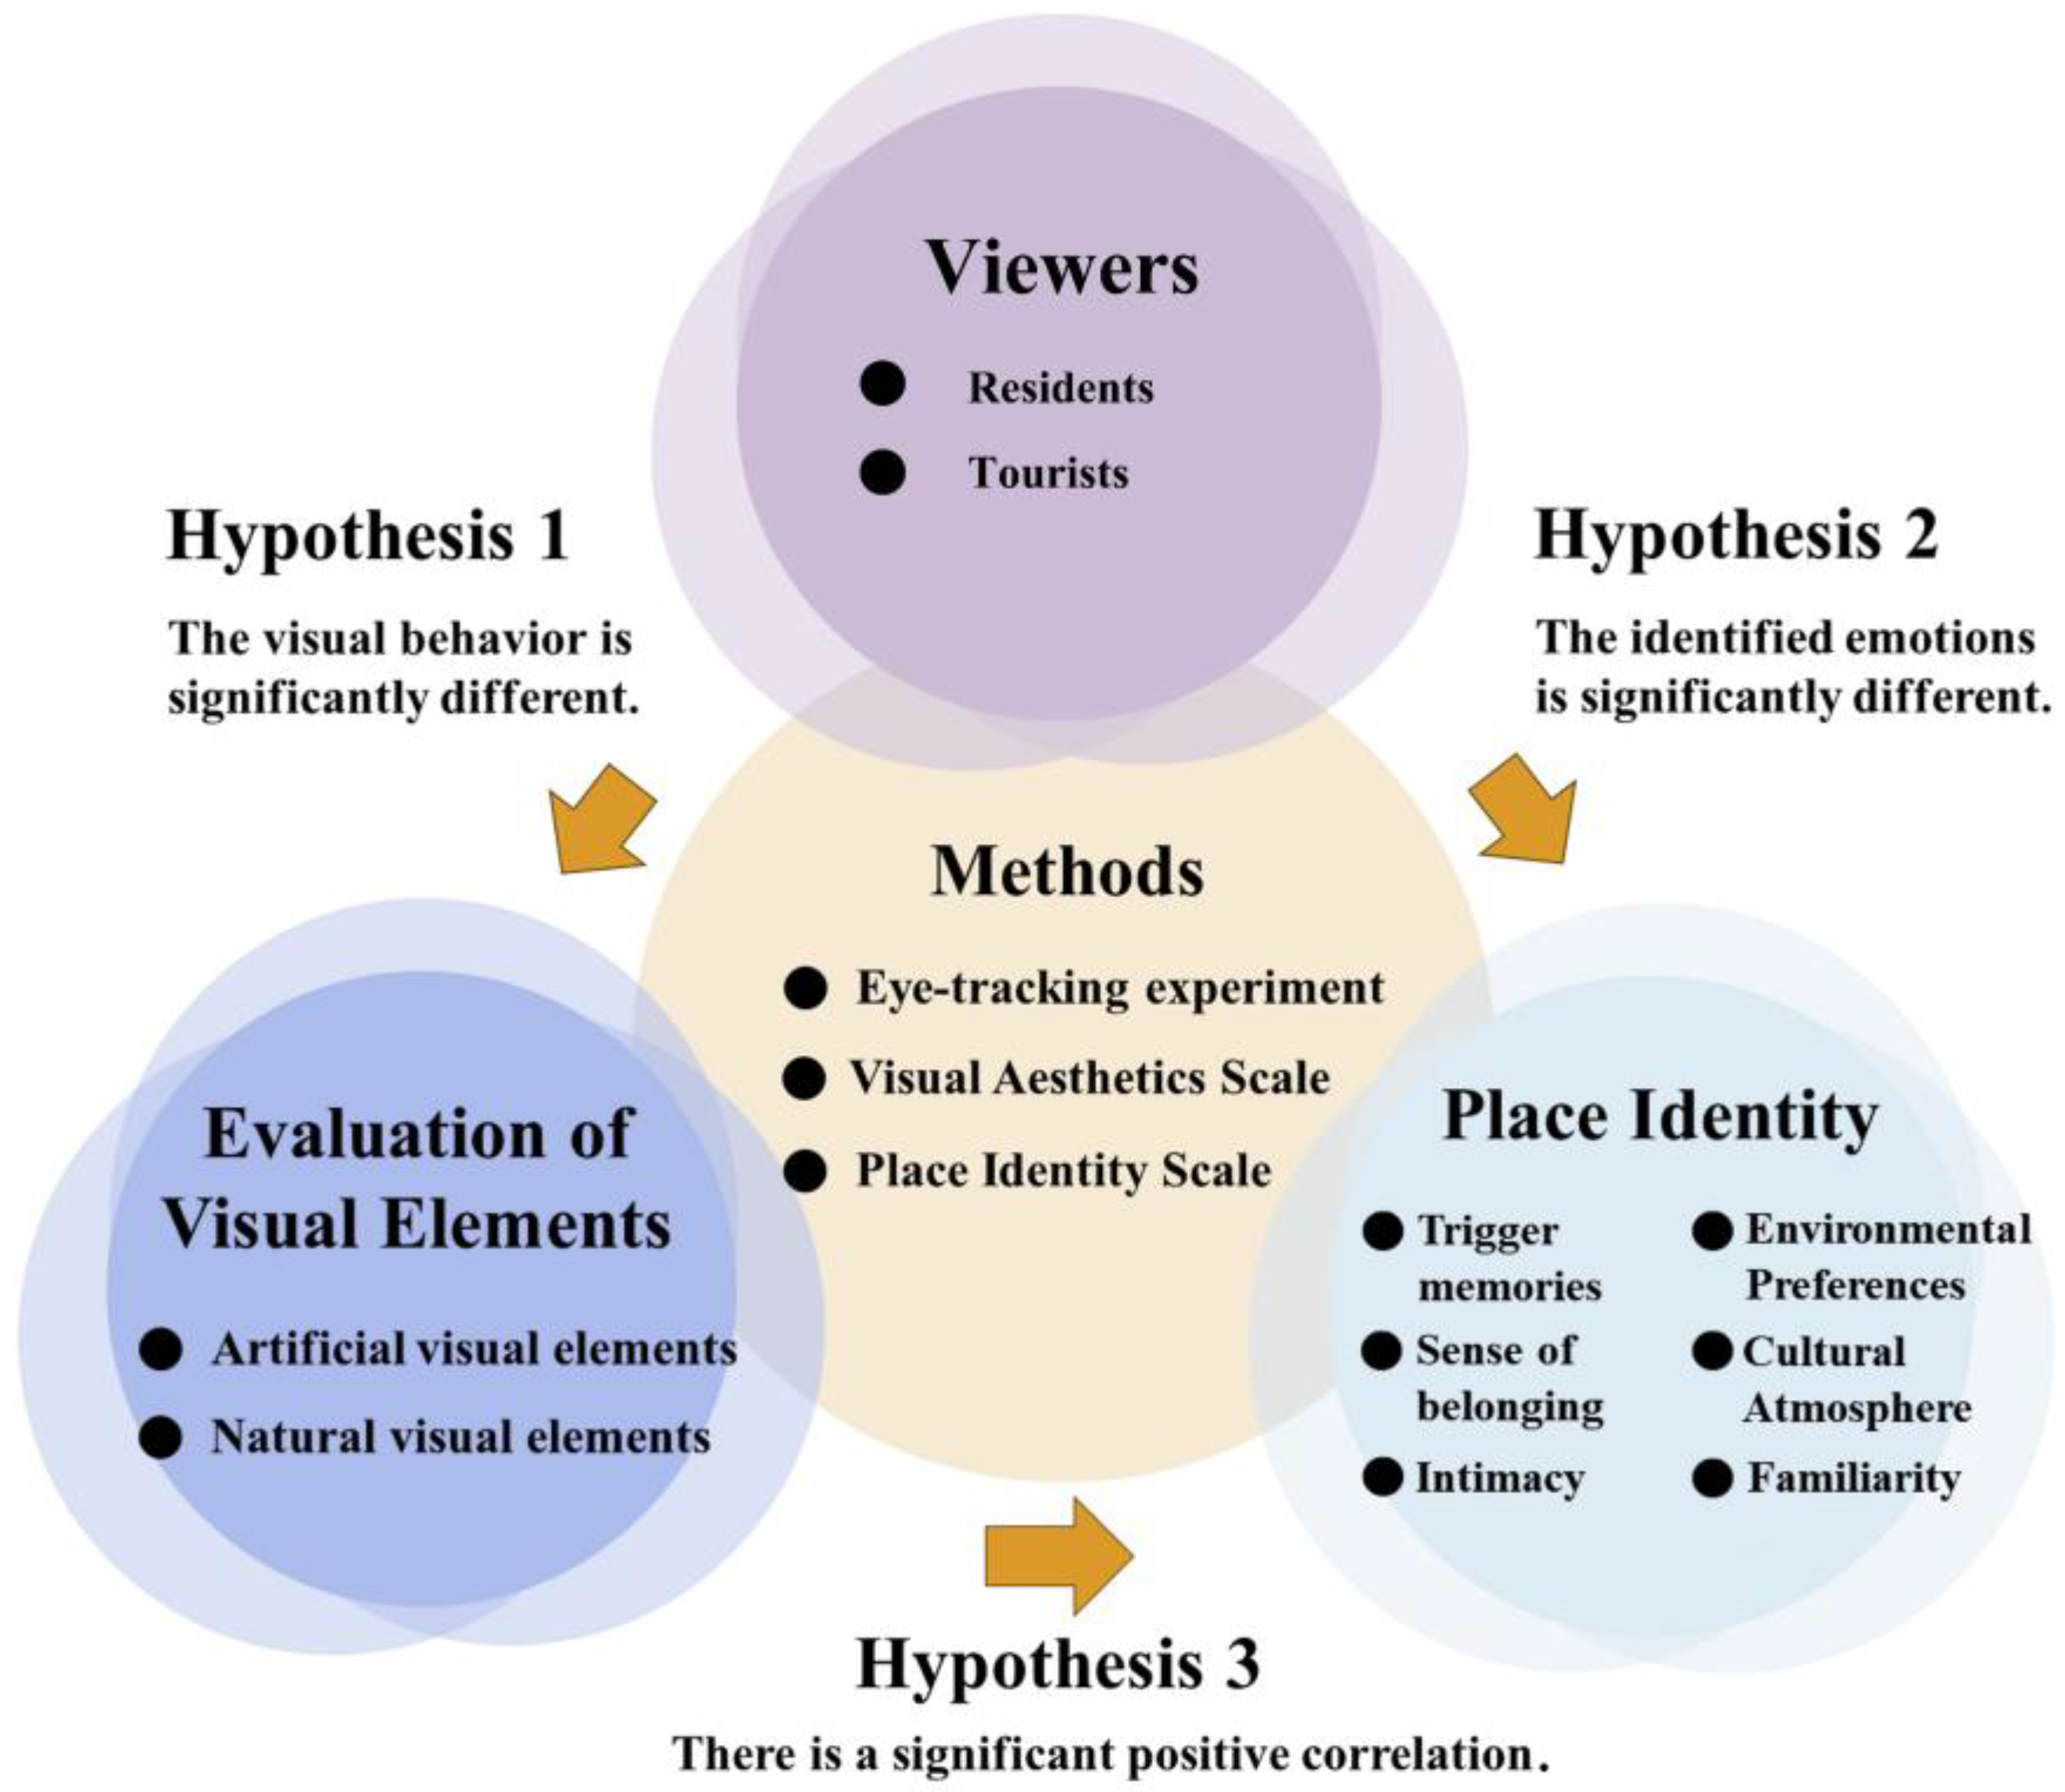
Figure 2.
Schematic diagram of the division of sight lines into the landscape architecture.
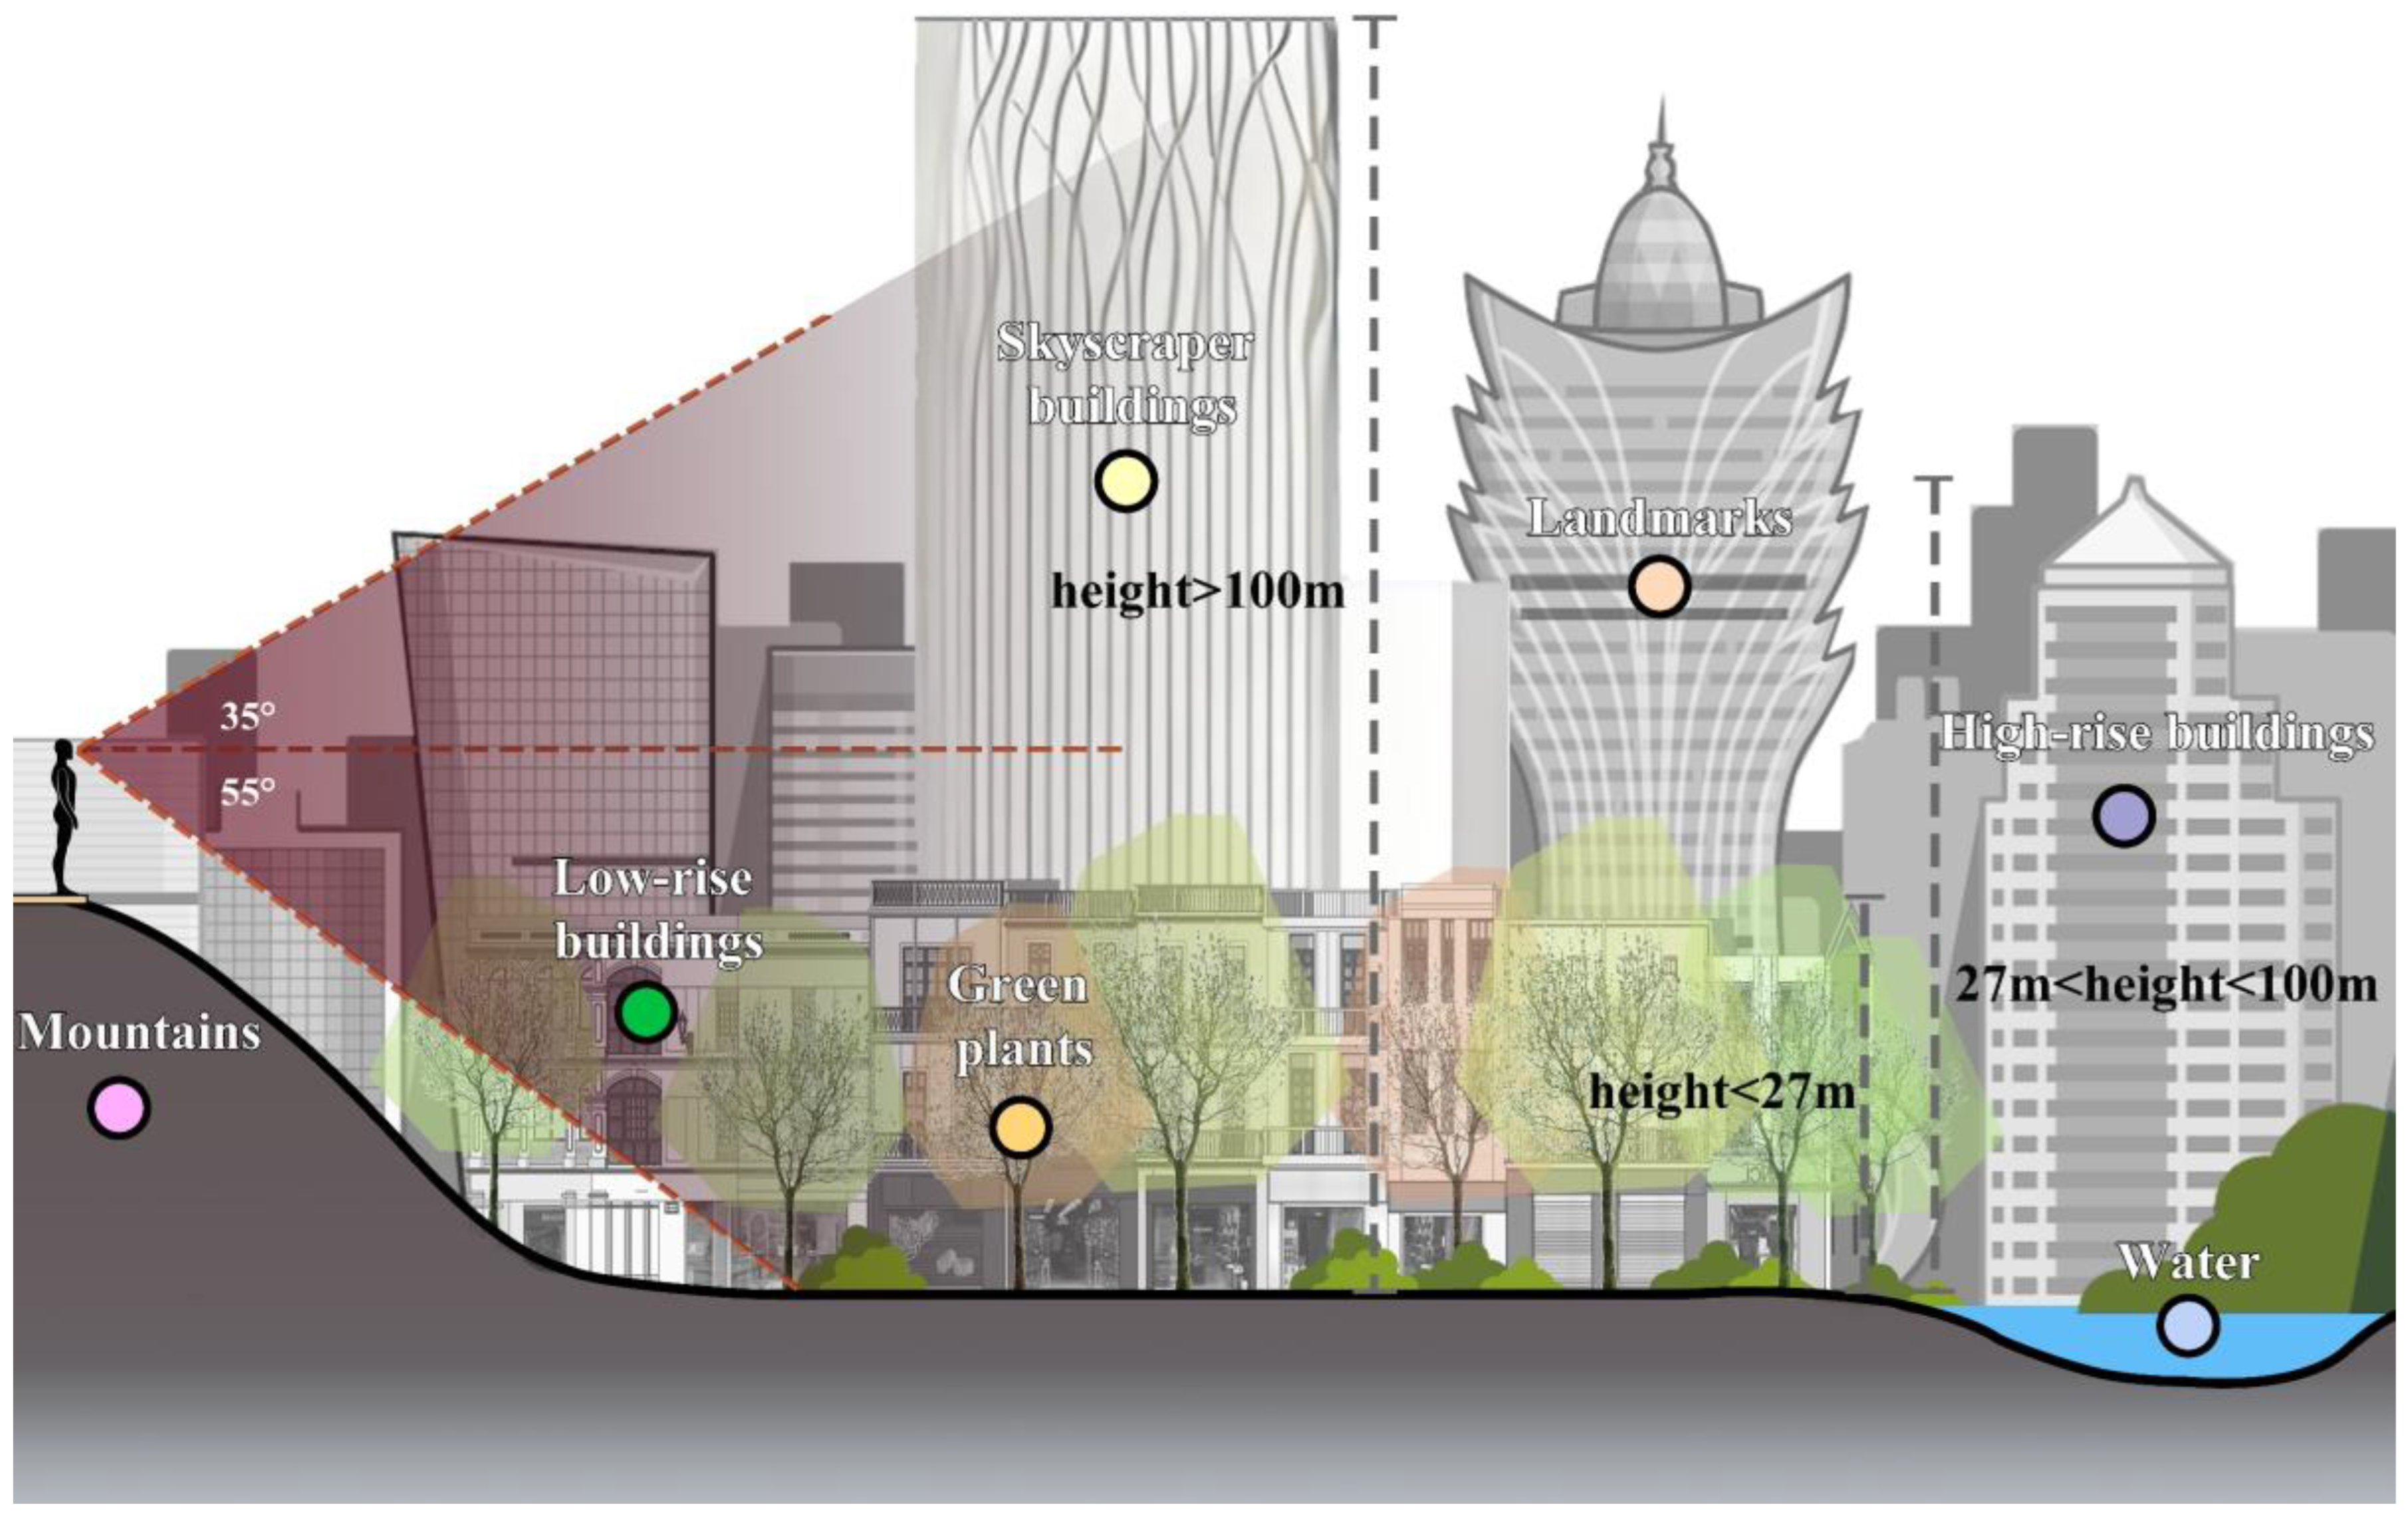
Figure 3.
Distribution of important sightlines in the Historic District of Macao.
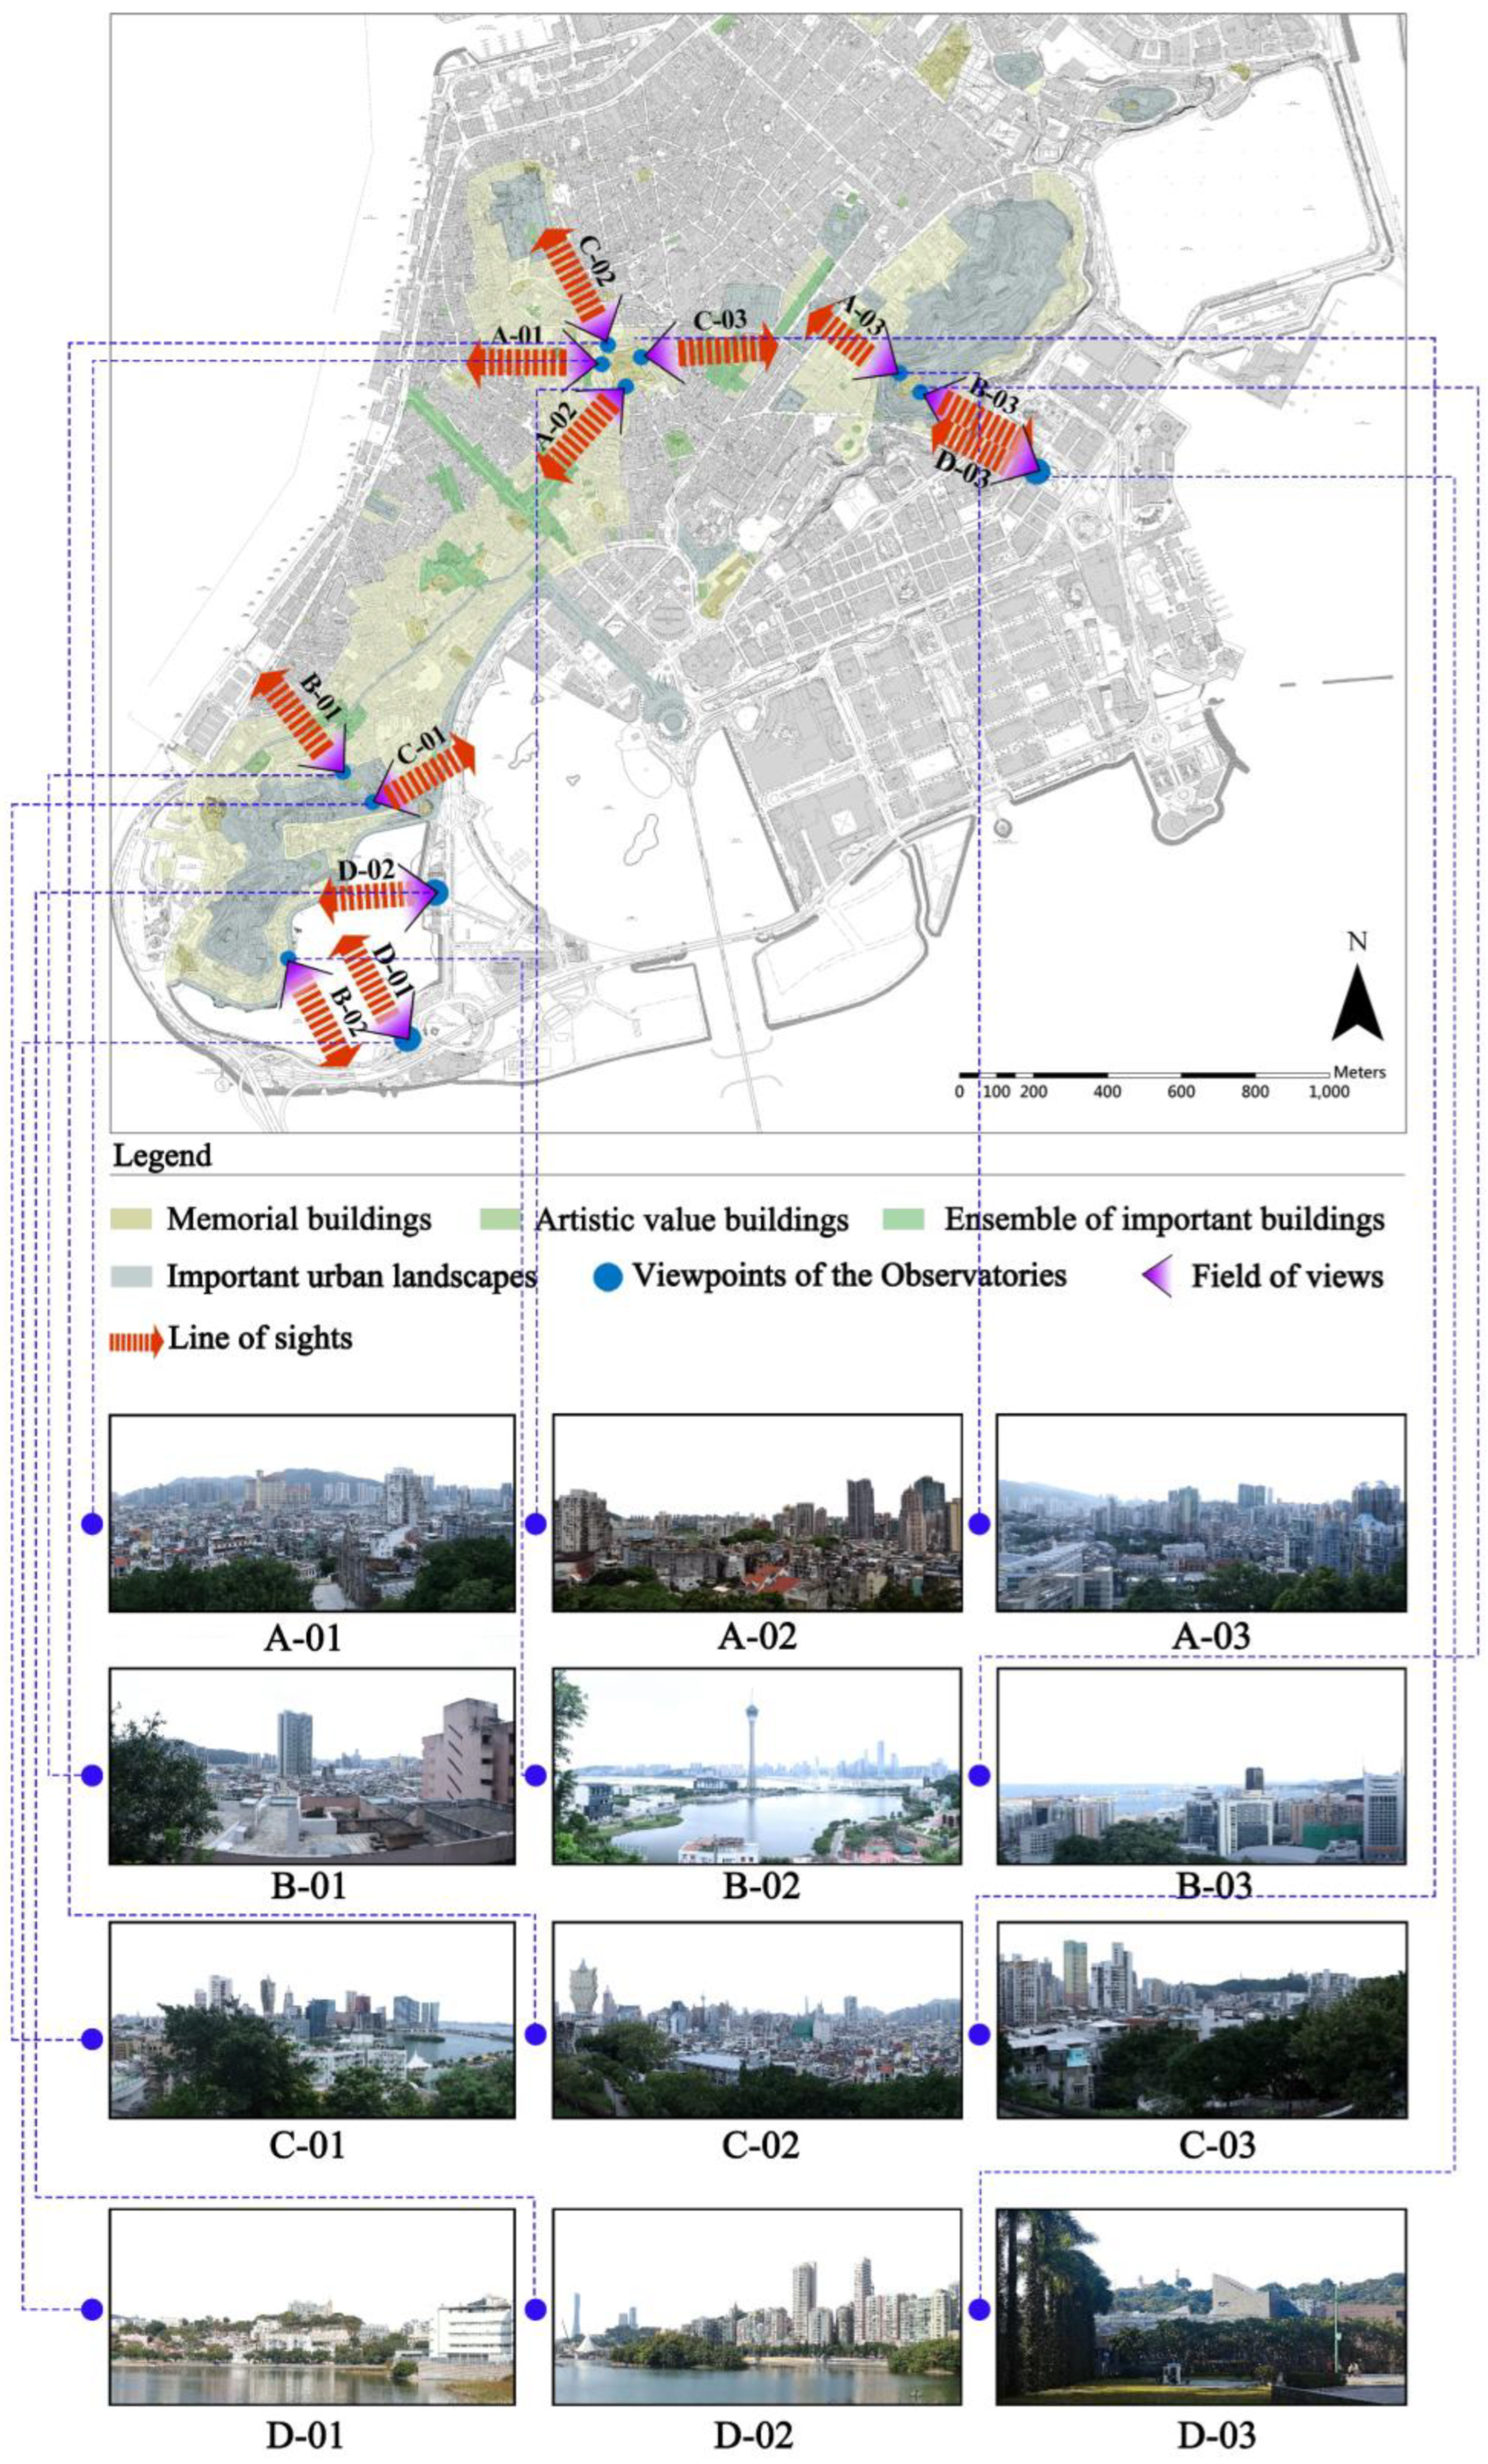
Figure 4.
Step-by-step diagram of the eye-tracking experiment.
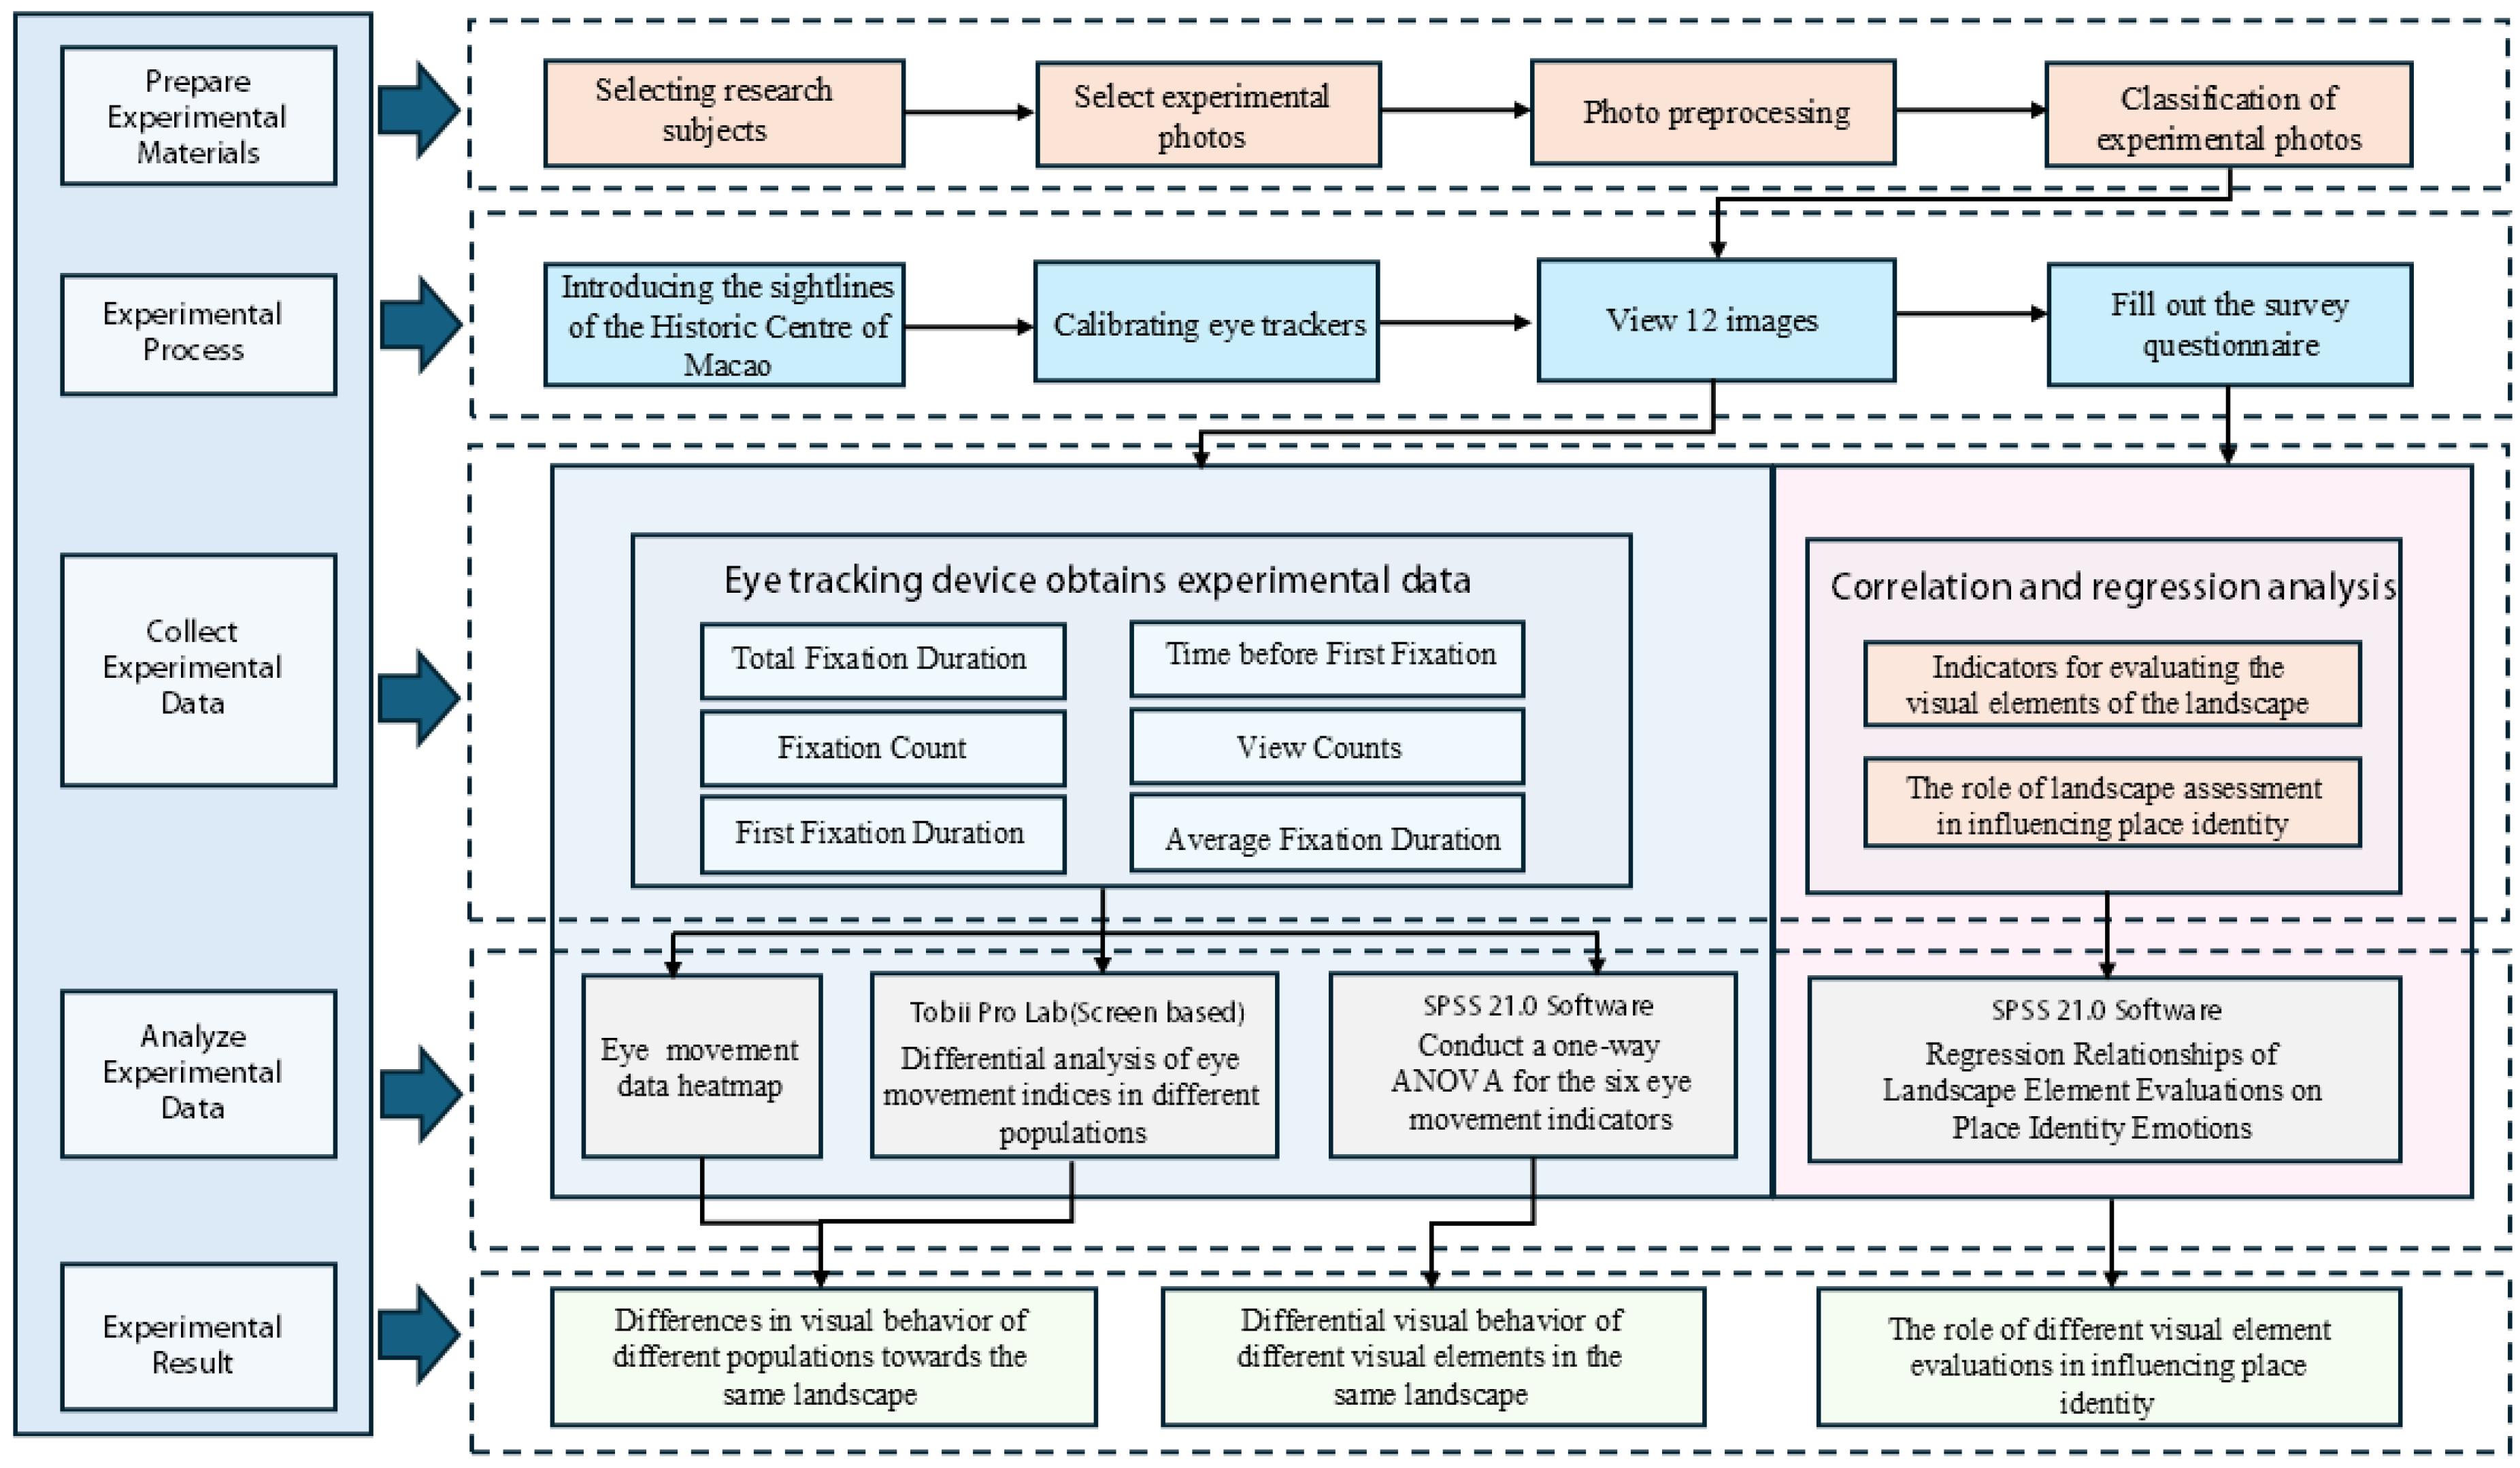
Figure 5.
AOIs images.
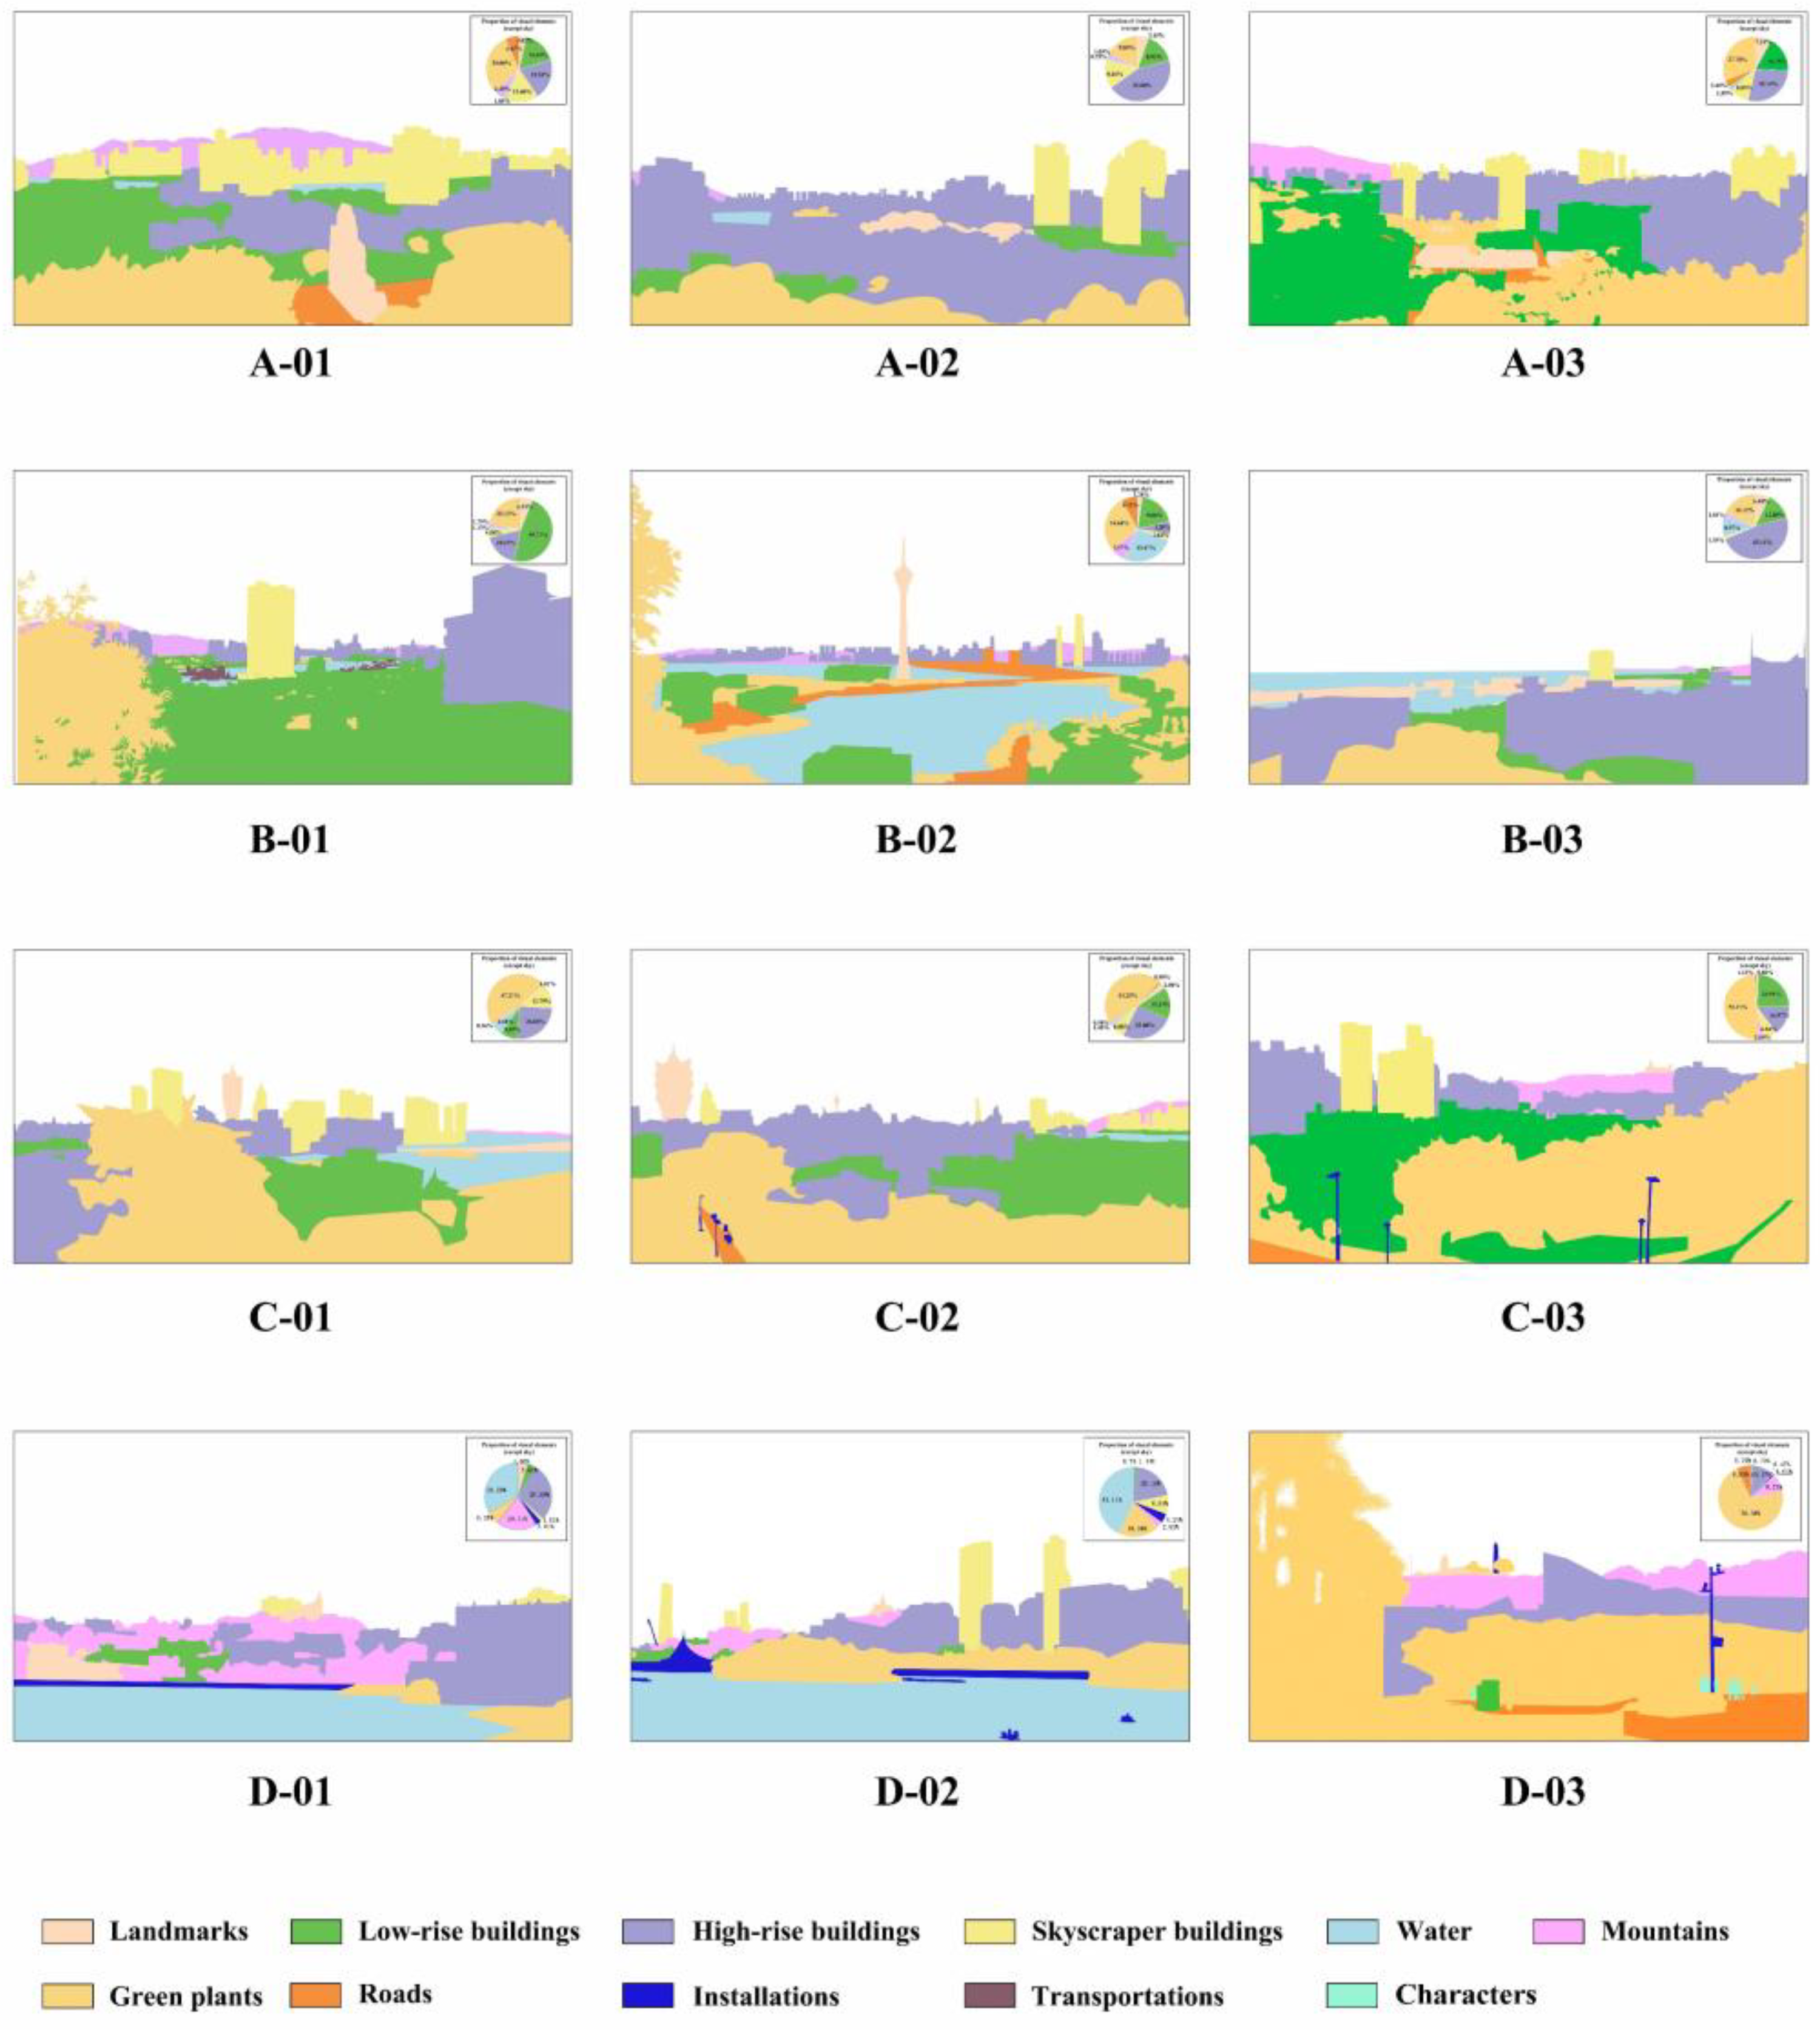
Figure 6.
Viewers’ visual behavior data for different landscape architecture elements.
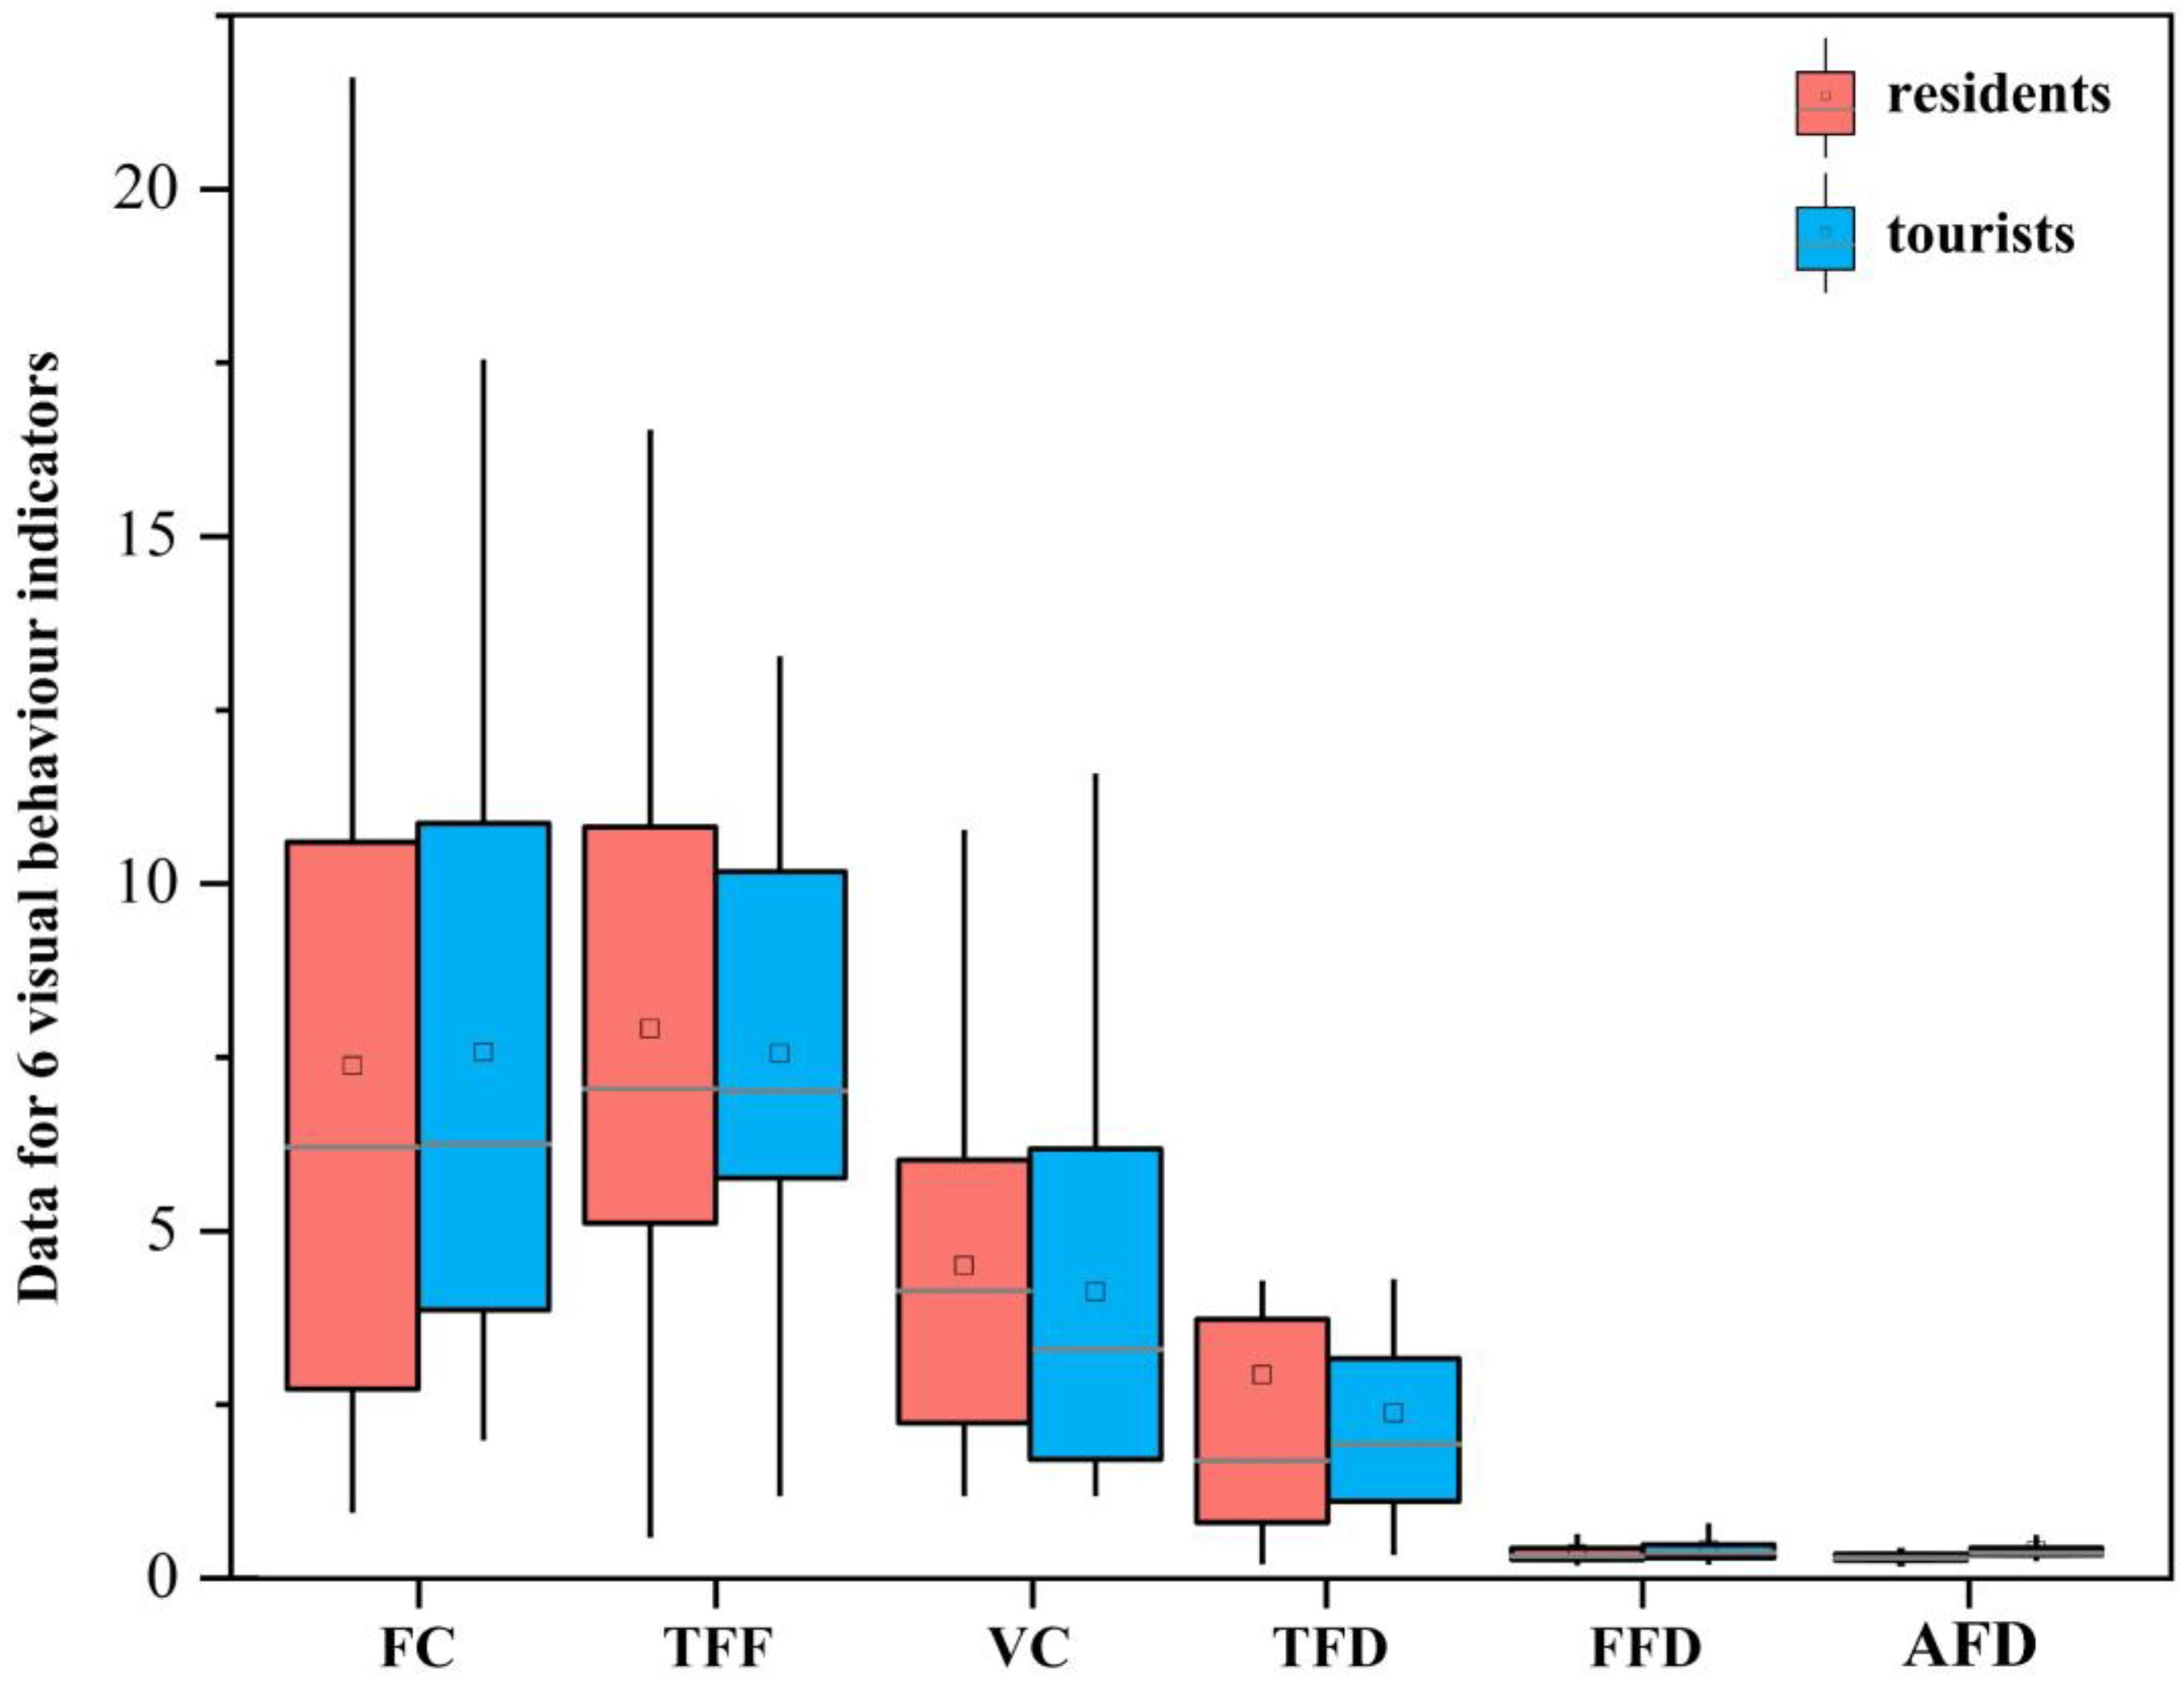
Figure 7.
Viewers’ visual behavior data for different landscape architecture elements. (** Represents p < 0.01, which is significantly correlated at the 0.01 level. * Represents p < 0.05, which is significantly correlated at the 0.05 level.).
Figure 7.
Viewers’ visual behavior data for different landscape architecture elements. (** Represents p < 0.01, which is significantly correlated at the 0.01 level. * Represents p < 0.05, which is significantly correlated at the 0.05 level.).
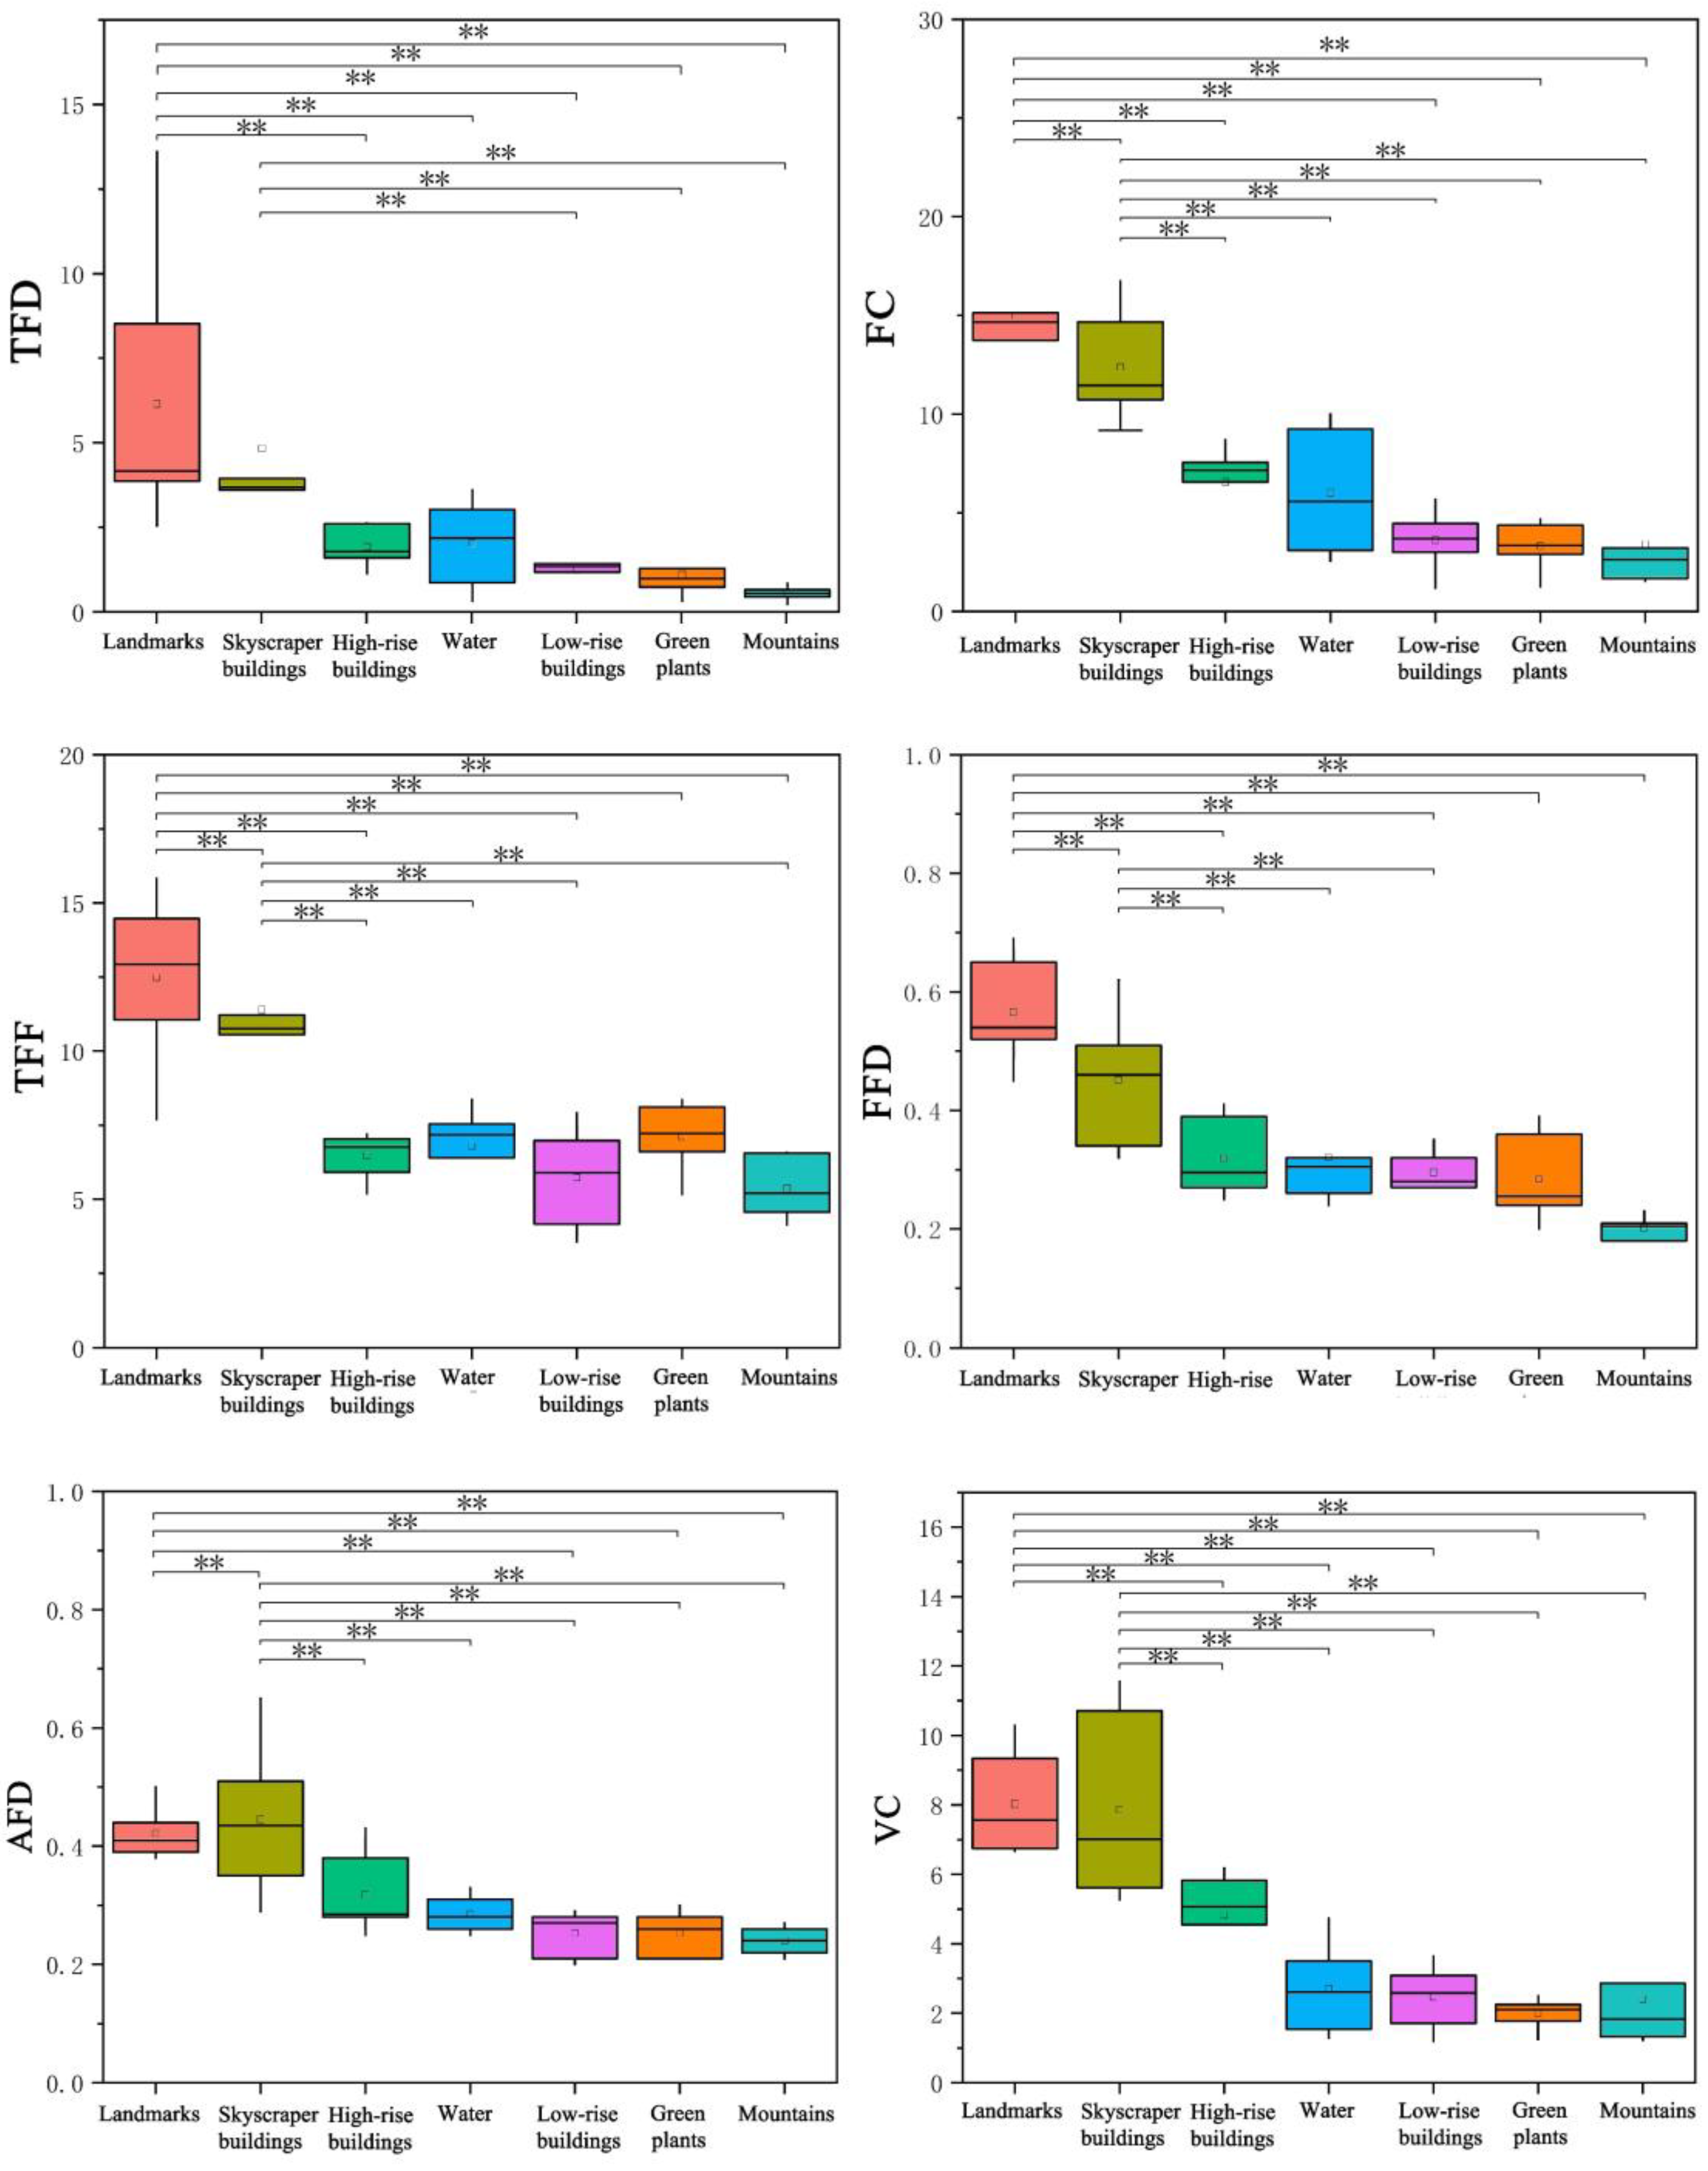
Figure 8.
Viewers recognized the psychometric results at the scene of the view. (** Represents p < 0.01, which is significantly correlated at the 0.01 level. * Represents p < 0.05, which is significantly correlated at the 0.05 level.).
Figure 8.
Viewers recognized the psychometric results at the scene of the view. (** Represents p < 0.01, which is significantly correlated at the 0.01 level. * Represents p < 0.05, which is significantly correlated at the 0.05 level.).
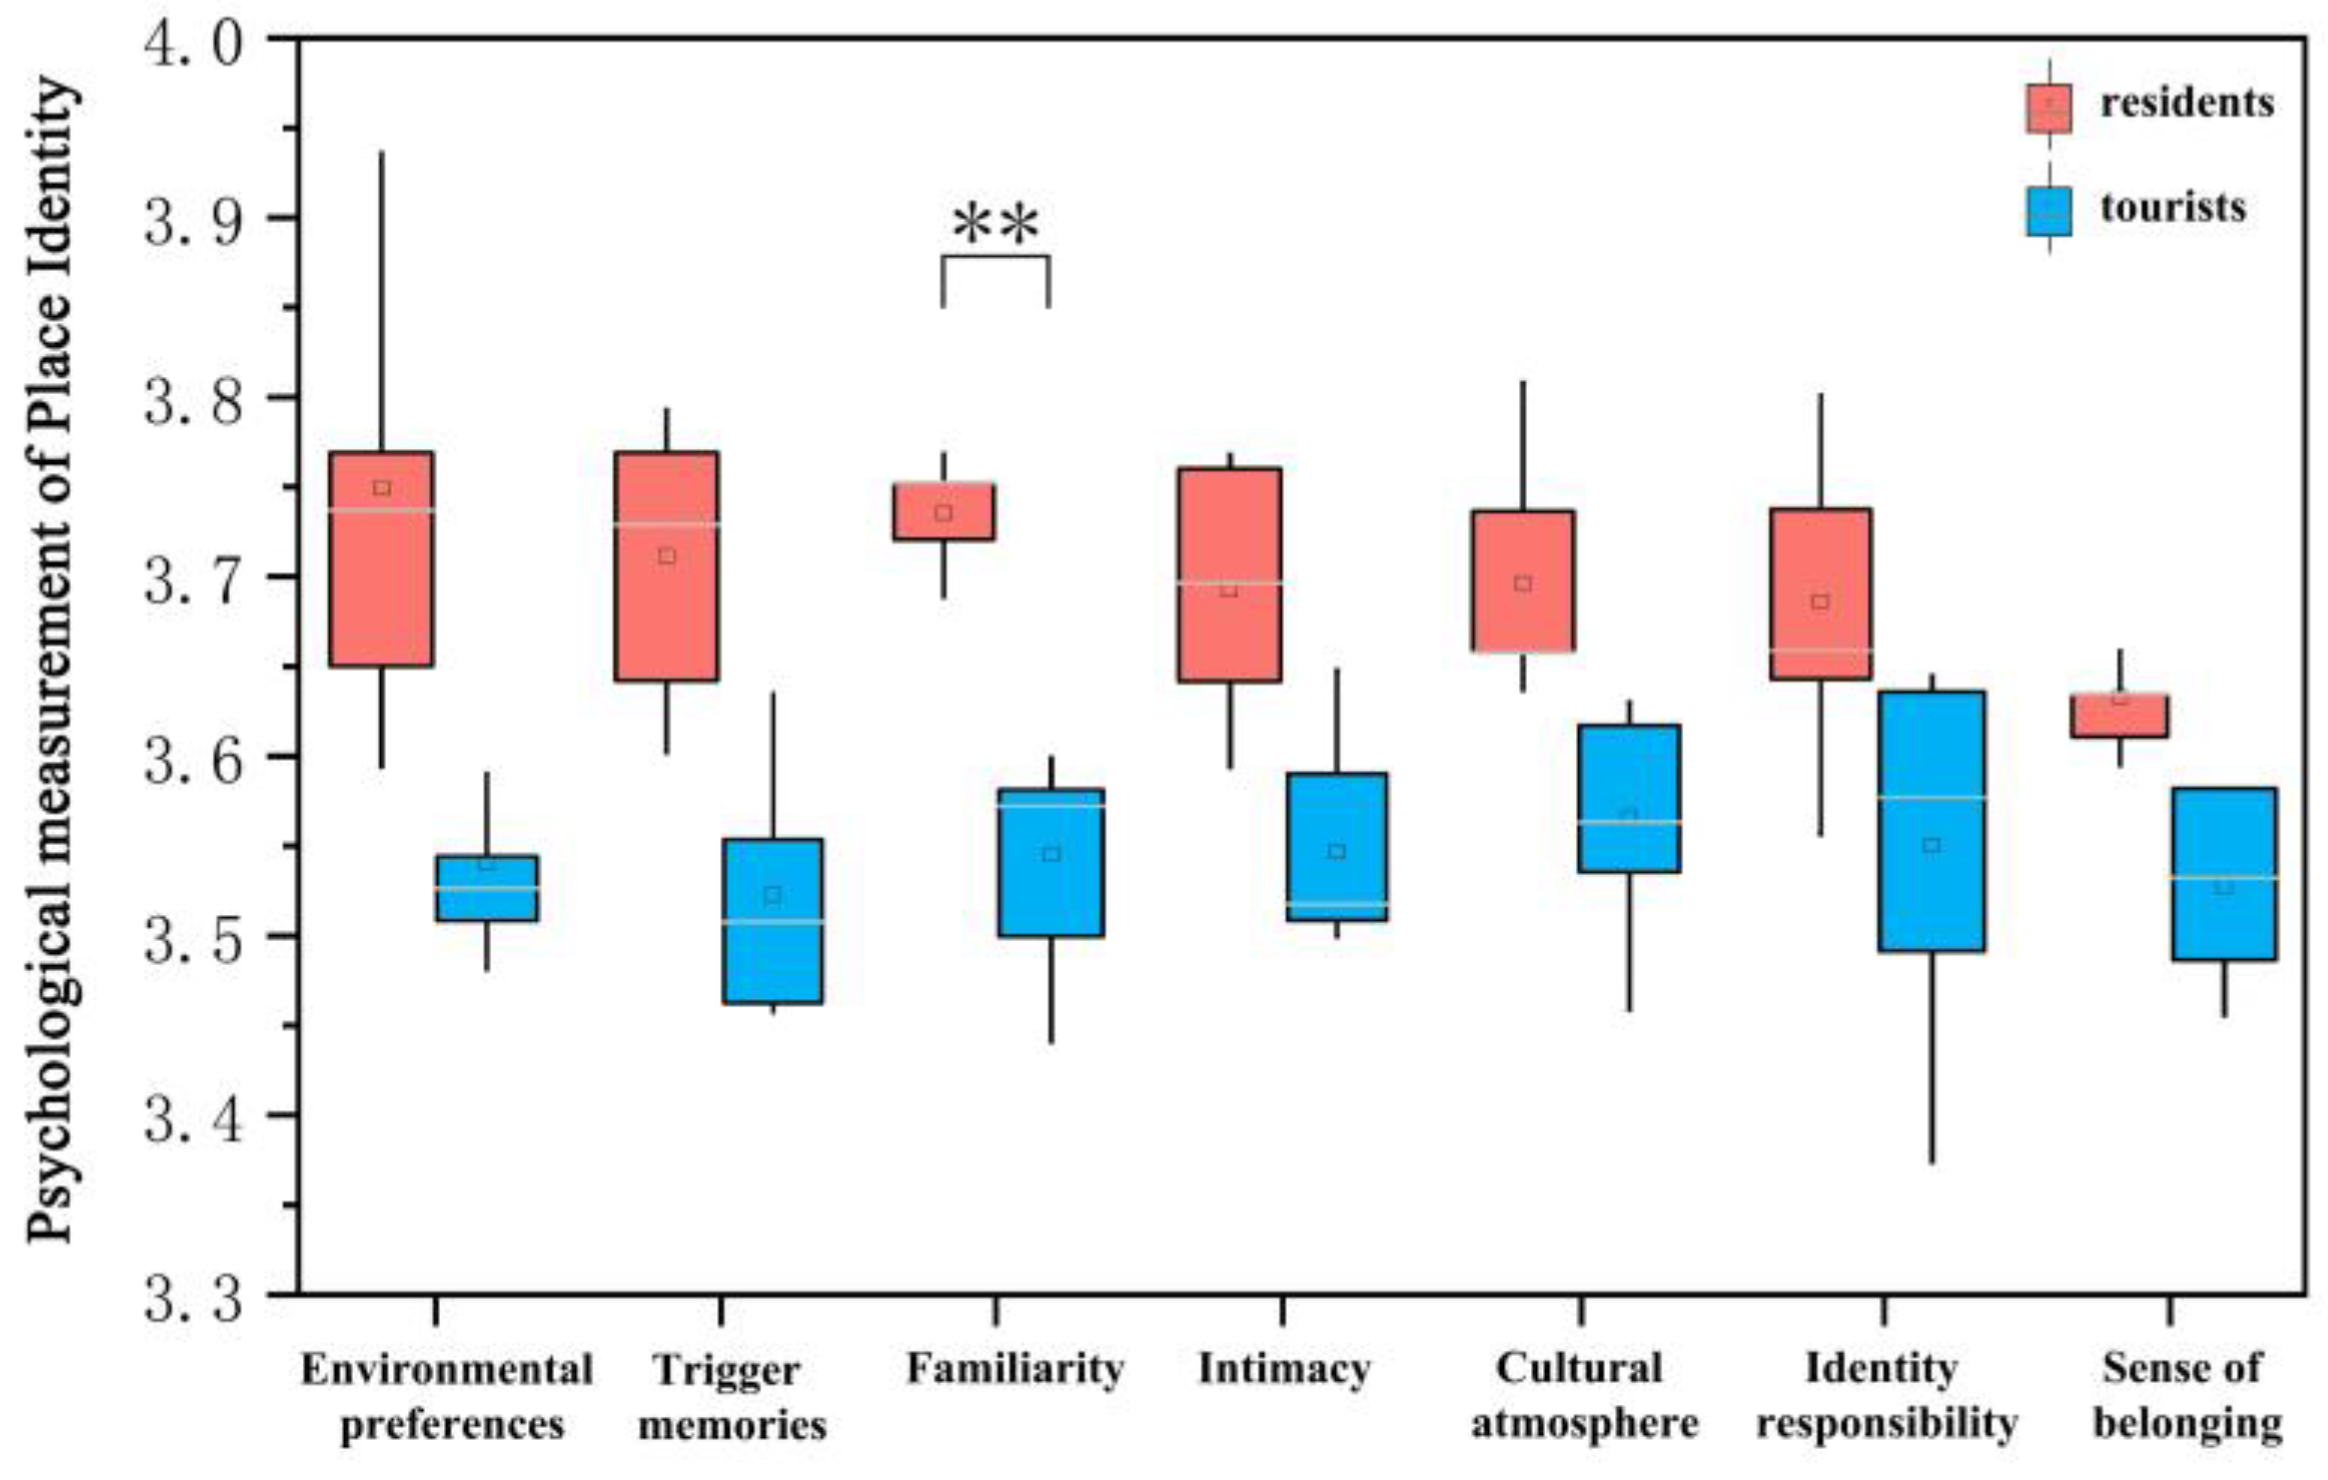
Figure 9.
Biased correlation analysis of aesthetic evaluation of visual elements and place identity. (** Represents p < 0.01, which is significantly correlated at the 0.01 level. * Represents p < 0.05, which is significantly correlated at the 0.05 level.).
Figure 9.
Biased correlation analysis of aesthetic evaluation of visual elements and place identity. (** Represents p < 0.01, which is significantly correlated at the 0.01 level. * Represents p < 0.05, which is significantly correlated at the 0.05 level.).
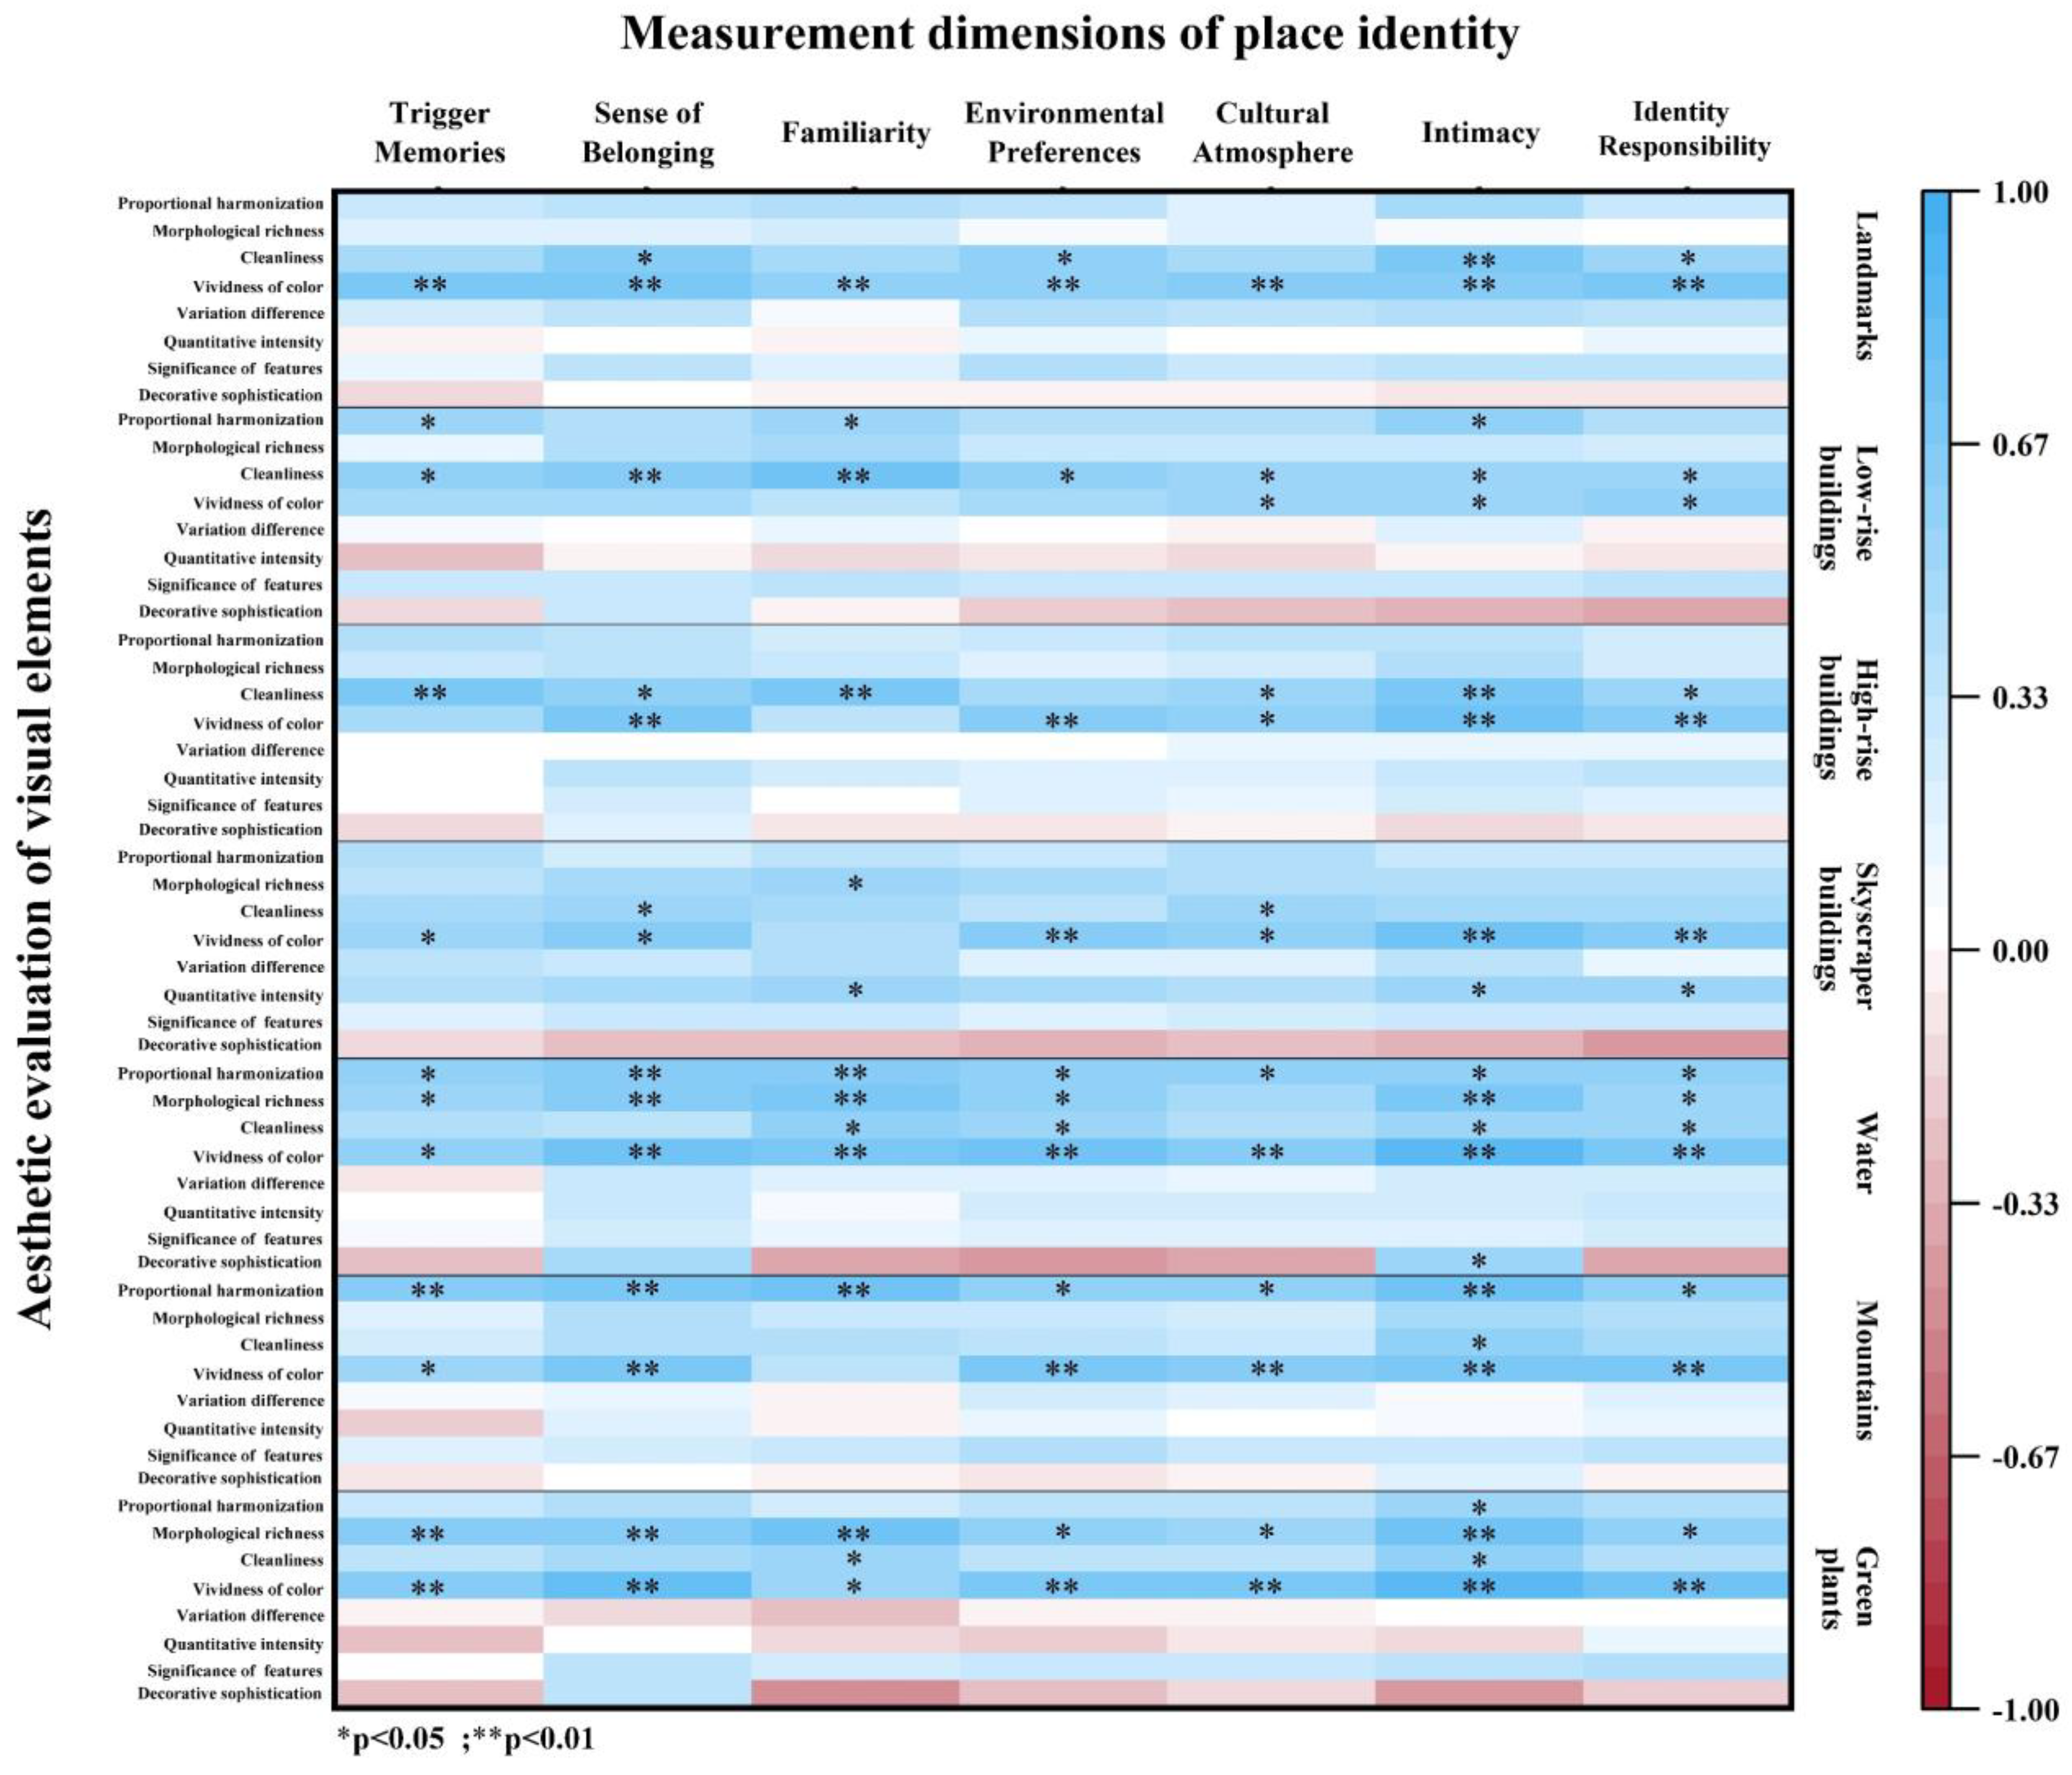
Figure 10.
Comparison of the Guia Lighthouse in 1950 looking towards the Outer Harbour. (Image taken from 1950 “Macao in 19th–20th Century Postcards”).
Figure 10.
Comparison of the Guia Lighthouse in 1950 looking towards the Outer Harbour. (Image taken from 1950 “Macao in 19th–20th Century Postcards”).
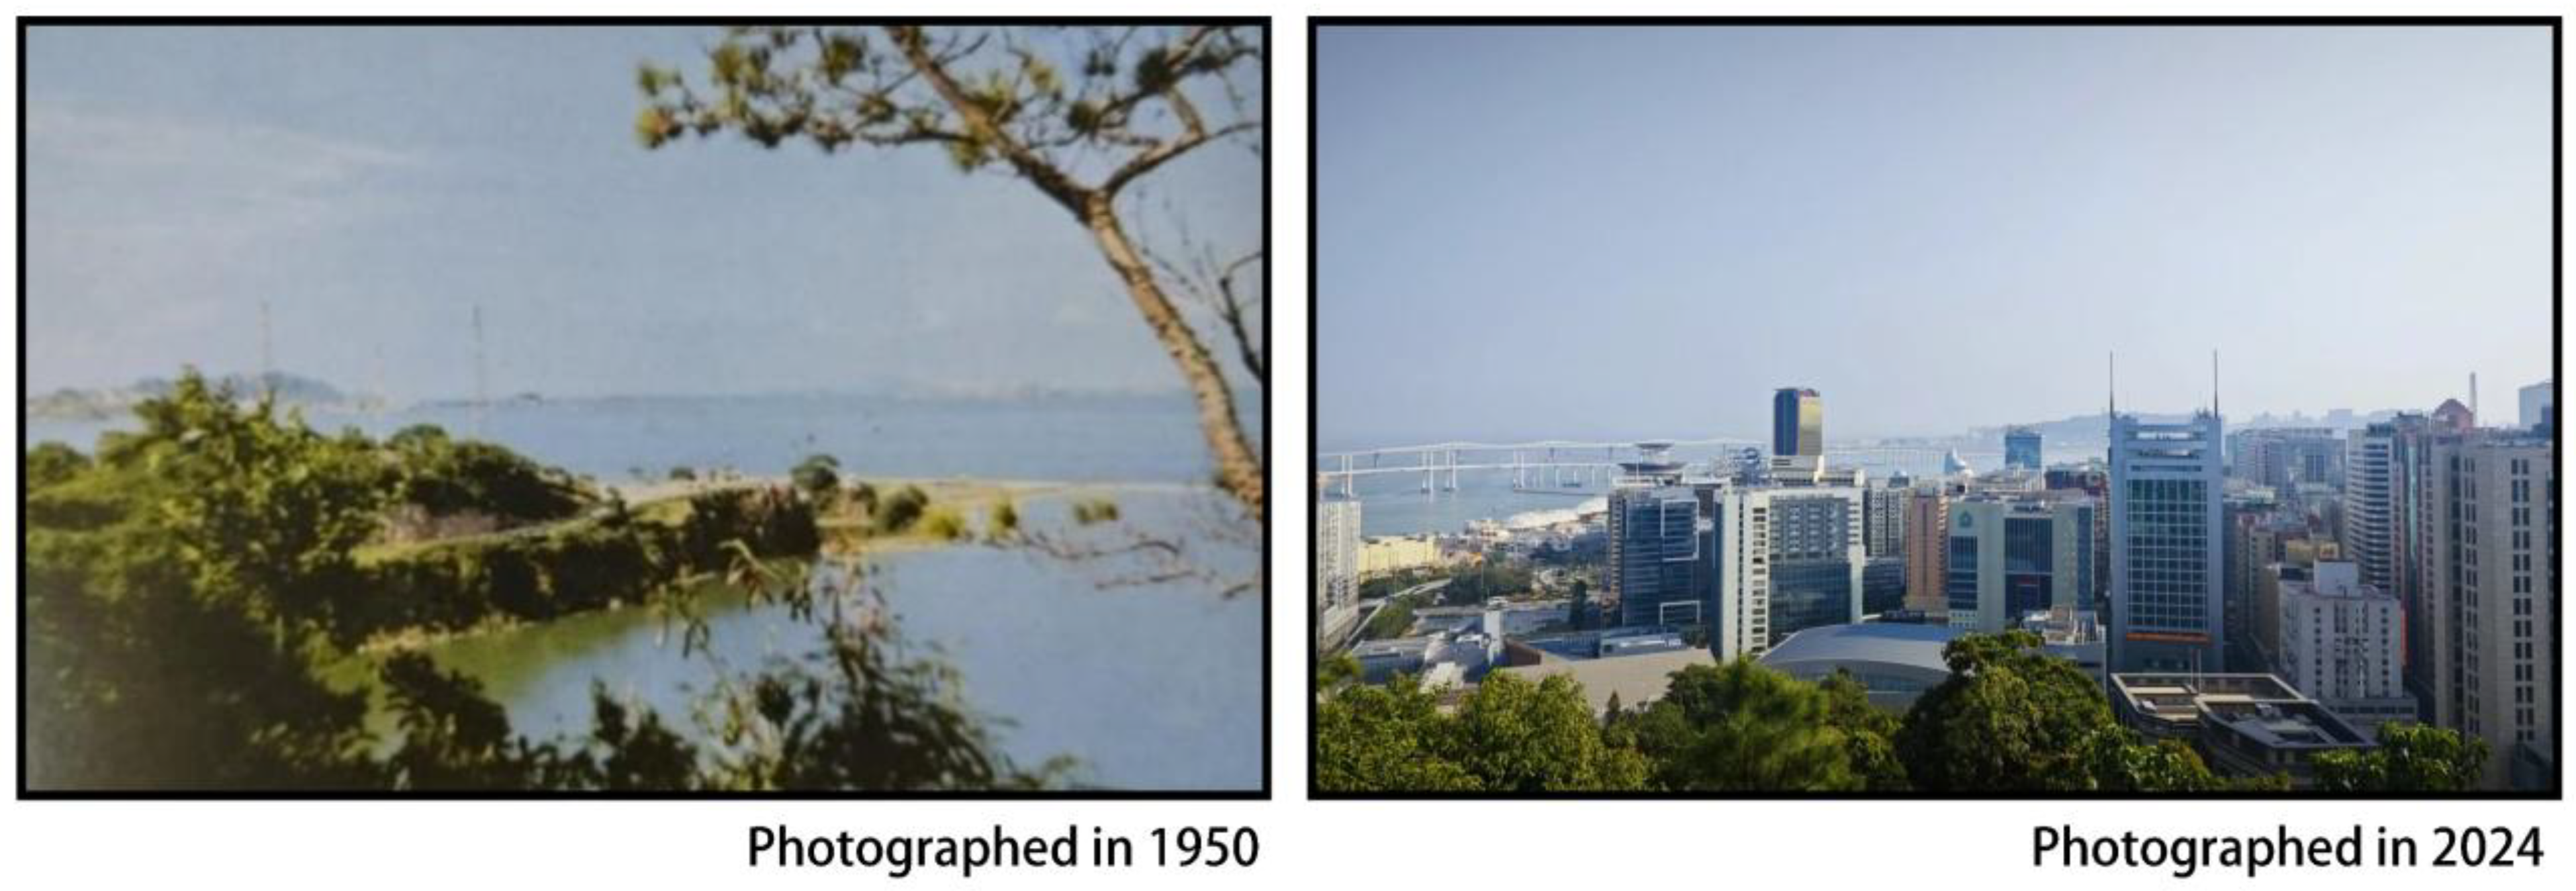

Table 1.
The viewpoint and main visual elements seen from the observation decks in Macao.
| Theme and Quantity | No. | Sight Direction | Viewing Objects | The Main Visual Elements of the Environment |
|---|---|---|---|---|
| A. Landscapes of architectural heritage and sites in the historic district | A-01 | From the Fortress to the Ruins of St. Paul’s | Architectural heritages | Landmarks, low-rise buildings, high-rise buildings, skyscraper buildings, green plants, water, mountains, roads, etc. |
| A-02 | From Fortress to White Pigeon Nest Park | Urban greenings | Landmarks, low-rise buildings, high-rise buildings, skyscraper buildings, green plants, water, mountains, etc. | |
| A-03 | From Guia Fort and Lighthouse to Tap Seac Square | Architectural heritages | Landmarks, low-rise buildings, high-rise buildings, skyscraper buildings, green plants, water, mountains, roads, etc. | |
| B. Landscapes of the inner harbour, outer harbour and water systems | B-01 | From Bishop’s Hill Observation Deck to the Inner Harbor Waterway | The inner harbor | Landmarks, low-rise buildings, high-rise buildings, skyscraper buildings, green plants, water, mountains, etc. |
| B-02 | From Bishop’s Hill Church to Sai Van Lake | Sai van lake | Landmarks, low-rise buildings, high-rise buildings, skyscraper buildings, green plants, water, mountains, roads, bridge, etc. | |
| B-03 | From Guia Fort and Lighthouse to the Outer Harbor | The outer harbor | Landmarks, high-rise buildings, skyscraper buildings, green plants, water, mountains, roads, bridge, etc. | |
| C. Landscapes of the historic district style and urban skyline | C-01 | From Guiyang Mountain to Nam Van Lake | The city district and skyline | Landmarks, low-rise buildings, high-rise buildings, skyscraper buildings, green plants, water, mountains, roads, etc. |
| C-02 | From Fortress to Inner Harbor City | The cityscape of port area | Landmarks, low-rise buildings, high-rise buildings, skyscraper buildings, green plants, water, etc. | |
| C-03 | From Main Fortress to Guia Fortress | The landscapes between urban highlands | Landmarks, low-rise buildings, high-rise buildings, skyscraper buildings, green plants, etc. | |
| D. Landscapes of high point landmark heritage in the historic district | D-01 | From the Nam Van Lake to the direction of the Church of Our Lady of Penha | The Church of Our Lady of Penha | Landmark buildings, low-rise buildings, high-rise buildings, skyscraper buildings, green plants, mountains, water, etc. |
| D-02 | From the Sai Van Lake to the direction of the Church of Our Lady of Penha | The Church of Our Lady of Penha | Landmark buildings, low-rise buildings, high-rise buildings, skyscraper buildings, green plants, mountains, water, etc. | |
| D-03 | From the Lotus Square to the direction of the Guia Lighthouse | Guia Fort and Lighthouse | Landmark buildings, low-rise buildings, high-rise buildings, roads, green plants, mountains, etc. |
Table 2.
Eye-tracking heat distribution of different types of viewing platform viewing landscape images.
Table 2.
Eye-tracking heat distribution of different types of viewing platform viewing landscape images.
| NO. | A-01 | A-02 | A-03 | ||||||||||||||||||||
|---|---|---|---|---|---|---|---|---|---|---|---|---|---|---|---|---|---|---|---|---|---|---|---|
| Residents eye tracking experiment heat map | 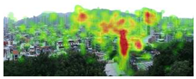 |
 |
 |
||||||||||||||||||||
| Tourists eye tracking experiment heat map | 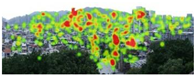 |
 |
 |
||||||||||||||||||||
| Hot spots correspond to visual features | landmarks | ● | mountains | ◎ | landmarks | ╳ | mountains | ● | landmarks | ● | mountains | ◎ | |||||||||||
| low-rise buildings | ◎ | water | ● | low-rise buildings | ● | water | ╳ | low-rise buildings | ◎ | water | ○ | ||||||||||||
| high-rise buildings | ● | green plants | ○ | high-rise buildings | ● | green plants | ◎ | high-rise buildings | ◎ | green plants | ◎ | ||||||||||||
| skyscraper buildings | ● | roads | ○ | skyscraper buildings | ● | roads | ╳ | skyscraper buildings | ● | roads | ○ | ||||||||||||
| NO. | B-01 | B-02 | B-03 | ||||||||||||||||||||
| Residents eye tracking experiment heat map | 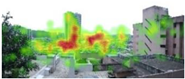 |
 |
 |
||||||||||||||||||||
| Tourists eye tracking experiment heat map | 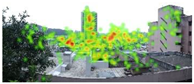 |
 |
 |
||||||||||||||||||||
| Hot spots correspond to visual features | landmarks | ╳ | mountains | ◎ | landmarks | ● | mountains | ○ | landmarks | ╳ | mountains | ○ | |||||||||||
| low-rise buildings | ◎ | water | ● | low-rise buildings | ● | water | ● | low-rise buildings | ○ | water | ● | ||||||||||||
| high-rise buildings | ● | green plants | ◎ | high-rise buildings | ◎ | green plants | ◎ | high-rise buildings | ● | green plants | ◎ | ||||||||||||
| skyscraper buildings | ● | roads | ╳ | skyscraper buildings | ● | roads | ○ | skyscraper buildings | ● | roads | ● | ||||||||||||
| NO. | C-01 | C-02 | C-03 | ||||||||||||||||||||
| Residents eye tracking experiment heat map | 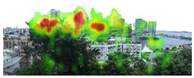 |
 |
 |
||||||||||||||||||||
| Tourists eye tracking experiment heat map | 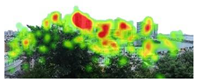 |
 |
 |
||||||||||||||||||||
| Hot spots correspond to visual features | landmarks | ● | mountains | ○ | landmarks | ● | mountains | ○ | landmarks | ● | mountains | ○ | |||||||||||
| low-rise buildings | ◎ | water | ● | low-rise buildings | ● | water | ○ | low-rise buildings | ● | water | ╳ | ||||||||||||
| high-rise buildings | ● | green plants | ◎ | high-rise buildings | ◎ | green plants | ○ | high-rise buildings | ◎ | green plants | ◎ | ||||||||||||
| skyscraper buildings | ● | roads | ○ | skyscraper buildings | ● | roads | ○ | skyscraper buildings | ● | roads | ╳ | ||||||||||||
| NO. | D-01 | D-02 | D-03 | ||||||||||||||||||||
| Residents eye tracking experiment heat map | 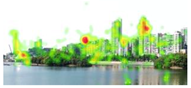 |
 |
 |
||||||||||||||||||||
| Tourists eye tracking experiment heat map | 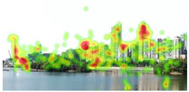 |
 |
 |
||||||||||||||||||||
| Hot spots correspond to visual features | landmarks | ● | mountains | ● | landmarks | ● | mountains | ● | landmarks | ● | mountains | ● | |||||||||||
| low-rise buildings | ◎ | water | ● | low-rise buildings | ● | water | ◎ | low-rise buildings | ╳ | water | ╳ | ||||||||||||
| high-rise buildings | ● | green plants | ◎ | high-rise buildings | ◎ | green plants | ◎ | high-rise buildings | ● | green plants | ● | ||||||||||||
| skyscraper buildings | ● | roads | ╳ | skyscraper buildings | ● | roads | ╳ | skyscraper buildings | ╳ | roads | ○ | ||||||||||||
● This element is of significant concern. ◎ This element has attention, but is not significant. ○ The image has this element but does not receive attention. ╳ indicates that the feature does not appear in the image.
Table 3.
Multiple linear regression model data table.
| Y | X | Non-Normalized | Standard Coefficient |
t | p-Value | |||
|---|---|---|---|---|---|---|---|---|
| B | Standard Error | Beta | ||||||
| Place identity | (constant) | −3.10 | 0.159 | 20.401 | 0.009 | |||
| landmarks | vividness of color | X1 | 0.573 | 0.037 | 0.425 | 15.663 | 0.000 | |
| high-rise buildings | vividness of color | X2 | 0.316 | 0.025 | 0.271 | 12.608 | 0.000 | |
| skyscraper buildings | vividness of color | X3 | 0.515 | 0.040 | 0.391 | 12.750 | 0.000 | |
| water | proportional harmonization | X4 | 0.169 | 0.028 | 0.162 | 5.991 | 0.001 | |
| vividness of color | X5 | 0.617 | 0.036 | 0.470 | 17.340 | 0.000 | ||
| mountains | proportional harmonization | X6 | 0.223 | 0.029 | 0.245 | 7.806 | 0.000 | |
| vividness of color | X7 | 0.799 | 0.024 | 0.628 | 33.048 | 0.000 | ||
| green plants | morphological richness | X8 | 0.094 | 0.024 | 0.100 | 4.010 | 0.007 | |
| vividness of color | X9 | 1.021 | 0.028 | 0.978 | 37.009 | 0.000 | ||
Disclaimer/Publisher’s Note: The statements, opinions and data contained in all publications are solely those of the individual author(s) and contributor(s) and not of MDPI and/or the editor(s). MDPI and/or the editor(s) disclaim responsibility for any injury to people or property resulting from any ideas, methods, instructions or products referred to in the content. |
© 2025 by the authors. Licensee MDPI, Basel, Switzerland. This article is an open access article distributed under the terms and conditions of the Creative Commons Attribution (CC BY) license (http://creativecommons.org/licenses/by/4.0/).
Copyright: This open access article is published under a Creative Commons CC BY 4.0 license, which permit the free download, distribution, and reuse, provided that the author and preprint are cited in any reuse.


