1. Introduction
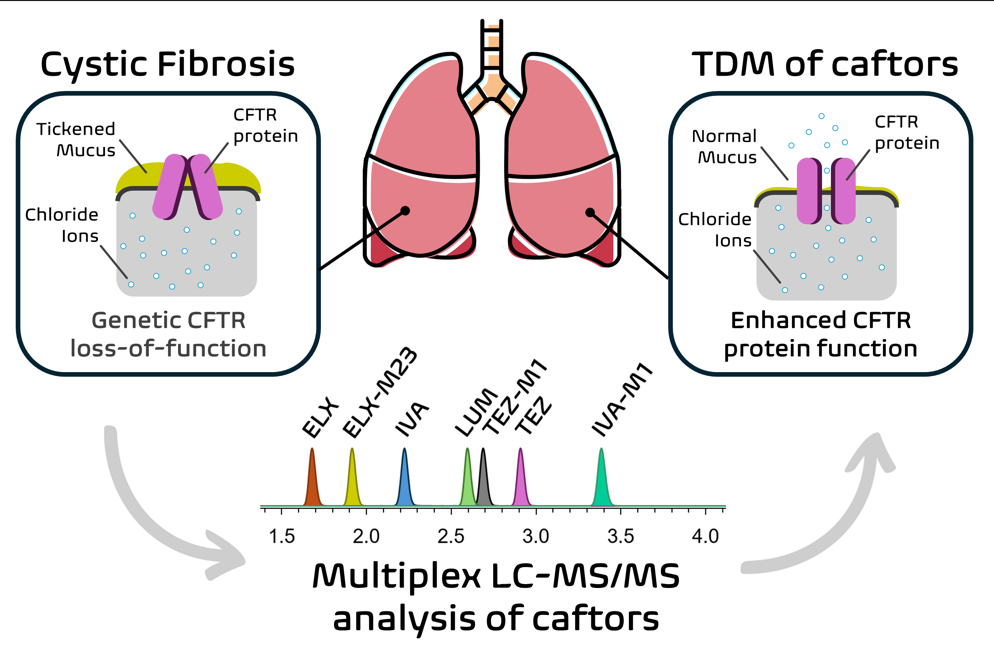
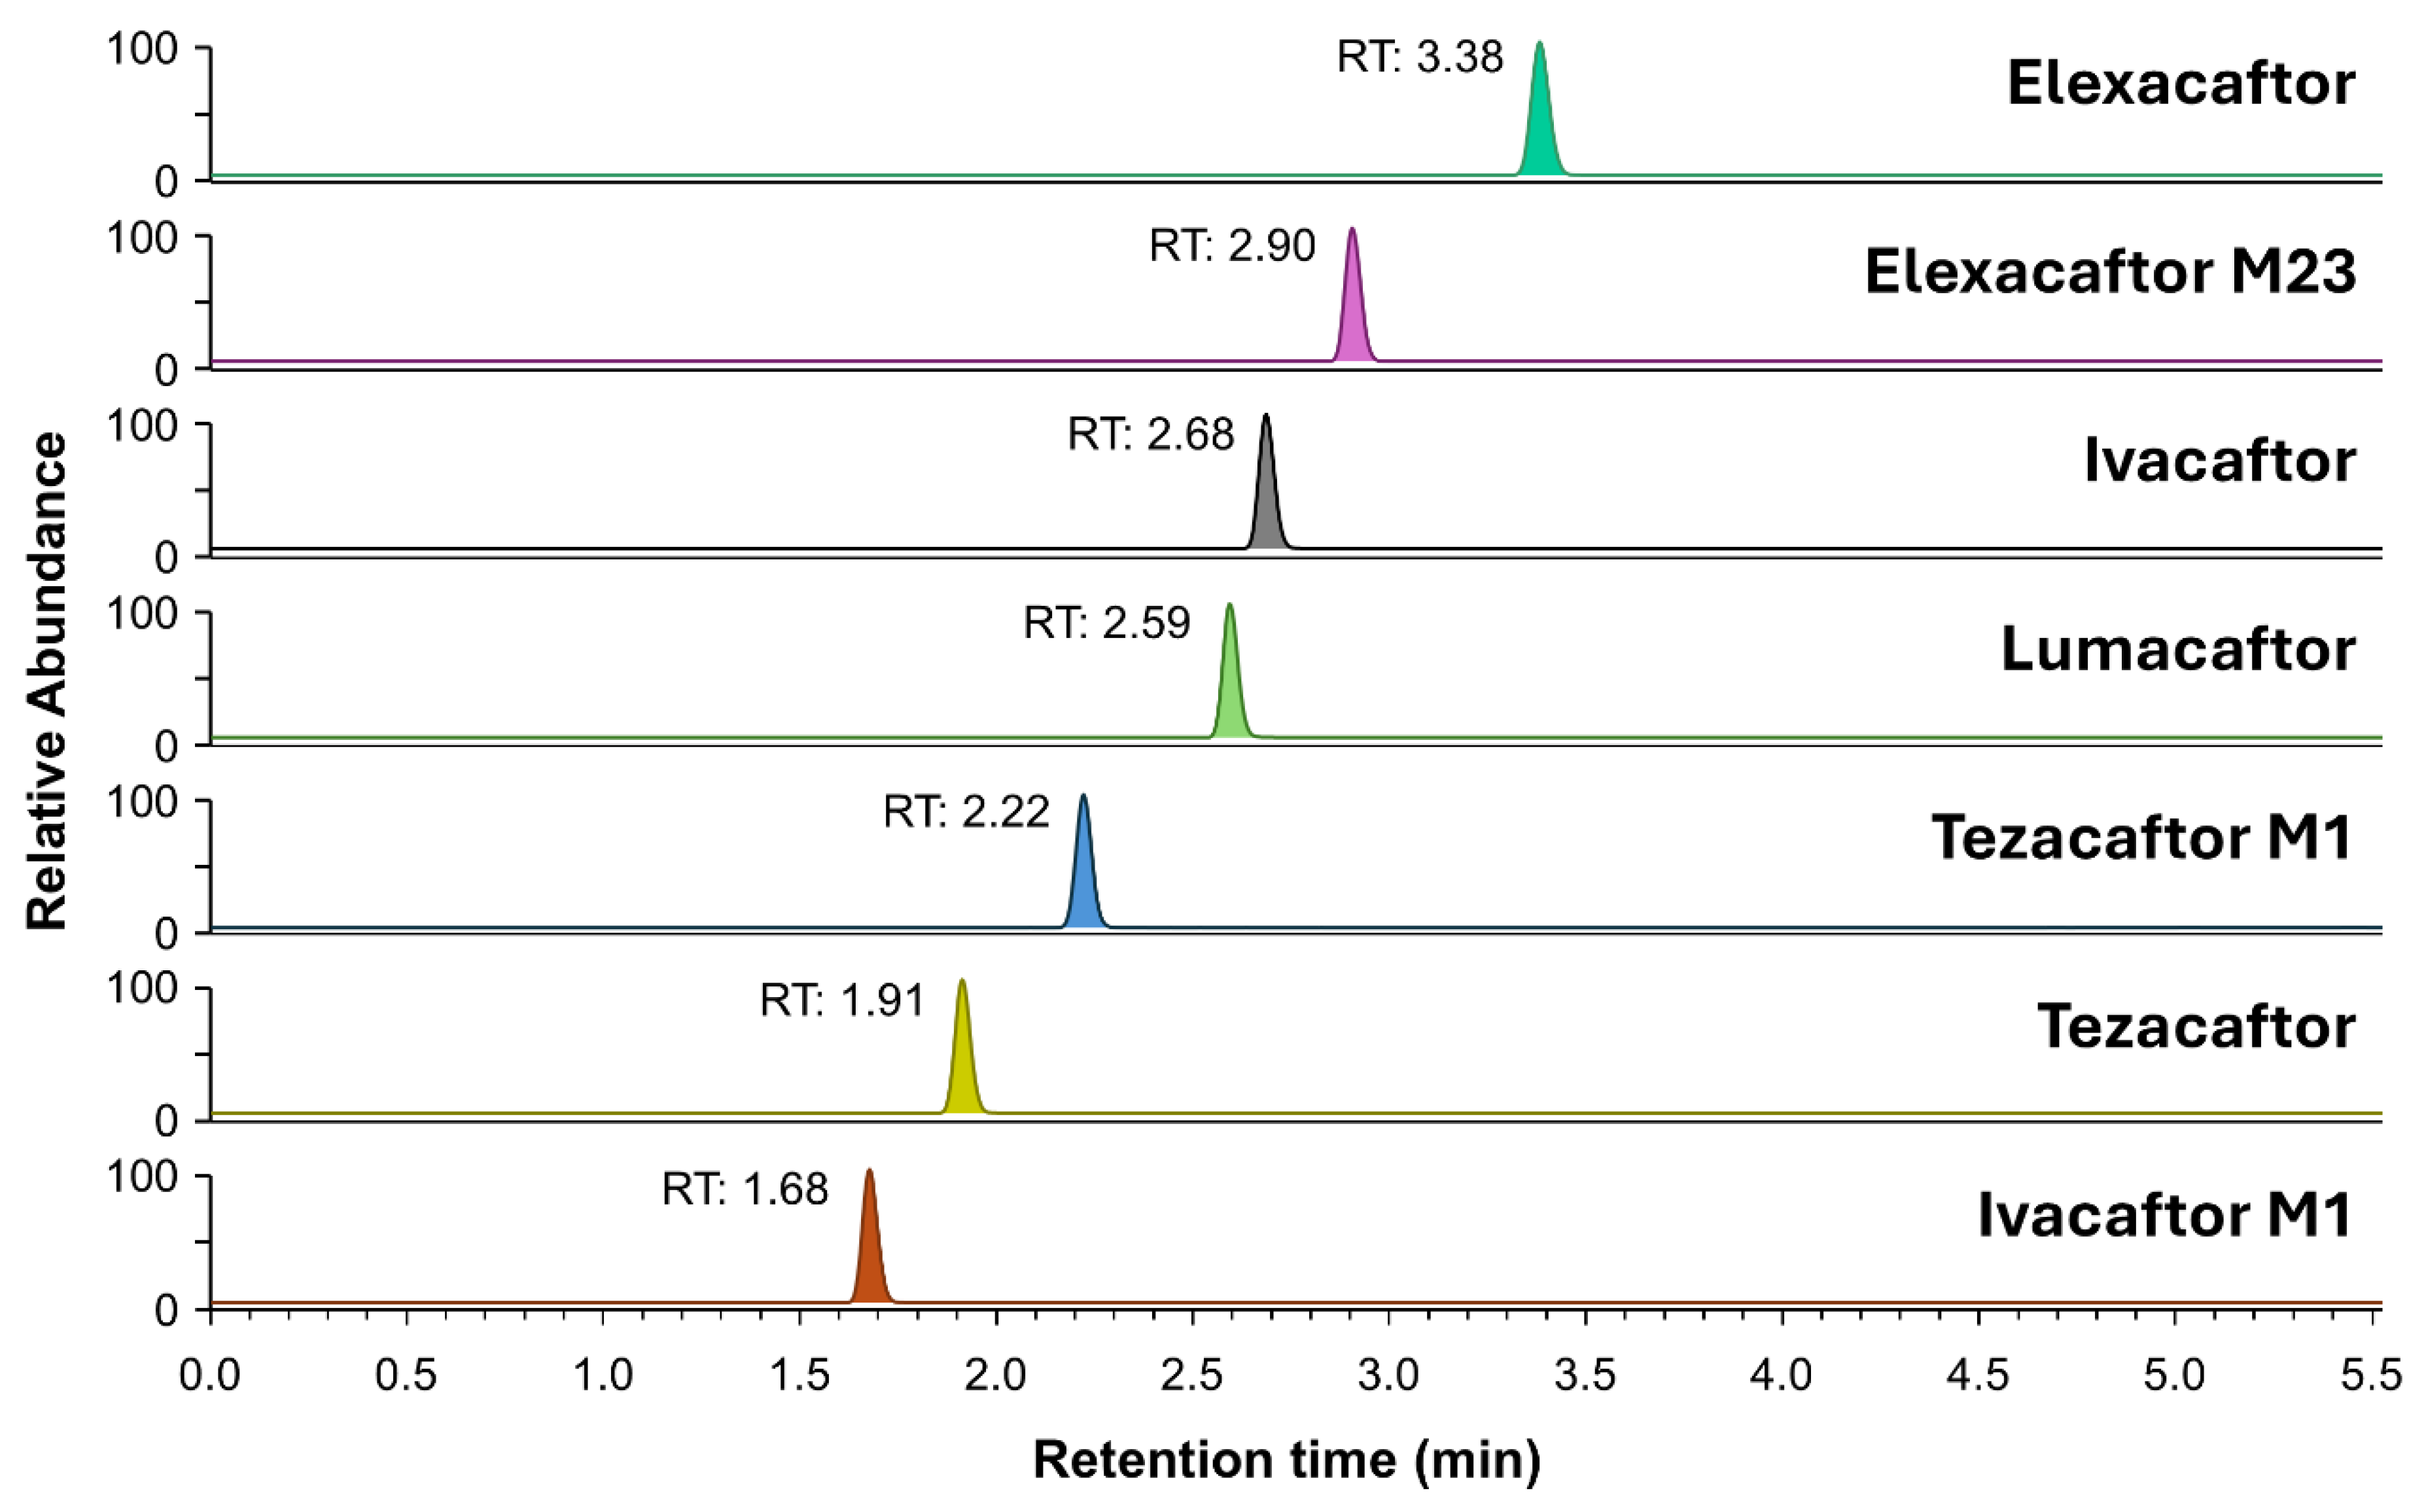
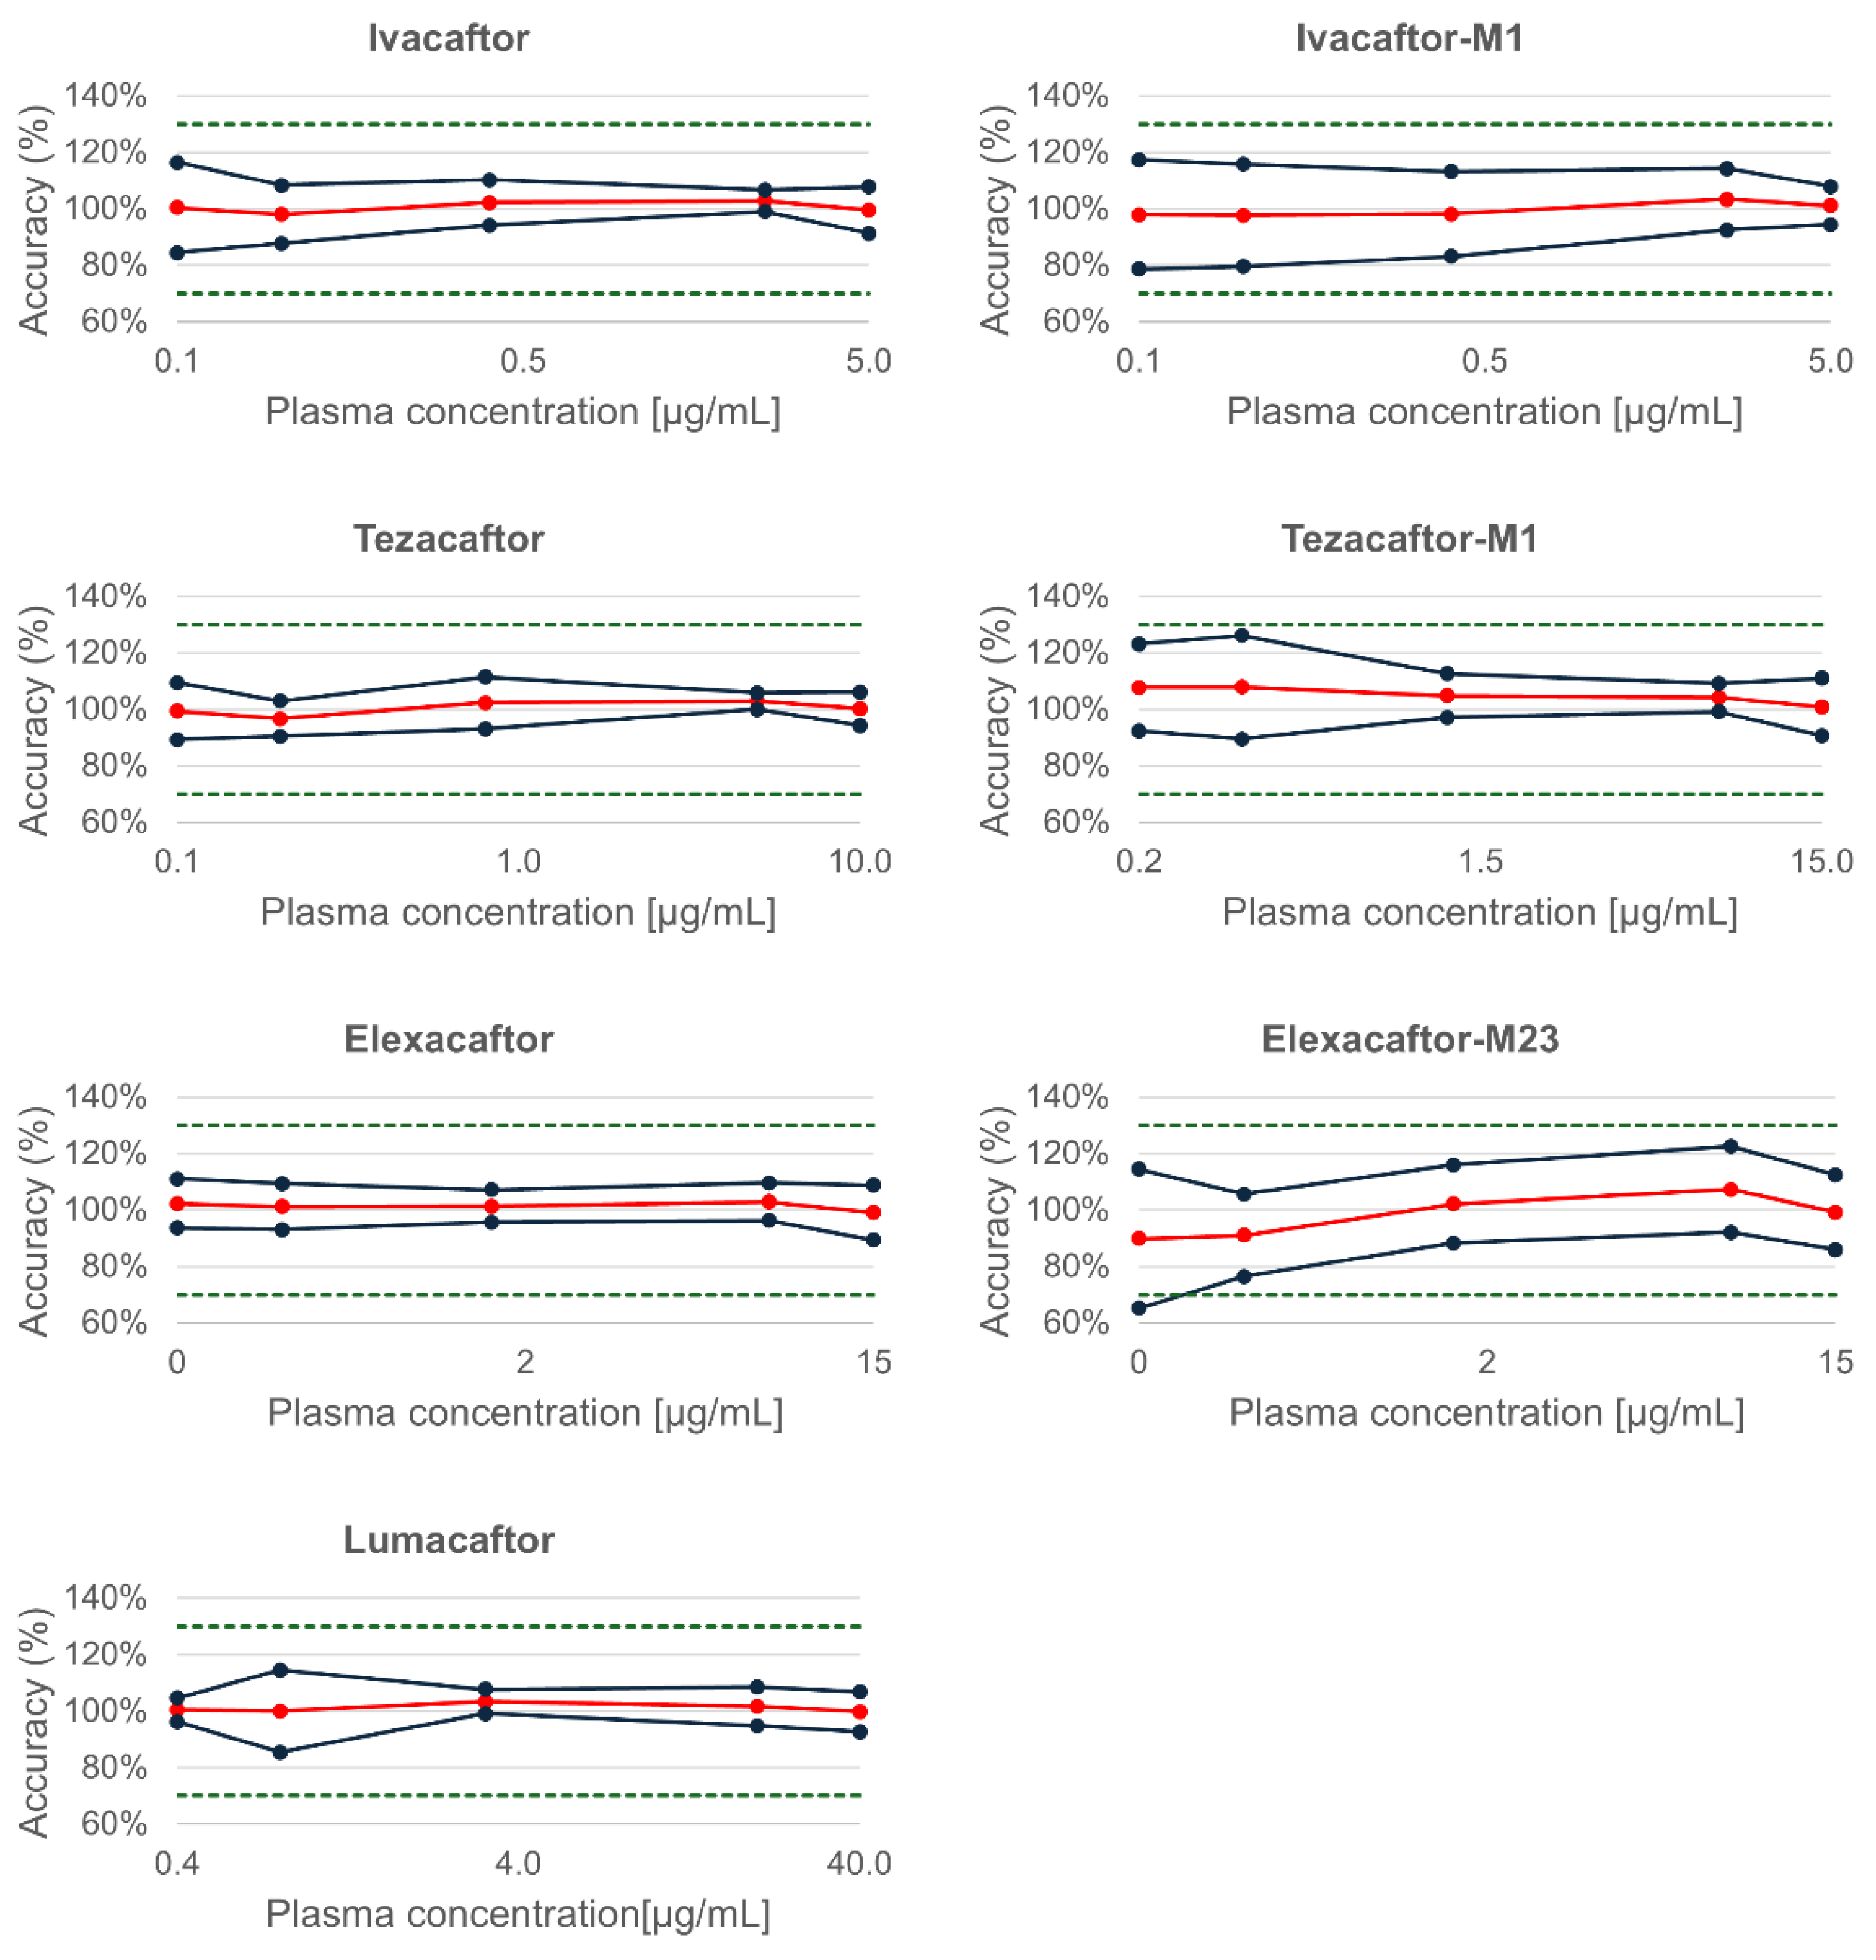
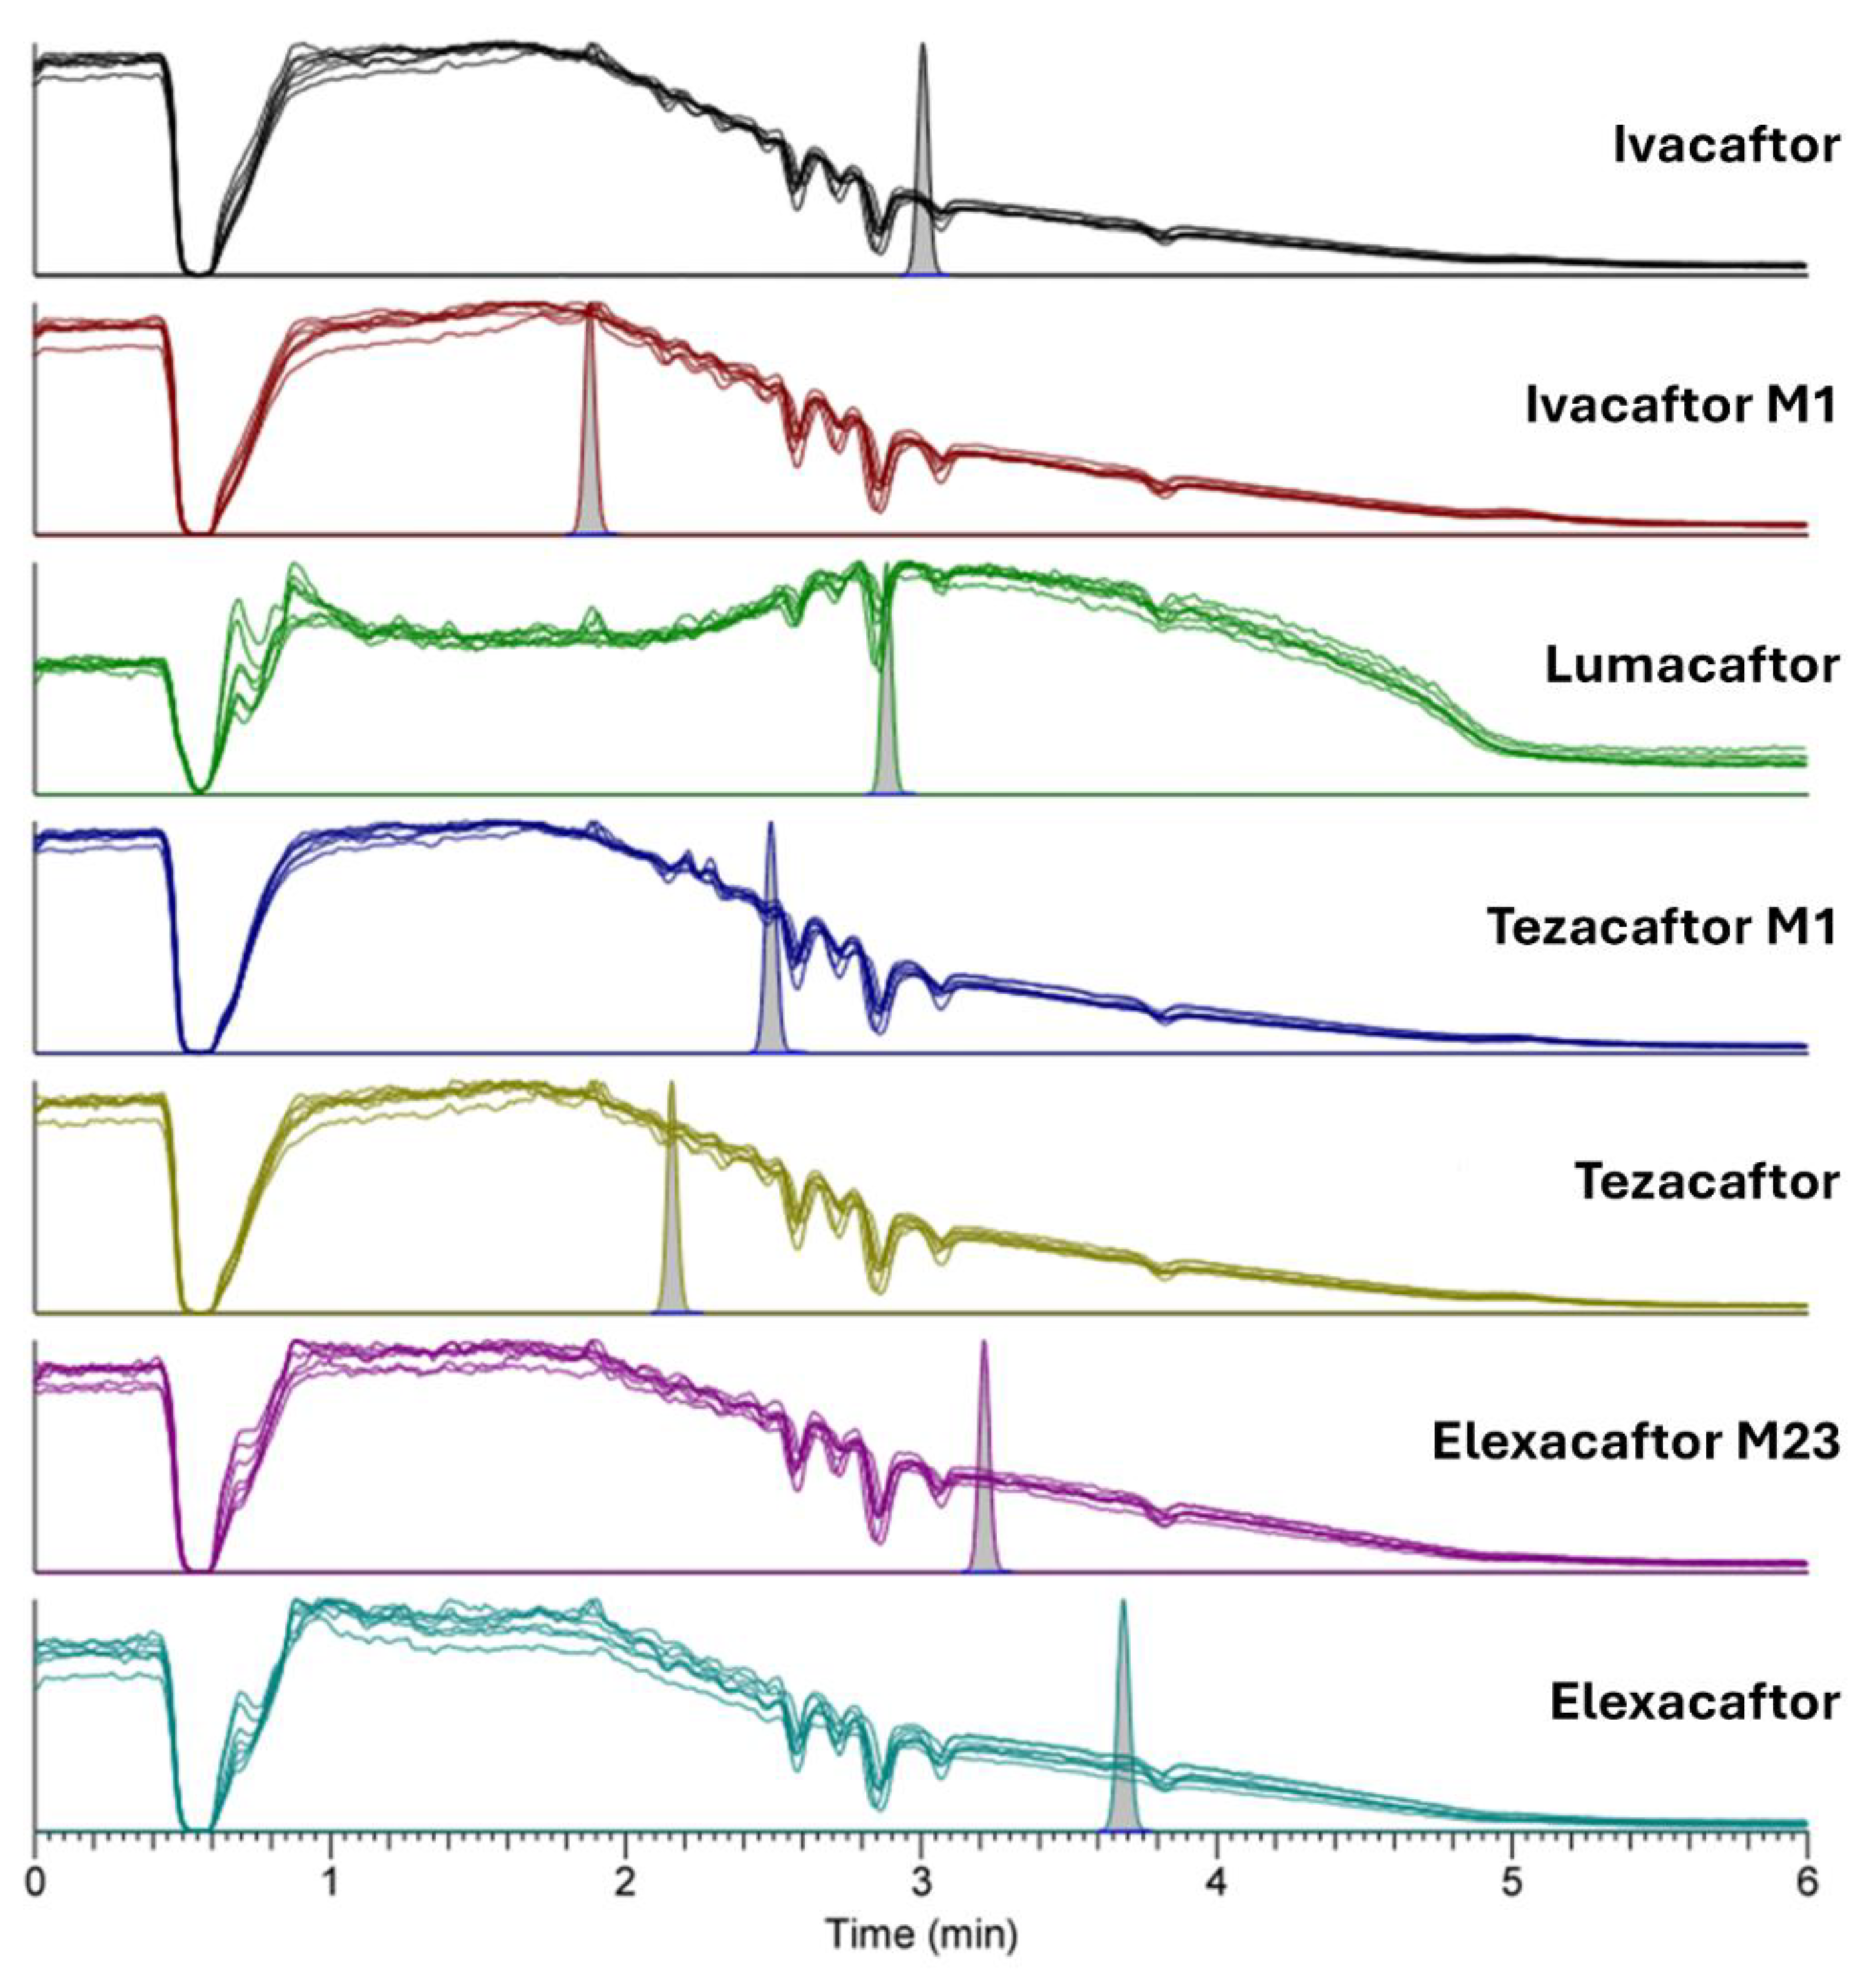
Cystic fibrosis (CF) is a life-threatening genetic disorder caused by mutations in the Cystic Fibrosis Transmembrane Conductance Regulator (CFTR) gene, leading to dysfunctional chloride transport and thickened mucus secretions in multiple organ systems, particularly the lungs and pancreas. The introduction of CFTR modulators—currently the four marketed ivacaftor, lumacaftor, tezacaftor, and elexacaftor—in the clinic has revolutionized the life of people with CF (pwCF) by improving lung function and reducing exacerbations of the clinical conditions in CF patients. These drugs, collectively referred to as "caftors," work by enhancing CFTR function, either by correcting protein folding (currently 3 marketed “correctors”: lumacaftor (LUM), tezacaftor (TEZ), and elexacaftor (ELX) or potentiating its activity (currently 1 marketed “potentiators”: ivacaftor (IVA), used alone or in combination with correctors so far Orkambi® (IVA + LUM combination therapy) or Trikafta® (IVA + TEZ + ELX combination therapy).
Caftors are subject to important interindividual pharmacokinetic (PK) variability. As CYP3A substrates, they are also prone to drug-drug interactions, for instance, inducers can reduce their exposure which may lead to a loss of clinical effect [
1,
2]. It is increasingly acknowledged that the full clinical benefice of these revolutionary caftors may be attained by their careful therapeutic drug monitoring (TDM) in patients as it is the case for other drugs [
3,
4].
Liquid chromatography-tandem mass spectrometry (LC-MS/MS) has emerged as a gold-standard technique for the precise and sensitive quantification of small-molecule drugs in biological matrices.
Recent studies have focused on analytical methodologies for quantifying CFTR modulators. A high-resolution mass spectrometry (LC-HRMS) method for the quantification of IVA, LUM, TEZ, and ELX in human plasma and in breast milk was recently developed [
5]. However, this method did not consider the metabolites ivacaftor-M1 (IVA-M1) and elexacaftor-M23 (ELX-M23), which represent an important part of active species circulating in plasma and hence participate to the overall activity, and thus deserve to be also monitored [
2]. Another LC-MS/MS method has been proposed for the rapid quantification of IVA, LUM, ELX, TEZ, ivacaftor-M6, and IVA-M1 in plasma, yet without including tezacaftor-M1 (TEZ-M1) and ELX-M23 [
6]. Similarly, an LC-MS/MS method for dried blood spot analysis was developed to quantify IVA, ivacaftor-M6, ELX, ELX-M23, TEZ, and TEZ-M1, omitting LUM [
7]. Özcan et al. reported an LC-MS approach for LUM and IVA, primarily focusing on identifying five novel degradation products rather than active metabolites [
8]. Other studies have also been limited in scope, with one focusing on ELX, TEZ, and IVA in human plasma [
9] and in human plasma and cellular lysate [
10]. Finally, an LC-MS/MS method described the dosage of IVA, IVA-M1, the rather inactive ivacaftor-M6 (the M6, i.e. carboxylate metabolite has an activity of 1/50th relative to IVA [
11]), LUM, and TEZ but omitted ELX and ELX-M23 [
12].
In this report, we describe the development and validation of an LC-MS/MS method for the simultaneous quantification of IVA, LUM, TEZ, and ELX, along with their major active metabolites: IVA-M1, TEZ-M1, and ELX-M23. Our approach uses stable isotope-labeled internal standards for all parent drugs, improving both analytical accuracy and precision and providing a more robust PK assessment. Our method adheres to regulatory guidelines for bioanalytical method validation, ensuring accuracy, precision, and robustness for clinical application. Furthermore, this method has been applied in a real-world clinical setting to ascertain drug exposure in CF patients receiving CFTR modulator therapy and constitutes a first step toward the emerging field of the precision therapy of CFTRs disorders.
The proposed method constitutes an important analytical tool for facilitating PK studies and supporting personalized medicine approaches in CF care.
2. Results and Discussion
2.1. Analytical Method Development
Several LC and MS parameters were optimized. LC parameters included mobile phase A composition (either 0.1% FA or 0.2% FA in water), different elution programs (by gradually increasing the initial percentage of mobile phase B to 5, 15, 25, 35, 45, or 60%), and modulation of the elution curve. Regarding column length, two options were examined to obtain the best resolution: 75 mm (C18 Xselect® HSS T3, 3.5 µm, 2.1 x 75 mm) and 150 mm (C18 Xselect® HSS T3, 2.5 µm, 2.1 x 150 mm).
To optimize the gradient, a sample containing all the analytes of interest in MeOH was used. The progressive increase of the initial ACN gradient between each test did not affect the quality of separation, with negligible selectivity variations. In this context, an initial gradient condition of 50% B ACN was determined to be optimal for achieving a sufficiently short analysis time while remaining suitable for the column's dead volume.
The evaluation of mobile phase A consisting of either 0.1% FA or 0.2% FA in water is reported in
Figure S1. Although retention times were similar for both mobile phase A compositions, 0.2% FA in water provided a better ionization of the ions with slightly higher MS sensitivities, and it was therefore retained as optimal mobile phase A composition.
Optimized MS/MS parameters are reported in
Table 2. All selected transitions proved to be precise and reproducible for the analysis of caftors and their metabolites. To perform this optimization, MeOH solvent solutions were individually spiked at 1 µg/mL for each analyte.
However, optimization of the vaporization temperature was necessary to increase the sensitivity of the analysis for certain compounds such as the metabolites. The optimization involved successively injecting a solution containing all the molecules of interest and varying the vaporization temperature (40, 100, 150, 200, 250, and 300°C). The peak areas obtained during the variation of vaporization temperature are reported in
Figure S2. As reported, peak areas generally increased with the increase in vaporization temperature, except for IVA, which had a maximum at 150°C, after which a slight decrease was observed. Low sensitivity was generally observed for TEZ-M1 and ELX-M23, therefore conditions improving their signals were preferred. Considering the sensitivity of all analytes, the vaporization temperature of 300°C was selected as the best compromise.
The sample precipitation procedure was also subjected to optimization. A comparison of two precipitation solvents, namely MeOH and ACN, based on the organoleptic examination of the obtained sample, and their impact on the peak intensity of the different analytes is reported in
Figure S3. As shown, a slight difference between the two tested solvents was observed, with the peak areas of analytes obtained using MeOH generally lower than those obtained with ACN. To account for the low analytical sensitivity observed for the metabolites, ACN was finally chosen.
Figure 1.
Multiplex plasma analysis by UHPLC-MS/MS of the 4 caftors and active metabolites. For sake of readability, the corresponding internal standards are not shown. Chromatographic profile of a CAL6 plasma quality control sample (IVA 5 µg/mL, LUM 40 µg/mL, TEZ 10 µg/mL, ELX 15 µg/mL, IVA-M1 5 µg/mL, TEZ-M1 15 µg/mL, ELX-M23 15 µg/mL).
2.2. Validation of the Method
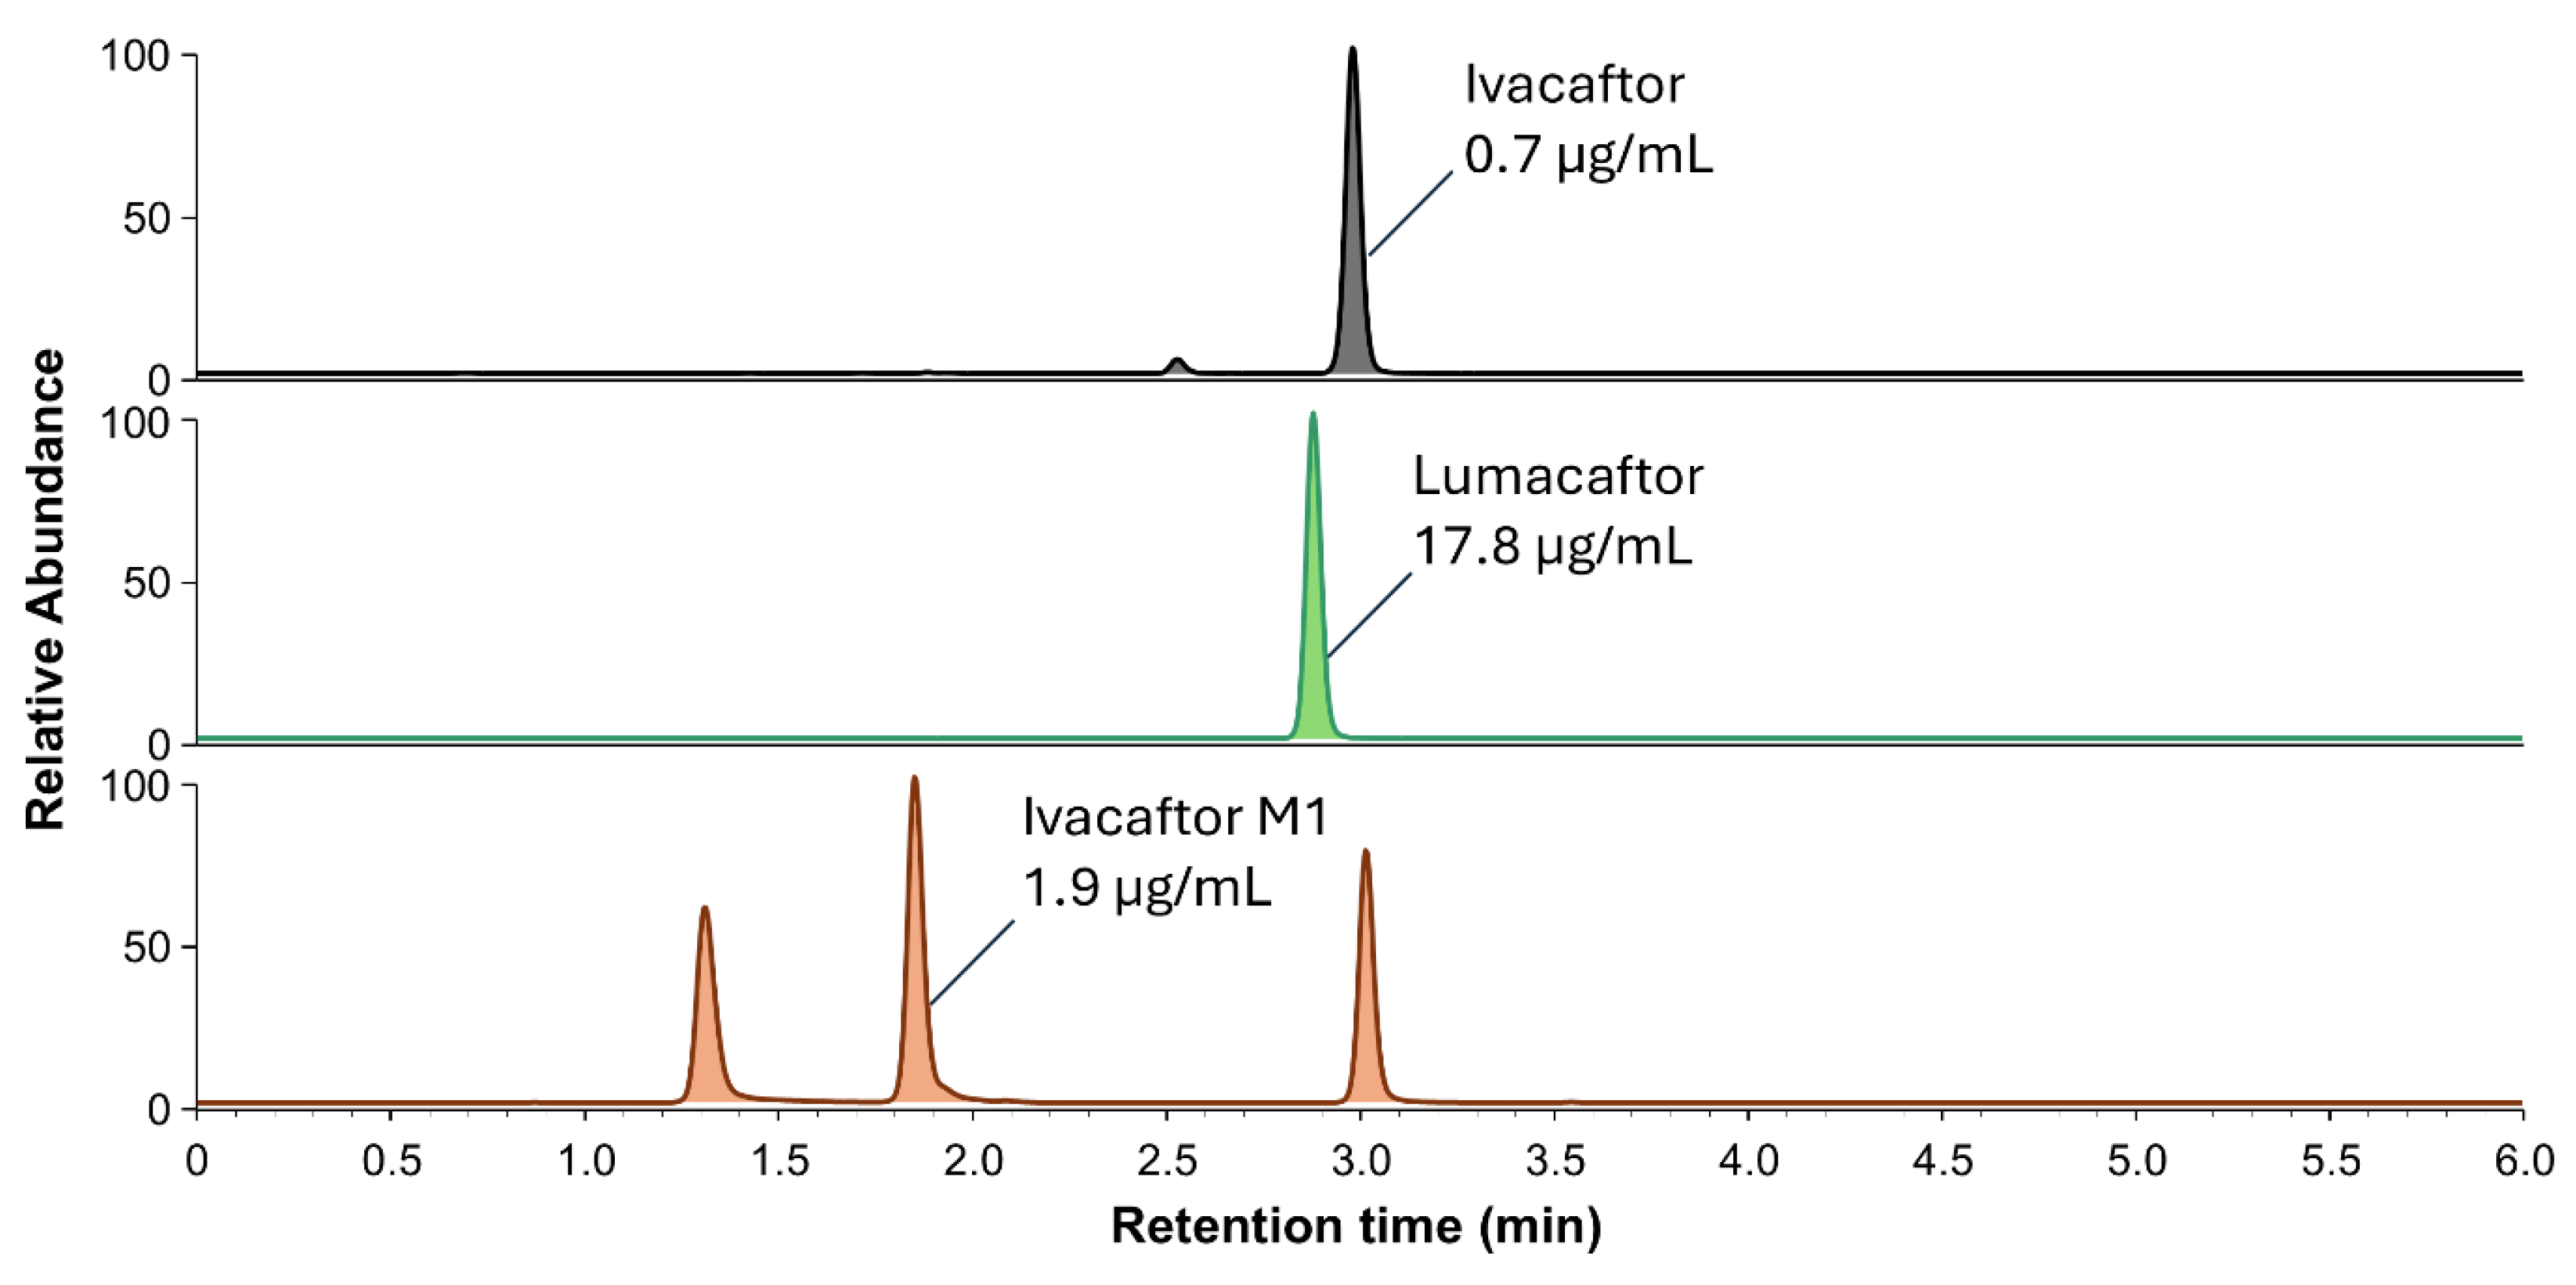
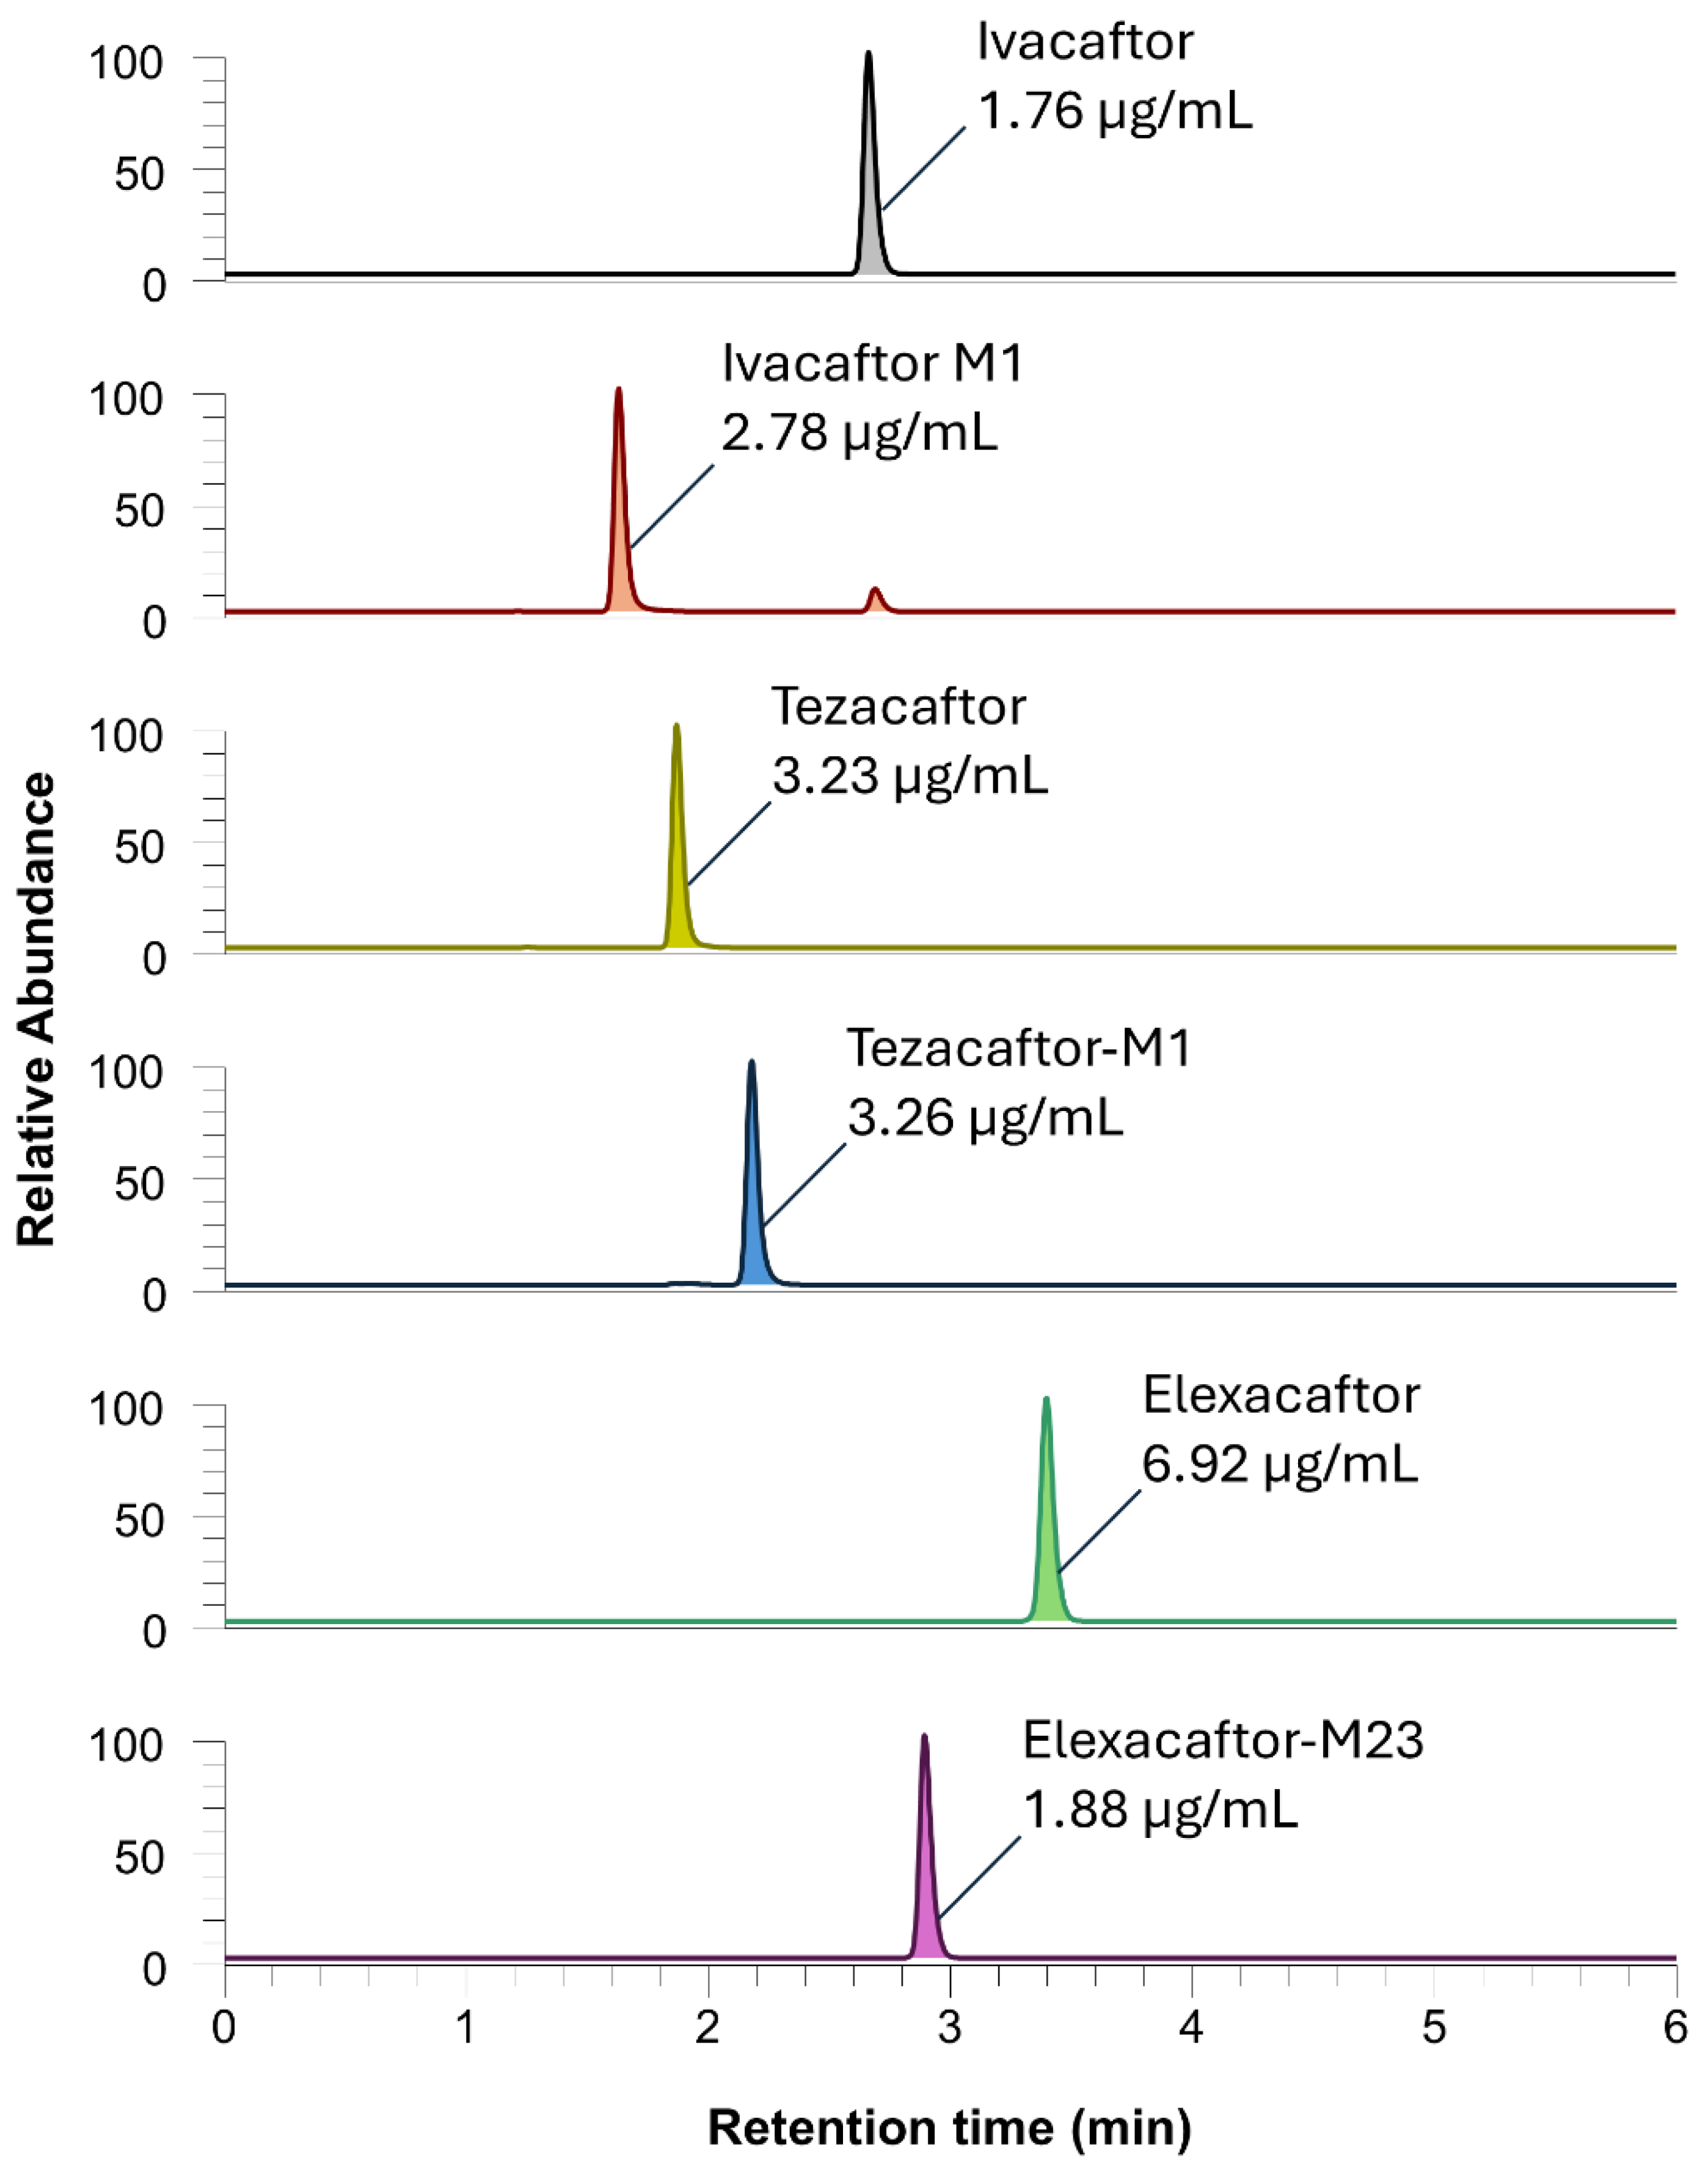
2.2.1. Selectivity, Specificity, Crosstalk, and Carryover
The method selectivity was demonstrated by the absence of peaks (or values below the limit of acceptance) in several plasma samples from subjects not receiving caftors (i.e. blank plasma) (
Table S1). Additionally, no crosstalk was observed between different analytes or between analytes and their respective internal standards (IS).
Figure S4 shows that LUM glucuronide is detected at a different retention time than the parent drug, which ensures minimal risk of overestimation in the quantification of LUM. Carryover was prevented by optimizing the liquid chromatography gradient program and implementing a double needle rinse step (ACN/MeOH/H2O 4:4:2). Additionally, a 98% B column washing step ensured the removal of residual contaminants, resulting in carryover levels below 15% relative to the area of the lowest calibrator (data not shown).
2.2.2. Limit of Detection, and Linearity
The evaluation of the LODs was satisfactory. However, for ELX and TEZ-M1, a 10-fold dilution of the sample produced a signal nine times greater than the background noise. This value significantly exceeds the LOD, which is established at three times the background noise signal. Although the specific LOD has not been determined, achieving lower concentrations is not clinically relevant, as the 10-fold dilution corresponds to a plasma concentration of 15 ng/mL for both TEZ-M1 and ELX.
The linearity observed during validation is considered satisfactory, with slopes ranging between 0.94 and 1.04. Additionally, all determination coefficients (R²) obtained are greater than 0.99 (
Table S2), demonstrating that the method reliably predicts the analyte concentrations across the tested range.
2.2.3. Trueness and Precision
The accuracy and precision calculated from the analysis of QCs during the 3 validation days are within the defined range of ±15% of the target value for the 7 analytes (
Table 3).
The accuracy profiles (
Figure 2) obtained for the analytes IVA, LUM, TEZ, ELX, IVA-M1, and TEZ-M1 meet the acceptance limits of ±30% established by the tolerance interval for biological samples, except at the lowest QC (0.15 µg/mL) for ELX-M23, where a slightly larger bias is observed. The formal LLOQ for ELX-M23 is thus 0.3 µg/mL. For all the other analytes, the LLOQ and ULOQ were defined as the lowest and the highest validated concentrations, as reported in
Table 1.
2.2.4. Evaluation of Matrix Effect
During the qualitative test (
Figure 3), potential signal suppression at the retention times of the analytes can be highlighted by overlaying the chromatograms obtained from analyzing 6 blank plasmas. A slight indication of signal suppression near the retention times for certain analytes such as IVA, LUM, or TEZ-M1 was observed. Nevertheless, the systematic use of stable isotopically labeled internal standards corrected for this matrix effect. The observed signal decrease between 2.5 and 3.2 minutes likely corresponds to the elution of phospholipids as they pass through the MS/MS detector. In contrast, the complete signal suppression at 0.5 minutes is due to the column's dead volume, likely caused by the presence of highly polar compounds that are not retained on the column.
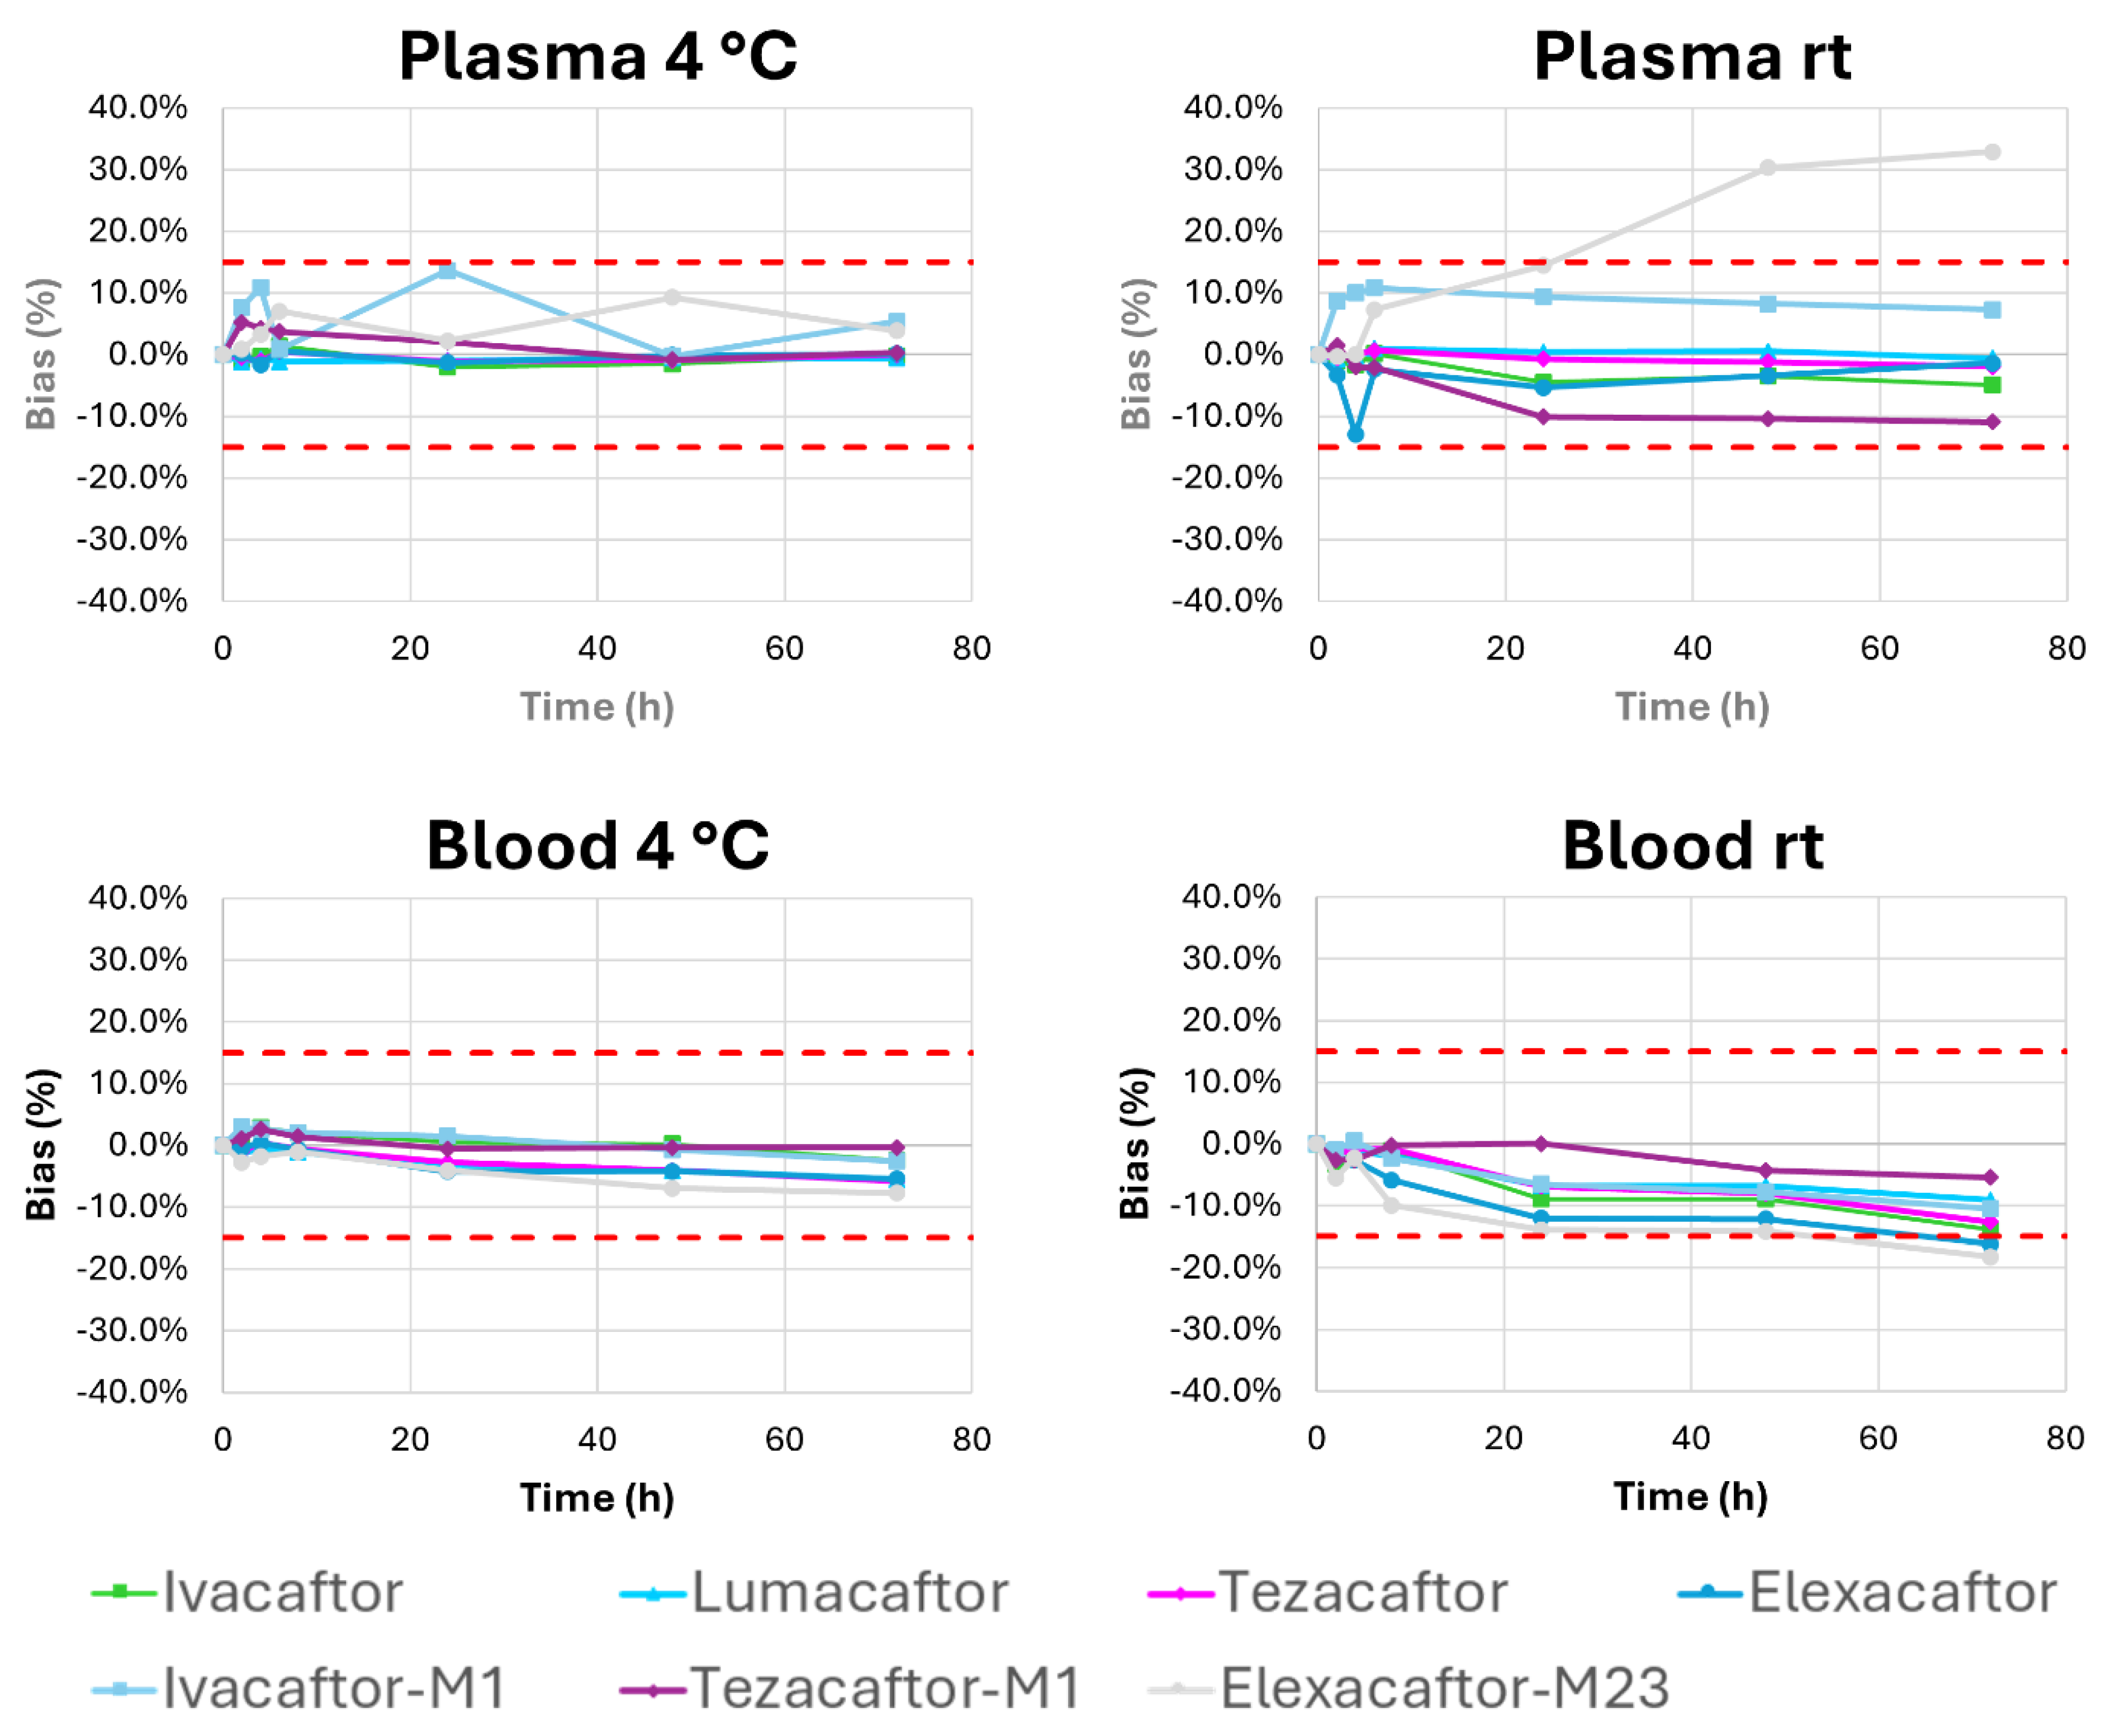
2.2.5. Stability Studies
The deviations measured for the stability profiles of the parent molecules are less than 15%, indicating that the molecules IVA, LUM, TEZ, and ELX remain stable in plasma for 72 hours, both at room temperature and at 4°C (
Figure 4). In contrast, metabolites IVA-M1, TEZ-M1, and ELX-M23 remain stable in plasma for 72 hours when stored at 4°C but exhibit variable stability profiles at room temperature. The results of the stability test suggest that blood samples should be centrifuged immediately after collection to allow the plasma to be sent within 72 hours to the laboratory at room temperature for analysis (
Figure 4).
The analysis of samples in vials stored in the autosampler at 4°C for 24h demonstrated good stability for all analytes, remaining below the ±15% limit (
Table S4). Similarly, data obtained after 3 freeze-thaw cycles reveal a mean deviation ≤ 12.2% compared to the reference, demonstrating the samples' ability to remain stable during the cycles (
Figure 5).
Data reported for integrity to dilution (
Table S5) showed that for all dilutions performed with plasma, the ratios obtained for all compounds are within the ±15% acceptance range, demonstrating the robustness of the method for plasma dilutions.
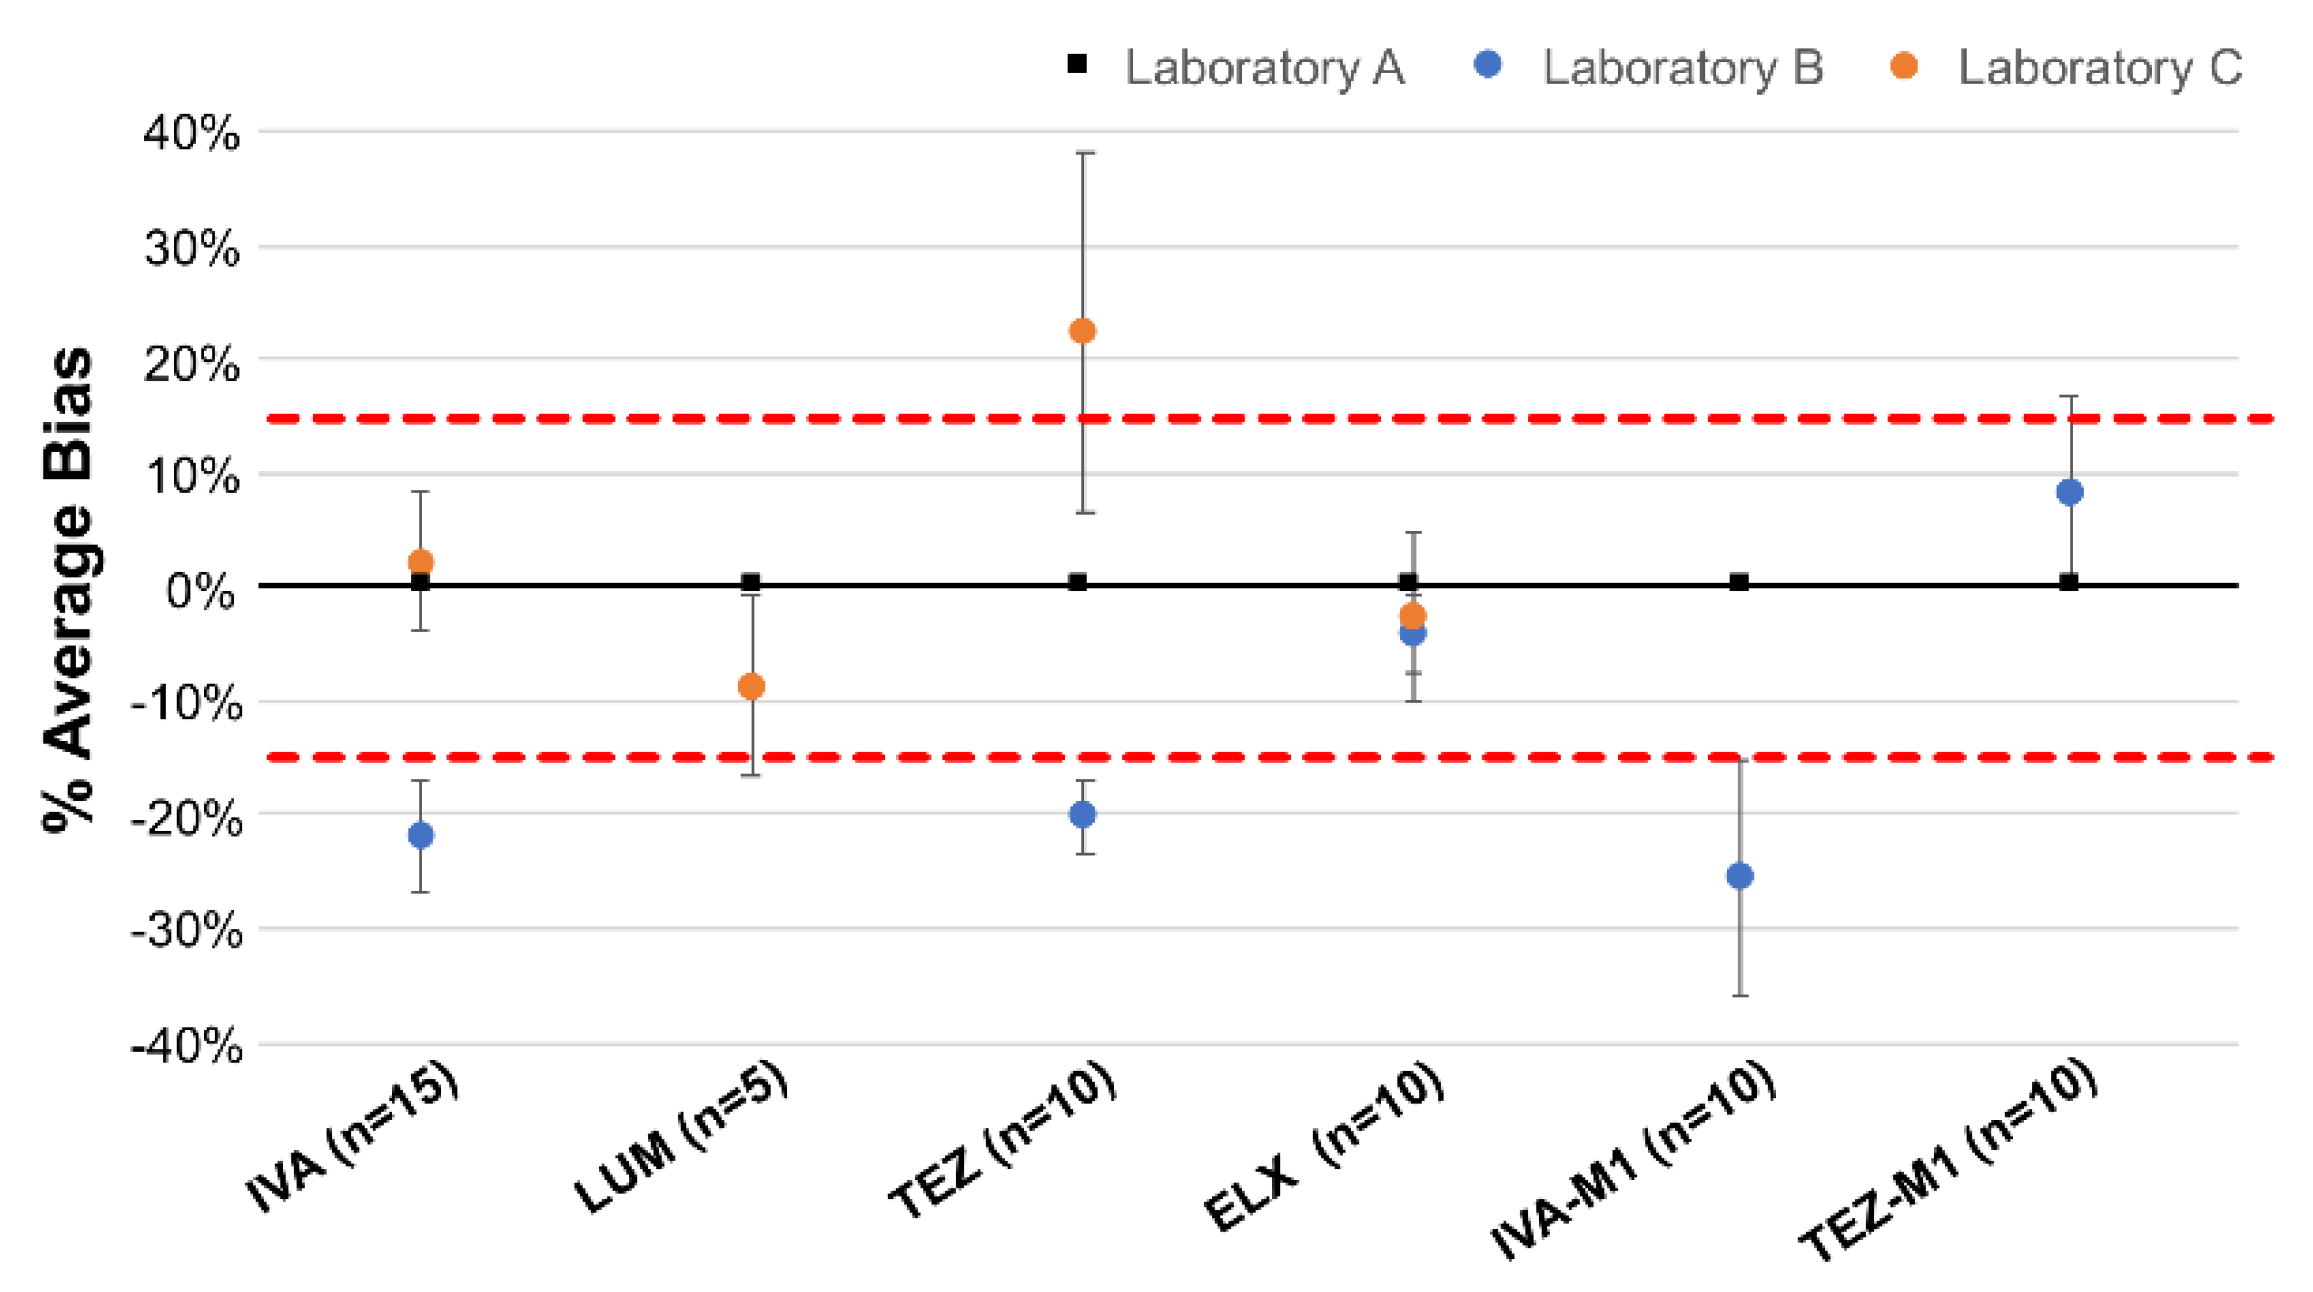
2.3. Inter-Laboratory Comparisons
The satisfactory performance of our laboratory in the inter-laboratory comparison (ILC) confirmed the accuracy of the analytical method. The exchange of drug samples among collaborating laboratories demonstrated high consistency in measured concentrations, with minimal variation between results. This strong agreement across laboratories validated the reliability of the developed analytical method, confirming its suitability for routine drug quantification.
2.4. Clinical Application: Exploratory Analyses
Two examples of the chromatographic profiles of patient samples are reported in
Figure 7 and
Figure 8. The first chromatogram (
Figure 7) shows the signal peaks and concentrations obtained from a sample from a patient treated with IVA + LUM dual therapy. The sample was taken from the patient 3 hours after the last dose of medication. The observed signals demonstrate the presence of the compounds of interest, including the active metabolite. The second series of chromatograms reported in
Figure 8 represents the multiplex analysis of a plasma sample from a patient treated with IVA + TEZ + ELX triple therapy, 20 hours after the drug intake. A quantification test was also performed on a breast milk sample from a consenting breast-feeding patient (
Figure S5) treated with IVA + TEZ + ELX triple therapy, 3 hours after the medication intake. Matrix matched calibration with human milk was used for the quantification and QC in this matrix were within the acceptance limit (i.e. bias <15%, data not shown). The reported examples demonstrate the specificity of the analytical method by highlighting the expected parent drugs and their respective metabolites.
3. Materials and Methods
3.1. Chemical and Reagents
Compounds analyzed in this study included IVA, LUM, TEZ, ELX, and their metabolites hydroxymethyl ivacaftor (i.e. IVA-M1), TEZ-M1, and ELX-M23. IVA (cat n° C48883), LUM (cat n° C49431), TEZ (cat n° C48881), ELX (cat n° C48878), and the isotope-labelled reference materials tezacaftor-D4 (TEZ-D4, cat n° C48882), and elexacaftor-D3 (ELX-D3, cat n° C48880) were obtained from Chemie Brunschwig AG (Basel, Switzerland). IVA-M1 (cat. n° CS-O-11850), TEZ-M1 (cat. n° CS-O-35941), ELX-M23 (cat. n° CS-O-35456), and the isotope-labelled reference materials ivacaftors-D4 (IVA-D4, cat. n° CS-O-01219), and lumacaftor-D4 (LUM-D4, cat. n° CS-P-08060) were obtained from Clearsynth (Brampton, Canada). Voriconazole-D3 (VOR-D3, cat. n° TRC-V760002) found to be a suitable IS for IVA-M1, was purchased from LGC standards (Teddington, UK). Acetonitrile (ACN), methanol (MeOH), formic acid (FA), and dimethyl sulfoxide (DMSO) were of analytical grade (≥ 98 %) and purchased from Merck (Darmstadt, Germany). Ultrapure water was supplied by a Milli-Q IQ 7000 purification system (Merck Millipore, Burlington, USA).
3.2. Stock Solutions, Calibration and Validation Standards Preparation
Stock solutions of internal standards (IS) IVA-D4 (5mg/mL), LUM-D4 (2mg/mL), TEZ-D4 (1mg/mL), ELX-D3 (1mg/mL) and VOR-D3 (5 mg/mL) were prepared by dilution in acetonitrile (ACN) to achieve a final concentration of 0.2 μg/mL, 1 μg/mL, 0.4 μg/mL, 0.4μg/mL, and 0.5 mg/mL, respectively. The mix of IS were used to normalize the parent drug and the corresponding metabolite except for IVA-M1 for which the optimal IS was voriconazole-D3 (
Table 2).
A stock solution in DMSO was prepared for each analyte: IVA and LUM were solubilized to 5 mg/mL, while TEZ and ELX to 2 mg/mL and 1 mg/mL, respectively. These stock solutions were subsequently stored at −80 °C. Two independent working solutions (WS) were prepared by appropriately diluting stock solutions in a mixture of H2O:MeOH (1:1). These were further diluted twenty-fold in plasma to produce the various calibrators (CALs) and quality controls (QCs) at the final concentrations specified in
Table 1. Notably, calibration concentration ranges were based on FDA data retrieved from caftors drug registration files and from comprehensive literature review of available clinical PK studies and encompass the plasma concentrations typically observed in patients [
1,
2,
10,
12,
13,
14,
15].
3.3. Plasma Sample Extraction Procedure
Citrate plasma was donated from patients with Vaquez disease (polycythemia vera) undergoing their regular phlebotomy at the clinic “Unisanté”, University of Lausanne, Switzerland. This plasma, collected according to institutional ethical standards, was used as “blank plasma” to generate the CAL and QC samples.
In 1.5-mL Eppendorf® tubes, 50 µL of plasma sample (calibration, validation standards, quality control (QC) or patient samples) was precipitated with 150 µL of ACN containing the mix of IS (i.e. protein precipitation solvent). The mixture was vortexed and centrifugated at 20’000g (14’000 rpm) for 10 minutes at 4 °C using a Mikro 220R centrifuge from Hettich (Bäch, Switzerland) to achieve plasma protein precipitation. Subsequently, 150 µL of the supernatant was transferred to glass vials with inserts and mixed with 150 µL of MilliQ water before being vortexed again.
3.4. Instrumentation and Experimental Conditions
Analyses were performed on a LC-MS/MS system from Thermo Fisher Scientific (San Jose, USA) consisting of a Vanquish ultra-high-performance liquid chromatography (UHPLC) equipped with a 2-channel binary high-pressure gradient pump and a flow-through needle auto-sampler maintained at 4 °C. The chromatographic system was coupled with a TSQ Quantis triple quadrupole mass spectrometer equipped with an electrospray ionization (ESI) interface. MS analyses were performed in ESI positive mode applying static spray voltage set to 3.45 kV. Optimized ESI source parameter settings involved ion transfer tube and vaporizer temperatures of 350 °C and 300 °C, respectively; sheath, auxiliary, and sweep gas flow rates at 45, 10, and 0 (arbitrary units), respectively. The mass resolutions for the first (Q1) and third (Q3) quadrupoles were set at 0.7 and 1.2 Da, respectively, and the pressure of the collision gas (argon) in the second quadrupole (Q2) was 1.5 mTorr. Instrument control, data acquisition, and processing were performed using Xcalibur version 4.5 (ThermoFisher Scientific, San Josp, CA, USA).
Chromatographic separations were achieved by gradient elution onto a 2.1 mm x 75 mm C18 Xselect® HSS T3 3.5 µm column Waters® (Milford, USA). Mobile phases consisted of 0.2% FA in water (A), and ACN (B), flow rate was set to 0.3 mL/min and injection volume to 10 µL. The optimized gradient program started with 50% B, increased to: 60% B at 0.5 minutes, 80% B at 1.5 minutes, then 90% B at 3.5 minutes. A 1.5-minute column washing step was then performed at 98% B, followed by a 2-minutes re-equilibration step at the initial gradient conditions (50% B).
3.5. Validation Procedure
The method was validated in compliance with the European Medicines Agency (EMA) ICH M10 scientific guidelines on bioanalytical method validation [
16].
3.5.1. Selectivity, Specificity, Crosstalk, and Carryover
Method selectivity was confirmed by injecting six blank plasma samples from drug-free subjects to ensure no interfering peaks appeared at the retention times of the target analytes. Peak area <20% analyte of the lowest CAL or <5% of the IS at the respective retention times of the analytes are considered as negligible according to EMA ICH M10 guidelines.
A key challenge arises from the potential in-source fragmentation of the LUM glucuronide metabolite, which may produce the parent drug ion and would lead to overestimation of the LUM, in case of incidental co-elution with parent drug. To evaluate potential interference from the glucuronide metabolite, we assessed whether in-source dissociation during ESI could generate detectable parent drug ions at the selected mass transitions and retention time. This transition was followed solely for qualitative monitoring without quantification.
To assess crosstalk, blank plasma (CAL0) was precipitated with the IS solution, while a CAL6 sample was precipitated with acetonitrile (ACN) only. Crosstalk was quantified by calculating the ratio of peak areas of CAL0/CAL1 for IS interference and CAL6 without IS/CAL1 for analyte interference. Acceptance criteria were set at ≤20% interference of IS in analyte detection and ≤5% interference of analyte in IS detection, following EMA guidelines.
Finally, carryover was evaluated by injecting a solution containing all analytes (IVA, LUM, TEZ, IVA-M1, TEZ-M1, ELX-M23) at the lowest (CAL1) and then at the highest concentration (CAL6) with 3 subsequent blank injections (blank plasma extract without IS). The signal detected in the blank sample was compared to CAL1 to determine carryover percentages.
3.5.2. Evaluation of Matrix Effect
Matrix effects were assessed both qualitatively and quantitatively. Qualitative assessment was performed by direct infusion of analytes while simultaneously analyzing blank plasma using LC-MS/MS. This was achieved by modifying the MS inlet tubing with a "T" fitting to allow continuous monitoring of potential matrix-induced ion suppression or enhancement.
For quantitative matrix effect evaluation, ten blank EDTA plasma samples from drug-free volunteers were spiked at three concentration levels (QCL2, QCM1, and QCM2). Following standard sample processing, analyte recoveries were quantified and compared to theoretical concentrations. The matrix effect was considered negligible and validated if deviations remained within ±15%, as per EMA ICH M10 guidelines.
3.5.3. Limit of Quantification, and Linearity
The lower limit of quantification (LLOQ) was determined as the lowest analyte concentration that could be reliably quantified with acceptable accuracy and precision, ensuring reproducible results with minimal uncertainty. The LLOQ threshold adhered to EMA acceptability criteria of ±20% deviation from nominal values.
The limit of detection (LOD) was defined as the lowest analyte concentration distinguishable from background noise at a signal-to-noise (S/N) ratio of ≥3. LOD was established experimentally by serial dilutions of CAL1 and comparison with blank plasma responses.
Linearity was evaluated by analyzing calibration standards prepared in plasma, covering a concentration range encompassing concentrations expected to occur in patients. Calibration curves were assessed based on regression parameters, including slope, y-intercept, and residual sum of squares (R² > 0.99). A graphical assessment was performed to visualize linearity deviations.
3.5.4. Trueness and Precision
A series of replicate analyses (n=3) were conducted on five QC validation sample levels (L1, L2, M1, M2, H) to evaluate both intra-assay (within a single analytical run) and inter-assay (across multiple runs) accuracy and precision, as part of the validation process. Among these five levels, three were selected as QC levels for routine analysis (QC1, QC2, QC3).
To assess dilution integrity, QC samples with concentrations exceeding the highest calibrator (twice the highest QC level) were diluted tenfold using five different blank plasma samples, ensuring their adjusted concentrations fell within the validated plasma range.
Trueness was assessed by calculating bias, defined as the percentage difference between the measured and expected concentrations.
Precision was determined through repeatability (intraday variability) and intermediate precision (variability observed within and across different days). Initially, calibrators were prepared in duplicate, while QC samples were prepared in triplicate (i.e., validation samples) to span the anticipated concentration range.
β-Expectation tolerance intervals were used to define the range within which β% of future measurements are expected to fall, providing an estimation of method uncertainty (MU) [
17,
18,
19]. Accuracy profiles, representing the total analytical error, were generated using β-expectation tolerance with a β-value of 80%. For bioanalytical purposes, acceptability thresholds were established at ±30% [
20].
Various calibration models were assessed to determine the most suitable approach for characterizing the response-to-concentration relationship. The optimal model was selected based on estimates of trueness and precision, utilizing up to six of the eight initially tested calibrators. The decision was also influenced by the narrowest β-expectation tolerance interval and the lowest limit of quantification (LLOQ) [
21]. Finally, MU was derived from validation phase data, setting the β-value at 0.95.
3.5.5. Stability Studies
Stability experiments were conducted to assess analyte integrity under various storage and handling conditions, including: i) Short-term stability: Plasma and whole blood samples were aliquoted and stored at room temperature and at +4°C, and then analyzed at multiple time points (0, 2, 4, 6, 24, 48, and 72h), ii) Post-precipitation stability: Extracted samples were stored in the autosampler maintained at +4°C and re-analyzed after 24 hours, iii) Freeze-thaw stability: Aliquots were subjected to three freeze-thaw cycles (-80°C) before reanalysis, iv) Analyte stability in whole blood: Due to potential ex vivo metabolism, separate experiments were conducted for parent molecules (IVA, LUM, TEZ, ELX) and their active metabolites (IVA-M1, TEZ-M1, ELX-M23).
Stability was considered acceptable if results remained within ±15% of initial (t=0) concentrations, per EMA recommendations.
3.5.6. Inter-Laboratory Comparisons
As proficiency program has not yet been established, inter-laboratory comparisons (ILCs) were organized with two European laboratories to evaluate the performance and accuracy of the method, as previously done for other drug classes [
22]. Since neither laboratory's assay methods could cover all target molecules independently, some analytes were measured in both laboratories for validation purposes, while others were analyzed exclusively in one laboratory or the other. Additionally, due to sample volume constraints, different samples were sent to each laboratory, ensuring that the same samples were analyzed in at least two laboratories.
3.6. Clinical Application of the Method
Initially, a small number of patients’ blood samples were analyzed as laboratory QC analyses for the formal demonstration of assay applicability. After extensive analytical method validation, caftors levels were determined in samples from patients’ treated with IVA + LUM dual therapy or IVA + TEZ + ELX triple therapy, collected within the framework of an observational population PK-pharmacodynamics study. All patients provided written informed consent for the donation of 5 mL aliquot of blood (EDTA) taken at their usual medical follow-up visit, for scientific purposes. The study protocol has been approved by the Institutional Ethics Committee CER-VD (protocol 2024-01337).
Blood samples (EDTA) from patients were centrifuged at 12700 rpm for 10 minutes at 4 °C, and the collected plasma was directly stored at −80 °C until batch-wise analysis.
To preliminarily evaluate the applicability of the method to alternative biological matrices, particularly human breast milk, a calibration curve and QC were prepared in this matrix, and initial quantification tests were performed on breast milk samples from a consenting breast-feeding donor. These exploratory analyses provide preliminary insights into the method’s feasibility and its potential for future validation in lactation studies and neonatal PK assessments.
7. Conclusions
An LC-MS/MS analytical method was developed and validated for the simultaneous analyses and quantification of caftors and their major active metabolites in plasma. This method was found to be reliable, robust, and well-suited for the analysis of CFTR modulators and their metabolites during the observational PK study with CF patients.
The developed analytical method was found to have excellent selectivity, sensitivity, and linearity, meeting the regulatory requirements issued by the EMA, as well as the specific needs of our application.
Application of this analytical tool in the real world constitutes the first essential step towards the therapeutic drug monitoring of caftors and paves the way to characterize the association between drug exposure and efficacy or safety of these revolutionary therapies in patients with cystic fibrosis with the aim to tailor treatment to individuals.
Supplementary Materials
The following supporting information can be downloaded at the website of this paper posted on Preprints.org. Figure S1: Optimization of mobile phase composition, Figure S2: Optimization of MS parameters, Figure S3: Optimization of extraction procedure, Table S1: Method selectivity, Table S2: Method linearity, Table S3: Evaluation of matrix effect, Table S4: Stability of the extracted analytes, Table S5: Evaluation of dilution integrity, Figure S4: Identification of LUM glucuronide, Figure S5: Caftors quantification in human breast milk.
Author Contributions
Conceptualization, E.C. and L.A.D.; Validation, F.V., E.C. and L.A.D; Formal Analysis, F.C., F.V. and E.C.; Investigation, F.C., S.A., L.FB., M.V. and T.M.; Resources, E.C. and L.A.D.; Writing – Original Draft Preparation, V.D. and E.C.; Writing – Review & Editing, E.C, V.D. and L.A.D.; Visualization, V.D. and F.C.; Supervision, E.C. and L.A.D.; Project Administration, E.C. and L.A.D.; Funding Acquisition, E.C. and L.A.D; Medical supervision and patient clinical care: S.B., A.K., F.G., Z.B., G.M, I.R., A.S.; Therapeutic Drug Monitoring: E.C., M.G., C.M. and P.T. All authors have read and agreed to the published version of the manuscript.
Funding
This research was funded by the Cystic Fibrosis Switzerland and the Swiss Working Group for Cystic Fibrosis (SWGCF) grant number [2022]. We are also grateful to all collaborators of the pharmacological laboratory at CHUV and the CF medical team at CHUV and Neuchâtel Hospital. The salaries of F.V. and A.M. were supported by the SNF grant n°324730_192449 to L.A.D. Part of the salary of T.M., was provided by SNF grant n°32003B_179273. The analytical development was supported in part by private funds of the Laboratory of Clinical Pharmacology (i.e. PCL8-FFS 32072, L.A.D).
Institutional Review Board Statement
The study was conducted according to the guidelines of the Declaration of Helsinki and approved by the Institutional Review Board (or Ethics Committee) of “Décision de la Commission cantonale (VD) d'éthique de la recherche sur l’être humain (CER-VD)”, protocol 2024-01337
Informed Consent Statement
Informed consent was obtained from all subjects involved in the study.
Data Availability Statement
Data is contained within the article or supplementary material.
Acknowledgments
We are grateful to all collaborators of the pharmacological laboratory at Lausanne and the CF medical team at Lausanne and Neuchâtel hospitals. We thank Professor Michael Vogeser, Institute of Laboratory Medicine, Hospital of the University of Munich (LMU), Munich, Germany, and Professor Jean-Marc Treluyer, Dr Léo Froelicher-Bournaud, Dr Sihem Nedjma Benaboud, Department of Clinical Pharmacology, Cochin Hospital, AP-HP, University of Paris-Cité, Paris, France for samples exchange that enabled to cross-validate results accuracy.
Conflicts of Interest
The authors declare no conflict of interest.
References
- Garg, V.; Shen, J.; Li, C.; Agarwal, S.; Gebre, A.; Robertson, S.; Huang, J.; Han, L.; Jiang, L.; Stephan, K.; et al. Pharmacokinetic and Drug-Drug Interaction Profiles of the Combination of Tezacaftor/Ivacaftor. Clin Transl Sci 2019, 12, 267–275. [Google Scholar] [CrossRef] [PubMed]
- Choong, E.; Sauty, A.; Koutsokera, A.; Blanchon, S.; Andre, P.; Decosterd, L. Therapeutic Drug Monitoring of Ivacaftor, Lumacaftor, Tezacaftor, and Elexacaftor in Cystic Fibrosis: Where Are We Now? Pharmaceutics 2022, 14. [Google Scholar] [CrossRef] [PubMed]
- Noetzli, M.; Choong, E.; Ansermot, N.; Eap, C.B. Simultaneous determination of antidementia drugs by HPLC-MS: validation data of the method and plasma level determinations in 300 patients. In Proceedings of the Therapeutic Drug Monitoring, Aug; 2011; pp. 501–501. [Google Scholar]
- Courlet, P.; Alves Saldanha, S.; Cavassini, M.; Marzolini, C.; Choong, E.; Csajka, C.; Gunthard, H.F.; Andre, P.; Buclin, T.; Desfontaine, V.; et al. Development and validation of a multiplex UHPLC-MS/MS assay with stable isotopic internal standards for the monitoring of the plasma concentrations of the antiretroviral drugs bictegravir, cabotegravir, doravirine, and rilpivirine in people living with HIV. J Mass Spectrom 2020, 55, e4506. [Google Scholar] [CrossRef] [PubMed]
- Hansson, A.B.; Wadstrom, H.; Eliasson, E.; Al Shakirchi, M.; de Monestrol, I.; Barclay, V. Development and clinical implementation of an LC-HRMS method for ivacaftor, lumacaftor, tezacaftor and elexacaftor in human plasma and breast milk. Anal Bioanal Chem 2024, 416, 5565–5577. [Google Scholar] [CrossRef] [PubMed]
- Zheng, Y.; Rouillon, S.; Khemakhem, M.; Balakirouchenane, D.; Lui, G.; Abdalla, S.; Sanoufi, M.R.; Sauvaitre, L.; Thebault, L.; Hirt, D.; et al. A rapid LC-MS/MS method for the simultaneous quantification of ivacaftor, lumacaftor, elexacaftor, tezacaftor, hexyl-methyl ivacaftor and ivacaftor carboxylate in human plasma. J Pharm Biomed Anal 2024, 248, 116322. [Google Scholar] [CrossRef] [PubMed]
- Vonk, S.E.M.; van der Meer-Vos, M.; Kos, R.; Neerincx, A.H.; Terheggen-Lagro, S.W.J.; Altenburg, J.; Maitland-van der Zee, A.H.; Mathot, R.A.A.; Kemper, E.M.; Amsterdam Mucociliary Clearance Disease research, g. Dried Blood Spot Method Development and Clinical Validation for the Analysis of Elexacaftor, Elexacaftor-M23, Tezacaftor, Tezacaftor-M1, Ivacaftor, Ivacaftor Carboxylate, and Hydroxymethyl Ivacaftor Using LC-MS/MS. Ther Drug Monit 2024, 46, 804–812. [Google Scholar] [CrossRef] [PubMed]
- Ozcan, S.; Erdogan Uzunoglu, U.; Levent, S.; Can, N.O. Liquid chromatographic determination of lumacaftor in the presence of ivacaftor and identification of five novel degradation products using high-performance liquid chromatography ion trap time-of-flight mass spectrometry. J Sep Sci 2023, 46, e2300228. [Google Scholar] [CrossRef] [PubMed]
- Pigliasco, F.; Cafaro, A.; Stella, M.; Baiardi, G.; Barco, S.; Pedemonte, N.; D'Orsi, C.; Cresta, F.; Casciaro, R.; Castellani, C.; et al. Simultaneous Quantification of Ivacaftor, Tezacaftor, and Elexacaftor in Cystic Fibrosis Patients' Plasma by a Novel LC-MS/MS Method. Biomedicines 2023, 11. [Google Scholar] [CrossRef] [PubMed]
- Ryan, K.J.; Guimbellot, J.S.; Dowell, A.E.; Reed-Walker, K.D.; Kerstner-Wood, C.D.; Anderson, J.D.; Liu, Z.; Acosta, E.P. Quantitation of cystic fibrosis triple combination therapy, elexacaftor/tezacaftor/ivacaftor, in human plasma and cellular lysate. J Chromatogr B Analyt Technol Biomed Life Sci 2022, 1213, 123518. [Google Scholar] [CrossRef] [PubMed]
- European public assessment report. Summary of Product Characteristics. Available online: https://www.ema.europa.eu/en/documents/variation-report/kalydeco-h-c-2494-x-83-g-epar-assessment-report-variation_en.pdf (accessed on June 3, 2022).
- Vonk, S.E.M.; van der Meer-Vos, M.; Bos, L.D.J.; Neerincx, A.H.; Majoor, C.J.; Maitland-van der Zee, A.H.; Mathot, R.A.A.; Kemper, E.M.; Amsterdam Mucociliary Clearance Disease research, g. Quantitative Method for the Analysis of Ivacaftor, Hydroxymethyl Ivacaftor, Ivacaftor Carboxylate, Lumacaftor, and Tezacaftor in Plasma and Sputum Using Liquid Chromatography With Tandem Mass Spectrometry and Its Clinical Applicability. Ther Drug Monit 2021, 43, 555–563. [Google Scholar] [CrossRef] [PubMed]
- Schneider, E.K. Cytochrome P450 3A4 Induction: Lumacaftor versus Ivacaftor Potentially Resulting in Significantly Reduced Plasma Concentration of Ivacaftor. Drug Metab Lett 2018, 12, 71–74. [Google Scholar] [CrossRef] [PubMed]
- Habler, K.; Kalla, A.S.; Rychlik, M.; Bruegel, M.; Teupser, D.; Nahrig, S.; Vogeser, M.; Paal, M. Isotope dilution LC-MS/MS quantification of the cystic fibrosis transmembrane conductance regulator (CFTR) modulators ivacaftor, lumacaftor, tezacaftor, elexacaftor, and their major metabolites in human serum. Clin Chem Lab Med 2022, 60, 82–91. [Google Scholar] [CrossRef] [PubMed]
- Schneider, E.K.; Reyes-Ortega, F.; Wilson, J.W.; Kotsimbos, T.; Keating, D.; Li, J.; Velkov, T. Development of HPLC and LC-MS/MS methods for the analysis of ivacaftor, its major metabolites and lumacaftor in plasma and sputum of cystic fibrosis patients treated with ORKAMBI or KALYDECO. J Chromatogr B Analyt Technol Biomed Life Sci 2016, 1038, 57–62. [Google Scholar] [CrossRef] [PubMed]
- European public assessment report. Guideline on Bioanalytical Method Validation and Study Sample Analysis. Available online: https://www.ema.europa.eu/en/documents/scientific-guideline/ich-guideline-m10-bioanalytical-method-validation-step-5_en.pdf (accessed on June 3, 2023).
- Feinberg, M. Validation of analytical methods based on accuracy profiles. J Chromatogr A 2007, 1158, 174–183. [Google Scholar] [CrossRef] [PubMed]
- Hoffman, D.; Kringle, R. A total error approach for the validation of quantitative analytical methods. Pharm Res 2007, 24, 1157–1164. [Google Scholar] [CrossRef] [PubMed]
- Rozet, E.; Hubert, C.; Ceccato, A.; Dewe, W.; Ziemons, E.; Moonen, F.; Michail, K.; Wintersteiger, R.; Streel, B.; Boulanger, B.; et al. Using tolerance intervals in pre-study validation of analytical methods to predict in-study results. The fit-for-future-purpose concept. J Chromatogr A 2007, 1158, 126–137. [Google Scholar] [CrossRef] [PubMed]
- Food and Drug Administration. Guidance for Industry: Bioanalytical Method Validation. Available online: http://www.fda.gov/downloads/Drugs/GuidanceComplianceRegulatoryInformation/Guidances/UCM070107.pdf. (accessed on June 3, 2022).
- Rozet, E.; Ceccato, A.; Hubert, C.; Ziemons, E.; Oprean, R.; Rudaz, S.; Boulanger, B.; Hubert, P. Analysis of recent pharmaceutical regulatory documents on analytical method validation. J Chromatogr A 2007, 1158, 111–125. [Google Scholar] [CrossRef] [PubMed]
- Choong, E.; Uppugunduri, C.R.S.; Marino, D.; Kuntzinger, M.; Doffey-Lazeyras, F.; Lo Piccolo, R.; Chalandon, Y.; Peters, C.; Daali, Y.; Ansari, M. Therapeutic Drug Monitoring of Busulfan for the Management of Pediatric Patients: Cross-Validation of Methods and Long-Term Performance. Ther Drug Monit 2018, 40, 84–92. [Google Scholar] [CrossRef] [PubMed]
Figure 2.
Accuracy profiles of the analytes and their metabolites on 3 sets of analyses with a tolerance interval of 30% and a risk α at 5%. Mean biais obtained over 3 days for each concentration of QC (5 levels: L1, L2, M1, M2, H) are reported in red. Upper and lower β-expectation tolerance intervals (β = 95%, black lines) and acceptance limits (± 30%, green dotted lines) are also PRESENTED.
Figure 3.
Qualitative evaluation of matrix effect. Chromatograms of six different blank plasma extracts with post-column infusion of a CAL6 sample of each analyte (IVA 5 µg/mL, LUM 40 µg/mL, TEZ 10 µg/mL, ELX 15 µg/mL, IVA-M1 5 µg/mL, TEZ-M1 15 µg/mL, ELX-M23 15 µg/mL).
Figure 3.
Qualitative evaluation of matrix effect. Chromatograms of six different blank plasma extracts with post-column infusion of a CAL6 sample of each analyte (IVA 5 µg/mL, LUM 40 µg/mL, TEZ 10 µg/mL, ELX 15 µg/mL, IVA-M1 5 µg/mL, TEZ-M1 15 µg/mL, ELX-M23 15 µg/mL).
Figure 4.
Short-term stability testing of all analytes in plasma and whole blood. Quantification performed on three QC samples (low, medium, and high concentrations) over time (at 0, 2, 4, 6, 24, 48, and 72 hours) at room temperature (rt) and at +4°C. The mean deviation of the measured values from the nominal concentration at T0 for the three QC samples is shown. Upper and lower acceptance limits (± 15%, red dotted lines) are also presented.
Figure 5.
Freeze-thaw stability testing of all analytes in plasma. Quantification performed on three QC samples (low, medium, and high concentrations) over three freezing/thawing cycles. The mean deviation of the measured values from the nominal concentration at T0 for the three QC samples is shown. Upper and lower acceptance limits (± 15%, red dotted lines) are also presented.
Figure 6.
Inter-laboratory comparison. Results of plasma concentrations obtained from samples analyzed simultaneously in our laboratory (Laboratory A) and two European laboratories (namely, Laboratory B or C).
Figure 6.
Inter-laboratory comparison. Results of plasma concentrations obtained from samples analyzed simultaneously in our laboratory (Laboratory A) and two European laboratories (namely, Laboratory B or C).
Figure 7.
Chromatogram of a patient receiving IVA + LUM dual therapy, collected 3h after dosing. The plasma concentrations of IVA, LUM, and IVA-M1 were 0.7, 17.8, and 1.9 µg/mL, respectively. Corresponding internal standards are not shown. .
Figure 7.
Chromatogram of a patient receiving IVA + LUM dual therapy, collected 3h after dosing. The plasma concentrations of IVA, LUM, and IVA-M1 were 0.7, 17.8, and 1.9 µg/mL, respectively. Corresponding internal standards are not shown. .
Figure 8.
Chromatogram of a patient receiving IVA + TEZ + ELX triple therapy, collected 20h after dosing. The plasma concentrations of IVA, IVA-M1, TEZ, TEZ-M1, ELX, and ELX-M23 were 1.76, 2.80, 3.39, 3.26, 6.92, and 1.88 µg/mL, respectively. Corresponding internal standards are not shown.
Figure 8.
Chromatogram of a patient receiving IVA + TEZ + ELX triple therapy, collected 20h after dosing. The plasma concentrations of IVA, IVA-M1, TEZ, TEZ-M1, ELX, and ELX-M23 were 1.76, 2.80, 3.39, 3.26, 6.92, and 1.88 µg/mL, respectively. Corresponding internal standards are not shown.
Table 2.
Optimized MS/MS parameters of analytes and their respective metabolites and stable isotopically labelled IS .
Table 2.
Optimized MS/MS parameters of analytes and their respective metabolites and stable isotopically labelled IS .
| Compound |
Precursor ion (m/z) |
Product ion (m/z) |
CE [V] |
RT [min] |
Internal standard |
| Ivacaftor |
393.3 |
337.167 |
14 |
2.66 |
Ivacaftor-D4 |
| Lumacaftor |
453.3 |
413 |
26 |
2.57 |
Lumacaftor-D4 |
| Tezacaftor |
521.3 |
449.083 |
21 |
1.90 |
Tezacaftor-D4 |
| Elexacaftor |
598.3 |
422.333 |
26 |
3.36 |
Elexacaftor-D3 |
| Ivacaftor-M1 |
409.3 |
353.083 |
16 |
1.66 |
Voriconazole-D3 |
| Tezacaftor-M1 |
519.3 |
501.25 |
17 |
2.19 |
Tezacaftor-D4 |
| Elexacaftor-M23 |
584.3 |
422.583 |
25 |
2.89 |
Elexacaftor-D3 |
| Ivacaftor-D4 |
397.3 |
341.167 |
14 |
2.66 |
|
| Lumacaftor-D4 |
457.3 |
417 |
26 |
2.57 |
|
| Tezacaftor-D4 |
525.3 |
453.25 |
22 |
1.90 |
|
| Elexacaftor-D3 |
601.3 |
422.25 |
26 |
3.36 |
|
| Voriconazole-D3 |
353.1 |
284.2 |
15 |
1.40 |
|
Table 3.
Trueness and accuracy of tested analytes over the validated range.
Table 3.
Trueness and accuracy of tested analytes over the validated range.
| |
Precision |
| Compound |
Concentration [µg/mL] |
Truness (%) |
Repeatability (%) |
Intermediate precision (%) |
| Ivacaftor |
0.05 |
100.4 |
1.9 |
7.1 |
| 0.1 |
98.0 |
2.7 |
4.6 |
| 0.4 |
102.2 |
2.2 |
3.5 |
| 2.5 |
102.8 |
1.4 |
1.7 |
| 5 |
99.5 |
2.0 |
3.7 |
| Lumacaftor |
0.4 |
100.5 |
1.9 |
1.9 |
| 0.8 |
100.0 |
6.4 |
6.4 |
| 3.2 |
103.5 |
1.5 |
1.9 |
| 20 |
101.8 |
1.8 |
3.1 |
| 40 |
99.9 |
3.1 |
3.1 |
| Tezacaftor |
0.1 |
99.3 |
2.4 |
4.4 |
| 0.2 |
96.7 |
1.8 |
2.8 |
| 0.8 |
100.3 |
3.7 |
4.1 |
| 5 |
102.9 |
1.3 |
1.3 |
| 10 |
100.2 |
1.4 |
2.6 |
| Elexacaftor |
0.15 |
100.4 |
2.4 |
5.1 |
| 0.3 |
98.6 |
3.3 |
4.0 |
| 1.2 |
103.5 |
5.0 |
5.6 |
| 7.5 |
103.0 |
2.5 |
2.8 |
| 15 |
99.0 |
1.8 |
2.6 |
| Ivacaftor-M1 |
0.05 |
98.0 |
6.7 |
8.5 |
| 0.1 |
97.7 |
8.0 |
8.0 |
| 0.4 |
98.2 |
6.6 |
6.6 |
| 2.5 |
103.3 |
2.8 |
4.8 |
| 5 |
101.1 |
2.0 |
3.0 |
| Tezacaftor-M1 |
0.15 |
107.8 |
3.6 |
6.8 |
| 0.3 |
107.9 |
8.1 |
8.1 |
| 1.2 |
104.9 |
3.4 |
3.4 |
| 7.5 |
104.2 |
1.6 |
2.2 |
| 15 |
100.8 |
2.9 |
4.5 |
| Elexacaftor-M23 |
0.15 |
89.8 |
4.0 |
10.9 |
| 0.3 |
91.0 |
4.9 |
6.4 |
| 1.2 |
102.2 |
4.9 |
6.1 |
| 7.5 |
107.3 |
5.6 |
6.7 |
| 15 |
99.2 |
4.0 |
5.9 |
Table 1.
Final concentrations (µg/mL) of calibration solutions (CAL) and quality controls (QC) reported for the different analytes in plasma.
Table 1.
Final concentrations (µg/mL) of calibration solutions (CAL) and quality controls (QC) reported for the different analytes in plasma.
| Molecule |
CAL1 |
CAL2 |
CAL 3 |
CAL4 |
CAL5 |
CAL6 |
QC 1 |
QC 2 |
QC 3 |
| Ivacaftor |
0.05 |
0.10 |
0.20 |
0.50 |
1.25 |
5.00 |
0.15 |
0.75 |
3.75 |
| Lumacaftor |
0.40 |
0.80 |
1.60 |
4.00 |
10.00 |
40.00 |
1.20 |
6.00 |
30.00 |
| Tezacaftor |
0.10 |
0.20 |
0.40 |
1.00 |
2.50 |
10.00 |
0.30 |
1.50 |
7.50 |
| Elexacaftor |
0.15 |
0.30 |
0.60 |
3.00 |
7.50 |
15.00 |
0.45 |
2.25 |
11.25 |
| Ivacaftor-M1 |
0.05 |
0.10 |
0.20 |
1.00 |
2.50 |
5.00 |
0.15 |
0.75 |
3.75 |
| Tezacaftor-M1 |
0.15 |
0.30 |
0.60 |
3.00 |
7.50 |
15.00 |
0.45 |
2.25 |
11.25 |
| Elexacaftor-M23 |
0.15 |
0.30 |
0.60 |
3.00 |
7.50 |
15.00 |
0.45 |
2.25 |
11.25 |
|
Disclaimer/Publisher’s Note: The statements, opinions and data contained in all publications are solely those of the individual author(s) and contributor(s) and not of MDPI and/or the editor(s). MDPI and/or the editor(s) disclaim responsibility for any injury to people or property resulting from any ideas, methods, instructions or products referred to in the content. |
© 2025 by the authors. Licensee MDPI, Basel, Switzerland. This article is an open access article distributed under the terms and conditions of the Creative Commons Attribution (CC BY) license (https://creativecommons.org/licenses/by/4.0/).