
Submitted:
21 February 2025
Posted:
24 February 2025
You are already at the latest version
Abstract
We studied the effects of human blood coagulation on its antioxidant activity, as well as on the cellular secretion of immunoregulatory molecules in vitro. The coagulation process considerably decreased reactive oxygen species (ROS) activity induced by lipopolysaccharide (LPS) in blood samples. Human serum was found to have significantly greater antioxidant activity than plasma. Blood coagulation markedly reduced LPS-induced secretion of (TNF-α) by cells, without significantly affecting the secretion of interleukin-1 (IL-1), IL-6, IL-8 and C-reactive protein (CRP). Blood clotting led to an increase in the spontaneous release of IL-8 and both spontaneous and LPS-induced release of vascular endothelial growth factor (VEGF) by blood cells. A significant increase in procalcitonin levels was also observed in serum samples from blood stimulated with LPS. Thus, blood clotting favors the anti-oxidant and anti-inflammatory functions of immunoreactive blood cells.
Keywords:
blood coagulation
; whole blood immunoreactivity
; reactive oxygen species
; cytokines
; regeneration
1. Introduction
Homeostasis and the immune system are closely connected, relying on shared pathways and regulatory processes. This relationship is crucial for defending against injuries and infections, but when dysregulated, it can contribute to disease. Therefore, studying the control mechanisms of both blood coagulation and immune reactivity is of pivotal importance.
Blood coagulation’s main role is to maintain consistent blood flow to the tissues. Additionally, it substantially enhances interactions between platelets and leukocytes, crucial for blocking pathogen invasion [1]. Platelet activation is accompanied by the release of numerous immunoactive and growth factors, such as interleukin-1 (IL-1), platelet-derived growth factor (PDGF), insulin-like growth factor-1 (IGF-1), vascular endothelial growth factor (VEGF), platelet-derived angiogenic factor (PDAF), transforming growth factor- beta (TGF-β), chemokines and prostaglandins. These factors contribute to linking blood coagulation with regeneration and immune functions [1,2,3] Additionally, activated platelets express immunoactive co-stimulatory molecules, such as CD40L (CD154), further linking blood clotting with the activation of innate and adaptive immune cells [1]. To control excessive inflammatory responses, large amounts of biologically active interleukin-1 receptor antagonist (IL-1RA) and other cytokines (IL-4, IL-6, IL-10, IL-13, Il-17, IL-22) have been shown to be released during the blood coagulation process [4,5]. This suggests that coagulation could regulate both local and systemic immune responses to inflammatory stimuli and create the necessary conditions for regenerative processes, even in the presence of infection [6].
In this study, we examined the early, direct effects of the human blood coagulation process on the immunobiological reactivity of blood cells within the first few hours after clot formation begins.
2. Materials and Methods
The study was approved by the local ethical committee of Petrovsky National Research Centre of Surgery (protocol № 9, 2024). All blood donors were informed about the use of their blood for research purposes.
2.1. Getting Whole Blood Samples
Venous blood samples were collected from 23 healthy donors (aged 25–45) into standard cold vacutainer tubes, either with or without heparin. The blood was then split into samples of 1 and 2 ml and stored on ice for no more than 2 h before use.
2.2. Measurements of Reactive Oxygen Species (ROS)
Venous blood samples, 1 ml each, with or without heparin, were incubated at 37.5°C for a half-hour. Lipopolysaccharide (LPS) from Salmonella typhi (50 μL, Pyrogenal, Medgamal, Russia) was then added to the blood at a final concentration of 1 µg/mL, or saline was added, as a control. All samples were treated with a 50 μL aliquot of 1M Luminol solution (Sigma-Aldrich) at the same time. Both LPS and control samples underwent a two-hour incubation at 37.5 C. ROS activity in blood samples reached a steady state for this time before decreasing. ROS concentrations were determined in samples based on the chemiluminescence intensity measured using a Lum-1200 luminometer (LLC DISoft, Moscow, Russia), according to the manufacturer’s instructions. The PowerGraph software package (DISoft Company, Moscow, Russia) was used for data acquisition, signal logging, real-time visualization and processing, as well as for data editing, mathematical processing, and analysis.
Blood samples were incubated at 37.5°C for 3 hours, with or without heparin, to get plasma and serum, respectively. Centrifugation at 2000 g for 20 minutes was used to separate liquids from cells. Saline solution was ozonized by passing it through a medical ozone generator (Medozons-BM, Nizhny Novgorod, Russia) and used immediately. Blood plasma or serum samples (1 ml) were incubated with ozonized saline (1 ml) or 3% hydrogen peroxide (5 μL), as well as a 1M Luminol solution at 37.5°C for 2 h. ROS levels in samples were measured, as described above.
2.3. Assaying Bioactive Molecules
Blood samples (2 mL each) were incubated for 3 or 18 h at 37 C with or without heparin in the presence or absence of LPS. Concentrations of IL-1, IL-6, IL-8, TNF-α, CRP, procalcitonin, and VEGF were measured in serum and plasma samples using commercially available ELISA kits from Vector-Best (Novosibirsk, Russia), following the manufacturer’s instructions.
2.4. Statistical Analysis
Significant differences within paired blood samples were analyzed using the paired Student’s t-test. Data in the figures are presented as means + their errors. Differences were considered significant at P < 0.05.
3. Results
3.1. Antioxidant Effect of Blood Clotting
Changes in ROS production are among the most immediate responses of blood cells to environmental stimuli. ROS [*O2− (superoxide), H2O2 (hydrogen peroxide), *OH- (hydroxyl radical), 1O2 (singlet oxygen), and α-O (alpha-oxygen)] trigger chain reactions that can lead to DNA/RNA damage, protein oxidation, and lipid (per)oxidation [7]. Infection is well known to be a potent stimulus for ROS production by immune cells. Thrombosis with associated inflammation (thromboinflammation) also includes leukocytes, platelets, and endothelial cells, leading to the production of ROS in the bloodstream. In our experiments, we used LPS-treated blood cells to model the effects of an infectious agent that typically accompanies blood vessel trauma. It was of interest how the process of blood coagulation, already at the earliest stages of its development, can influence the ROS secretion by blood cells. Figure 1 demonstrates that LPS-induced ROS activity was significantly reduced (6-fold lower) in samples with clotted blood compared to those with non-clotted blood.
This phenomenon can be explained, at least in part, by the increased antioxidant activity of serum. Figure 2 and Figure 3 (A,B) shows that plasma and serum both could reduce ROS activity upon incubation with ozonized saline or hydrogen peroxide. Notably, serum antioxidant activity across all dilution series significantly exceeded plasma levels. These data suggest that the blood coagulation process makes up a powerful stimulus for the secretion of antioxidant biomolecules by blood cells.
3.1.1. Anti-Inflammatory Effect of Blood Clotting
IL-1, IL-6, IL-8, and TNF-α are key mediators that trigger inflammation [8]. As expected, incubation of blood with LPS resulted in a dramatic enhancement of cellular IL-1 secretion. Figure 4 demonstrates that IL-1 levels in sera (in the samples without heparin) after both 3 and 18 hours of blood incubation were like those observed in plasmas (in samples with heparin). In control samples without LPS low IL-1 concentrations (<30 pg/ml) were detected, which were nearly identical in serum and plasma samples.
In the absence of LPS blood stimulation, both plasma and serum samples exhibited low IL-6 concentrations (<50 pg/ml). When blood was incubated with LPS, IL-6 secretion increased dramatically. No significant differences were observed between IL-6 levels in plasma and serum (Figure 5).
Figure 6 illustrates that serum samples had significantly greater IL-8 levels compared to plasma samples without LPS blood stimulation. This implies that the blood coagulation process directly stimulates the release of IL-8, a chemoattractant cytokine crucial for attracting immune cells, primarily neutrophils, to injured tissues.
LPS moderately increased IL-8 release from blood cells; plasma and serum IL-8 levels were similar (Figure 7).
The TNF-α content in blood samples without LPS did not exceed 100 pg/ml. As expected, LPS dramatically increased TNF-α secretion by blood cells. After 18 hours of incubation, TNF-α concentrations in serum samples were significantly lower than those in plasma samples. Along with that, after 3 hours of incubation of blood with LPS, similar levels of this key pro-inflammatory cytokine were observed in both serum and plasma samples (Figure 8), suggesting that blood coagulation acquired substantial anti-inflammatory potential only 18 hours after coagulation began.
-reactive protein (CRP) and procalcitonin are well-established markers of systemic inflammation. The CRP content in blood samples without LPS did not exceed 1.5 mg/L. In our experiments, we observed significant increases in CRP secretion only after 18 hours of incubation of blood with LPS, with no stable significant differences noted between serum and plasma samples (Figure 9). However, in some experiments, there was a tendency for higher CRP concentrations in serum compared to plasma samples.
We also measured procalcitonin levels and found that, after 18 hours of blood incubation with LPS, the concentrations of this peptide precursor of calcitonin and marker of bacterial infection were threefold higher than those in plasma samples (Figure 10). This data suggests that blood coagulation enhances procalcitonin secretion by blood cells.
The primary function of VEGF is to promote the formation of new blood vessels after trauma and facilitate collateral blood supply (i.e., the development of new vessels when existing ones are blocked). Our experiments revealed that VEGF concentrations in intact serum samples were significantly higher than those observed in intact plasma samples, as early as 1 hour after incubation (Figure 11). These data suggest that the blood coagulation process itself constitutes a powerful stimulus for VEGF secretion by blood cells.
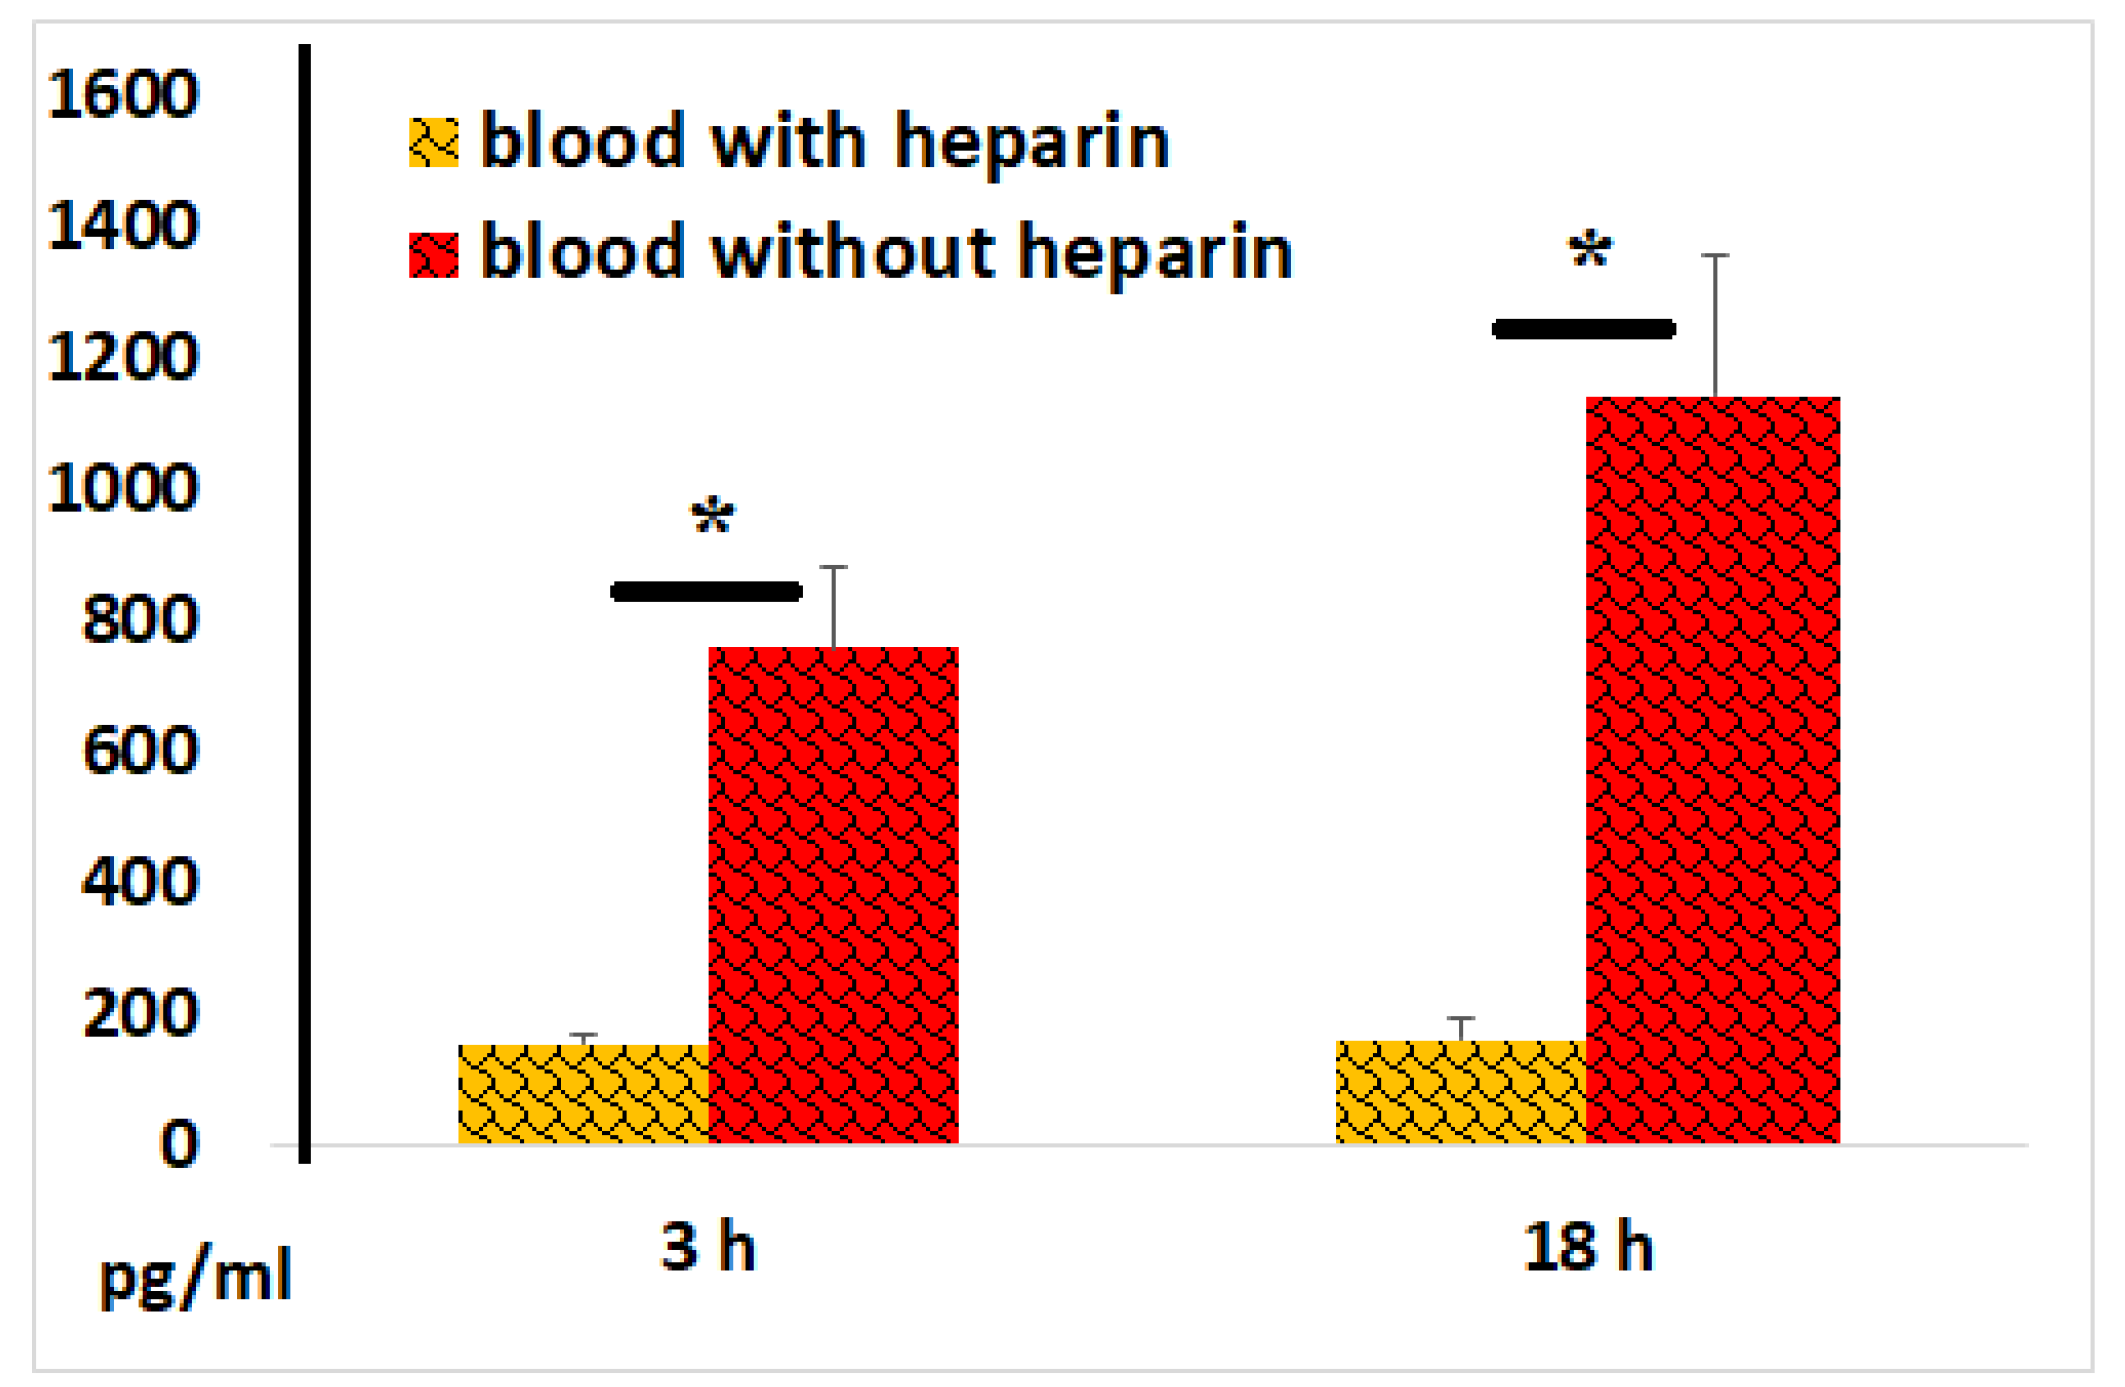
Statistically significantly higher levels of VEGF were detected in serum samples compared to plasma samples after 3 and 18 hours of blood incubation with LPS (Figure 12). Notably, LPS exhibited only a relatively weak stimulatory effect on cellular VEGF secretion, highlighting the powerful regenerative potential of the blood coagulation process.
4. Discussion
Blood clotting is essential for maintaining the organism’s integrity by forming a barrier that prevents blood from leaking out of the bloodstream. Normally, when blood vessels are damaged, endothelial cells and blood cells—primarily monocytes and macrophages—upregulate the production of the transmembrane protein tissue factor (TF). The interaction between TF and circulating blood-coagulation factors triggers the coagulation cascade, leading to fibrin clot formation, effectively linking blood clotting to inflammation [2,9]. Furthermore, blood clotting has a twofold purpose, occurring simultaneously or sequentially: (i) preventing pathogens from spreading within the body and (ii) providing the necessary conditions for tissue repair.
ROS are critical for protecting against microbial and cancer dangers [7]. On the other hand, they are primarily responsible for the inflammation-driven damages to cells and tissues, thus accelerating body aging and causing diseases [10]. Therefore, the ROS generation and activity is strictly controlled in the body. ROS are pivotal in promoting the expression of genes encoding antioxidant enzymes (such as superoxide dismutase, glutathione peroxidase, glutathione S-transferase, catalase, haem oxygenase-1, NADPH–quinone oxidoreductase, heat shock proteins etc) that protect against oxygen-related cellular damage [10]. In this report, we presented evidence that blood coagulation may lead to decreased ROS activity in blood samples and that this effect may be mediated, at least in part, by increased cellular secretion of antioxidant molecules. These biomolecules are primarily needed to mitigate ROS-induced damage to healthy tissues next to the blood clot.
Platelets are known to interact with immune cells, with about 3% of lymphocytes physically linked to platelets. Platelet activation increases their association with lymphocytes [1,11], while lymphocyte activation also promotes direct platelet-lymphocyte interactions [12,13]. This platelet-lymphocyte cross-talk stimulates the generation of pro-inflammatory Th1 and Th17 cells [14,15], establishing an important regulatory mechanism in thrombosis, inflammation, immunity, and atherosclerosis [12,13,16]. Our data demonstrated that blood clotting significantly enhanced IL-8 and VEGF secretion by blood cells in the absence of LPS. This suggests that the coagulation process, even in its early stages, attracts immune cells—primarily neutrophils—to sites of tissue damage and helps prevent ischemic tissue damage.
Injury to blood vessels raises the risk of microbial pathogens entering the body. LPS, a mandatory component in all gram-negative bacteria, strongly activates innate immunity. The binding of LPS by TLR4 and CD14 on immune cells also determine the potency and Th1/Th2 polarisation of adaptive immune reactions [17]. Blood clots have been shown previously to effectively bind LPS, thus influencing LPS-dependent immune processes within the clot [18]. We designed experiments where whole blood was incubated with LPS to model the simultaneous effects of an infectious agent and blood coagulation on immunogenesis. We stress that this experimental model closely resembles natural conditions, with no synthetic culture medium used, except for heparin, which was added to inhibit blood coagulation. With this model, we examined how coagulation impacts the release of pro-inflammatory cytokines IL-1, IL-6, IL-8, and TNF-α, which can be involved in both protective immune responses and severe life-threatening conditions caused by immune dysregulation. The selection of these cytokines was also based on their known pro-coagulant effects. Indeed, IL-1 upregulates TF expression in endothelial cells, monocytes, and other blood cells; IL-6 stimulates fibrinogen production; IL-8 recruits neutrophils to sites of tissue damage, activating their pro-coagulant properties; and TNF-α activates platelets and promotes their aggregation [8,19]. Taken together, the cytokines selected and analysed in our study can be considered key players in the omnidirectional interactions between the homeostasis system and the immune system, both in normal and pathological conditions.
Our data showed that LPS stimulated the production of all pro-inflammatory cytokines studied, both in the presence and absence of heparin. Cytokine production was detected as early as within the initial 3 hours of LPS exposure, reaching its peak at 18 hours. With these conditions, blood coagulation substantially reduced TNF-α production from cells stimulated by LPS, while levels of IL-1, IL-6, IL-8, and CRP were unaffected. Previously, it was shown that the formation of a blood clot stimulates the secretion of various factors by blood cells, including IL-10 and IL-13, which have strong anti-inflammatory properties [4]. In light of the available data, we envisage that even in the presence of an infectious agent, the blood coagulation-mediated immunoregulation is primarily aimed at containing inflammatory cytodestructive processes and creating the necessary conditions for the development of regenerative processes. To support this assumption, our experiments also revealed that blood coagulation enhanced both spontaneous and LPS-induced VEGF secretion by blood cells, suggesting that increased VEGF secretion, along with reduced ROS levels in situ, could promote neoangiogenesis at tissue damage sites, favoring tissue regeneration.
Interestingly, sera in blood samples exposed to LPS showed higher procalcitonin levels than plasmas. Elevated procalcitonin in the blood is known to be an indicator of bacterial infection in the body. These observations supports the idea that bacterial infections, which cause more severe blood vessel damage compared to viral infections, may more effectively activate blood coagulation, subsequently stimulating procalcitonin secretion by blood cells.
5. Conclusions
The data from this study suggests that the blood coagulation process not only forms a barrier preventing blood from leaving the vascular channel, but also favors antioxidant, anti-inflammatory and regenerative cellular reactivities essential to repair damaged tissue structures. Bacterial product, such a LPS, may be an additional mobilizing factor in this regard.
Consent to participate: Not applicable
Consent for publication: Not applicable
Data availability: The authors do not have permission to share data.
Declaration of competing interest: The authors declare that they have no known competing financial interests or personal relationships that could have appeared to influence the work reported in this paper.
CRediT authorship contribution statement: Victor I. Seledtsov: Conceptualization, Methodology, Project Administration, Data Interpretation, Supervision, and Writing - Original Draft. Anatoly A. Pyshenko, Tatyana Ya. Lyubavskaya, Irina A. Seledtsova: Investigations, Statistical Analysis. Alexei von Delwig: Data Interpretation, Writing - Reviewing and Editing.
Funding
This research was supported by grants FURG-2023-0074 and FUGR -2023-77 from the Ministry of Science and Higher Education of the Russian Federation.
References
- Łukasik ZM, Makowski M, Makowska JS. From blood coagulation to innate and adaptive immunity: the role of platelets in the physiology and pathology of autoimmune disorders. Rheumatol Int. 2018 Jun;38(6):959-974. [CrossRef] [PubMed]
- Antoniak S. The coagulation system in host defense. Res Pract Thromb Haemost. 2018 May 24;2(3):549-557. [CrossRef] [PubMed]
- Xiong Z, Wang Q, Li W, Huang L, Zhang J, Zhu J, Xie B, Wang S, Kuang H, Lin X, Lee C, Kumar A, Li X. Corrigendum: platelet-derived growth factor-D activates complement system to propagate macrophage polarization and neovascularization. Front Cell Dev Biol. 2022 Feb 8;10:848292. doi: 10.3389/fcell.2022.848292. Erratum for: Front Cell Dev Biol. 2021 Jun 02;9:686886. [CrossRef] [PubMed]
- Vitali M, Ometti M, Drossinos A, Pironti P, Santoleri L, Salini V. Autologous conditioned serum: clinical and functional results using a novel disease modifying agent for the management of knee osteoarthritis. J Drug Assess. 2020 Mar 25;9(1):43-51. [CrossRef] [PubMed]
- Suárez-Álvarez B, Liapis H, Anders HJ. Links between coagulation, inflammation, regeneration, and fibrosis in kidney pathology. Lab Invest. 2016 Apr;96(4):378-90. [CrossRef] [PubMed]
- Ludwig N, Hilger A, Zarbock A, Rossaint J. Platelets at the crossroads of pro-inflammatory and resolution pathways during inflammation. Cells. 2022 Jun 17;11(12):1957. [CrossRef] [PubMed]
- Seledtsov VI, von Delwig AA. Oxygen therapy in traditional and immunotherapeutic treatment protocols of cancer patients: current reality and future prospects. Expert Rev Anticancer Ther. 2022 Jun;22(6):575-581. [CrossRef] [PubMed]
- Bester J, Matshailwe C, Pretorius E. Simultaneous presence of hypercoagulation and increased clot lysis time due to IL-1β, IL-6 and IL-8. Cytokine. 2018 Oct; 110:237-242. [CrossRef] [PubMed]
- Foley JH, Conway EM. Cross talk pathways between coagulation and inflammation. Circ Res. 2016 Apr 29;118(9):1392-408. [CrossRef] [PubMed]
- Seledtsov VI, von Delwig AA. Therapeutic stimulation of glycolytic ATP production for treating ROS-mediated cellular senescence. Metabolites. 2022 Nov 23;12(12):1160. [CrossRef] [PubMed]
- Gros A, Ollivier V, Ho-Tin-Noé B. Platelets in inflammation: regulation of leukocyte activities and vascular repair. Front Immunol. 2015 Jan 6; 5:678. [CrossRef] [PubMed]
- Li N, Ji Q, Hjemdahl P. Platelet-lymphocyte conjugation differs between lymphocyte subpopulations. J Thromb Haemost. 2006 Apr;4(4):874-81. [CrossRef]
- Zamora C, Cantó E, Nieto JC, Ortiz MA, Diaz-Torné C, Diaz-Lopez C, Llobet JM, Juarez C, Vidal S. Functional consequences of platelet binding to T lymphocytes in inflammation. J Leukoc Biol. 2013 Sep;94(3):521-9. [CrossRef]
- Gerdes N, Zhu L, Ersoy M, Hermansson A, Hjemdahl P, Hu H, Hansson GK, Li N. Platelets regulate CD4⁺ T-cell differentiation via multiple chemokines in humans. Thromb Haemost. 2011 Aug;106(2):353-62. [CrossRef] [PubMed]
- Zhu L, Huang Z, Stålesen R, Hansson GK, Li N. Platelets provoke distinct dynamics of immune responses by differentially regulating CD4+ T-cell proliferation. J Thromb Haemost. 2014 Jul;12(7):1156-65. [CrossRef] [PubMed]
- Li, N. Platelet-lymphocyte cross-talk. J Leukoc Biol. 2008 May;83(5):1069-78. [CrossRef] [PubMed]
- Ciesielska A, Matyjek M, Kwiatkowska K. TLR4 and CD14 trafficking and its influence on LPS-induced pro-inflammatory signaling. Cell Mol Life Sci. 2021 Feb;78(4):1233-1261. [CrossRef] [PubMed]
- Armstrong MT, Rickles FR, Armstrong PB. Capture of lipopolysaccharide (endotoxin) by the blood clot: a comparative study. PLoS One. 2013 Nov 25;8(11): e80192. [CrossRef] [PubMed]
- Wilhelm G, Mertowska P, Mertowski S, Przysucha A, Strużyna J, Grywalska E, Torres K. The Crossroads of the Coagulation System and the Immune System: Interactions and Connections. Int J Mol Sci. 2023 Aug 8;24(16):12563. [CrossRef] [PubMed]
Figure 1.
Effect of blood coagulation on ROS activity in blood samples. ROS activity (total number kilopockets in photon mode, Kpps) in blood samples incubated with or without heparin in the absence or presence of LPS. The results from identical experiments with blood samples of 4 donors are shown. * < 0.05.
Figure 2.
Chemiluminescence intensity of ozonized saline diluted 2-fold with physiological solution (1), plasma (2) or serum (3).
Figure 2.
Chemiluminescence intensity of ozonized saline diluted 2-fold with physiological solution (1), plasma (2) or serum (3).

Figure 3.
(A,B). ROS activity (Kpps) induced by ozonized saline solution (A) or hydrogen peroxide (B) in plasma or serum samples. Control values for ozonized saline and hydrogen peroxide solutions in the absence of plasma/serum were 2.850 and 61.870 Kpps, respectively. The representative results from identical experiments with samples of 4 donors are shown.
Figure 4.
IL-1 concentrations in plasma and serum samples following 3 and 18 hours of their incubation with LPS. The results from identical experiments with blood samples of 5 donors are shown.
Figure 4.
IL-1 concentrations in plasma and serum samples following 3 and 18 hours of their incubation with LPS. The results from identical experiments with blood samples of 5 donors are shown.
Figure 5.
IL-6 concentrations in plasma and serum samples following 3 and 18 hours of incubation of whole blood with LPS. The results from identical experiments with samples of 5 donors are shown.
Figure 5.
IL-6 concentrations in plasma and serum samples following 3 and 18 hours of incubation of whole blood with LPS. The results from identical experiments with samples of 5 donors are shown.
Figure 6.
IL-8 concentrations in plasma and serum samples, as determined at 1, 2, and 3 hours after blood incubation onset. The representative results from identical experiments with samples of 2 donors are shown.
Figure 6.
IL-8 concentrations in plasma and serum samples, as determined at 1, 2, and 3 hours after blood incubation onset. The representative results from identical experiments with samples of 2 donors are shown.
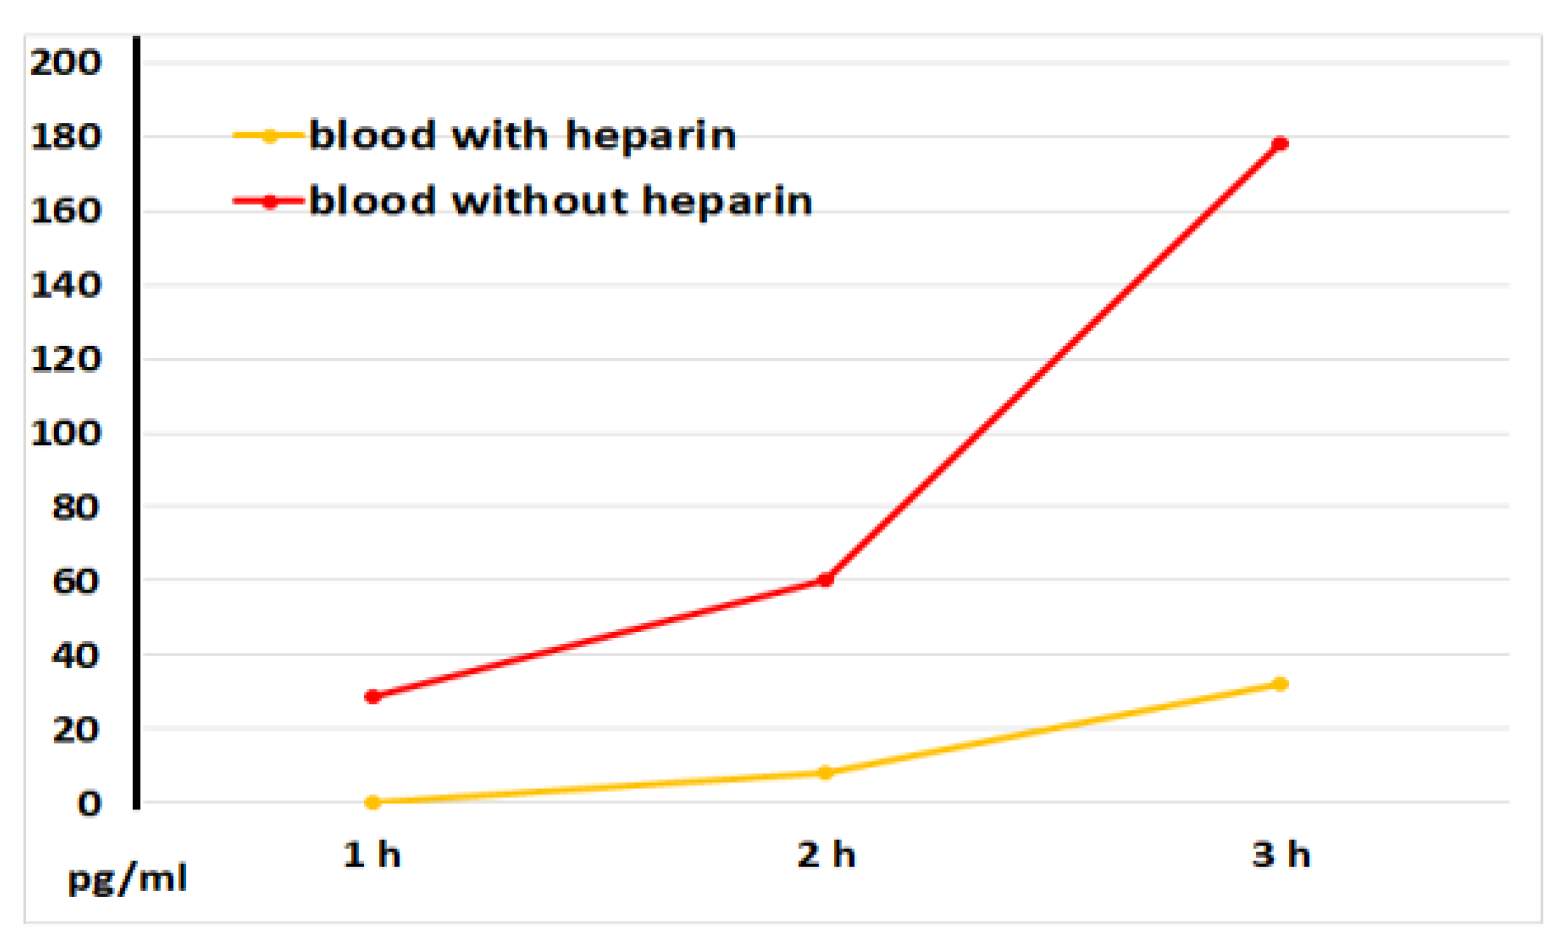
Figure 7.
IL-8 concentrations in plasma and serum samples following 3 and 18 hours of incubation of whole blood with LPS. The results from identical experiments with samples of 5 donors are shown.
Figure 7.
IL-8 concentrations in plasma and serum samples following 3 and 18 hours of incubation of whole blood with LPS. The results from identical experiments with samples of 5 donors are shown.
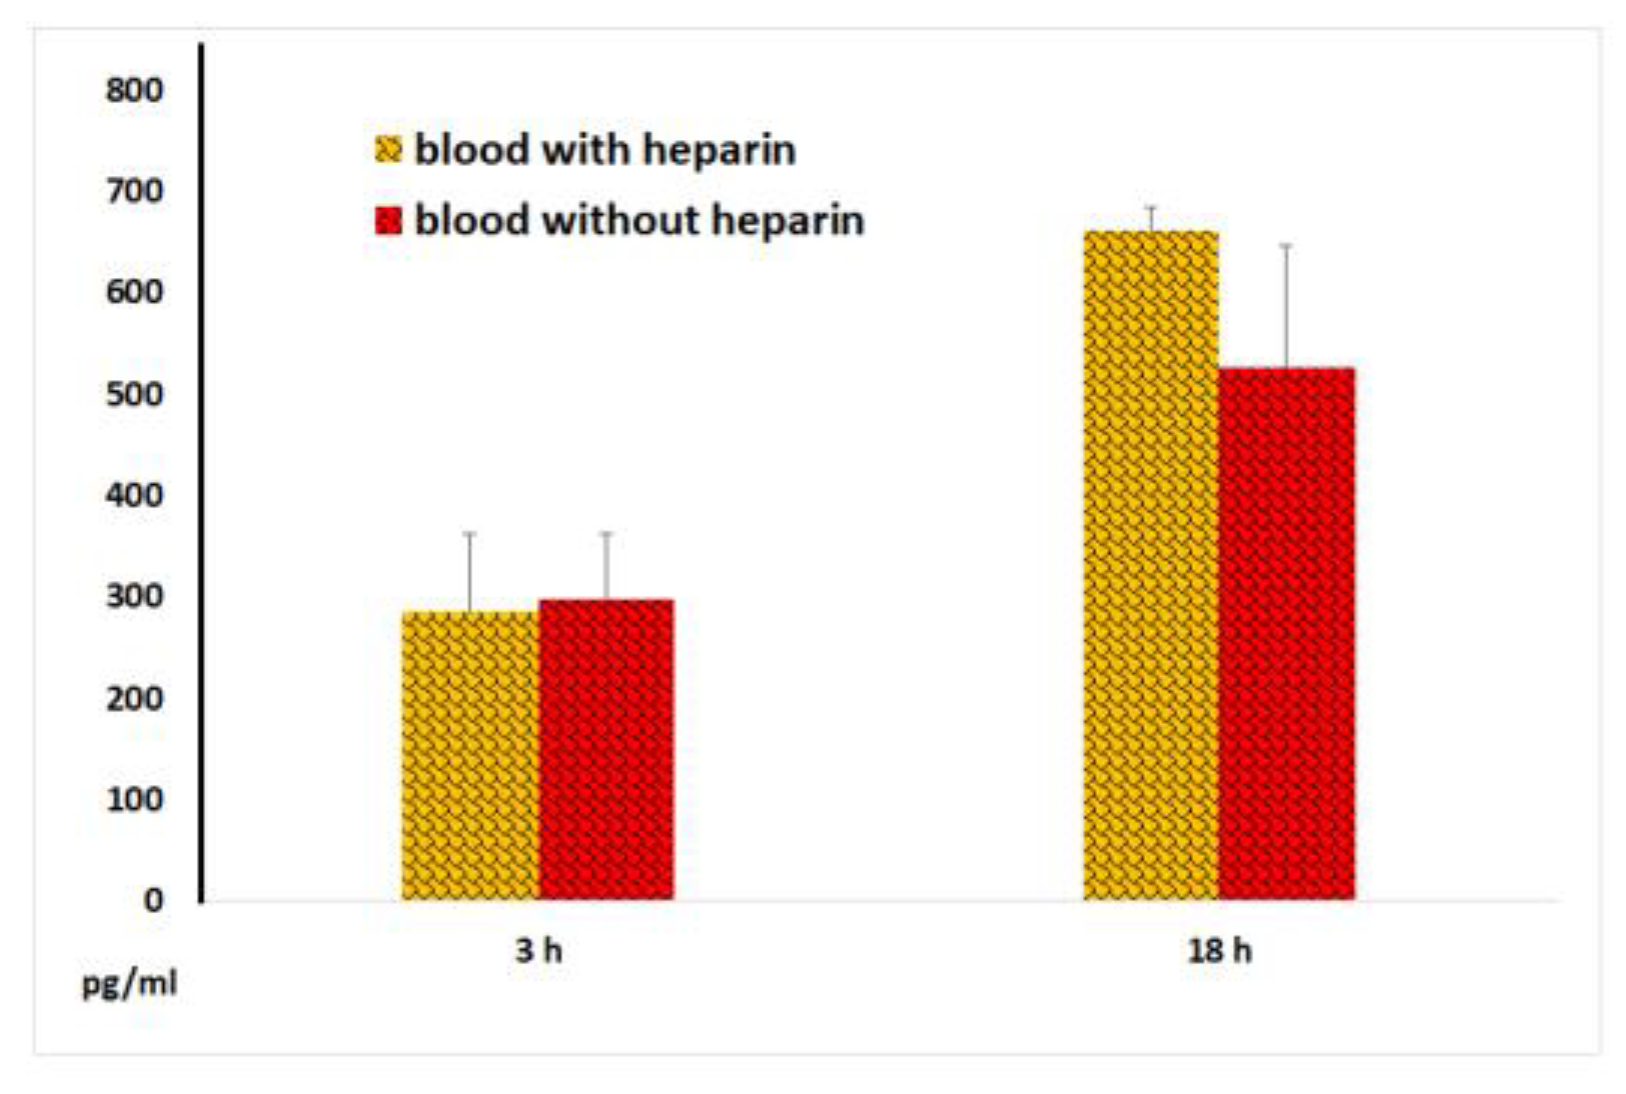
Figure 8.
TNF-α concentrations in plasma and serum samples following 3 and 18 hours of incubation of whole blood with LPS. The results from identical experiments with samples of 7 donors are shown. *P < 0.02.
Figure 8.
TNF-α concentrations in plasma and serum samples following 3 and 18 hours of incubation of whole blood with LPS. The results from identical experiments with samples of 7 donors are shown. *P < 0.02.
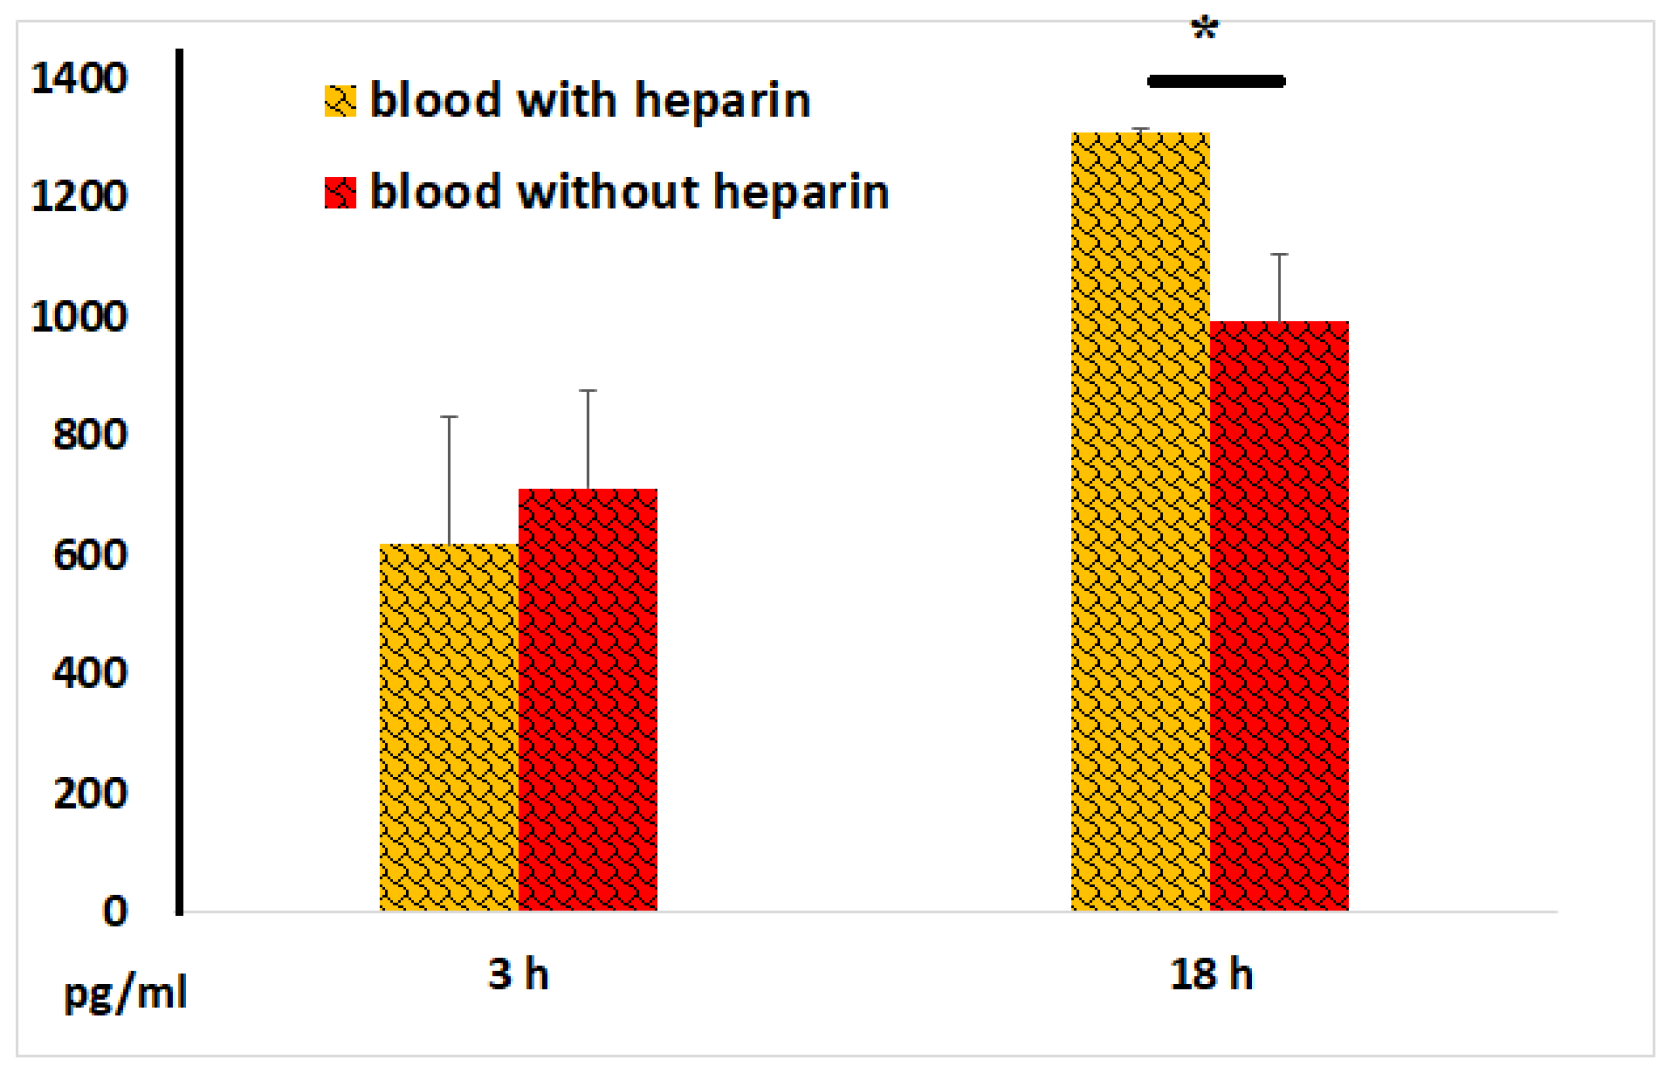
Figure 9.
CRP concentrations in plasma and serum samples following 3 and 18 hours of incubation of whole blood with LPS. The results from identical experiments with samples of 7 donors are shown.
Figure 9.
CRP concentrations in plasma and serum samples following 3 and 18 hours of incubation of whole blood with LPS. The results from identical experiments with samples of 7 donors are shown.
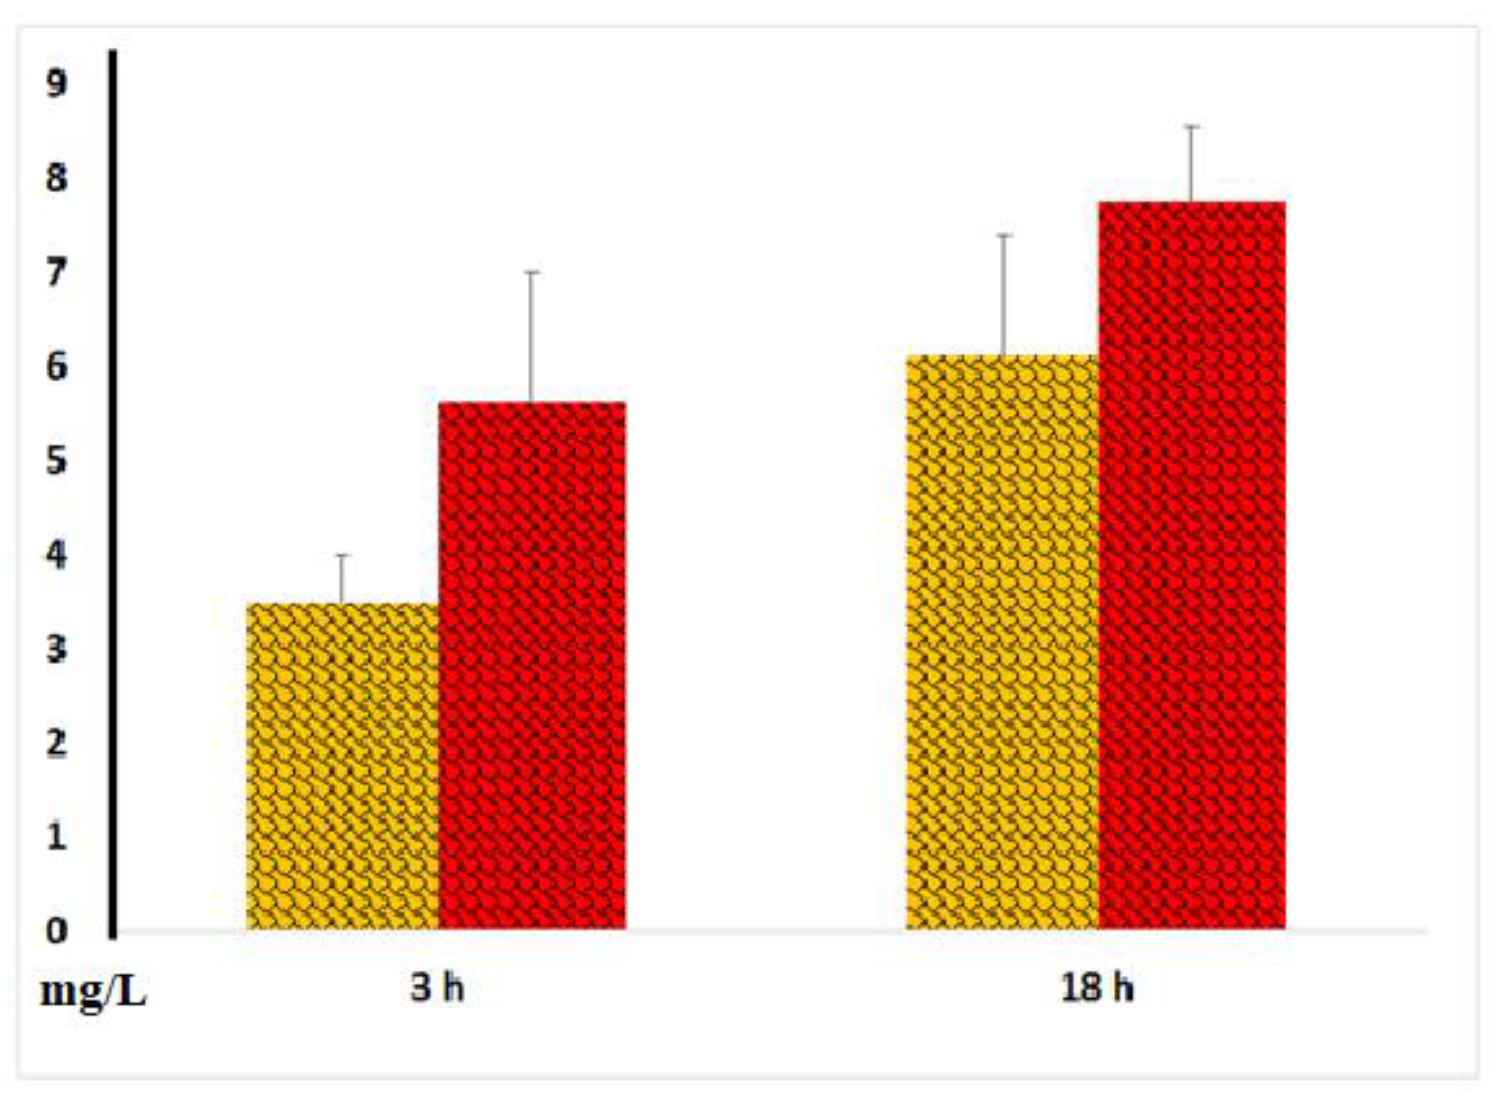
Figure 10.
Procalcitonin concentrations in plasma and serum samples following 3 and 18 hours of incubation of whole blood with LPS. The results from identical experiments with samples of 7 donors are shown. *p < 0.05.
Figure 10.
Procalcitonin concentrations in plasma and serum samples following 3 and 18 hours of incubation of whole blood with LPS. The results from identical experiments with samples of 7 donors are shown. *p < 0.05.
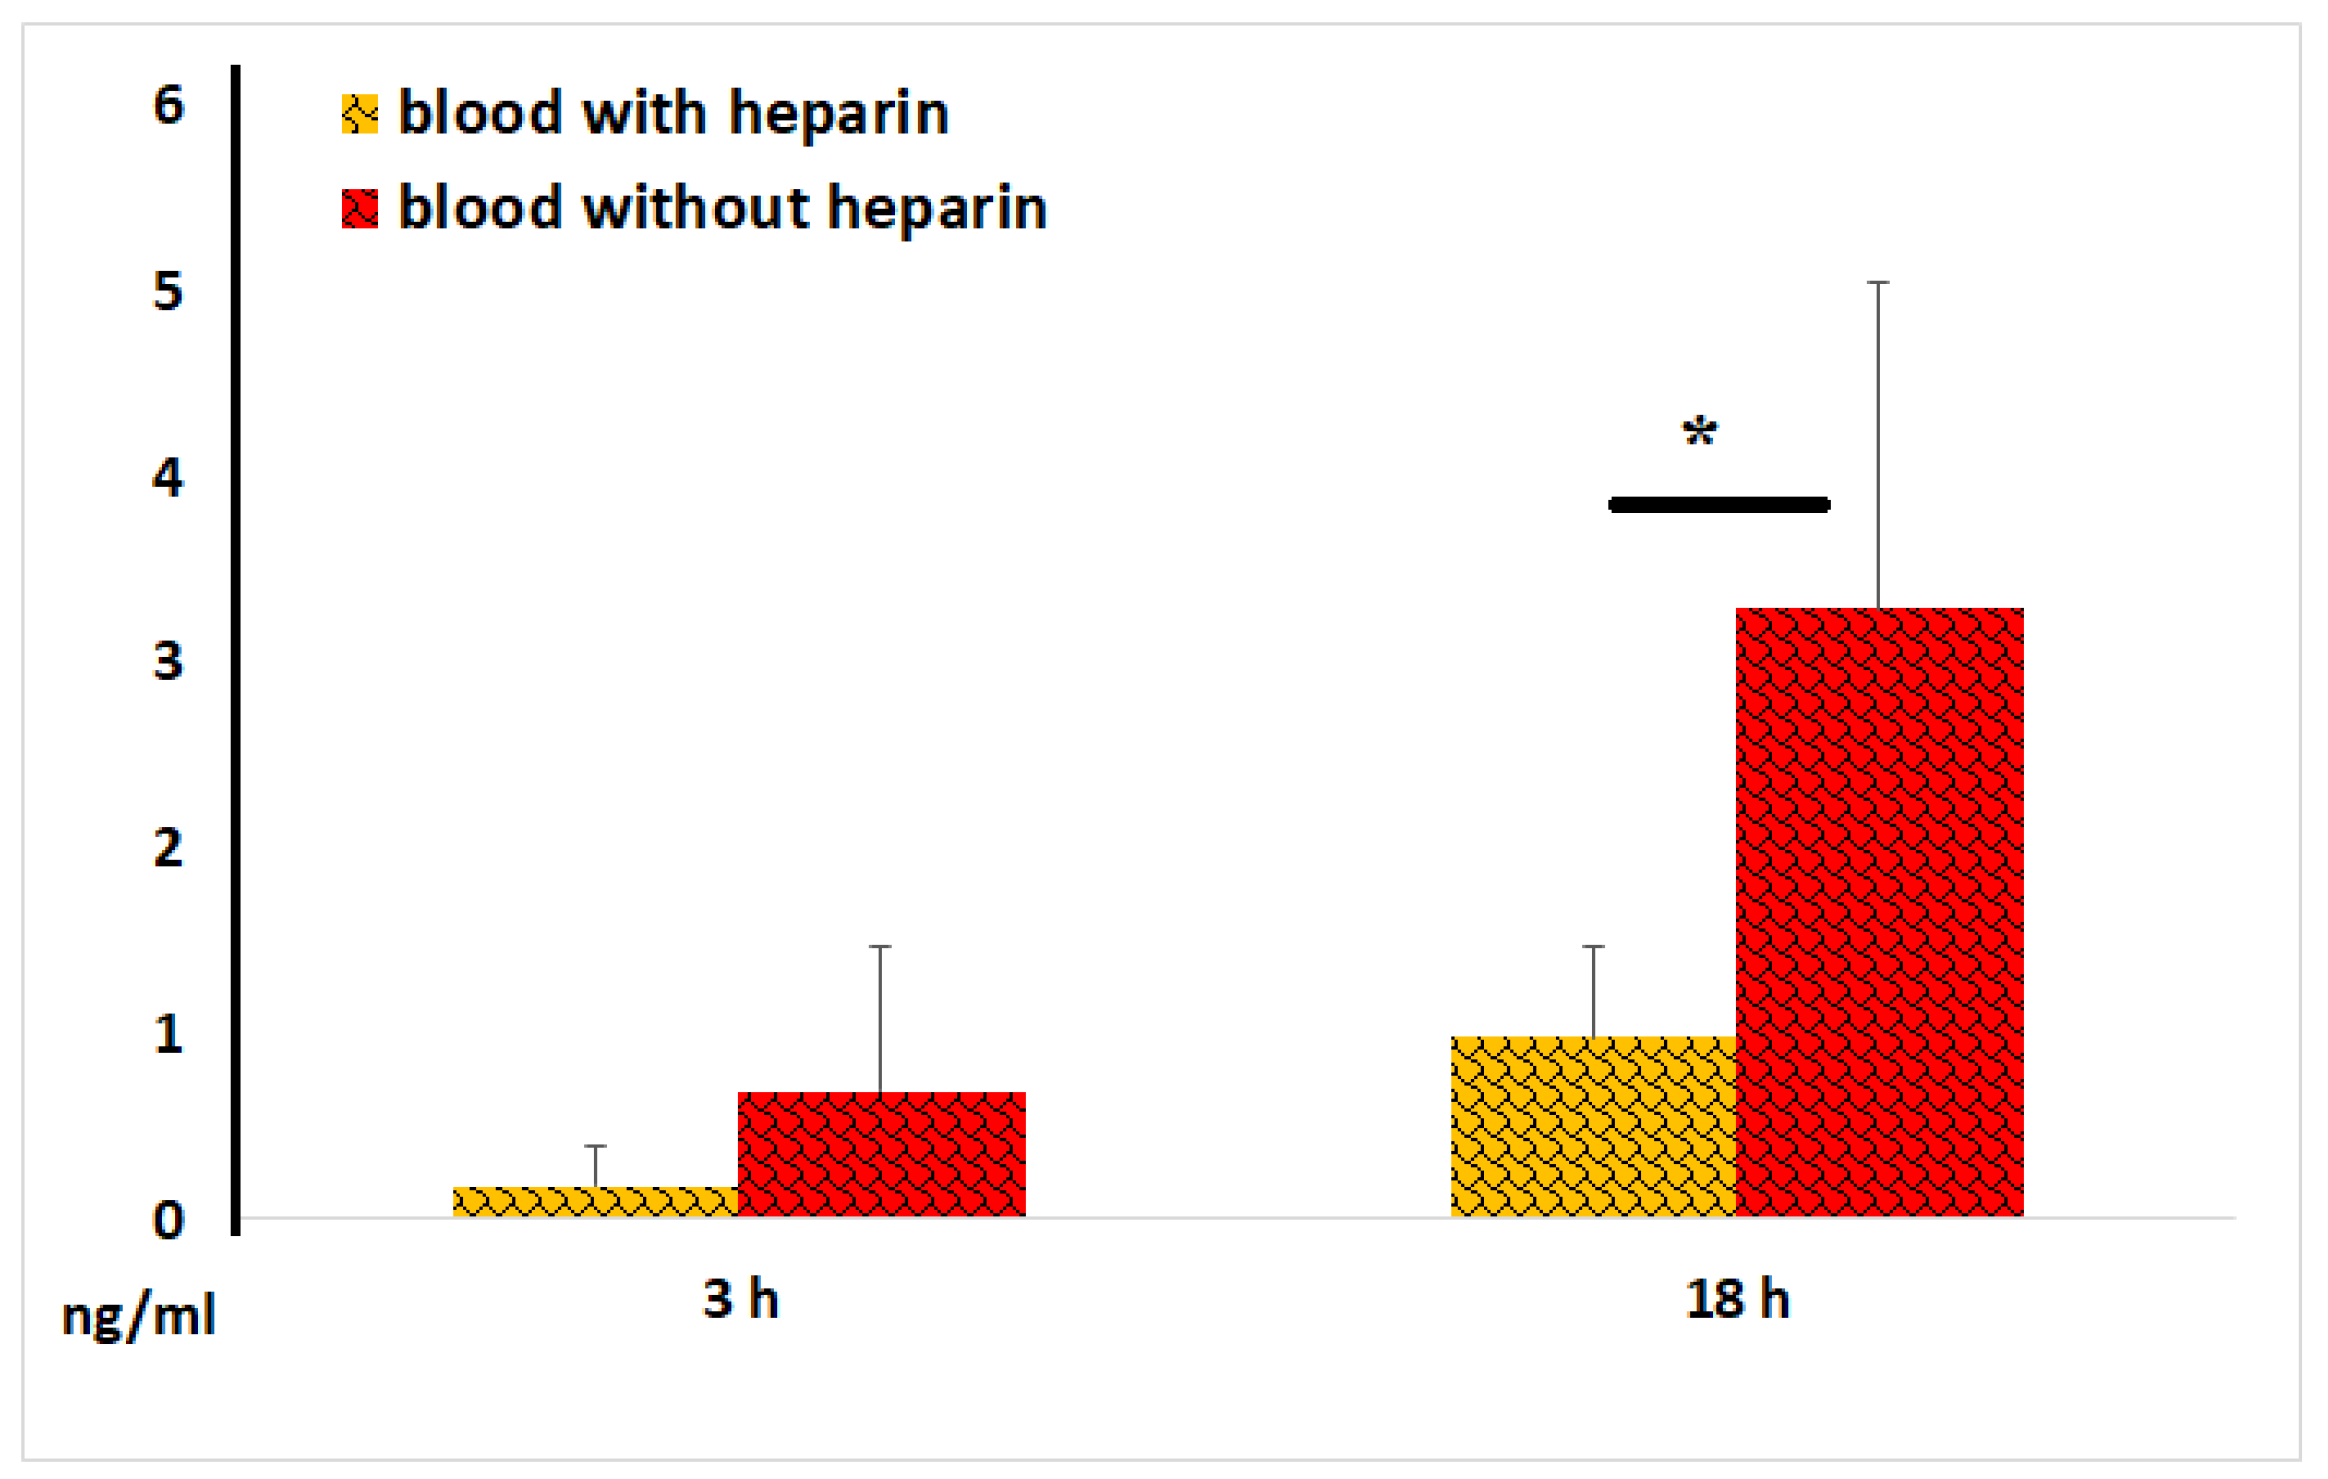
Figure 11.
VEGF concentrations in plasma and serum samples during the first hours of blood incubation. The representative results from identical experiments with 2 samples of 2 donors are shown.
Figure 11.
VEGF concentrations in plasma and serum samples during the first hours of blood incubation. The representative results from identical experiments with 2 samples of 2 donors are shown.
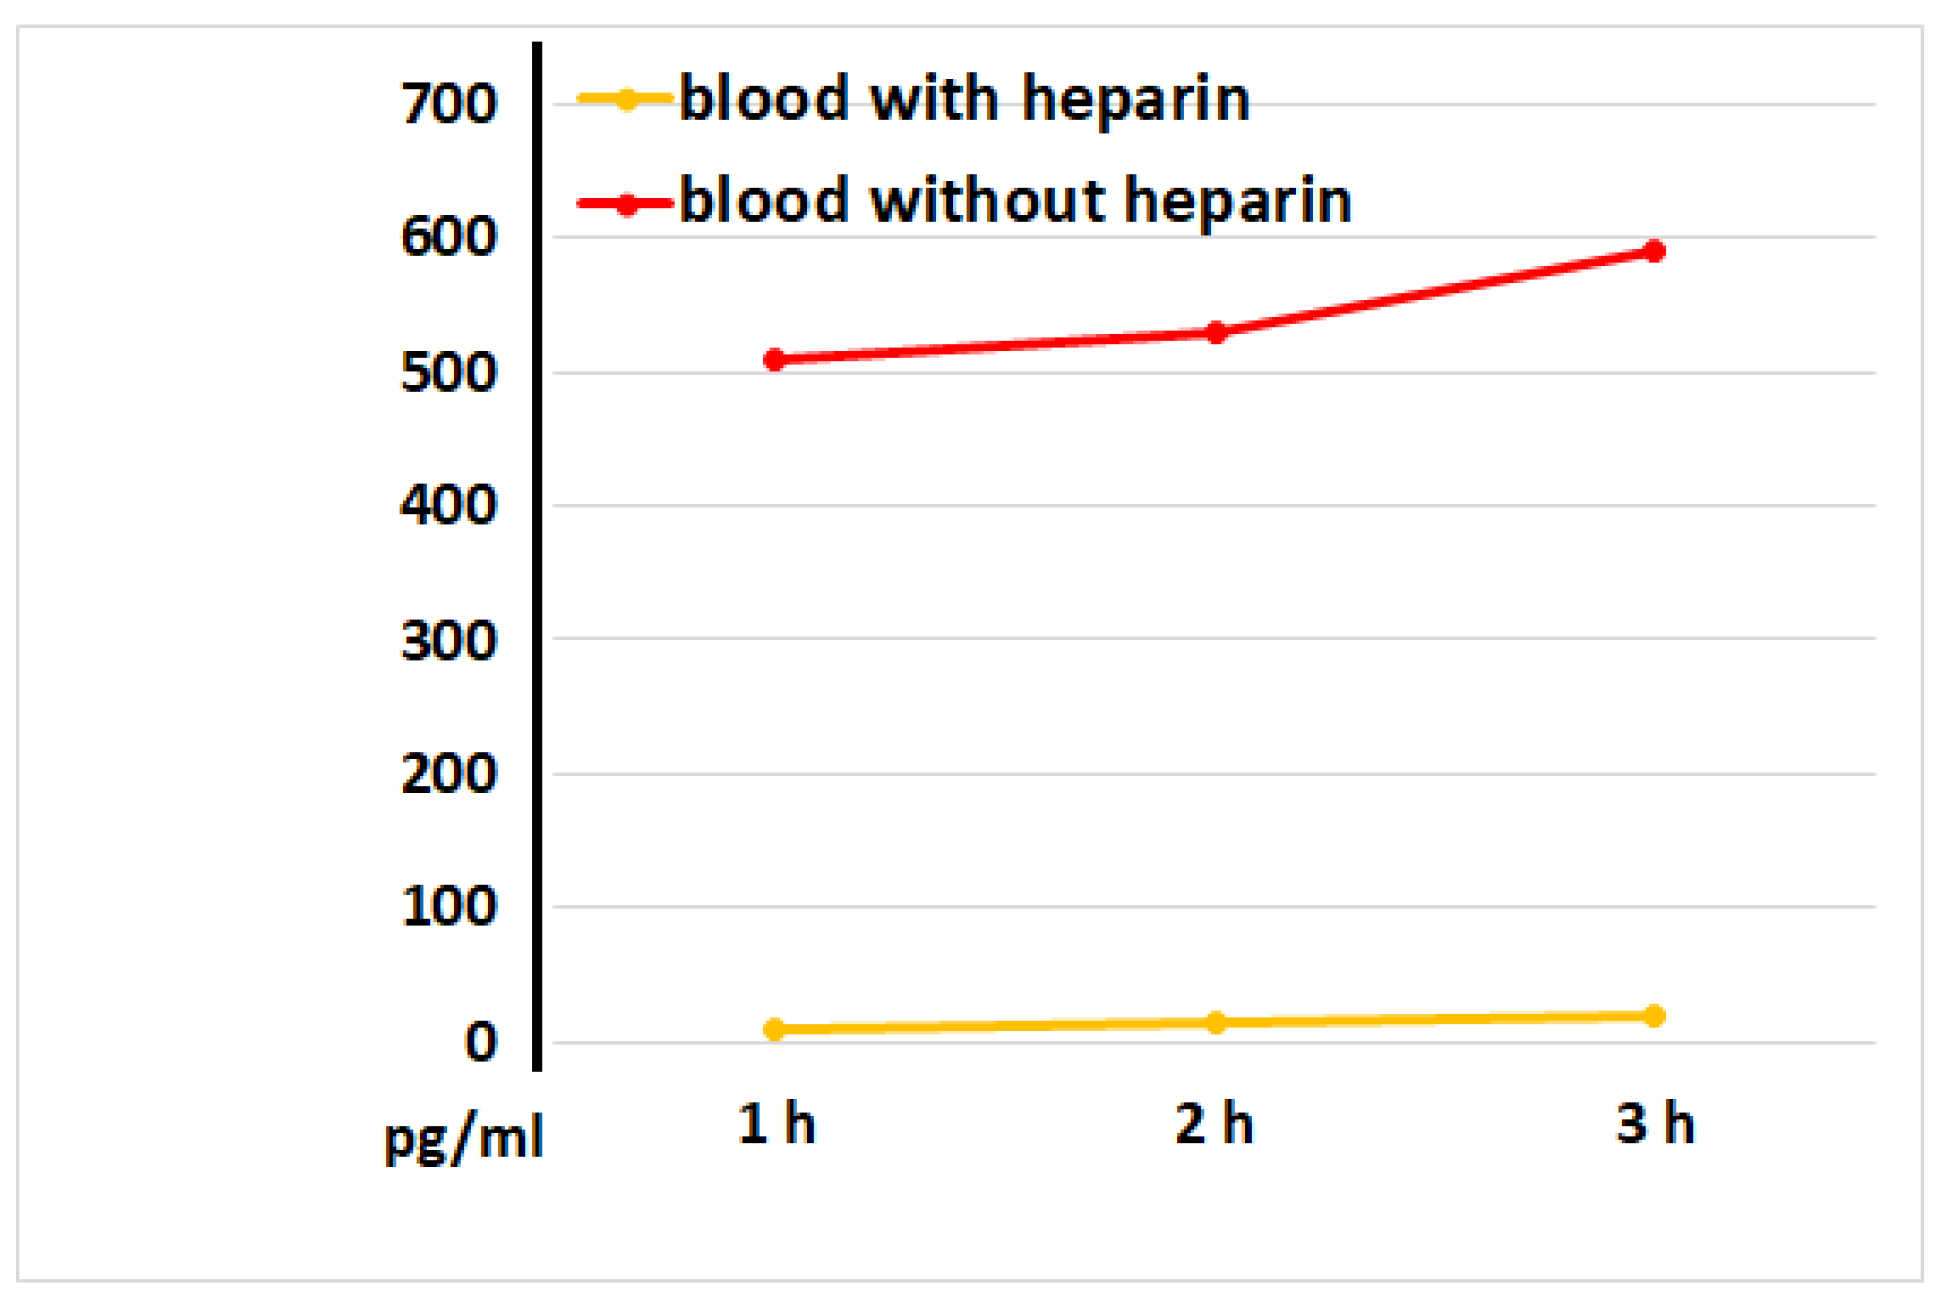
Figure 12.
VEGF concentrations in plasma and serum samples following 3 and 18 hours of incubation of blood with LPS. The results from identical experiments with samples of 5 donors are shown. *P < 0.03.
Figure 12.
VEGF concentrations in plasma and serum samples following 3 and 18 hours of incubation of blood with LPS. The results from identical experiments with samples of 5 donors are shown. *P < 0.03.
Disclaimer/Publisher’s Note: The statements, opinions and data contained in all publications are solely those of the individual author(s) and contributor(s) and not of MDPI and/or the editor(s). MDPI and/or the editor(s) disclaim responsibility for any injury to people or property resulting from any ideas, methods, instructions or products referred to in the content. |
© 2025 by the authors. Licensee MDPI, Basel, Switzerland. This article is an open access article distributed under the terms and conditions of the Creative Commons Attribution (CC BY) license (https://creativecommons.org/licenses/by/4.0/).
Copyright: This open access article is published under a Creative Commons CC BY 4.0 license, which permit the free download, distribution, and reuse, provided that the author and preprint are cited in any reuse.


