

Submitted:
14 February 2025
Posted:
18 February 2025
You are already at the latest version
Abstract
Ischemic heart disease (IHD) is a global health crisis exacerbated by diagnostic and preventive challenges. This study investigated associations between lipid profiles, inflammation biomarkers, and exhaled volatile organic compounds (VOCs) in IHD using machine learning. Eighty participants (31 IHD patients confirmed by computed tomography perfusion [CTP]; 49 controls) underwent CTP, breath analysis (PTR-TOF-MS-1000), and blood testing. LASSO regression with cross-validation analyzed links between VOCs, lipid parameters (HDL, LDL, ApoB, Lp(a), total cholesterol), and inflammation markers (IL-6, CRP). Controls showed minimal plasma biomarker-VOC correlations, whereas IHD patients demonstrated strong lipid-VOC relationships: HDL positively correlated with m/z 49.995 (r=0.31), and total cholesterol inversely with m/z 94.053 (r=−0.35). Key discriminative VOCs included 2-ethyl-2,5-dihydro-4,5-dimethylthiazole, HO3PS2, CH8N3P, and m/z 49,995.01251. IHD patients exhibited dynamic lipid-VOC interactions post-stress (e.g., ApoB, LDL), absent in controls. Inflammation markers had limited direct VOC ties but unique patterns: IL-6 inversely linked to total cholesterol in patients, contrasting with CRP/HDL correlations in controls. These findings highlight VOC-lipidome networks as potential non-invasive biomarkers for IHD-specific metabolic dysregulation. Integrating breathomics with machine learning may advance early diagnosis and personalized risk stratification, addressing critical gaps in IHD management.
Keywords:
IHD
; Mass Spectrometry
; Inflammasome and Lipidome
; CTP
; Breathome and Machine Learning Models
Introduction
Ischemic heart disease is can be described as a global health emergency due to the dramatic increase in the number of the victims annually. This returns to the poor early diagnostic and preventive techniques. Therefore, development an easy, rapid, cost effective, and available in the outpatient and the inpatient department is urgent. Application of the exhaled breath analysis for the diagnosis of ischemic heart disease (IHD) is novel sector in the cardiology. Several methods and techniques have been used to assess the changes in the exhaled breath analysis biochemical components including the usage of selected e-nose sensors and mass spectrometers that work on the time of flight or requires pre-preparation for the obtained sample of the exhaled breath. Some published papers reported that exhaled breath analysis can be used as a mirror of the heart health including ischemia [1,2,3,4].
Volatilome is a wide term used to describe the biochemical components of the exhaled breath, called volatile organic compounds (VOCs). The current investigation did not cover the IHD associated exhaled breath biomarkers changes. Moreover, there no single study reported the changes in the lipidome and inflammasome in patients with IHD confirmed by the stressed computer tomography myocardial perfusion (CTP) imaging. Additionally, studying if there is any correlation between the exhaled breath biomarkers and the lipidome and inflammasome biomarkers in IHD patients has not yet to be investigated.
Recent study demonstrated that patients with coronary artery disease experience elevation in the acetone, ethanol, and phenol in their exhaled breath [5]. However, the study suffers from the lack of clear inclusion and exclusion criteria (did not exclude diabetes mellitus and chronic heart failure patient), narrow spectrum of the VOCs (only 36), small sample size, offline method of analysis, and the absence of the bias section in the paper. More recent study performed on 80 participants, 31 patients with ischemic heart disease confirmed by positive myocardial perfusion defect on the stressed computer tomography myocardial perfusion (CTP) with stress test using the adenosine triphosphate (ATP) discriminated IHD patients from healthy with diagnostic accuracy of 84 % using the exhaled breath analysis through PTR-TOF-MS-1000 [6].
The current research directed to address the changes in the breathome biomarkers and find if there is a correlation with the cardiac lipidome and inflammasome biomarkers.
Material and Methods
Study Design
Single center and cross-sectional study with diagnostic purpose. The study follows the case-control regime. The included participants gave a written informed consent to participate in the study and publish any associated pictures. The study confirmed by the local ethical committee of the University and registered at the clinicaltrials.gov (NCT06181799). The research performed in accordance with the recommendations of the Good Clinical Practice. The full study protocol available at the clinical trials website (https://clinicaltrials.gov/study/NCT06181799?a=1).
Data Collection
The data collected from the hospital number 1 of the Sechenov University for the period of October 27, 2023 till June 11, 2024. The study protocol registered at the clinicaltrials.gov for better comprehension of the data collection.
Instrumental Analysis
All the instrumental and laboratory analysis conducted with high quality standards and according to the Helinski agreement and Good clinical Practice guidelines.
Stressed Computer Tomography Myocardial Perfusion (CTP) Imaging with ATP
Before performing the stressed computer tomography myocardial perfusion (CTP) imaging, all the participants present results of the venous creatinine level, not older than 30 days, eGFR (estimated glomerular filtration rate) according to the 2021 CKD-EPI creatinine > 30 ml/min/1,73 m2, according to the recommendation for using this formula by the National kidney foundation and the American Society of Nephrology [7,8,9,10].
The participants of both groups got catheterization in the basilar vein or the radial vein for injection of contrast and Natrii adenosine triphosphate (10 mg/1ml) to induce pharmacological stress test to the heart by increasing heart rate. Then using the catheter for contrast injection during the procedure of the computer tomography.
To prepare the Natrii Adenosine Triphosphate, a 3ml of Adenosine Triphosphate dilute in 17 ml of isotonic Sodium Chloride solution 0.9%, the injected volume of the diluted drug in milliliters is calculated by body weight. For 1 dose, take 3 ml of adenosine triphosphate (3 ampoules of each 1 ml (10mg)) + 17 ml of isotonic solution of sodium chloride 0.9% in one syringe, 20 ml. For one patient, manually inject intravenously (IV) through the already inserted catheter at a rate of 300 μg/kg/2 minutes, depending on weight: 60 kg = 12 ml, 70 kg = 14 ml, 80 kg = 16 ml, 100 kg = 20 ml of the full dose.
Stress computed tomography myocardial perfusion (CTP) imaging (done on Canon «Aquilion One Genesis» device with 640 slice, 0,5mm thickness) with contrast (Omnipaque, 50 ml). Firstly, make image to evaluate the calcification level in the valves and the ascending aorta. Then, inject the contrast and make a rest image for myocardial perfusion, then the patient continues lying on the apparat for 20 minutes and then inject in to the catheter the Natrii Adenosine Triphosphate (10 mg/1ml) according to body weight to cause pharmacological stress test to the heart during two minutes. Then make and image of the myocardial perfusion after stress test immediately, the image must be done in less than 30 seconds.
Mass Spectrometry (PTR-TOF-MS-1000)
All participants, at rest, passed real time mass spectrometry (MS) within one minute using a PTR TOF-1000 (IONICON PTR-TOF-1000-MS - Trace VOC Analyzer, Eduard-Bodem-Gasse 3, 6020 Innsbruck, Austria (Europe). The analysis of exhaled air was carried out in the hospital at morning, on an empty stomach, without toothbrushing. All participants abstained from food and liquids (except water) and exercise training for 6-8 hours before breathing [11]. Participants used disposable and sterile mouthpieces, and according to the manufacturer's instructions, additional filters were not required. All participants breathed into the sampler for 1 minute (during this time from 12 to 16 exhalation cycles are analyzed). The ionized molecules were separated by their m/z and subsequently detected. Full scan mass spectra were obtained in the 10-685 mass-to-charge ratio (m/z) with a scan time of 1000 ms and primary ion H3O+. The temperature of T-Drift and T-Inlet was 80 °. The cabinet where participants exhale is calm and free from harmful air pollutants like smoking or volatile organic compounds that could affect the accuracy of the results. When they went to the hospital from home, they either used public transportation or their own vehicles to avoid the physical stress test, which could affect their exhaled breath.
Blood Analysis
During the day of the study, in the morning, all participants underwent a single venous blood sampling (bicycle ergometry, vascular stiffness test, single-channel ECG, exhaled air analysis, followed by blood and/or myocardial perfusion, then blood sampling). Venous blood was taken from the participants of the biochemical test tube in the volume of 10 ml. Then the blood was centrifuged at a speed of 2000 rpm for 20 minutes. The centrifuged plasma was then distributed to the 7 tested eppendorfs using pipettes. The Eppendorf was then marked with the participant's full name, all 7 eppendorfs were placed in one bag, and the participant's full name, date of birth, date of blood sample collection, and the investigator's mark were signed on the back. After that, the bag was placed in a special thermostat-refrigerator at a temperature of -82-84 ° C. At the end of collection from all patients, we sent frozen plasma samples to the laboratory, frozen cells, baggage, for analysis for the determination of total cholesterol, low-density lipoprotein (LDL), very low-density lipoprotein (VLDL), high-density lipoprotein (HDL), triglycerides (TAG), C-reactive protein (CRP), lipoprotein a, apolipoprotein B, and interleukin-6 (IL-6). Lipid profile analyses (OX, LDL, VLDL, HDL, TAG, APO B, Lipoprotein (a)) were carried out on the Beckman Coulter AU-5800 automatic biochemical analyzer (Beckman Coulter Inc., 250 S Kraemer Blvd, Brea CA 92821-6232, dated September 21, 2011, No FSZ 2011/10584), Vector Best reagents. The analysis of CRP and IL-6 was carried out on a Beckman Coulter AU-5800 device (Beckman Coulter Inc., 250 S Kraemer Blvd, Brea CA 92821-6232, dated September 21, 2011, No FSZ 2011/10584), Vector Best reagents. The following kits were used for CRP and IL-6; SRB-ELISA-BEST highly sensitive RU No RZN 2016/3872, and Interleukin-6-ELISA-BEST RU No RZN 2022/18690 ELISA. ELISA was used to assay inflammasomes (CRP and IL-6). At the same time, we provided the laboratory with an Excel spreadsheet with the names of the participants and the necessary tests in order to immediately enter the results into the table and avoid confusion and errors in the results.
The reference values that used in the study obtained from the laboratory were the analysis done. (Table 1)
CVD Risk Stratification
Statistical Analysis
For quantitative parameters, the nature of the distribution (using the Shapiro-Wilk test), the mean, the standard deviation, the median, the interquartile, the minimum and maximum values were determined. For categorical and qualitative features, the proportion and absolute number of values were determined.
Comparative analysis for normally distributed quantitative traits was carried out on the basis of Welch's t-test (2 groups); for abnormally distributed quantitative traits, using the Mann-Whitney U-test (2 groups).
Comparative analysis of categorical and qualitative features was carried out using the Pearson X-square criterion, in case of its inapplicability, using the exact Fisher test.
Due to the number of patients in the study groups, as well as the significant number of studied indicators, a direct criterion comparison with a low probability will show significant differences, and therefore subsequent analysis was performed using machine learning algorithms.
Selection of Significant Predictors of Perfusion Defect and Evaluation of Model Quality
The study consisted of a number of stages:
- Determination of exhaled air metabolites associated with the outcome, assessment of the strength of such a relationship;
- Assessment of the relationship between plasma lipid spectrum indicators and the fact of taking lipid-lowering therapy, as well as inflammatory markers (CRP, IL-6) with the outcome;
- Building associative relationships between plasma biochemical parameters at stage 2 and selected metabolites in exhaled air in each group (with a perfusion defect and in controls)
Determination of Outcome-Associated Exhaled Air Metabolites and Cross-Validation Using Machine Learning Models
In the study, there were three time points during which the patient exhaled into a mass spectrometer.
- The first point is the Point Baseline - The patient exhaled calmly before any exertion.
- The second point - After stress - The patient exhaled immediately after the stress test.
- Third point - The patient exhaled after 3 minutes of recovery after the stress test.
The deltas are calculated as the difference between the corresponding endpoint and the starting point, referred to the starting point. Thus, deltas reflect the relative change in the intensity of the mass spectra.
To select metabolites, the XGBoost gradient boosting algorithm was used, which allows ranking predictors from the most to the least important [14]. Sampling was carried out separately for both periods: changes in the mass spectra at the time of immediate completion of the load (delt 01) and at the time of recovery (delt 03). Due to the number of observations to build a robust model, the selection consisted of 2000 iterations on which resampling was performed with repetitions of the full sample (n = 80), then the data was normalized (robust normalization of RobustScaler from the scikit-learn v1.5.2 module), and then the selection of predictors was performed at each iteration. The selection of predictors was carried out with the determination of the importance of predictors from the gradient boosting feature importance algorithm The obtained 2000 importance values for each predictor were averaged over the median, then a general list of significance in descending order was compiled. From this list, the top predictors with non-zero importance indicators for the model for the periods delt 01, delt 13 were selected, and predictors common to both periods (common predictors) were selected.
Then, for both periods and common predictors, models (XGBoost) were built using repetitive cross-validation (5 splits, 10 repeats) to assess the relationship between the selected predictors and the outcome using ROC analysis, sensitivity, and specificity (the best threshold was calculated using Youden's index).
Assessment of the Relationship Between Plasma Lipid Spectrum Indicators, the Fact of Taking Lipid-Lowering Therapy, as well as Inflammatory Markers with the Outcome
A similar predictor selection pipeline was used to assess the relationship between plasma and drug intake and outcome. It is important to note that the tests were taken at the time before the load. Among the indicators are: CRP, IL-6, total cholesterol, its fractions, APO_B, Lipoprotein A, the fact of taking lipid-lowering therapy.
Associative Relationships Between Plasma Biochemical Parameters and Selected Metabolites in Exhaled Air.
The logic of the study implies that there may be a hypothetical relationship between plasma parameters and inflammatory factors with metabolites in the exhaled air, while it is different in healthy subjects and patients.
To conduct a robust assessment of this hypothesis, resampling was performed again over 2000 iterations with repetitions of the full sample and Spearman correlations were calculated for each iteration. After that, the correlation indicators were averaged over the median across all 2000 virtual datasets.
From the obtained indicators, associative graphs were constructed, where the edges were lined up if the average correlation exceeded 0.3 by the built model.
Only those VOCs that were associated with lipid spectrum indicators and inflammatory markers were used
This pipeline was run separately for both groups (main and control), as well as for 2-time stages (immediately after physical activity, 0-1 and recovery stage, 1-3) and for common predictors. It was expected that VOCs could be identified, the changes of which would be associated with lipid indicators, or with markers of inflammation.
Statistical processing carried out using the R programming language v4.2, Python v.3.10 [^R], and Statistica 12 programme. (StatSoft, Inc. (2014). STATISTICA (data analysis software system), version 12. www.statsoft.com.). P considered statistically significant at <0.05.
Results
The primary number included in the study is 101 individuals, excluded 21 (either discontinued in the study or excluded due to the detection an exclusion criteria). The prospective study involved 80 participants.
According to the results of the CTP, the participates divided in to two groups. The first group participants with positive stress induced myocardial perfusion defect (n=31) and the second group with negative stress induced myocardial perfusion defect (n=49) on the CTP.
Descriptive Statistics Results
The descriptive characteristics of the sample were shown as both groups and then each group separately in tables for a full representation of the results. The characteristics of the continuous variables of the sample described in the below tables. (Table 3A-B)

Table 3.
A: The features (Descriptive Statistics) of the continues variables of the whole sample represented in the table.
Table 3.
A: The features (Descriptive Statistics) of the continues variables of the whole sample represented in the table.
| Variable | Mean (Min ; max) | Std.Dev. |
|---|---|---|
| Age | 56.28 (40.24; 77.94) | 10.601 |
| Pulse rate at rest | 70.29 (49.00; 93.00) | 9.559 |
| SBP at rest | 123.16 (54.00; 159.00) | 15.437 |
| DBP at rest | 80.61 (60.00; 122.00) | 11.238 |
| Body weight | 77.92 (52.50; 140.00) | 16.236 |
| Height | 169.95 (148.00; 190.00) | 8.835 |
| BMI | 26.93 (18.49; 48.44) | 4.901 |
| eVessel age | 56.50 (20.00; 80.00) | 13.520 |
| R-CAVI | 8.21 (4.80; 15.10) | 1.379 |
| L-CAVI | 8.18 (4.80; 14.90) | 1.299 |
| Mean CAVI | 8,194 (4,800; 15,000) | 1,331 |
| RABI | 1.15 (0.86; 1.40) | 0.088 |
| LABI | 1.15 (0.89; 1.42) | 0.084 |
| Mean SBP B | 134.38 (105.50; 169.00) | 13.086 |
| Mean DBP B | 85.28 (60.50; 104.50) | 8.358 |
| BP RB (=(SBP+DBP)/2) | 103.98 (75.00; 137.00) | 11.547 |
| BP LB (=(SBP+DBP)/2) | 104.54 (71.00; 136.00) | 10.534 |
| Mean BP B | 104.26 (73.00; 136.50) | 10.772 |
| BP RA (=(SBP+DBP)/2) | 108.39 (80.00; 137.00) | 12.553 |
| BP LA (=(SBP+DBP)/2) | 108.63 (81.00; 138.00) | 11.519 |
| Mean BP A | 108.51 (81.50; 135.00) | 11.468 |
| Mean ABI | 1.15 (0.88; 1.41) | 0.081 |
| RTb | 80.53 (59.00; 152.00) | 13.441 |
| LTb | 77.26 (58.00; 128.00) | 14.012 |
| Mean Tb | 78.89 (59.00; 132.50) | 12.547 |
| Right Tba | 86.26 (23.00; 117.00) | 16.232 |
| Left Tba | 86.40 (24.00; 114.00) | 14.685 |
| Mean Tba | 86.33 (23.50; 115.00) | 15.358 |
| Lha (cm) | 148.17 (130.33; 164.47) | 7.182 |
| haPWV (m/s) | 0.91 (0.67; 1.42) | 0.124 |
| β-stiffness index from PWV | 2.83 (1.21; 7.04) | 0.813 |
| Creatinine (µmol/L) | 82.74 (53.90; 138.00) | 16.014 |
| eGFR (2021 CKD-EPI Creatinine) | 85.31 (45.40; 113.70) | 14.684 |
| Total cholesterol (mmol/l) | 5.5 (2.6; 9.6) | 1.47 |
| TAG (mmol/l) | 1.3 (0.5; 4.2) | 0.65 |
| LDL (mmol/l) | 3.4 (1.4; 6.1) | 1.01 |
| HDL (mmol/l) | 1.4 (0.5; 2.6) | 0.45 |
| VLDL (mmol/l) | 0.6 (0.2; 1.9) | 0.29 |
| Atherogenic index (calculated) | 3.3 (1.1; 10.2) | 1.42 |
| APO B (g/L) | 1.1 (0.6; 2.0) | 0.30 |
| Lipoprotein a (mg/L) | 238.0 (9.0; 841.0) | 235.59 |
| CRP | 3.37 (0.33; 16.05) | 3.19 |
| IL- 6 | 0.87 (0.40; 5.90) | 1.04 |
| SCORE2 , SCORE2-OP, SMART Risk Score | 11.42 (1.50; 37.00) | 7.80 |
Table 3.
B: The features (Descriptive Statistics) of the categorical variables of the whole sample represented in the table. Abbreviations: METs; metabolic equivalent. CPT; stress myocardial perfusion computer tomography imaging.
Table 3.
B: The features (Descriptive Statistics) of the categorical variables of the whole sample represented in the table. Abbreviations: METs; metabolic equivalent. CPT; stress myocardial perfusion computer tomography imaging.
| Index | Factor | Absolute value (relative value %) |
|---|---|---|
| Gender | F | 39 (48.75%) |
| M | 41 (51.25%) | |
| Obesity stage | Normal | 30 (37.50%) |
| Overweight | 29 (36.25%) | |
| 1 degree | 20 (25.00%) | |
| 3 degree | 1 (1.25%) | |
| Smoking | Yes | 14 (17.50%) |
| No | 66 (82.50%) | |
| Concomitant diseases | Yes | 41 (51.25%) |
| No | 35 (43.75%) | |
| Missing data | 4 (5.00%) | |
| Atherosclerosis of the coronary artery | Yes | 31 (38.75%) |
| No | 49 (61.25%) | |
| Hemodynamically significant coronary artery atherosclerosis on the CTP (>60% stenosis) | Yes | 9 (11.25%) |
| No | 71 (88.75%) | |
| Stress induced myocardial perfusion defect on the CTP | Yes | 31 (38.75%) |
| No | 49 (61.25%) | |
| Myocardial perfusion defect before Stress ATP on the CTP | Yes | 26 (32.50%) |
| No | 54 (67.50%) | |
| Atherosclerosis in other arteries | Yes | 41 (51.25%) |
| No | 32 (40.00%) | |
| Missing data | 7 (8.75%) | |
| Atherosclerotic vascular (Namely) | Carotid | 1 (1.25%) |
| Carotid. Brachiocephalic bifurcation | 41 (51.25%) | |
| Missing data | 38 (47.50%) | |
| Carotid artery atherosclerosis | Yes | 39 (48.75%) |
| No | 34 (42.50%) | |
| Missing data | 7 (8.75%) | |
| Brachiocephalic artery atherosclerosis | Yes | 37 (46.25%) |
| No | 36 (45.00%) | |
| Missing data | 7 (8.75%) | |
| Arterial Hypertension | Yes | 40 (50.00%) |
| No | 40 (50.00%) | |
| Stage of the arterial hypertension | I | 5 (6.25%) |
| II | 20 (25.00%) | |
| III | 16 (20.00%) | |
| Degree of hypertension | Degree 1 | 19 (23.75%) |
| Degree 2 | 13 (16.25%) | |
| Degree 3 | 9 (11.25%) | |
| Risk of cardiovascular disease | Low | 27 (33.75%) |
| Moderate | 27 (33.75%) | |
| High | 18 (22.50%) | |
| Very high | 8 (10.00%) | |
| SCAD from anamnesis | Yes | 3 (3.75%) |
| No | 29 (36.25%) | |
| Missing data | 48 (60.00%) | |
| CAVI degree | Normal (<8) | 36 (45.00%) |
| Borderline (8-9) | 22 (27.50%) | |
| Pathological (>9) | 22 (27.50%) | |
| ABI degree | Normal | 76 (95.00%) |
| Borderline | 2 (2.50%) | |
| Abnormal | 1 (1.25%) | |
| Noncompressible | 1 (1.250%) | |
| Biological estimated vascular age | Normal | 45 (56.25%) |
| High | 35 (43.75%) | |
| CKD stage | I | 35 (43.75%) |
| II | 41 (51.25%) | |
| IIIa | 4 (5.00%) | |
| Total cholesterol (mmol/l) | Normal | 34 (42.50 %) |
| High | 46 (57.50 %) | |
| TAG (mmol/l) | Normal | 66 (82.50 %) |
| High | 14 (17.50 %) | |
| LDL (mmol/l) | Normal | 22 (27.50 %) |
| High | 58 (72.50 %) | |
| HDL (mmol/l) | Normal | 42 (52.50 %) |
| Low | 38 (47.50%) | |
| VLDL (mmol/l) | Normal | 66 (82.50 %) |
| High | 14 (17.50 %) | |
| Atherogenic index (calculated) | Low | 19 (23.75%) |
| Moderate | 32 (40.00%) | |
| High | 29 (36.25%) | |
| APO B (g/L) | Normal | 61 (76.25%) |
| High | 19 (23.75 %) | |
| Lipoprotein a (mg/L) | Normal | 59 (73.75 %) |
| High | 21 (26.25 %) | |
| IL-6 | Normal | 80 (100 %) |
| High | 0 (0.00 %) | |
| CRP | Normal | 61 (76.25 %) |
| High | 19 (23.75 %) | |
| Group1 (SMART Risk Score) Group 2 (SCORE2 or SCORE2-OP) |
Low | 21 (26.25 %) |
| Moderate | 36 (45.00 %) | |
| High | 23 (28.75 %) | |
| Lipid lowering drugs | Yes | 15 (18.75 %) |
| No | 65 (81.25 %) |
The comparative characteristics of the sample represented in the below tables based on the presence or absence of the stress induced myocardial perfusion defect of the CTP imaging with the adenosine triphosphate. (Table 4A-B)
Table 4.
A. Categorical variables presented in absolute and relative values of the study for true incidence of the stated factor. X2 and U-Manna-Whitney criterion test used as a comparative test, as needed. * Values statically significant difference. Abbreviations: METs; metabolic equivalent. CPT; stress myocardial perfusion computer tomography imaging. On the basis of direct criterion comparisons, there are virtually no significant differences.
Table 4.
A. Categorical variables presented in absolute and relative values of the study for true incidence of the stated factor. X2 and U-Manna-Whitney criterion test used as a comparative test, as needed. * Values statically significant difference. Abbreviations: METs; metabolic equivalent. CPT; stress myocardial perfusion computer tomography imaging. On the basis of direct criterion comparisons, there are virtually no significant differences.
| Index | Factor | Group 1 (n=31). Positive myocardial perfusion defect on the CTP | Group 2 (n=49). Negative myocardial perfusion defect on the CTP |
p |
|---|---|---|---|---|
| Gender | F | 17 (54.83871%) | 22 (44.89796%) | 0.387 |
| M | 14 (45.16129%) | 27 (55.10204%) | ||
| Obesity stage | Normal | 12 (38.70968%) | 18 (36.73469%) | 0.988363 |
| Overweight | 11 (35.48387%) | 18 (36.73469%) | ||
| 1 degree | 8 (25.80645%) | 12 (24.48980%) | ||
| 3 degree | 0 (0.0%) | 1 (2.04082 %) | ||
| Smoking | Yes | 7 (22.5806 %) | 7 (14.28571 %) | 0.342 |
| No | 24 (77.41935 %) | 42 (85.71429 %) | ||
| Concomitant diseases | Yes | 15 (48.38710%) | 26 (53.06122 %) | 0.835 |
| No | 12 (38.70968 %) | 23 (46.93878 %) | ||
| Missing data | 4 (12.90323 %) | 0 (0.0 %) | ||
| Atherosclerosis of the coronary artery | Yes | 16 (51.61290 %) | 15 (30.61224 %) | 0.061 |
| No | 15 (48.38710 %) | 34 (69.38776 %) | ||
| Hemodynamically significant coronary artery atherosclerosis on the CTP (>60% stenosis) | Yes | 8 (25.80645 %) | 1 (2.04082 %) | 0.002 * |
| No | 23 (74.19355%) | 48 (97.95918 %) | ||
| Stress induced myocardial perfusion defect on the CTP | Yes | 31 (100 %) | 0 (0.00 %) | <0.001 * |
| No | 0 (0.00 %) | 49 (100.00 %) | ||
| Myocardial perfusion defect before Stress ATP on the CTP | Yes | 21 (67.74194 %) | 5 (10.20408 %) | <0.001* |
| No | 10 (32.25806 %) | 44 (89.79592 %) | ||
| Atherosclerosis in other arteries | Yes | 22 (70.96774 %) | 19 (38.77551%) | 0.006* |
| No | 7 (22.58065 %) | 25 (51.02041 %) | ||
| Missing data | 2 (6.45161 %) | 5 (10.20408 %) | ||
| Atherosclerotic vascular (Namely) | Carotid | 1 (3.22581%) | 0 (0.0%) | 0.347 |
| Carotid. Brachiocephalic bifurcation | 21 (67.74194%) | 19 (38.77551%) | ||
| Missing data | 9 (29.03226 %) | 30 (61.22449 %) | ||
| Carotid artery atherosclerosis | Yes | 20 (64.51613 %) | 19 (38.77551 %) | 0.015* |
| No | 8 (25.80645 %) | 26 (53.06122 %) | ||
| Missing data | 3 (9.67742 %) | 4 (8.16327 %) | ||
| Brachiocephalic artery atherosclerosis | Yes | 18 (58.06452 %) | 19 (38.77551 %) | 0.067 |
| No | 10 (32.25806 %) | 26 (53.06122 %) | ||
| Missing data | 3 (9.67742 %) | 4 (8.16327 %) | ||
| Arterial Hypertension | Yes | 19 (61.29032 %) | 21 (42.85714 %) | 0.109 |
| No | 12 (38.70968 %) | 28 (57.14286 %) | ||
| Stage of the arterial hypertension | I | 4 (13.55%) | 1 (2.04082%) | 0.079756 |
| II | 6 (19.35484%) | 14 (28.57143%) | ||
| III | 9 (29.03226%) | 7 (14.28571%) | ||
| Degree of hypertension | Degree 1 | 10 (32.25806%) | 9 (18.36735%) | 0.098908 |
| Degree 2 | 3 (9.67742%) | 10 (20.40%) | ||
| Degree 3 | 6 (19.35484%) | 3 (6.12245%) | ||
| Risk of cardiovascular disease | Low | 10 (32.25806%) | 19 (38.77551%) | 0.449429 |
| Moderate | 8 (25.80645%) | 16 (34.70%) | ||
| High | 8 (25.80645%) | 10 (20.40816%) | ||
| Very high | 5 (16.12903%) | 3 (6.12245%) | ||
| SCAD from anamnesis | Yes | 4 (12.90323 %) | 1 (2.04082 %) | <0.001 * |
| No | 2 (6.45161 %) | 25 (51.02041%) | ||
| Missing data | 25 (80.64516 %) | 23 (46.93878 %) | ||
| CAVI degree | Normal (<8) | 9 ( 29.03226 %) | 27 (55.10204 %) | 0.073757 |
| Borderline (8-9) | 11 (35.48387 %) | 11 (22.44898 %) | ||
| Pathological (>9) | 11 (35.48387 %) | 11 (22.44898 %) | ||
| ABI degree | Normal | 29 (93.54839 %) | 47 (95.91837 %) | 0.89381 |
| Borderline | 1 ( 3.22581 %) | 1 ( 2.04082 %) | ||
| Abnormal | 1 ( 3.22581 %) | 1 ( 2.04082 %) | ||
| Biological estimated vascular age | Normal | 16 (51.61290%) | 29 (59.18367%) | 0.507 |
| High | 15 (48.38710%) | 20 (40.81633%) | ||
| CKD stage | I | 12 (38.70%) | 23 (46.93877 %) | 0.285103 |
| II | 16 (51.61290%) | 25 (51.02041%) | ||
| IIIa | 3 (9.67742%) | 1 (2.04082 %) | ||
| Total cholesterol (mmol/l) | Normal | 10 (32.25 %) | 24 (48.97 %) | 0.14 |
| High | 21 (67.74 %) | 25 (51.02 %) | ||
| TAG (mmol/l) | Normal | 23 (74.19 %) | 43 (87.75 %) | 0.11 |
| High | 8 (25.80 %) | 6 (12.24 %) | ||
| LDL (mmol/l) | Normal | 6 (19.35 %) | 16 (32.65 %) | 0.19 |
| High | 25 (80.64 %) | 33 (67.34 %) | ||
| HDL (mmol/l) | Normal | 14 (45.16 %) | 28 (57.14 %) | 0.29 |
| Low | 17 (54.83 %) | 21 (42.85 %) | ||
| VLDL (mmol/l) | Normal | 23 (74.19 %) | 43 (87.75 %) | 0.11 |
| High | 8 (25.80 %) | 6 (12.24 %) | ||
| Atherogenic index (calculated) | Low | 5 (16.12 %) | 14 (28.57 %) | 0.30 |
| Moderate | 12 (38.70 %) | 20 (40.81 %) | ||
| High | 14 (45.16 %) | 15 (30.61 %) | ||
| APO B (g/L) | Normal | 21 (67.74 %) | 40 (81.63 %) | 0.15 |
| High | 10 (32.25 %) | 9 (18.36 %) | ||
| Lipoprotein a (mg/L) | Normal | 24 (77.41 %) | 35 (71.42 %) | |
| High | 7 (22.58 %) | 14 (28.57 %) | ||
| IL-6 | Normal | 31 (100.00 %) | 49 (100.00 %) | 1.00 |
| High | 0 (0.00 %) | 0 (0.00 %) | ||
| CRP | Normal | 20 (64.51 %) | 41 (83.67 %) | 0.04 * |
| High | 11 (35.48 % ) | 8 (16.32 %) | ||
| Group1 (SMART Risk Score) Group 2 (SCORE2 or SCORE2-OP) |
Low | 11 (35.48387 %) | 10 (20.40 %) | 0.10 |
| Moderate | 15 (48.38710 %) | 21 (42.85 %) | ||
| High | 5 (16.12903 %) | 18 (36.73 %) | ||
| Lipid lowering drugs | Yes | 6 (19.35 %) | 9 (14.75 %) | 0.91 |
| No | 25 (80.64 %) | 40 (65.57 %) |
Table 4.
B: The continuous variables of the sample presented as a mean ± standard deviation (Std. div.), Student test as independent variables used. * Values statically significant difference. Abbreviations: SBP; systolic blood pressure, DBP; diastolic blood pressure, BMI, body mass index, HR; heart rate, METs; metabolic equivalent, R-CAVI; right Cardio-ankle vascular index, L-CAVI; left Cardio-ankle vascular index, RABI; right ankle-brachial index, LABI; left ankle-brachial index, SBP B; systolic blood pressure brachial, DBP B; diastolic blood pressure brachial, BP RB; blood pressure right brachial, BP RA ; blood pressure right ankle, BP LA; blood pressure left ankle, BP A; blood pressure ankle, ABI; ankle-brachial index, RTb; right brachial pulse, LTb; left brachial pulse, Tb; mean brachial pulse, Tba; mean brachial-ankle pulse, Lha (cm); length heart-ankle, haPWV (m/s); heart-ankle pulse wave velocity.
Table 4.
B: The continuous variables of the sample presented as a mean ± standard deviation (Std. div.), Student test as independent variables used. * Values statically significant difference. Abbreviations: SBP; systolic blood pressure, DBP; diastolic blood pressure, BMI, body mass index, HR; heart rate, METs; metabolic equivalent, R-CAVI; right Cardio-ankle vascular index, L-CAVI; left Cardio-ankle vascular index, RABI; right ankle-brachial index, LABI; left ankle-brachial index, SBP B; systolic blood pressure brachial, DBP B; diastolic blood pressure brachial, BP RB; blood pressure right brachial, BP RA ; blood pressure right ankle, BP LA; blood pressure left ankle, BP A; blood pressure ankle, ABI; ankle-brachial index, RTb; right brachial pulse, LTb; left brachial pulse, Tb; mean brachial pulse, Tba; mean brachial-ankle pulse, Lha (cm); length heart-ankle, haPWV (m/s); heart-ankle pulse wave velocity.
| Variable | Group 1 (n=31). Positive stress induced myocardial perfusion defect on CTP. Mean ± Std. div. |
Group 2 (n=49). Negative stress induced myocardial perfusion defect on CTP. Mean ± Std. div. | t-value | p |
|---|---|---|---|---|
| Age | 59.9307 ±11.70846 | 53.9675 ± 9.23135 | 2.53382 | 0.013287* |
| Pulse rest | 70.2258 ±10.74464 | 70.3265 ±8.84446 | -0.04562 | 0.963726 |
| SBP rest | 124.4839 ± 20.56351 | 122.3265 ±11.22755 | 0.60653 | 0.545921 |
| DBP rest | 82.3548 ±13.16447 | 79.5102 ± 9.81521 | 1.10453 | 0.272758 |
| Body weight | 77.1290 ±14.71675 | 78.4204 ±17.25762 | -0.34465 | 0.731287 |
| Height | 169.8065 ±9.41424 | 170.0408 ±8.54695 | -0.11487 | 0.908845 |
| BMI | 26.7076 ±4.23191 | 27.0654 ± 5.31845 | -0.31627 | 0.752643 |
| eVessel age | 61.2258 ±12.42232 | 53.5102 ±13.44762 | 2.57376 | 0.011955* |
| R-CAVI | 8.5806 ±1.03904 | 7.9714 ±1.51891 | 1.95970 | 0.053603 |
| L-CAVI | 8.4387 ±0.93868 | 8.0184 ±1.46922 | 1.41852 | 0.160024 |
| Mean CAVI | 8.509677 ±0.97506 | 7.994898 ±1.48991 | 1.704581 | 0.092253 |
| RABI | 1.1232 ± 0.10041 | 1.1629 ±0.07697 | -1.99089 | 0.049996* |
| LABI | 1.1297 ±0.08716 | 1.1584 ±0.08032 | -1.50589 | 0.136133 |
| Mean SBP B | 137.9839 ±15.43399 | 132.0918 ±10.91953 | 1.99878 | 0.049116 |
| Mean DBP B | 86.9194 ±8.76841 | 84.2347 ±8.00397 | 1.40836 | 0.162997 |
| BP RB (=(SBP+DBP)/2) | 106.4194 ±12.85243 | 102.4286 ±10.48411 | 1.51834 | 0.132972 |
| BP LB (=(SBP+DBP)/2) | 107.0968 ±11.51044 | 102.9184 ±9.63898 | 1.75092 | 0.083892 |
| Mean BP B | 106.7581 ±11.94004 | 102.6735 ±9.75990 | 1.67101 | 0.098728 |
| BP RA (=(SBP+DBP)/2) | 110.6452 ±13.09338 | 106.9592 ±12.11741 | 1.28474 | 0.202687 |
| BP LA (=(SBP+DBP)/2) | 111.2903 ±12.77026 | 106.9388 ±10.43913 | 1.66443 | 0.100039 |
| Mean BP A | 110.9677 ±12.37129 | 106.9490 ±10.69572 | 1.54024 | 0.127550 |
| Mean ABI | 1.1265 ±0.09089 | 1.1606 ±0.07259 | -1.85781 | 0.066970 |
| RTb | 77.2581 ±10.23708 | 82.5918 ±14.85193 | -1.75167 | 0.083761 |
| LTb | 74.1613 ±12.88176 | 79.2245 ±14.46730 | -1.58966 | 0.115958 |
| Mean Tb | 75.7097 ±10.65033 | 80.9082 ±13.32318 | -1.83215 | 0.070746 |
| Right Tba | 81.1935 ±16.27968 | 89.4694 ±15.52029 | -2.27998 | 0.025341* |
| Left Tba | 83.0000 ±14.73092 | 88.5510 ±14.39048 | -1.66560 | 0.099806 |
| Mean Tba | 82.0968 ±15.38420 | 89.0102 ±14.87850 | -1.99834 | 0.049164* |
| Lha (cm) | 148.0571 ±7.65284 | 148.2476 ±6.94782 | -0.11487 | 0.908845 |
| haPWV (m/s) | 0.9533 ±0.11852 | 0.8860 ±0.12080 | 2.44529 | 0.016727* |
| β-stiffness index from PWV | 2.9538 ±0.65907 | 2.7567 ±0.89559 | 1.05682 | 0.293858 |
| Creatinine (µmol/L) | 80.3787 ±15.44759 | 84.2339 ±16.34146 | -1.04969 | 0.297103 |
| eGFR (2021 CKD-EPI Creatinine) | 84.8548 ±15.14628 | 85.5898 ±14.53585 | -0.21677 | 0.828950 |
| Total cholesterol (mmol/l) | 5.61±1.56 | 5.49 ± 1.43 | 0.36 | 0.71 |
| TAG (mmol/l) | 1.41± 0.77 | 1.16 ± 0.54 | 1.73 | 0.08 |
| LDL (mmol/l) | 3.46 ± 1.08 | 3.27 ± 0.96 | 0.81 | 0.41 |
| HDL (mmol/l) | 1.28 ± 0.34 | 1.44 ± 0.50 | -1.54 | 0.12 |
| VLDL (mmol/l) | 0.64 ± 0.35 | 0.52 ± 0.25 | 1.73 | 0.08 |
| Atherogenic index (calculated) | 3.60 ± 1.75 | 3.05 ± 1.14 | 1.69 | 0.09 |
| APO B (g/L) | 1.19 ± 0.35 | 1.08 ± 0.27 | 1.63 | 0.10 |
| Lipoprotein a (mg/L) | 213.22 ± 207.23 | 253.67 ± 252.70 | -0.74 | 0.45 |
| CRP | 3.81 ± 2.96 | 3.09 ± 3.33 | 0.97 | 0.33 |
| IL- 6 | 0.88 ± 0.91 | 0.86 ± 1.12 | 0.05 | 0.95 |
| Group 1 (SMART Risk Score) Group 2 (SCORE2 or SCORE2-OP) |
15.07 ± 7.72 | 9.11 ± 7.00 | 3.56 | 0.00061* |
A supplementary file was attached to demonstrate all the comparative indicators in between continuous variables as well as in between the categorical variables. (supplementary S1)
The Diagnostic Accuracy of the Bicycle Ergometry
We examined the diagnostic accuracy of a standard exercise test on a bicycle ergometer. In the ROC analysis, where the predictor was the result of a sample with the results of the physical exertion “Reaction_type” = 'Positive', and the target variable was Myocardial_perfusion_defect_after_stress_ATP, the following results were obtained. (Table 5)
Lipidome and Inflammasome Changes with Breathome Changes
The results of the lipid profile and the inflammasome are evaluated on three steps to make sure the optimal predictors are selected and increase the confidence in the obtained the results. The following steps are done;
Step 1 - Selection of Significant Predictors of Perfusion Defect and Evaluation of Model Quality
After the selection procedures were carried out in the time interval between the baseline and the completion of the load, the following predictors were the most associated with the outcome (based on the results of 2000 iterations, their median feature importance in the model was as follows). (Table 6)
The quality of the model rebuilt with these features is quite high, which suggests that these predictors are important for the outcome. (Table 7)
For the time of recovery, the following VOCs showed the highest association with the outcome. (Table 8)
The rebuilt model also showed a high relationship between predictors and the outcome. (Table 9)
Common to both time intervals were VOCs
'144.08472',
'144.91780',
'49.995012',
'94.053730'
The model rebuilt with them, on the whole, demonstrated moderate quality, which suggests a significant role of these VOCs. (Table 10)
Complete tables with predictors and received values based on XGBoost represented in (supplementary S2,S3).
Step 2 - Assess the Relationship Between Plasma and Outcome
When selecting plasma predictors at the first stage, the fact of taking lipid-lowering therapy was additionally included. The resulting predictors were arranged as follows. (Table 11)
It is important to emphasize that the significant role of lipid-lowering therapy is due to the fact that patients with a defect are apparently more likely to be prescribed such therapy, which confirms the correctness of the logic of selection using boosting. Lipid-lowering therapy was excluded to assess the quality of the model. (Table 12)
The quality of the resulting model was quite low. This can be explained by the objectively low relationship between lipid spectrum indicators, pro-inflammatory factors and the results of the exercise test and recovery, as well as by the fact that plasma was taken only before the load.
Step 3 - Links Between Plasma Biochemistry and Sampled VOCs
Correlation matrices and graphs were built on the basis of data preprocessing and with division into groups, as indicated in the methods section.
When visualizing, the size of the graph edges corresponds to the median correlation coefficient, the color - its direction (red - reverse, blue - direct). The size of the nodes corresponds to their valence by module (the valence (or order) of a graph vertex is the number of edges for which this vertex is the end, taking into account the weight of the edge, where the weight is the correlation coefficient).
When constructing the graphs’, known associations were recorded, which confirmed the chosen logic: in both groups, the presence of direct moderate correlations between inflammatory markers, the presence of direct moderate to strong correlations between lipid spectrum indicators, which corresponds to the logic of the Friedwald formula.
When analyzing the dynamics immediately after physical activity, the spectrum indicators (TCH, HDL, LDL, apo B) were associated with VOCs in the group of patients, while the connections were negative, and in the case of LPA - positive. In the group of healthy people, such patterns were not recorded. (Figure 1 A-B) (Supplementary S4, S5)
In the pre-recovery analysis among patients, CRP and IL-6 were negatively associated with VOCs, LPAs were positive. Whereas, in the control group, TCH, HDL negatively associated with the VOCs, APO B were positive. (Figure 2 A-B) (Supplementary S6, S7)
If we consider the graphs with common VOCs, in the main group, a moderate relationship of VOCs with the spectrum can be traced in relation to HDL (positive) and TCH (negative). In the control group, we can visualize a positive moderate association between the VOCs trace and TAG , VLDL, APO B. (Figure 3 A-B) (Supplementary S8, S9)
Annotation of the Obtained m/z
The annotation performed on several steps;
-
At the first stage, for each mass-charge ratio (m/z), all possible gross formulas were found based on the following hypothesis space:
- We only looked at adducts of the [M+H];
-
The molecule could include the following elemental composition:
- 2.
- C from 0 to 10;
- 3.
- H from 0 to 50;
- 4.
- N from 0 to 10;
- 5.
- from 0 to 10;
- 6.
- P from 0 to 10;
- 7.
- S from 0 to 10;
- 8.
- The molecule should not include halogens: "Cl", "Br", "I", "F"
- 9.
- Rings and Double Bond Equivalents (RDB) from -0.5 to 20;
- 10.
- Error in determining the weight up to 50ppm
-
At the second stage, a match search was carried out in the HMDB library for each resulting formula (Human Metabolome Database) under the following conditions:
- Exact Molecular Formula Match.
- The search was carried out only for m/z less than 200, since there are too many options for gross formulas for m/z over 200.
If there are no suitable gross formulas for the mass, only the m/z value itself is given. (Table 13) for full variants of the possible chemical substances of the found m/z, check the supplementary file. (Supplementary S10)
Limitations of this Study
The main limitation is the modest data set, which may lead to potential bias in the results. To reduce the impact of such bias, resampling techniques from a significant number of iterations were used, as well as using robust data normalization and averaging by the median (stricter logic than the mean). At the same time, a number of the obtained results demonstrate known facts (the order of correlations in the lipid spectrum corresponds to the logic of the Friedwald formula, correlations between proinflammatory markers). These points allow us to increase the credibility of the obtained results to some extent.
Discussion
In the light of the obtained results, there is no statistically significant difference in the concentration of the lipidome biomarkers between the two groups. This probably returns to the different types of ischemia detected through the CTP such as microvascular ischemia (syndrome X, Ischemia with non-obstructive coronary artery disease; INOCA) and atherosclerotic ischemia [16]. The pathophysiology of the ischemia in the two cases is different, in syndrome X, the primary pathogenetic pathway is microvascular vasospasm resulting in mismatch between demand and supply of the myocardiocytes. The microvascular vasospasm can be associated with the inflammatory changes and not lipidome changes. Therefore, inflammasome biomarkers are higher in IHD group (first group), where myocardial perfusion defect was in most of the cases without significant coronary arteries stenosis. Therefore, considering the inflammation biomarkers more reliable for both types of myocardiocyte ischemia, micro- and macro-vascular [17].
Whereas, the pathophysiology of the ischemia with obstructive coronary artery (IOCA) is classically due to dyslipidemia. Therefore, the plasma of these participants has high bad lipids such as high LDL and TAG. Additionally, inflammation biomarkers are remarkably higher in IHD patients. Or take lipid lowering agents such as statins to reduce the levels of the bad lipids.
Interesting links were recorded between lipid spectra and inflammatory markers. However, Inflammatory marker scores were not directly strongly associated with VOCs. In the case of the lipid spectrum, we see numerous correlations:
-
At the time point immediately after the load:
-
In the main group:
- ✓
- Negative correlations with ApoB, HDL, LDL, TCH in the study group
- ✓
- Positive correlations with LPA in the study group
- ✓
- Positive correlations with several VOCs when prescribing lipid-lowering therapy in the study group
-
In the control group:
- ✓
- Significantly fewer correlations
- ✓
- Correlations between spectrum and VOCs are positive
-
-
3 minutes after the second breath
-
In the main group:
- ✓
- Important - there are positive correlations with IL6 substances with almost the same mass spectrum
- ✓
- Positive correlations with CRP of 2 VOCs
- ✓
- of the spectrum, only HDL (multidirectional) and LPA correlate with VOCs
- ✓
- There is a moderate negative relationship with the prescription of lipid-lowering therapy and some severe VOC (i.e., it is higher in those who are not prescribed therapy)
-
In the control group:
- ✓
- Significantly fewer correlations
- ✓
- Correlations between TCH and HDL with VOCs are negative, with Apo B and lipid-lowering therapy - positive.
-
-
Common VOCs at both points:
-
In the main group:
- ✓
- no common VOCs (to be at both time stages)
-
In the control group:
- ✓
- Significantly fewer correlations
- ✓
- In fact, only 1 VOC common to both periods, directly related to the lipid spectrum.
-
An important regularity was that for all 3 stages of graph construction in healthy individuals, we observed the absence of strong correlations between VOCs and plasma parameters. At the same time, as in patients, there is a large number of correlations between spectrum indicators and VOCs.
If we talk about inflammatory markers, in the group of healthy patients, a moderate negative correlation between CRP and HDL was recorded, which was absent in patients. At the same time, a moderate inverse correlation between IL-6 and TCH was recorded in patients.
An important point is the negative relationship at all points between HDL and lipid-lowering therapy (which is logical), but only in the control group. In the study group, the relationship was too weak, while the groups did not differ significantly in the criteria.
The findings suggested that 2-Ethyl-2,5-dihydro-4,5-dimethylthiazole, HO3PS2, CH8N3P, and m/z 49.99501251 are the most important VOCs and related to the lipid profile and the inflammation biomarkers. However, the origin of these molecules in the exhaled breath of the patients is questionable and requires further investigations.
The 2-Ethyl-2,5-dihydro-4,5-dimethylthiazole is an organic compound belonging to the thiazole family, which is a heterocyclic compound containing sulfur and nitrogen [18,19]. Thiazoles and their derivatives are often studied for their biological activities, including potential roles in metabolism or as biomarkers. In the context of heart disease, thiazole derivatives might be investigated for their effects on cellular metabolism, oxidative stress, or inflammation, which are key factors in ischemic heart disease (IHD) [20,21]. While specific studies directly linking this compound to IHD are not readily available in the literature.
The molecular formula HO3PS2 and CH8N3P suggest that these compounds may be related to biochemical pathways or metabolic processes that could influence heart health. However, specific connections between these formulas and heart disease are not detailed in the literature.
HO3PS2 contains phosphorus and sulfur, which are elements involved in various biochemical processes [22]. Phosphorothioates are often used in biochemistry and molecular biology, such as in oligonucleotide synthesis [23,24]. In heart disease, phosphorus-containing compounds are critical for energy metabolism (e.g., ATP), and disruptions in phosphorus metabolism can contribute to cardiovascular dysfunction [22,25].
CH8N3P is a small molecule containing phosphorus and nitrogen. Phosphorus-containing compounds are essential in cellular energy transfer and signaling pathways [26]. In the context of IHD, such compounds might be relevant in studies of mitochondrial dysfunction or energy metabolism, which are often impaired in ischemic conditions [27,28].
The m/z 49.99501251 have a high molecular weight (m/z) suggests a large biomolecule, possibly a protein, peptide, or complex metabolite. In mass spectrometry, such a peak could represent a biomarker or a degradation product associated with heart disease [29,30]. In IHD, proteomics and metabolomics studies often identify specific proteins or metabolites that are dysregulated, which could serve as diagnostic or prognostic markers [31,32].
Future directions include validate the specificity of identified VOCs in larger cohorts. Additionally, explore biochemical pathways linking thiazole derivatives and phosphorus-containing compounds to IHD progression and investigate the impact of lipid-lowering therapies on VOC profiles to refine therapeutic monitoring strategies.
Conclusions
The study reveals complex interactions between lipid profiles, inflammatory markers, and volatile organic compounds (VOCs) in patients with ischemic heart disease (IHD), with notable distinctions between patient and healthy control groups. The findings suggested that 2-Ethyl-2,5-dihydro-4,5-dimethylthiazole, HO3PS2, CH8N3P, and m/z 49.99501251 are the most important VOCs and related to the lipid profile and the inflammation biomarkers. Patients with ischemic heart disease have a large number of correlations between lipid spectrum indicators and VOCs, in particular; HDL and m/z 49.995012 (r= 0.31); total cholesterol and m/z 94.053730 (r= - 0.35).
List of abbreviations
CVD; cardiovascular disease, CTP; stress computed tomography myocardial perfusion imaging, VOCs; volatile organic compounds.
References
- Marzoog, B.A. Volatilome Is Inflammasome- and Lipidome-Dependent in Ischemic Heart Disease. Curr. Cardiol. Rev. 2024, 20, e190724232038. [Google Scholar] [CrossRef] [PubMed]
- Marzoog, B. Breathomics Detect the Cardiovascular Disease: Delusion or Dilution of the Metabolomic Signature. Curr. Cardiol. Rev. 2024, 20, 68–76. [Google Scholar] [CrossRef] [PubMed]
- Marzoog, B.A. Volatilome: A Novel Tool for Risk Scoring in Ischemic Heart Disease. Curr. Cardiol. Rev. 2024, 20, e080724231719. [Google Scholar] [CrossRef]
- Marzoog, B.A.; Chomakhidze, P.; Gognieva, D.; Gagarina, N.V.; Kopylov, P. Methods Enhancing the Diagnostic Accuracy of the Bicycle Ergometry in Ischemic Heart Disease. Curr. Cardiol. Rev. 2024. [Google Scholar]
- Lombardi, M.; Segreti, A.; Miglionico, M.; Pennazza, G.; Tocca, L.; Amendola, L.; Vergallo, R.; Di Sciascio, G.; Porto, I.; Grigioni, F.; et al. Breath Analysis via Gas Chromatography–Mass Spectrometry (GC-MS) in Chronic Coronary Syndrome (CCS): A Proof-of-Concept Study. J. Clin. Med. 2024, 13, 5857. [Google Scholar] [CrossRef]
- Marzoog, B.A.; Chomakhidze, P.; Gognieva, D.; Gagarina, N.V.; Silantyev, A.; Suvorov, A.; Fominykha, E.; Mustafina, M.; Natalya, E.; Gadzhiakhmedova, A.; et al. Machine Learning Model Discriminate Ischemic Heart Disease Using Breathome Analysis. Biomedicines 2024, 12, 2814. [Google Scholar] [CrossRef]
- Cockcroft, D.W.; Gault, M.H. Prediction of Creatinine Clearance from Serum Creatinine. Nephron 1976, 16, 31–41. [Google Scholar] [CrossRef]
- Winter, M.A.; Guhr, K.N.; Berg, G.M. Impact of Various Body Weights and Serum Creatinine Concentrations on the Bias and Accuracy of the Cockcroft-Gault Equation. Pharmacotherapy 2012, 32, 604–612. [Google Scholar] [CrossRef]
- Brown, D.L.; Masselink, A.J.; Lalla, C.D. Functional Range of Creatinine Clearance for Renal Drug Dosing: A Practical Solution to the Controversy of Which Weight to Use in the Cockcroft-Gault Equation. Ann. Pharmacother. 2013, 47, 1039–1044. [Google Scholar] [CrossRef]
- Delgado, C.; Baweja, M.; Crews, D.C.; Eneanya, N.D.; Gadegbeku, C.A.; Inker, L.A.; Mendu, M.L.; Miller, W.G.; Moxey-Mims, M.M.; Roberts, G. V.; et al. A Unifying Approach for GFR Estimation: Recommendations of the NKF-ASN Task Force on Reassessing the Inclusion of Race in Diagnosing Kidney Disease. Am. J. Kidney Dis. 2022, 79, 268–288.e1. [Google Scholar] [CrossRef]
- Horváth, I.; Barnes, P.J.; Loukides, S.; Sterk, P.J.; Högman, M.; Olin, A.-C.; Amann, A.; Antus, B.; Baraldi, E.; Bikov, A.; et al. A European Respiratory Society Technical Standard: Exhaled Biomarkers in Lung Disease. Eur. Respir. J. 2017, 49, 1600965. [Google Scholar] [CrossRef] [PubMed]
- collaboration, S. working group and E.C. risk; Hageman, S.; Pennells, L.; Ojeda, F.; Kaptoge, S.; Kuulasmaa, K.; de Vries, T.; Xu, Z.; Kee, F.; Chung, R.; et al. SCORE2 Risk Prediction Algorithms: New Models to Estimate 10-Year Risk of Cardiovascular Disease in Europe. Eur. Heart J. 2021, 42, 2439–2454. [Google Scholar] [CrossRef]
- Dorresteijn, J.A.N.; Visseren, F.L.J.; Wassink, A.M.J.; Gondrie, M.J.A.; Steyerberg, E.W.; Ridker, P.M.; Cook, N.R.; Van Der Graaf, Y. Development and Validation of a Prediction Rule for Recurrent Vascular Events Based on a Cohort Study of Patients with Arterial Disease: The SMART Risk Score. Heart 2013, 99, 866–872. [Google Scholar] [CrossRef] [PubMed]
- Hastie, T.; Tibshirani, R.; Friedman, J.H. The Elements of Statistical Learning: Data Mining, Inference, and Prediction; Springer series in statistics; Springer, 2009; ISBN 9780387848846.
- Human Metabolome Database Available online:. Available online: https://hmdb.ca/ (accessed on 24 January 2025).
- Nagasawa, N.; Nakamura, S.; Ota, H.; Ogawa, R.; Nakashima, H.; Hatori, N.; Wang, Y.; Kurita, T.; Dohi, K.; Sakuma, H.; et al. Relationship between Microvascular Status and Diagnostic Performance of Stress Dynamic CT Perfusion Imaging. Eur. Radiol. 2024. [Google Scholar] [CrossRef]
- Michallek, F.; Nakamura, S.; Ota, H.; Ogawa, R.; Shizuka, T.; Nakashima, H.; Wang, Y.-N.; Ito, T.; Sakuma, H.; Dewey, M.; et al. Fractal Analysis of 4D Dynamic Myocardial Stress-CT Perfusion Imaging Differentiates Micro- and Macrovascular Ischemia in a Multi-Center Proof-of-Concept Study. Sci. Rep. 2022, 12, 5085. [Google Scholar] [CrossRef]
- Mandadapu, S.R.; Weerawarna, P.M.; Prior, A.M.; Uy, R.A.Z.; Aravapalli, S.; Alliston, K.R.; Lushington, G.H.; Kim, Y.; Hua, D.H.; Chang, K.-O.; et al. Macrocyclic Inhibitors of 3C and 3C-like Proteases of Picornavirus, Norovirus, and Coronavirus. Bioorg. Med. Chem. Lett. 2013, 23, 3709–3712. [Google Scholar] [CrossRef]
- T. Chhabria, M.; Patel, S.; Modi, P.; S. Brahmkshatriya, P. Thiazole: A Review on Chemistry, Synthesis and Therapeutic Importance of Its Derivatives. Curr. Top. Med. Chem. 2016, 16, 2841–2862. [Google Scholar] [CrossRef]
- Libby, P.; Ridker, P.M.; Hansson, G.K. Inflammation in Atherosclerosis. J. Am. Coll. Cardiol. 2009, 54, 2129–2138. [Google Scholar] [CrossRef]
- Meurillon, M.; Marton, Z.; Hospital, A.; Jordheim, L.P.; Béjaud, J.; Lionne, C.; Dumontet, C.; Périgaud, C.; Chaloin, L.; Peyrottes, S. Structure–Activity Relationships of β-Hydroxyphosphonate Nucleoside Analogues as Cytosolic 5′-Nucleotidase II Potential Inhibitors: Synthesis, in Vitro Evaluation and Molecular Modeling Studies. Eur. J. Med. Chem. 2014, 77, 18–37. [Google Scholar] [CrossRef]
- Tonelli, M.; Sacks, F.; Pfeffer, M.; Gao, Z.; Curhan, G. Relation Between Serum Phosphate Level and Cardiovascular Event Rate in People With Coronary Disease. Circulation 2005, 112, 2627–2633. [Google Scholar] [CrossRef]
- Evans, K.; Nasim, Z.; Brown, J.; Clapp, E.; Amin, A.; Yang, B.; Herbert, T.P.; Bevington, A. Inhibition of SNAT2 by Metabolic Acidosis Enhances Proteolysis in Skeletal Muscle. J. Am. Soc. Nephrol. 2008, 19, 2119–2129. [Google Scholar] [CrossRef] [PubMed]
- Eckstein, F. Phosphorothioates, Essential Components of Therapeutic Oligonucleotides. Nucleic Acid Ther. 2014, 24, 374–387. [Google Scholar] [CrossRef]
- Neubauer, S. The Failing Heart—an Engine out of Fuel. N Engl J Med 2007, 356, 1140–1151. [Google Scholar] [CrossRef]
- Ingwall, J.S. Energy Metabolism in Heart Failure and Remodelling. Cardiovasc. Res. 2008, 81, 412–419. [Google Scholar] [CrossRef]
- Lesnefsky, E.J.; Chen, Q.; Hoppel, C.L. Mitochondrial Metabolism in Aging Heart. Circ. Res. 2016, 118, 1593–1611. [Google Scholar] [CrossRef]
- Smith, R.A.J.; Murphy, M.P. Mitochondria-Targeted Antioxidants as Therapies. Discov. Med. 2011, 11, 106–114. [Google Scholar]
- Gerszten, R.E.; Wang, T.J. The Search for New Cardiovascular Biomarkers. Nature 2008, 451, 949–952. [Google Scholar] [CrossRef]
- Dettmer, K.; Aronov, P.A.; Hammock, B.D. Mass Spectrometry-based Metabolomics. Mass Spectrom. Rev. 2007, 26, 51–78. [Google Scholar] [CrossRef]
- McGarrah, R.W.; Crown, S.B.; Zhang, G.-F.; Shah, S.H.; Newgard, C.B. Cardiovascular Metabolomics. Circ. Res. 2018, 122, 1238–1258. [Google Scholar] [CrossRef]
- Rosendorff, C.; Lackland, D.T.; Allison, M.; Aronow, W.S.; Black, H.R.; Blumenthal, R.S.; Cannon, C.P.; de Lemos, J.A.; Elliott, W.J.; Findeiss, L.; et al. Treatment of Hypertension in Patients With Coronary Artery Disease. J. Am. Coll. Cardiol. 2015, 65, 1998–2038. [Google Scholar] [CrossRef]
Figure 1.
A-B: Baseline time interval - load test completion.
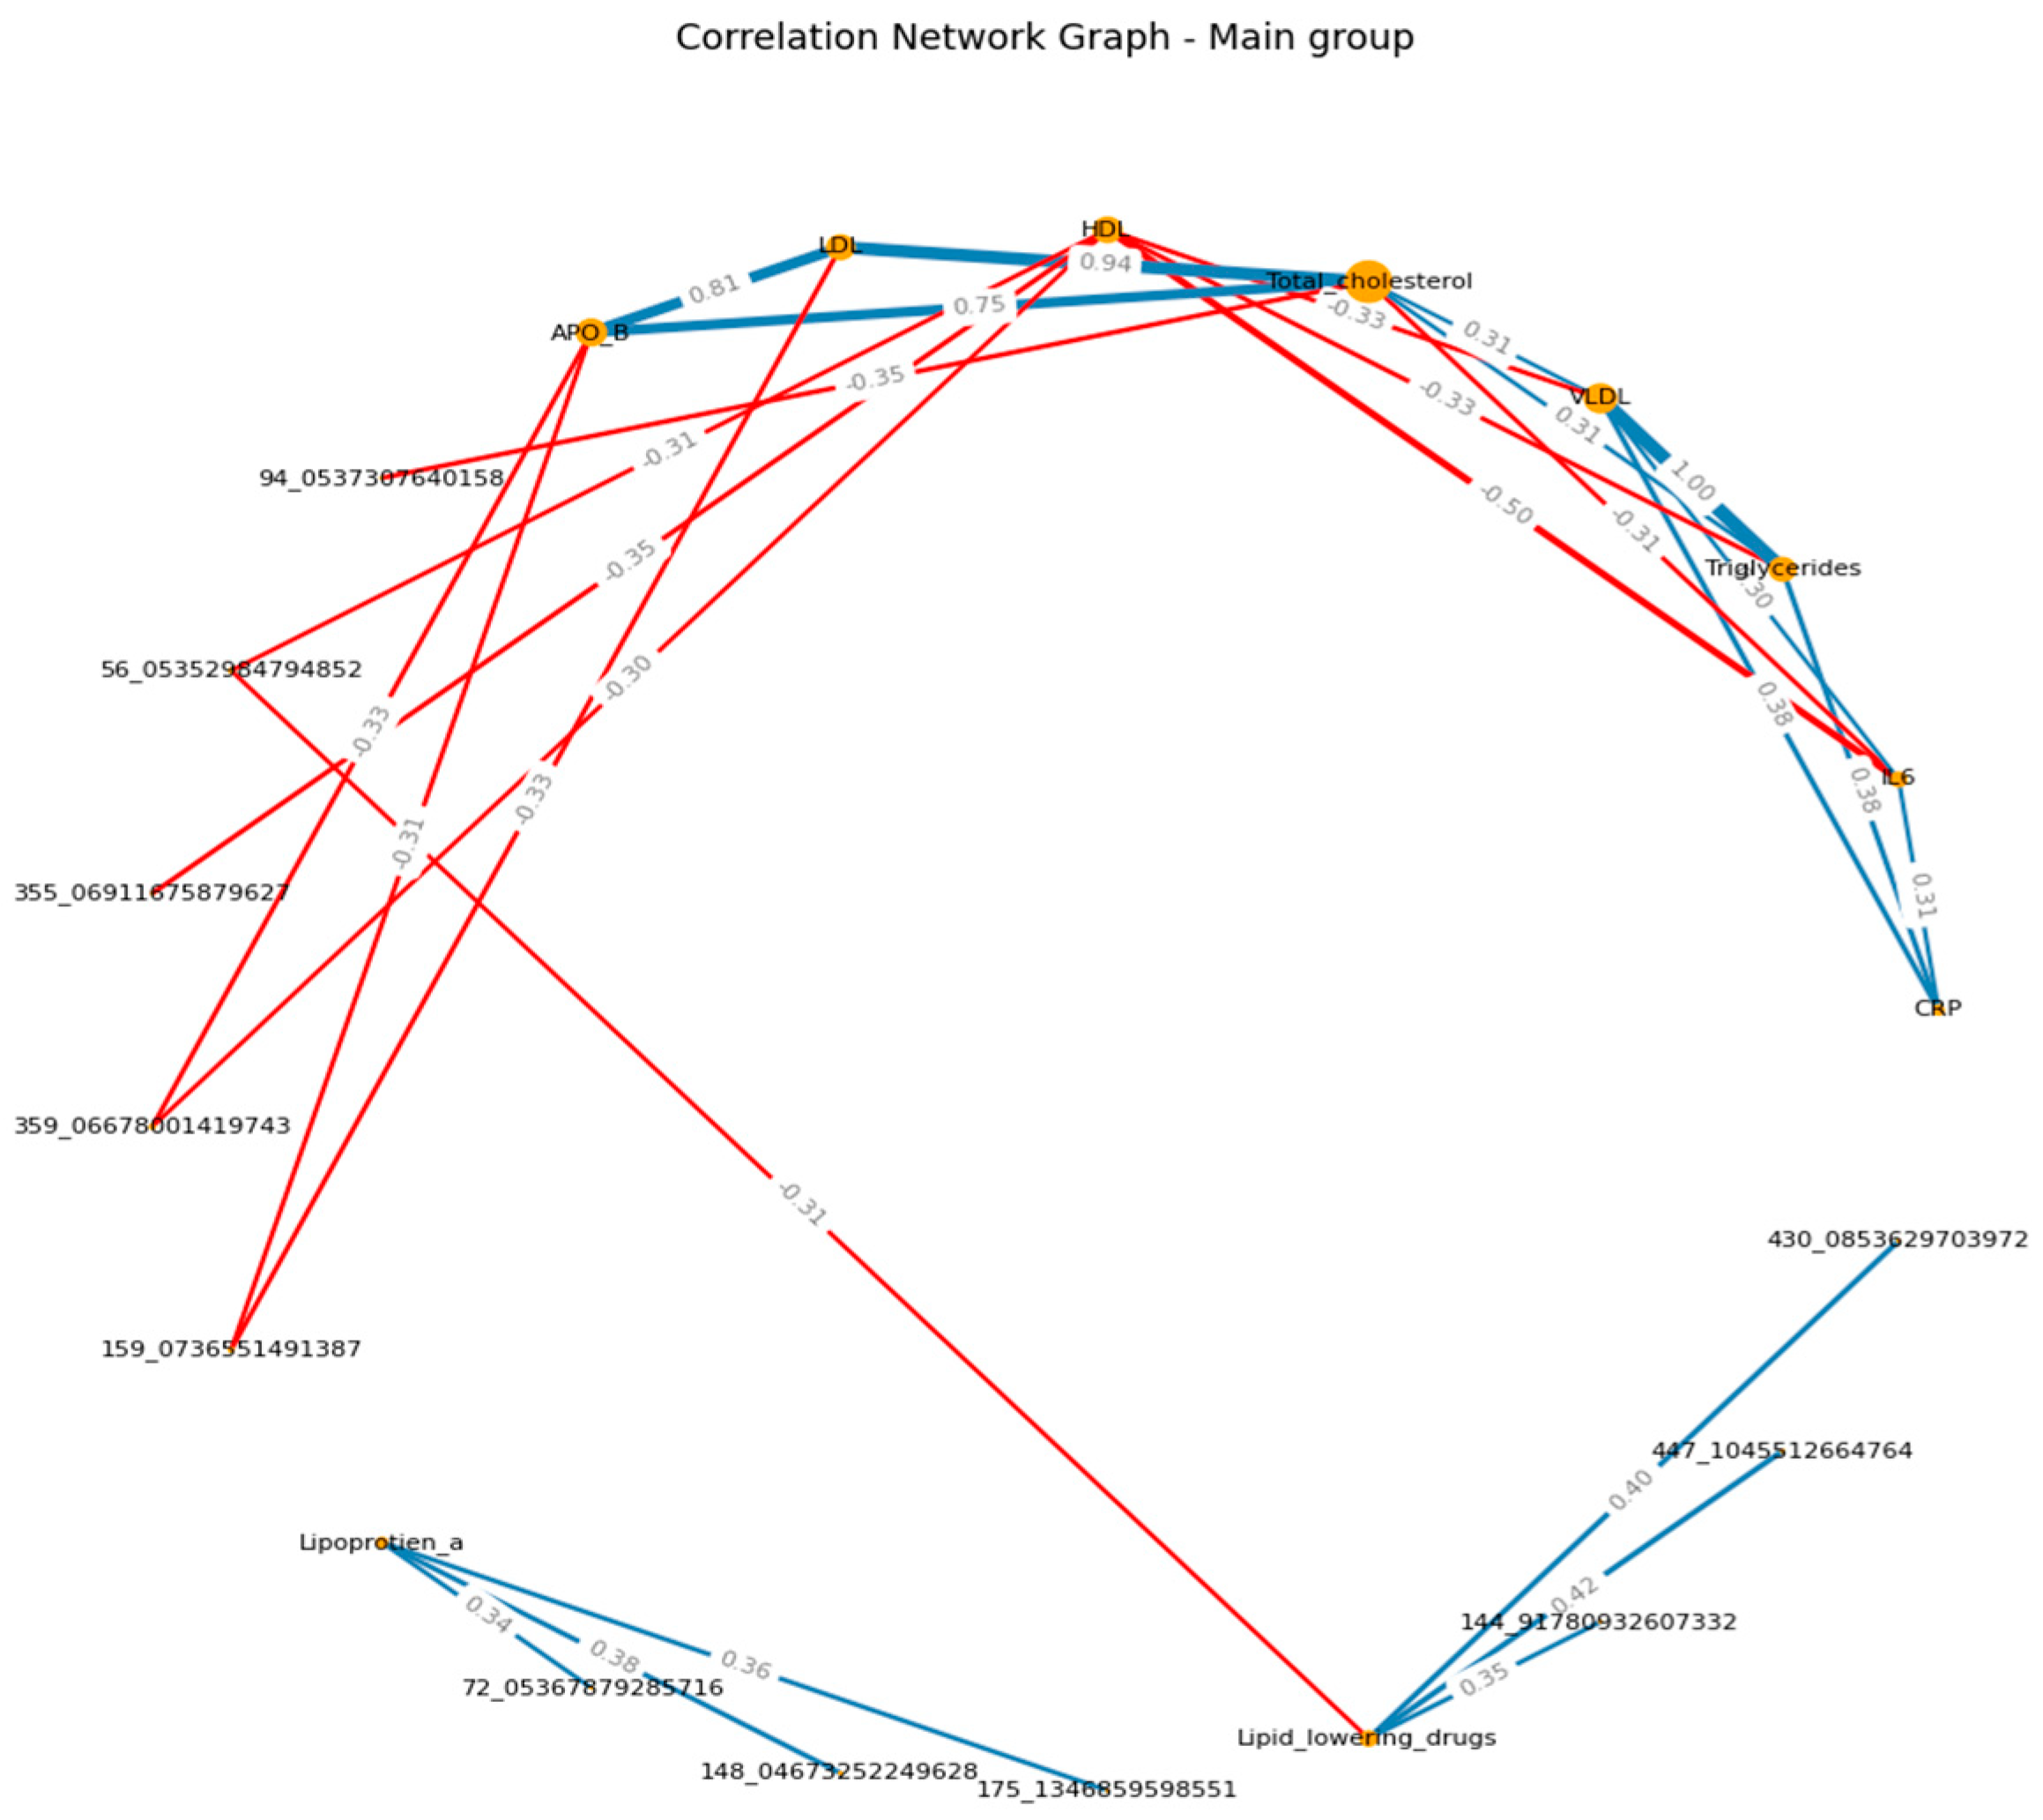
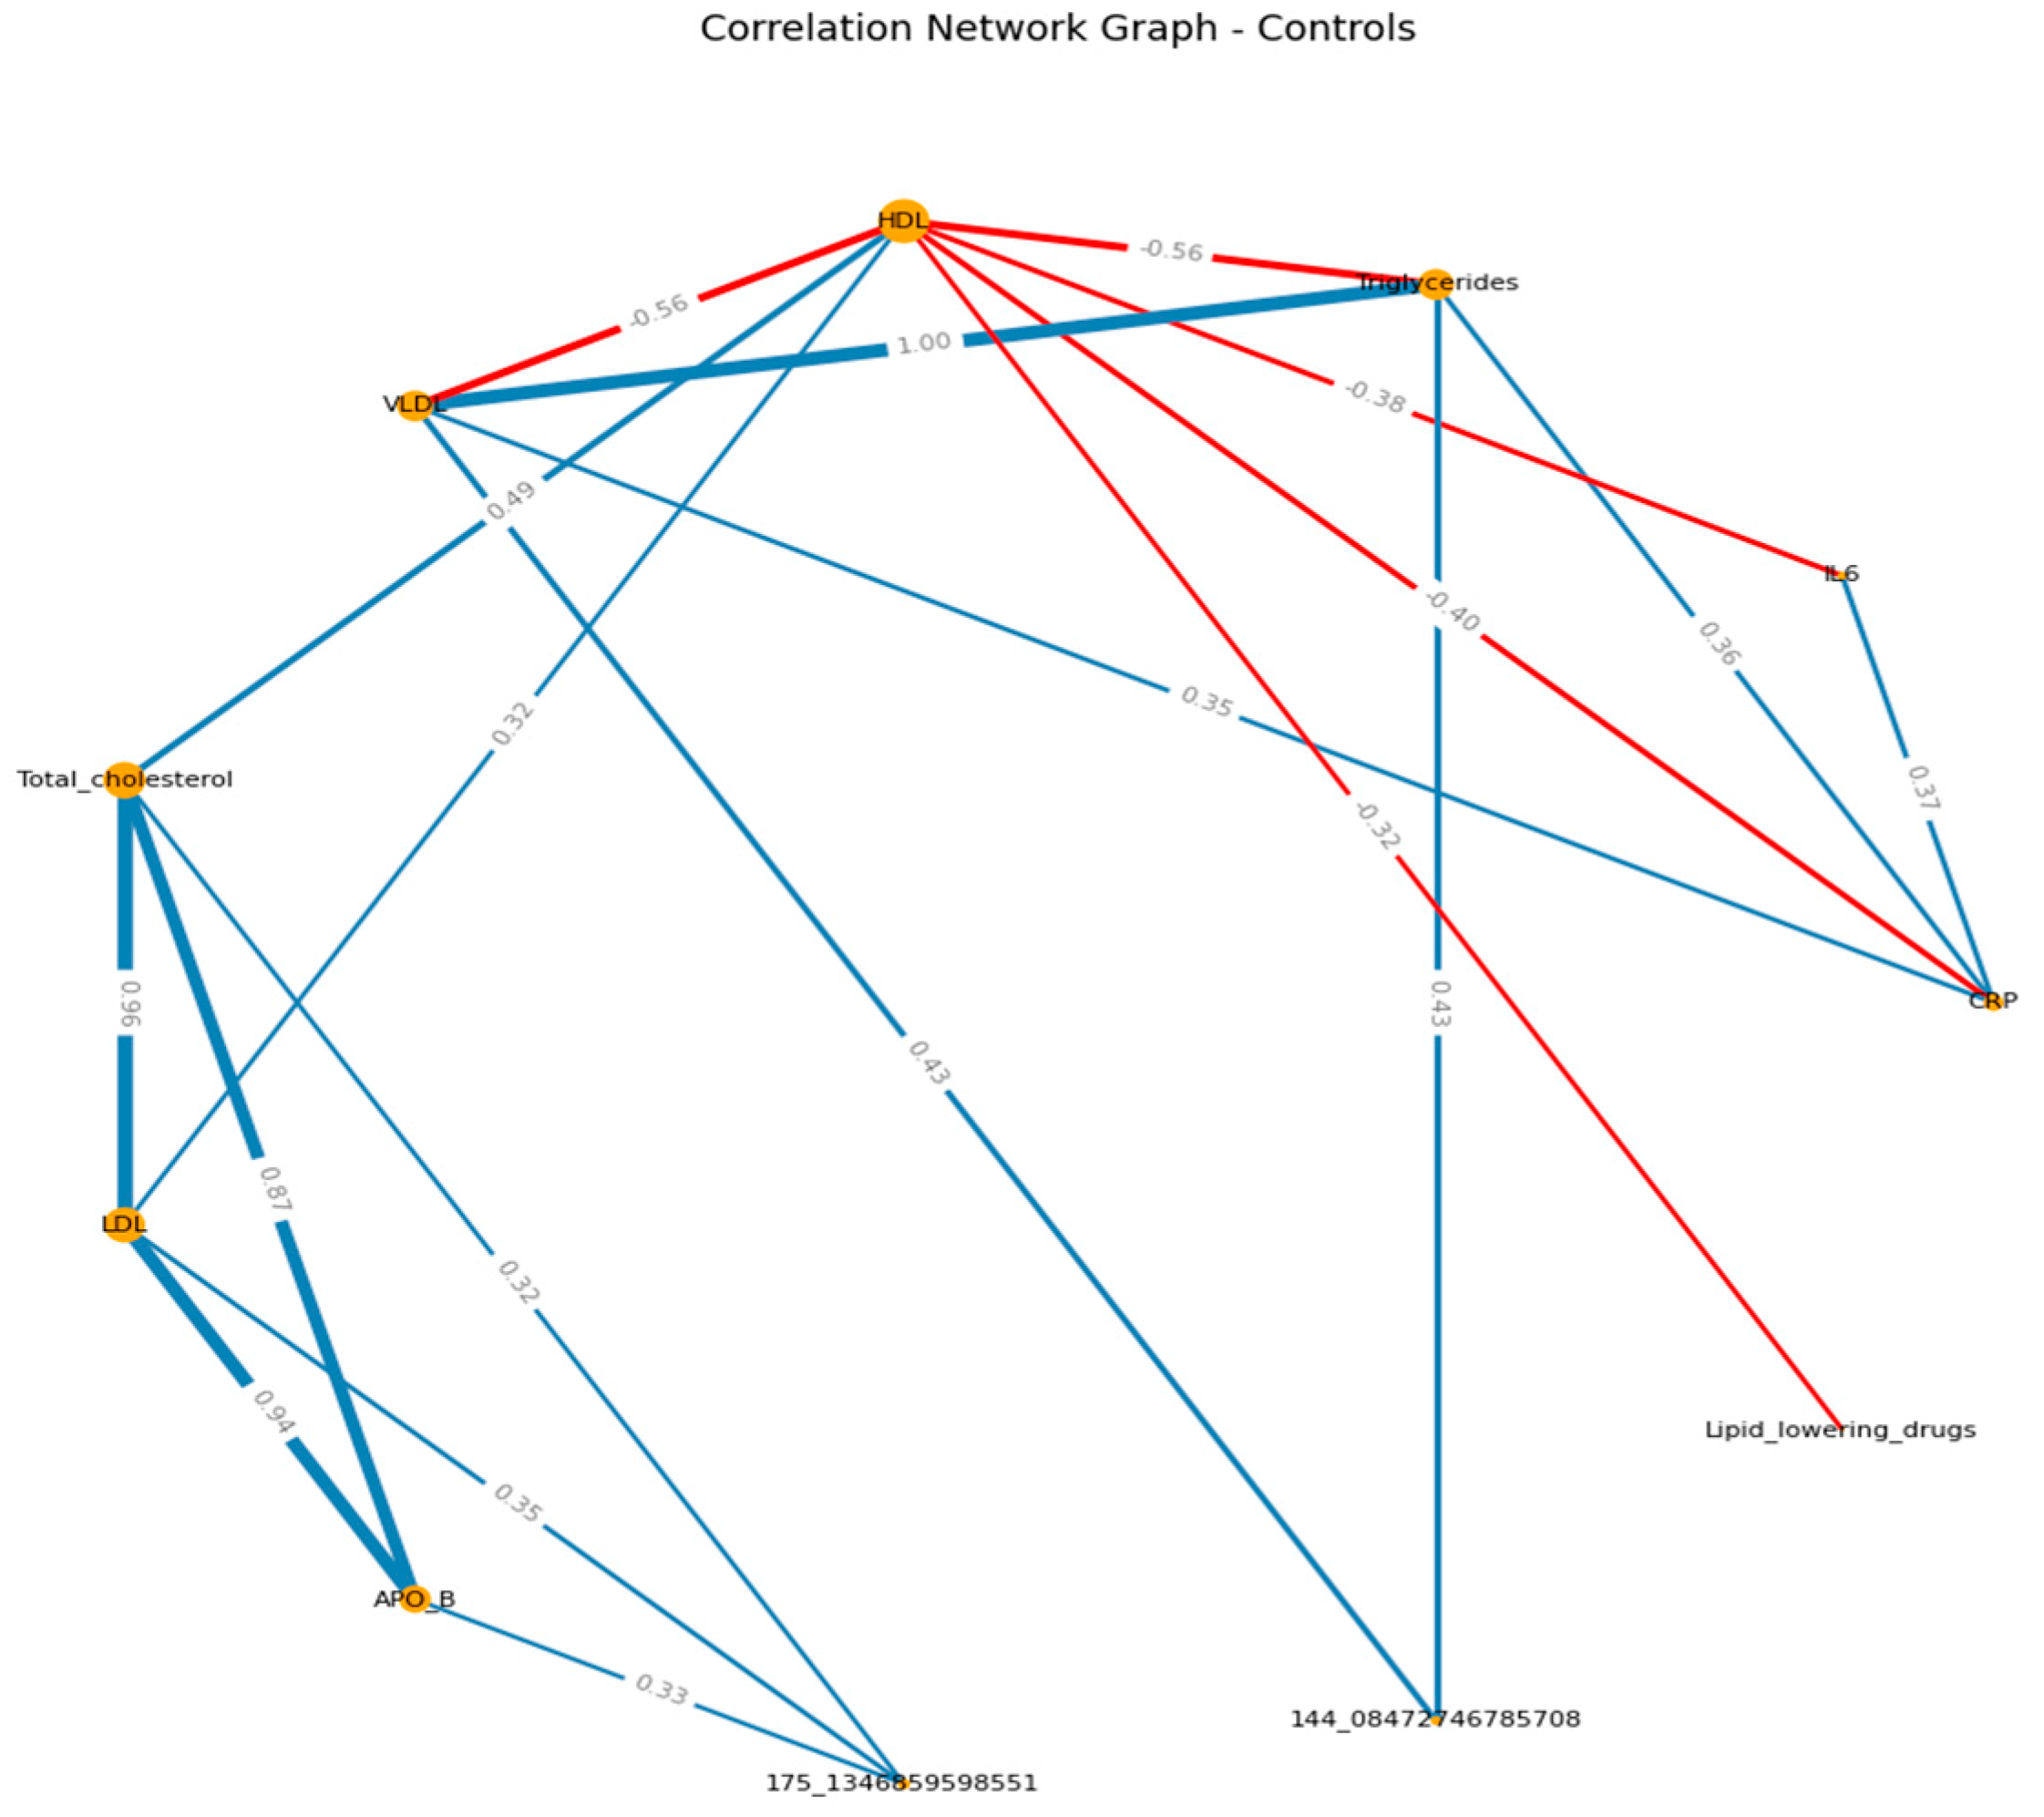
Figure 2.
A-B: Load test completion. – Recovery.
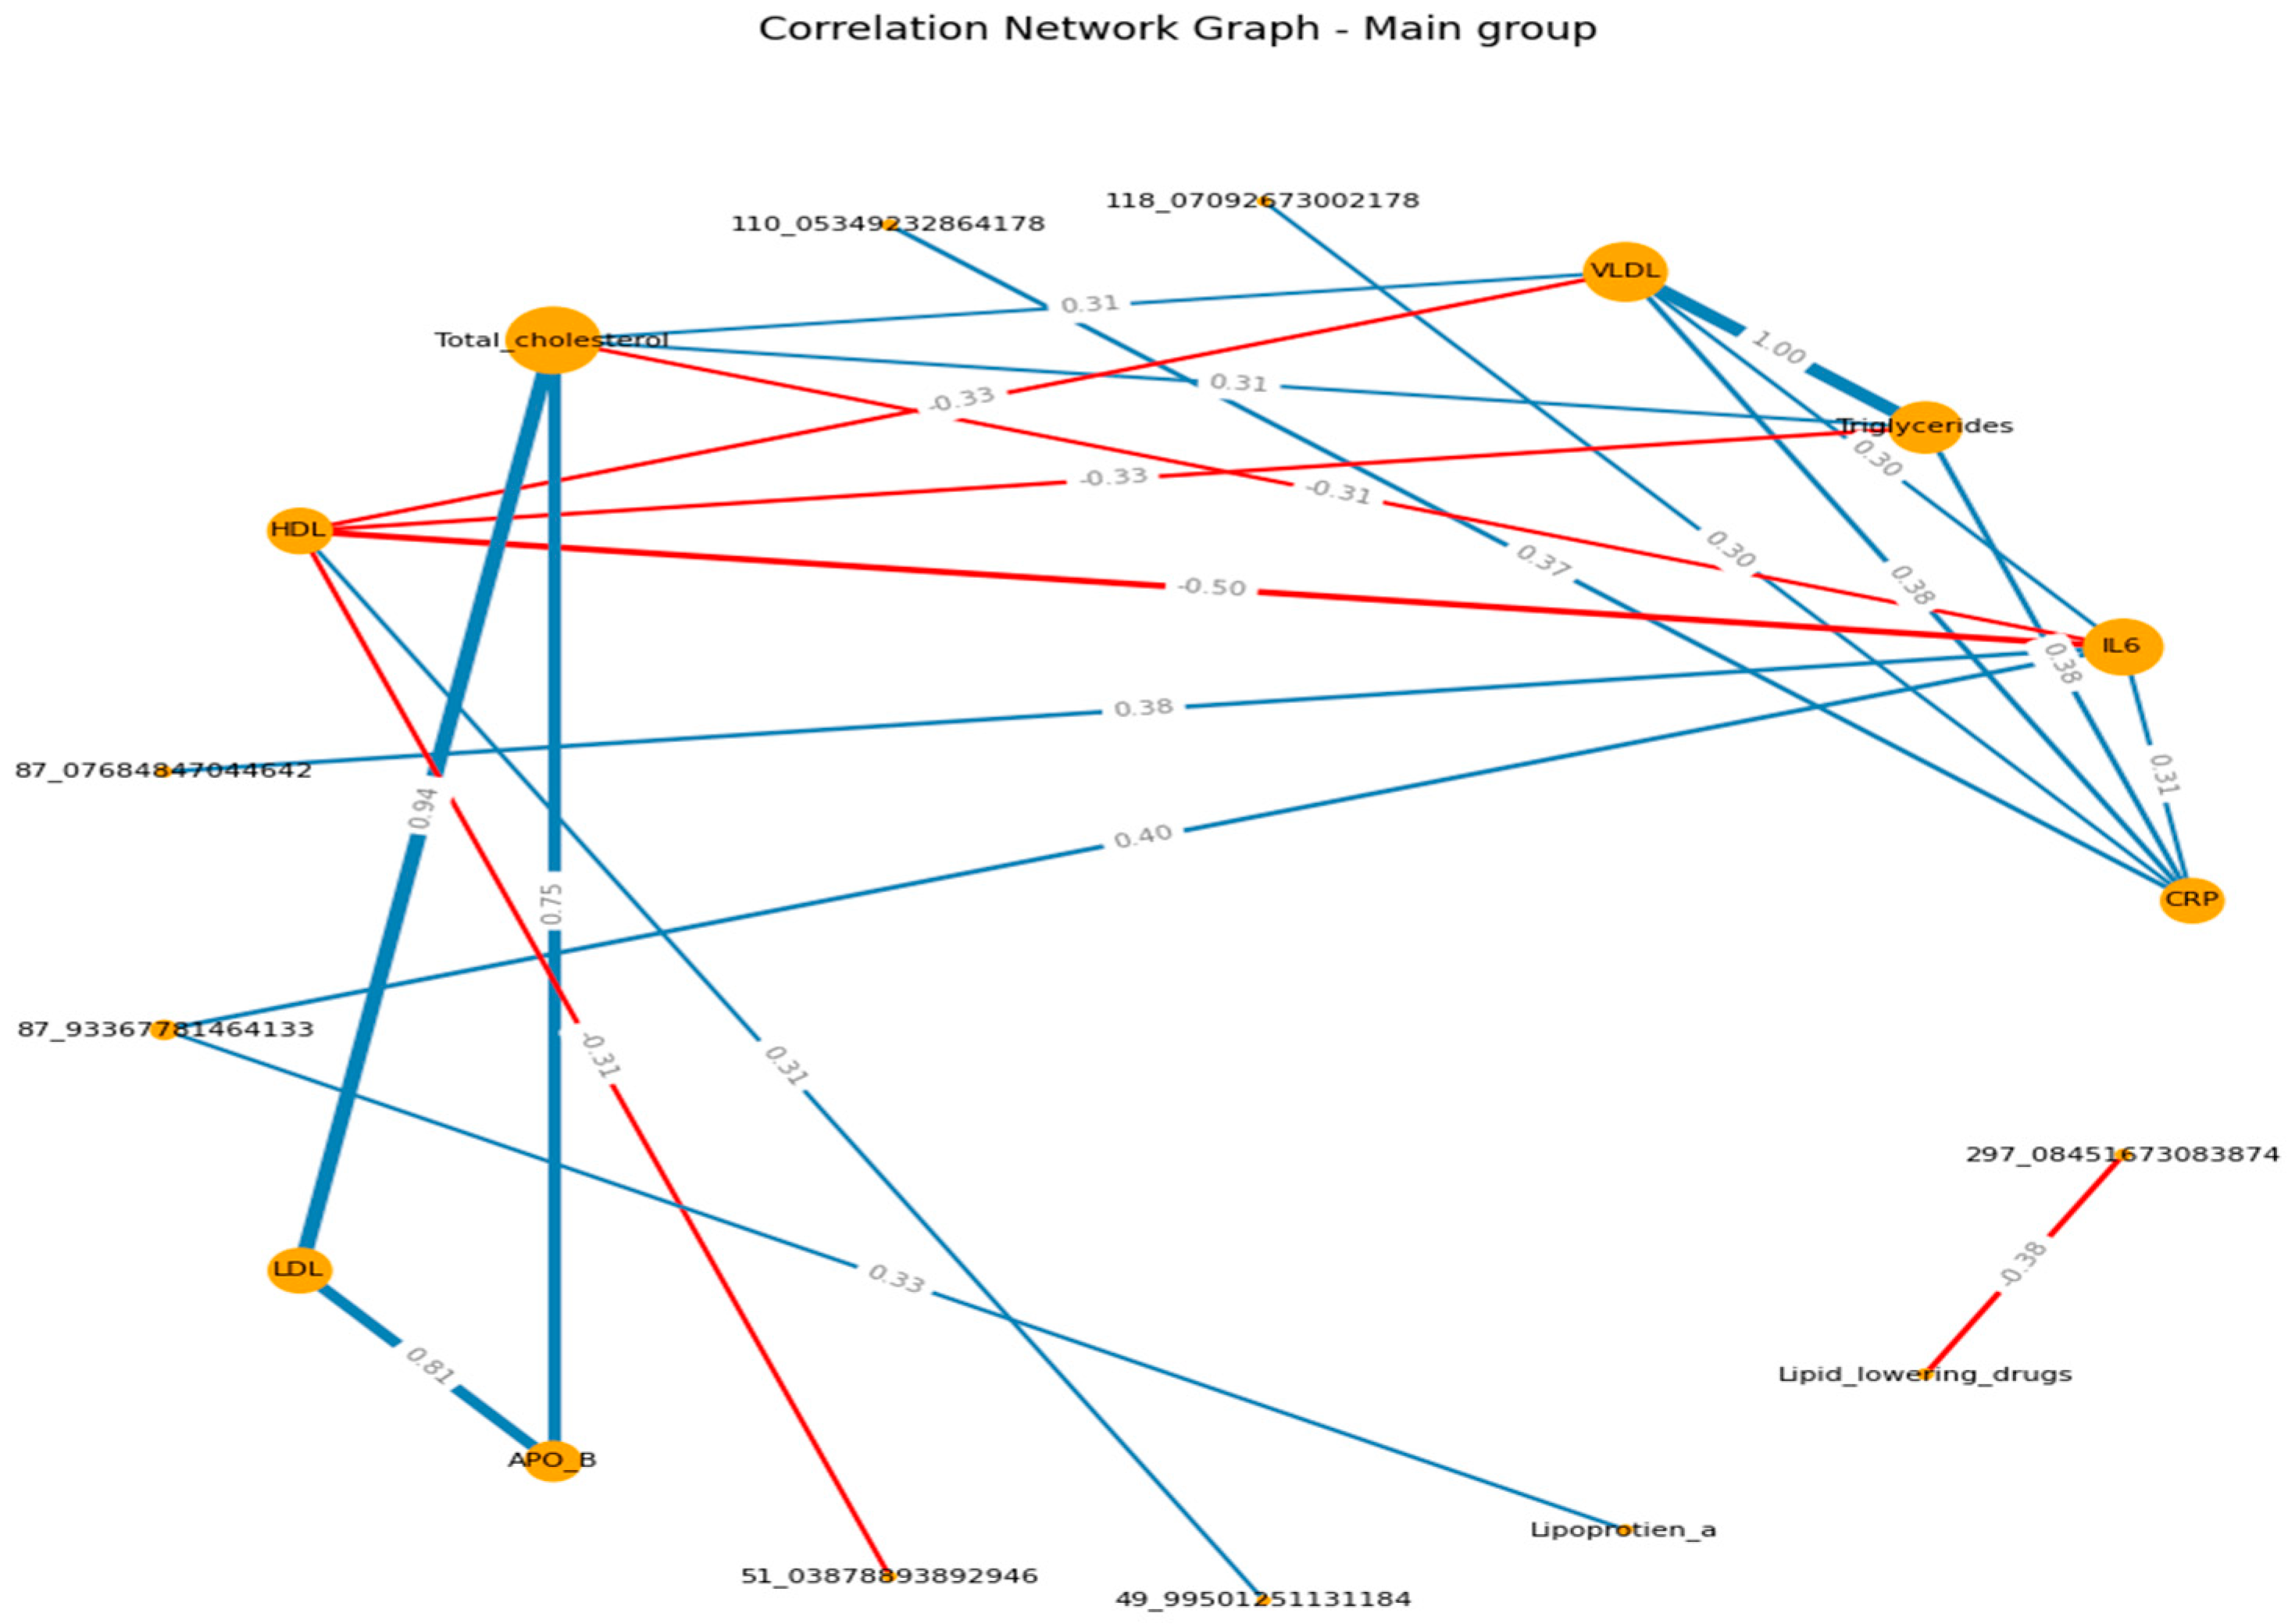
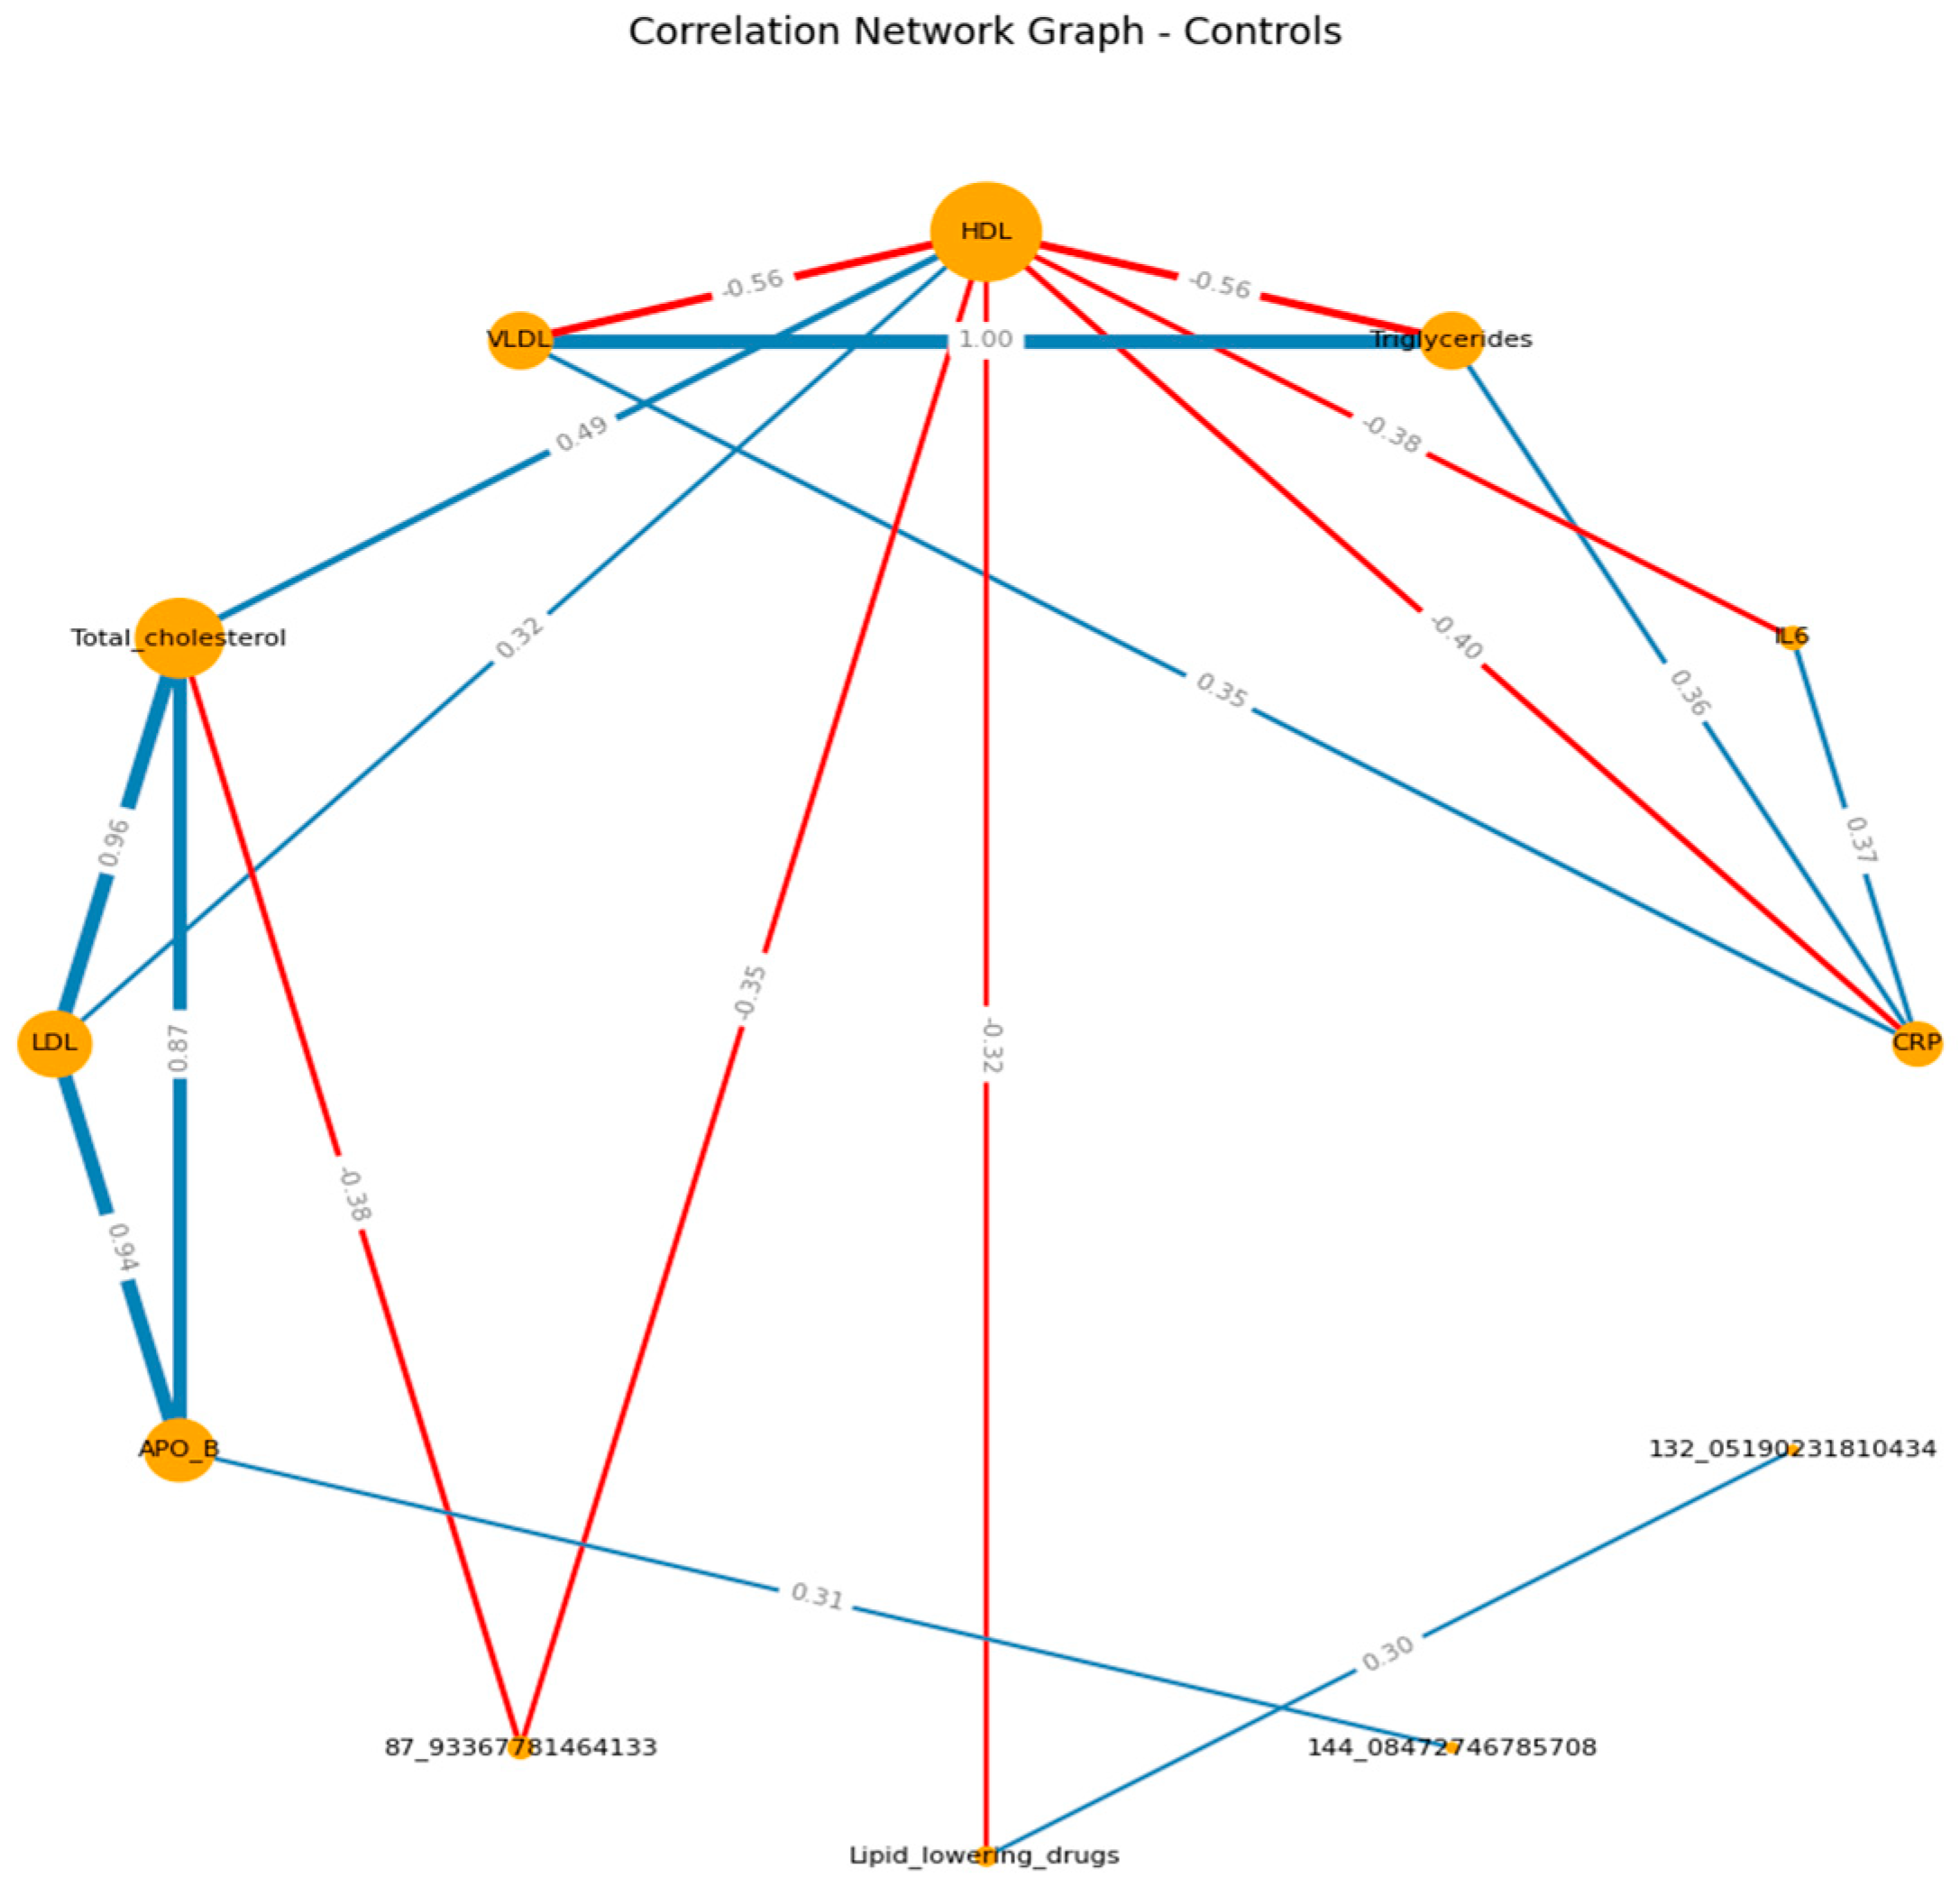
Figure 3.
A-B: Common VOCs.
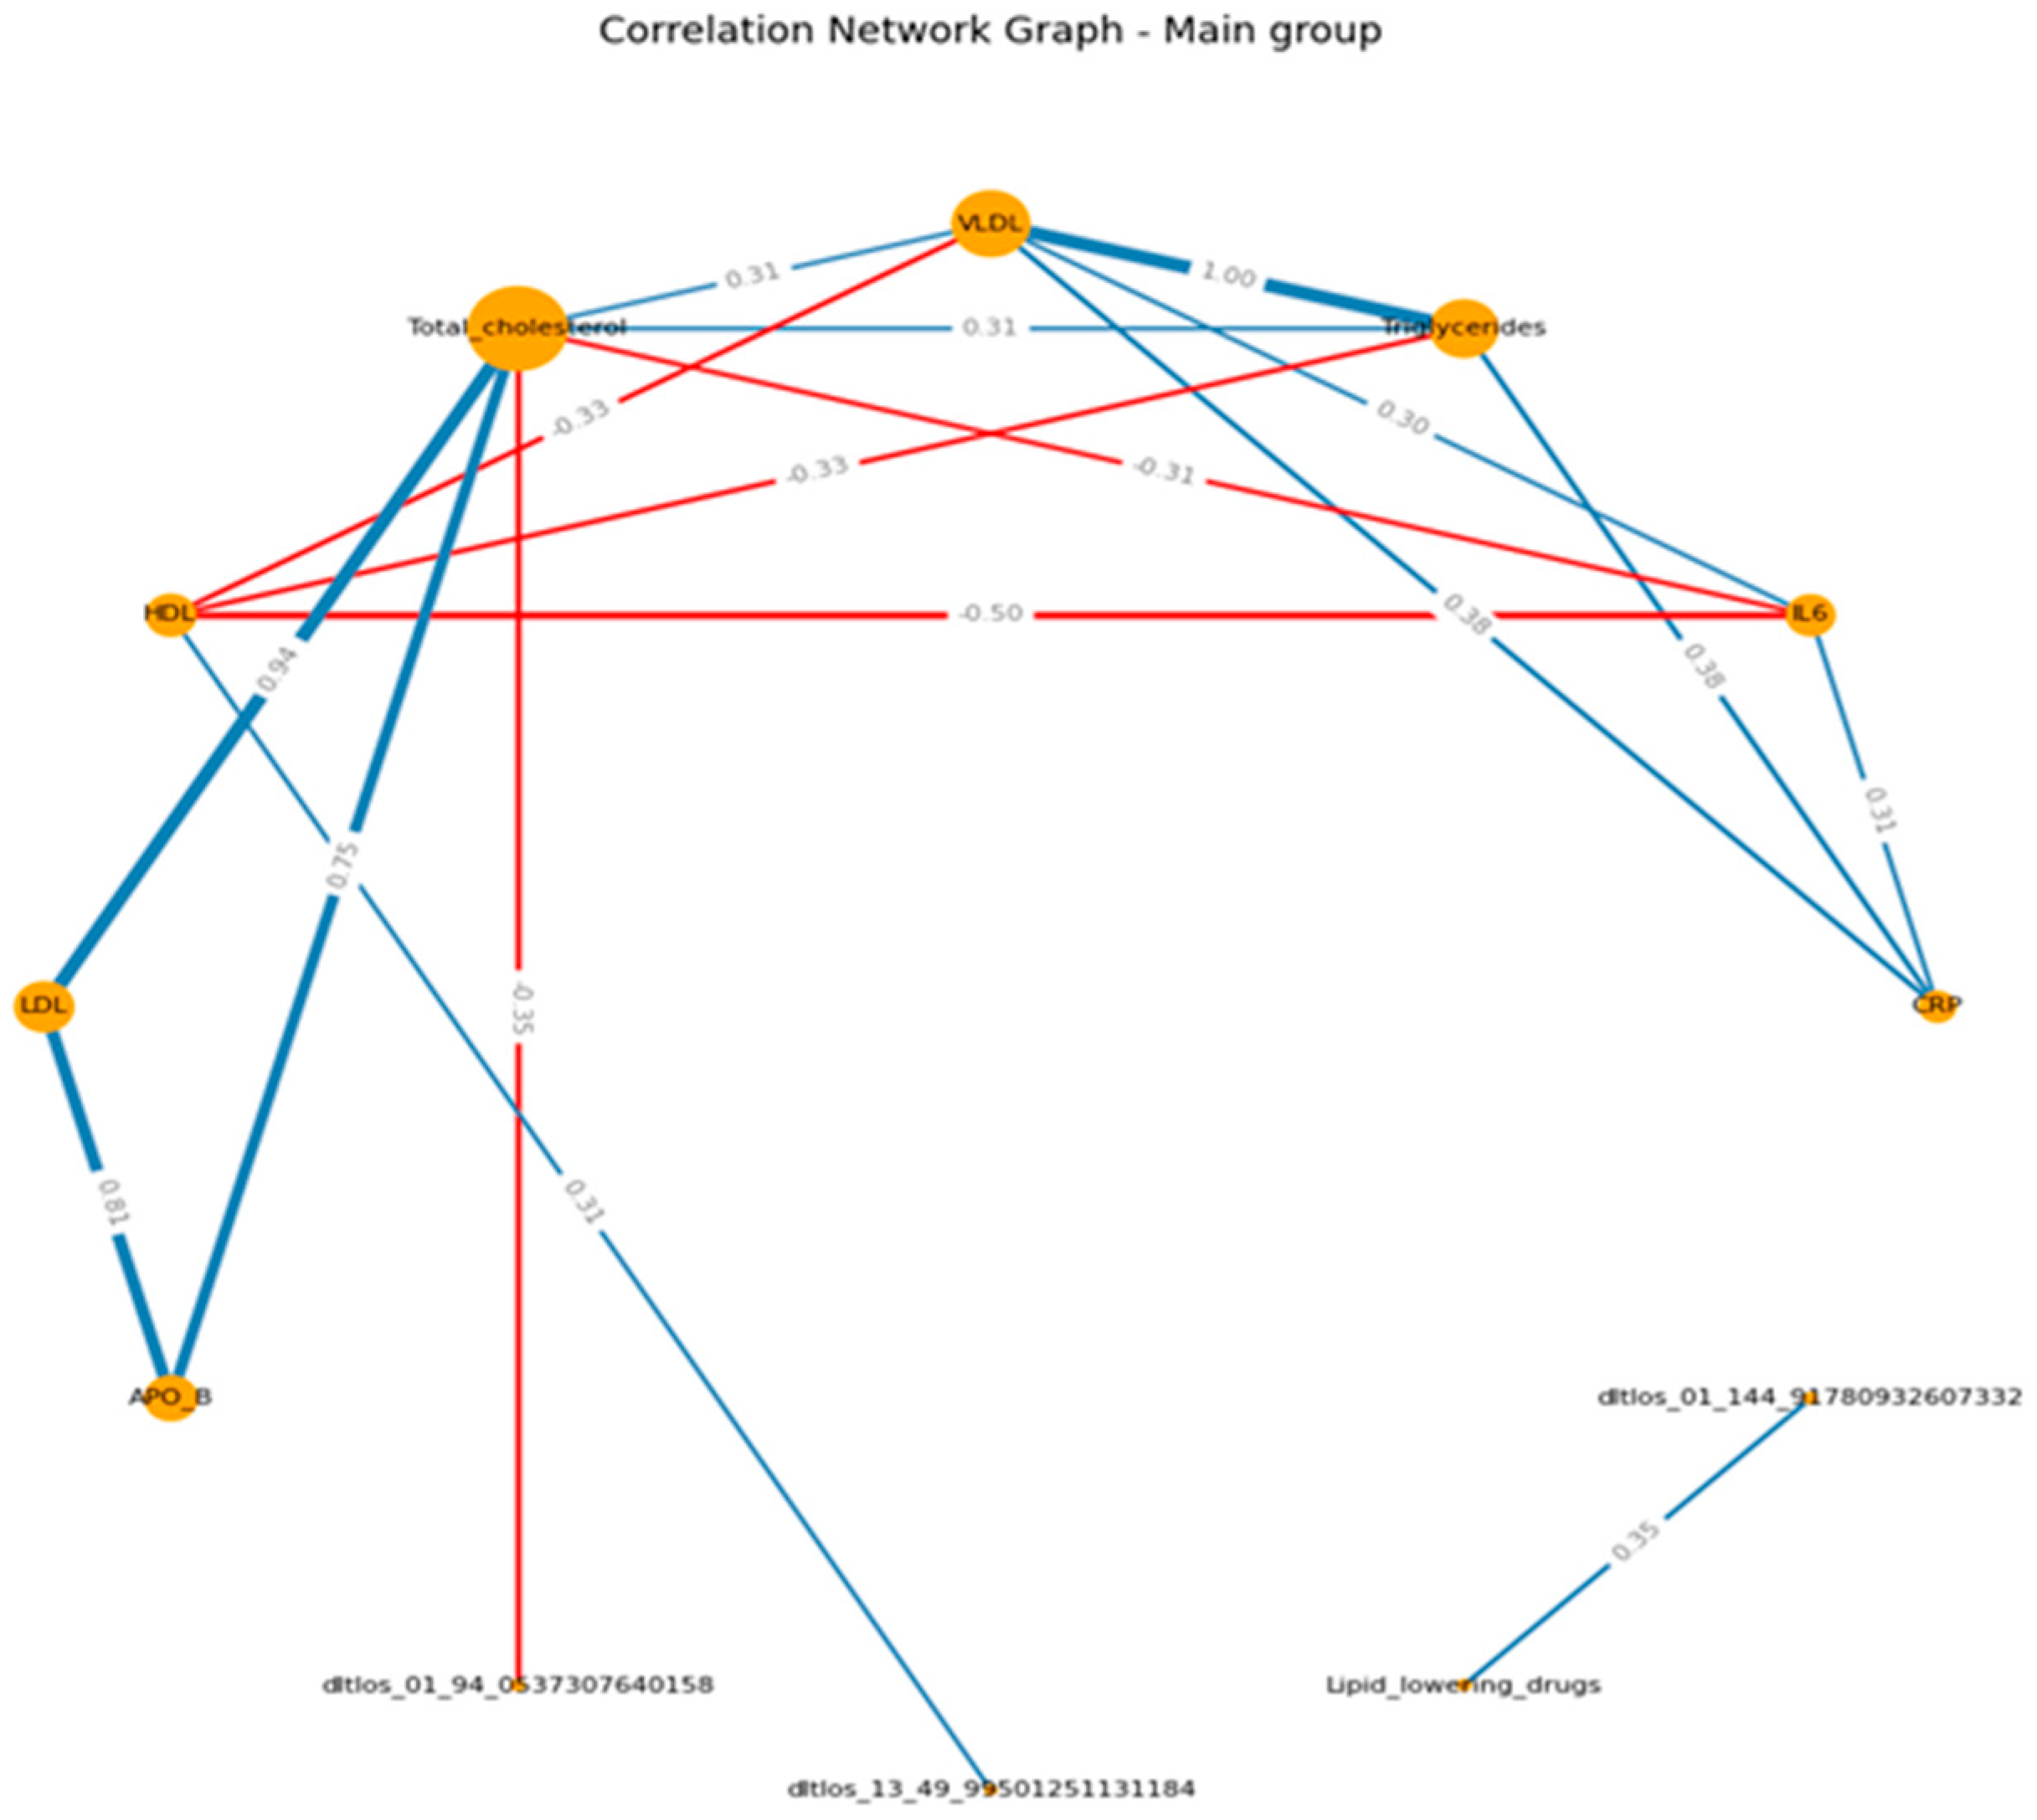
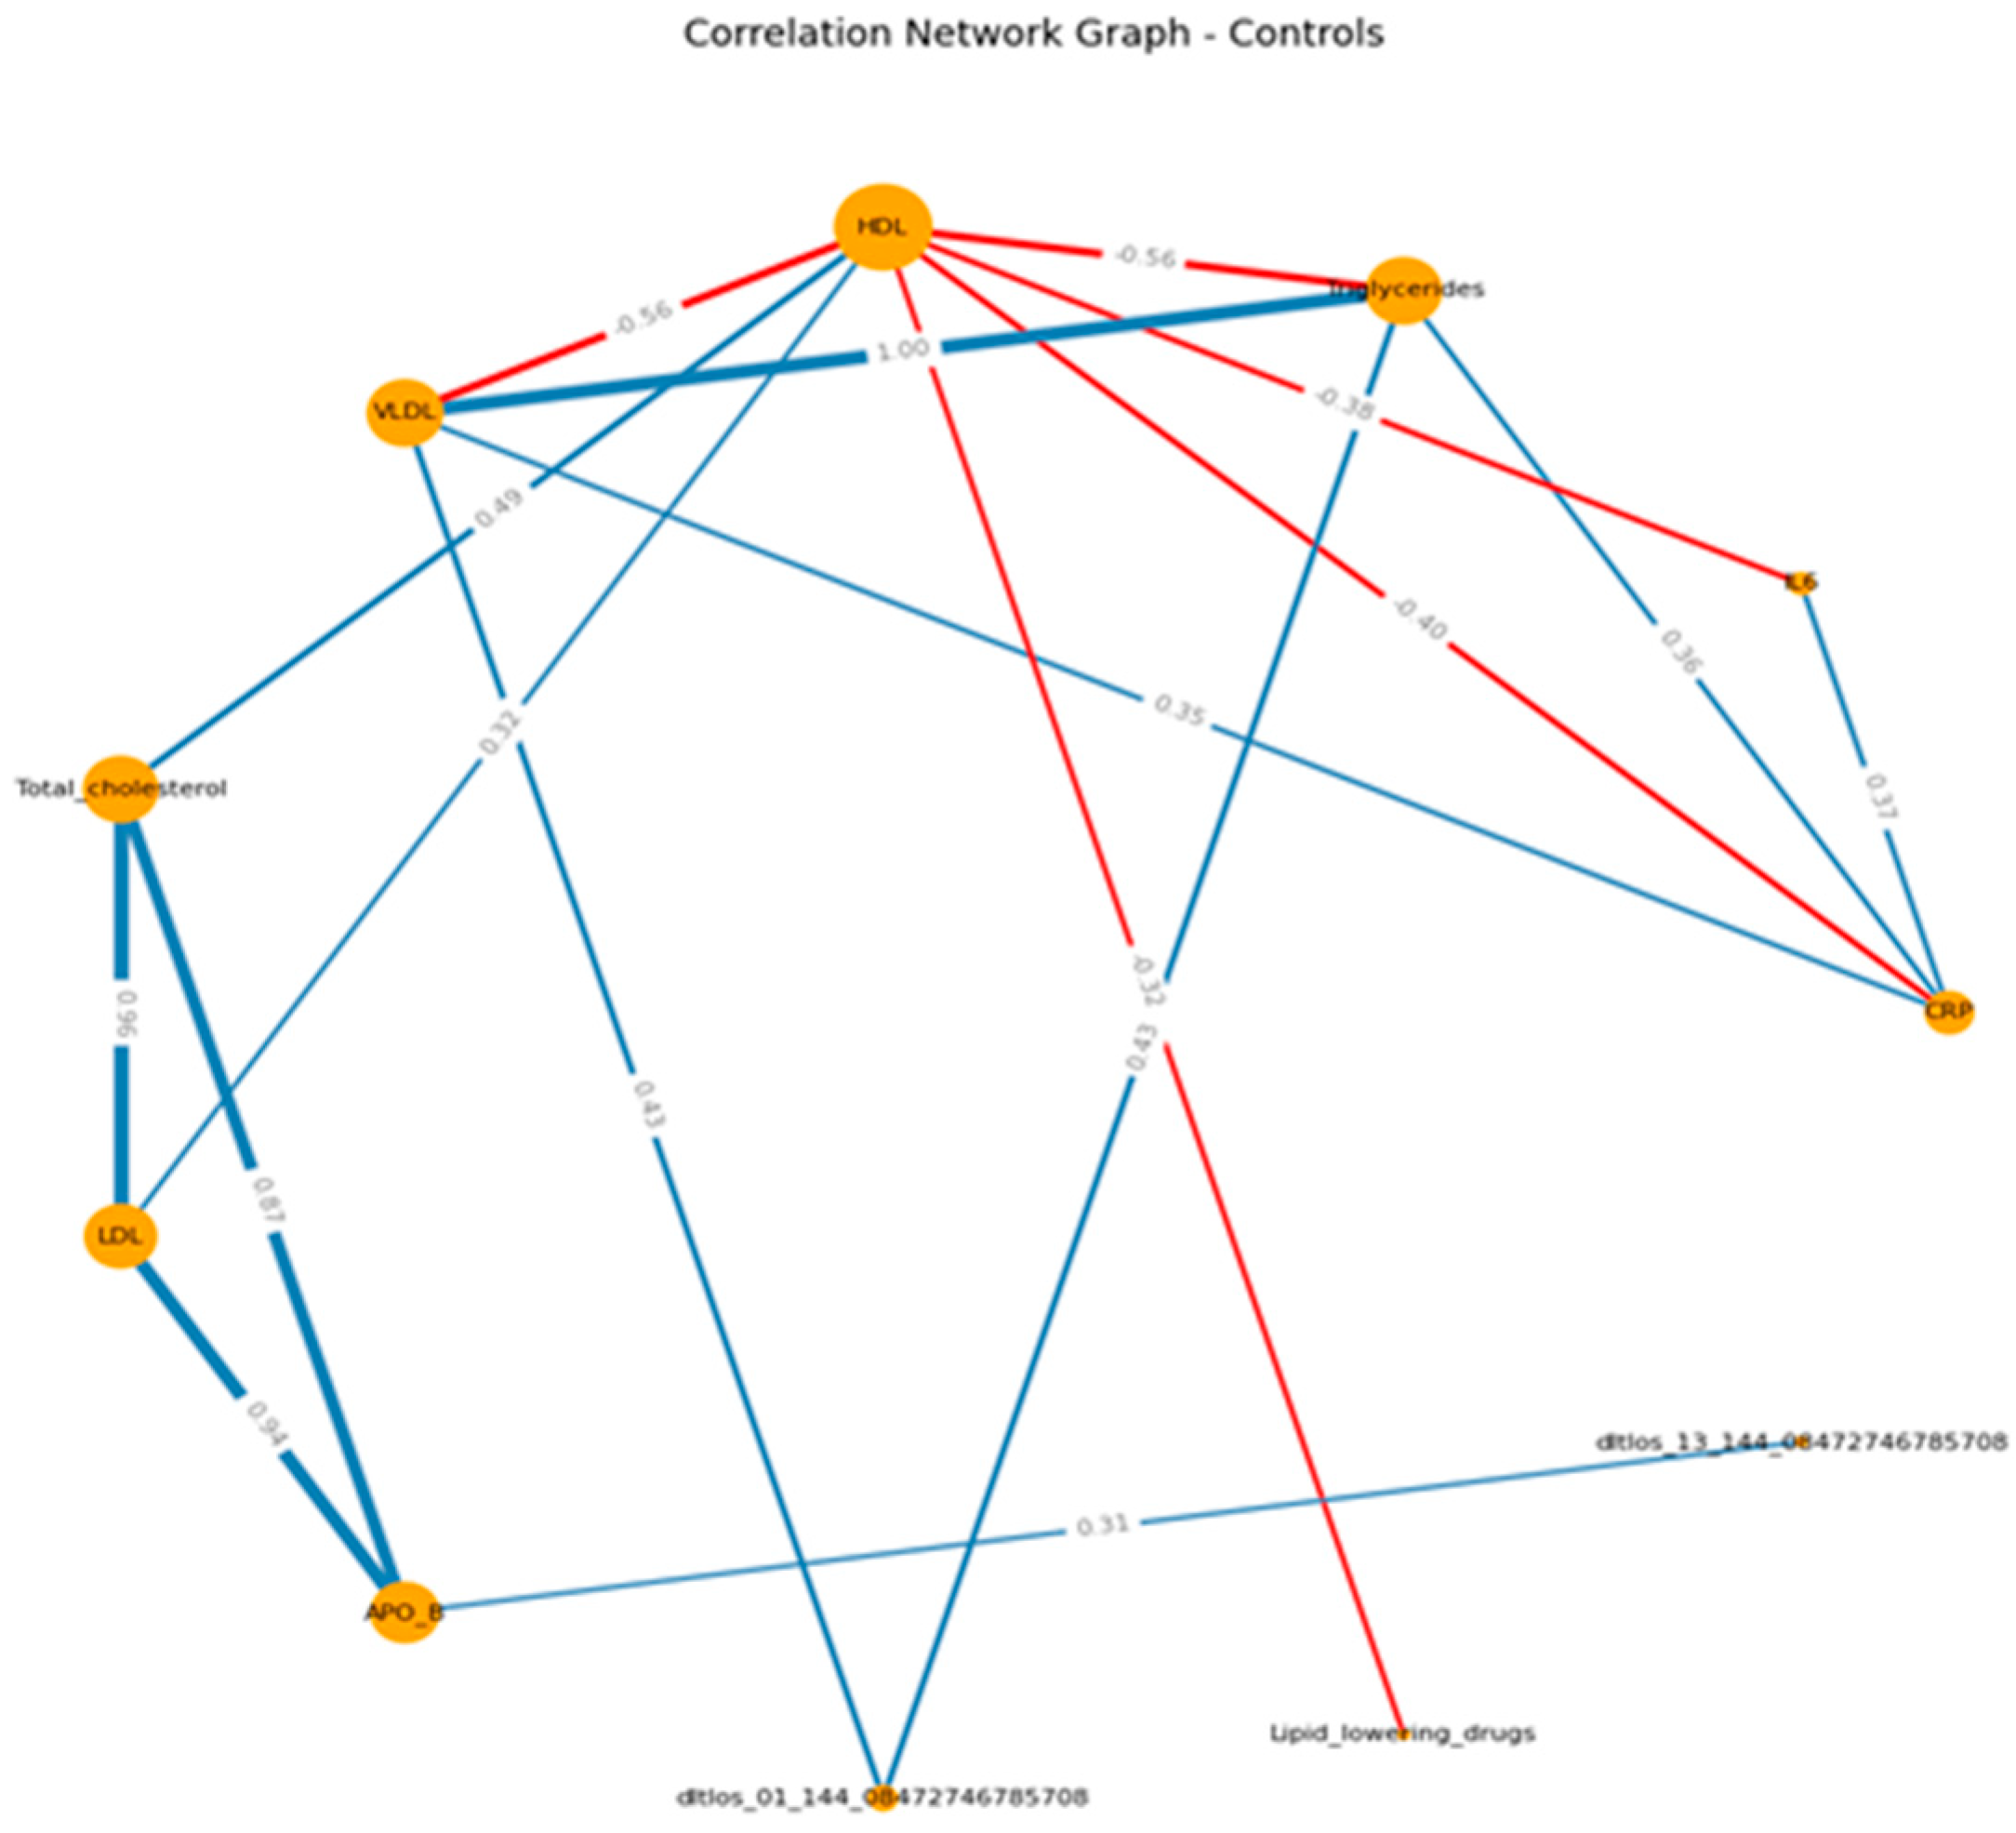
Table 1.
Laboratory reference values for male and female.
| Index | Male | Female |
|---|---|---|
| Total cholesterol (mmol/L) | <5.2 | <5.2 |
| Triglycerides (mmol/L) | <1.7 | <1.7 |
| HDL (mmol/L) | >1.6 | >1.6 |
| LDL (mmol/L) | <3.3 | <3.3 |
| VLDL (mmol/L) | 0.19-0.77 | 0.19-0.77 |
| Atherogenic index (calculated) | 2,2-3,5 | 2.2-3.5 |
| Apolipoprotein B (g/L) | 0,60:1,40 | 0.55:1.30 |
| Lipoprotein a (mg/L) | 0,0 - 300,0 | 0.0 - 300.0 |
| CRP (IU/L) | < 5 | < 5 |
| IL-6 (pg/ml) | <10 | <10 |
Table 2.
Reference Value for SCORE2, SCORE2-OP и SMART risk score.
| Index | SCORE2 | SCORE2-OP (70 - 90 years age) | |
| 40 - 50 years age | 50-69 years age | ||
| Low | < 2,5 % | < 5 % | < 7,5 % |
| Moderate | 2,5-7,5 % | 5-10 % | 7,5 -15 % |
| High | ≥7,5 % | ≥ 10 % | ≥ 15% |
| Index | SMART risk score (30 – 90 years age) | ||
| Low | < 10 % | ||
| Moderate | 10-19 % | ||
| High | 20-29 % | ||
| Very high | 30-39 % | ||
| Extremely High | ≥ 40 % | ||
Table 5.
The quality of the bicycle ergometry appeared quite low in our cohort.
| Chars | Point estimate | 95%CI |
|---|---|---|
| AUC | 0.507 | [0.388 ; 0.625] |
| Sensitivity | 0.484 | [0.306 ; 0.657] |
| Specificity | 0.531 | [0.392 ; 0.673] |
| Negative predictive value | 0.619 | [0.465 ; 0.758] |
| Positive predictive value | 0.395 | [0.238 ; 0.553] |
Table 6.
The selected VOCs, which have the most important role in the baseline stage.
| Factor | Coeff |
|---|---|
| 144.91780 | 0.00938 |
| 159.07365 | 0.00803 |
| 56.053529 | 0.00718 |
| 59.057819 | 0.00385 |
| 72.053678 | 0.00223 |
| 355.06911 | 0.00217 |
| 71.054029 | 0.00212 |
| 49.995012 | 0.00195 |
| 43.047418 | 0.00184 |
| 148.046732 | 0.00171 |
| 94.0537307 | 0.00159 |
| 44.9914437 | 0.00138 |
| 447.104551 | 0.00137 |
| 63.0213147 | 0.00095 |
| 144.084727 | 0.00094 |
| 359.066780 | 0.00084 |
| 430.085362 | 0.00062 |
| 175.134685 | 0.00043 |
Table 7.
The diagnostic accuracy of the built model.
| Chars | Point estimate | 95% CI |
|---|---|---|
| Area Under Curve (AUC) | 0.968 | [0.931 ; 0.993] |
| Sensitivity | 0.903 | [0.786 ; 1.000] |
| Specificity | 0.918 | [0.833 ; 0.981] |
| Negative predictive value | 0.938 | [0.857 ; 1.00] |
| Positive predictive value | 0.875 | [0.75 ; 0.931] |
Table 8.
The selected VOCs that have an important role in the recovery period.
| Factor | Coeff |
|---|---|
| 51.03878 | 0.01694 |
| 49.99501 | 0.01478 |
| 132.05190 | 0.01418 |
| 144.91780 | 0.01034 |
| 87.076848 | 0.00865 |
| 94.053730 | 0.00587 |
| 87.933677 | 0.0047 |
| 118.07092 | 0.00376 |
| 110.05349 | 0.00205 |
| 144.08472 | 0.00158 |
| 44.014505 | 0.00153 |
| 297.08451 | 0.00121 |
| 119.95504 | 0.00009 |
Table 9.
The diagnostic accuracy of the built model.
| Chars | Point estimate | 95% CI |
|---|---|---|
| Area Under Curve (AUC) | 0.994 | [0.981 ; 1.000] |
| Sensitivity | 0.903 | [0.788 ; 1.000] |
| Specificity | 0.980 | [0.935 ; 1.000] |
| Negative predictive value | 0.941 | [0.873 ; 1.000] |
| Positive predictive value | 0.966 | [0.889 ; 1.000] |
Table 10.
The diagnostic accuracy of the built model.
| Chars | Point estimate | 95% CI |
|---|---|---|
| Area Under Curve (AUC) | 0.931 | [0.869 ; 0.978] |
| Sensitivity | 0.613 | [0.435 ; 0.793] |
| Specificity | 1.000 | [1.000 ; 1.000] |
| Negative predictive value | 0.803 | [0.692 ; 0.903] |
| Positive predictive value | 1.000 | [1.000 ; 1.000] |
Table 11.
The selected predictors arranged ascendingly according to the importunacy in the built model.
Table 11.
The selected predictors arranged ascendingly according to the importunacy in the built model.
| Factor | Coeff. |
|---|---|
| HDL | 0.110409 |
| Lipid_lowering_drugs | 0.108628 |
| CRP | 0.107933 |
| Lipoprotien_a | 0.103706 |
| IL6 | 0.103494 |
| Total_cholesterol | 0.10115 |
| APO_B | 0.0975365 |
| Triglycerides | 0.0893278 |
| LDL | 0.0754772 |
| VLDL | 0.000 |
Table 12.
The diagnostic accuracy of the built model.
| Chars | Point estimate | 95% CI |
|---|---|---|
| Area Under Curve (AUC) | 0.528 | [0.367 ; 0.568] |
| Sensitivity | 0.290 | [0.133 ; 0.45 ] |
| Specificity | 0.653 | [0.521 ; 0.784] |
| Negative predictive value | 0.593 | [0.463 ; 0.717] |
| Positive predictive value | 0.346 | [0.161 ; 0.52 ] |
Table 13.
Comparative presentation of the most significantly VOCs in the exhaled breath analysis of individuals with ischemic heart disease and without ischemic heart disease. The presented m/z (mass/charge) ratios in our study are close to m/z ratios published in the literature or from the chemical substances’ library provided by the Human Metabolome Database (HMD). In case that the m/z ratio does not have a known chemical name, represented as a chemical formula. * Can be two or more chemical substances according to the found m/z. In bold, these are the common m/z during the baseline time interval - load test completion and load test completion. – recovery.
Table 13.
Comparative presentation of the most significantly VOCs in the exhaled breath analysis of individuals with ischemic heart disease and without ischemic heart disease. The presented m/z (mass/charge) ratios in our study are close to m/z ratios published in the literature or from the chemical substances’ library provided by the Human Metabolome Database (HMD). In case that the m/z ratio does not have a known chemical name, represented as a chemical formula. * Can be two or more chemical substances according to the found m/z. In bold, these are the common m/z during the baseline time interval - load test completion and load test completion. – recovery.
|
m/z in our study |
Name of the chemical substance | Chemical formula | Annotation Method | mass error | Coeff | Error, ppm | References |
|---|---|---|---|---|---|---|---|
| 43.04741899 | N/A | N/A | N/A | N/A | 0.00184 | N/A | [15] |
| *44.01450529 | Cyanate | CHNO | HMD | -0.0014148530245989832 | 0.00153 | -32.14515340515334 | [15] |
| 44.99144371 | N/A | N/A | N/A | N/A | 0.00138 | N/A | [15] |
| 49.99501251 | N/A | N/A | N/A | N/A | 0.00195 | N/A | [15] |
| 49.99501251 | N/A | N/A | N/A | N/A | 0.01478 | N/A | [15] |
| 51.03878894 | N/A | N/A | N/A | N/A | 0.01694 | N/A | [15] |
| 56.05352985 | N/A | N/A | N/A | N/A | 0.00718 | N/A | [15] |
| 59.05781995 | Acetamidine | C2H6N2 | HMD | 0.0025544869753986177 | 0.00385 | 43.254000529672744 | [15] |
| *63.02131476 | N/A | C5H2 | HMD | 0.0016116769754006555 | 0.00095 | 25.573521935210344 | [15] |
| 71.05402914 | N/A | N/A | N/A | N/A | 0.00212 | N/A | [15] |
| *72.05367879 | Dihydrotriazole | C2H5N3 | HMD | 0.001944646975402975 | 0.00223 | 26.988864525163752 | [15] |
| *87.07684847 | N/A | C5H10O | HMD | 0.0035929669754040106 | 0.00865 | 41.26202358646307 | [15] |
| 87.93367781 | N/A | N/A | N/A | N/A | 0.0047 | N/A | [15] |
| *94.05373076 | Methylphosphoramide | CH8N3P | HMD | -0.000870323024585673 | 0.00159 | -9.253466263943373 | [15] |
| *94.05373076 | Methylphosphoramide | CH8N3P | HMD | -0.000870323024585673 | 0.00587 | -9.253466263943373 | [15] |
| *110.0534923 | N/A | CH7N3O3 or C4H5N4 |
HMD | 0.0025261369754048246 or 0.005205136975405367 | 0.00205 | 22.953719346940023 or 47.296427097619386 | [15] |
| *118.0709267 | Indole | C8H7N | HMD | -0.00580126302459405 | 0.00376 | -49.13371298706043 | [15] |
| *119.9550439 | N/A | C2HNOS2 | HMD | 0.002188536975396005 | 0.00009 | 18.24464319499953 | [15] |
| *132.0519023 | N/A | C2H5N5O2 | HMD | -0.0003008630245915356 | 0.01418 | -2.2783694846593328 | [15] |
| *144.0847275 | 2-Ethyl-2.5-dihydro-4.5-dimethylthiazole | C7H13NS | HMD | -0.0005810630245832726 | 0.00094 | -4.032787059844858 | [15] |
| *144.0847275 | 2-Ethyl-2,5-dihydro-4,5-dimethylthiazole | C7H13NS | HMD | -0.0005810630245832726 | 0.00158 | -4.032787059844858 | [15] |
| 144.9178093 | Phosphorothioic acid | HO3PS2 | HMD | -5.8863024577249234e-05 | 0.00938 | -0.40618213083386184 | [15] |
| 144.9178093 | Phosphorothioic acid | HO3PS2 | HMD | -5.8863024577249234e-05 | 0.01034 | -0.40618213083386184 | [15] |
| *148.0467325 | 1-Methyl-2-nitro-1-nitrosoguanidine | C2H5N5O3 | HMD | -0.00021606302456689264 | 0.00171 | -1.4594244730588204 | [15] |
| *159.0736551 | N/A | C6H10N2O3 | HMD | 0.0027643369754173364 | 0.00803 | 17.377717093880598 | [15] |
| *175.134686 | N/A | C12H16N | HMD | 0.0008644369754335912 | 0.00043 | 4.93584106710644 | [15] |
| *297.0845167 | N/A | N/A | N/A | N/A | 0.00121 | N/A | N/A |
| *355.0691168 | N/A | N/A | N/A | N/A | 0.00217 | N/A | N/A |
| *359.06678 | N/A | N/A | N/A | N/A | 0.00084 | N/A | N/A |
| *430.085363 | N/A | N/A | N/A | N/A | 0.00062 | N/A | N/A |
| *447.1045513 | N/A | N/A | N/A | N/A | 0.00137 | N/A | N/A |
Disclaimer/Publisher’s Note: The statements, opinions and data contained in all publications are solely those of the individual author(s) and contributor(s) and not of MDPI and/or the editor(s). MDPI and/or the editor(s) disclaim responsibility for any injury to people or property resulting from any ideas, methods, instructions or products referred to in the content. |
© 2025 by the authors. Licensee MDPI, Basel, Switzerland. This article is an open access article distributed under the terms and conditions of the Creative Commons Attribution (CC BY) license (http://creativecommons.org/licenses/by/4.0/).
Copyright: This open access article is published under a Creative Commons CC BY 4.0 license, which permit the free download, distribution, and reuse, provided that the author and preprint are cited in any reuse.