Submitted:
13 February 2025
Posted:
16 February 2025
You are already at the latest version
Abstract
Development and electrochemical characteristics of ionic liquid crystal elastomers (iLCEs) are described for use as electrolyte components in lithium-ion batteries. The unique combination of elastic and liquid crystal properties in iLCEs grants them robust mechanical attributes and structural ordering. Specifically, the macroscopic alignment of phase-segregated, ordered nanostructures in iLCEs serves as ion pathways, which can be solidified through photopolymerization to create ion-conductive solid-state polymer lithium batteries (SSPLBs) with high ionic conductivity (1.76 × 10⁻³ S cm-1 at 30 °C), and high (0.61) transference number. Additionally, the rubbery state ensures good interfacial contact with electrodes that inhibits lithium dendrite formation. Furthermore, in contrast to liquid electrolytes, the iLCE is shrinking on heating thus preventing any overheating related explosion. The fabricated Li/LiFePO4 (LFP) cells using iLCE-based solid electrolytes show excellent cycling stability with a discharge capacity of ∼124 mAh g-1 with coulombic efficiency close to 100%. These results are promising for practical application of iLCE-based SSPLBs.
Keywords:
1. Introduction
2. Results
2.1. Material Composition
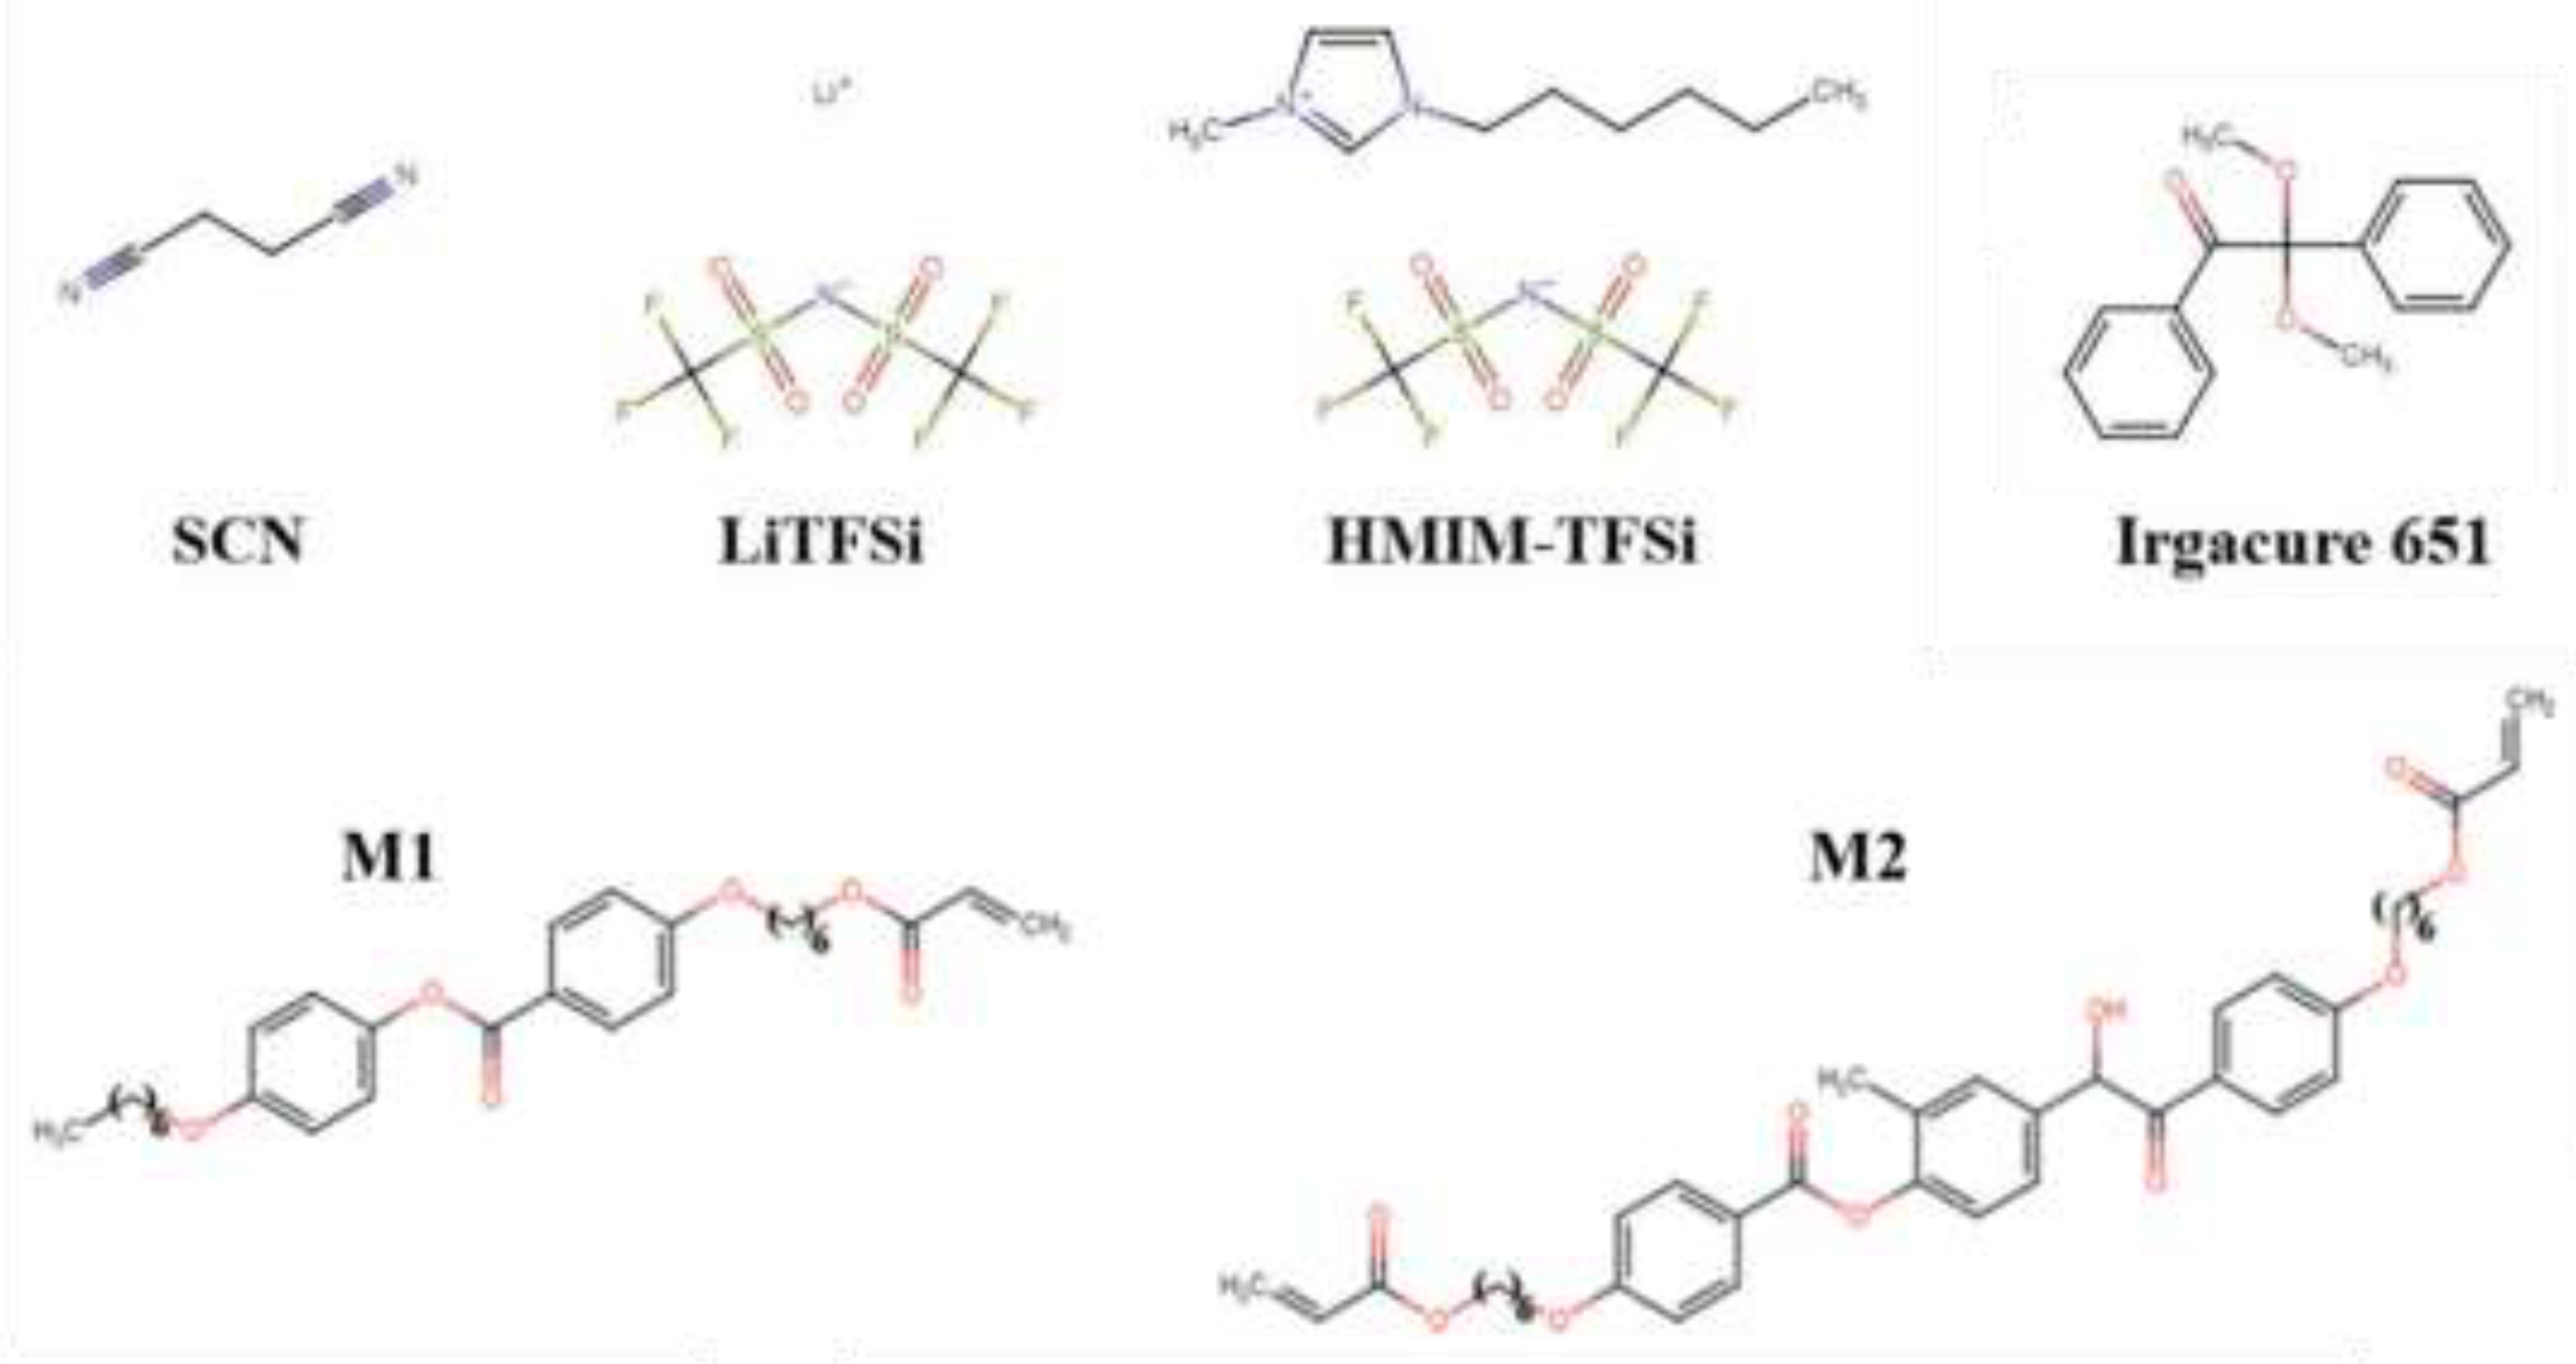
2.1.1. Synthesis of Ionic Liquid Crystal Elastomer
2.1.2. Fabrication of iLCE Electrolyte Membrane
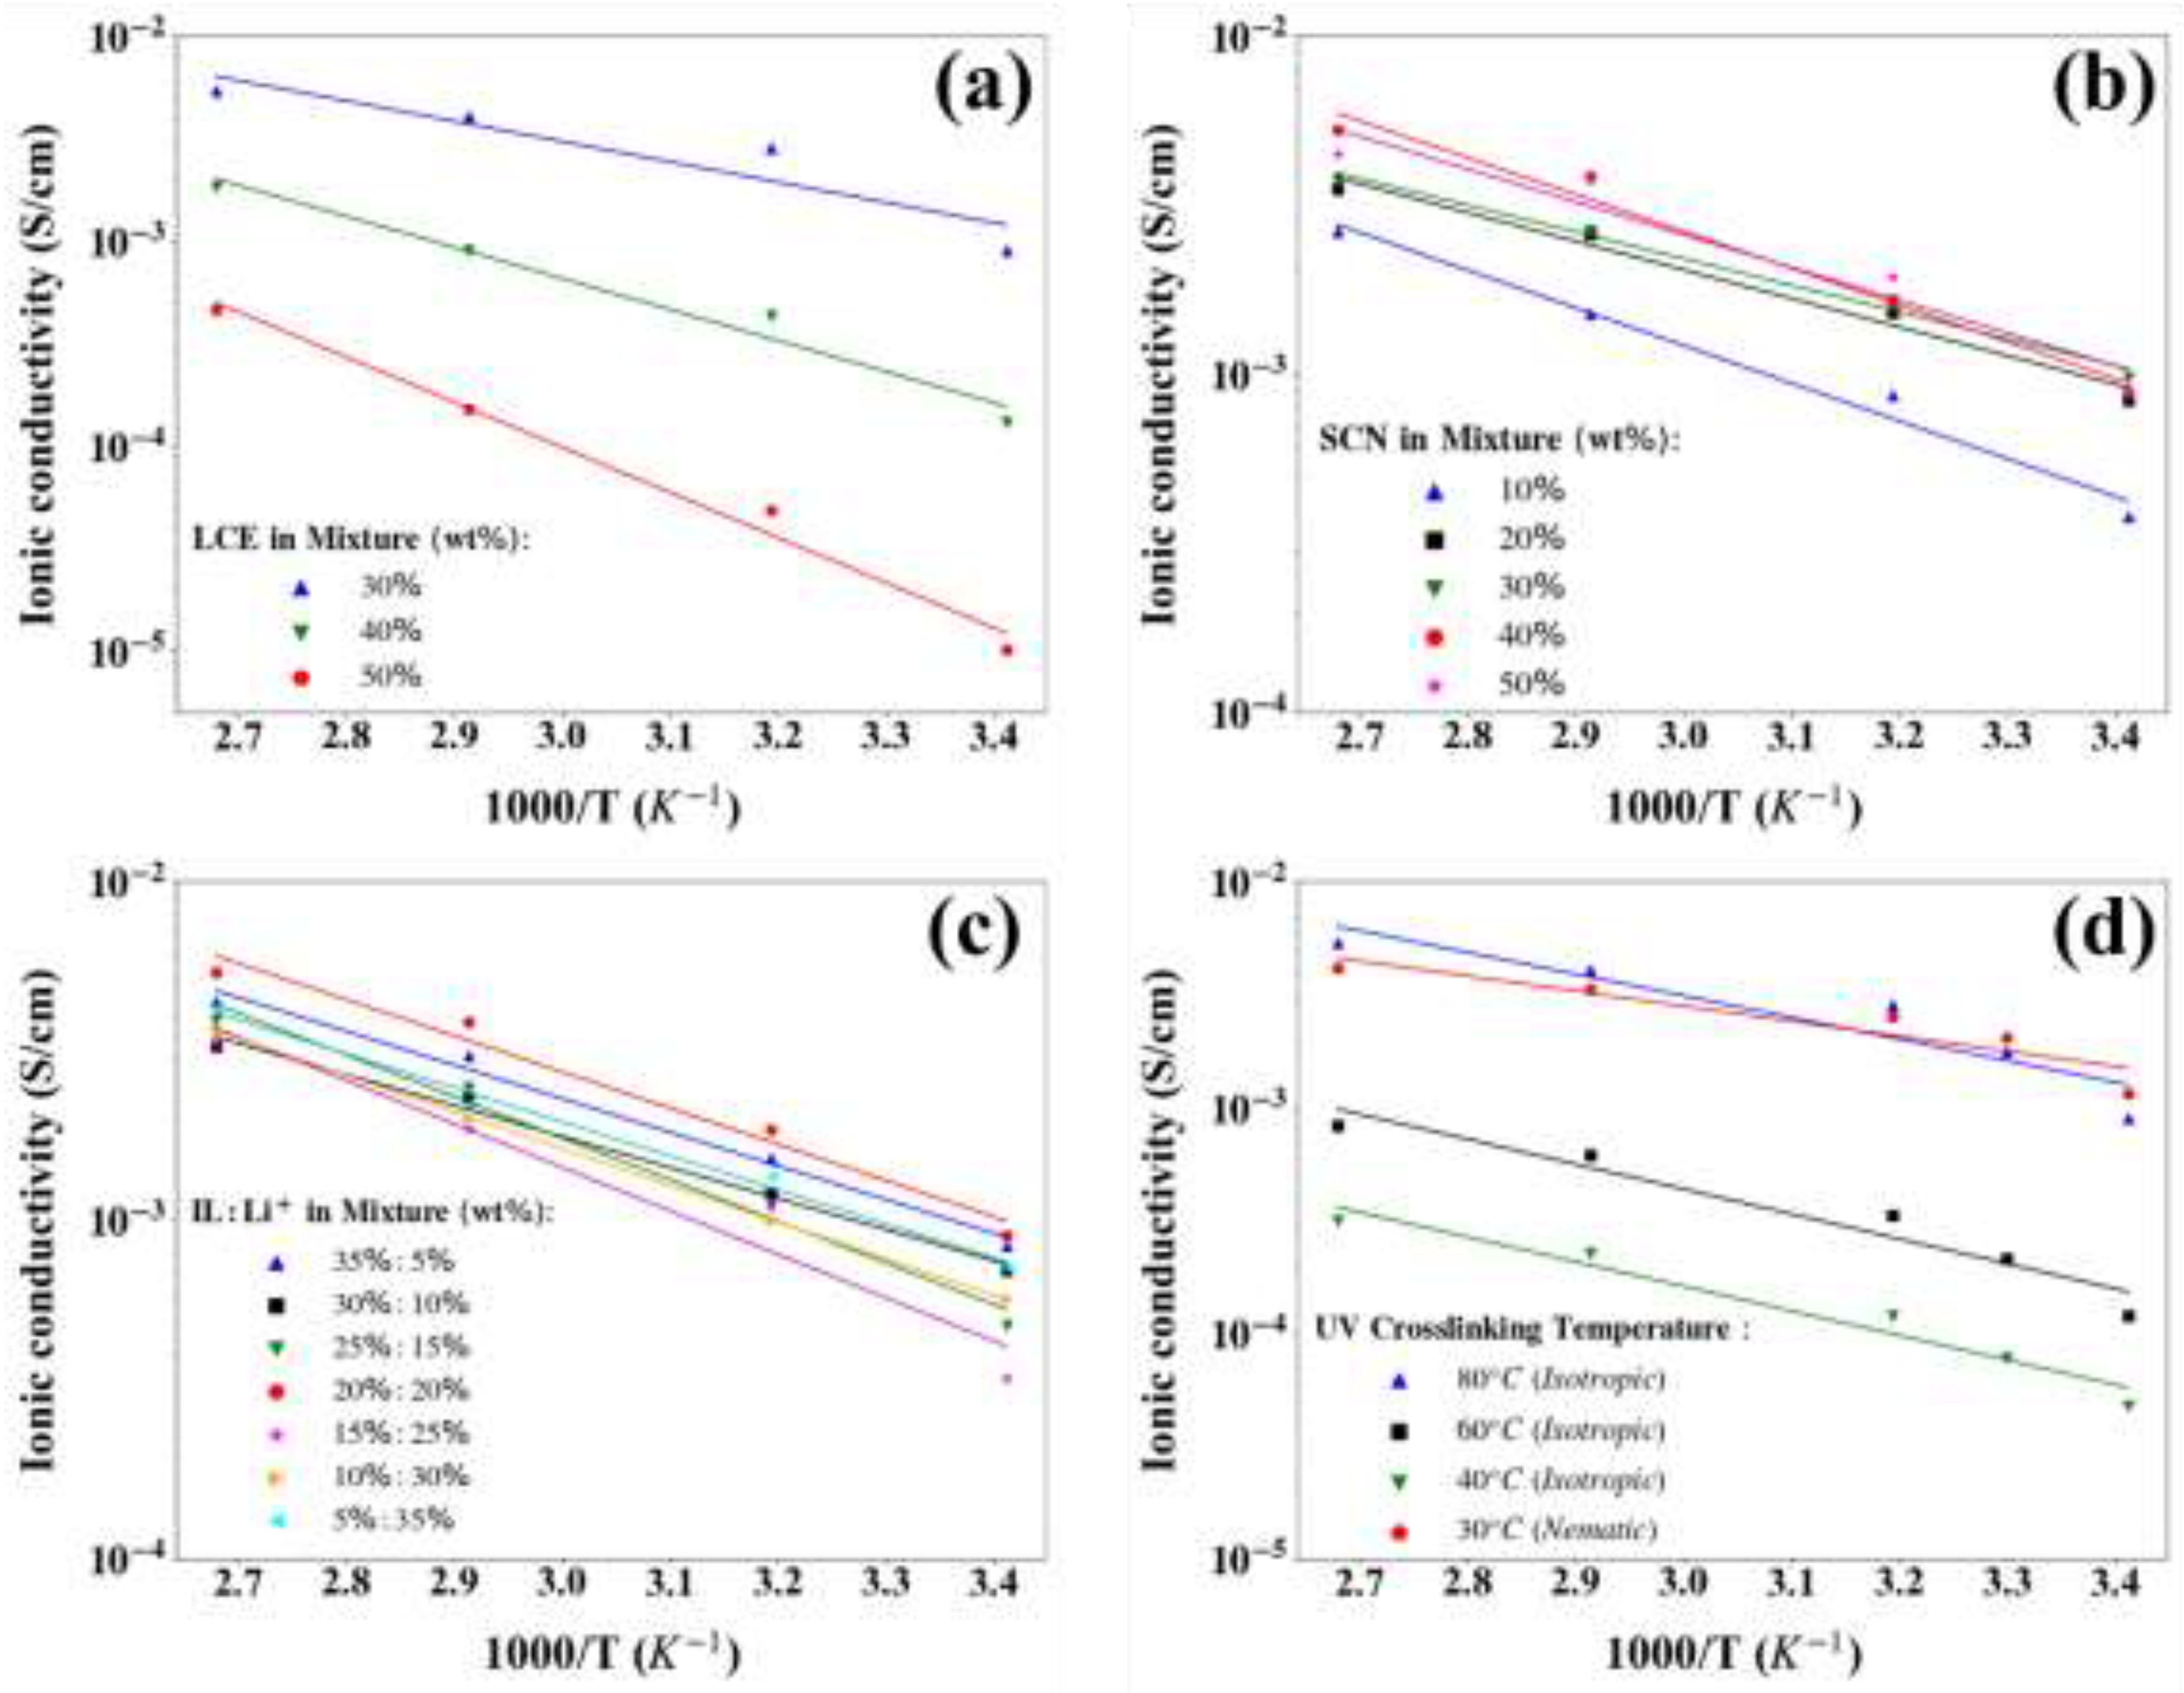
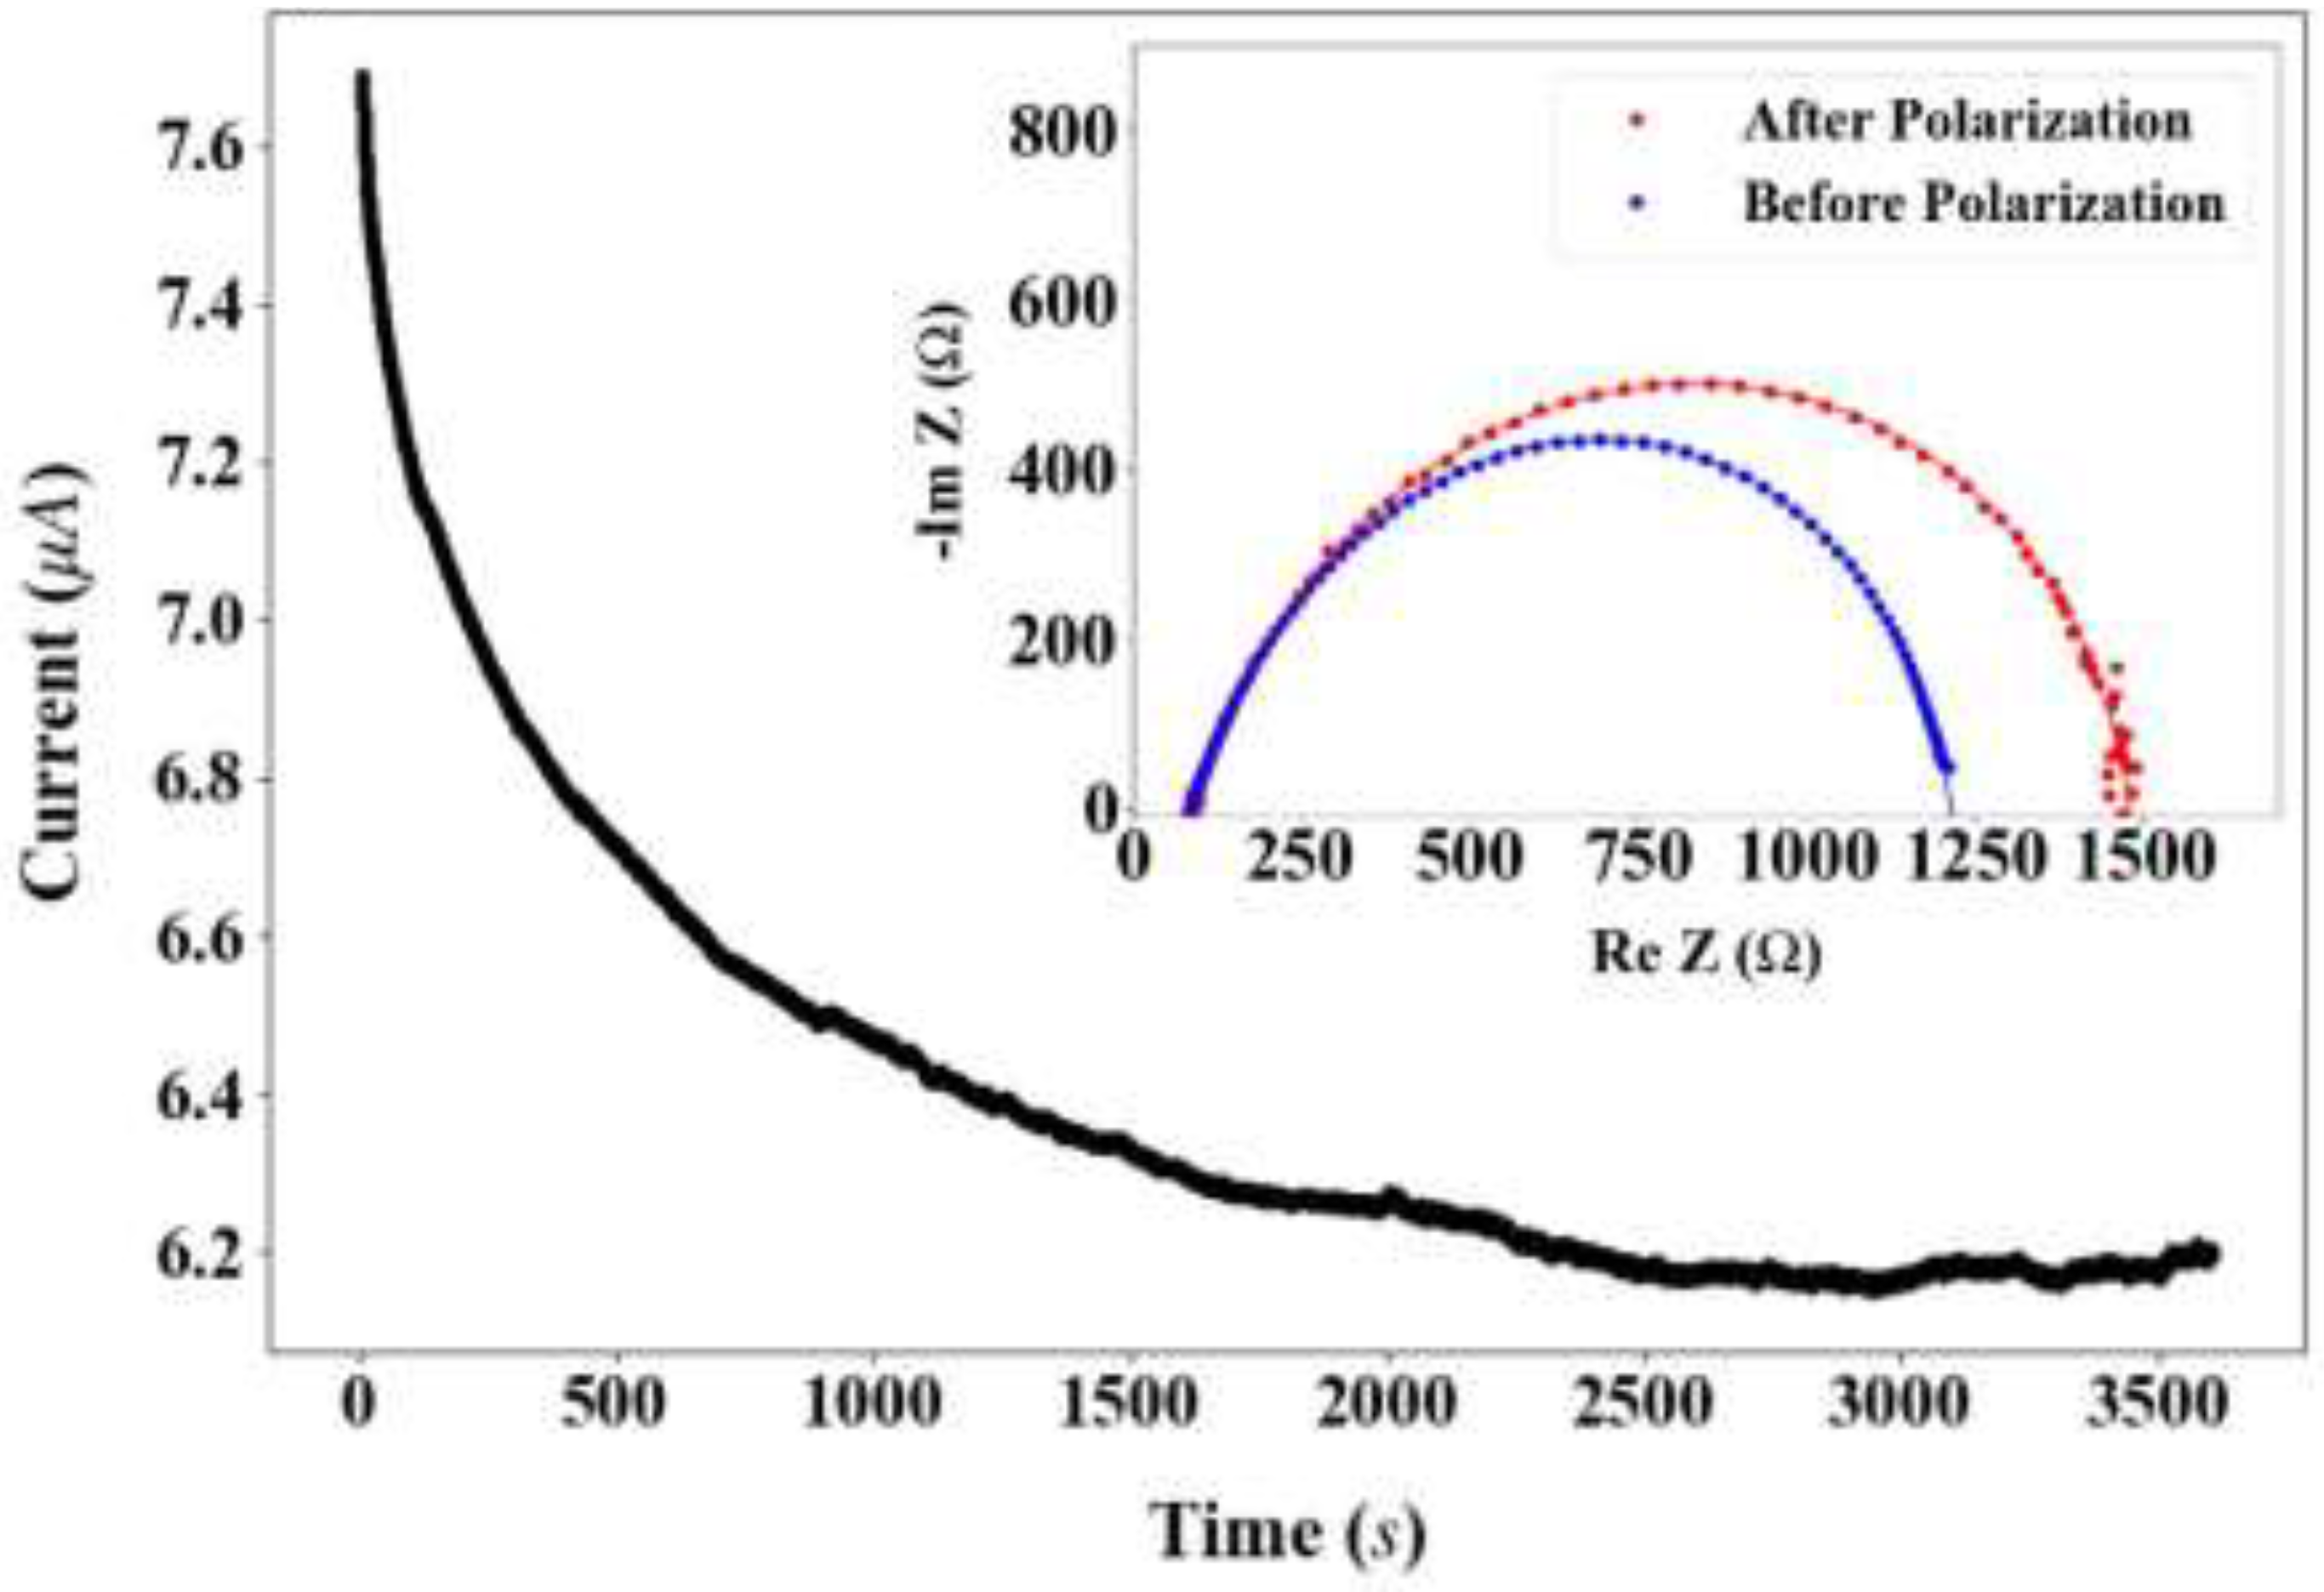
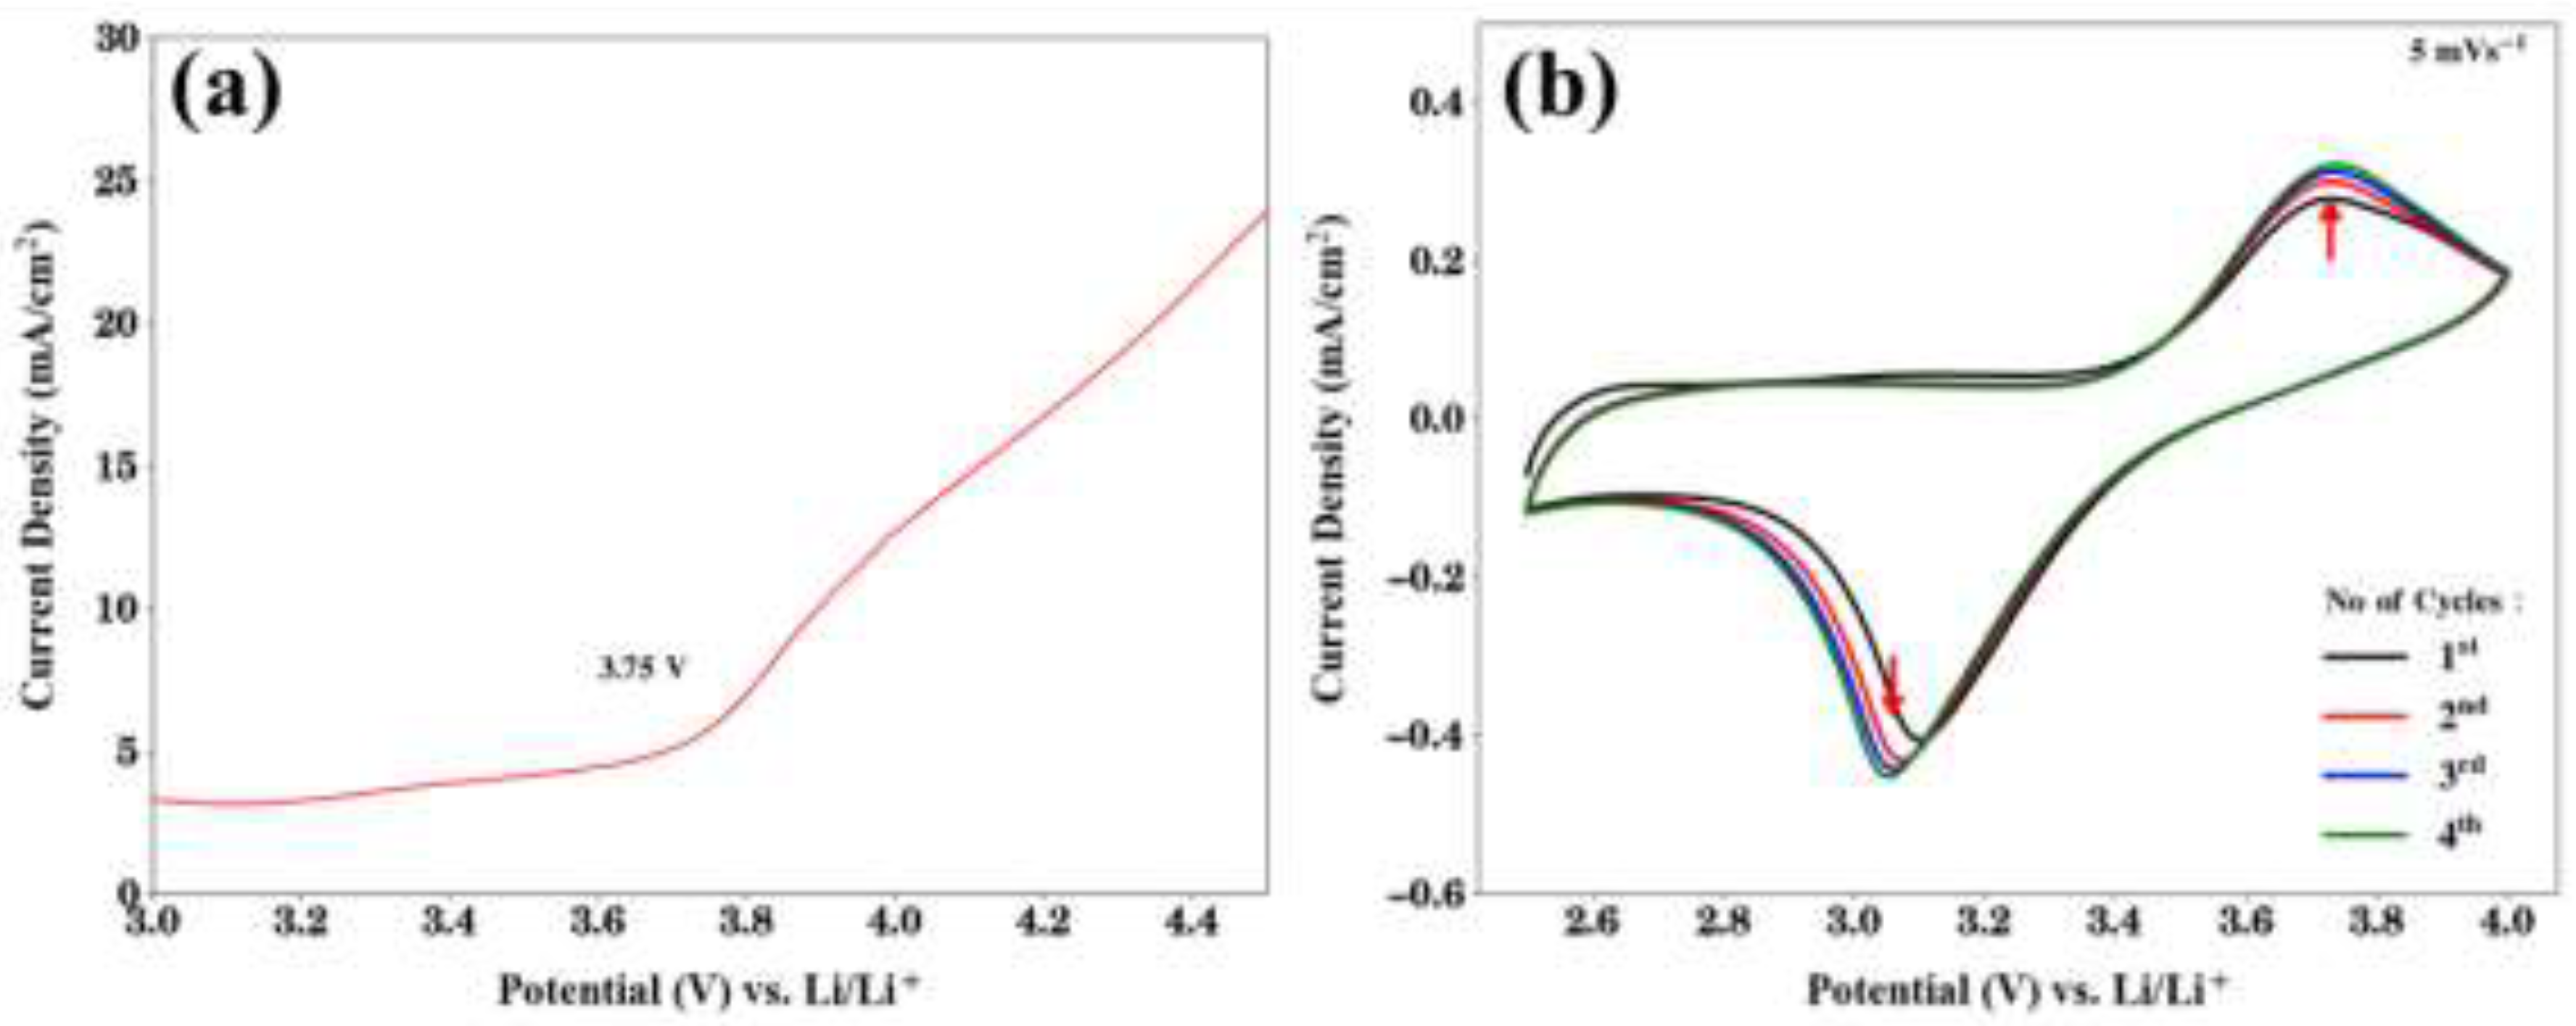
2.2. Electrochemical Performance
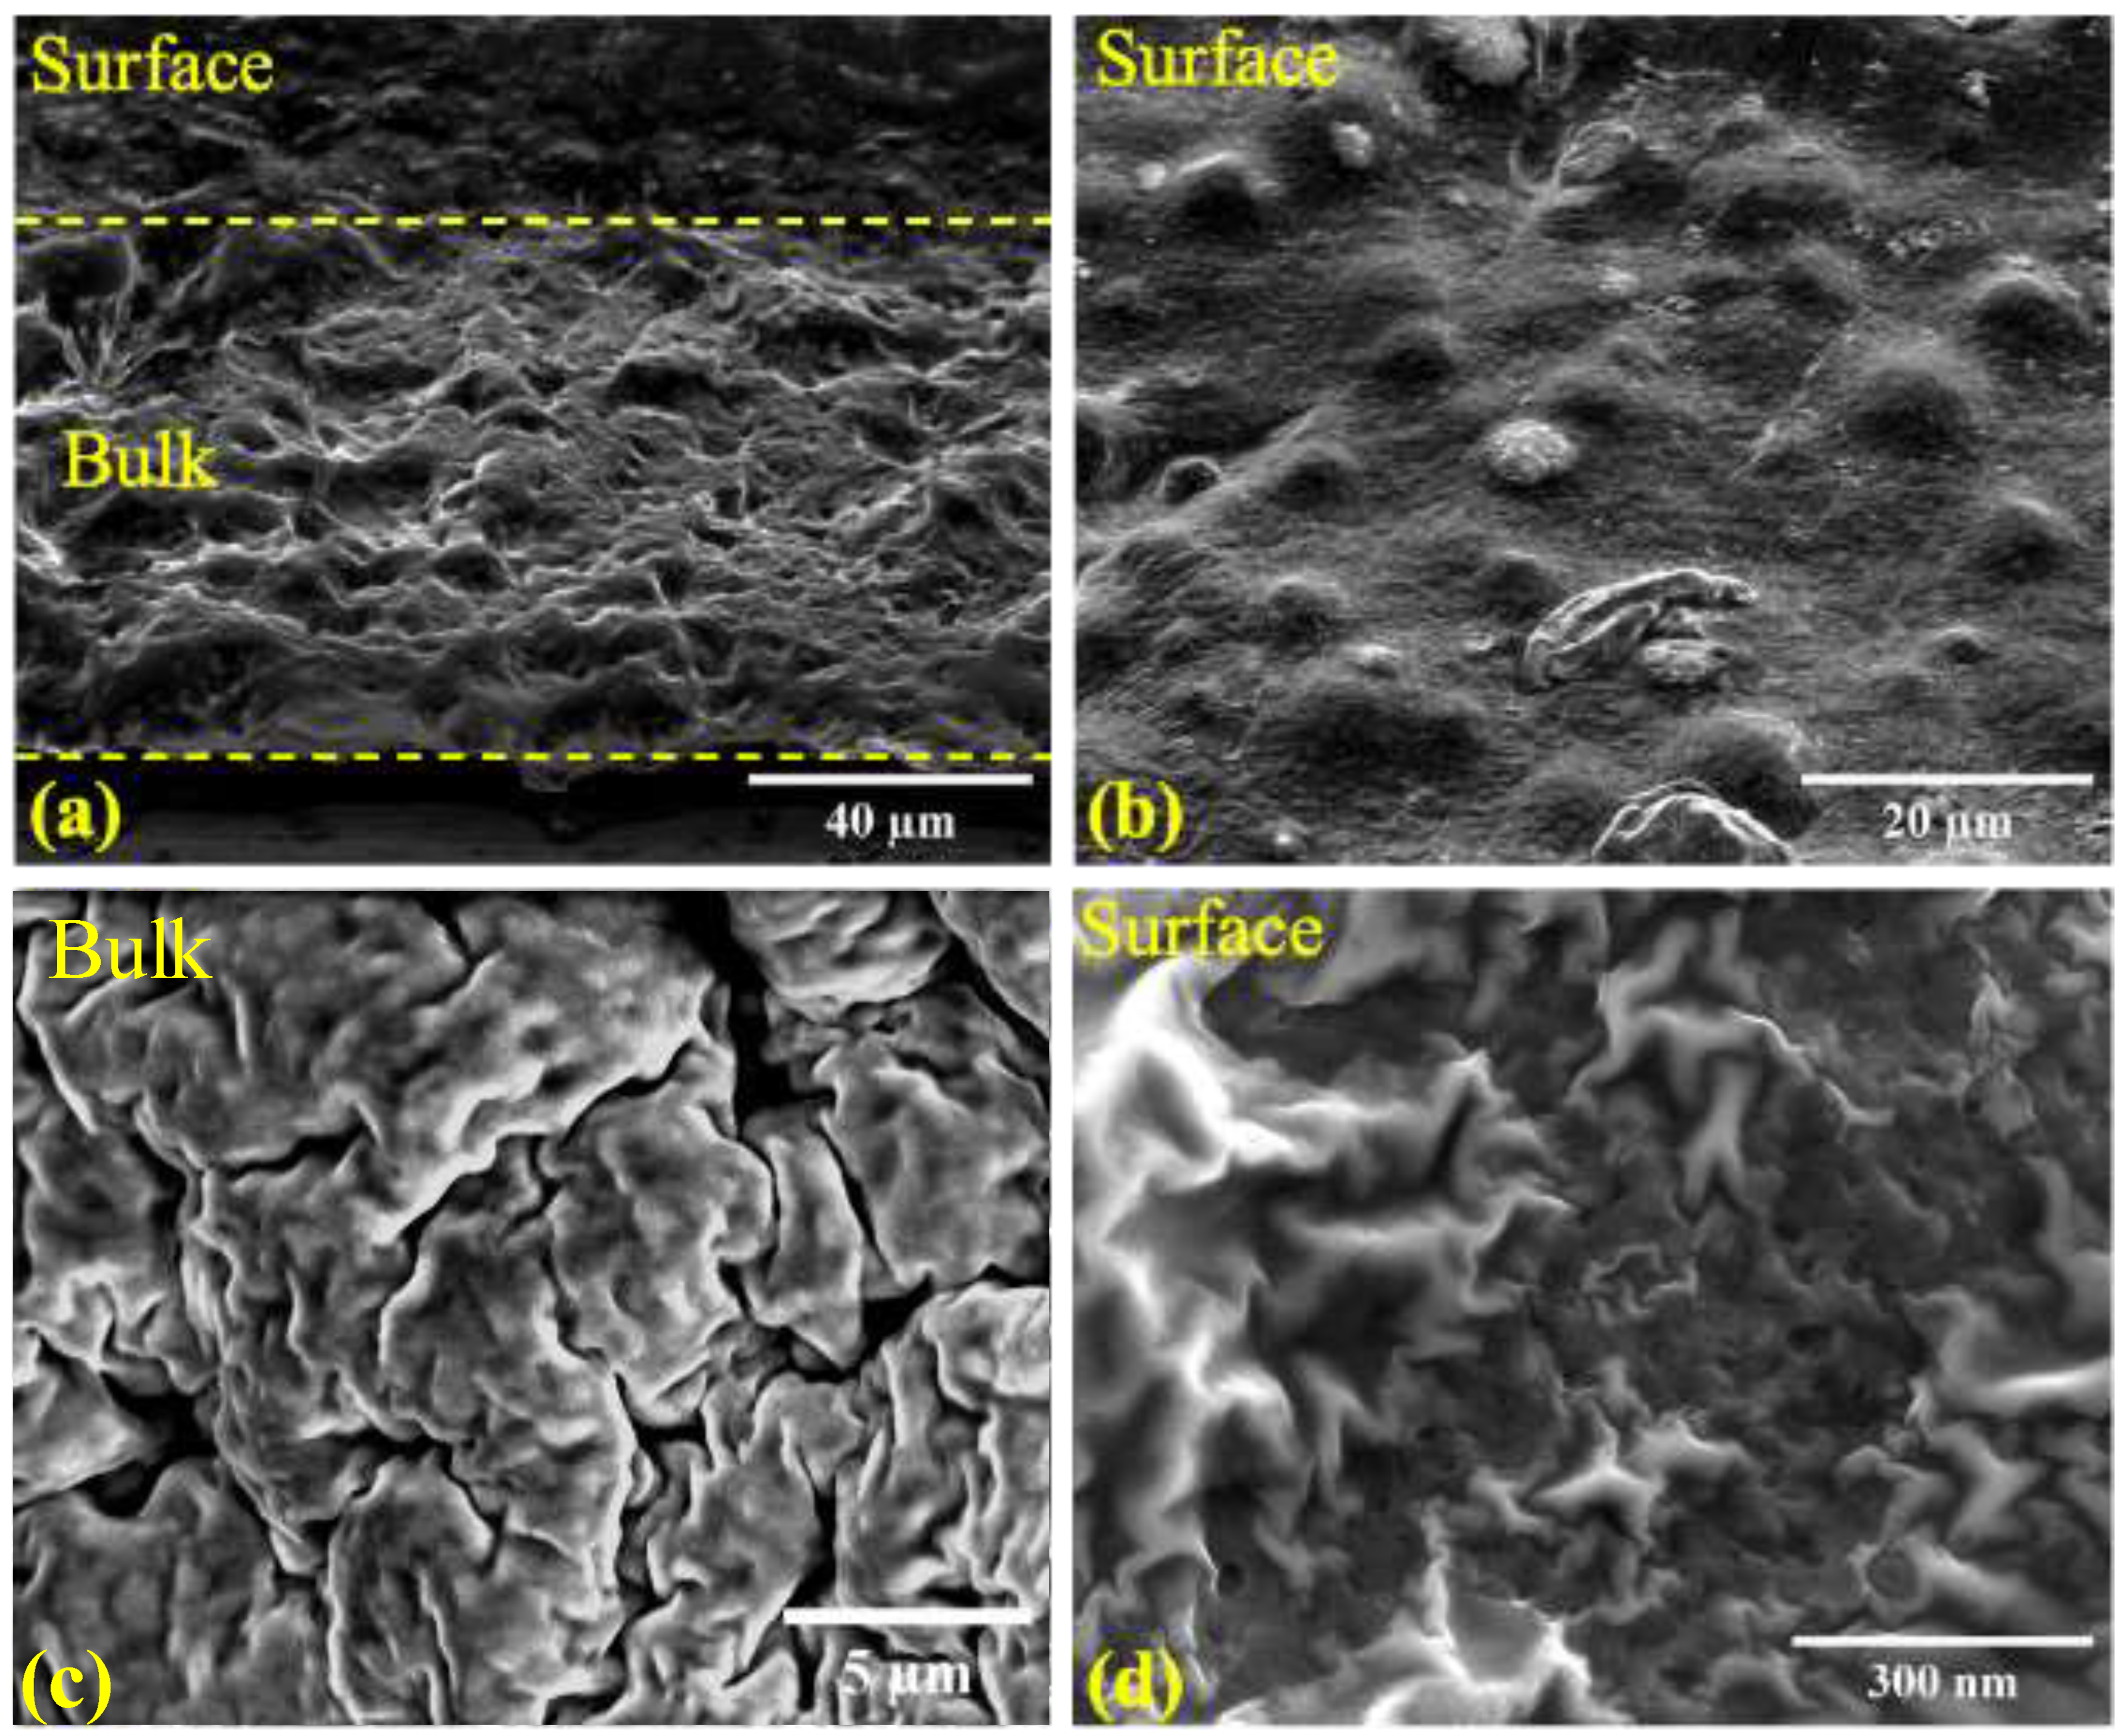
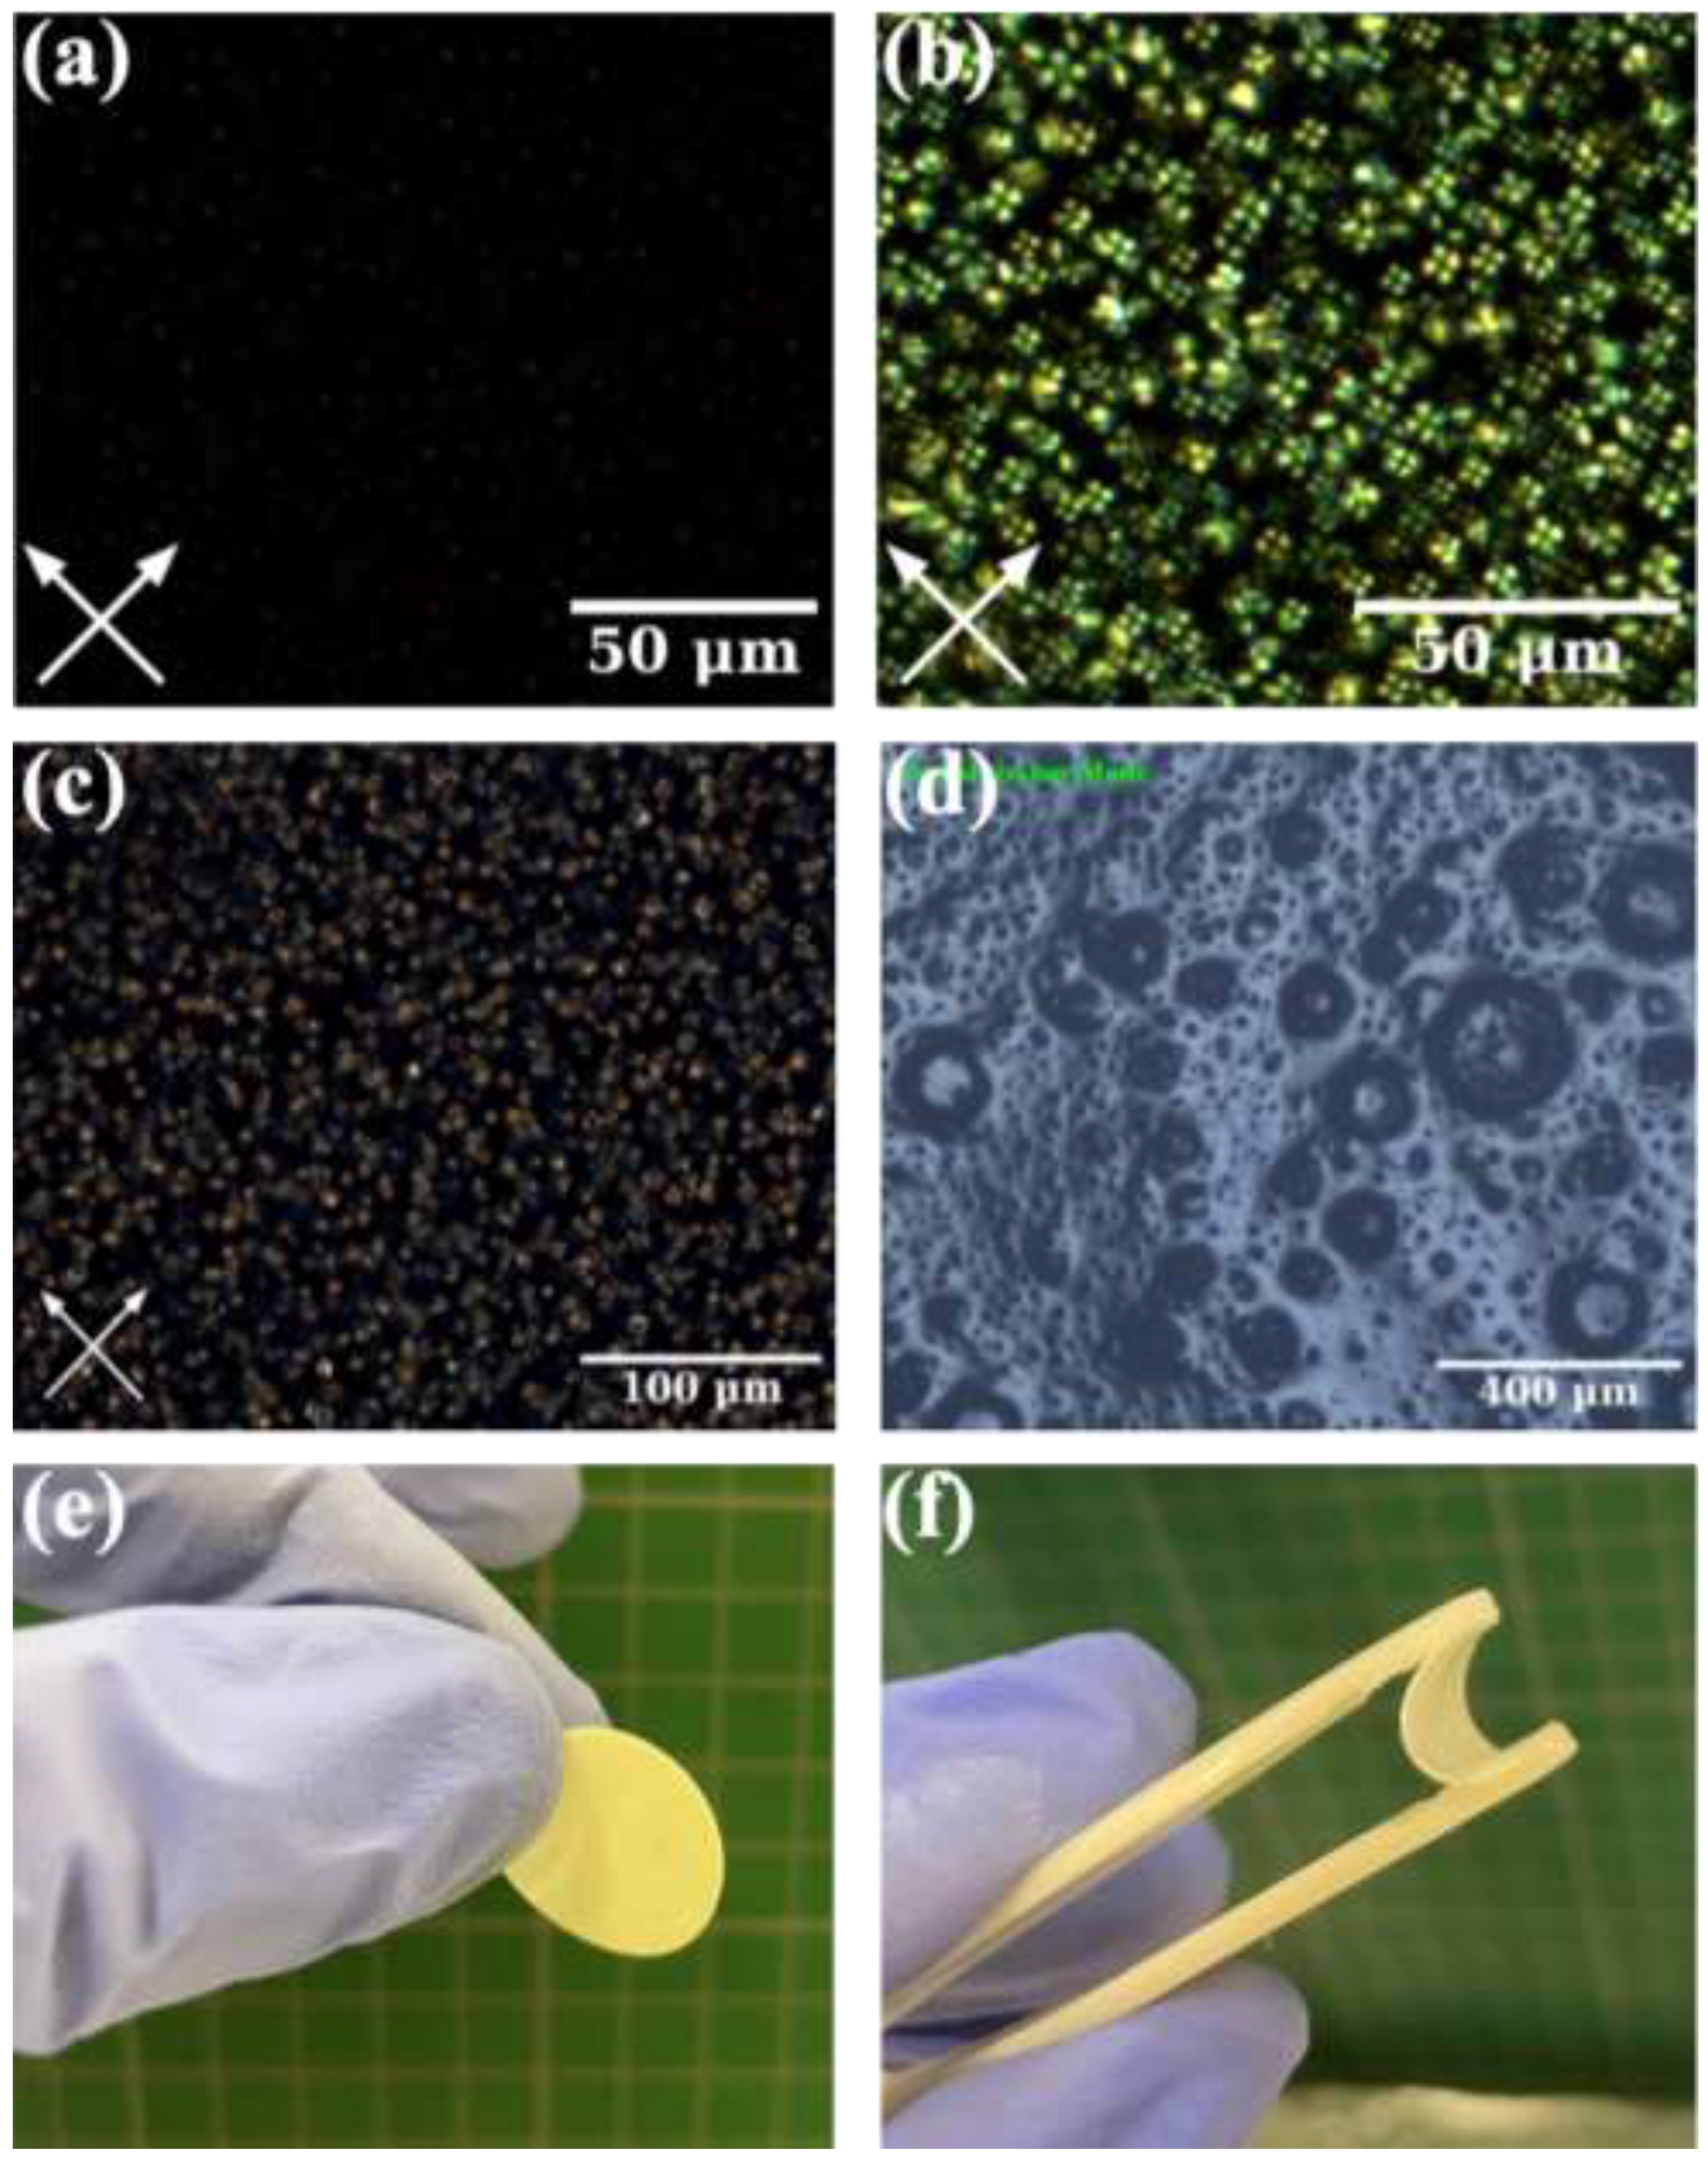
2.3. Structure of iLCE electrolytes
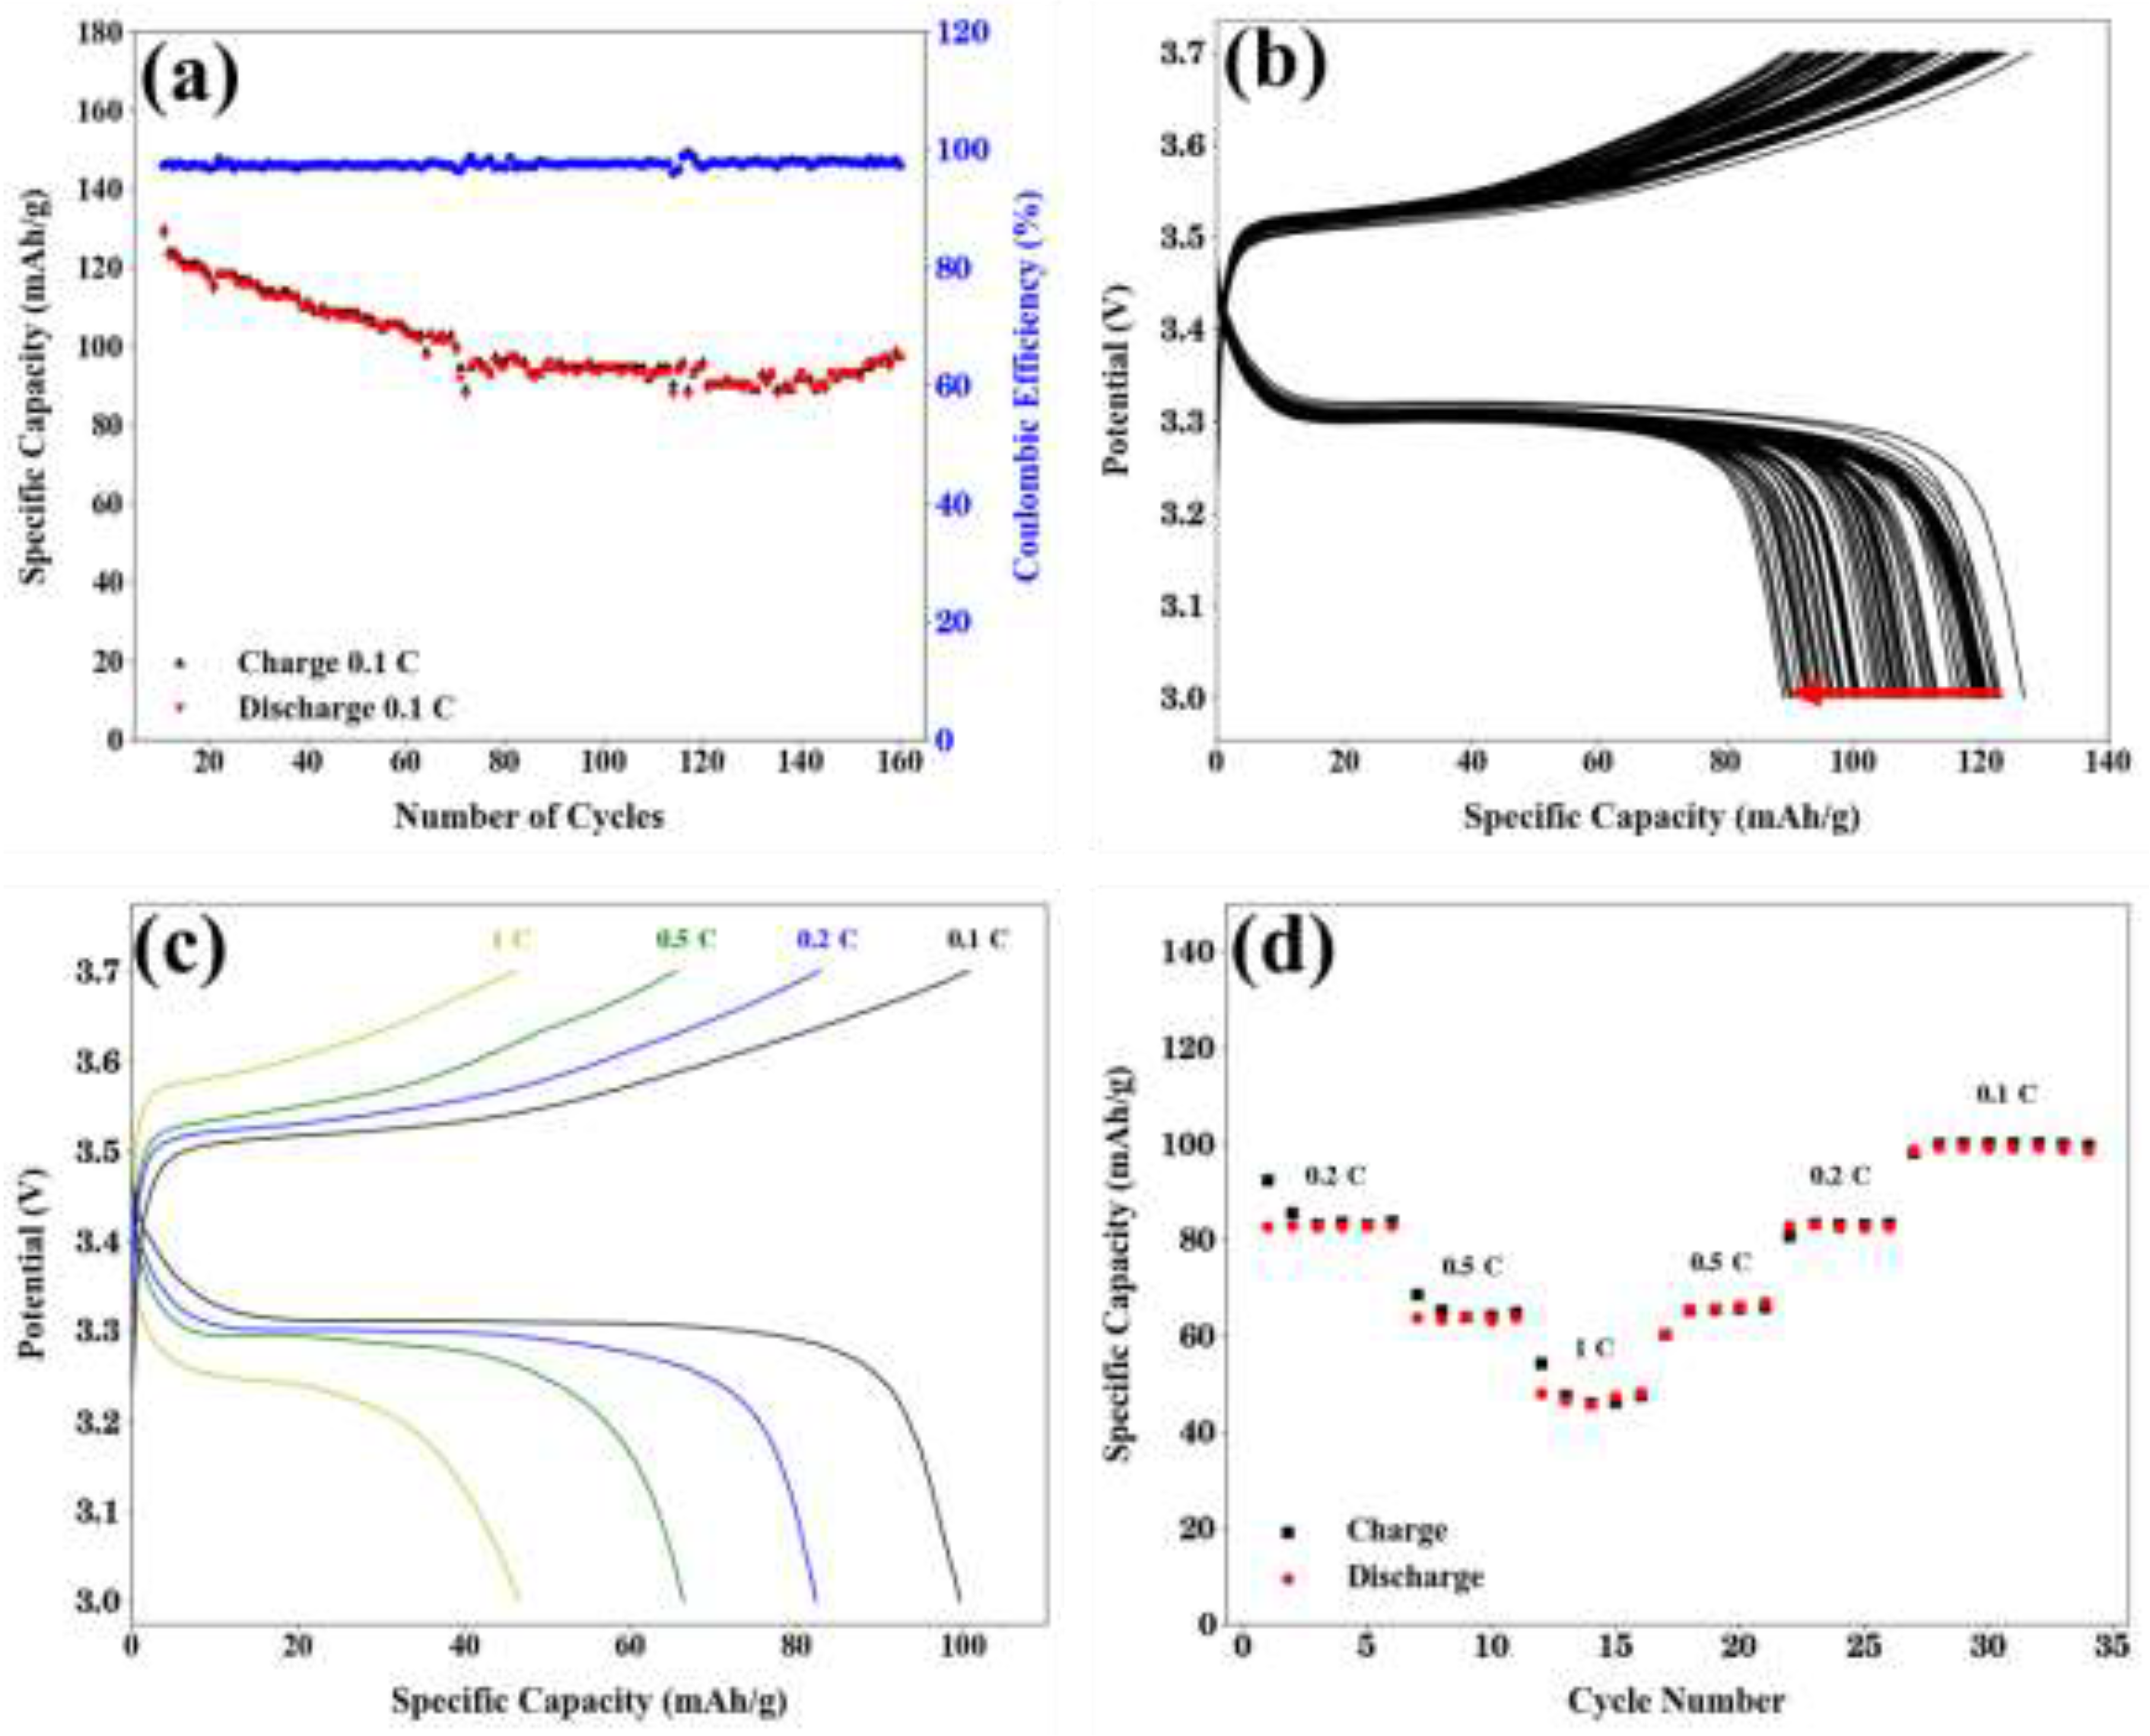
2.4. Cell Performance
3. Conclusions
4. Patents
Supplementary Materials
Author Contributions
Funding
Data Availability Statement
Acknowledgments
Conflicts of Interest
References
- Holtstiege, F.; Bärmann, P.; Nölle, R.; Winter, M.; Placke, T. Pre-Lithiation Strategies for Rechargeable Energy Storage Technologies: Concepts, Promises and Challenges. Batteries 2018, 4, 4. [Google Scholar] [CrossRef]
- Herr, R. Organic Electrolytes for Lithium Cells. Electrochim Acta 1990, 35. [Google Scholar] [CrossRef]
- Aurbach, D.; Ein-Eli, Y.; Markovsky, B.; Zaban, A.; Luski, S.; Carmeli, Y.; Yamin, H. The Study of Electrolyte Solutions Based on Ethylene and Diethyl Carbonates for Rechargeable Li Batteries: II. Graphite Electrodes. J Electrochem Soc 1995, 142, 2882–2889. [Google Scholar] [CrossRef]
- Walker, C.W.; Cox, J.D.; Salomon, M. Conductivity and Electrochemical Stability of Electrolytes Containing Organic Solvent Mixtures with Lithium Tris(Trifluoromethanesulfonyl)Methide. J Electrochem Soc 1996, 143, L80–L82. [Google Scholar] [CrossRef]
- Armand, M. The History of Polymer Electrolytes. Solid State Ion 1994, 69, 309–319. [Google Scholar] [CrossRef]
- Alloin, F.; Sanchez, J.Y.; Armand, M. New Solvating Cross-Linked Polyether for Lithium Batteries. J Power Sources 1995, 54, 34–39. [Google Scholar] [CrossRef]
- Goodenough, J.B.; Kim, Y. Challenges for Rechargeable Li Batteries. Chemistry of Materials 2010, 22, 587–603. [Google Scholar] [CrossRef]
- Etacheri, V.; Marom, R.; Elazari, R.; Salitra, G.; Aurbach, D. Challenges in the Development of Advanced Li-Ion Batteries: A Review. Energy Environ Sci 2011, 4, 3243–3262. [Google Scholar] [CrossRef]
- Chu, S.; Majumdar, A. Opportunities and Challenges for a Sustainable Energy Future. Nature 2012, 488, 294–303. [Google Scholar] [CrossRef]
- Goodenough, J.B.; Park, K.S. The Li-Ion Rechargeable Battery: A Perspective. J Am Chem Soc 2013, 135, 1167–1176. [Google Scholar] [CrossRef]
- Tatsumisago, M.; Nagao, M.; Hayashi, A. Recent Development of Sulfide Solid Electrolytes and Interfacial Modification for All-Solid-State Rechargeable Lithium Batteries. Journal of Asian Ceramic Societies 2013, 1, 17–25. [Google Scholar] [CrossRef]
- Armand, M.; Tarascon, J.M. Building Better Batteries. Nature 2008, 451, 652–657. [Google Scholar] [CrossRef]
- Tarascon, J.M.; Armand, M. Issues and Challenges Facing Rechargeable Lithium Batteries. Nature 2001, 414, 359–367. [Google Scholar] [CrossRef] [PubMed]
- Nair, J.R.; Imholt, L.; Brunklaus, G.; Winter, M. Lithium Metal Polymer Electrolyte Batteries: Opportunities and Challenges. Electrochemical Society Interface 2019, 28, 55–61. [Google Scholar] [CrossRef]
- Deng, K.; Qin, J.; Wang, S.; Ren, S.; Han, D.; Xiao, M.; Meng, Y. Effective Suppression of Lithium Dendrite Growth Using a Flexible Single-Ion Conducting Polymer Electrolyte. Small 2018, 14, 231424. [Google Scholar] [CrossRef]
- Zhang, H.; Li, C.; Piszcz, M.; Coya, E.; Rojo, T.; Rodriguez-Martinez, L.M.; Armand, M.; Zhou, Z. Single Lithium-Ion Conducting Solid Polymer Electrolytes: Advances and Perspectives. Chem Soc Rev 2017, 46, 797–815. [Google Scholar] [CrossRef]
- Shono, K.; Kobayashi, T.; Tabuchi, M.; Ohno, Y.; Miyashiro, H.; Kobayashi, Y. Proposal of Simple and Novel Method of Capacity Fading Analysis Using Pseudo-Reference Electrode in Lithium Ion Cells: Application to Solvent-Free Lithium Ion Polymer Batteries. J Power Sources 2014, 247, 1026–1032. [Google Scholar] [CrossRef]
- Nakayama, M.; Wada, S.; Kuroki, S.; Nogami, M. Factors Affecting Cyclic Durability of All-Solid-State Lithium Polymer Batteries Using Poly(Ethylene Oxide)-Based Solid Polymer Electrolytes. Energy Environ Sci 2010, 3, 1995–2002. [Google Scholar] [CrossRef]
- Kaneko, F.; Wada, S.; Nakayama, M.; Wakihara, M.; Koki, J.; Kuroki, S. Capacity Fading Mechanism in All Solid-State Lithium Polymer Secondary Batteries Using PEG-Borate/Alumlnate Ester as Plasticizer for Polymer Electrolytes. Adv Funct Mater 2009, 19, 918–925. [Google Scholar] [CrossRef]
- Fergus, J.W. Ceramic and Polymeric Solid Electrolytes for Lithium-Ion Batteries. J Power Sources 2010, 195, 4554–5469. [Google Scholar] [CrossRef]
- Goodenough, J.B. Batteries and a Sustainable Modern Society. Electrochemical Society Interface 2016, 25, 67. [Google Scholar] [CrossRef]
- Yu, X.; Manthiram, A. A Review of Composite Polymer-Ceramic Electrolytes for Lithium Batteries. Energy Storage Mater 2021, 34, 282–300. [Google Scholar] [CrossRef]
- Li, S.; Zhang, S.Q.; Shen, L.; Liu, Q.; Ma, J. Bin; Lv, W.; He, Y.B.; Yang, Q.H. Progress and Perspective of Ceramic/Polymer Composite Solid Electrolytes for Lithium Batteries. Advanced Science 2020, 7, 1903088. [Google Scholar] [CrossRef] [PubMed]
- Chung, S.H.; Wang, Y.; Persi, L.; Croce, F.; Greenbaum, S.G.; Scrosati, B.; Plichta, E. Enhancement of Ion Transport in Polymer Electrolytes by Addition of Nanoscale Inorganic Oxides. Journal of Power Sources 2001, 97–98, 644–648. [Google Scholar] [CrossRef]
- Takeda, Y.; Yamamoto, O.; Imanishi, N. Lithium Dendrite Formation on a Lithium Metal Anode from Liquid, Polymer and Solid Electrolytes. Electrochemistry 2016, 84, 210–218. [Google Scholar] [CrossRef]
- Wang, D.; Zhang, W.; Zheng, W.; Cui, X.; Rojo, T.; Zhang, Q. Towards High-Safe Lithium Metal Anodes: Suppressing Lithium Dendrites via Tuning Surface Energy. Advanced Science 2017, 4, 1600168. [Google Scholar] [CrossRef]
- Mandal, M.; Bardhan, P.; Mandal, M.; Maji, T.K. Development of Wood Polymer Composites with Thermosetting Resin from Soybean Oil Cross-Linked with Rosin Derivative. European Journal of Wood and Wood Products 2020, 78, 1265–1278. [Google Scholar] [CrossRef]
- Goydaragh, M.G.; Taghizadeh-Mehrjardi, R.; Jafarzadeh, A.A.; Triantafilis, J.; Lado, M. Using Environmental Variables and Fourier Transform Infrared Spectroscopy to Predict Soil Organic Carbon. Catena (Amst) 2021, 202, 105280. [Google Scholar] [CrossRef]
- Ehgartner, C.R.; Werner, V.; Selz, S.; Hüsing, N.; Feinle, A. Carboxylic Acid-Modified Polysilsesquioxane Aerogels for the Selective and Reversible Complexation of Heavy Metals and Organic Molecules. Microporous and Mesoporous Materials 2021, 312, 110759. [Google Scholar] [CrossRef]
- Evans, J.; Vincent, C.A.; Bruce, P.G. Electrochemical Measurement of Transference Numbers in Polymer Electrolytes. Polymer (Guildf) 1987, 28, 2324–2328. [Google Scholar] [CrossRef]
- Bruce, P.G.; Evans, J.; Vincent, C.A. Conductivity and Transference Number Measurements on Polymer Electrolytes. Solid State Ion 1988, 28–30, 918–922. [Google Scholar] [CrossRef]
- Strickberger, S.A.; Ravi, S.; Daoud, E.; Niebauer, M.; Man, K.C.; Morady, F. Relation between Impedance and Temperature during Radiofrequency Ablation of Accessory Pathways. Am Heart J 1995, 130, 1026–1030. [Google Scholar] [CrossRef] [PubMed]
- Feng, C.; Kyu, T. Role of Dinitrile Plasticizer Chain Lengths in Electrochemical Performance of Highly Conductive Polymer Electrolyte Membrane for Lithium Ion Battery. Electrochim Acta 2020, 330, 135320. [Google Scholar] [CrossRef]
- Pal, U.; Chen, F.; Gyabang, D.; Pathirana, T.; Roy, B.; Kerr, R.; MacFarlane, D.R.; Armand, M.; Howlett, P.C.; Forsyth, M. Enhanced Ion Transport in an Ether Aided Super Concentrated Ionic Liquid Electrolyte for Long-Life Practical Lithium Metal Battery Applications. J Mater Chem A Mater 2020, 8, 18826–18839. [Google Scholar] [CrossRef]
- Chang, Z.; Qiao, Y.; Deng, H.; Yang, H.; He, P.; Zhou, H. A Liquid Electrolyte with De-Solvated Lithium Ions for Lithium-Metal Battery. Joule 2020, 4, 1776–1789. [Google Scholar] [CrossRef]
- Sun, H.; Zhu, G.; Zhu, Y.; Lin, M.C.; Chen, H.; Li, Y.Y.; Hung, W.H.; Zhou, B.; Wang, X.; Bai, Y.; et al. High-Safety and High-Energy-Density Lithium Metal Batteries in a Novel Ionic-Liquid Electrolyte. Advanced Materials 2020, 32, 2001741. [Google Scholar] [CrossRef]
- Kobayashi, K.; Pagot, G.; Vezzù, K.; Bertasi, F.; Di Noto, V.; Tominaga, Y. Effect of Plasticizer on the Ion-Conductive and Dielectric Behavior of Poly(Ethylene Carbonate)-Based Li Electrolytes. Polym J 2021, 53, 149–155. [Google Scholar] [CrossRef]
- Wang, B.; Wu, Y.; Zhuo, S.; Zhu, S.; Chen, Y.; Jiang, C.; Wang, C. Synergistic Effect of Organic Plasticizer and Lepidolite Filler on Polymer Electrolytes for All-Solid High-Voltage Li-Metal Batteries. J Mater Chem A Mater 2020, 8, 5968–5974. [Google Scholar] [CrossRef]
- Rosero-Navarro, N.C.; Kajiura, R.; Miura, A.; Tadanaga, K. Organic−inorganic Hybrid Materials for Interface Design in All-Solid-State Batteries with a Garnet-Type Solid Electrolyte. ACS Appl Energy Mater 2020, 3, 11260–11268. [Google Scholar] [CrossRef]
- Onozuka, R.; Piedrahita, C.; Yanagida, Y.; Adachi, K.; Tsukahara, Y.; Kyu, T. Ion Conductive Polymer Electrolyte Membranes Based on Star-Branched Poly(Ethylene-Glycol Tri-Acrylate) and Polysulfide Macromonomers. Solid State Ion 2020, 346, 115182. [Google Scholar] [CrossRef]
- He, R.; Peng, F.; Dunn, W.E.; Kyu, T. Chemical and Electrochemical Stability Enhancement of Lithium Bis(Oxalato)Borate (LiBOB)-Modified Solid Polymer Electrolyte Membrane in Lithium Ion Half-Cells. Electrochim Acta 2017, 246, 123–134. [Google Scholar] [CrossRef]
- Piedrahita, C.; Kusuma, V.; Nulwala, H.B.; Kyu, T. Highly Conductive, Flexible Polymer Electrolyte Membrane Based on Poly(Ethylene Glycol) Diacrylate-Co-Thiosiloxane Network. Solid State Ion 2018, 322, 61–68. [Google Scholar] [CrossRef]
- Cao, J.; He, R.; Kyu, T. Fire Retardant, Superionic Solid State Polymer Electrolyte Membranes for Lithium Ion Batteries. Curr Opin Chem Eng 2017, 15, 68–75. [Google Scholar] [CrossRef]
- Fu, G.; Soucek, M.D.; Kyu, T. Fully Flexible Lithium Ion Battery Based on a Flame Retardant, Solid-State Polymer Electrolyte Membrane. Solid State Ion 2018, 320, 310–315. [Google Scholar] [CrossRef]
- Fu, G.; Dempsey, J.; Izaki, K.; Adachi, K.; Tsukahara, Y.; Kyu, T. Highly Conductive Solid Polymer Electrolyte Membranes Based on Polyethylene Glycol-Bis-Carbamate Dimethacrylate Networks. J Power Sources 2017, 359, 441–449. [Google Scholar] [CrossRef]
- Fu, G.; Kyu, T. Effect of Side-Chain Branching on Enhancement of Ionic Conductivity and Capacity Retention of a Solid Copolymer Electrolyte Membrane. Langmuir 2017, 33, 13973–13981. [Google Scholar] [CrossRef] [PubMed]
- He, R.; Echeverri, M.; Ward, D.; Zhu, Y.; Kyu, T. Highly Conductive Solvent-Free Polymer Electrolyte Membrane for Lithium-Ion Batteries: Effect of Prepolymer Molecular Weight. J Memb Sci 2016, 498, 208–217. [Google Scholar] [CrossRef]
- He, R.; Kyu, T. Effect of Plasticization on Ionic Conductivity Enhancement in Relation to Glass Transition Temperature of Crosslinked Polymer Electrolyte Membranes. Macromolecules 2016, 49, 5637–5648. [Google Scholar] [CrossRef]
- Ibrahim, S.; Johan, M.R. Conductivity, Thermal and Neural Network Model Nanocomposite Solid Polymer Electrolyte System (PEO-LiPF 6-EC-CNT). Int J Electrochem Sci 2011, 6, 5565–5587. [Google Scholar] [CrossRef]
- Klongkan, S.; Pumchusak, J. Effects of Nano Alumina and Plasticizers on Morphology, Ionic Conductivity, Thermal and Mechanical Properties of PEO-LiCF3SO3 Solid Polymer Electrolyte. Electrochim Acta 2015, 161, 171–176. [Google Scholar] [CrossRef]
- Christie, A.M.; Lilley, S.J.; Staunton, E.; Andreev, Y.G.; Bruce, P.G. Increasing the Conductivity of Crystalline Polymer Electrolytes. Nature 2005, 433, 18305–18308. [Google Scholar] [CrossRef] [PubMed]
- Phan, T.N.T.; Issa, S.; Gigmes, D. Poly(Ethylene Oxide)-Based Block Copolymer Electrolytes for Lithium Metal Batteries. Polym Int 2019, 68, 7–13. [Google Scholar] [CrossRef]
- Young, W.S.; Epps, T.H. Ionic Conductivities of Block Copolymer Electrolytes with Various Conducting Pathways: Sample Preparation and Processing Considerations. Macromolecules 2012, 45, 4689–4697. [Google Scholar] [CrossRef]
- Ben youcef, H.; Garcia-Calvo, O.; Lago, N.; Devaraj, S.; Armand, M. Cross-Linked Solid Polymer Electrolyte for All-Solid-State Rechargeable Lithium Batteries. Electrochim Acta 2016, 220, 587–594. [Google Scholar] [CrossRef]
- Stalin, S.; Choudhury, S.; Zhang, K.; Archer, L.A. Multifunctional Cross-Linked Polymeric Membranes for Safe, High-Performance Lithium Batteries. Chemistry of Materials 2018, 30, 2058–2066. [Google Scholar] [CrossRef]
- Schulze, M.W.; McIntosh, L.D.; Hillmyer, M.A.; Lodge, T.P. High-Modulus, High-Conductivity Nanostructured Polymer Electrolyte Membranes via Polymerization-Induced Phase Separation. Nano Lett 2014, 14, 122–126. [Google Scholar] [CrossRef]
- Yang, L.; Wang, Z.; Feng, Y.; Tan, R.; Zuo, Y.; Gao, R.; Zhao, Y.; Han, L.; Wang, Z.; Pan, F. Flexible Composite Solid Electrolyte Facilitating Highly Stable “Soft Contacting” Li–Electrolyte Interface for Solid State Lithium-Ion Batteries. Adv Energy Mater 2017, 7, 1701437. [Google Scholar] [CrossRef]
- Bhattacharyya, A.J.; Fleig, J.; Guo, Y.G.; Maier, J. Local Conductivity Effects in Polymer Electrolytes. Advanced Materials 2005, 17, 2630–2634. [Google Scholar] [CrossRef]
- Yoshio, M.; Mukai, T.; Ohno, H.; Kato, T. One-Dimensional Ion Transport in Self-Organized Columnar Ionic Liquids. J Am Chem Soc 2004, 126, 994–995. [Google Scholar] [CrossRef]
- Yamanaka, N.; Kawano, R.; Kubo, W.; Kitamura, T.; Wada, Y.; Watanabe, M.; Yanagida, S. Ionic Liquid Crystal as a Hole Transport Layer of Dye-Sensitized Solar Cells. Chemical Communications 2005, 740–742. [Google Scholar] [CrossRef]
- Lee, S.; Becht, G.A.; Lee, B.; Burns, C.T.; Firestone, M.A. Electropolymerization of a Bifunctional Ionic Liquid Monomer Yields an Electroactive Liquid-Crystalline Polymer. Adv Funct Mater 2010, 20, 2063–2070. [Google Scholar] [CrossRef]
- Wang, S.; Liu, X.; Wang, A.; Wang, Z.; Chen, J.; Zeng, Q.; Wang, X.; Zhang, L. An Ionic Liquid Crystal-Based Solid Polymer Electrolyte with Desirable Ion-Conducting Channels for Superior Performance Ambient-Temperature Lithium Batteries. Polym Chem 2018, 9, 4674–4682. [Google Scholar] [CrossRef]
- Mukai, T.; Yoshio, M.; Kato, T.; Yoshizawa, M.; Ohno, H. Anisotropic Ion Conduction in a Unique Smectic Phase of Self-Assembled Amphiphilic Ionic Liquids. Chemical Communications 2005, 1333. [Google Scholar] [CrossRef] [PubMed]
- Uchida, Y.; Matsumoto, T.; Akita, T.; Nishiyama, N. Ion Conductive Properties in Ionic Liquid Crystalline Phases Confined in a Porous Membrane. J Mater Chem C Mater 2015, 3, 6144–6147. [Google Scholar] [CrossRef]
- Kuo, D.; Soberats, B.; Kumar, K.R.S.; Yoshio, M.; Ichikawa, T.; Ohno, H.; Zeng, X.; Ungar, G.; Kato, T. Switching of Ionic Conductivities in Columnar Liquid-Crystalline Anilinium Salts: Effects of Alkyl Chains, Ammonium Cations and Counter Anions on Thermal Properties and Switching Temperatures. Mol Syst Des Eng 2019, 4, 342–347. [Google Scholar] [CrossRef]
- Feng, C.; Hemantha Rajapaksha, C.P.; Jákli, A. Ionic Elastomers for Electric Actuators and Sensors. Engineering 2021, 7, 581. [Google Scholar] [CrossRef]
- Luo, S.C.; Sun, S.; Deorukhkar, A.R.; Lu, J.T.; Bhattacharyya, A.; Lin, I.J.B. Ionic Liquids and Ionic Liquid Crystals of Vinyl Functionalized Imidazolium Salts. J Mater Chem 2011, 21, 1866–1873. [Google Scholar] [CrossRef]
- Hemantha Rajapaksha, C.P.; Paudel, P.R.; Kodikara, P.M.S.G.; Dahal, D.; Dassanayake, T.M.; Kaphle, V.; Lüssem, B.; Jákli, A. Ionic Liquid Crystal Elastomers-Based Flexible Organic Electrochemical Transistors: Effect of Director Alignment of the Solid Electrolyte. Appl Phys Rev 2022, 9, 011415. [Google Scholar] [CrossRef]
- Alyami, A.; Rajapaksha, C.P.H.; Paudel, P.R.; Kaphle, V.; Kodikara, S.G.; Lüssem, B.; Jákli, A. Bending Sensor Using Ionic Liquid Crystal Elastomers as Solid Electrolyte of Organic Electrochemical Transistors. Liq Cryst 2023, 297–304. [Google Scholar] [CrossRef]
- Rajapaksha, C.P.H.; Gunathilaka, M.D.T.; Narute, S.; Albehaijan, H.; Piedrahita, C.; Paudel, P.; Feng, C.; Lüssem, B.; Kyu, T.; Jákli, A. Flexo-Ionic Effect of Ionic Liquid Crystal Elastomers. Molecules 2021, 26, 4234. [Google Scholar] [CrossRef]
- Feng, C.; Rajapaksha, C.P.H.; Cedillo, J.M.; Piedrahita, C.; Cao, J.; Kaphle, V.; Lüssem, B.; Kyu, T.; Jákli, A. Electroresponsive Ionic Liquid Crystal Elastomers. Macromol Rapid Commun 2019, 40, 1900299. [Google Scholar] [CrossRef] [PubMed]
- Alyami, A.; Rajapaksha, C.P.H.; Feng, C.; Paudel, P.R.; Paul, A.; Adaka, A.; Dharmarathna, R.; Lüssem, B.; Jákli, A. Ionic Liquid Crystal Elastomers for Actuators, Sensors, and Organic Transistors. Liq Cryst 2023, 50, 1151–1161. [Google Scholar] [CrossRef]
- Drzaic, P.S. Liquid Crystal Dispersions; 1995. [Google Scholar]
- Scharf, T. Polarized Light in Liquid Crystals and Polymers; 2006. [Google Scholar]
- Méry, A.; Rousselot, S.; Lepage, D.; Dollé, M. A Critical Review for an Accurate Electrochemical Stability Window Measurement of Solid Polymer and Composite Electrolytes. Materials 2021, 14. [Google Scholar] [CrossRef] [PubMed]
- Seidl, L.; Grissa, R.; Zhang, L.; Trabesinger, S.; Battaglia, C. Unraveling the Voltage-Dependent Oxidation Mechanisms of Poly(Ethylene Oxide)-Based Solid Electrolytes for Solid-State Batteries. Adv Mater Interfaces 2022, 9. [Google Scholar] [CrossRef]
- Alarco, P.J.; Abu-Lebdeh, Y.; Abouimrane, A.; Armand, M. The Plastic-Crystalline Phase of Succinonitrile as a Universal Matrix for Solid-State Ionic Conductors. Nat Mater 2004, 3. [Google Scholar] [CrossRef]
- Wang, X.; He, Z.; Yan, R.; Niu, H.; He, W.; Miao, Z. Liquid Crystal Elastomer-Based Solid Electrolyte with Intelligently Regulated Rigidity–Flexibility toward High-Energy Lithium Batteries. Chemical Engineering Journal 2025, 503, 158552. [Google Scholar] [CrossRef]
- Fu, J.; Li, Z.; Zhou, X.; Guo, X. Ion Transport in Composite Polymer Electrolytes. Mater Adv 2022. [Google Scholar] [CrossRef]
- Gerdroodbar, A.E.; Alihemmati, H.; Safavi-Mirmahaleh, S.A.; Golshan, M.; Damircheli, R.; Eliseeva, S.N.; Salami-Kalajahi, M. A Review on Ion Transport Pathways and Coordination Chemistry between Ions and Electrolytes in Energy Storage Devices. J Energy Storage 2023, 74. [Google Scholar] [CrossRef]
- Lee, H.; Choi, J.W.; Kyu, T. A Comparative Study on Electrochemical Performance of Single versus Dual Networks in Lithium Metal/Polysulfide-Polyoxide Co-Network/Lithium Titanium Oxide Cathode. Batteries 2024, 10. [Google Scholar] [CrossRef]
Disclaimer/Publisher’s Note: The statements, opinions and data contained in all publications are solely those of the individual author(s) and contributor(s) and not of MDPI and/or the editor(s). MDPI and/or the editor(s) disclaim responsibility for any injury to people or property resulting from any ideas, methods, instructions or products referred to in the content. |
© 2025 by the authors. Licensee MDPI, Basel, Switzerland. This article is an open access article distributed under the terms and conditions of the Creative Commons Attribution (CC BY) license (http://creativecommons.org/licenses/by/4.0/).


