Preprint
Article

This version is not peer-reviewed.

Explainable Supervised Learning Models for Aviation Predictions in Australia

A peer-reviewed article of this preprint also exists.

Submitted:

13 February 2025

Posted:

13 February 2025

You are already at the latest version

Abstract

Despite its recent success in various industries, artificial intelligence has not received full acceptance; hence, it has been fully deployed by the aviation industry. This is partly attributed to, among other factors, the AI (Artificial Intelligence) model works as a black-box model with no clear explanations of how outputs are generated from the input samples. Aviation is an extremely sensitive application field, and this model’s opaqueness makes it hard for a human user in the aviation industry to trust such a model. The work in this study examines the classification performance of various AI algorithms. Then it applies the SHAP (SHapley Additive exPlanations) framework to generate and visualize global-based model explanations to understand which features are learned for the decision boundary of each model and how much each model contributes to the final model output. We also deployed a variation autoencoder to handle the imbalanced class distribution nature of the ATSB (Australian Transport Safety Bureau) dataset. We recorded competitive classification performance in accuracy, precision, recall, and F1-score for a three-class supervised learning-based classification problem.

Keywords: 
;  ;  ;  ;  ;  

1. Introduction

Recent years have seen a rapid proliferation of advanced artificial intelligence (AI) algorithms with profound performance regarding detection, prediction, and classification tasks [1,2,3,4]. Consequently, this has triggered an exponential rise in the development and deployment of AI-based applications across various industries for accelerated process automation. This change in basic assumptions has further been motivated by the evolution of Internet of things (IoT) technology which equips “things” that conventionally had no computing capabilities with some degree of intelligence through sensors and actuators that monitor the world around them, collecting data about every event and transmitting it to the concerned entities for further analysis and decision-making support [5]. For instance, the Airbus A350 comes with more than 250,000 sensors that monitor every component, in and out, of the aircraft and its surroundings and collect data ranging from weather to in-flight commands issued by pilots [6]. This translates into huge volumes of data flowing into air traffic management systems that require real-time analysis to support timely decisions by human stakeholders.
In non-safety critical fields, advanced data analytics techniques coupled with advanced AI algorithms have come to the rescue in such situations. However, the inherent lack of model transparency by AI models has turned out to be a great impediment to the deployment of AI in the aviation industry due to its sensitivity to safety-threatening occurrences [1,5,7]. The rationale behind AI models’ outputs remains opaque to human users to this day which is non-trivial to applications with high sensitivity to wrong model outputs, like the aviation industry, where even a seemingly slight misjudgment of the situation can have far-reaching catastrophic consequences ranging from loss of life to unrecoverable losses caused by accidents that often result in aircraft getting completely destroyed and aviation companies losing huge sums of money in compensating the victims’ families.
To achieve AI model transparency and trustworthiness, AI researchers are shifting their focus to finding approaches that can make models explainable both at a local level where the rationale behind individual model predictions is explained and at a global level which is concerned with giving an intuition of the decision boundary learned by the model while providing a high-level insight of how the learned features impact the model’s outputs [5]. This concept of making AI models explainable is known as Explainable Artificial Intelligence (XAI) [8,9]. Various XAI-based approaches have been proposed in the last half-decade including model-agnostic and model-independent approaches. Most of the traditional machine learning algorithms like support vector machines (SVM), Decision Trees (DT), and K-Nearest Neighbor (KNN), among others, are intrinsically explainable, that is, their mode of operation is easily explainable, and human users can easily visualize the rationale behind a given model output [8,10].
On the other hand, deep learning models continue to operate as a “Blackbox” with no human-centric explanations for their output owing to the enormous amount of non-linear mathematical operations that take place in their hidden layers [1,8,11,12]. Deep learning XAI approaches have been proposed to clear this barrier, including SHapley Additive exPlanations (SHAP) [13,14], DeepSHAP [13,14], Local Interpretable Model-agnostic Explanation (LIME) [15], DeepLIFT [16], among others.
In this paper, owing to the outstanding performance recorded by supervised machine learning algorithms in recent AI-based studies including healthcare [17,18], air transport [19], and computer vision [20] among others, and the labelled nature of the dataset used for this study supervised learning was deployed for all the experiments. We leveraged Variational Autoencoder (VAE) models for under-represented class instances augmentation to ease the class imbalance distribution of the ATSB dataset. Then we trained and evaluated four AI algorithms for a three-class classification problem. Out of the four models, three are standard machine learning algorithms (i.e., SVM, Logistic regression (LR), and Random Forest (RF)) while the fourth is a deep neural network (DNN) constituting five hidden layers. We then deployed the SHAP technique to each model intending to understand the features pertinent to the decision boundary of each model and how they differ [21,22].
Our contributions to this study are as follows.
  • We investigate the impact of imbalanced distribution on the classification performance of various machine learning models and then propose a VAE-based data levelling approach to enhance model performance regarding minority class instances recognition.
  • We evaluate and visualize the impact of each independent variable on the model output to allow model explainability and consequently make the model classifications more transparent and trustable by human stakeholders in the aviation industry.
The rest of this paper is structured as: Section II presents existing prior work related to this study followed by Section III which gives a detailed description of the various techniques deployed to bring this work to existence, Section IV presents the experimental results and comprehensive discussion of their implications. Finally, Section V concludes this paper with a brief account of the current state of research on XAI concerning aviation safety and the possible direction for future research as far as this topic is concerned.

2. Related Work

Despite capturing the attention of many AI researchers across various fields of research, Explainable Artificial Intelligence (XAI) is still in its infant stage, that is, not much has been done to fully explore it for most fields, aviation not being exceptional. This section presents the prior studies whose context was the deployment of XAI to the aviation industry.
A study by [22] presented a taxonomy of the various levels of XAI relating to the aviation industry that can enhance trust in machine intelligence to human users. The study also gives an insight into the different state-of-the-art XAI approaches highlighting the pros and cons of each and suggesting the most suitable application area for each. However, no quantitative-based experiments are conducted to prove their concept, and consequently, no quantified performance comparison of the approaches for real-world scenarios is done. The work in [23] proposed a framework for generating human-centric and scientific explanations to enable human users to describe and interpret model predictions in the aviation industry. The authors contextualized XAI at four levels including interactivity with users where the XAI provides interactive explanations, level of observation where XAI is realized by either studying the observed data or the observed model, model structure where explanations are either model-agnostic or specific, and purpose of the explanations.
In a case study, Midtfjord et al. [24] highlighted the complexities involved in accurately modelling the physical dynamics of runway surface friction incurred by aircraft during landing. This challenge arises due to the complex and nonlinear interactions among the various physical factors influencing surface friction, as well as their time-dependent interdependencies. By incorporating weather data and runway condition reports, the study employed eXtreme Gradient Boosting (XGBoost) models to develop a hybrid assessment framework capable of classifying slippery runway conditions and predicting slipperiness levels. To ensure model transparency and support reliable decision-making for airport operators, the SHAP (SHapley Additive exPlanations) method was applied, offering localized explanations of the model outputs.
By using data provided by the United States Air Force (USAF) spanning from 2010 to 2018, study [25] trained and assessed several versions of interpretable models based on Bayesian networks, designed to function as decision support systems for selecting USAF candidate pilots. The authors utilized SHAP values alongside split conformal prediction techniques to provide explanations for the resulting black-box model hence facilitating a transparent and manageable assessment of each feature’s impact on the model's prediction, as well as a reliable estimation of the prediction's uncertainty.
The study by Groot et al. [26] emphasized that in scenarios with high traffic density, analytical conflict resolution methods can lead to airspace instabilities. The authors also highlighted that, despite existing alternative AI-based methods, such as those leveraging deep reinforcement learning, having demonstrated promising results in these settings, they functioned as black-box models, making their decision-making processes challenging to interpret. To address this, the authors explored ways to explain the behavior of a Soft Actor-Critic model trained for vertical conflict resolution within a structured urban airspace. They employed a heat map of chosen actions as a tool to interpret and visualize the learning policy.
Study [27] introduced a green performance evaluation model for airport buildings, leveraging PCA and hierarchical clustering algorithms within an explainable, semi-supervised AI framework. This approach aimed to minimize reliance on human intervention when assessing green scores. By employing methods such as the scatter coefficient, Psi Index, variation, and permutation to reduce dataset dimensions, alongside divisive and agglomerative hierarchical clustering techniques, the authors were able to derive interpretable decision trees from the corresponding hierarchical dendrograms.
In their study, [28]developed a deep neural network model aimed at forecasting airport throughput based on both current and anticipated weather and air traffic conditions. To offer insights into which features the model relied upon to generate specific outputs, the authors proposed a method incorporating the explainable principal component analysis (EPCA) algorithm [29]. This approach enabled users to explore feature vectors derived from processing autoencoder outputs, providing a clearer understanding of the model’s internal processes and decision-making behaviour. Through the proposed method, users could gain insight into both what the model learned and how particular outcomes were achieved. The technique was applied to a real-world case study where deep learning was used to predict the total number of flights—either landings or takeoffs at major US airports within a 15-minute interval.
Zeldam et al., [30] proposed and applied an automated failure diagnosis model where feasibility was tested using XAI on the RNLAF (Royal Netherlands Air Force) F-16s dataset. Their approach was demonstrated using several learning models---Support Vector Machine (SVM), Random Forest (RF), Naive Bayes (NB), and Neural Network (NN)---and experimental findings showed RF to record a higher performance of ≃ 80%. Their research is also based on XAI for model interpretation and understanding of the assessed diagnosis. The survey conducted in [
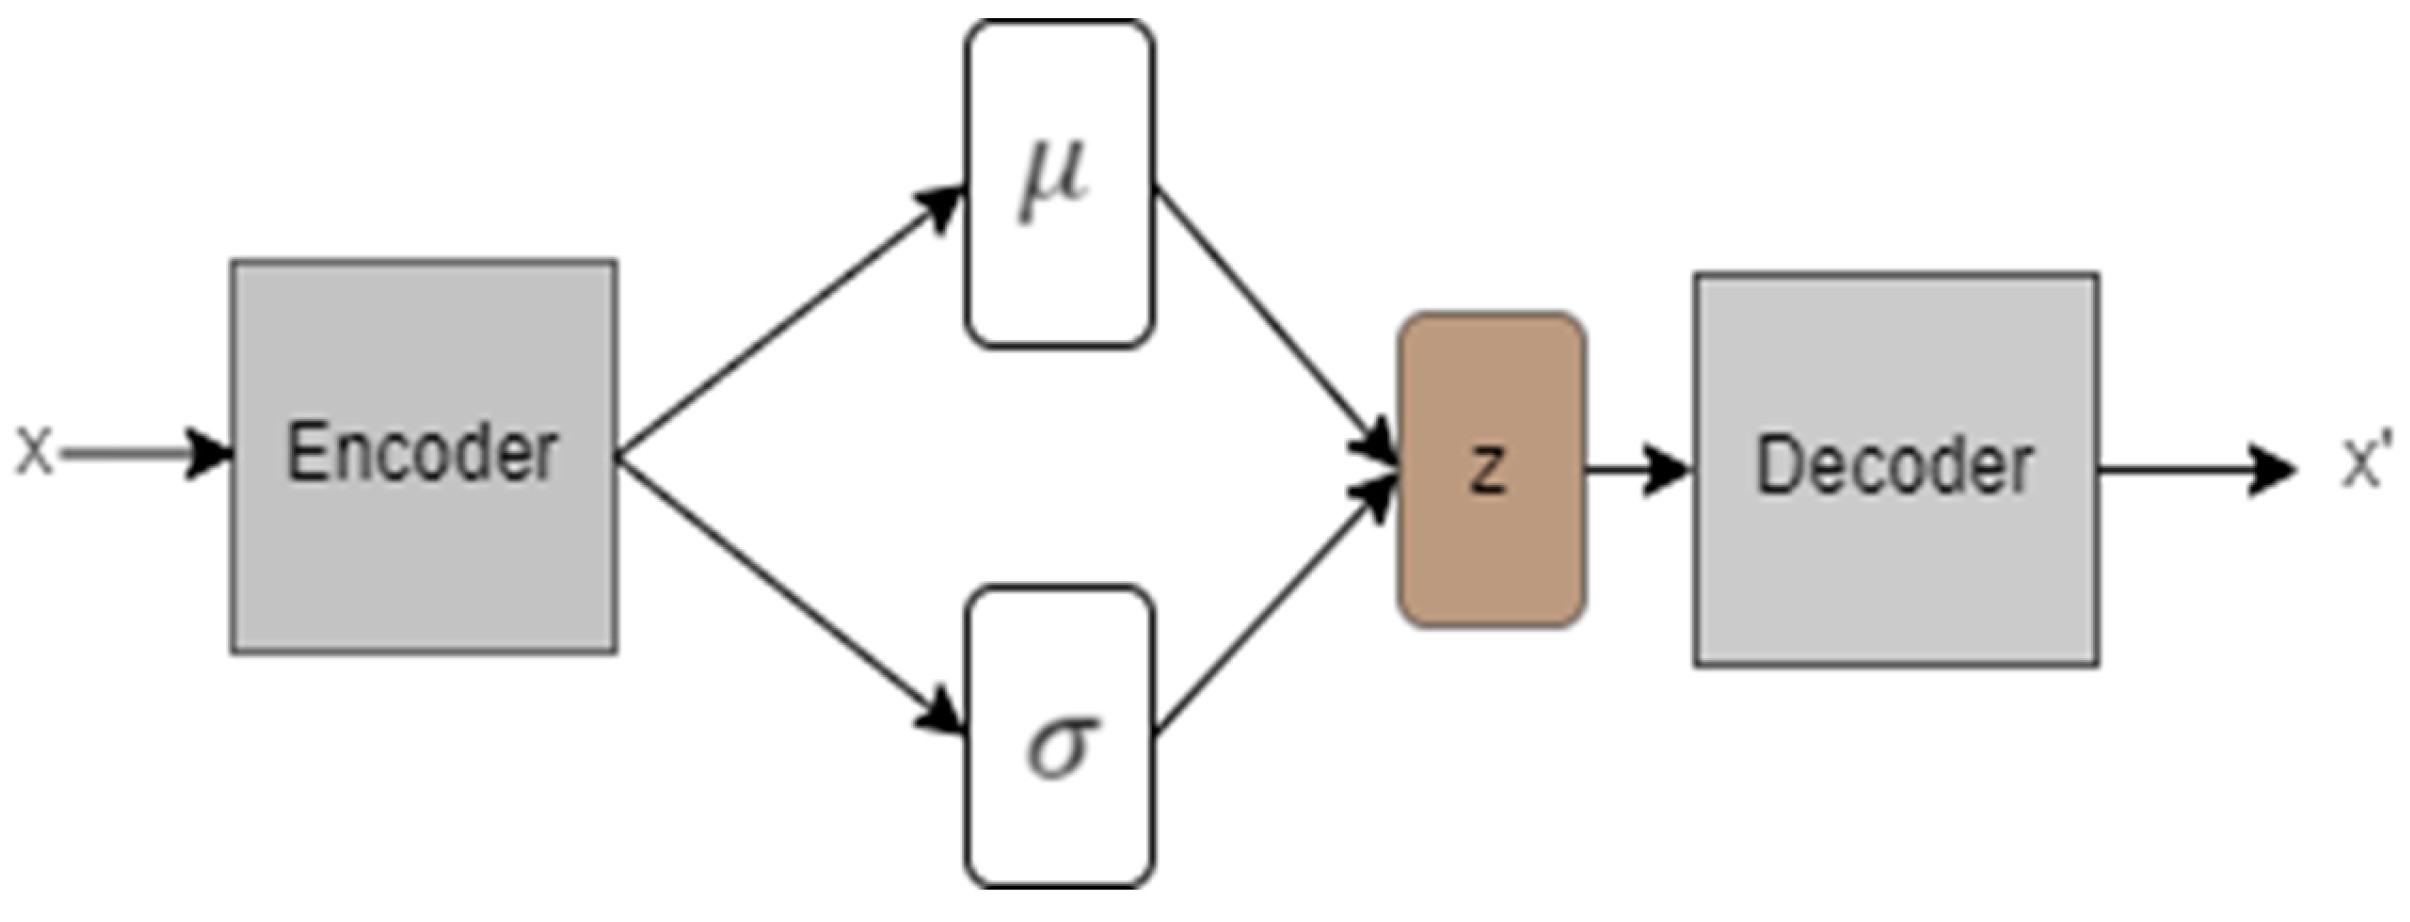
5] revealed that LR, SVM, RF, and NN models are better in AI prediction and hence can be used on aviation datasets. Their survey was on AI and XAI in Air Traffic Management (ATM) where they identified the current and future research developments in the same domain. They indicated that LIME and SHAP explanations are now commonly used as they are acceptable to researchers and thus should be used to give more knowledge and understanding to what models give to avoid biases and trust issues among the end users. They also studied the importance of using autoencoders in AI models as explained by Dubot and Olive in their studies specifically regarding air transportation [31,32].
In [33] a CNN (Convolutional Neural Networks) model was developed for the detection of topological defects in automated fiber placement manufacturing. To gain an intuition of the visual features (individual pixels or a group of pixels forming small image segments) that contribute to the model’s decision boundary, three XAI techniques were deployed including Smoothed Integrated Gradients (SIG), Guided Gradient Class activation mapping while the importance of deep learning features was obtained using Shapley Additive Explanations. For visualization of model classifications, SIG and DeepSHAP techniques were deployed. The authors computed and visualized explanations for sample layup defective images while seeing how these explanations correlated with model decisions. Also, study [34] developed an inception network model (CNN-based model) to discriminate between classes of objects/images. For model explainability, the authors deployed image feature visualization techniques including, visualizing activated neurons, deconvolution, deep dream, and Mask R-CNN segmentation to the output of each layer to extract intermediate information and understand which features are learned for input image discrimination. The authors in [33] presented a CNN-based semi-supervised model that used an autoencoder component for unsupervised learning and a fully connected network component for supervised learning. The study leveraged Linear adversarial perturbation using the fast gradient sign method (FGSM) to realize input feature perturbation in a bid to understand the impact of each feature on the model classification performance. Also, t-SNE was initialized using PCA (Principal Components Analysis) and then deployed to visualize the high-dimensional latent feature space in a 2D space.
In [35] a recurrent LSTM-based deep neural network was trained and evaluated on a historic flight dataset collected at the John F. Kennedy International Airport for predicting future unsafe situations. To ensure transparency of model operations, the authors leveraged a combination of input perturbation techniques and an intrinsically explainable hyperplane-based classification model to, in a global approach, explain the decision boundary of the proposed neural network model. The proposed LSTM (Long Short-Term Memory) model recorded 9.4%,12.8%, and 42.3 seconds while the hyperplane-based model recorded 97.2%, 18.0%, and 51.8 seconds in terms of accuracy, miss-detection rate, and duration before the occurrence of the degraded state, respectively.
In a study [36], Saraf et al. proposed a prototype tool for verifying and validating AI-based aviation systems. A LIME-based technique was used to generate reliable, human-understandable explanations for predictions from the Multiple Kernel Anomaly Detection (MKAD) algorithm, an SMV-based algorithm developed by NASA (National Aeronautics & Space Administration) for aircraft trajectory anomaly detection. Using the enhanced input perturbation technique, the proposed approach located exact anomaly points from the aircraft trajectory images. The authors also proposed a prototype for verifying and validating AI-based aviation systems where they applied XAI for aviation safety applications. Their work gave proof of concept for an explanation as they used XAI to make reasonable interpretations that humans can understand in making decisions based on the models. Hence concluded that the application of XAI can be used by subject matter experts (SMEs) and is useful concerning users accepting the decision made by AI-based support tools.
In the study [37], a genetic algorithm-based conflict resolution algorithm for ATM was proposed to determine the best aircraft trajectories. Model explainability was evaluated by assessing the degree to which the controller understood its operations. Flight trajectory data was collected via flight simulations with nine controllers and the authors designed questionnaires to get feedback from each controller. To get fine-grained details, the authors also designed and utilized semi-structured questionnaires to assess the explanations at four levels, that is, at a Black box level where only the selected solution was presented, at a heat map level where a combination of potential solutions was demonstrated and at a storytelling level where human-centric explanations in form of storytelling were used.
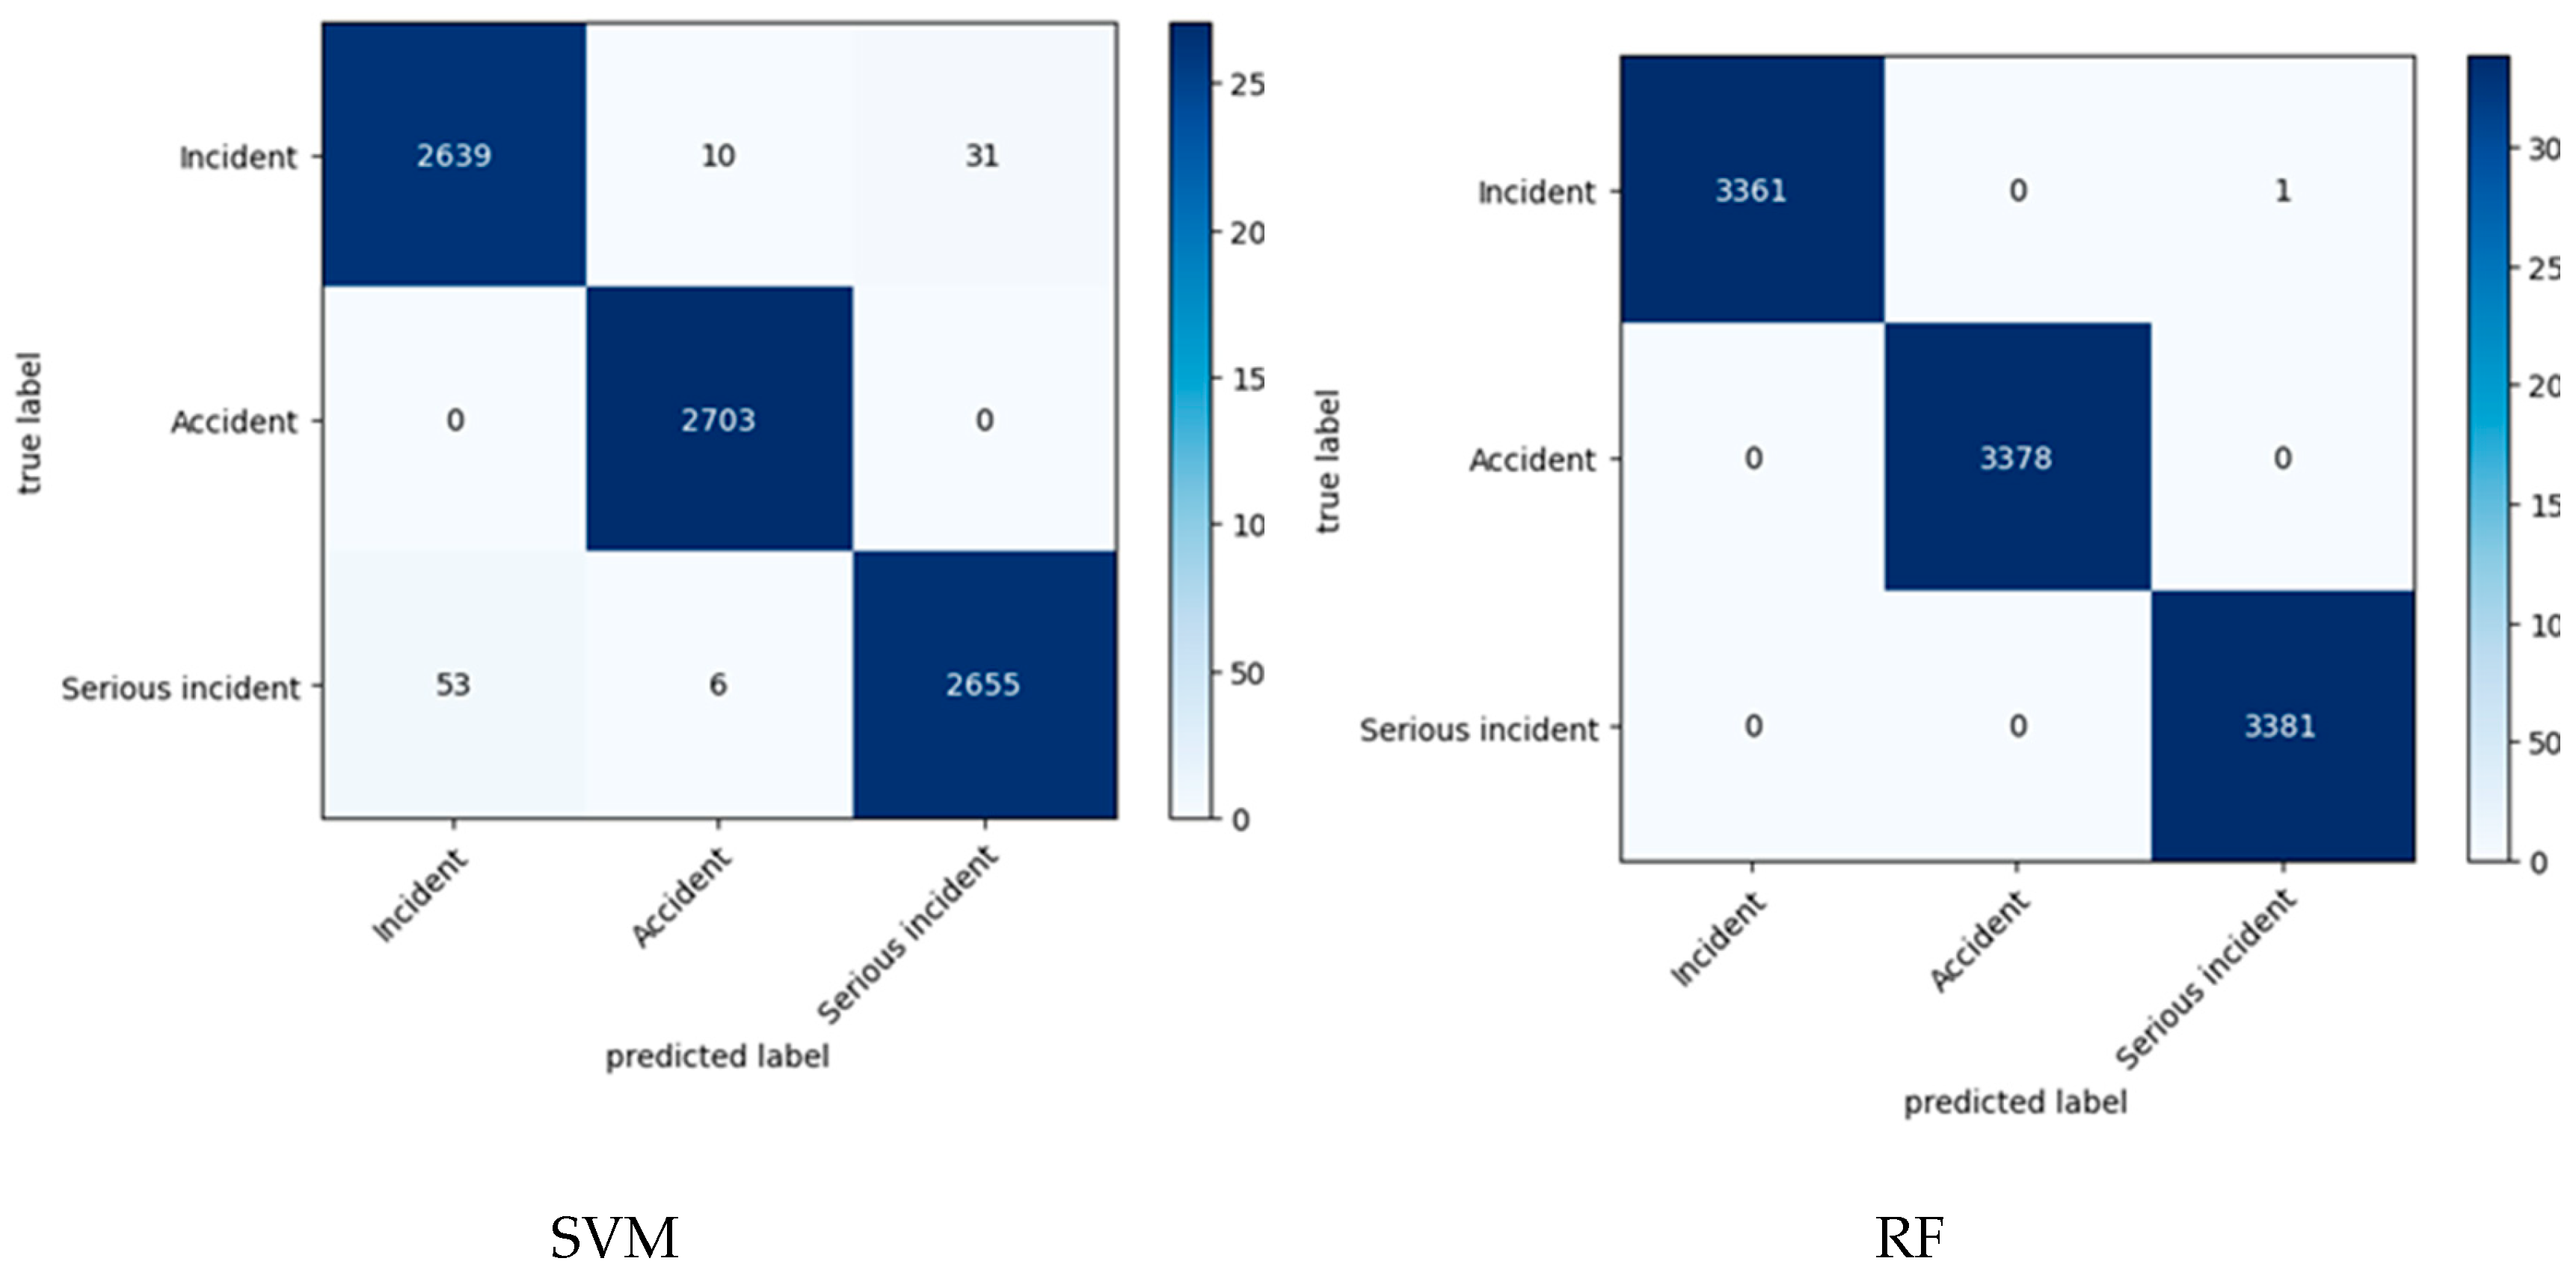
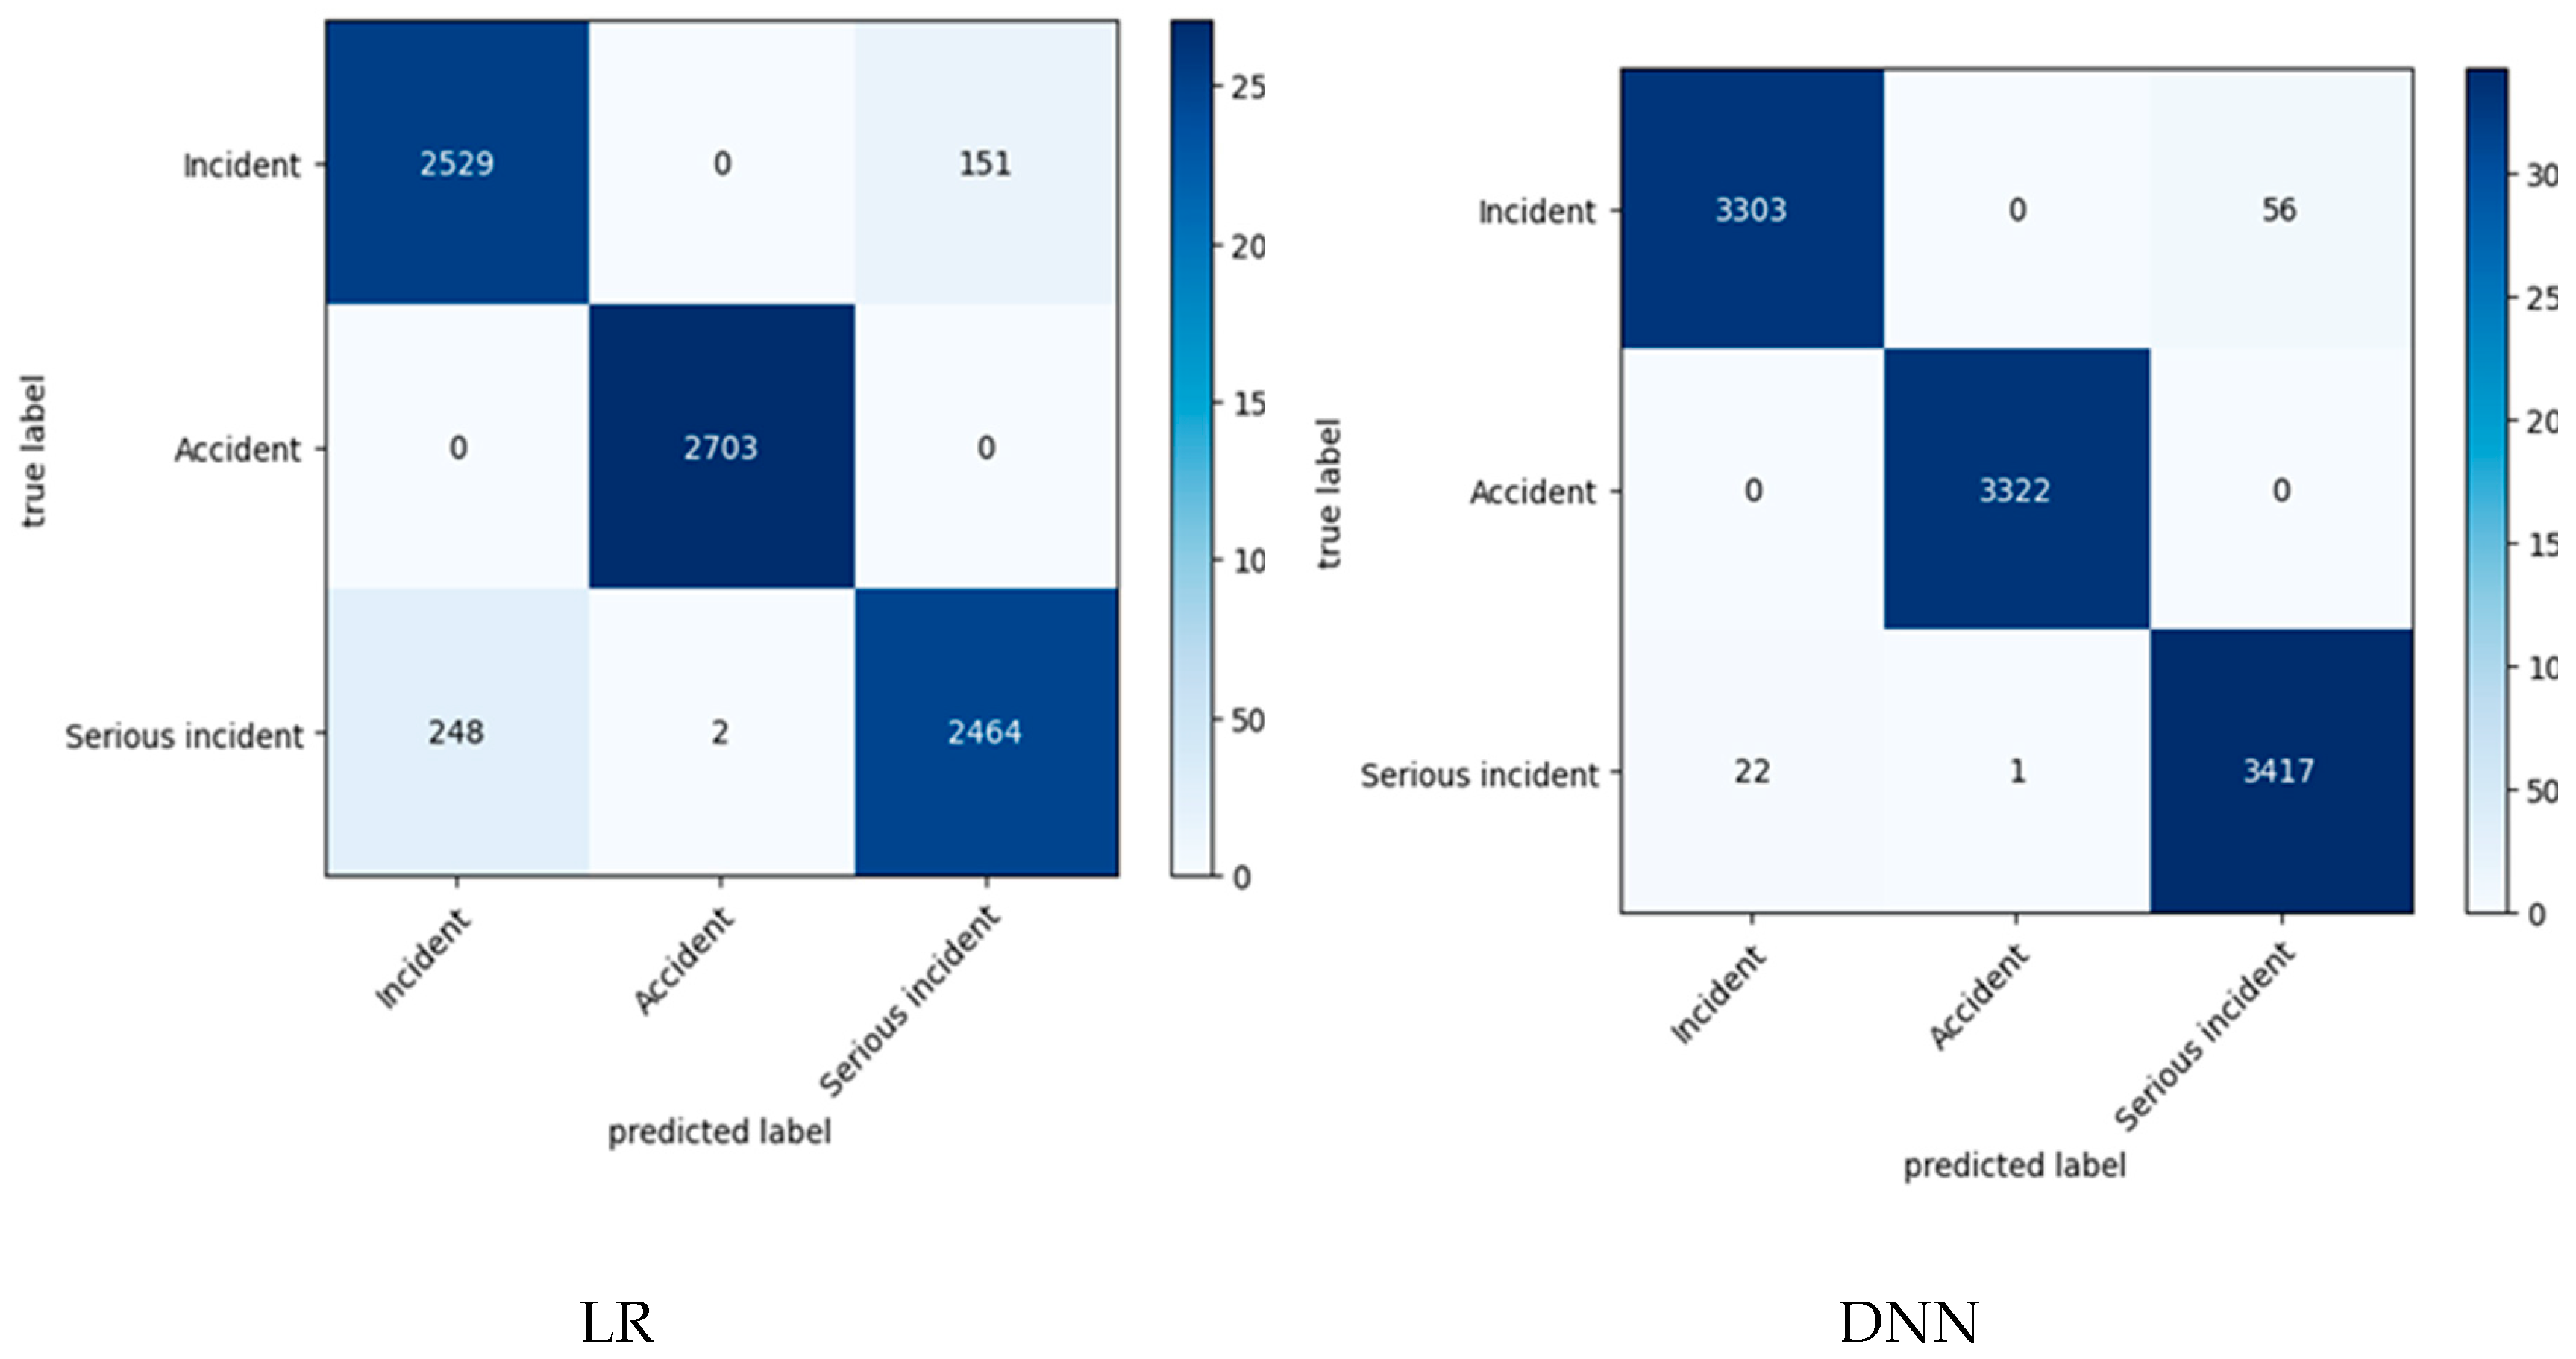
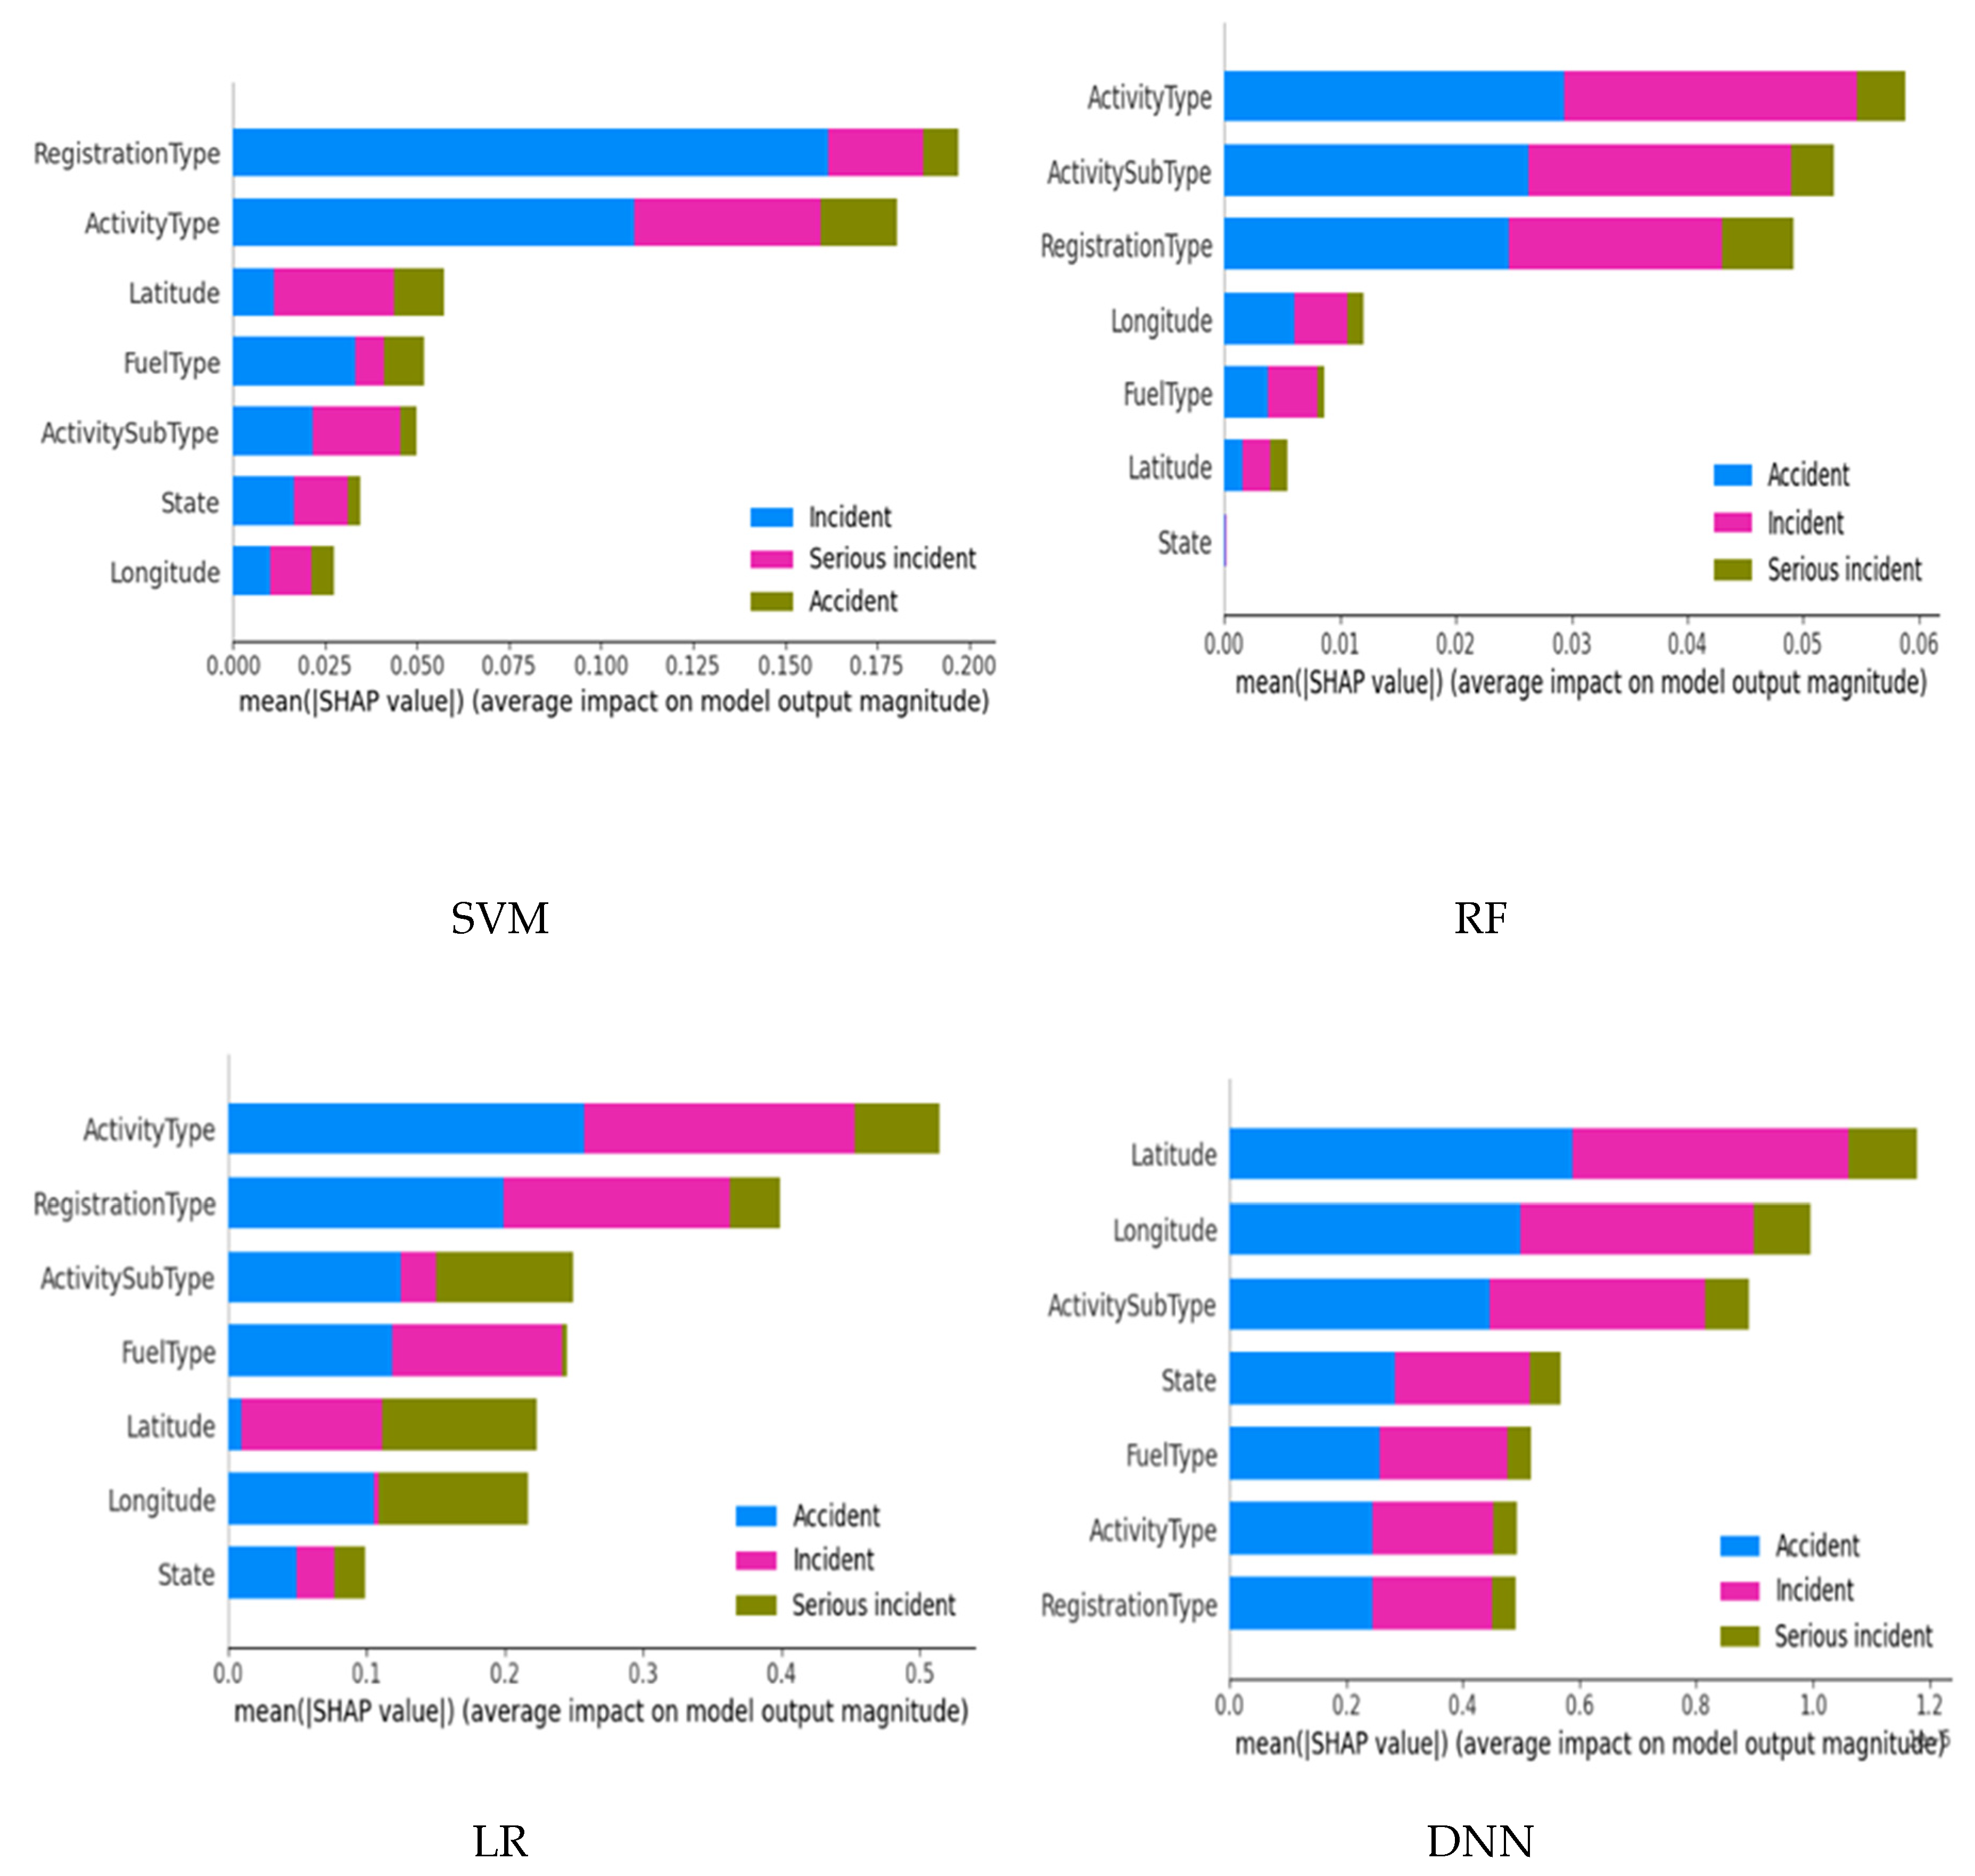
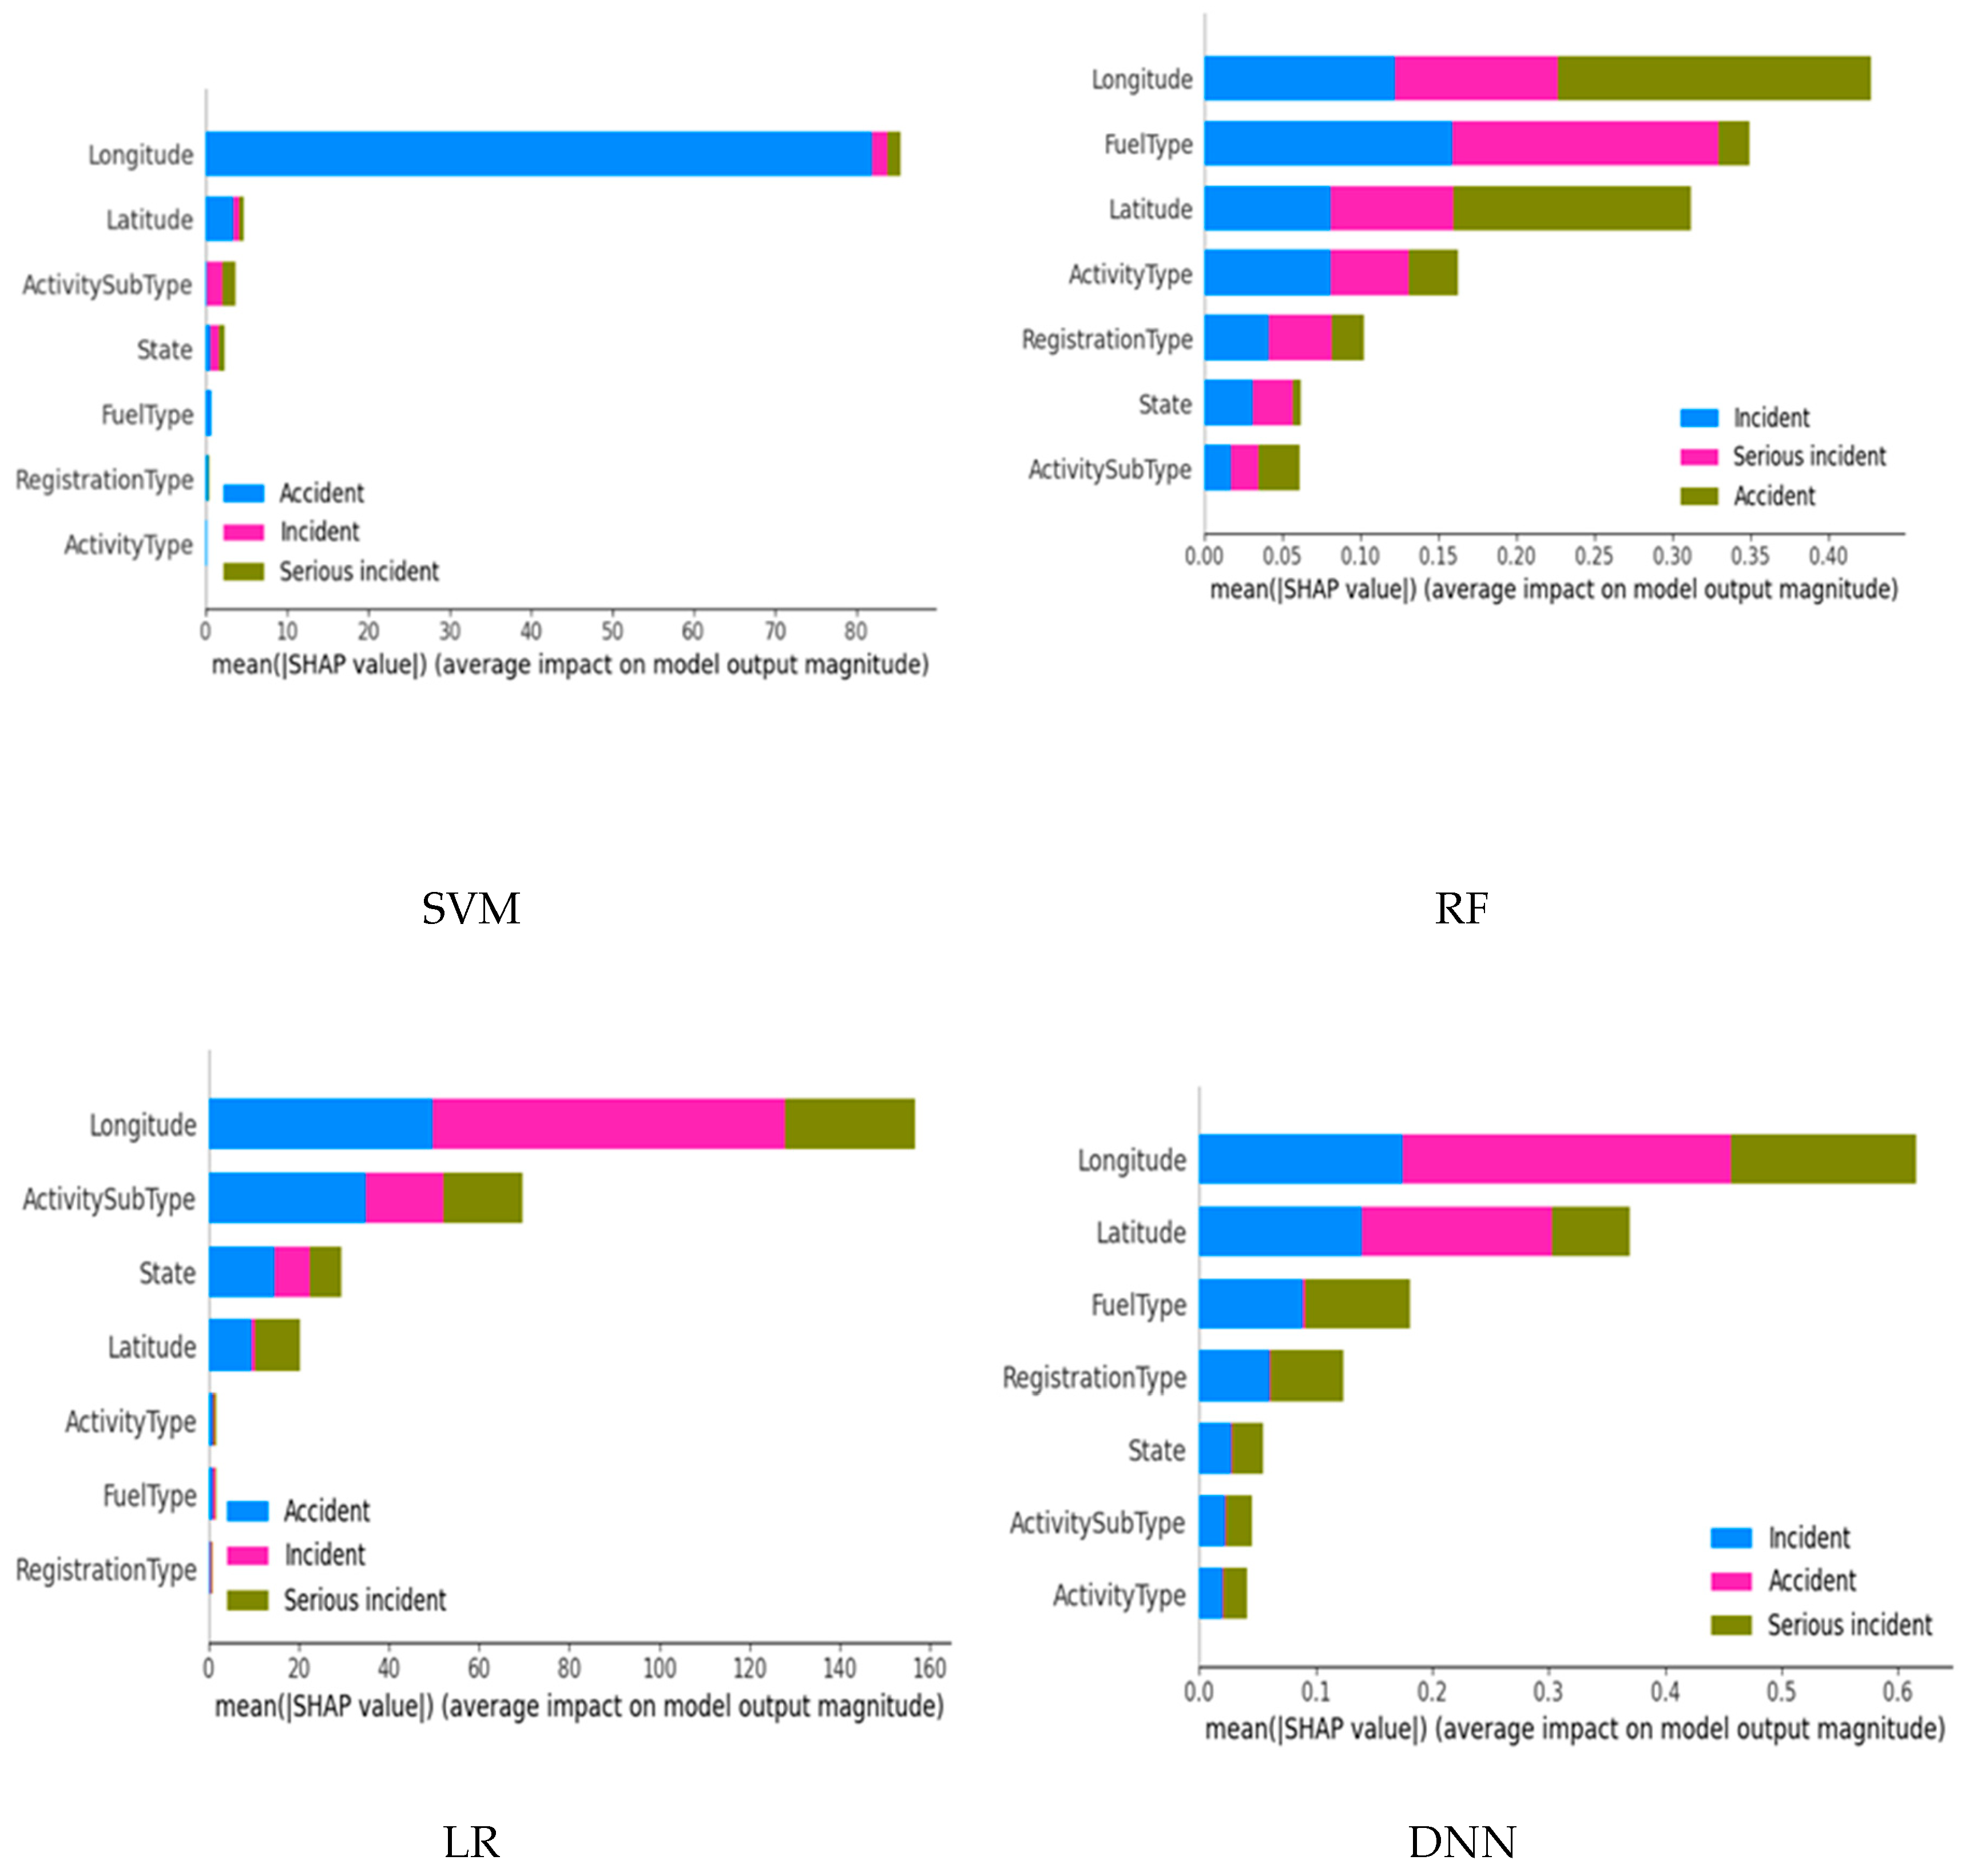
Despite many of the above studies emphasizing the importance of working with explainable and interpretable models in safety-critical fields, no prior studies have explored explainable models in the classification of aviation incidents using the ATSB aviation incident reports, while the few that have studied aviation incidents using this dataset have not considered the impact of its imbalanced distribution on model performance. This study closes this knowledge gap by training and evaluating the performance of various classic machine learning models and a deep learning model in classifying aviation incidents in the Australian Aviation industry while giving an insight into how the various features influence model predictions for both balanced and imbalanced learning.

3. Materials and Methods

The experimental execution in this study followed a three-step approach starting with data preprocessing followed by model training and evaluation and finally, the application of XAI-based techniques, SHAP and LIME, for model explainability. To study the impact of class imbalance, the investigated models were trained and evaluated on both the imbalanced and balanced datasets before and after the application of VAE.

3.1. Dataset

This study considered Accidents, Incidents, and Serious Incidents that were recorded in Australia for 20 years resulting in a dataset with 26,262 records distributed among the three classes as 3,402 (12.95%) “Accidents”, 20,894 (79.56%) “Incidents”, 1,966 (7.49%) “Serious Incidents” where the data was sourced directly from the ATSB investigation authorities.

3.2. Data Preprocessing

To ensure the dataset was in the desired format various data analytics techniques were utilized for the identification and removal of outliers and missing values, elimination of irrelevant features, handling of class imbalance, and feature encoding [36] Categorical features including “State”, “FuelType”, “RegistrationType”, “ActivityType”, and “ActivitySubType” were encoded as numerical features using 0ne-hot encoding. To handle class imbalance, additional instances were generated for the two under-represented classes— the “Accidents” class and the “Serious incidents” class—using a variational auto-encoder (VAE) [38]. The use of VAEs for imbalanced learning in this study was inspired by the impressive performance recorded by VAEs in enhancing the recognition of minority class instances for intrusion detection in the study [39]. A detailed description of how VAE operates is presented in the Subsection below.

3.3. Variational Autoencoder for class imbalance

As seen from the previous subsection, the dataset distribution in terms of the “occurrenceClass” variable is uneven with the incident class instances forming almost 80% of the total instances while accident and serious incident instances share the remaining 20%. Learning from imbalanced datasets can result in biased learning whereby the model learns patterns of the majority class and nothing from the under-represented classes. In such a case accuracy can be misleading since it can be high even when no minority class is assigned to the right class. This can be seen in section IV where we present validation results of models trained on the imbalanced dataset. To mitigate this issue, we employed variational autoencoders to generate more instances for the two under-represented classes.
A variation autoencoder first introduced [38], is an artificial neural network-based generative model that operates by learning a set of parameters, , of an approximate posterior, q ( z / x ) for the unknown true posterior (encoder), p θ ( z / x ) , where x is a random variable from the unknown underlying prior dataset distribution, p θ ( x ) , of the training dataset while z ~ N ( μ , σ ) is the low-dimension latent space of the learned VAE and often approximates a normal distribution. The decoder, p θ ( x / z ) , is trained to reconstruct the input variable, x ' , by sampling from the learned latent space distribution, z z so that x x ' . The model learns by minimizing two errors, i.e, the Kullback Leibler (KL) divergence between the actual and approximate posterior and the reconstruction error between the input data points, x , and reconstructed data points, x ' . Figure 1 depicts the general architecture of a VAE.
In this work, we developed two VAE models for the two under-represented occurrence class instances of the ATSB dataset. For instance, to generate more samples for the serious incident class, we trained a VAE using only samples of the serious class and then used the decoder model of the trained VAE to generate additional samples for that class. The same procedure was followed to generate additional “accident” class instances to balance the distribution between the three classes of instances of the “occurrence” class variables. 16000 and 17000 instances were generated for the “Accident” and “Serious Incident” classes respectively.

3.4. Model Performance Evaluation

This section presents a description of the evaluation metrics that were used in this study to assess the performance of the model. This work focused on multi-class classification and measured the performance by considering how well the predictions were distributed among classes based on precision, recall, F1 score, and accuracy [40,41,42,43,44]. F1-score as one of the performance metrics used in this study is simply the weighted combination of both recall and precision and its range is between 0 and 1 and the higher value is more preferred [41]. Table 1 shows the equations and explains how these performance metrics are calculated.
Where.
TP denotes the True Positive value where the actual value is similar/equal to the predicted value (i.e; the value of accident predictions that is correct according to the labeled data).
TN: The True Negative value for a class where it is the sum of all columns and rows except the class's values being calculated.
FP: False Positive value where the class is the sum of values of the corresponding column except for the True Positive value (i.e; the value of accident predictions which is not correct according to the labeled data).
FN: False Negative value where the class is equal to the number of wrongly predicted values or not detected by the model (i.e; the value of accident labeled in the original data but not/wrongly detected by the model).

3.4.1. Confusion Matrix

A confusion matrix is a square matrix in the R^m dimensional space, where m is the number of unique entries of the dependent variable instances distributed among the class labels by the trained AI model during the testing phase. It is a tool used to give visual information of how well the model performed on the test dataset and is often used as a yardstick to measure the goodness of the model. Table 2 demonstrates a simple confusion matrix for a binary classification problem discriminating between positive and negative instances of the test dataset. The dark cells show the correctly predicted value i.e., true positives (TP) and true negatives (TN), while the lighter cells show the wrong predictions i.e., false negatives (FN) and false positives (FP) [43].

3.5. Model Training and Validation

As indicated earlier, four classifiers including Logistic Regression, (LR), Random Forest (RF), Support Vector Machine (SVM), and the conventional feedforward Deep Neural Network (DNN) with backpropagation, were trained and evaluated for discriminating between instances of the occurrence class of the ATSB dataset. For both imbalanced and balanced dataset scenarios, python’s scikit-learn library was utilized to randomly split the datasets into train and test sets in a 4:1 ratio. The same library was used for instantiating the three standard machine learning classifiers (LR, RF, and SVM). It is worth noting that the three models’ hyper-parameters were set to sklearn’s defaults except the max_ depth on RF, which was set to 30, and the SVM kernel which was set to linear.
Also, we maintained the common architecture for the DNN which conventionally constitutes an input layer followed by a finite number of hidden dense layers (five hidden layers for the DNN in this study) and an output layer. For all hidden layers, a Rectified Linear Unit (ReLU) was deployed for activation while the output layer deployed softmax as the activation function. To prevent the model from overfitting, each of the first three hidden layers is followed by a dropout layer that in a stochastic manner selects 20% of nodes in each weight cycle [45]. To generate the predicted class, the argmax function was used. This returns the index corresponding to the entry with the highest probability from the softmax output.
Python libraries including Shap, pandas, and Numpy were respectively used for model explainability, loading and managing dataframes, numerical dataset transformation and label encoding while Matplotlib and Seaborn served to generate visual plots of model scores. All experiments were implemented in a Jupyter notebook on a Linux server with 256 CPU cores and 256GB RAM running Ubuntu OS.

3.6. Explanation Methods

To assert model transparency and trust by human users, we deployed XAI to generate model explanations. XAI is a technique applied in AI such that the results of a specific decision can be understood by humans. Various algorithms have been proposed in the recent past for the generation of individual prediction-based explanations, also known as local explanations. Local Interpretable Model-agnostic Explanation (LIME) proposed by [15] is a good example of such a technique which has seen application in numerous studies [46,47]. However, LIME and similar models have the drawback of the inability to explain the model’s predictions at a global scale, therefore, we utilized the SHAP module to generate and visualize global explanations for each of the classifiers used in this work. Despite the structures and prediction processes of the three classic ML (Machine Learning) algorithms (LR, RF, and SVM) being inherently explainable, we still applied SHAP to them to allow for a visual comparison between the features they learn and those learned by the DNN to define the decision boundary.

3.7. SHapley Additive exPlanations (SHAP)

This technique was proposed by [14] as a way of transforming “black box” AI models into transparent “white box” models to enhance their trustworthiness by generating and visualizing global explanations for the model’s learned decision boundary. SHAP was proposed to enable the explainability of complex AI models including ensembles and deep neural networks which were hard for even AI experts to explain. It works by assigning a numerical value (known as the shap_value) to each feature in the train set that defines its degree of importance to the model’s outputs. SHAP deploys the feature importance additive measure to generate a unified solution that combines the model explanation benefits of the previous local explanation XAI-based schemes including LIME [15], DeepLIFT [16,48] Layer-wise relevance propagation [49] and Classic Shapley Value Estimation [50,51,52], to generate global explanations. Figure 2 gives a high-level visual overview of the scope of XAI deployment in this work.

4. Results and Discussion

In this section, the findings of this study are presented and discussed in the context of classification performance and XAI, clearly highlighting the impact of imbalanced and balanced dataset distribution in both cases.

4.1. Machine Learning Model Performance

The performance of the four classification models studied in this work was evaluated in terms of accuracy. Table 3 clearly shows how the models perform on both the balanced and imbalanced datasets. These results clearly show that the application of VAE improved the classification performance for all models. However, in many cases, accuracy alone is not enough to judge the goodness of a model, especially for classification problems where the training dataset is highly imbalanced. For this matter, we investigated model performance in terms of other metrics and results are presented in Table 4 and Table 5 for the imbalanced and balanced train datasets, respectively.
It is clear from Table 4 that high accuracy can be misleading when working with class imbalance situations. That is, despite all models giving a classification accuracy far greater than the random guess value of 33.33% for a three-class classification problem, they learn nothing from the serious incidents instances as depicted from the recorded precision, recall, and F1-scores of 0.0 from all of them. This is further depicted by the confusion matrix of each model in Figure 2. However, the application of VAE for imbalanced learning, as seen in Table 5, not only improved the classification accuracy but also greatly enhanced the recognition of minority class instances, with great improvements in precision, recall and F1-score for both the accident and serious incident class. This is further evidenced in Figure 3, by the confusion matrix plots.
Model Class Performance
PRECISION RECALL F1-SCORE
SVM ACCIDENT 0.91 0.95 0.93
INCIDENT 0.99 1.00 1.00
SERIOUS-INCIDENT 0.95 0.90 0.93
RF ACCIDENT 1.00 1.00 1.00
INCIDENT 1.00 1.00 1.00
SERIOUS-INCIDENT 1.00 1.00 1.00
LR ACCIDENT 0.91 0.94 0.93
INCIDENT 1.00 1.00 1.00
SERIOUS-INCIDENT 0.94 0.91 0.92
DNN ACCIDENT 0.99 0.98 0.99
INCIDENT 1.00 1.00 1.00
SERIOUS-INCIDENT 0.98 0.99 0.99
Figure 3 and Figure 4 are the confusion matrix plots from the test sets of imbalanced and balanced datasets, respectively. The plots give a visual insight into how the different models perform on the test showing how the test instances are distributed amongst each class for each trained model.
However, despite recording impressive classification scores after balancing the train set distribution across the dependent variable classes, the models still don't provide any information about which features influenced their final decisions and to what extent, and they continue to operate as black box models whose output cannot be trusted in a safety-critical field like aviation both civil and general aviation. To address these issues this study applied SHAP for explainability and the experimental findings are presented in the subsequent subsections.

4.2. SHAP-Based Explanations

To clearly understand what features the models learn and how they impact the model output, we generated and visualized shap_values obtained for each feature from all four models on the imbalanced and balanced datasets. Figure 5 shows SHAP plots for the imbalanced dataset case while Figure 6 shows SHAP plots from the balanced dataset scenarios. As already seen from the classification results, the models recorded awful results on the imbalanced datasets while the performance improved on the balanced dataset. To understand the rationale behind this pattern we took a step further and conducted a comparative study of the four most key features that defined the decision boundary for each model before and after balancing the dataset. This comparison is presented in Table 6 below.
It is clear from Table 6 that all the models attach different importance to the feature when trained on an imbalanced dataset than when trained on a balanced dataset. This could tell why the models performed poorly on the imbalanced datasets in terms of minority class instance recognition than on the balanced datasets. The models likely learned and used weak features for the decision boundary in the imbalance scenario. As can be seen from Table 6, the three features Longitude, Latitude, and activity type and Fuel Type form the core of the decision boundary for the three classic machine learning algorithms. While the DNN model, though, maintains the two fields' latitude and longitude, it substitutes the third field with Fuel Type. It is worth noting that, while the combination of the four most key features as depicted from the SHAP plots, is different for all models the Latitude and Longitude features are part of the four most key features for all four models when trained on the balanced dataset.

4. Discussion

This study highlights the challenges and opportunities in leveraging AI for aviation safety, focusing on class imbalance and explainability.

4.1. Impact of Dataset Balancing on Model Performance

The results demonstrate that balancing datasets using Variational Autoencoder (VAE) significantly improves classification performance across all models (SVM, RF, LR, DNN). Minority class recognition, particularly for accidents and serious incidents, showed marked improvements, with F1 scores increasing from 0.0 on imbalanced datasets to nearly 1.0. These findings reaffirm the necessity of robust preprocessing methods like VAE in addressing class imbalance—a persistent challenge in aviation safety datasets. However, the results also expose the limitations of relying solely on accuracy, as models can be overfit to majority classes. Confusion matrix analyses further support the use of metrics like precision, recall, and F1 scores for evaluating model performance in safety-critical contexts.

4.2. Explainability and Feature Importance Analysis

Using SHAP, the study provided insights into feature importance, revealing that models trained on balanced datasets relied more on domain-relevant features such as Latitude, Longitude, and Activity Type. In contrast, imbalanced datasets led to weaker feature selection and poor minority class recognition. The DNN model, while leveraging nuanced relationships, remains inherently opaque, highlighting a critical gap in trust and transparency for stakeholders.

4.3. Challenges in Transparency and Trust

Although SHAP adds interpretability to AI models, its scope is limited to local and feature-level insights. Deep learning models like DNNs, despite their high performance, pose challenges for adoption in aviation safety due to their "black box" nature. Developing hybrid explainability techniques that offer comprehensive global and local insights remains a vital area for future research.

4.4. Practical Implications and Future Work

The study underscores the importance of balanced datasets and XAI tools for improving model acceptance in the aviation industry. Collaborating with domain experts to align AI systems with operational workflows is critical for fostering trust. Future research should extend these findings to diverse datasets, explore hybrid models, and develop aviation-specific explainability tools to further bridge the gap between AI performance and stakeholder trust.

5. Conclusions

This study addresses two critical barriers to adopting AI in aviation safety: class imbalance and explainability. Through VAE-based dataset balancing, substantial improvements in recognizing minority class instances were achieved, underscoring the importance of addressing class imbalance in safety-critical applications. Additionally, the integration of SHAP enhanced model transparency by providing actionable insights into feature importance, which are essential for building trust among stakeholders. These findings emphasize the need for continued innovation in hybrid explainability frameworks that combine the predictive power of deep learning with interpretability. By offering practical strategies for balancing datasets and enhancing model transparency, this research lays the foundation for a safer integration of AI in aviation safety workflows. Future work should expand these findings to other datasets and incident types while developing domain-specific explainability tools to support broader AI adoption in the aviation industry.

Author Contributions

Aziida Nanyonga: Conceptualization, methodology, software, data curation, validation, writing—original draft preparation, Hassan Wasswa; formal analysis, writing—original draft preparation, Ugur Turhan and Keith Joiner.; writing—review and editing and Graham Wild: Data collection, supervision, final draft

Data Availability Statement

Authors confirm that the data will be available upon request.

Acknowledgments

We would like to express our sincere gratitude to the ATSB authorities for providing the ATSB dataset, which was instrumental in conducting this research.

Conflicts of Interest

The authors declare no conflicts of interest.

Abbreviations

The following abbreviations are used in this manuscript:
AI Artificial Intelligence
LIME Local Interpretable Model-agnostic Explanation
SHAP SHapley Additive exPlanations
XAI Explainable Artificial Intelligence
ATSB Australian Transport Safety Bureau
VAE Variational Autoencoder
LR Logistic Regression
RF Random Forest
SVM Support Vector Machine
DNN Conventional feedforward Deep Neural Network

References

  1. Samek WJapa. Explainable artificial intelligence: Understanding, visualizing and interpreting deep learning models. 2017.
  2. Nanyonga A, Wasswa H, Turhan U, Joiner K, Wild G, editors. Comparative Analysis of Topic Modeling Techniques on ATSB Text Narratives Using Natural Language Processing. 2024 3rd International Conference for Innovation in Technology (INOCON); 2024: IEEE. [CrossRef]
  3. Nanyonga A, Wasswa H, Wild G, editors. Aviation Safety Enhancement via NLP & Deep Learning: Classifying Flight Phases in ATSB Safety Reports. 2023 Global Conference on Information Technologies and Communications (GCITC); 2023: IEEE. [CrossRef]
  4. Nanyonga A, Wild G, editors. Impact of Dataset Size & Data Source on Aviation Safety Incident Prediction Models with Natural Language Processing. 2023 Global Conference on Information Technologies and Communications (GCITC); 2023: IEEE. [CrossRef]
  5. Degas A, Islam MR, Hurter C, Barua S, Rahman H, Poudel M, et al. A survey on artificial intelligence (ai) and explainable ai in air traffic management: Current trends and development with future research trajectory. 2022;12(3):1295. [CrossRef]
  6. Shukla B, Fan I-S, Jennions I, editors. Opportunities for explainable artificial intelligence in aerospace predictive maintenance. PHM Society European Conference; 2020.
  7. Memarzadeh M, Akbari Asanjan A, Matthews BJA. Robust and Explainable Semi-Supervised Deep Learning Model for Anomaly Detection in Aviation. 2022;9(8):437. [CrossRef]
  8. Kostopoulos N, Kalogeras D, Pantazatos D, Grammatikou M, Maglaris VJIA. SHAP interpretations of tree and neural network DNS classifiers for analyzing DGA family characteristics. 2023;11:61144-60. [CrossRef]
  9. Saraf AP, Chan K, Popish M, Browder J, Schade J, editors. Explainable artificial intelligence for aviation safety applications. AIAA Aviation 2020 Forum; 2020. [CrossRef]
  10. Khattak A, Chan P-W, Chen F, Peng HJA. Prediction of aircraft go-around during wind shear using the dynamic ensemble selection framework and pilot reports. 2022;13(12):2104. [CrossRef]
  11. Wanner J, Herm L-V, Janiesch C. How much is the black box? The value of explainability in machine learning models. 2020.
  12. Adadi A, Berrada MJIa. Peeking inside the black-box: a survey on explainable artificial intelligence (XAI). 2018;6:52138-60. [CrossRef]
  13. Lundberg SJapa. A unified approach to interpreting model predictions. 2017.
  14. Scott M, Su-In LJAinips. A unified approach to interpreting model predictions. 2017;30:4765-74.
  15. Ribeiro MT, Singh S, Guestrin C, editors. " Why should i trust you?" Explaining the predictions of any classifier. Proceedings of the 22nd ACM SIGKDD international conference on knowledge discovery and data mining; 2016.
  16. Shrikumar A, Greenside P, Kundaje A, editors. Learning important features through propagating activation differences. International conference on machine learning; 2017: PMlR.
  17. Aziida N, Malek S, Aziz F, Ibrahim KS, Kasim SJSM. Predicting 30-day mortality after an acute coronary syndrome (ACS) using machine learning methods for feature selection, classification and visualisation. 2021;50(3):753-68.
  18. Ibrahim K, Sorayya M, Aziida N, Sazzli SJIJoC. Preliminary study on application of machine learning method in predicting survival versus non-survival after myocardial infarction in Malaysian population. 2018;273:8.
  19. Wild G, Baxter G, Srisaeng P, Richardson S, editors. Machine learning for air transport planning and management. AIAA Aviation 2022 Forum; 2022.
  20. Wasswa H, Serwadda A, editors. The proof is in the glare: On the privacy risk posed by eyeglasses in video calls. Proceedings of the 2022 ACM on International Workshop on Security and Privacy Analytics; 2022.
  21. Khattak A, Chan P-W, Chen F, Peng HJA. Prediction and interpretation of low-level wind shear criticality based on Its altitude above runway level: Application of Bayesian optimization–ensemble learning classifiers and SHapley additive exPlanations. 2022;13(12):2102. [CrossRef]
  22. Messalas A, Kanellopoulos Y, Makris C, editors. Model-agnostic interpretability with shapley values. 2019 10th International Conference on Information, Intelligence, Systems and Applications (IISA); 2019: IEEE. [CrossRef]
  23. Sutthithatip S, Perinpanayagam S, Aslam S, editors. (Explainable) artificial intelligence in aerospace safety-critical systems. 2022 IEEE Aerospace Conference (AERO); 2022: IEEE.
  24. Midtfjord AD, De Bin R, Huseby ABJCRS, Technology. A decision support system for safer airplane landings: Predicting runway conditions using XGBoost and explainable AI. 2022;199:103556. [CrossRef]
  25. Wasilefsky D, Caballero WN, Johnstone C, Gaw N, Jenkins PRJDSS. Responsible machine learning for United States Air Force pilot candidate selection. 2024;180:114198. [CrossRef]
  26. Groot D, Ribeiro M, Ellerbroek J, Hoekstra J, editors. Policy Analysis of Safe Vertical Manoeuvring using Reinforcement Learning: Identifying when to Act and when to stay Idle. 13th SESAR Innovation Days; 2023.
  27. Ramakrishnan J, Seshadri K, Liu T, Zhang F, Yu R, Gou ZJJoBE. Explainable semi-supervised AI for green performance evaluation of airport buildings. 2023;79:107788. [CrossRef]
  28. Rudd K, Eshow M, Gibbs M, editors. Method for Generating Explainable Deep Learning Models in the Context of Air Traffic Management. International Conference on Machine Learning, Optimization, and Data Science; 2021: Springer.
  29. Brinton C, editor A framework for explanation of machine learning decisions. IJCAI-17 workshop on explainable AI (XAI); 2017.
  30. Zeldam, S. Automated failure diagnosis in aviation maintenance using explainable artificial intelligence (XAI): University of Twente; 2018.
  31. Olive X, Basora L, Viry B, Alligier R, editors. Deep trajectory clustering with autoencoders. ICRAT 2020, 9th International Conference for Research in Air Transportation; 2020.
  32. Dubot T, editor Predicting sector configuration transitions with autoencoder-based anomaly detection. Proceedings of the International Conference for Research in Air Transportation; 2018.
  33. Meister S, Wermes MA, Stüve J, Groves RM, editors. Explainability of deep learning classifier decisions for optical detection of manufacturing defects in the automated fiber placement process. Automated Visual Inspection and Machine Vision IV; 2021: SPIE.
  34. Dolph CV, Tran L, Allen BD, editors. Towards explainability of uav-based convolutional neural networks for object classification. 2018 Aviation Technology, Integration, and Operations Conference; 2018.
  35. Grushin A, Nanda J, Tyagi A, Miller D, Gluck J, Oza NC, et al., editors. Decoding the black box: Extracting explainable decision boundary approximations from machine learning models for real time safety assurance of the national airspace. AIAA Scitech 2019 Forum; 2019.
  36. Silaparasetty N. Machine learning concepts with python and the jupyter notebook environment: Using tensorflow 2.0: Springer; 2020. [CrossRef]
  37. Hurter C, Degas A, Guibert A, Durand N, Ferreira A, Cavagnetto N, et al. Usage of more transparent and explainable conflict resolution algorithm: air traffic controller feedback. 2022;66:270-8. [CrossRef]
  38. Kingma DPJapa. Auto-encoding variational bayes. 2013.
  39. Abdulhammed R, Faezipour M, Abuzneid A, AbuMallouh AJIsl. Deep and machine learning approaches for anomaly-based intrusion detection of imbalanced network traffic. 2018;3(1):1-4. [CrossRef]
  40. Baptista ML, Henriques EM, Prendinger HJM. Classification prognostics approaches in aviation. 2021;182:109756.
  41. Doğru A, Bouarfa S, Arizar R, Aydoğan RJA. Using convolutional neural networks to automate aircraft maintenance visual inspection. 2020;7(12):171. [CrossRef]
  42. Haghighi S, Jasemi M, Hessabi S, Zolanvari AJJoOSS. PyCM: Multiclass confusion matrix library in Python. 2018;3(25):729. [CrossRef]
  43. Hossin M, Sulaiman MNJIjodm, process km. A review on evaluation metrics for data classification evaluations. 2015;5(2):1.
  44. Nanyonga A, Wasswa H, Turhan U, Molloy O, Wild G, editors. Sequential classification of aviation safety occurrences with natural language processing. AIAA AVIATION 2023 Forum; 2023.
  45. Srivastava N, Hinton G, Krizhevsky A, Sutskever I, Salakhutdinov RJTjomlr. Dropout: a simple way to prevent neural networks from overfitting. 2014;15(1):1929-58.
  46. Gianfagna L, Di Cecco A. Explainable AI with python: Springer; 2021.
  47. Carvalho DV, Pereira EM, Cardoso JSJE. Machine learning interpretability: A survey on methods and metrics. 2019;8(8):832. [CrossRef]
  48. Shrikumar A, Greenside P, Shcherbina A, Kundaje AJapa. Not just a black box: Learning important features through propagating activation differences. 2016.
  49. Bach S, Binder A, Montavon G, Klauschen F, Müller K-R, Samek WJPo. On pixel-wise explanations for non-linear classifier decisions by layer-wise relevance propagation. 2015;10(7):e0130140. [CrossRef]
  50. Datta A, Sen S, Zick Y, editors. Algorithmic transparency via quantitative input influence: Theory and experiments with learning systems. 2016 IEEE symposium on security and privacy (SP); 2016: IEEE. [CrossRef]
  51. Lipovetsky S, Conklin MJAsmib, industry. Analysis of regression in game theory approach. 2001;17(4):319-30.
  52. Štrumbelj E, Kononenko IJK, systems i. Explaining prediction models and individual predictions with feature contributions. 2014;41:647-65. [CrossRef]
Figure 1. Variational autoencoder architecture.
Preprints 149233 g001
Figure 2. Overview of the scope of explainability methods used.
Preprints 149233 g002
Figure 3. The Confusion Matrix for models trained on an imbalanced Dataset.
Preprints 149233 g003aPreprints 149233 g003b
Figure 4. The Confusion Matrix for models trained on a Balanced Dataset.
Preprints 149233 g004aPreprints 149233 g004b
Figure 5. SHAP plots for models trained on an imbalanced dataset.
Preprints 149233 g005
Figure 6. SHAP plots for models trained on the balanced dataset.
Preprints 149233 g006
Table 1. Summary of different evaluation metrics used.
Metrics used Formula Evaluation focus
Precision (p) T P T P + F P Precision measures the correctly predicted positives from the total predicted patterns in a positive class
Recall (r) T P T P + T N This recall measures the fraction of positive patterns that are correctly classified
F1-score (F) 2 p r e c i s i o n r e c a a l p r e c i s i o n + r e c a l l F-score measures the weighted average score of precision and recall
Accuracy (acc) T P + T N T P + F P + T N + F N Accuracy measures the total number of instances evaluated using the correctly predicted ratio.
Table 2. Confusion matrix.
Actual Value Predicted Value
TN FP
FN TP
Table 3. Comparison of classification accuracy for the various models.
Algorithm Accuracy
Imbalanced dataset Balanced dataset
Random forest 74.4% 99.9%
Support Vector Machine 74.5% 98.7%
Deep Neural Networks 73.9% 99.2%
Logistic Regression 75.0% 95.0%
Table 4. Model performance on an imbalanced dataset.
Model Class Performance
PRECISION RECALL F1-SCORE
SVM ACCIDENT 0.67 0.04 0.07
INCIDENT 0.75 1.00 0.87
SERIOUS-INCIDENT 0.00 0.00 0.00
RF ACCIDENT 0.84 0.03 0.07
INCIDENT 0.74 1.00 0.85
SERIOUS-INCIDENT 0.00 0.00 0.00
LR ACCIDENT 0.66 0.09 0.16
INCIDENT 0.75 0.99 0.86
SERIOUS-INCIDENT 0.00 0.00 0.00
DNN ACCIDENT 0.00 0.00 0.00
INCIDENT 0.74 1.00 0.85
SERIOUS-INCIDENT 0.00 0.00 0.00
Table 5. Model performance on a Balanced dataset.
Model Class Performance
PRECISION RECALL F1-SCORE
SVM ACCIDENT 0.91 0.95 0.93
INCIDENT 0.99 1.00 1.00
SERIOUS-INCIDENT 0.95 0.90 0.93
RF ACCIDENT 1.00 1.00 1.00
INCIDENT 1.00 1.00 1.00
SERIOUS-INCIDENT 1.00 1.00 1.00
LR ACCIDENT 0.91 0.94 0.93
INCIDENT 1.00 1.00 1.00
SERIOUS-INCIDENT 0.94 0.91 0.92
DNN ACCIDENT 0.99 0.98 0.99
INCIDENT 1.00 1.00 1.00
SERIOUS-INCIDENT 0.98 0.99 0.99
Table 6. Comparison of top 4 features defining each model’s decision boundary on imbalanced and imbalanced datasets.
Model Top 4 SHAP features on an imbalanced dataset Top 4 SHAP features on a balanced dataset
SVM Registration type Longitude
Activity type Latitude
Latitude Activity subtype
Fuel type State
RF Activity type Longitude
Activity subtype Fuel type
Registration type Latitude
Longitude Activity type
LR Activity type Longitude
Registration type Activity subtype
Activity subtype State
Fuel type Latitude
DNN Latitude Longitude
Longitude Latitude
Activity subtype Fuel type
State Registration type
Disclaimer/Publisher’s Note: The statements, opinions and data contained in all publications are solely those of the individual author(s) and contributor(s) and not of MDPI and/or the editor(s). MDPI and/or the editor(s) disclaim responsibility for any injury to people or property resulting from any ideas, methods, instructions or products referred to in the content.
Copyright: This open access article is published under a Creative Commons CC BY 4.0 license, which permit the free download, distribution, and reuse, provided that the author and preprint are cited in any reuse.
Prerpints.org logo

Preprints.org is a free preprint server supported by MDPI in Basel, Switzerland.

Subscribe

Disclaimer

Terms of Use

Privacy Policy

Privacy Settings

© 2025 MDPI (Basel, Switzerland) unless otherwise stated