

Submitted:
08 February 2025
Posted:
10 February 2025
You are already at the latest version
Abstract
Variable selection methods have been a focus in the context of econometrics and statistics literature. In this paper, we consider additive spatial autoregressive model with high-dimensional covariates. Instead of adopting the traditional regularization approaches, we offer a novel multi-step sparse boosting algorithm to conduct model-based prediction and variable selection. One main advantage of this new method is that we do not need to perform the time-consuming selection of tuning parameters. Extensive numerical examples illustrate the advantage of the proposed methodology. An application of Boston housing price data is further provided to demonstrate the proposed methodology.
Keywords:
sparse boosting
; variable selection
; spatial autoregressive model
; additive model
; instrument variable
1. Introduction
Spatial data, also known as geospatial data, commonly appear in fields such as environmental health, economics, and epidemiology. This type of data can be represented by numerical values in a geographic coordinate system. The spatial autoregressive (SAR) model, which includes a spatially lagged term of the response variable to account for spatial dependence among spatial units, has become an important research topic in recent econometrics and statistics literature. Significant developments in the estimation and inference of this model can be found in the works of Cliff and Ord [1], Anselin [2], Robert [3], among others.
The linear SAR model, which extends the ordinary linear regression model by incorporating a spatially lagged term of the response variable, has been extensively studied [4,5,6,7,8]. However, it imposes assumptions that might be unrealistic in practice, rendering it inefficient if not correctly specified. To enhance model flexibility and adaptability, the nonparametric SAR model allows for investigating the relationship between the response variable and predictors without assuming a specific shape for the relationship. This model has recently gained much attention from econometricians and statisticians. One of the most powerful and useful models in spatial statistics is the partial linear SAR model, where the spatially lagged response variable and some predictors enter the model linearly, while the remaining predictors are incorporated nonparametrically. Specifically, Su and Jin [9] proposed a profile quasi-maximum likelihood estimation method for the model. Koch and Krisztin [10] proposed an estimation method based on B-splines and genetic algorithms. Chen et al. [11] proposed a two-step Bayesian approach based on kernel estimation and Bayesian methods for inference. Krisztin [12] proposed a novel Bayesian semiparametric estimation method combining penalized splines with Bayesian methods. Li and Mei [13] proposed a method to test linear constraints on the parameters of the partially linear SAR model.
Beyond the partial linear SAR model, Su [14] studied the SAR model, where the spatially lagged response variable enters the model linearly and all predictors enter nonparametrically, proposing semiparametric GMM estimation under weak moment conditions. Wei et al. [15] studied SAR models with varying coefficients to capture heterogeneous effects of covariates and spatial interaction. Du et al. [16] considered a class of partially linear additive SAR models and proposed a generalized method of moments estimator. Cheng and Chen [17] studied partially linear single-index SAR models and proposed profile maximum likelihood estimators. In this paper, we will consider the additive SAR model, which is more flexible than the SAR model examined in [14], as it includes only one nonparametric component, easing the curse of dimensionality issue. In particular, we will address high-dimensional data settings where the dimensionality of predictors may exceed the sample size.
Data science is an ever-expanding field. High-dimensional models, where the feature dimension grows exponentially or non-polynomially fast with sample size, have become a focus in statistical literature. Including irrelevant features in the model can lead to undesirable computational issues and unstable estimation. To address these challenges, variable screening and selection techniques have been developed. Among these developments, penalized approaches such as lasso [18], SCAD [19], MCP [20], and their various extensions [21,22,23] have been thoroughly studied to identify important covariates and estimate the coefficients of interest simultaneously, thereby improving the prediction accuracy and interpretability of statistical models. For example, following the idea of group lasso [23] and adaptive lasso [22], Wei et al. [15] proposed a local linear shrinkage estimator for the SAR model with varying coefficients for model selection. Nevertheless, these regularization methods have one major disadvantage: they all involve tuning parameters that must be chosen using computationally intensive methods such as cross-validation.
In recent decades, boosting methods have become an effective alternative tool for high-dimensional data settings to perform variable selection and model estimation. They offer several advantages, such as relatively smaller computational cost, lower risk of overfitting, and simpler adjustments to incorporate additional constraints. Boosting was initially conceptualized as a machine learning algorithm that constructs better base learners to minimize the loss function with every iteration. The original version of the boosting algorithm proposed by Schapire [24] and Freund [25] did not fully exploit the potential of base learners. This changed when Freund and Schapire [26] proposed the AdaBoost algorithm, which could adapt to base learners more effectively. Following the development of this algorithm, many other boosting algorithms have been formulated, with major variations in their loss functions. For instance, AdaBoost with the exponential loss, L2Boosting [27] with the squared error loss, SparseL2Boosting [28] with the penalized loss, and HingeBoost [29] with the weighted hinge loss. Other versions of boosting algorithms proposed recently include pAUCBoost [30], Twin Boosting [31], Twin HingeBoost [29], ER-Boost [32], GSBoosting [33], among others. As demonstrated by Yue et al. [34,35,36,37], sparse boosting achieves better variable selection performance than L2Boosting as well as some penalized methods such as lasso. However, the application of (sparse) boosting approaches in high-dimensional SAR models has not yet been investigated.
However, there currently exists a lack of exploration regarding the application of (sparse) boosting methods in the study of high-dimensional spatial autoregressive (SAR) models, which provides an opportunity for further investigation in this research. This paper focuses on additive spatial autoregressive models with high-dimensional covariates and proposes a novel multi-step sparse boosting algorithm aimed at model-based prediction and variable selection, rather than relying on traditional regularization methods. A significant advantage of this new method is that it eliminates the need for time-consuming tuning parameter selection, thereby enhancing the convenience of modeling. Our approach is designed specifically for high-dimensional additive spatial autoregressive models, improving the flexibility and adaptability of the model in complex situations. Extending existing boosting techniques to such complex model structures presents a considerable technical challenge and requires deeper exploration both theoretically and practically. The detailed research presented in this paper facilitates the first application of this method in the field, thereby providing a foundation for future research. Through simulation studies and real data examples, we demonstrate the superior performance of the proposed method compared to various alternative algorithms. Our results not only fill the existing research gap in the literature but also offer empirical support for the multi-step sparse boosting method as an effective tool for high-dimensional data analysis, especially in scenarios involving complex relationships among variables.
The rest of the paper is organized as follows. In Section 2, the additive autoregressive model is formulated, and a multi-step sparse boosting algorithm is proposed. In Section 3, simulation studies are conducted to demonstrate the validity of this multi-step method. In Section 4, the performance of the multi-step sparse boosting method is evaluated by analyzing Boston housing price data. Concluding remarks are given in Section 5.
2. Methodology
2.1. Model and Estimation
Consider the following additive spatial autoregressive model:
where is the vector of the observations of the response variable with n being the number of spatial units, W is an spatial weight matrix of known constants with zero diagonal elements and is referred to as spatial lag of Y, is the spatial autoregressive parameter with , is the vector of the j-th regressor and is the observed matrix of regressors. For simplicity, the covariates are assumed to be distributed on compact intervals respectively. are unknown smooth functions on with the assumption that for identifiability purpose. is an vector of i.i.d disturbances with zero mean and finite variance .
The smoothing splines technique is typically used to estimate the unknown functions, demonstrating steady performance in practice. In this paper, we will use B-spline basis functions to approximate the unknown coefficient functions . Let be an equally spaced B-spline basis, where L is the dimension of the basis. Similar to Huang et al. [38], let , , . Then under appropriate smoothness assumptions, for . Then the spline estimator of is , where , . It is obvious that for .
Then the model (1) can be rewritten as follows
where . Let denote the projection matrix onto the space spanned by . Similar to [39], partialing out the B-spline approximation, we obtain
In the above equation, a problem of endogeneity emerges because the spatially lagged value of Y is correlated with the stochastic disturbance. Suppose H is a relevant vector instrument to eliminate the endogeneity of . Let . Regressing D on instrument H via OLS produces the fitted value for the endogenous variable D:
Substituting D with its predicted value in model (3), it becomes
where . Then by OLS,
Substituting D with and with in model (2), it becomes
Then the least squares loss function is close to
However, when dimensionality of is larger than sample size n, least square estimation fails. In this case, we will adopt sparse boosting approach to estimate . Denote as the estimator of obtained through sparse boosting, using the squared loss function (8) as the loss function. The detailed sparse boosting algorithm will be given in the next subsection.
Consequently, can be estimated by for . The variance can be estimated by
Similar to [39], we use an analogous rationality for the construction of instrument variables. In the first step, we simply regress Y on pseudo regressors variables and . Then the least squares loss function is
Denote as the estimators of obtained through sparse boosting, using the squared loss function (10) as the loss function. Then, we can use the following instrumental variable:
In the second step, instrumental variable is used to obtain the estimators and , which are then used to construct the instrumental variable
Finally, use the instrumental variables H to obtain the final estimators and . The function can be estimated by for and the response Y can be estimated by .
2.2. Sparse Boosting Techniques
Sparse boosting can be viewed as iteratively pursuing gradient descending in function space using a penalized empirical risk function that integrates squared loss and the complexity of the boosting measure. Similar to Yue et al. ([34,35,36,37]), we will adopt the g-prior minimum description length (gMDL) [40], a combination of squared loss and the trace of boosting operator, as the penalized empirical risk function to estimate the update criterion in each iteration and the stopping criterion. We use it because it has a data driven penalty to avoid the selection of the tuning parameter. To facilitate presentation, suppose the vector is regressed on the -dimensional matrix . Then the least squares loss function involved in sparse boosting is , where . The gMDL takes the form:
where is the residual sum of squares and is the boosting operator. The model achieve shortest description of data will be chosen.
We present the sparse boosting approach more specifically. The initial value of is set to the zero vector, i.e. . In each of the kth iteration (, and K is the maximum number of iterations considered in the first step), we use the residual from the current iteration to fit each of the j-th component . The fit, denoted by , is calculated by minimizing the squared loss function with respect to . Therefore, the least squares estimate is , the corresponding hat matrix is and the residual sum of squares is . The chosen element is attained by:
where and for is the first step boosting operator for choosing jth element in the kth iteration. Hence, there is an unique element to be selected at each iteration, and only the corresponding coefficient vector changes, i.e., , where is the pre-specified step-size parameter. All the other for keep unchanged. We repeat this procedure for K times and the number of iterations K can be estimated by
where .
From the sparse boosting, we get the estimator of by .
Overall, as illustrated in Figure 1, the flowchart visually summarizes the methodologies and steps articulated in this paper, thereby enhancing the understanding of our proposed multi-step sparse boosting algorithm for high-dimensional additive spatial autoregressive models.
In Step I, the algorithm starts with parameter initialization, followed by iterations to identify optimal variables using the g-prior minimum description length (gMDL) criterion. Coefficients are updated until a stopping criterion is met, resulting in covariance matrix estimates.
Step II applies the sparse boosting algorithm again to refine variable selection and update coefficients. This approach enhances model accuracy and selection efficiency, making it well-suited for high-dimensional data analysis.
3. Simulation
In this section, we investigate the finite sample performance of the proposed methodology with Monte Carlo simulation studies. The data is generated from the following model:
where are all i.i.d on . , and . The error term follows a normal distribution with mean 0 and variance . Similar to [41], the weight matrix is set to be , where , is the m-dimensional unit vector, and ⊗ is Kronecker product. Thus, the number of spatial units is . For comparison, we consider and , corresponding to and 400 respectively. We evaluate three different values of , representing weak to strong spatial dependence of the responses. Additionally, we consider and 1. The degree of freedom for B-splines basis is set to be , where is the integer part of x.
In face of ultra-high dimensional data, pre-screening can be adopted to reduce the dimensionality to a moderate size. In particular, we adopt marginal screening by -norm [42] to screen out irrelevant covariates. More specifically, we regress Y on each covariate to construct the marginal model . The empirical -norm of an estimated function is defined as:
A greater value of this measure suggest a stronger association between the covariate and the response. Following the recommendation by [42,43,44,45], the covariates with the largest -norm are selected. Thus, for sample size 100 and 400, the first 21 and 66 variables in the ranked list are selected to conduct downstream analysis, respectively. Thereafter, we proceed to use our proposed multi-step sparse boosting approach to build up the final parsimonious model. For comparison, besides the proposed method using sparse boosting in each step, we also examine other approaches such as -boosting, lasso regression and elastic net regression in each step.
In our implementation, we set the maximum number of boosting iterations to and the elastic net mixing parameter to . Penalized methods were executed using the R package glmnet, with tuning parameters selected via 5-fold cross-validation. To assess the performance of our approach, we analyze results from 500 replications, reporting the following metrics:
- S: coverage probability that the top covariates after screening includes all important covariates;
- TP: the median of true positives;
- FP: the median of false positives;
- Size: the median of model sizes;
- ISPE: the average of in-sample prediction errors defined as ;
- RMISE: the average of root mean integrated squared errors defined as
- ;
- Bias(): the mean bias of ;
- Bias(): the mean bias of .
The simulation results presented in Table 1 and Table 2, based on 500 replications, provide comprehensive insights into the performance of various methods for variable screening and selection under two conditions ( and ).
At , M1 consistently achieves high coverage probabilities, reaching 0.99 when , while maintaining a true positive count of 4 and significantly reducing the false positive rates compared to other methods. For example, M2 has a maximum of 12 false positives when and , while M3 and M4 peak at 15 and 16 false positives, respectively. In terms of in-sample prediction error (ISPE), M1 demonstrates robust performance with values ranging from 1.123 to 3.127. M2, M3, and M4 show higher ISPE values, indicating a tendency toward overfitting, with M2 reaching 3.405 at and , M3 reaching 3.443, and M4 reaching 3.64. M1 also excels in root mean integrated squared error (RMISE), with values between 0.534 and 0.754 at and , while M2 ranges from 0.579 to 0.782. At , M3 and M4 have even higher values, further demonstrating M1’s effectiveness in making accurate predictions.
At , similar trends are observed with the performance of M1 being even more pronounced. For instance, M1 maintains a coverage probability of 1.00 when . The ISPE for M1 ranges from 2.280 to 5.771, while M4’s ISPE peaks at 6.681, highlighting M1’s advantage in prediction accuracy. Additionally, the false positive rates for M2, M3, and M4 increase, reaching more than 40 at , further affirming M1’s superior performance. Despite maintaining a median true positive count of 4, M1 shows lower bias in parameter estimation, with Bias() ranging from -0.107 to 0.002 compared to higher biases in the other methods.
In summary, the multi-step sparse boosting method (M1) outperforms alternative approaches in variable selection and parameter estimation, excelling in maintaining lower false positive rates and superior estimation accuracy. This establishes the multi-step sparse boosting method as a highly effective method for high-dimensional data analysis, particularly in scenarios involving complex relationships among variables.
4. Real Data Analysis
In this section, we apply the proposed method to the Boston housing price data, originally collected by Harrison and Rubinfield [46] and integrated by Gilley and Pace [47]. The dataset is available for download from http://ugrad.stat.ubc.ca/R/library/mlbench/html/BostonHousing.html. It comprises median house prices observed in 506 census tracts in the Boston area in 1970, alongside a set of variables presumed to influence house prices. Table 3 provides a detailed description of these variables:
The Boston housing price dataset is widely used in spatial econometrics and has been extensively studied in the literature. For the same data set, Xie et al. [48] adopted spatial autoregressive model, Li and Mei [13] considered partially linear spatial autoregressive model and Du et al. [16] used partially linear additive spatial autoregressive models. In the following, we will consider the additive spatial autoregressive model
where represents the median house value for census tract i, is the spatial autoregressive parameter, denotes the spatial weight matrix with entries set as , where is the Euclidean distance based on longitude and latitude coordinates of any two houses, is the threshold distance (set to following Su and Yang [4]), resulting in a weight matrix with 19.1% nonzero elements. For comparative analysis, we consider the following methods explored in our simulation study: multi-step sparse boosting, multi-step -boosting, multi-step lasso and multi-step elastic net. These methods will be used to estimate the functions and , aiming to identify the significant determinants of housing prices while accounting for spatial dependencies among census tracts.
The results of variable selection, estimation and prediction are summarized in Table 4. In addition to the number of selected variables, we also report the in-sample prediction error (ISPE) and out-of-sample prediction error (OSPE) measured by 5-fold cross-validation.
From Table 4, we observe that, compared to traditional lasso and elastic net methods, the Boosting and Sparse Boosting methods for the varying-coefficient model exhibit smaller OSPE, while also producing relatively sparser models. The smaller ISPE may be due to overfitting in the traditional models which choosing all of the variables. These conventional models exhibit errors that increase by a factor of 6 to 7 during out-of-sample predictions, whereas our proposed model demonstrates greater stability with smaller fluctuations when comparing ISPE to OSPE. Our Sparse Boosting method for the varying-coefficient AFT model performs remarkably well in terms of sparsity, estimation, and prediction.
Additionally, we present a Venn diagram in Figure 2 showing the overlapping genes identified by all different methods. We observe that SparseBoosting and Boosting select 2 variables (RM and LSTAT) which mostly affect the Boston housing prices in common, while lasso and elastic net methods identify all the 12 variables in common. However, SparseBoosting and Boosting produce distinct lists of selected variables compared to the other methods, with only 2 variables selected by all methods.
We plot the estimated curves of varying coefficients for RM and LSTAT, which are the two selected variables by sparse boosting method, with their 95% confidence bands constructed by 500 bootstrap resamples in Figure 3. All of the functions are quite different from a straight line and this suggest that the varying-coefficient model is more appropriate to describe the covariate effects on boston housing prices in our data. Using more sophisticated semiparametric model specification may provide more accurate model for the high-dimensional analysis. Furthermore, we observe different functional forms for the two impact variables.
5. Concluding Remarks
This paper introduces a useful multi-step sparse boosting algorithm specifically designed for additive spatial autoregressive models with high-dimensional covariates, addressing critical aspects of variable selection and parameter estimation. Our methodology effectively facilitates model-based prediction without the burden of time-consuming tuning parameter selection, thereby streamlining the modeling process.
Using B-spline basis functions for approximating varying coefficients is a critical component of our approach, which allows for smooth and accurate representations even when the underlying assumptions regarding smoothness may be violated, enhancing the robustness of the model. Moreover, a noteworthy aspect of our finding is the two-step sparse boosting approach employing the generalized Minimum Description Length (gMDL) model selection criterion. The gMDL criterion utilizes a data-driven penalty for squared loss, promoting model parsimony while effectively filtering out irrelevant covariates.
The simulation results illustrate the efficacy of our proposed approach. Our multi-step sparse boosting method consistently exhibits fewer false positives than alternative methods, while true positive rates accurately reflect the actual number of relevant variables. In contrast, traditional methods utilizing boosting, lasso, or elastic net tend to suffer from overfitting, as evidenced by lower in-sample prediction errors (ISPE) and larger model sizes. Meanwhile, the real-world application of our methodology to the Boston housing price data further confirms its effectiveness and stability in identifying significant predictors of housing prices. By accurately selecting key variables, our approach enhances the model’s predictive performance and interpretability.
However, several limitations of our study must be acknowledged. Firstly, although B-spline basis functions offer significant advantages, they may not fully capture the intricate complexities of all data relationships, potentially limiting the model’s applicability to more diverse or nuanced datasets. Therefore, while our research encompasses thorough simulations and empirical testing on the housing price datasets, it is imperative to extend evaluations across a wider array of datasets.
This method can be extended to various fields, not limited to environmental studies, healthcare, and social sciences. Additionally, it is applicable to both nonparametric and semiparametric models, although our focus here has been on nonparametric approaches. This broader analysis is crucial to comprehensively validate the model’s versatility and effectiveness across various contexts within the disciplines of econometrics and statistics.
Acknowledgments
We thank the editor and reviewers for their careful review and insightful comments. This study has been been partly supported by awards XXXX in Singapore.
References
- C. Andrew, J. K. Ord, Spatial autocorrelation, Pion, London (1973).
- L. Anselin, Spatial econometrics: methods and models (vol. 4), Studies in Operational Regional Science. Dordrecht: Springer Netherlands (1988). [CrossRef]
- R. Haining, Spatial data analysis in the social and environmental sciences, Cambridge University Press, 1993. [CrossRef]
- L. Su, Z. Yang, Instrumental variable quantile estimation of spatial autoregressive models (2007). http://econpapers.repec.org/paper/eabdevelo/1563.htm.
- H. H. Kelejian, I. R. Prucha, Specification and estimation of spatial autoregressive models with autoregressive and heteroskedastic disturbances, Journal of econometrics 157 (1) (2010) 53–67. [CrossRef]
- X. Lin, L.-f. Lee, Gmm estimation of spatial autoregressive models with unknown heteroskedasticity, Journal of Econometrics 157 (1) (2010) 34–52. [CrossRef]
- X. Liu, L.-f. Lee, C. R. Bollinger, An efficient gmm estimator of spatial autoregressive models, Journal of Econometrics 159 (2) (2010) 303–319. [CrossRef]
- H. Li, C. A. Calder, N. Cressie, One-step estimation of spatial dependence parameters: Properties and extensions of the aple statistic, Journal of Multivariate Analysis 105 (1) (2012) 68–84. [CrossRef]
- L. Su, S. Jin, Profile quasi-maximum likelihood estimation of partially linear spatial autoregressive models, Journal of Econometrics 157 (1) (2010) 18–33. [CrossRef]
- M. Koch, T. Krisztin, Applications for asynchronous multi-agent teams in nonlinear applied spatial econometrics, Journal of Internet Technology 12 (6) (2011) 1007–1014. [CrossRef]
- W. R. Chen, Jiaqing, H. Yangxin, Semiparametric spatial autoregressive model : A two-step bayesian approach, Annals of Public Health Research 2 (1) (2015) 1012.
- T. Krisztin, The determinants of regional freight transport: a spatial, semiparametric approach, Geographical Analysis 49 (3) (2017) 268–308. [CrossRef]
- T. Li, C. Mei, Statistical inference on the parametric component in partially linear spatial autoregressive models, Communications in Statistics-Simulation and Computation 45 (6) (2016) 1991–2006. [CrossRef]
- L. Su, Semiparametric gmm estimation of spatial autoregressive models, Journal of Econometrics 167 (2) (2012) 543–560. [CrossRef]
- H. Wei, Y. Sun, M. Hu, Model selection in spatial autoregressive models with varying coefficients, Frontiers of Economics in China 13 (4) (2018) 559–576. [CrossRef]
- J. Du, X. Sun, R. Cao, Z. Zhang, Statistical inference for partially linear additive spatial autoregressive models, Spatial statistics 25 (2018) 52–67. [CrossRef]
- S. Cheng, J. Chen, X. Liu, Gmm estimation of partially linear single-index spatial autoregressive model, Spatial Statistics (2019). [CrossRef]
- R. Tibshirani, Regression shrinkage and selection via the lasso, Journal of the Royal Statistical Society: Series B (Methodological) 58 (1) (1996) 267–288. [CrossRef]
- J. Fan, R. Li, Variable selection via nonconcave penalized likelihood and its oracle properties, Journal of the American statistical Association 96 (456) (2001) 1348–1360. [CrossRef]
- C.-H. Zhang, et al., Nearly unbiased variable selection under minimax concave penalty, The Annals of statistics 38 (2) (2010) 894–942. [CrossRef]
- H. Zou, T. Hastie, Regularization and variable selection via the elastic net, Journal of the royal statistical society: series B (statistical methodology) 67 (2) (2005) 301–320. [CrossRef]
- H. Zou, The adaptive lasso and its oracle properties, Journal of the American statistical association 101 (476) (2006) 1418–1429. [CrossRef]
- M. Yuan, Y. Lin, Model selection and estimation in regression with grouped variables, Journal of the Royal Statistical Society: Series B (Statistical Methodology) 68 (1) (2006) 49–67. [CrossRef]
- R. E. Schapire, The strength of weak learnability, Machine learning 5 (2) (1990) 197–227. [CrossRef]
- Y. Freund, Boosting a weak learning algorithm by majority, Information and computation 121 (2) (1995) 256–285. [CrossRef]
- Y. Freund, R. E. Schapire, A decision-theoretic generalization of on-line learning and an application to boosting, Journal of computer and system sciences 55 (1) (1997) 119–139. [CrossRef]
- P. Bühlmann, B. Yu, Boosting with the l 2 loss: regression and classification, Journal of the American Statistical Association 98 (462) (2003) 324–339. [CrossRef]
- P. Bühlmann, B. Yu, Sparse boosting, Journal of Machine Learning Research 7 (Jun) (2006) 1001–1024. http://jmlr.org/papers/v7/buehlmann06a.html.
- Z. Wang, Hingeboost: Roc-based boost for classification and variable selection, The International Journal of Biostatistics 7 (1) (2011) 1–30. [CrossRef]
- O. Komori, S. Eguchi, A boosting method for maximizing the partial area under the roc curve, BMC bioinformatics 11 (1) (2010) 314. [CrossRef]
- P. Bühlmann, T. Hothorn, Twin boosting: improved feature selection and prediction, Statistics and Computing 20 (2) (2010) 119–138. [CrossRef]
- Y. Yang, H. Zou, Nonparametric multiple expectile regression via er-boost, Journal of Statistical Computation and Simulation 85 (7) (2015) 1442–1458. [CrossRef]
- J. Zhao, General sparse boosting: Improving feature selection of l2 boosting by correlation-based penalty family, Communications in Statistics-Simulation and Computation 44 (6) (2015) 1612–1640. [CrossRef]
- M. Yue, J. Li, S. Ma, Sparse boosting for high-dimensional survival data with varying coefficients, Statistics in medicine 37 (5) (2018) 789–800. [CrossRef]
- M. Yue, J. Li, M.-Y. Cheng, Two-step sparse boosting for high-dimensional longitudinal data with varying coefficients, Computational Statistics & Data Analysis 131 (2019) 222–234. [CrossRef]
- M. Yue, L. Huang, A new approach of subgroup identification for high-dimensional longitudinal data, Journal of Statistical Computation and Simulation 90 (11) (2020) 2098–2116. [CrossRef]
- M. Yue, J. Li, B. Sun, Conditional sparse boosting for high-dimensional instrumental variable estimation, Journal of Statistical Computation and Simulation 92 (15) (2022) 3087–3108. [CrossRef]
- J. Huang, J. L. Horowitz, F. Wei, Variable selection in nonparametric additive models, Annals of statistics 38 (4) (2010) 2282. [CrossRef]
- Y. Zhang, D. Shen, Estimation of semi-parametric varying-coefficient spatial panel data models with random-effects, Journal of Statistical Planning and Inference 159 (2015) 64–80. [CrossRef]
- M. H. Hansen, B. Yu, Model selection and the principle of minimum description length, Journal of the American Statistical Association 96 (454) (2001) 746–774. [CrossRef]
- L.-F. Lee, Asymptotic distributions of quasi-maximum likelihood estimators for spatial autoregressive models, Econometrica 72 (6) (2004) 1899–1925. [CrossRef]
- M. Yue, J. Li, Improvement screening for ultra-high dimensional data with censored survival outcomes and varying coefficients, The international journal of biostatistics 13 (1) (2017). [CrossRef]
- J. Fan, J. Lv, Sure independence screening for ultrahigh dimensional feature space, Journal of the Royal Statistical Society: Series B (Statistical Methodology) 70 (5) (2008) 849–911. [CrossRef]
- M.-Y. Cheng, T. Honda, J. Li, H. Peng, et al., Nonparametric independence screening and structure identification for ultra-high dimensional longitudinal data, The Annals of Statistics 42 (5) (2014) 1819–1849. [CrossRef]
- X. Xia, J. Li, B. Fu, Conditional quantile correlation learning for ultrahigh dimensional varying coefficient models and its application in survival analysis, Statistica Sinica (2018). [CrossRef]
- D. Harrison Jr, D. L. Rubinfeld, Hedonic housing prices and the demand for clean air, Journal of environmental economics and management 5 (1) (1978) 81–102. [CrossRef]
- O. W. Gilley, R. K. Pace, et al., On the harrison and rubinfeld data, Journal of Environmental Economics and Management 31 (3) (1996) 403–405. [CrossRef]
- T. Xie, R. Cao, J. Du, Variable selection for spatial autoregressive models with a diverging number of parameters, Statistical Papers (2018) 1–21. [CrossRef]
Figure 1.
Flowchart of the Sparse Boosting Algorithm: The methodological framework and computational processes of the sparse boosting algorithm, facilitating comprehension of the key steps involved.
Figure 1.
Flowchart of the Sparse Boosting Algorithm: The methodological framework and computational processes of the sparse boosting algorithm, facilitating comprehension of the key steps involved.
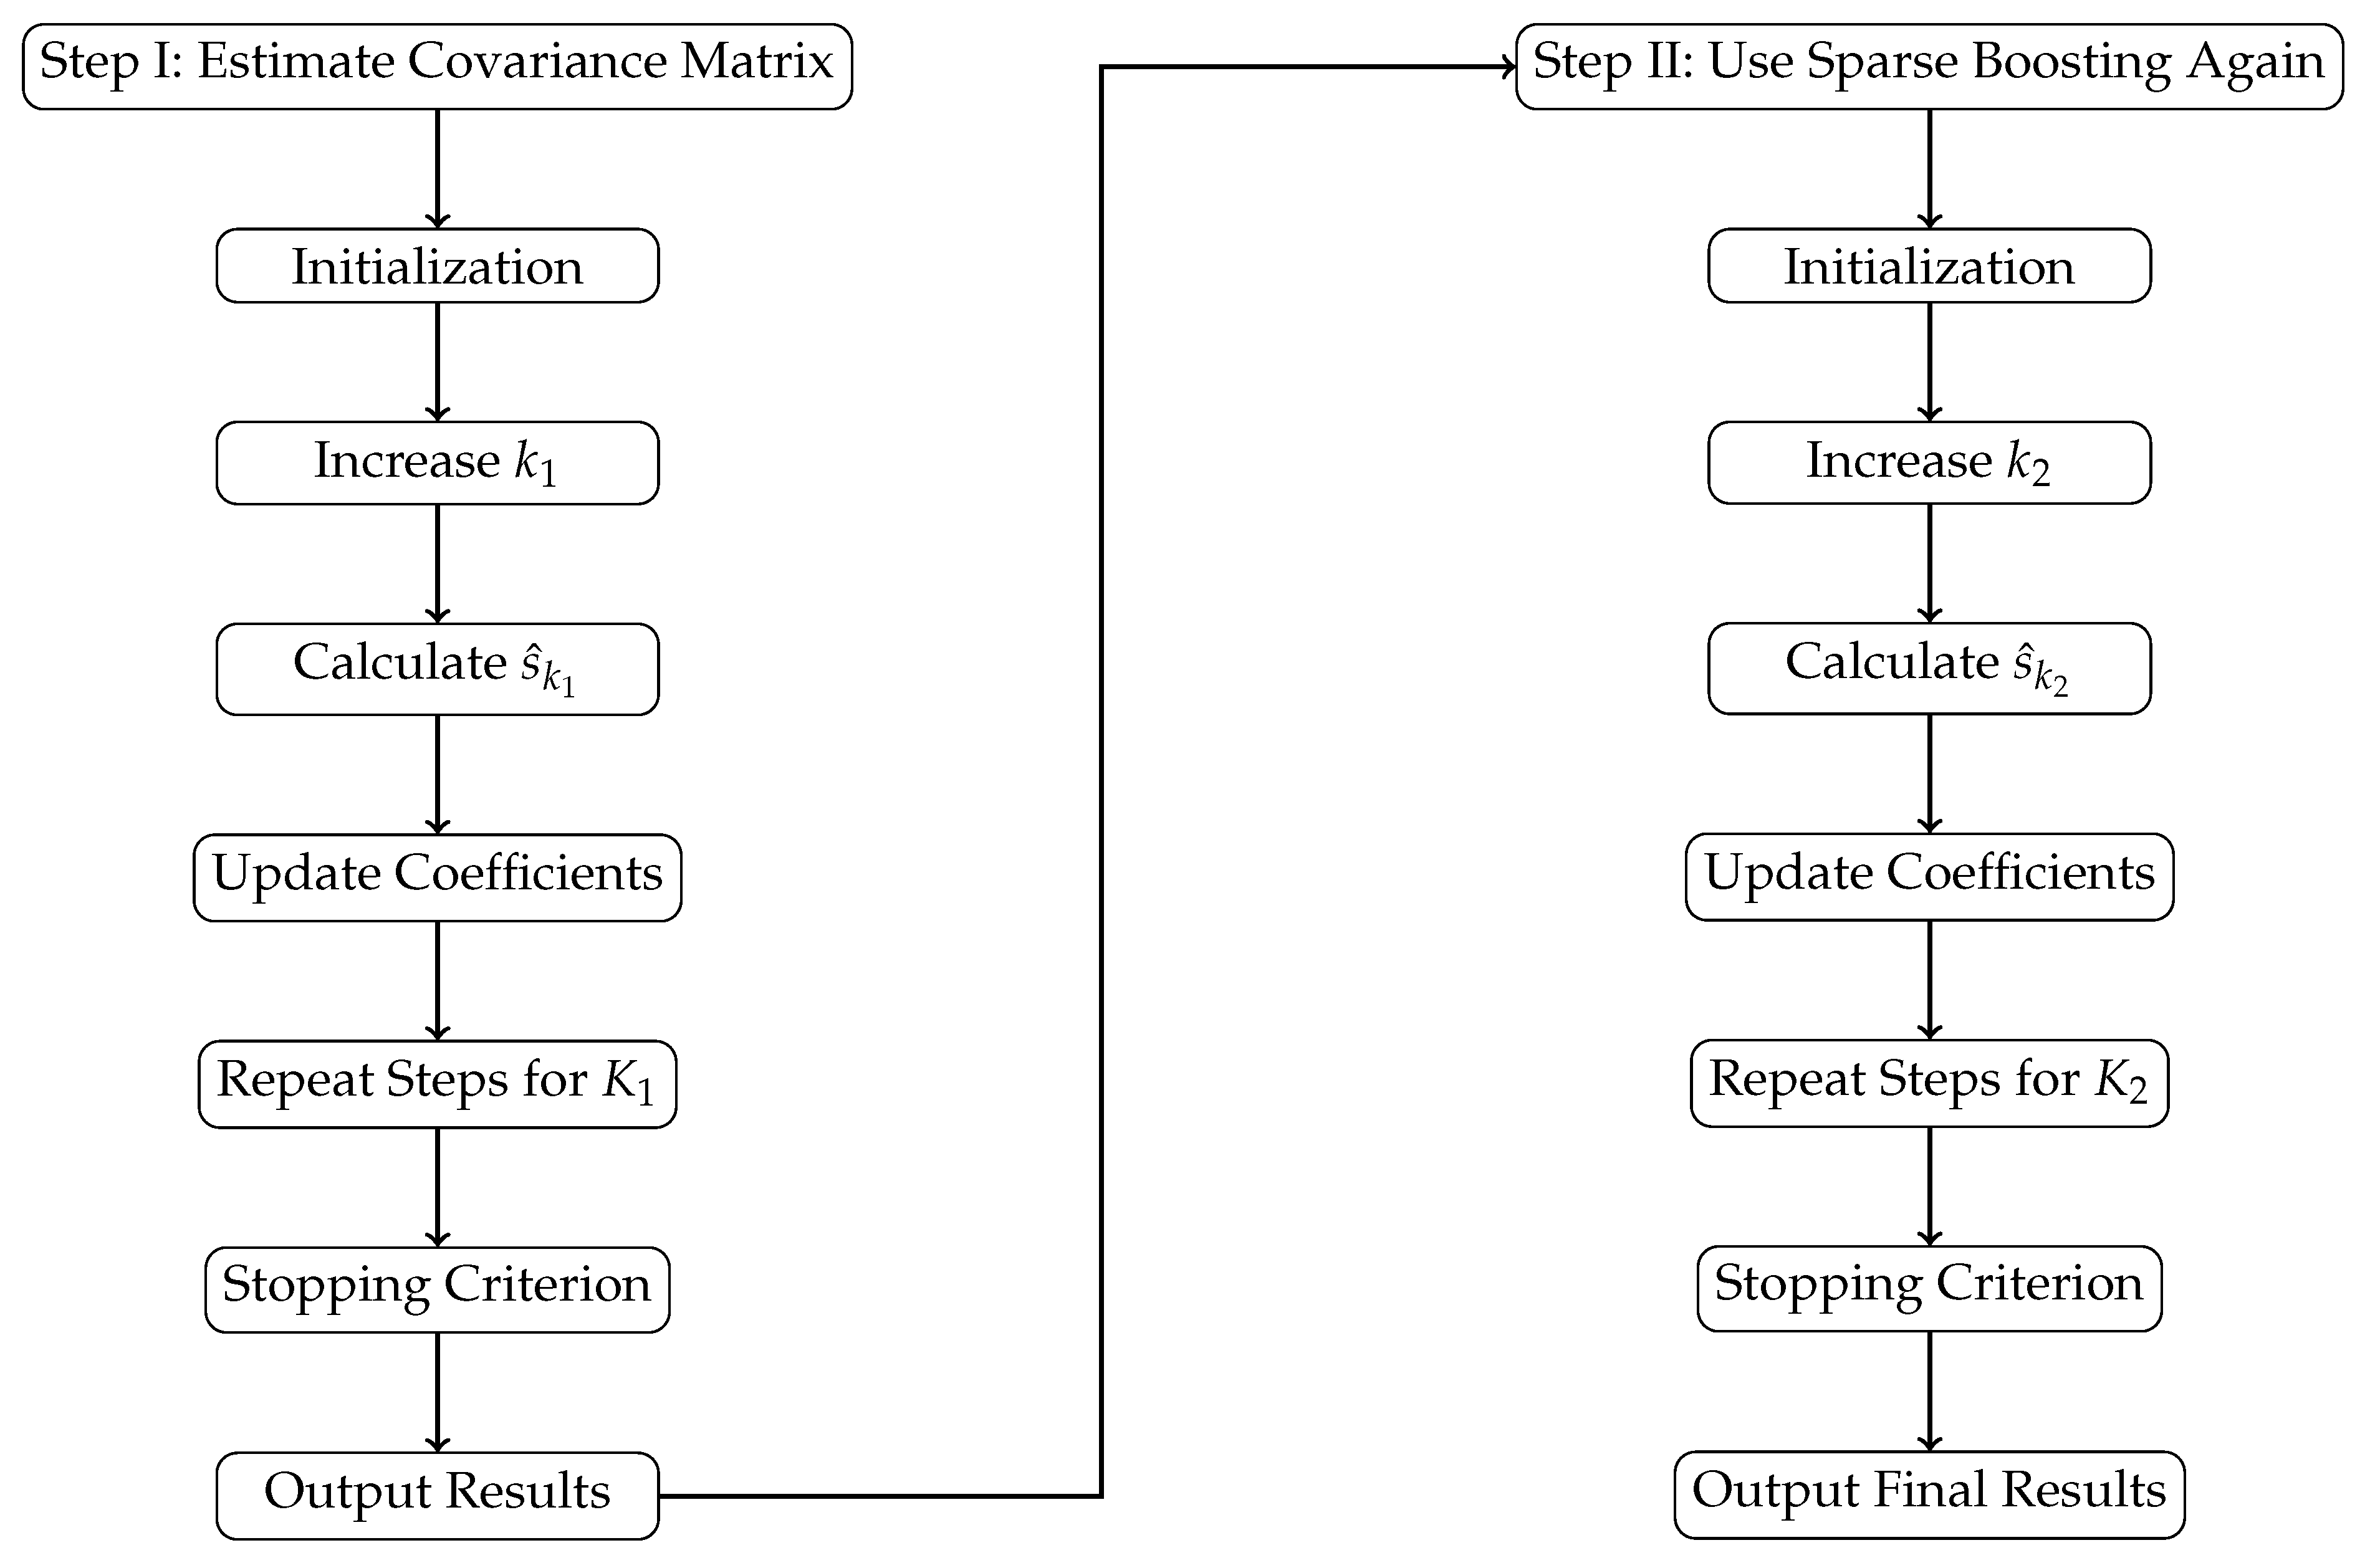
Figure 2.
Venn diagram showing overlapping genes selected among all methods. Blue: sparse boosting; Green: boosting; Red:lasso regression; Yellow: elastic net regression
Figure 2.
Venn diagram showing overlapping genes selected among all methods. Blue: sparse boosting; Green: boosting; Red:lasso regression; Yellow: elastic net regression
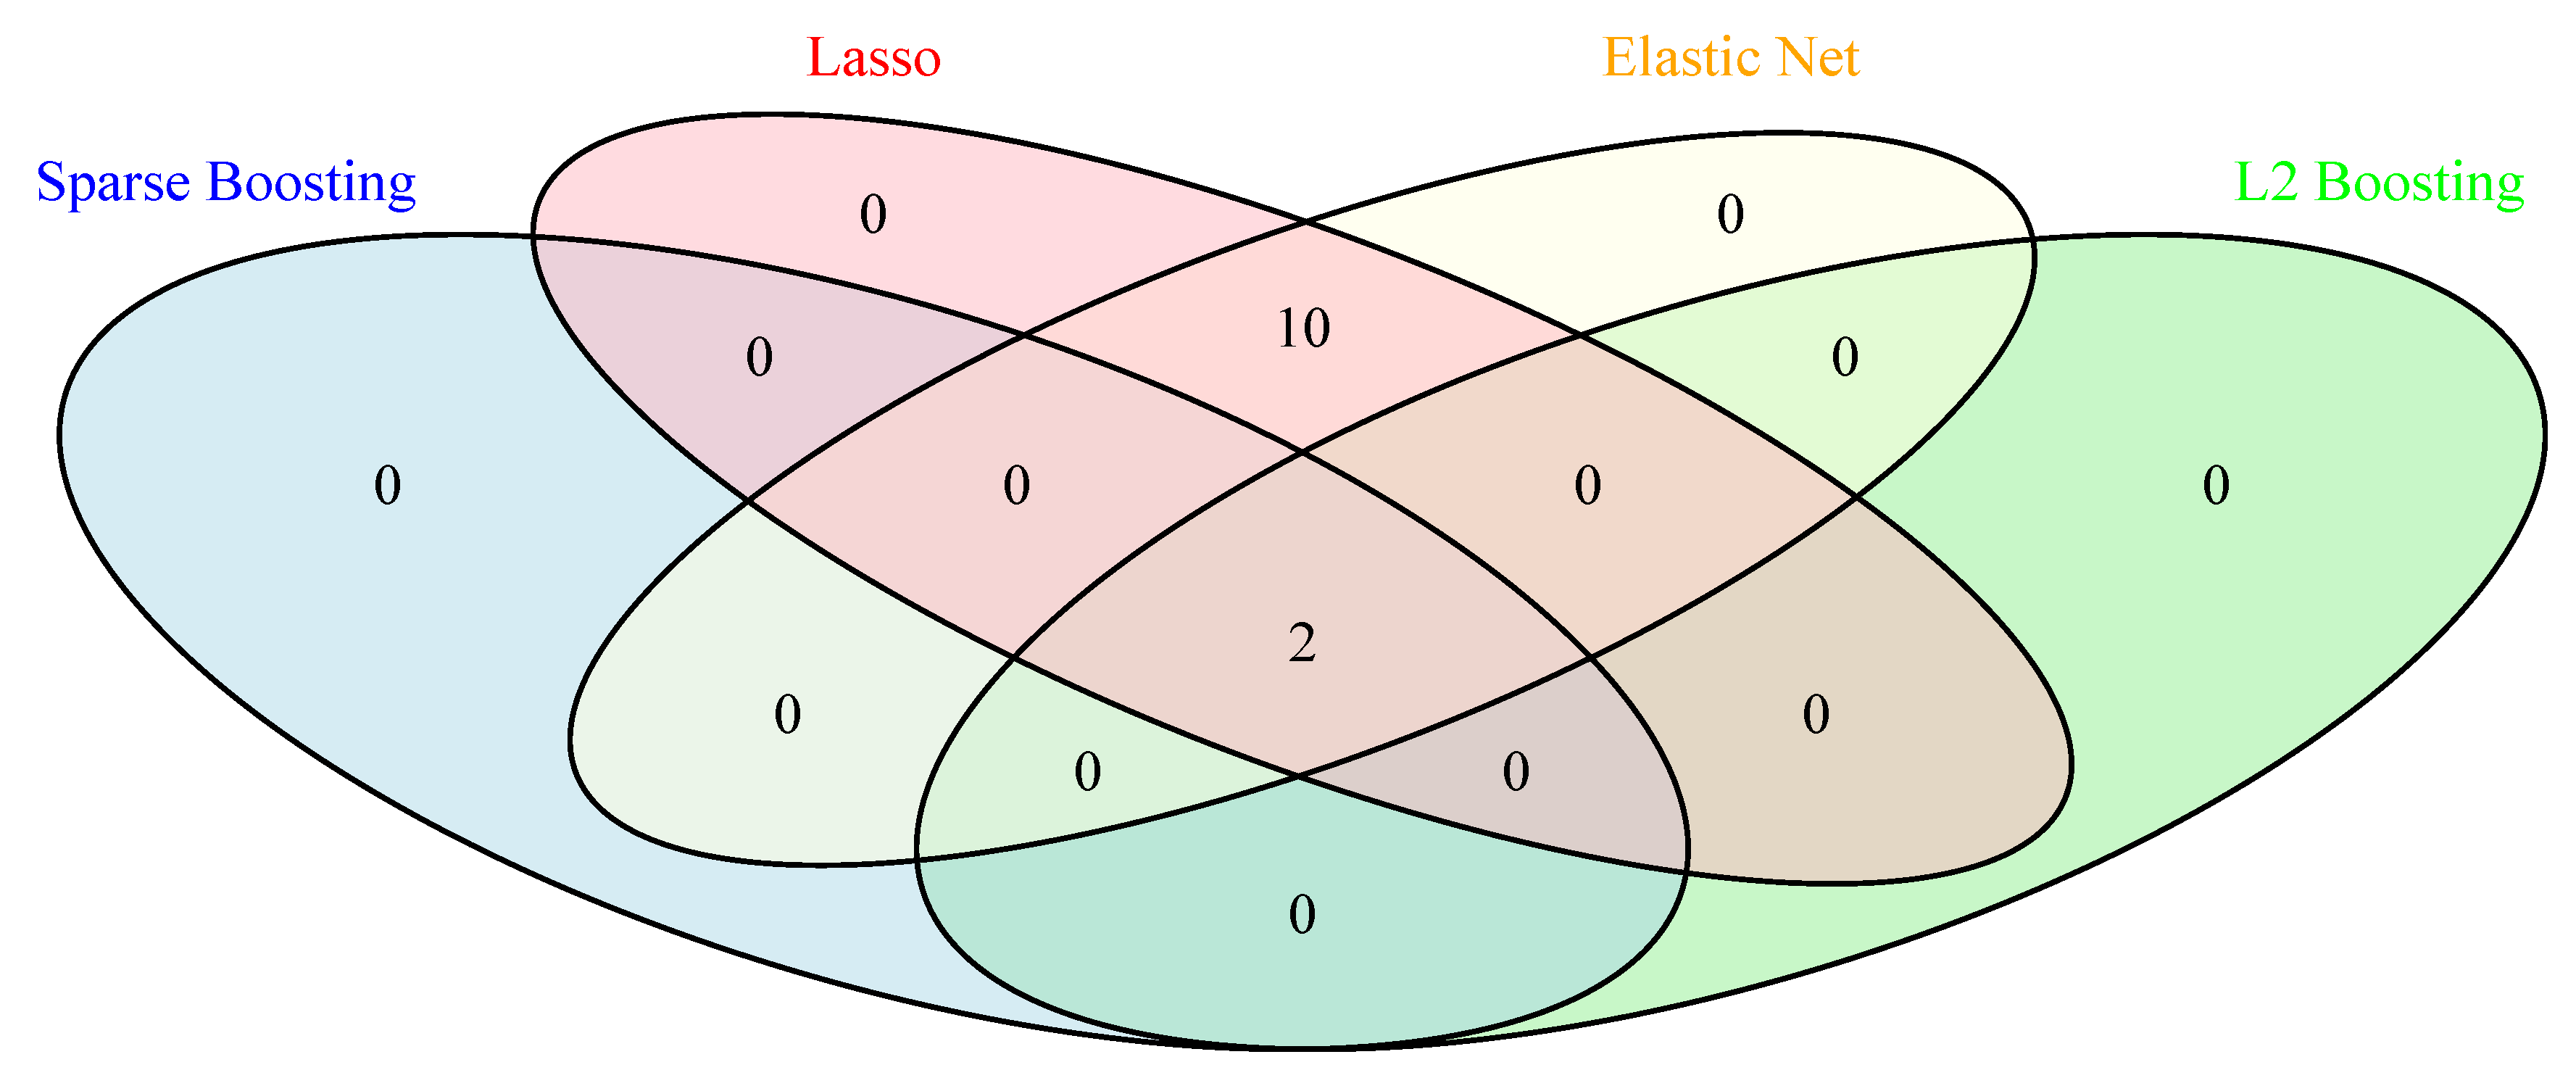
Figure 3.
Estimated nonparametric function with their 95% confidence bands based on 500 bootstraps for the selected variables in the final spatial additive model by multi-step sparse boosting.
Figure 3.
Estimated nonparametric function with their 95% confidence bands based on 500 bootstraps for the selected variables in the final spatial additive model by multi-step sparse boosting.
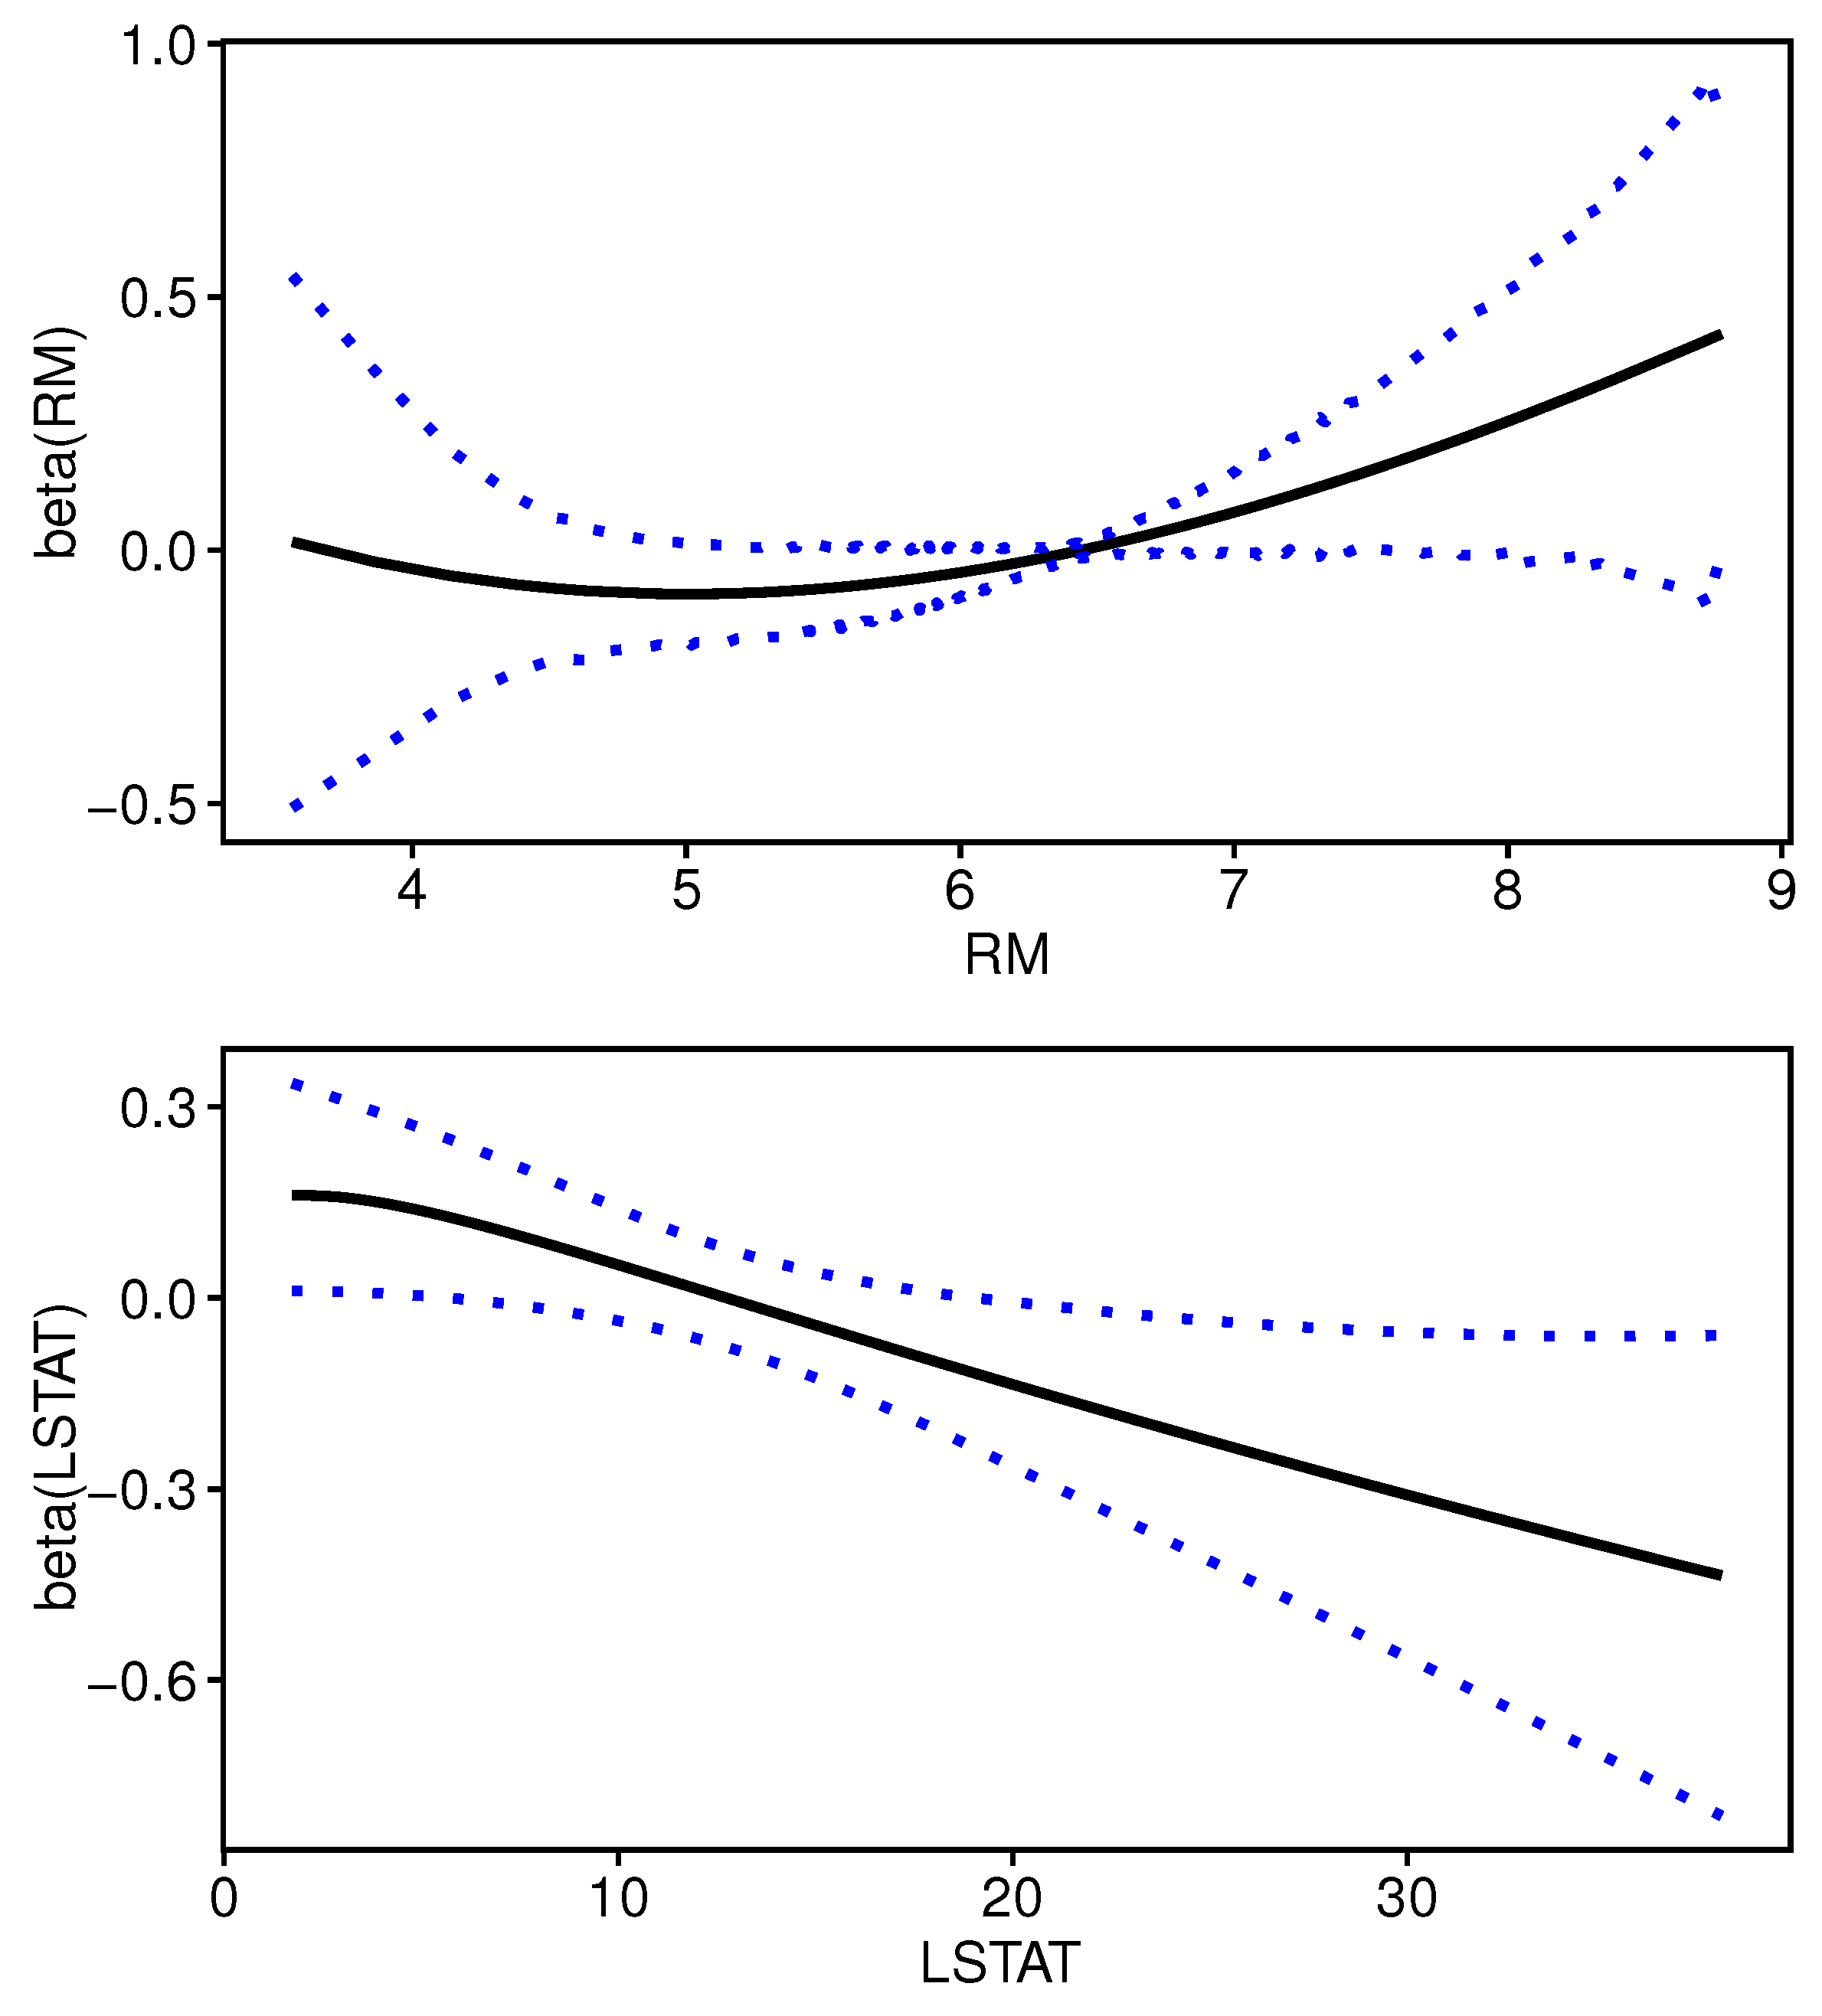

Table 1.
Results of variable screening, variable selection, and estimation for simulation when . The values in the parentheses are the robust standard deviations. M1: our proposed multi-step sparse boosting method; M2: except sparse boosting, -boosting are used in each step; M3: except sparse boosting, lasso regression are used in each step; M4: except sparse boosting, elastic net regression are used in each step. S: coverage probability that the top covariates after screening includes all important covariates; TP: the median of true positive; FP: the median of false positive; Size: the median of model sizes; ISPE: the average of mean square error; RMISE: the average of root mean integrated squared error; Bias(): the mean bias of ; Bias(): the mean bias of . The values in the parentheses are the robust standard deviations; Simulation based on 500 replicates.
Table 1.
Results of variable screening, variable selection, and estimation for simulation when . The values in the parentheses are the robust standard deviations. M1: our proposed multi-step sparse boosting method; M2: except sparse boosting, -boosting are used in each step; M3: except sparse boosting, lasso regression are used in each step; M4: except sparse boosting, elastic net regression are used in each step. S: coverage probability that the top covariates after screening includes all important covariates; TP: the median of true positive; FP: the median of false positive; Size: the median of model sizes; ISPE: the average of mean square error; RMISE: the average of root mean integrated squared error; Bias(): the mean bias of ; Bias(): the mean bias of . The values in the parentheses are the robust standard deviations; Simulation based on 500 replicates.
| n | Method | S | TP | FP | Size | ISPE | RMISE | Bias() | Bias() | |
|---|---|---|---|---|---|---|---|---|---|---|
| 100 | 0.2 | M1 | 0.88 ( 0.32 ) | 4 ( 0.45 ) | 4 ( 2.31 ) | 8 ( 2.31 ) | 1.123 ( 1.640 ) | 0.754 ( 0.538 ) | -0.025 ( 0.240 ) | 0.393 ( 0.538 ) |
| M2 | 0.88 ( 0.32 ) | 4 ( 0.20 ) | 12 ( 2.19 ) | 16 ( 2.18 ) | 1.212 ( 1.578 ) | 0.782 ( 0.496 ) | -0.032 ( 0.216 ) | 0.461 ( 0.507 ) | ||
| M3 | 0.88 ( 0.32 ) | 4 ( 0.20 ) | 15 ( 2.42 ) | 19 ( 2.49 ) | 1.235 ( 1.500 ) | 0.802 ( 0.499 ) | -0.031 ( 0.228 ) | 0.486 ( 0.496 ) | ||
| M4 | 0.88 ( 0.32 ) | 4 ( 0.16 ) | 16 ( 1.66 ) | 20 ( 1.70 ) | 1.336 ( 1.527 ) | 0.843 ( 0.495 ) | -0.029 ( 0.216 ) | 0.535 ( 0.486 ) | ||
| 0.5 | M1 | 0.92 ( 0.28 ) | 4 ( 0.28 ) | 4 ( 2.50 ) | 8 ( 2.43 ) | 1.320 ( 1.657 ) | 0.694 ( 0.444 ) | -0.002 ( 0.112 ) | 0.331 ( 0.447 ) | |
| M2 | 0.92 ( 0.28 ) | 4 ( 0.04 ) | 12 ( 2.43 ) | 16 ( 2.43 ) | 1.495 ( 1.764 ) | 0.744 ( 0.442 ) | 0.004 ( 0.118 ) | 0.420 ( 0.453 ) | ||
| M3 | 0.92 ( 0.28 ) | 4 ( 0.06 ) | 15 ( 2.36 ) | 19 ( 2.36 ) | 1.567 ( 1.796 ) | 0.773 ( 0.449 ) | 0.001 ( 0.109 ) | 0.451 ( 0.450 ) | ||
| M4 | 0.92 ( 0.28 ) | 4 ( 0.05 ) | 16 ( 1.82 ) | 20 ( 1.82 ) | 1.609 ( 1.688 ) | 0.797 ( 0.428 ) | 0.001 ( 0.107 ) | 0.486 ( 0.426 ) | ||
| 0.8 | M1 | 0.99 ( 0.12 ) | 4 ( 0.08 ) | 4 ( 1.94 ) | 8 ( 1.93 ) | 3.127 ( 2.182 ) | 0.578 ( 0.197 ) | 0.005 ( 0.049 ) | 0.204 ( 0.191 ) | |
| M2 | 0.99 ( 0.12 ) | 4 ( 0 ) | 12 ( 2.29 ) | 16 ( 2.29 ) | 3.405 ( 2.099 ) | 0.623 ( 0.175 ) | 0.006 ( 0.039 ) | 0.284 ( 0.158 ) | ||
| M3 | 0.99 ( 0.12 ) | 4 ( 0 ) | 14 ( 2.24 ) | 18 ( 2.24 ) | 3.443 ( 2.061 ) | 0.641 ( 0.165 ) | 0.006 ( 0.038 ) | 0.310 ( 0.147 ) | ||
| M4 | 0.99 ( 0.12 ) | 4 ( 0 ) | 16 ( 1.69 ) | 20 ( 1.69 ) | 3.64 ( 2.096 ) | 0.670 ( 0.167 ) | 0.006 ( 0.038 ) | 0.354 ( 0.151 ) | ||
| 400 | 0.2 | M1 | 1 ( 0 ) | 4 ( 0.75 ) | 5 ( 3.10 ) | 9 ( 3.38 ) | 1.116 ( 1.674 ) | 0.630 ( 0.450 ) | -0.018 ( 0.691 ) | 0.402 ( 0.512 ) |
| M2 | 1 ( 0 ) | 4 ( 0 ) | 33 ( 4.28 ) | 37 ( 4.28 ) | 1.023 ( 1.199 ) | 0.589 ( 0.068 ) | -0.038 ( 0.649 ) | 0.376 ( 0.294 ) | ||
| M3 | 1 ( 0 ) | 4 ( 0 ) | 52 ( 8.40 ) | 56 ( 8.40 ) | 0.841 ( 1.199 ) | 0.410 ( 0.153 ) | -0.039 ( 0.635 ) | 0.276 ( 0.329 ) | ||
| M4 | 1 ( 0 ) | 4 ( 0 ) | 55 ( 8.24 ) | 59 ( 8.24 ) | 0.827 ( 1.008 ) | 0.443 ( 0.135 ) | -0.055 ( 0.604 ) | 0.299 ( 0.287 ) | ||
| 0.5 | M1 | 1 ( 0 ) | 4 ( 0.62 ) | 5 ( 2.91 ) | 9 ( 3.12 ) | 1.370 ( 1.892 ) | 0.596 ( 0.376 ) | -0.009 ( 0.416 ) | 0.360 ( 0.433 ) | |
| M2 | 1 ( 0 ) | 4 ( 0 ) | 33 ( 4.19 ) | 37 ( 4.19 ) | 1.261 ( 1.510 ) | 0.580 ( 0.050 ) | -0.026 ( 0.308 ) | 0.338 ( 0.166 ) | ||
| M3 | 1 ( 0 ) | 4 ( 0 ) | 52 ( 8.55 ) | 56 ( 8.55 ) | 0.982 ( 1.156 ) | 0.389 ( 0.124 ) | -0.020 ( 0.331 ) | 0.237 ( 0.236 ) | ||
| M4 | 1 ( 0 ) | 4 ( 0 ) | 55 ( 8.72 ) | 59 ( 8.72 ) | 1.068 ( 1.273 ) | 0.427 ( 0.122 ) | -0.022 ( 0.328 ) | 0.268 ( 0.219 ) | ||
| 0.8 | M1 | 1 ( 0 ) | 4 ( 0 ) | 5 ( 2.25 ) | 9 ( 2.25 ) | 2.437 ( 1.593 ) | 0.534 ( 0.049 ) | -0.046 ( 0.134 ) | 0.284 ( 0.204 ) | |
| M2 | 1 ( 0 ) | 4 ( 0 ) | 33 ( 4.34 ) | 37 ( 4.34 ) | 2.720 ( 1.892 ) | 0.579 ( 0.046 ) | -0.021 ( 0.134 ) | 0.331 ( 0.200 ) | ||
| M3 | 1 ( 0 ) | 4 ( 0 ) | 52 ( 8.62 ) | 56 ( 8.62 ) | 2.299 ( 1.820 ) | 0.388 ( 0.116 ) | -0.023 ( 0.157 ) | 0.233 ( 0.279 ) | ||
| M4 | 1 ( 0 ) | 4 ( 0 ) | 56 ( 8.83 ) | 60 ( 8.83 ) | 2.377 ( 1.832 ) | 0.417 ( 0.095 ) | -0.028 ( 0.109 ) | 0.245 ( 0.180 ) |
Table 2.
Results of variable screening, variable selection, and estimation for simulation when . The values in the parentheses are the robust standard deviations. M1: our proposed multi-step sparse boosting method; M2: except sparse boosting, -boosting are used in each step; M3: except sparse boosting, lasso regression are used in each step; M4: except sparse boosting, elastic net regression are used in each step. S: coverage probability that the top covariates after screening includes all important covariates; TP: the median of true positive; FP: the median of false positive; Size: the median of model sizes; ISPE: the average of mean square error; RMISE: the average of root mean integrated squared error; Bias(): the mean bias of ; Bias(): the mean bias of . The values in the parentheses are the robust standard deviations; Simulation based on 500 replicates.
Table 2.
Results of variable screening, variable selection, and estimation for simulation when . The values in the parentheses are the robust standard deviations. M1: our proposed multi-step sparse boosting method; M2: except sparse boosting, -boosting are used in each step; M3: except sparse boosting, lasso regression are used in each step; M4: except sparse boosting, elastic net regression are used in each step. S: coverage probability that the top covariates after screening includes all important covariates; TP: the median of true positive; FP: the median of false positive; Size: the median of model sizes; ISPE: the average of mean square error; RMISE: the average of root mean integrated squared error; Bias(): the mean bias of ; Bias(): the mean bias of . The values in the parentheses are the robust standard deviations; Simulation based on 500 replicates.
| n | Method | S | TP | FP | Size | ISPE | RMISE | Bias() | Bias() | |
|---|---|---|---|---|---|---|---|---|---|---|
| 100 | 0.2 | M1 | 0.85 ( 0.36 ) | 4 ( 0.38 ) | 6 ( 2.65 ) | 10 ( 2.67 ) | 2.280 ( 1.853 ) | 1.000 ( 0.537 ) | -0.079 ( 0.329 ) | 0.402 ( 0.503 ) |
| M2 | 0.85 ( 0.36 ) | 4 ( 0.15 ) | 14 ( 1.91 ) | 17 ( 1.92 ) | 2.586 ( 1.790 ) | 1.037 ( 0.493 ) | -0.072 ( 0.309 ) | 0.523 ( 0.470 ) | ||
| M3 | 0.85 ( 0.36 ) | 4 ( 0.17 ) | 15 ( 2.14 ) | 19 ( 2.20 ) | 2.796 ( 1.752 ) | 1.128 ( 0.489 ) | -0.074 ( 0.319 ) | 0.598 ( 0.462 ) | ||
| M4 | 0.85 ( 0.36 ) | 4 ( 0.15 ) | 16 ( 1.73 ) | 20 ( 1.79 ) | 2.948 ( 1.726 ) | 1.173 ( 0.479 ) | -0.074 ( 0.316 ) | 0.650 ( 0.452 ) | ||
| 0.5 | M1 | 0.90 ( 0.30 ) | 4 ( 0.19 ) | 6 ( 2.49 ) | 10 ( 2.44 ) | 2.656 ( 1.762 ) | 0.921 ( 0.429 ) | -0.004 ( 0.186 ) | 0.335 ( 0.387 ) | |
| M2 | 0.90 ( 0.30 ) | 4 ( 0.10 ) | 14 ( 1.85 ) | 18 ( 1.84 ) | 3.067 ( 1.799 ) | 0.980 ( 0.413 ) | 0.003 ( 0.174 ) | 0.471 ( 0.371 ) | ||
| M3 | 0.90 ( 0.30 ) | 4 ( 0.08 ) | 16 ( 1.80 ) | 20 ( 1.80 ) | 3.323 ( 1.865 ) | 1.070 ( 0.418 ) | 0.003 ( 0.184 ) | 0.544 ( 0.374 ) | ||
| M4 | 0.90 ( 0.30 ) | 4 ( 0.05 ) | 16 ( 1.44 ) | 20 ( 1.44 ) | 3.446 ( 1.726 ) | 1.116 ( 0.408 ) | 0.001 ( 0.181 ) | 0.594 ( 0.360 ) | ||
| 0.8 | M1 | 1 ( 0.06 ) | 4 ( 0 ) | 6 ( 2.16 ) | 10 ( 2.16 ) | 5.771 ( 2.019 ) | 0.782 ( 0.186 ) | 0.002 ( 0.058 ) | 0.190 ( 0.164 ) | |
| M2 | 1 ( 0.06 ) | 4 ( 0 ) | 13 ( 1.76 ) | 17 ( 1.76 ) | 6.277 ( 1.939 ) | 0.824 ( 0.162 ) | 0.004 ( 0.056 ) | 0.313 ( 0.159 ) | ||
| M3 | 1 ( 0.06 ) | 4 ( 0 ) | 15 ( 1.92 ) | 19 ( 1.92 ) | 6.567 ( 1.921 ) | 0.906 ( 0.172 ) | 0.008 ( 0.056 ) | 0.373 ( 0.162 ) | ||
| M4 | 1 ( 0.06 ) | 4 ( 0 ) | 16 ( 1.37 ) | 20 ( 1.37 ) | 6.681 ( 1.848 ) | 0.943 ( 0.179 ) | 0.006 ( 0.055 ) | 0.424 ( 0.168 ) | ||
| 400 | 0.2 | M1 | 1 ( 0 ) | 4 ( 0.65 ) | 12 ( 4.03 ) | 16 ( 4.38 ) | 2.327 ( 1.895 ) | 0.715 ( 0.386 ) | -0.051 ( 1.052 ) | 0.440 ( 0.526 ) |
| M2 | 1 ( 0 ) | 4 ( 0 ) | 42 ( 3.43 ) | 46 ( 3.43 ) | 2.367 ( 1.498 ) | 0.715 ( 0.089 ) | -0.012 ( 0.939 ) | 0.451 ( 0.390 ) | ||
| M3 | 1 ( 0 ) | 4 ( 0 ) | 45 ( 12.00 ) | 49 ( 12.00 ) | 2.245 ( 1.363 ) | 0.727 ( 0.157 ) | -0.005 ( 1.020 ) | 0.460 ( 0.418 ) | ||
| M4 | 1 ( 0 ) | 4 ( 0 ) | 47 ( 10.79 ) | 51 ( 10.79 ) | 2.304 ( 1.337 ) | 0.762 ( 0.151 ) | -0.036 ( 1.047 ) | 0.494 ( 0.432 ) | ||
| 0.5 | M1 | 1 ( 0 ) | 4 ( 0.43 ) | 12 ( 3.86 ) | 16 ( 4.01 ) | 2.484 ( 1.819 ) | 0.665 ( 0.258 ) | -0.080 ( 0.594 ) | 0.361 ( 0.416 ) | |
| M2 | 1 ( 0 ) | 4 ( 0 ) | 41 ( 3.60 ) | 45 ( 3.60 ) | 2.635 ( 1.733 ) | 0.714 ( 0.092 ) | -0.069 ( 0.599 ) | 0.444 ( 0.411 ) | ||
| M3 | 1 ( 0 ) | 4 ( 0 ) | 44 ( 11.66 ) | 48 ( 11.66 ) | 2.579 ( 1.601 ) | 0.715 ( 0.154 ) | -0.085 ( 0.648 ) | 0.432 ( 0.407 ) | ||
| M4 | 1 ( 0 ) | 4 ( 0 ) | 46 ( 10.75 ) | 50 ( 10.75 ) | 2.650 ( 1.606 ) | 0.751 ( 0.148 ) | -0.039 ( 0.613 ) | 0.453 ( 0.387 ) | ||
| 0.8 | M1 | 1 ( 0 ) | 4 ( 0 ) | 12 ( 3.38 ) | 16 ( 3.38 ) | 4.800 ( 1.832 ) | 0.628 ( 0.081 ) | -0.107 ( 0.227 ) | 0.330 ( 0.382 ) | |
| M2 | 1 ( 0 ) | 4 ( 0 ) | 41 ( 3.81 ) | 45 ( 3.81 ) | 5.042 ( 1.664 ) | 0.687 ( 0.056 ) | -0.111 ( 0.195 ) | 0.412 ( 0.347 ) | ||
| M3 | 1 ( 0 ) | 4 ( 0 ) | 44 ( 12.22 ) | 48 ( 12.22 ) | 5.101 ( 1.827 ) | 0.682 ( 0.120 ) | -0.109 ( 0.236 ) | 0.415 ( 0.401 ) | ||
| M4 | 1 ( 0 ) | 4 ( 0 ) | 45 ( 10.98 ) | 49 ( 10.98 ) | 5.152 ( 1.787 ) | 0.716 ( 0.102 ) | -0.105 ( 0.229 ) | 0.432 ( 0.376 ) |
Table 3.
Description of the variables in Boston housing data.
| Variable | Varaible Description |
|---|---|
| MEDV | Median value of owner-occupied housing expressed in USD 1,000’s |
| CRIM | Per capita murder rate by town |
| ZN | Proportion of residential land zoned for lots over square feet |
| B | Proportion of Black residents by town |
| RM | Average number of rooms per dwelling |
| DIS | Weighted distances to five Boston employment centers |
| NOX | Nitric oxides concentration (parts per 10 millions) per town |
| AGE | Proportion of owner-occupied units built before 1940 |
| INDUS | Proportion of non-retail business acres per town |
| RAD | Index of accessibility to radial highways per town |
| PTRATIO | Pupil-teacher ratio by town |
| LSTAT | Percentage of lower status population |
| TAX | Full-value property tax rate per USD 10,000 |
| CHAS | Charles River dummy variable (1 if tract bounds river; 0 otherwise) |
Table 4.
Boston housing price example: variable selection, estimation and prediction performance. No.: Number of variables selected; Variables: Names of selected variables; ISPE: In-sample prediction error ; OSPE: 5-fold cross-validation out-of-sample prediction error.
Table 4.
Boston housing price example: variable selection, estimation and prediction performance. No.: Number of variables selected; Variables: Names of selected variables; ISPE: In-sample prediction error ; OSPE: 5-fold cross-validation out-of-sample prediction error.
| Method | No. | Variables | ISPE | OSPE |
|---|---|---|---|---|
| multi-step sparse boosting | 2 | RM (3), LSTAT (9) | 0.665 | 0.951 |
| multi-step boosting | 2 | RM (3), LSTAT (9) | 0.665 | 0.951 |
| multi-step lasso | 12 | CRIM (1), B (2), RM (3), DIS (4), NOX (5), AGE (6), INDUS (7), PTRATIO (8), LSTAT (9), ZN (10), RAD (11), TAX (12) | 0.172 | 1.197 |
| multi-step elastic net | 12 | CRIM (1), B (2), RM (3), DIS (4), NOX (5), AGE (6), INDUS (7), PTRATIO (8), LSTAT (9), ZN (10), RAD (11), TAX (12) | 0.160 | 1.232 |
Disclaimer/Publisher’s Note: The statements, opinions and data contained in all publications are solely those of the individual author(s) and contributor(s) and not of MDPI and/or the editor(s). MDPI and/or the editor(s) disclaim responsibility for any injury to people or property resulting from any ideas, methods, instructions or products referred to in the content. |
© 2025 by the authors. Licensee MDPI, Basel, Switzerland. This article is an open access article distributed under the terms and conditions of the Creative Commons Attribution (CC BY) license (http://creativecommons.org/licenses/by/4.0/).
Copyright: This open access article is published under a Creative Commons CC BY 4.0 license, which permit the free download, distribution, and reuse, provided that the author and preprint are cited in any reuse.