Submitted:
03 February 2025
Posted:
04 February 2025
You are already at the latest version
Abstract
Background and Objectives: The superficial femoral artery (SFA) can be injured during the intramedullary femoral nailing procedure with proximal and distal cross fixation performed for proximal femoral fractures and interthorachanteric fractures. This study aims to determine the safe and dangerous zones for SFA in operative interventions on the femoral body and to define the relationship of these zones with femur length and gender. Materials and Methods: Using Computed Tomography Angiography, the relationship between the SFA and the medial shaft of the femur was examined in 160 limbs of 80 patients. The upper and lower cut points of the medial part of the SFA in the sagittal plane were defined. The distance of these points to the adductor tubercle was measured and the ratio of this value to the femur length was calculated. Results: The average distance of the SFA to the adductor tubercle in women was 214.2 ± 25.9 mm at the anterior border of the femur, while in men it was 229.8 ± 26.2 mm (p=0.000). The danger zone length was 85 mm in women and 102 mm in men, and the difference was statistically significant (p=0.000). The average distance of the SFA to the adductor tubercle at the anterior border of the femur was 223.1 ± 27.3 mm, and the average femur length was 374.9 ± 30.2 mm, and a moderate correlation was found between them (r=0.568). Conclusions: When determining the intraoperative danger zone using anatomical reference points in surgical approaches to the femur, variables such as gender and femur length should not be ignored.
Keywords:
Femoral artery
; Iatrogenic vascular injury
; Computed Tomography Angiography
1. Introduction
After the femoral artery (FA) branches into the deep femoral artery (DFA), it continues as the superficial femoral artery (SFA) and descends along the anteromedial line of the thigh within the femoral triangle. The SFA traverses the adductor canal and typically passes through the adductor magnus hiatus at the upper point of the distal third of the thigh, where it continues as the popliteal artery [1]. Although the SFA is located anteromedially to the femur in the proximal thigh, it shifts medially to the femur and ultimately assumes a posteromedial position as it descends. Along its course, the SFA is generally in close proximity to the femoral and saphenous nerves, which are highly susceptible to injury [2]. Due to this anatomical course, the SFA is at risk of injury during proximal and distal cross-fixation, a standard surgical method for managing proximal femur and intertrochanteric fractures, as well as during intramedullary femoral nailing procedures [3,4,5,6]. Particularly, injuries to the SFA have been reported due to the placement of fixation materials such as external fixation pins, cerclage wires, plates, and screws, or as a result of bone fragments created during these procedures [5,7,8,9,10]. Although iatrogenic vascular injury resulting from these procedures is not common, the most common complications include laceration-induced bleeding, arterial occlusion, aneurysm, or arteriovenous fistula development [3,7,8,9,11,12,13]. Understanding the course of the SFA and DFA, particularly their position relative to the medial femoral cortex (MFC), is critical for surgeons to predict potential dangerous zones and exercise greater caution during surgical procedures such as femoral shaft screw placement. Minimizing complications remains a significant goal, and numerous studies have been conducted to elucidate the anatomical relationship between the femoral shaft and the FA to serve this purpose [2,14,15,16,17,18,19]. Therefore, this study aimed to define the position of the SFA relative to the MFC using computed tomography (CT) in the Turkish population and to identify safe and dangerous zones for proximal femur surgical procedures based on distance and proportional measurements, using anatomical reference points identifiable under fluoroscopy on the distal femur.
2. Materials and Methods
2.1. Study Design and Ethics Approval
This study employed a retrospective, single-center design and was approved by the ethics committee of our hospital (Date/No: 26.05.2023/413). Because the study posed no risk and no participants or groups were negatively affected, the requirement for an informed consent was waived.
2.2. Patient Selection
A total of 80 patients (45 men and 35 women) who underwent bilateral lower extremity CT angiography (CTA) at our hospital’s radiology department between January 2022 and December 2023 and met the inclusion criteria were included in the study. The inclusion criteria were defined as being over 18 years of age, having no history of femur or hip fractures, no history of total occlusion of the iliac or femoral arteries, no prior vascular surgery, no congenital bone diseases or syndromes associated with bone dysplasia, and having CTAs of sufficient quality for evaluation.
2.3. Imaging and Measurement Methods
In this study, all images were obtained with a 64-slice CT scanner (Siemens Healthineers, Erlangen, Germany). Images were evaluated by two observers using a Picture Archiving and Communication System integrated with the hospital’s information system. Only the images deemed suitable by both observers were included, and necessary measurements were performed. Measurements were taken from the bilateral lower extremity CTAs of all patients, focusing on two distal anatomical reference points on each femur. The first measurement was the distance between the greater trochanter (GT) and the adductor tubercle (AT), whereas the second was the distance between the GT and the distal medial condylar plateau (DMC). The condylar line-adjusted anteversion angle was measured on the right and left lower extremity CTAs of all patients (Figure 1 and Figure 2).
Additionally, the transition point of the SFA relative to the femoral cortex was termed the anterior femoral cortex (AFC), the point where the SFA aligns parallel to the femoral axial shaft in relation to the condylar line was termed the MFC, and the point where the SFA transitions from the medial to the posterior femoral cortex was termed the posterior femoral cortex (PFC). At these points, the shortest perpendicular distance from the SFA to the femoral cortex, as well as the distance from the SFA to the AT and DMC at these levels, were measured (Figure 3 and Figure 4).
All measured values were recorded in millimeters and proportionally scaled to the previously measured femur length. The segment of the SFA located medially to the femur between the AFC and PFC transition points was considered the “dangerous zone,” whereas the segment distal to the PFC transition point, located posteriorly to the femur, was considered the "safe zone.”
2.4. Statistical Analysis
Data analysis was performed using SPSS version 22.0 for Windows (SPSS, Chicago, IL). The distribution of continuous variables for normality was assessed using the Kolmogorov–Smirnov and Shapiro-Wilk tests. Descriptive statistics, including frequency analysis and percentage distribution, were used for categorical variables, whereas the mean ± standard deviation was used for continuous variables. The significance of differences in means between groups was analyzed using the independent samples t-test. A p-value of <0.05 was considered statistically significant for all analyses.
3. Results
A total of 80 patients meeting the inclusion criteria, comprising 35 women and 45 men, were included in this study, resulting in 160 lower extremity angiography images. The mean age was 58.48 ± 13.73 years for women and 59.24 ± 13.72 years for men. The average anteversion angle was 14.75 ± 6.56 degrees in women and 15.07 ± 6.92 degrees in men (Table 1).
The mean distance from the SFA at the AFC point to the femur’s AT point was 223.01 ± 27.38 mm. This distance was 180.78 ± 26.83 mm at the MFC point and 128.01 ± 29.59 mm at the PFC point. The perpendicular distances from the FA to the femoral cortex at these levels were 27.20 ± 5.32 mm, 25.22 ± 5.52 mm, and 22.93 ± 6.04 mm, respectively (Table 2).
Femur length was measured using two anatomical reference points. The mean distance from the GT to the AT was 353.09 ± 22.35 mm in women and 393.05 ± 18.76 mm in men, showing a statistically significant difference (p < 0.001) (Table 3). For the same reference points, the mean femur length was 376.02 ± 28.54 mm on the right extremity and 375.11 ± 28.53 mm on the left extremity, with no statistically significant difference (p = 0.841) (Table 3).
The ratio of the length measured from the AFC point of the SFA to the femoral AT point, relative to the length between the femoral GT and AT points (Ratio 1), was 0.60 ± 0.05 in women and 0.58 ± 0.06 in men, with women showing a statistically significantly higher ratio (p = 0.021) (Table 4).
A statistically significant positive correlation of weak to moderate strength was identified between the distance from the SFA to the femoral AT and femur length at the AFC, MFC, and PFC levels, as well as between the distance from the SFA to the MFC and femur length at the same levels (p = 0.000, r = 0.276–0.568) (Table 5).
4. Discussion
Identifying and understanding the safe and dangerous zones for vascular injury during femoral surgical procedures is crucial for reducing patient morbidity and improving surgical outcomes. There are no studies in the literature specifically evaluating the distances and proportions of safe and dangerous zones for the SFA using anatomical reference points, such as the AT, which can be identified under fluoroscopy, in the Turkish population. In this study, the axial plane position of the SFA relative to the femoral cortex and its sagittal plane position relative to the AT were determined. We found that the dangerous zone of the SFA begins at an average distance of 223.01 ± 27.38 mm from the femoral AT and ends at 128.01 ± 29.59 mm, covering a segment of 95 mm. In women, this zone began at an average distance of 214.25 ± 25.93 mm from the AT and ended at 129.21 ± 29.28 mm, with a mean length of 85.04 mm. In men, it began at 229.83 ± 26.65 mm and ended at 127.08 ± 29.96 mm, with a mean length of 102.75 mm. Although the difference between sexes was statistically significant (p < 0.001), it was primarily attributed to the average femur length being shorter in women than in men (GT to AT distance: 353.09 mm vs. 393.05 mm). Therefore, the ratio of the dangerous zone distance for each SFA to femur length (GT to AT) was calculated to account for differences attributable to variations in femur length. This ratio was 0.24 ± 0.04 in women and 0.26 ± 0.04 in men, and the difference was statistically significant (p = 0.004). The ratios of distances from the AFC, MFC, and PFC section points of the SFA to the femoral AT relative to femur length (GT to AT) were 0.60 ± 0.05, 0.50 ± 0.05, and 0.36 ± 0.07 in women, respectively, and 0.58 ± 0.06, 0.46 ± 0.05, and 0.32 ± 0.07 in men, respectively. The differences between sexes were statistically significant (p = 0.021, 0.000, and 0.000, respectively). After minimizing the effect of femur length variability, it was observed that the SFA in women crossed the MFC earlier than that in men. However, due to the small sample size, we consider this finding debatable. The perpendicular distances from the SFA to the MFC in women were measured as 24.8 ± 4.24 mm at the AFC section, 22.84 ± 4.51 mm at the MFC section, and 21.92 ± 5.01 mm at the PFC section. In men, these distances were 29.11 ± 5.36 mm, 27.11 ± 5.57 mm, and 23.71 ± 6.70 mm, respectively. A statistically significant difference was found between women and men for the AFC and MFC section points (p < 0.000), whereas no statistically significant difference was detected for the PFC section point (p = 0.06). The findings obtained in the present study can be compared with a series of anatomical studies using the AT as a reference point for quantitative evaluation of the anatomical landmarks of the medial thigh (2,18–21). In their CTA study evaluating 180 lower extremities from 120 patients, Seyyed-Morteza et al. reported that the dangerous zone for the SFA began 236.93 ± 29.61 mm away from the AT, extended over 90.65 mm, and ended 146.28 ± 33.18 mm away. They also reported distances of the SFA to the femoral cortex as 29.06 ± 6.2 mm at the AFC level, 27.14 ± 5.5 mm at the MFC level, and 24.69 ± 4.9 mm at the PFC level. Because they included the entire study cohort in their calculations, they did not share any data on sex differences. Furthermore, they did not consider femur length in defining dangerous and safe zones [19]. In a similar study, Narulla et al. evaluated 41 extremities from a cohort of 22 patients using CTA to define safe and dangerous zones for the SFA. They found that the dangerous zone began 239.6 ± 39.8 mm away from the AT, extended over 172.5 ± 40.9 mm, and was 67.1 mm long. They also reported that compared to previous studies, the dangerous zone was narrower, whereas the safe zone was wider. They noted that this difference could be attributed to their use of the epicondylar axis to define the sagittal plane of the femoral shaft. Despite a statistically significant difference in femur lengths between sexes (p = 0.002), they did not observe any statistically significant difference when comparing the section points they used for defining the dangerous and safe zones (p > 0.05) [18]. Additionally, the distance of the SFA from the femoral cortex at the AFC and PFC levels was measured for both sexes. In women, this distance was 26.4 ± 6 mm at the AFC level and 21.23 ± 5.2 mm at the PFC level, whereas in men, it was 26.8 ± 7.7 mm and 23.6 ± 6.6 mm, respectively. No statistically significant difference was observed between the sexes (p = 0.118 and p = 0.075, respectively) [18]. This lack of significance could be attributed to the limited study cohort, the wide range of femur lengths observed in both sexes, and the unequal number of participants in each group. Maslow et al. evaluated a total of 30 limbs from 15 consecutive patients (7 women and 8 men) who underwent bilateral lower extremity CTA. They determined that the dangerous zone of the SFA started at an average distance of 232.1 ± 33 mm from the AT, extended over a length of 89.5 mm, and ended at a distance of 142.6 ± 40.6 mm [2]. In the same study, the distances of the SFA from the medial cortex of the femur at the AFC, MFC, and PFC levels were also measured. These values were 32.8 ± 8.1 mm for AFC, 31.1 ± 7.6 mm for MFC, and 30.7 ± 8.7 mm for PFC, respectively [2]. Kim et al. evaluated 30 patients using CTA in a study investigating the safe zone for minimally invasive plate osteosynthesis (MIPO) on the medial aspect of the distal femur [20]. They found that throughout its course in the thigh, the SFA was located more than 12 mm away from the femoral cortex (range: 12.2–38.0 mm), being closer posteriorly and distally but farther away anteriorly and medially. Accordingly, they concluded that the anteromedial aspect of the femur constitutes a safe zone for MIPO. Han et al. conducted a study involving 40 patients (20 women and 20 men) to measure the distances and angular intervals between the DFA and SFA and distal screws using CTA [21]. They reported that the SFA was located at an average distance of 19.28 ± 3.44 mm (range: 15.0–27.8 mm) from the femoral cortex distally. Considering the findings of existing studies in the literature, substantial variations have been reported regarding the identification of dangerous and safe zones as well as the closest distance of the SFA to the femoral cortex. Although some results align with those of our study, others differ significantly. These discrepancies may result from the limited patient populations selected, differences in study designs, regional and racial variations, and the omission of femur length as a variable in certain studies.
This study has certain limitations. First, the position of the SFA relative to the femur along its course is highly variable. To minimize this variability, larger sample sizes or meta-analyses are needed to support the findings. Second, none of the patients in the present study had pathologies that could affect femur length or surrounding soft tissues. In patients with femoral fractures or significant alterations in adjacent soft tissues, measurement values may differ due to the loss of anatomical integrity. Lastly, measurements performed in CTA using the epicondylar axis may differ from those taken intraoperatively, as extremities are typically positioned in adduction and internal rotation on the operating table.
5. Conclusions
When approaching femoral fractures via lateral access, either through open or percutaneous methods, there is a risk of injury to neurovascular structures located medially to the femoral cortex. A thorough understanding of the thigh anatomy prior to the planned intervention can significantly reduce this risk. During surgery, reference points such as the AT, MFC, and medial femoral condyle plateau, which can be utilized under fluoroscopic guidance, can assist in identifying safe and dangerous zones, thereby reducing potential morbidity and the likelihood of failure. In the present study, the starting and ending points of the dangerous and safe zones differed significantly between men and women. Furthermore, these zones showed a weak positive correlation with femur length. The results also showed that the distance of the section points from the AT and the ratio of the dangerous zone distance to femur length varied between males and females. Based on these findings, we recommend performing separate evaluations for men and women when planning the use of surgical instrumentation via lateral access to the femur. Specifically, we determined that the dangerous zone begins at a distance of 214.2 mm from the AT and extends over an average segment of 85 mm in females, whereas in men, it begins at 229.8 mm and extends over an average segment of 102.7 mm. Additionally, proportional calculations based on femur length indicate that the distal one-third of the femoral shaft relative to the AT (0.32–0.36) is a safe region in both sexes.
Author Contributions
Conceptualization, Y.M. and Ş.K.; methodology, Y.M., Ş.K. and A.Ş.; software, Ş.K. and A.Ş.; validation, Y.M., Ş.K. and A.Ş. ; formal analysis Y.M. and Ş.K.; investigation Y.M., Ş.K. and A.Ş.; resources Y.M., Ş.K. and A.Ş.; data curation, Y.M., Ş.K. and A.Ş.; writing—original draft preparation, Y.M. and Ş.K.; writing—review and editing, Ş.K.; visualization, Ş.K. and A.Ş.; supervision, Ş.K.; project administration, Ş.K.; funding acquisition, NO. All authors have read and agreed to the published version of the manuscript.
Funding
This research received no external funding.
Institutional Review Board Statement
The study was conducted in accordance with the Declaration of Helsinki, and approved by the University of Health Sciences, Gazi Yaşargil Training and Research Hospital Institutional Ethics Committee (413 / 05.26.2023).
Informed Consent Statement
The informed consent form was waived because there was no risk of the study and there were no adversely affected subjects or groups.
Data Availability Statement
The data presented in this study are available on request from the corresponding author due to (privacy, legal or ethical reasons).
Conflicts of Interest
The authors declare no conflicts of interest. There is no funder.
Abbreviations
The following abbreviations are used in this manuscript:
| AFC | Anterior femoral cortex |
| AT | Adductor tubercle |
| CT | Computed tomography |
| CTA | Computed tomography angiography |
| DFA | Deep femoral artery |
| DMC | Distal medial condylar plateau |
| FA | Femoral artery |
| GT | Greater trochanter |
| MFC | Medial femoral cortex |
| MIPO | Minimally invasive plate osteosynthesis |
| NA | Not applicable. |
| PFC | Posterior femoral cortex |
| SD | Standard deviation |
| SFA | Superficial femoral artery |
References
- Schulte, Erik; Schumacher, Udo (2006). "Arterial Supply to the Thigh". In Ross, Lawrence M.; Lamperti, Edward D. (eds.). Thieme Atlas of Anatomy: General Anatomy and Musculoskeletal System. Thieme. p. 490. ISBN 978-3-13-142081-7.
- Maslow JI, Collinge CA. Course of the Femoral Artery in the Mid- and Distal Thigh and Implications for Medial Approaches to the Distal Femur: A CT Angiography Study. J Am Acad Orthop Surg. 2019, 27, e659–e663. [Google Scholar] [CrossRef] [PubMed]
- Grimaldi M, Courvoisier A, Tonetti J, Vouaillat H, Merloz P. Superficial femoral artery injury resulting from intertrochanteric hip fracture fixation by a locked intramedullary nail. Orthop Traumatol Surg Res. 2009, 95, 380–2. [Google Scholar] [CrossRef] [PubMed]
- Eslami MH, Silvia BA. Endovascular repair of femoral artery pseudoaneurysm after orthopedic surgery with balloon-expandable covered stents. Vasc Endovascular Surg. 2008, 42, 176–9. [Google Scholar] [CrossRef] [PubMed]
- Tiwary SK, Kumar S, Khanna R, Khanna AK. Iatrogenic femoral artery aneurysms in orthopaedic practice. ANZ J Surg. 2007, 77, 899–901. [Google Scholar] [CrossRef] [PubMed]
- Handolin L, Pajarinen J, Tulikoura I. Injury to the deep femoral artery during proximal locking of a distal femoral nail--a report of 2 cases. Acta Orthop Scand. 2003 Feb;74(1):111-3.
- Mehta V, Finn HA. Femoral artery and vein injury after cerclage wiring of the femur: a case report. J Arthroplasty. 2005 Sep;20(6):811-4.
- Aleto T, Ritter MA, Berend ME. Case report: superficial femoral artery injury resulting from cerclage wiring during revision THA. Clin Orthop Relat Res. 2008 Mar;466(3):749-53.
- Paul MA, Patka P, van Heuzen EP, Koomen AR, Rauwerda J. Vascular injury from external fixation: case reports. J Trauma. 1992 Dec;33(6):917-20.
- Ha YC, Luminita S, Cho SH, Choi JY, Koo KH. Laceration of femoral vessels by an avulsion fracture fragment of the lesser trochanter after bipolar hemiarthroplasty. J Arthroplasty. 2005 Aug;20(5):680-3.
- DeCasas R, Lázaro FJ, García-Rayo MR, Arias J. Arteriovenous fistula after interlocking nailing of the femur: a case report. J Trauma. 1995 Feb;38(2):303-4.
- Yang KH, Park HW, Park SJ. Pseudoaneurysm of the superficial femoral artery after closed hip nailing with a Gamma nail: report of a case. J Orthop Trauma. 2002 Feb;16(2):124-7.
- Yang KH, Yoon CS, Park HW, Won JH, Park SJ. Position of the superficial femoral artery in closed hip nailing. Arch Orthop Trauma Surg. 2004 Apr;124(3):169-72.
- Kapoor R, Adhikary SD, Siefring C, McQuillan PM. The saphenous nerve and its relationship to the nerve to the vastus medialis in and around the adductor canal: an anatomical study. Acta Anaesthesiol Scand. 2012 Mar;56(3):365-7.
- Kwon JY, Johnson CE, Appleton P, Rodriguez EK. Lateral femoral traction pin entry: risk to the femoral artery and other medial neurovascular structures. J Orthop Surg Res. 2010 Jan 22;5:4.
- Han CD, Lee YH, Yang KH, Yang IH, Lee WS, Park YJ, Suh JS, Park KK. Relationship between distal screws and femoral arteries in closed hip nailing on computed tomography angiography. Arch Orthop Trauma Surg. 2013 Mar;133(3):361-6.
- Mahmoud SSS, Ahmed B, Hamid K, Milburn S, Baker P. Identification of the medial femoral safe zone for drilling during dynamic hip screw side plate fixation: A CT angiogram tracing of the profunda femoris artery. Injury. 2019 Mar;50(3):720-726.
- Narulla RS, Kanawati AJ. Safe zone for the superficial femoral artery demonstrated on computed tomography angiography. Injury. 2016 Mar;47(3):748-51.
- Kazemi SM, Keyhani S, Sadighi M, Hosseininejad SM. Navigation of femoral and popliteal artery around the knee with CT angiography: implications for surgical interventions. Surg Radiol Anat. 2023 Nov;45(11):1515-1523.
- Kim JJ, Oh HK, Bae JY, Kim JW. Radiological assessment of the safe zone for medial minimally invasive plate osteosynthesis in the distal femur with computed tomography angiography. Injury. 2014 Dec;45(12):1964-9.
- Han CD, Lee YH, Yang KH, Yang IH, Lee WS, Park YJ, Suh JS, Park KK. Relationship between distal screws and femoral arteries in closed hip nailing on computed tomography angiography. Arch Orthop Trauma Surg. 2013 Mar;133(3):361-6.
Figure 1.
Posterior condylar axis drawn on computed tomography axial images.
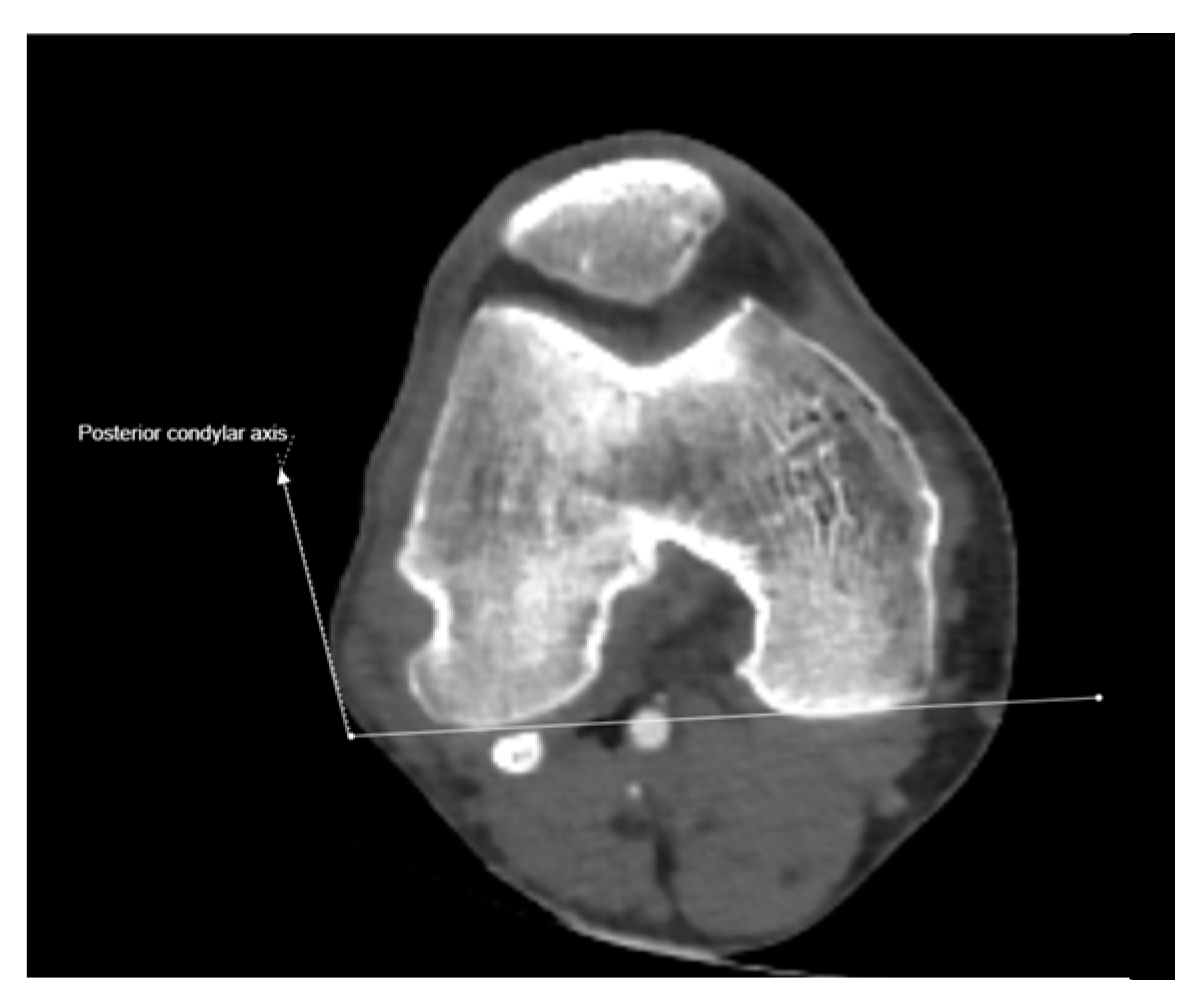
Figure 2.
Right femoral anteversion angle corrected according to posterior condylar axis.

Figure 3.
Anterior, medial and posterior femoral cortex cut points for the superficial femoral artery on the coronal scanogram of the right lower extremity CT angiography scan (a), Perpendicular distance of SFA to femoral cortex on axial CTA images at AFC, MFC and PFC levels (b,c,d).
Figure 3.
Anterior, medial and posterior femoral cortex cut points for the superficial femoral artery on the coronal scanogram of the right lower extremity CT angiography scan (a), Perpendicular distance of SFA to femoral cortex on axial CTA images at AFC, MFC and PFC levels (b,c,d).

Figure 4.
Left panel: Anterior, medial and posterior femoral cortex cut points for the superficial femoral artery on the coronal scanogram of the right lower extremity CT angiography scan. Right panel: Distance of SFA to femoral adductor tubercle and distal medial condyle on coronal and sagittal CTA images at AFC, MFC and PFC levels.
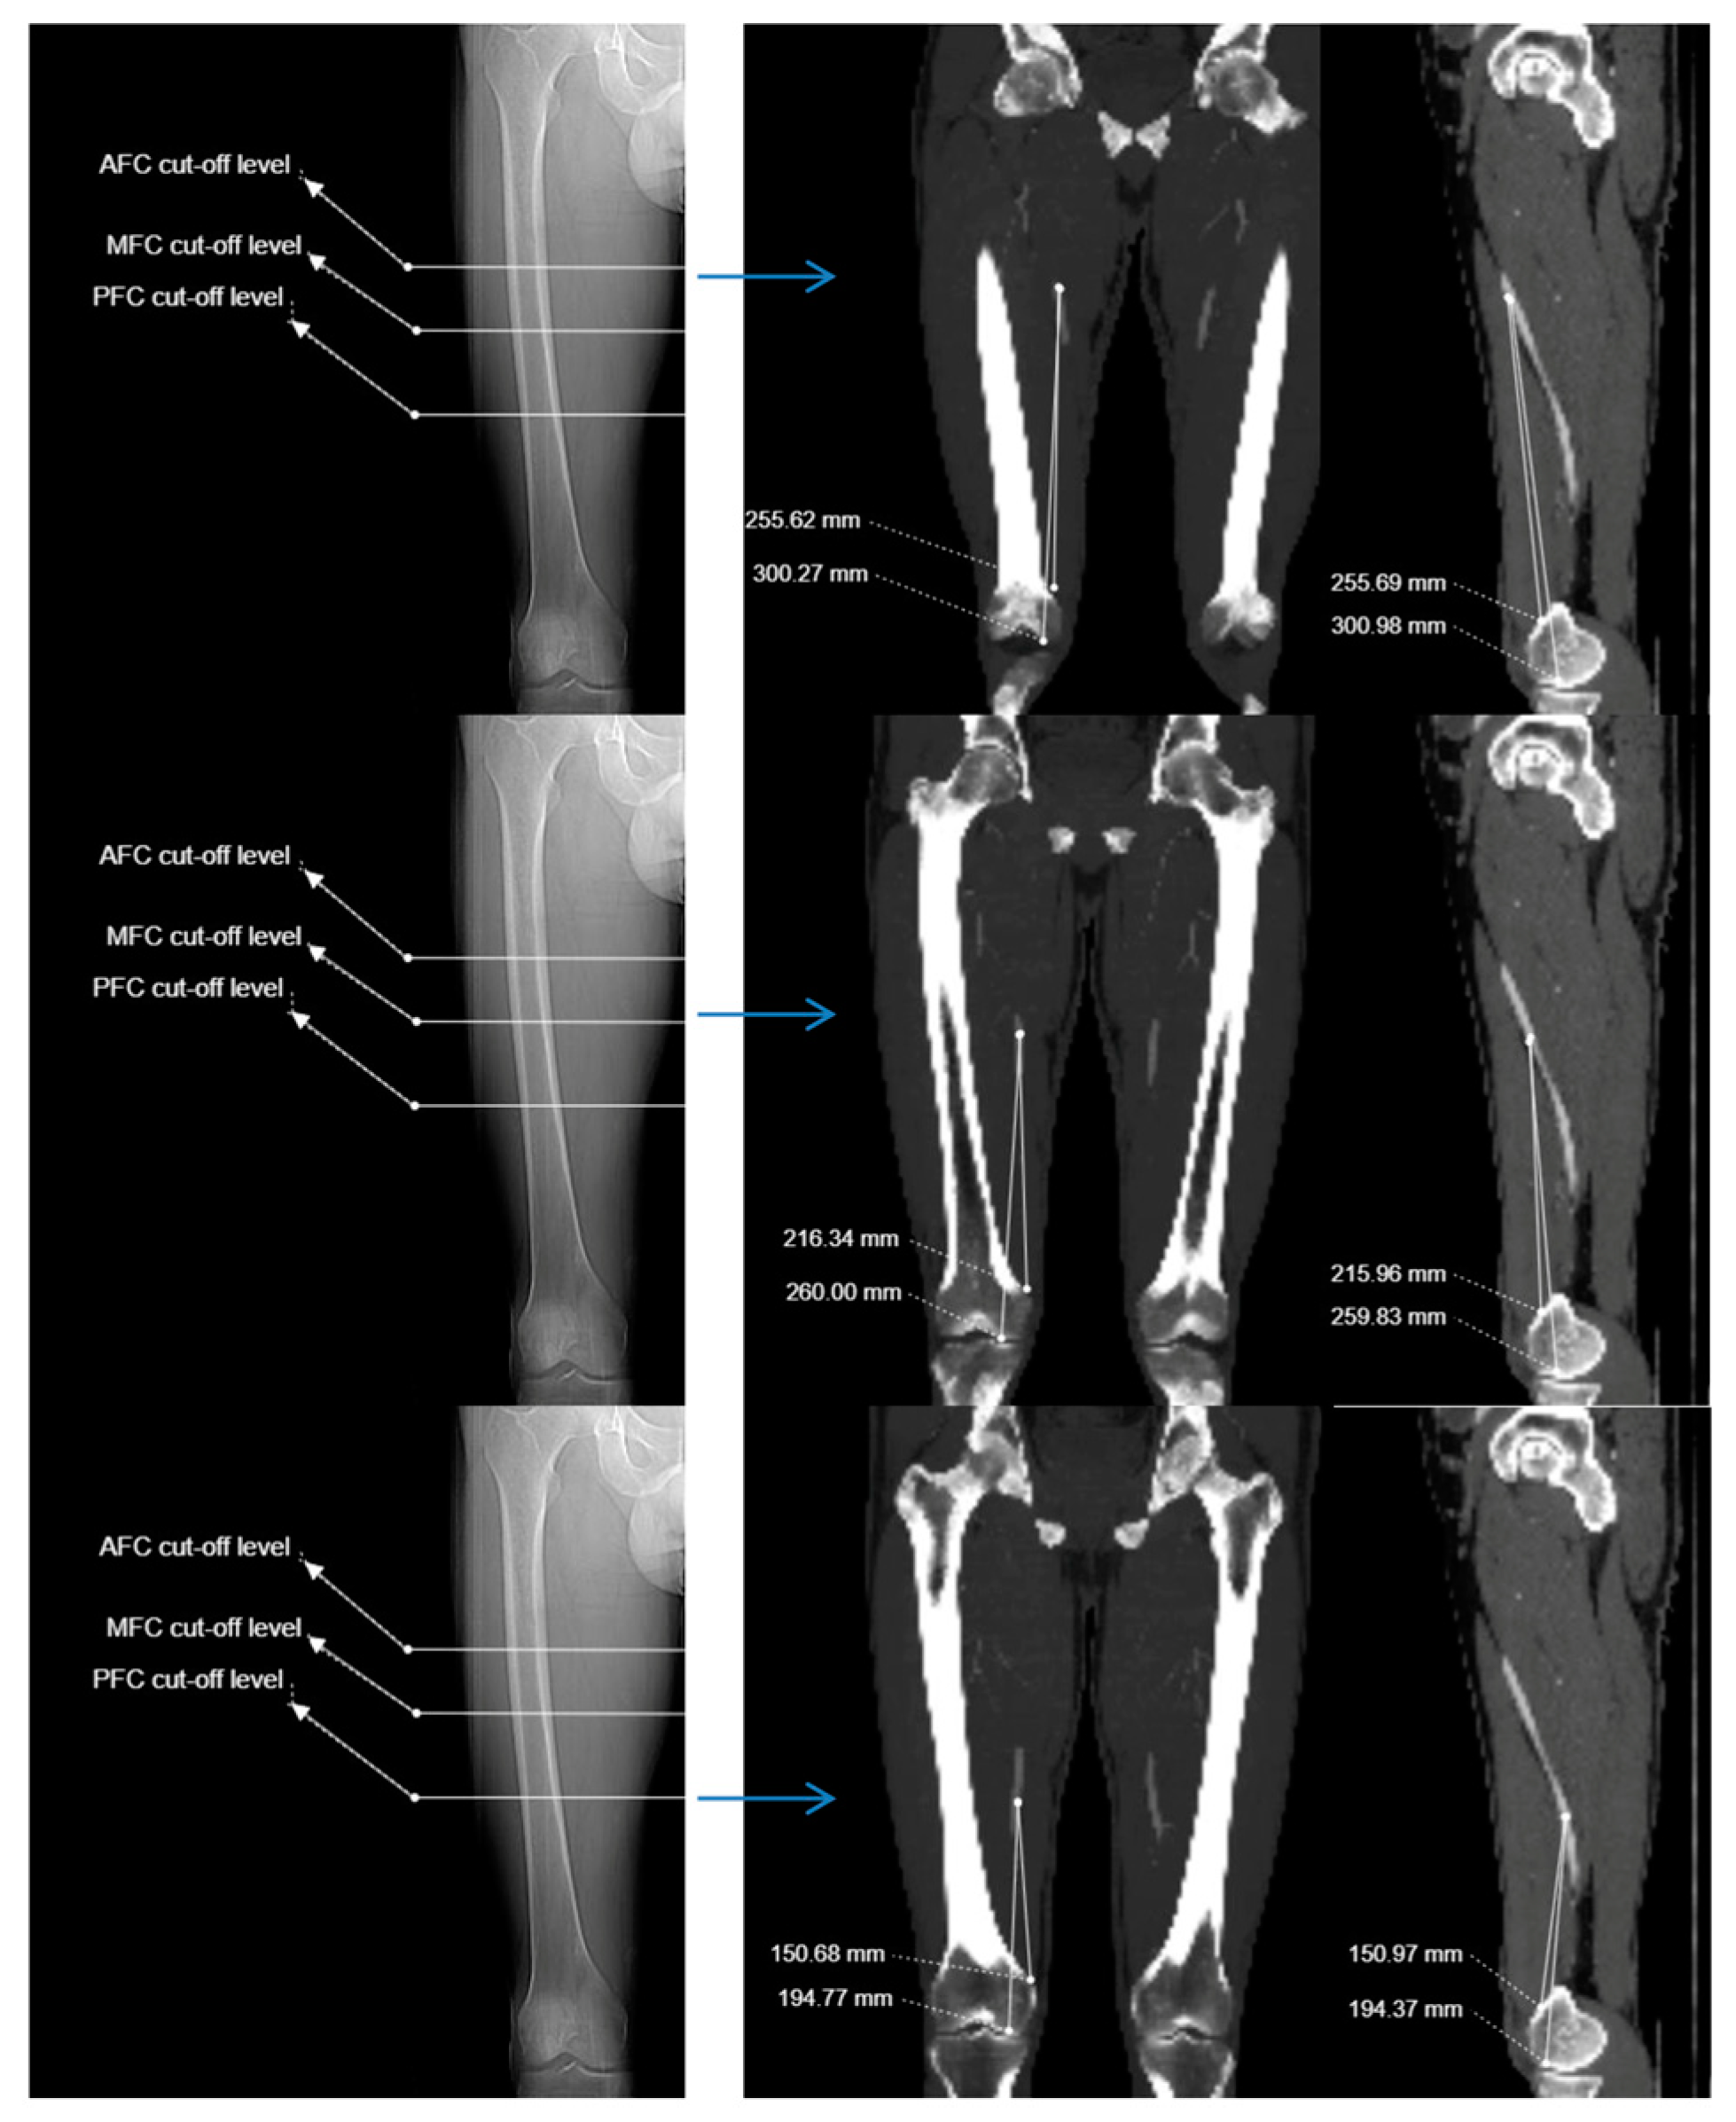

Table 1.
Demographic data and femur-related measurements in men and women.
| Variable | Female (N:70) Mean ± SD Min-Max |
Male (N:90) Mean ± SD Min-Max |
P value |
| Age (year) | 58.48 ± 13.73 (20.0 - 81.0) |
59.24 ± 13.72 (25.0 - 88.0) |
.729 |
| Femoral head neck angle (degree) | 21.21 ± 8.97 (3.2 - 39.1) |
20.99 ± 8.94 (1.4 - 39.6) |
.878 |
| Anteversion angle (degree) | 14.75 ± 6.56 (1.0 - 27.9) |
15.07 ± 6.92 (0.8 - 33.3) |
.769 |
| Angle of the SFA to the condylar line at the level of the AFC (degree) | 15.66 ± 4.25 (4.2 - 32.5) |
17.14 ± 5.10 (1.7 - 40.5) |
.349 |
| Angle of the SFA to the condylar line at the level of the PFC (degree) | -35.33 ± 10.16 (-55.7 - -10.3) |
-37.55 ± 12.09 (-79.2 - -18.0) |
.219 |
SD: Standard deviation , SFA: Superficial femoral artery , AFC: Anterior femoral cortex , PFC: Posterior femoral cortex.
Table 2.
Distance of the superficial femoral artery to anatomical reference points and angle relative to the femoral condylar line.
Table 2.
Distance of the superficial femoral artery to anatomical reference points and angle relative to the femoral condylar line.
| Anatomical reference level | Distance to AT (mm) Mean ± SD |
Distance to distal meidal condyle (mm) Mean ± SD | Distance to femoral cortex (mm) Mean ± SD |
Angle relative to condyles line (degree) Mean ± SD |
| Anterior femoral cortex | 223.01 ± 27.38 (156.3 - 293.8) |
265.04 ± 28.21 (207.0 -334.5) |
27.20 ± 5.32 (15.1 - 40.4) |
16.49 ± 9.94 (-9.7 - 40.5) |
| Midsagittal femoral cortex | 180.78 ± 26.83 (107.1 - 246.3) |
222.40 ± 27.65 (156.1 - 292.6) |
25.22 ± 5.52 (11.5 - 58.2) |
NA |
| Posterior femoral cortex | 128.01 ± 29.59 (54.1- 200.1) |
170.13 ± 29.96 (93.9 - 241.7) |
22.93 ± 6.04 (7.6 - 38.0) |
-36.58 ± 11.30 (-79.2 - -10.3) |
AT: Adductor tubercle , SD: Standard deviation, NA: Not applicable.
Table 3.
Comparison of anatomical reference points according to gender and right and let side (n=160).
Table 3.
Comparison of anatomical reference points according to gender and right and let side (n=160).
| Distance (mm) | Distance (mm) | |||||
| Anatomical reference | Female (N:70) Mean ± SD Min-Max |
Male (N:90) Mean ± SD Min-Max |
p-value | Left side (N:80) Mean ± SD Min-Max |
Right side (N:80) Mean ± SD Min-Max |
p-value |
| GT to AT distance | 353.09 ± 22.35 (314.1 - 400.9) |
393.05 ± 18.76 (347.6 - 443.1) |
.000 | 376.02 ± 28.54 (314.1 - 441.1) |
375.11 ± 28.53 (316.2 - 443.1) |
.841 |
| GT to DMC distance | 392.83 ± 22.48 (351.0 - 440.0) |
435.81 ± 19.53 (394.6 - 485.4) |
.000 | 417.75 ± 30.28 (351.0 - 485.4) |
416.26 ± 29.56 (353.0 - 480.1) |
.754 |
| Distance between SFA to AT at the level of AFC | 214.25 ± 25.93 (167.7 - 286.7) |
229.83 ± 26.65 (156.3 - 293.8) |
.000 | 220.72 ± 28.32 (156.3 - 282.3) |
225.3 ± 26.38 (177.4 - 293.8) |
.291 |
| Distance between SFA to DMC at the level of AFC | 253.99 ± 26.11 (207.1 - 333.1) |
272.59 ± 26.31 (207.5 - 330.7) |
.000 | 262.45 ± 28.77 (207.0 - 322.9) |
266.45 ± 26.68 (214.8 - 333.1) |
.363 |
| Distance between SFA to AT at the level of MFC | 177.31 ± 25.83 (134.9 - 246.3) |
183.49 ± 27.41 (107.1 - 238.4) |
.146 | 179.56 ± 28.35 (107.1 - 239.0) |
182.01 ± 25.33 (136.3 - 246.3) |
.567 |
| Distance between SFA to DMC at the level of MFC | 216.37 ± 26.7 (167.4 - 292.6) |
227.09 ± 27.62 (156.1 - 280.7) |
.014 | 221.26 ± 29.09 (156.1 - 280.7) |
223.54 ± 26.28 (174.1 - 292.6) |
.604 |
| Distance between SFA to AT at the level of PFC | 129.21 ± 29.28 (66.0- 200.0) |
127.08 ± 29.96 (54.1 - 182.7) |
.653 | 126.12 ± 30.55 (66.0 - 198.8) |
129.9 ± 28.66 (54.1 - 200.1) |
.422 |
| Distance between SFA to DMC at the level of PFC | 168.56 ± 29.67 (102.0 - 241.7) |
171.36 ± 30.29 (93.9 - 229.2) |
.559 | 168.37 ± 31.08 (102.0 - 234.6) |
171.90 ± 28.89 (93.9 - 241.7) |
.458 |
| Distance of SFA to femoral cortex at the level of AFC | 24.86 ± 4.24 (15.1 - 33.2) |
29.03 ± 5.38 (16.0 - 40.4) |
.000 | 26.36 ± 5.35 (15.1 - 38.5) |
28.05 ± 5.18 (16.6 - 40.4) |
.045 |
| Distance of SFA to femoral cortex at the level of MFC | 22.84 ± 4.51 (14.0 - 33.1) |
27.07 ± 5.55 (11.5 - 38.2) |
.000 | 24.02 ± 5.47 (11.5 - 38.2) |
26.42 ± 5.33 (13.6 - 37.8) |
.006 |
| Distance of SFA to femoral cortex at the level of PFC | 21.92 ± 5.01 (11.3 - 32.1) |
23.73 ± 6.66 (7.6 - 38.1) |
.051 | 22.07 ± 5.86 (10.5 - 35.5) |
23.80 ± 6.13 (7.6 - 38.1) |
.070 |
| SFA length between AFC and PFC levels | 85.04 ± 18.80 55.4-152.1) |
102.74 ± 15.84 (61.1-145.0) |
.000 | 94.59 ± 19.29 (55.4-152.1) |
95.40 ± 19.36 (57.4-143.9) |
.790 |
SD: Standard deviation , GT: Greater trochanter , AT: Adductor tubercle , DMC: Distal to the medial condyle , SFA: Superficial femoral artery, AFC: Anterior femoral cortex, MFC: Medial femoral cortex, PFC: Posterior femoral cortex.
Table 4.
Comparison of ratios created according to anatomical reference points according to gender, right and left side (N:160).
Table 4.
Comparison of ratios created according to anatomical reference points according to gender, right and left side (N:160).
| Ratio | Female (N:70) Mean ± SD Min-Max |
Male (N:90) Mean ± SD Min-Max |
P value | Left side(N:80) Mean ± SD Min-Max |
Right side(N:80) Mean ± SD Min-Max |
P value |
| Ratio 1 | 0.60 ± 0.05 (0.49 - 0.77) |
0.58 ± 0.06 (0.40 - 0.78) |
.021 | 0.58 ± 0.06 (0.40 - 0.78) |
0.60 ± 0.05 (0.46 - 0.77) |
.158 |
| Ratio 2 | 0.64 ± 0.05 (0.55 - 0.79) |
0.62 ± 0.05 (0.48 - 0.81) |
.014 | 0.62 ± 0.05 (0.48 - 0.81) |
0.64 ± 0.05 (0.52 - 0.79) |
.169 |
| Ratio 3 | 0.50 ± 0.05 (0.40 - 0.68) |
0.46 ± 0.06 (0.28 - 0.68) |
.000 | 0.47 ± 0.06 (0.28 - 0.68) |
0.48 ± 0.05 (0.36 - 0.68) |
.463 |
| Ratio 4 | 0.55 ± 0.05 (0.45 - 0.72) |
0.52 ± 0.05 (0.36 - 0.71) |
.001 | 0.53 ± 0.06 (0.36 - 0.71) |
0.53 ± 0.05 (0.42 - 0.72) |
.426 |
| Ratio 5 | 0.36 ± 0.07 (0.17 - 0.57) |
0.32 ± 0.07 (0.14 - 0.51) |
.000 | 0.33 ± 0.07 (0.17 - 0.55) |
0.34 ± 0.07 (0.14 - 0.57) |
.383 |
| Ratio 6 | 0.42 ± 0.07 (0.24 - 061) |
0.39 ± 0.06 (0.23 - 0.58) |
.001 | 0.40 ± 0.07 (0.24 - 059) |
0.41 ± 0.06 (0.23 - 0.61) |
.381 |
| Ratio 7 | 0.24 ± 0.04 (0.16-0.39) |
0.26 ± 0.04 (0.15-0.38) |
.004 | 0.25 ± 0.04 (0.16-0.39) |
0.25 ± 0.04 (0.15-0.38) |
.711 |
Ratio 1: Distance between SFA to AT at the level of AFC / GT to AT distance, Ratio 2: Distance between SFA to DMC at the level of AFC / GT to DMC distance, Ratio 3: Distance between SFA to AT at the level of MFC / GT to AT distance, Ratio 4: Distance between SFA to DMC at the level of MFC / GT to DMC distance, Ratio 5: Distance between SFA to AT at the level of PFC / GT to AT distance, Ratio 6: Distance between SFA to DMC at the level of PFC / GT to DMC distance, Ratio 7: SFA length between AFC and PFC levels / GT to AT distance. SD: Standard deviation , GT: Greater trochanter , AT: Adductor tubercle , DMC: Distal to the medial condyle , SFA: Superficial femoral artery, AFC: Anterior femoral cortex, MFC: Medial femoral cortex, PFC: Posterior femoral cortex.
Table 5.
At anatomical cut points; The relationship between the distance of SFA to the medial femoral cortex and adductor tubercle with femur lenght.
Table 5.
At anatomical cut points; The relationship between the distance of SFA to the medial femoral cortex and adductor tubercle with femur lenght.
| GT to AT distance (374.9 ± 30.2 mm) |
GT to DMC distance (417.0 ± 29.8 mm) |
|||||
| n | Distance (mm) | Pearson r | p | Pearson r | p | |
| Distance of SFA to femoral cortex at the level of AFC | 160 | 27.2 ± 5.3 | .288* | .000 | .276* | .000 |
| Distance of SFA to femoral cortex at the level of MFC | 160 | 25.2 ± 5.5 | .344* | .000 | .348* | .000 |
| Distance of SFA to femoral cortex at the level of PFC | 160 | 22.9 ± 6.0 | .294* | .000 | .304* | .000 |
| Distance between SFA to AT at the level of AFC | 160 | 223.0 ± 27.3 | .568* | .000 | .535* | .000 |
| Distance between SFA to AT at the level of MFC | 160 | 180.7 ± 26.8 | .464* | .000 | .437* | .000 |
| Distance between SFA to AT at the level of PFC | 160 | 128.0 ± 29.5 | .244* | .000 | .217* | .000 |
| SFA length between AFC and PFC levels | 160 | 94.9 ± 19.2 | .432* | .000 | .426* | .000 |
*Correlation is significant at the p<0.01 level. SFA: Superficial femoral artery, AFC: Anterior femoral cortex, MFC: Medial femoral cortex, PFC: Posterior femoral cortex, GT: Greater trochanter, AT: Adductor tubercle , DMC: Distal to the medial condyle.
Disclaimer/Publisher’s Note: The statements, opinions and data contained in all publications are solely those of the individual author(s) and contributor(s) and not of MDPI and/or the editor(s). MDPI and/or the editor(s) disclaim responsibility for any injury to people or property resulting from any ideas, methods, instructions or products referred to in the content. |
© 2025 by the authors. Licensee MDPI, Basel, Switzerland. This article is an open access article distributed under the terms and conditions of the Creative Commons Attribution (CC BY) license (http://creativecommons.org/licenses/by/4.0/).
Copyright: This open access article is published under a Creative Commons CC BY 4.0 license, which permit the free download, distribution, and reuse, provided that the author and preprint are cited in any reuse.


