Preprint
Article

This version is not peer-reviewed.

Synergistic Analysis of Habitat Quality and Urbanization Based on InVEST Modeling

Submitted:

02 February 2025

Posted:

03 February 2025

You are already at the latest version

Abstract

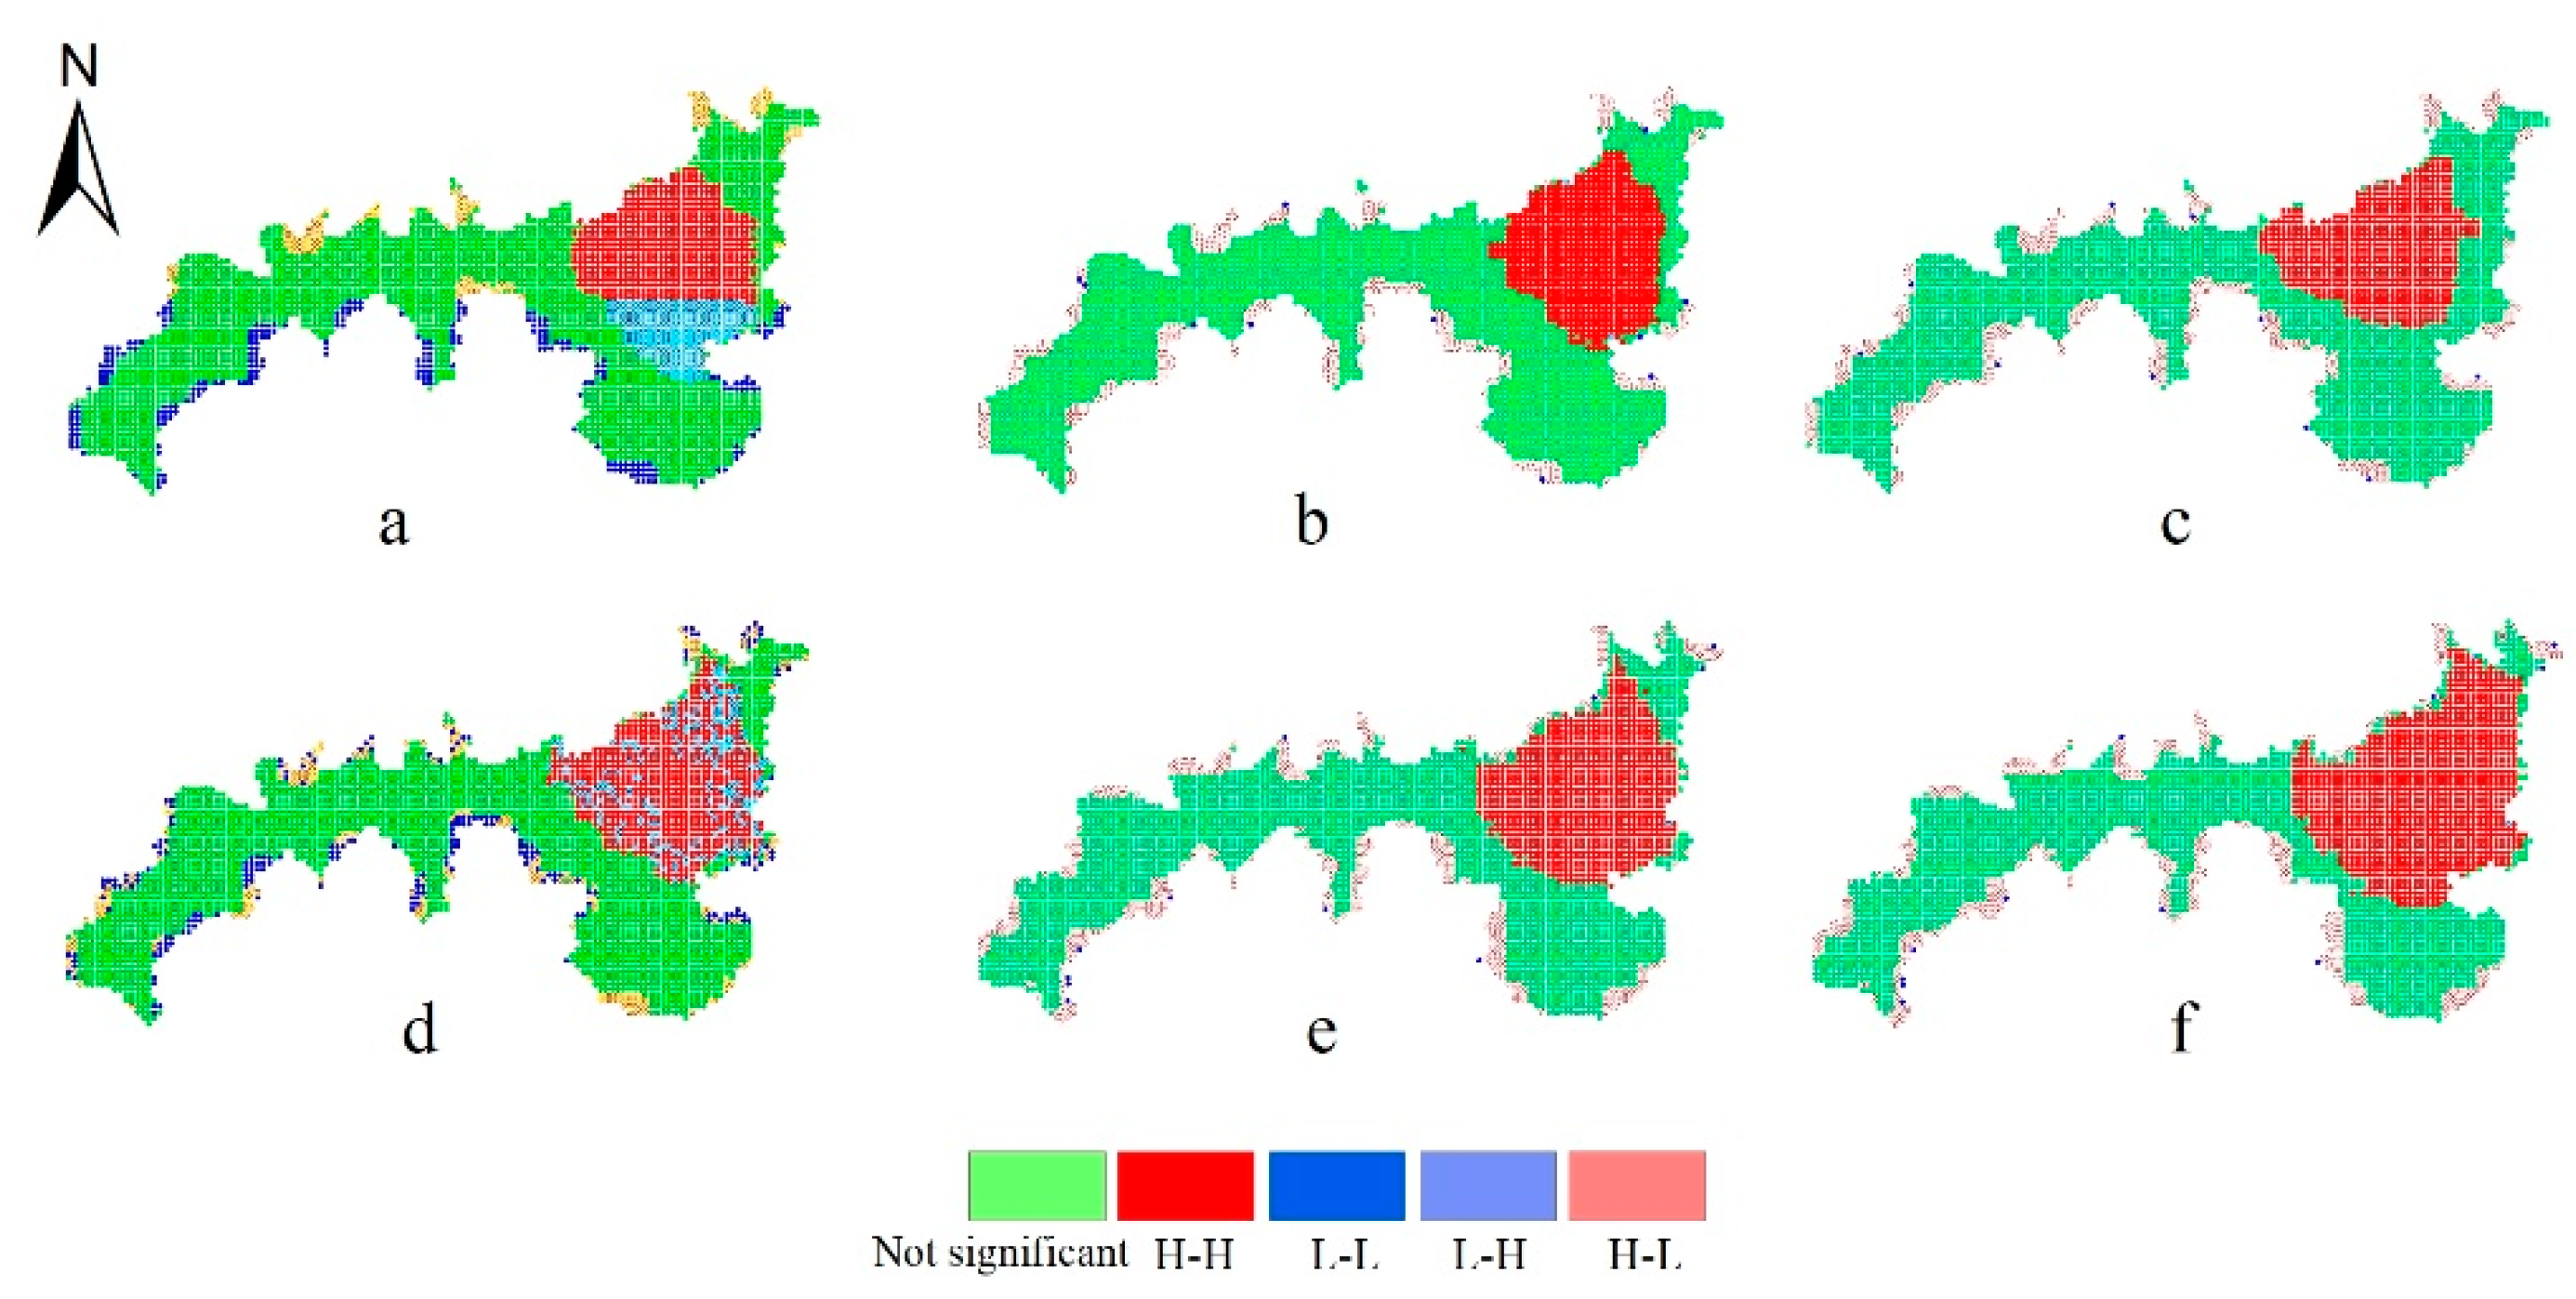
Since its completion in 214 BCE, the primary function of the Lingqu Canal has evolved from military transportation and irrigation to tourism. Today, with the advancement of urbanization, the canal’s functions have further diversified, giving rise to economic models such as "Agriculture + Tourism," "Water Conservancy + Tourism," and "Culture + Tourism." These developments have stimulated regional economic growth and enhanced the value of the Lingqu Canal as a cultural heritage site. However, due to high population density along both banks, complex production activities, lagging infrastructure development, and weak regulatory capacity, certain sections of the canal are experiencing significant sediment accumulation, water quality degradation, and ecosystem deterioration. The habitat quality along the canal is declining, placing the integrity of the Lingqu Canal itself at risk. Therefore, exploring the synergistic effects between urbanization and habitat quality—while also examining both the economic benefits and trends in habitat quality changes resulting from transformations in the canal’s functions—is crucial not only for its sustainable development but also for ensuring its long-term preservation and utilization as a World Cultural Heritage site. Based on land use data from 2000 to 2023 and utilizing the InVEST model, this study investigates the spatiotemporal evolution of habitat quality along the Lingqu Canal. Additionally, it analyzes the driving factors using the Geodetector model. A spatial autocorrelation analysis is conducted to explore how the functional diversification of the canal impacts economic development, ecological protection, and sustainable development. The findings are as follows: (1) The average habitat quality index along the Lingqu Canal increased from 0.63 in 2000 to 0.76 in 2023, reflecting a consistent annual increase with an average growth rate of 0.83%. This indicates significant ecological restoration efforts during this period. (2) The spatial variation in habitat quality along the canal between 2000 and 2023 results from multiple influencing factors, with changes in land use, precipitation levels, and population density identified as key determinants. (3) A strong correlation exists between habitat quality along the Lingqu Canal during this period and local Moran’s I index values, revealing high-high clusters predominantly located in urban centers in the eastern regions. This demonstrates notable spatial synergies, suggesting that the diversification of the canal’s functions has significantly facilitated the harmonious coexistence of ecological protection and local economic development, providing valuable insights for the sustainable development of global historical and cultural heritage

Keywords: 
;  ;  ;  ;  ;  

1. Introduction

Ecological changes and urbanization are significant factors affecting the sustainable development of cultural heritage [1]. While rapid urbanization has stimulated economic growth in the region, it has also led to an expansion of urban land use and the emergence of industrial chains [2], resulting in increased impervious surfaces, declining habitat quality, and reduced biodiversity within ecosystems surrounding cultural heritage sites [3]. These transformations pose considerable challenges to the conservation and sustainable development of cultural heritage. Consequently, long-term, accurate, and continuous monitoring of habitat quality and economic benefits associated with cultural heritage sites can provide heritage protection agencies with a scientific basis for implementing orderly measures for cultural heritage preservation. With advancements in earth observation technologies such as remote sensing, Geographic Information Systems (GIS), and Global Positioning System (GPS), along with the widespread application of remote sensing image data and innovative research methodologies, ecological models have been employed to quantify, assess, and simulate habitat quality on a large scale [4]. One widely utilized tool for ecological assessment is the InVEST model, which has been applied in several studies to evaluate habitat quality [5,6,7].
As a remarkable example of ancient Chinese water conservation engineering, the Lingqu Canal boasts a long history and significant cultural and economic value [8]. Since its completion in 214 BC, its primary functions have evolved from irrigation and military transportation to tourism. In response to urbanization, the canal's functions have diversified, giving rise to innovative economic models such as "agriculture + tourism," "water conservancy + tourism," and "culture + tourism." These models not only support regional economic development but also enhance the canal's cultural and economic significance, thereby elevating its value as a cultural heritage site. However, the Lingqu Canal faces numerous ecological and environmental challenges, including substantial domestic waste and sewage discharge, agricultural surface pollution, and unregulated industrial and mining wastewater emissions, among others. These issues are exacerbated by high population density, complex production activities, inadequate infrastructure, and weak regulatory capacity along the riverbanks. Consequently, these factors have led to serious silt buildup in some channels, loss of navigability, declining water quality, deteriorating aquatic ecology, reduced biodiversity, and even the potential destruction of the Lingqu Canal.
In addition to examining the economic benefits and trends in habitat quality changes resulting from the functional transformation of the Lingqu Canal, investigating the synergistic effects between urbanization and habitat quality is essential for ensuring the long-term preservation and sustainable use of the Lingqu Canal as a World Cultural Heritage site. This study identifies key driving factors by integrating the GeoDetector model with the InVEST model to evaluate the spatial and temporal variations in habitat quality along the Lingqu Canal from 2000 to 2023. Furthermore, the impacts of cultural heritage's functional diversification on economic growth, ecological preservation, and sustainable development are comprehensively analyzed using spatial autocorrelation analysis, aiming to develop a rational and scientific approach to coordinated development.

2. Materials and Methods
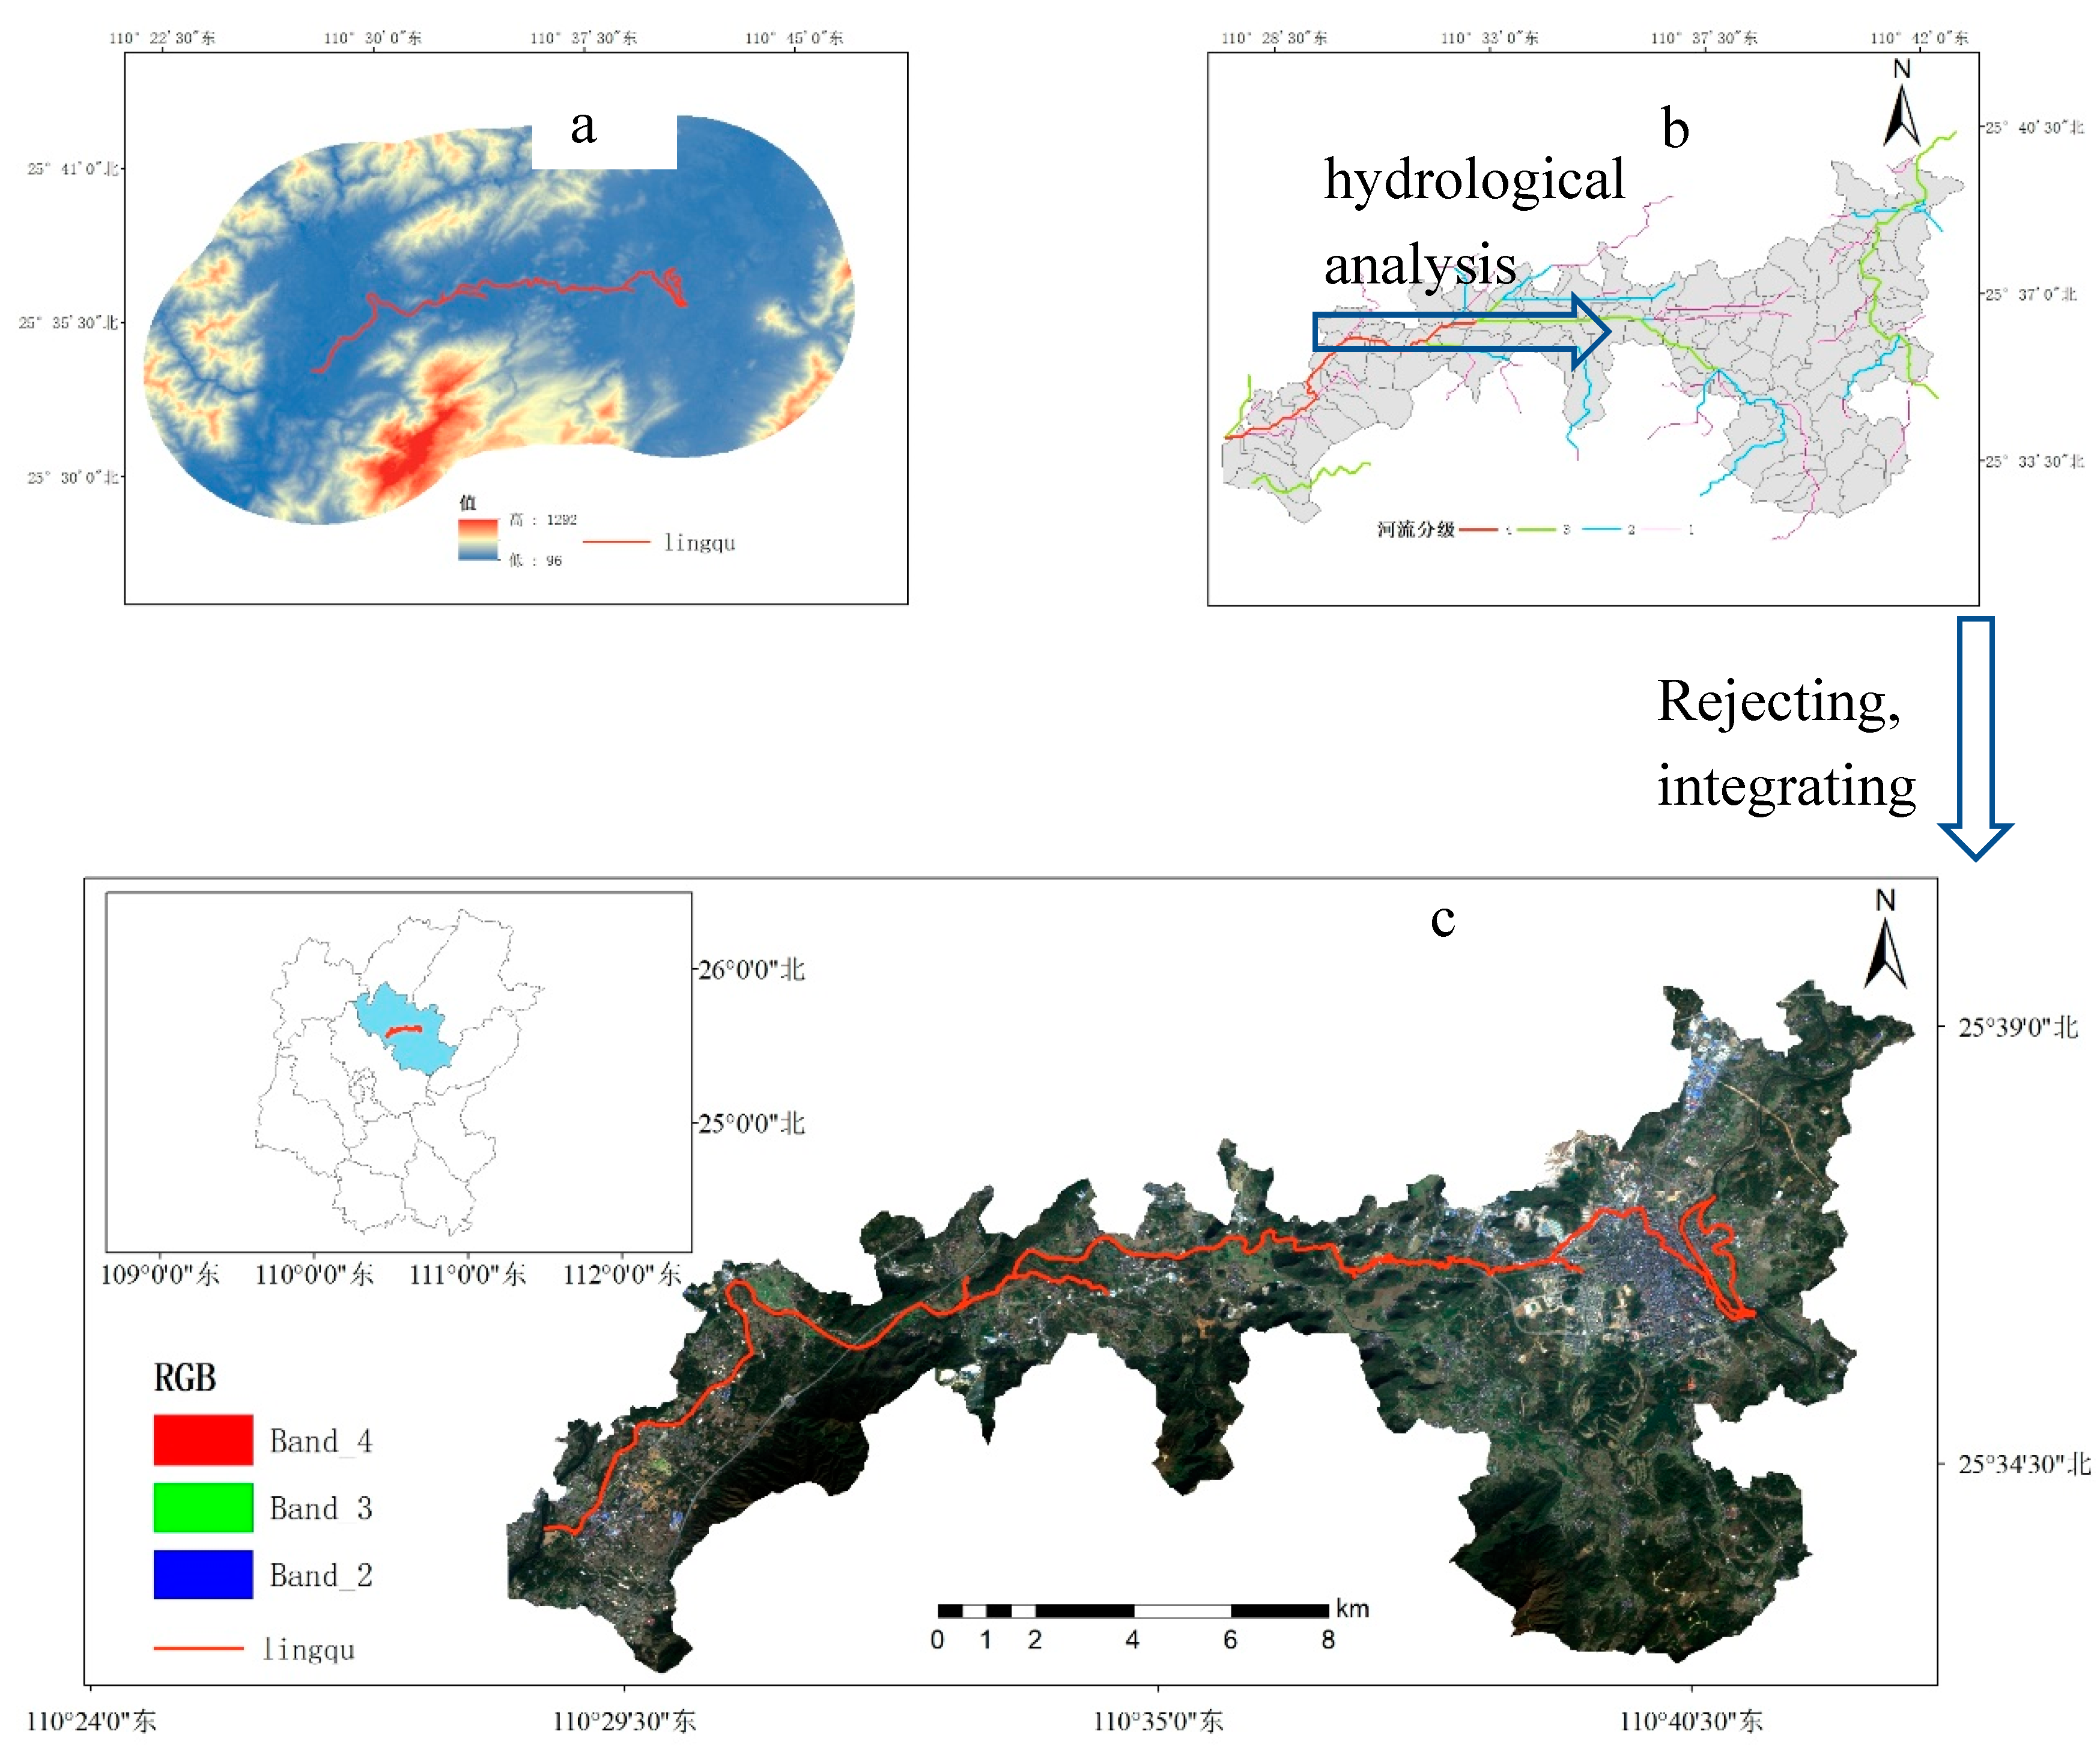
2.1. Study Area

Located in Xing'an County, Guangxi Zhuang Autonomous Region, the Lingqu Canal, also known historically as Qin chiseled canal, zero canal, steep river, Xing'an Canal, and Xianggui Canal, is a monumental engineering feat created by ancient Chinese laborers. This canal stretches from east to west, connecting the Xiangjiang River and the Li River, thereby linking the north-south waterways and integrating the Yangtze River and Pearl River systems into a comprehensive transportation network spanning East and South China. As a critical hub, the Lingqu Canal not only facilitates communication between Guilin and the outside world but also preserves a wealth of historical sites and cultural relics from various periods due to its long history. The watershed lies between 110°22′E to 110°38′E and 25°09′N to 25°37′N, covering a total length of approximately 37 kilometers. Due to data availability and research requirements, this study employs ArcGIS software's hydrological analysis tools to delineate the study area along the Lingqu Canal using DEM data and vector files of the canal (Figure 1).

2.2. Materials

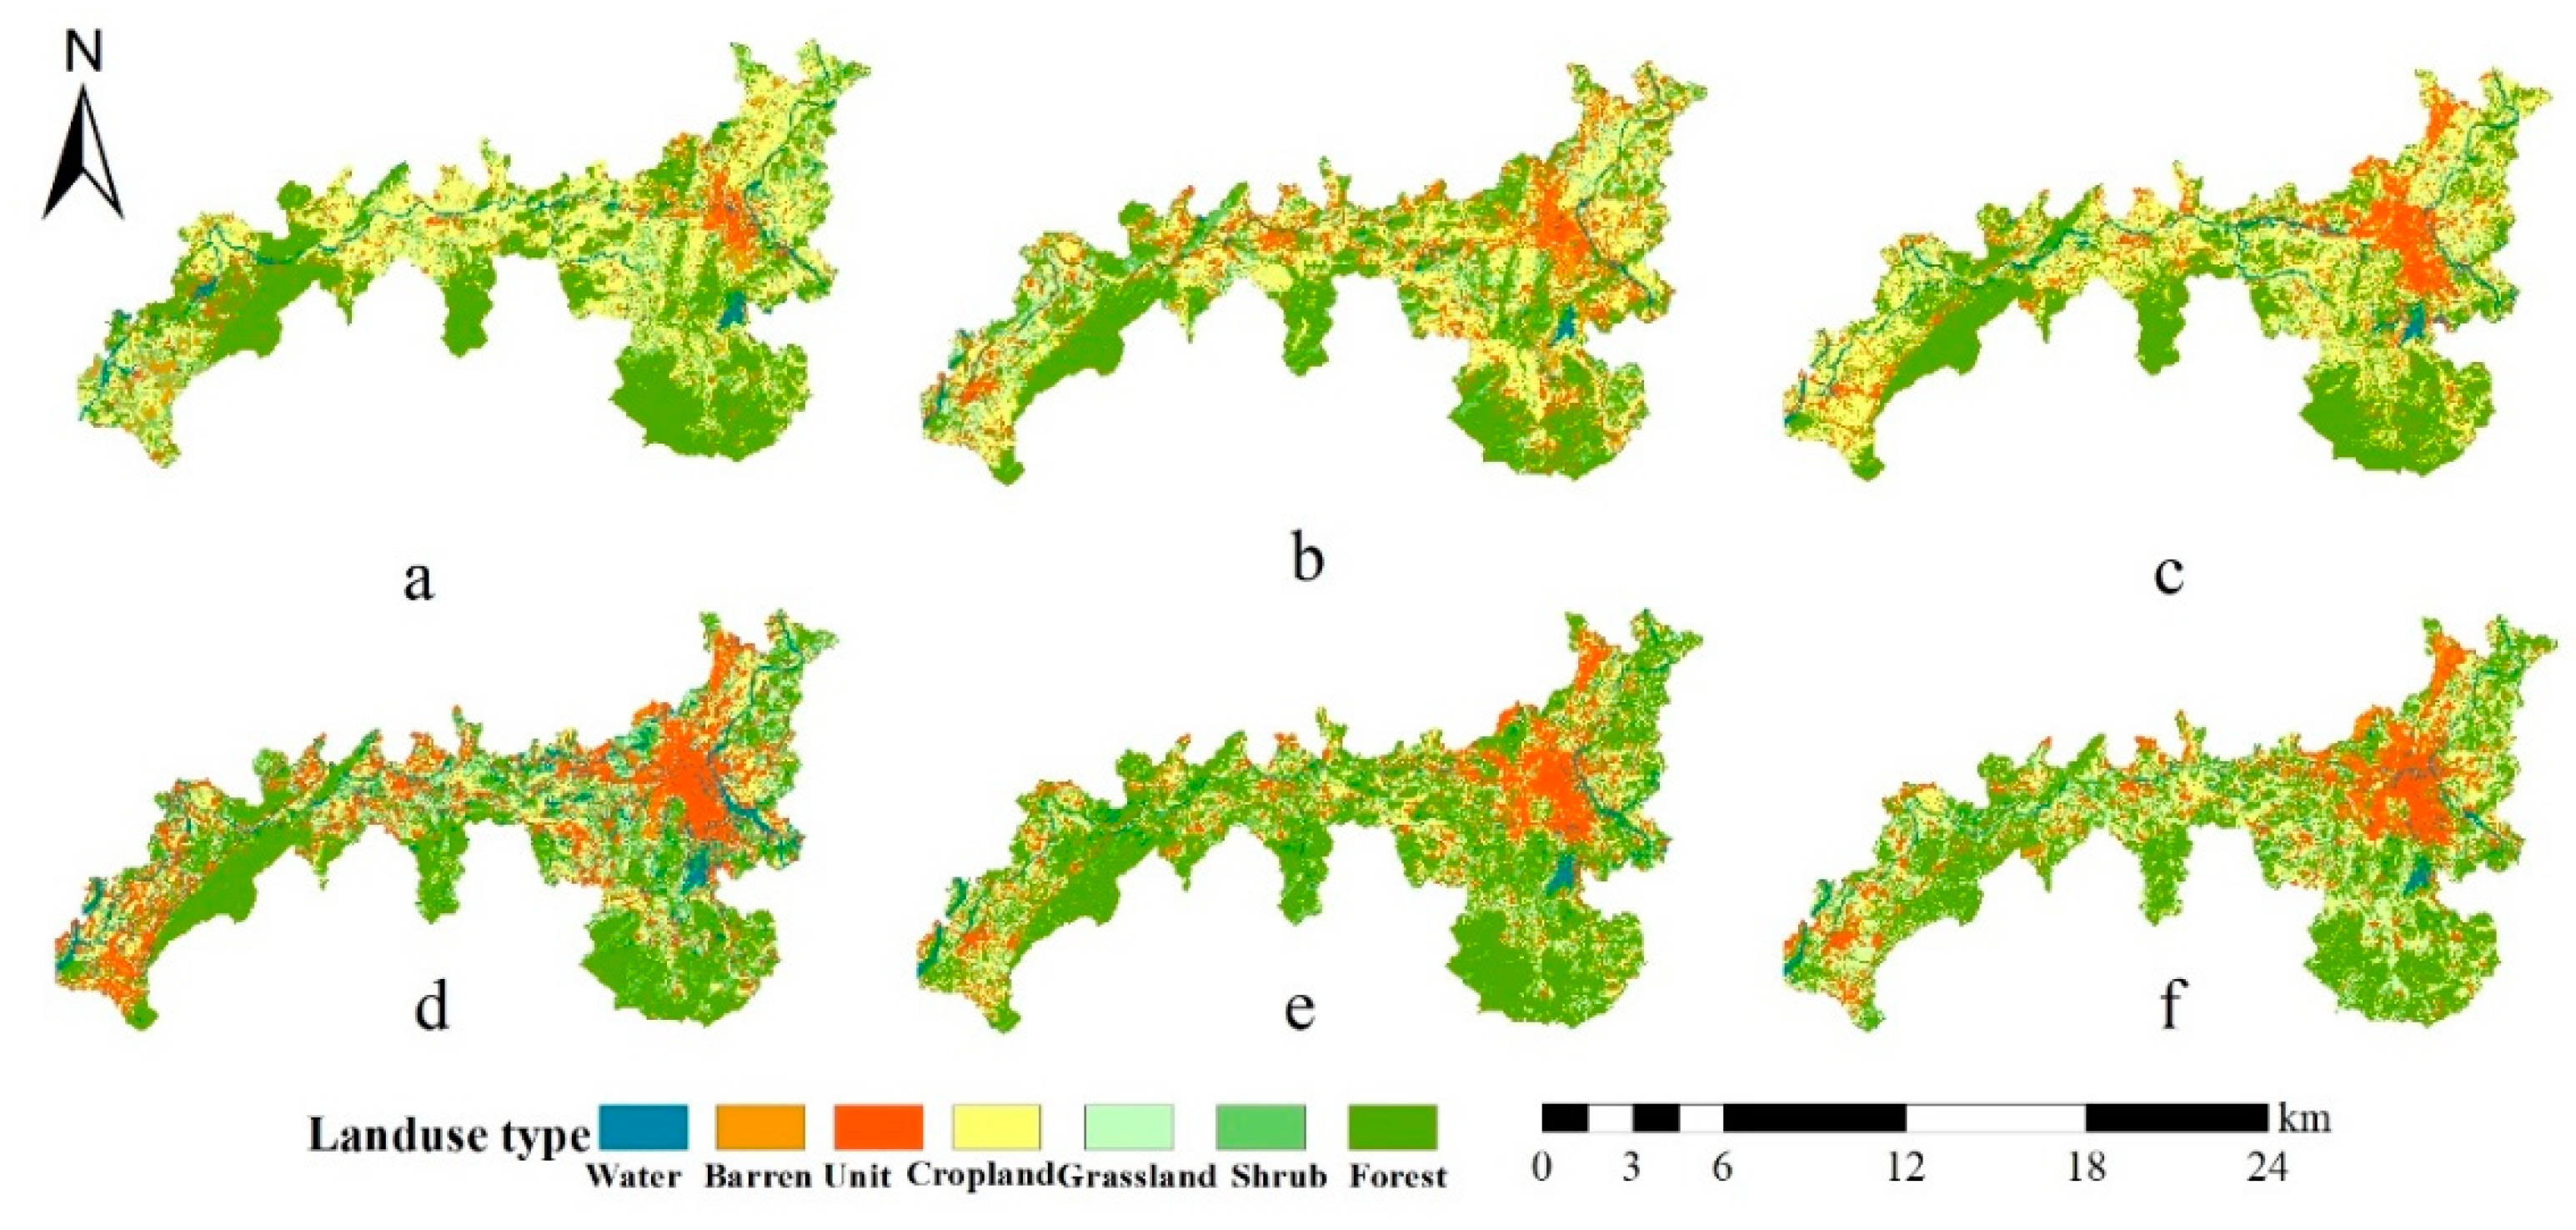
2.2.1. Land Use and Cover Change Dataset

The primary data source for this paper is a combination of multiple sources, including Senti-nel-2 remote sensing photos and Landsat series satellite images. The satellite image data includes six scenes and spans the years 2000–2023. The image data from October to December were chosen since the Lingqu Canal is situated in southern China, where gloomy and rainy weather occurs more frequently. The random forest technique [9,10,11,12,13,14,15,16] was utilized to categorize the land use kinds in conjunction with the present land use conditions along the Lingqu and the study requirements. A spatio-temporal dataset of land use along the Lingqu Canal from 2000 to 2023 was created by classifying the land use into seven categories: forested land, shrubs, grassland, building land, cropland, water, and barren ground (Figure 2). The six-phase pictures were classified with an overall accuracy of over 85% and a Kappa coefficient of over 0.8, meeting the accuracy standards for data processing and analysis.

2.2.2. Auxiliary data

Supporting information includes the following: digital elevation model (spatial resolution of 30m), rainfall and temperature data from 2000–2023, road data from 2000–2023, nighttime lighting data from 2000–2023, vector boundary data along the Lingqu Canal, and the socioeconomic statistical yearbook of Xing’an County from 2000–2023.

3. Method and Results

To investigate the driving factors influencing the spatial differentiation of habitat quality through the Geodetector model, the following factors were chosen: GDP, population density, nighttime light index, land use change, average annual temperature, average annual rainfall, slope, and elevation. Then, using the InVEST model, the spatial and temporal evolution characteristics of the habitat quality along the Spirit Canal were examined using land use data from six periods from 2000 to 203. Finally, the effects of the Lingqu Canal's functional diversification on economic development, ecological protection, and sustainable development were thoroughly examined.

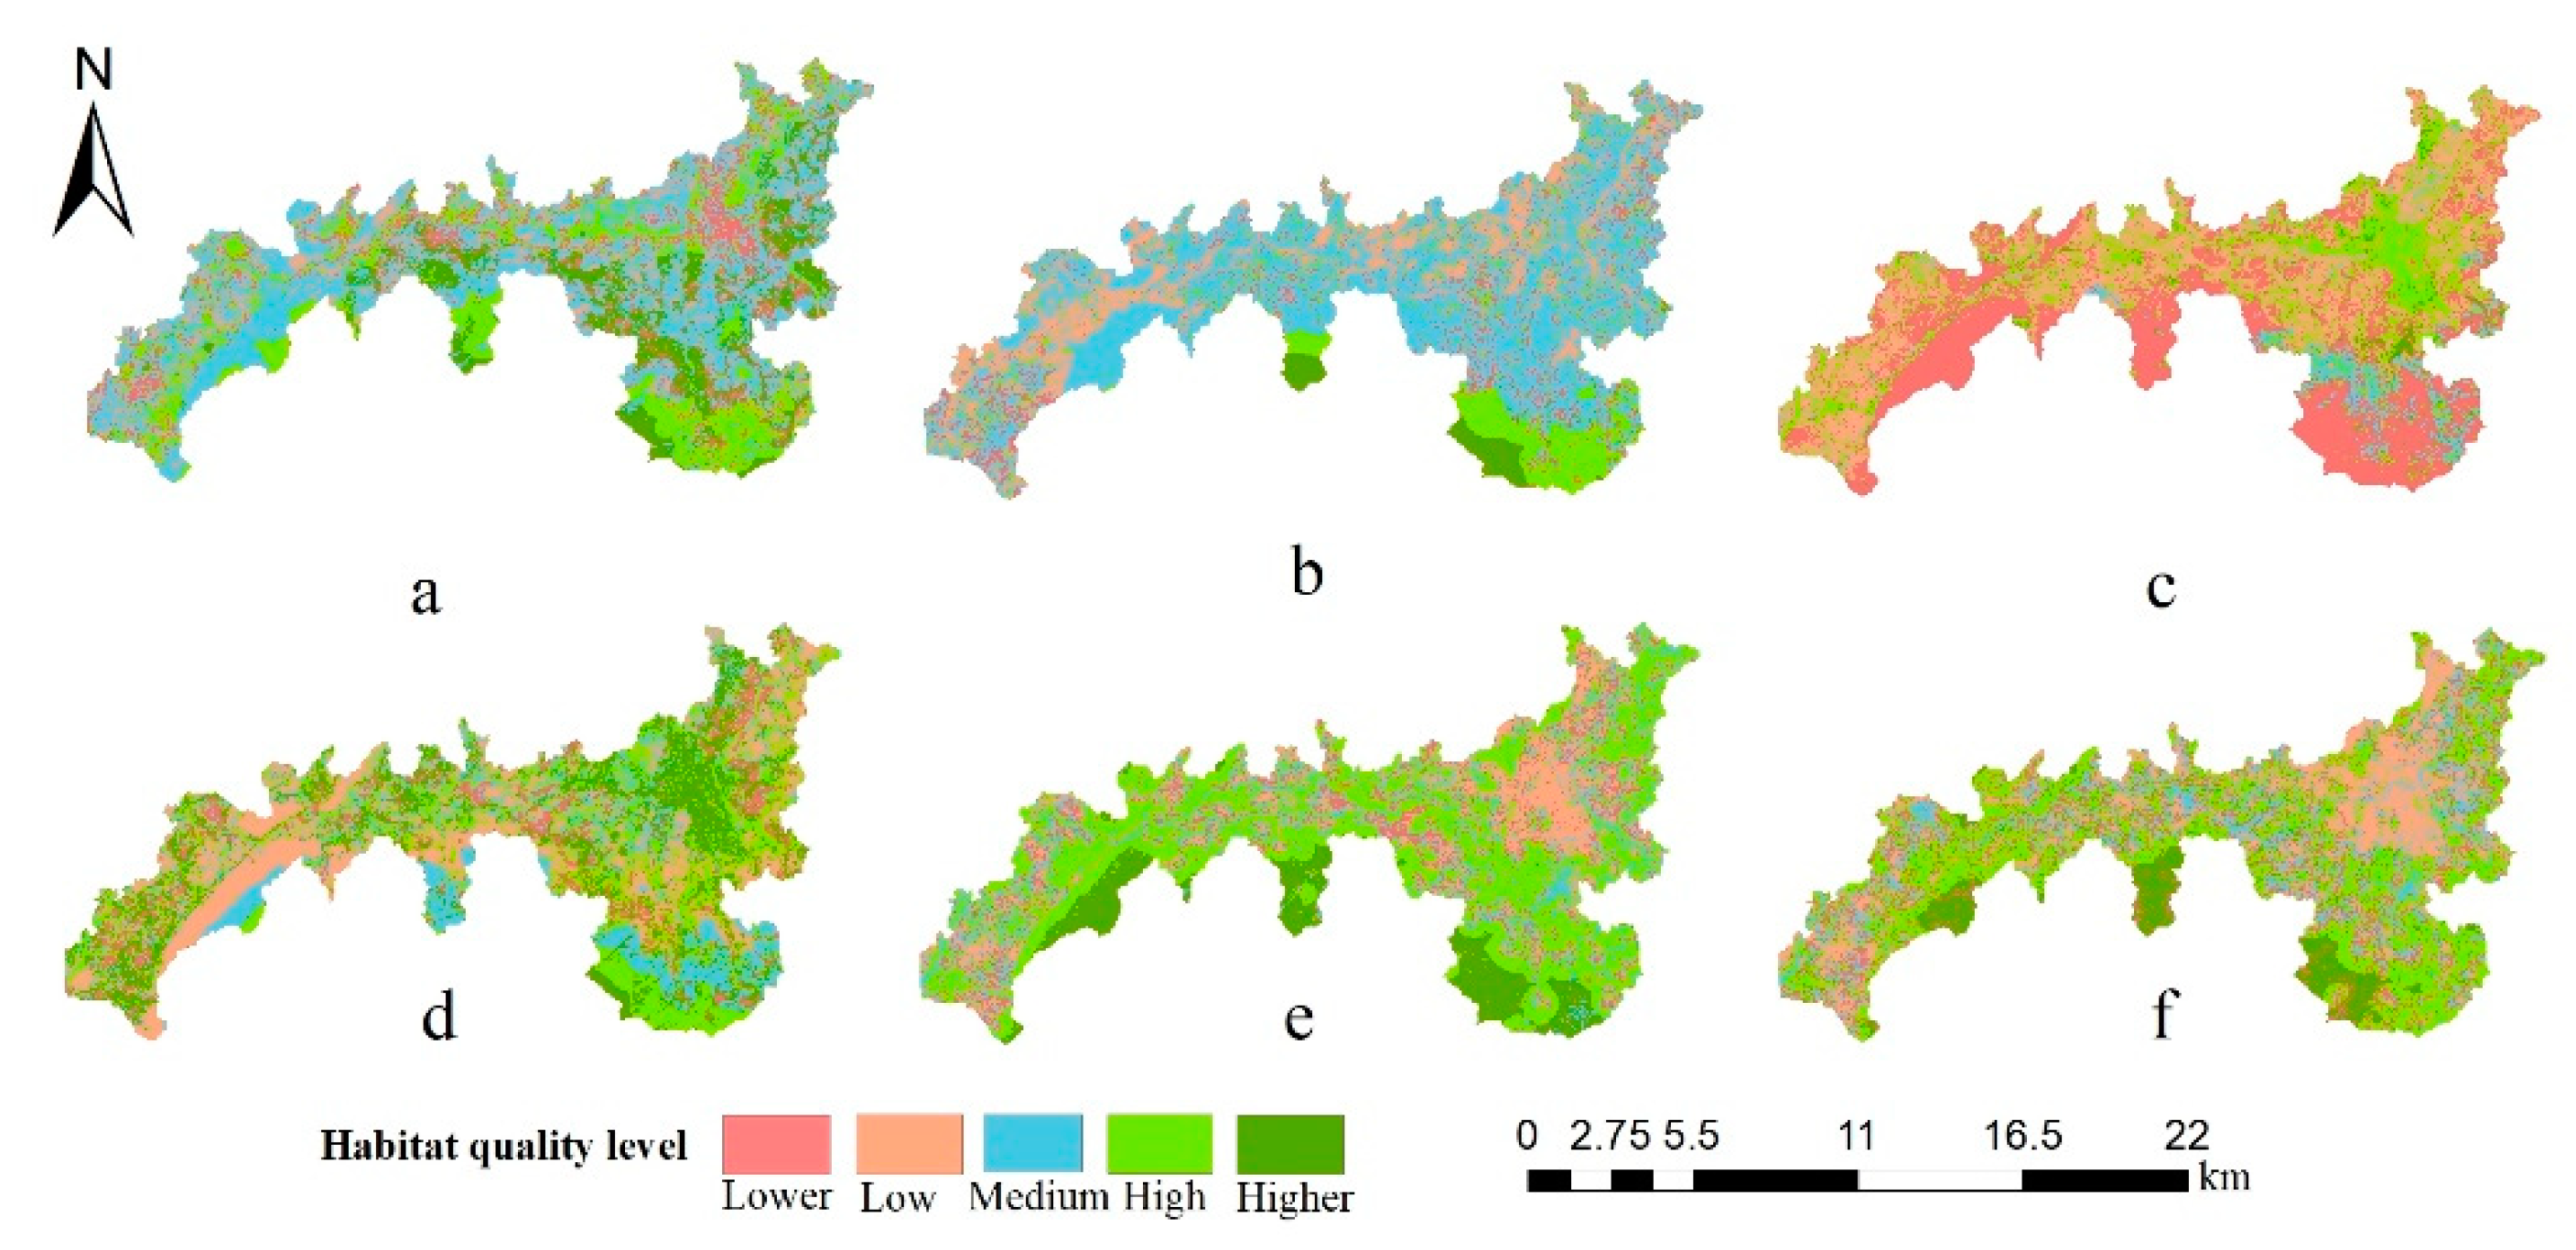
3.1. Habitat quality and ecological pattern analysis based on InVEST modeling

This paper uses the Habitat Quality module in the InVEST model to evaluate the habitat quality along the Lingqu Canal based on the spatiotemporal land use dataset and road network data that were produced and collected in the previous period. It then determines the habitat quality's spatiotemporal distribution along the canal (Figure 3) and the changes in the area and percentage of different grades of habitat quality from 2000 to 2023 (Table 4), thereby revealing its spatial and temporal distribution characteristics.
The model is as follows [17]:
Q x j = H j 1 D x j z D x j z + K 2
Where   Q x j is the habitat quality;   H j is the degree of habitat suitability of the jth landscape type; K denotes the half-saturation constant; z denotes the normalization constant;   D x j is the degree of habitat degradation.
The analysis of the changes in land use types along the Lingqu Canal, which were primarily disrupted by engineering activities including illegal house building, scaffolding, and occupying land, was done with the help of relevant specialists and research expertise. Because of this, this research considers cultivated land, man-made surfaces, barren terrain, and highways—all of which are strongly associated with human activities—as potential sources of harm. The weights, maximum impact distances, and degradation types of each type of threat source were established (Table 1), and the corresponding threat factor layers were extracted. These were based on the InVEST model's user manual, the research findings of Feng Tang and other scholars [18], and the actual conditions of the study area along the Lingqu Canal. Additionally, the relative sensitivity of various land classes to threat variables and the suitability of their habitats were ascertained (Table 2).
Using the InVEST model, we calculated the Habitat quality along the Lingqu Canal from 2000 to 2023 and categorized it into five equal intervals: low (0-0.2), lower (0.2-0.4), medium (0.4-0.6), high (0.6-0.8), and excellent (0.8-1).
As shown in Figure 3, the spatial distribution pattern of different levels of habitat quality along the Lingqu Canal from 2000 to 2023 is heterogeneous. Low-level habitat quality is mainly distributed around townships in areas with intensive human activities, with a small amount of distribution in other areas, and the land use type of this type of area is dominated by construction land. Medium habitat quality is mainly distributed in agricultural production areas along the Lingqu, where habitat quality is more seriously degraded and land use types are dominated by cropland; high habitat quality has the widest distribution and is concentrated in land use types dominated by woodland and grassland, where the natural ecological environment is stable and less disturbed by human activities.
The average habitat quality index along the Lingqu Canal increased from 0.63 to 0.76 between 2000 and 2023, indicating an increasing trend year by year with an average annual growth rate of 0.83%. This increased habitat quality along the Lingqu Canal was statistically analyzed to investigate habitat degradation (Table 3). The area of superior and high habitat quality increased from 48.63 km2 to 68.36 km2, and its area proportion increased by 14.29%; the area of relatively low and low habitat quality increased from 29.16 km2 to 47.84 km2, and its area proportion increased by 13.54%; and the area of medium habitat quality declined from 60.21 km2 to 21.80 km2, and its area proportion decreased by 27.8%, compared to the previous year. Overall habitat quality along the Lingqu Canal was at an upper-middle level during the study period, and it showed an upward trend annually. This suggests that several ecological protection measures have been successful since Guilin was granted permission to construct a national sustainable development agenda innovation demonstration zone in 2018.

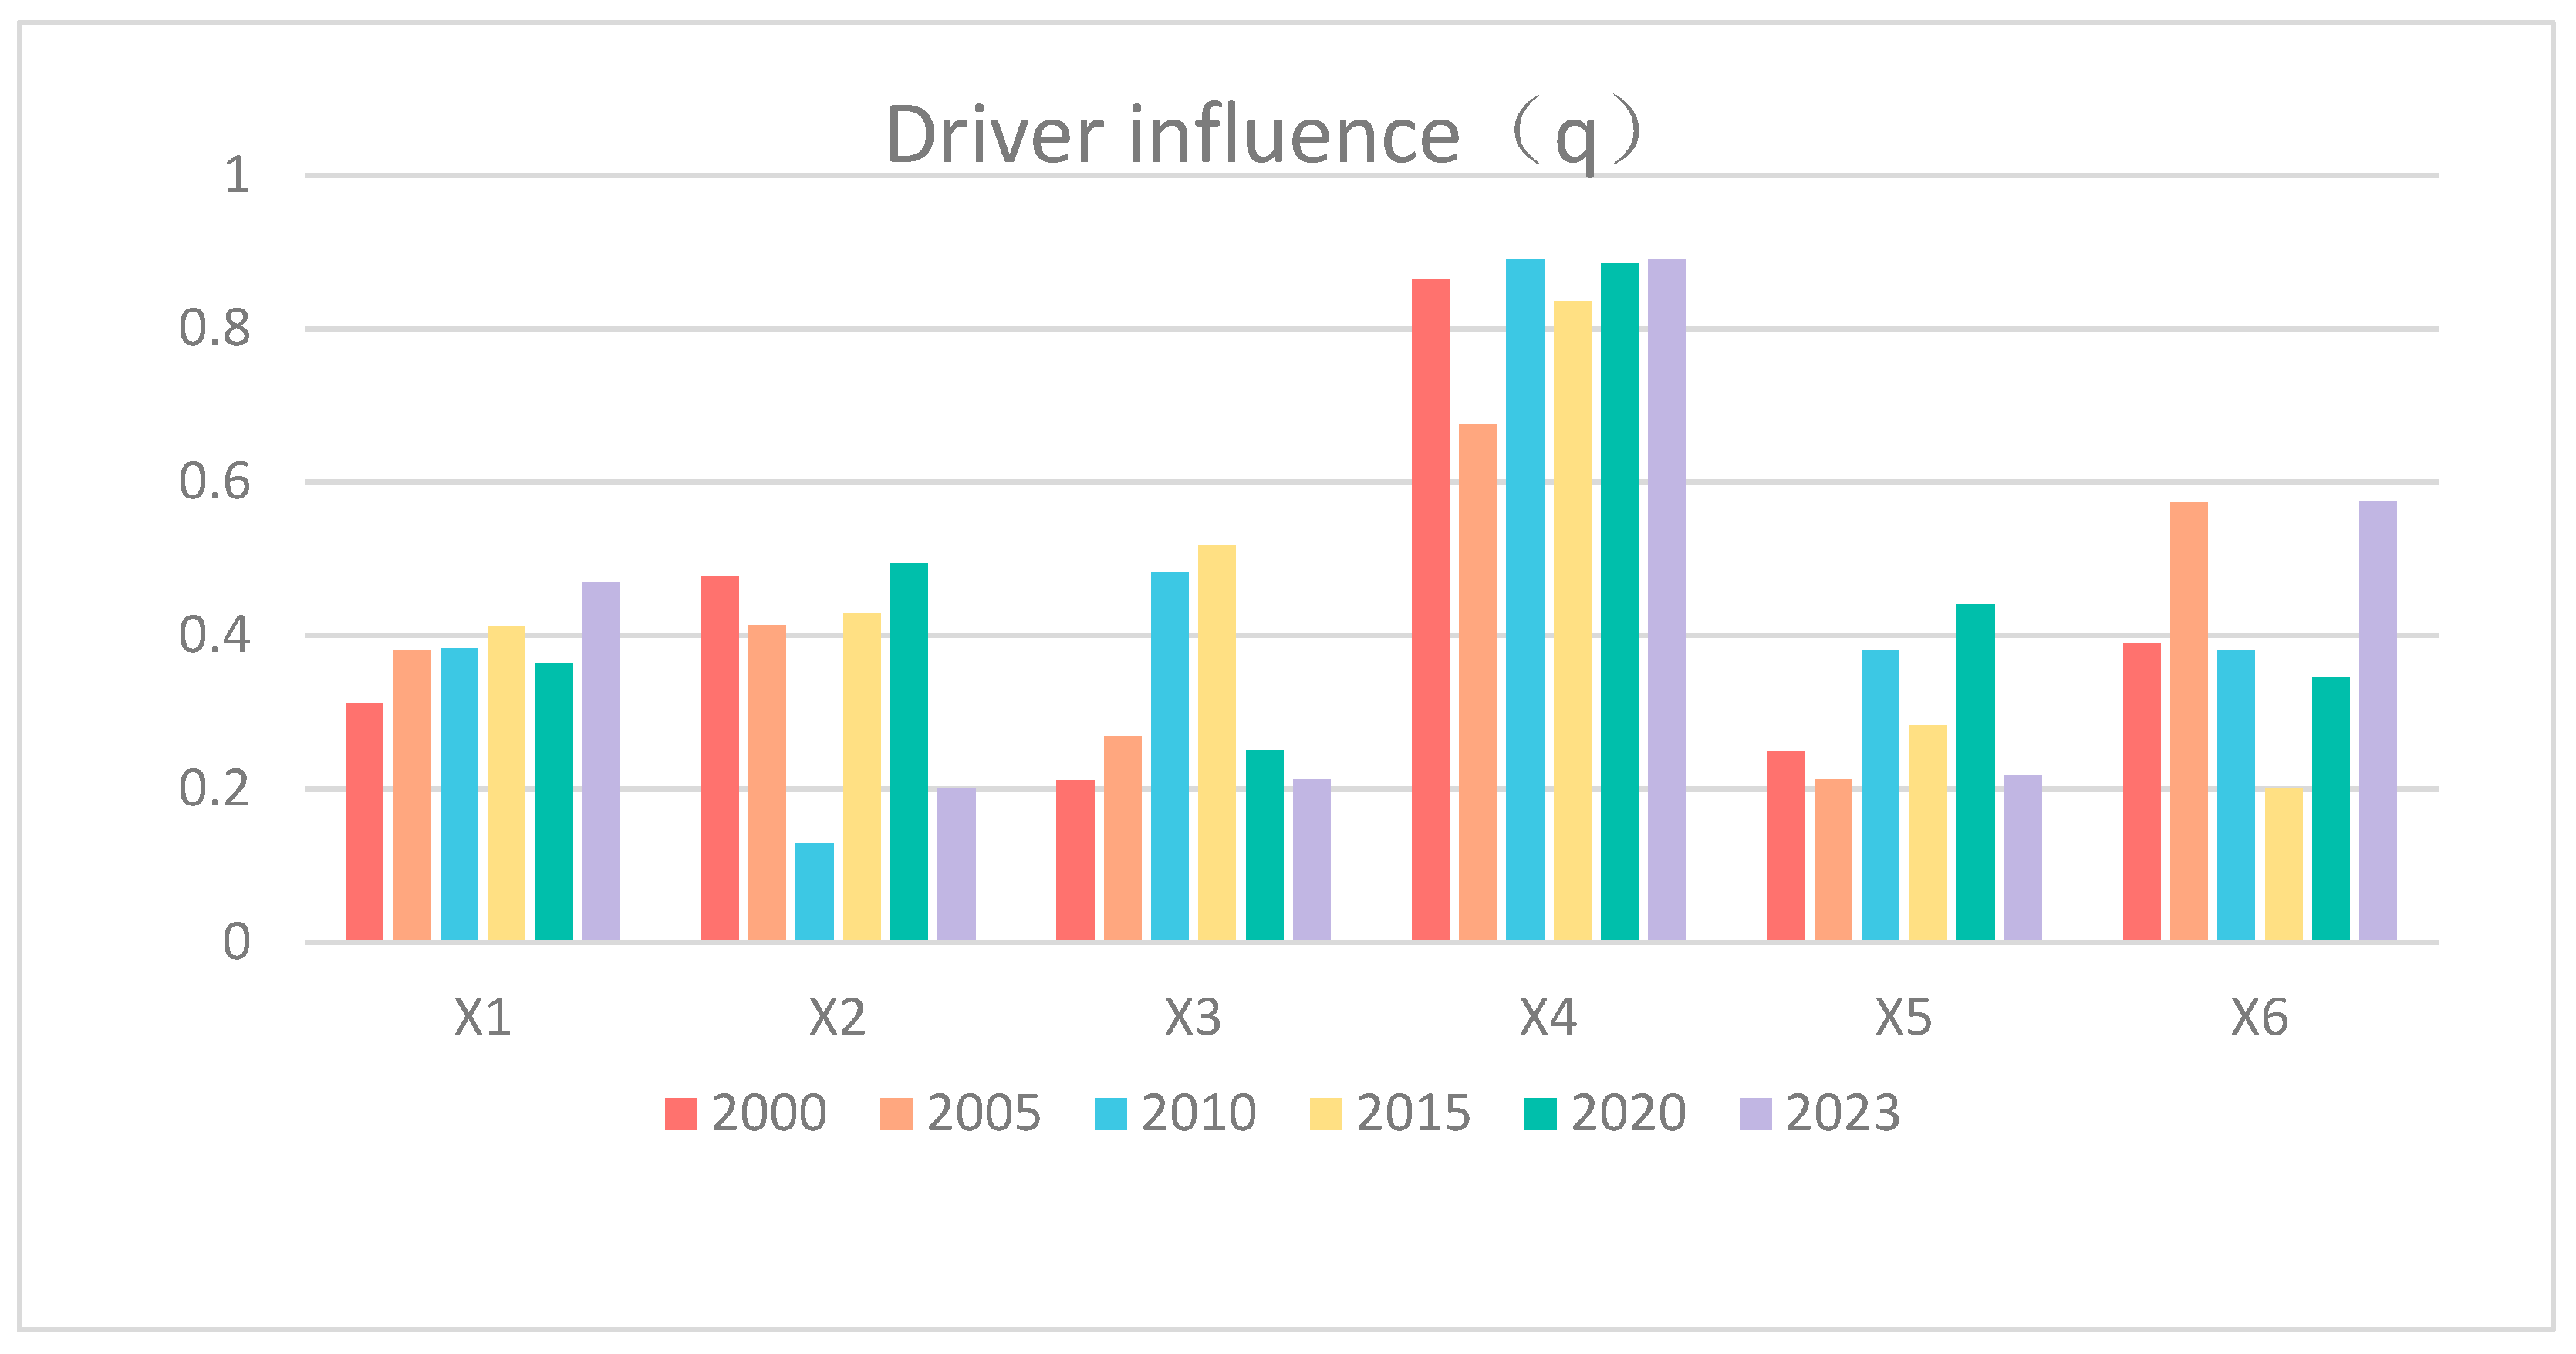
3.2. Driver analysis

This paper uses the GeoDetector model [19] to evaluate the drivers of habitat quality changes along the Lingqu Canal to further quantify these factors. This paper identified four natural factors (slope, elevation, average annual temperature, and average annual precipitation) and four social factors (GDP, population density, nighttime light index, and land use type) as the primary drivers in the context of the actual situation along the Lingqu Canal, as indicated in Table 4, based on the research findings of Pan, Z, and other scholars [20,21,22,23].
The results obtained are shown in Figure 4, from which it can be seen that in 2000, the main drivers were, in order of influence, land use change, average annual rainfall, and population density. By 2005, mean annual rainfall outweighed land use change, followed by elevation. In 2010, land use change outweighed mean annual rainfall and nighttime lighting in terms of influence. In 2015, land use change outweighed nighttime lighting and population density in terms of influence on habitat quality. In 2020, land use change outweighed mean annual rainfall and mean annual temperature in terms of influence on habitat quality. By 2023, land use change will influence habitat quality more than average annual temperature and average annual rainfall.
Between 2000 and 2023, the dominant factor, land use change, had an explanatory power of 0.839 on the change in habitat quality along the Lingqu Canal. The secondary drivers, mean annual rainfall and population density, had explanatory powers of 0.079 and 0.064, respectively, while the GDP and slope had the lowest explanatory powers, at 0.018 and 0.016, respectively. All things considered, social influences had a much bigger impact on the habitat quality along the Spirit Canal than did natural causes.3.3. Analysis of the Sustainable Development of Lingqu Canal under Functional Diversification.
To explore the synergistic effect between urbanization and habitat quality along the Lingqu Canal and to investigate the economic benefits and the trend of habitat quality changes brought about by the functional transformation of the Lingqu Canal. In this paper, the bivariate Moran's I index and bivariate localized Moran's I index are used to quantify the spatial effects of economic activities on the environment. By analyzing the spatial autocorrelation [24], especially the variable relationship between different geographic locations and neighboring regions, we reveal the degree of impact of economic development on the ecological environment during the process of urbanization, to provide a scientific basis for realizing the ecological protection and sustainable development of urbanization along the Lingqu Canal.
Figure 5 displays the local Moran's I index clustering of urbanization and habitat quality along the Lingqu Canal from 2000 to 2023. The figure's high-high clustering of economic income and habitat quality in 2000, 2005, 2010, 2020, and 2023 is primarily located in the east-town center, with respective Moran's I values of 0.021, 0.065, 0.075, 0.095, 0.101, and 0.105, and a significant p-value of less than 0.05. It shows that between 2000 and 2023, functional diversification supports the long-term growth of ecological protection and economic income of the Lingqu Canal. It also exhibits a clear spatial synergy, meaning that improving habitat quality in localized areas boosts the local economy, and the spatial relationship between habitat quality and economic income grows stronger over time. This implies that a greater chance of economic booms in the neighborhood is linked to an improvement in habitat quality along the Lingqu Canal.

4. Conclusions

(1) The habitat quality along the Lingqu Canal exhibited a declining trend from 2000 to 2010, followed by a significant improvement from 2010 to 2023. The lowest point was in 2010, when low-quality habitats accounted for 39.17%, while high-quality habitats comprised only 3.07%. Between 2015 and 2023, habitat quality showed a marked upward trend, reaching its peak in 2020 with high-quality habitats increasing to 11.33% and low-quality habitats decreasing to 12.08%.
(2) The primary factors influencing habitat quality between 2000 and 2023 were land use changes, population density, and annual precipitation. Land use changes and population density are driven by socioeconomic activities, particularly regional development and policy directions. While these factors generate economic benefits, they also place additional stress on the ecosystem, impacting habitat quality.
(3) From 2000 to 2023, the Lingqu Canal experienced significant functional diversification, effectively promoting a win-win situation for ecological preservation and economic growth. Through integration models such as "culture + tourism," "agriculture + tourism," and "water conservancy + tourism," the Lingqu Canal not only facilitated economic transformation but also contributed to the sustainable development of both the environment and tourism.
In conclusion, the conservation and development of the Lingqu Canal serve as a model for the sustainable utilization of cultural heritage and an exemplary case of managing the biological environment in the region. The Lingqu Canal will continue to advocate for mutually beneficial outcomes in ecological preservation and economic growth, positively impacting the achievement of comprehensive, well-coordinated, and sustainable development goals.

5. Discussion and outlook

5.1. Changes in Habitat Quality and Impacts

In this paper, we investigated the spatiotemporal evolution characteristics of habitat quality along the Lingqu Canal using the InVEST model. Additionally, the Geodetector model was employed to analyze the driving factors behind changes in habitat quality. Finally, spatial autocorrelation analysis was conducted to thoroughly examine the impact of the functional diversification of the Lingqu Canal on economic development, ecological protection, and sustainable development. The conclusions are as follows:
Overall, the habitat quality along the Lingqu Canal has demonstrated a trend of initial deterioration followed by improvement. Between 2000 and 2010, the habitat quality along the Lingqu Canal consistently declined, with 2010 marking the lowest point. In this year, 39.17% of the habitats were classified as low-quality, while only 3.07% were considered high-quality. The primary cause of ecological degradation during this period was excessive fertilizer use due to widespread farming practices, which led to increased river pollution. The heavy focus on infrastructure development overlooked ecological sustainability, further exacerbating regional environmental damage. Additionally, the underdeveloped tourism industry failed to integrate ecological and economic needs effectively. However, from 2015 to 2023, there was a significant improvement in the habitat quality along the Lingqu Canal. By 2020, the percentage of low-quality habitats dropped to 12.08%, while the percentage of high-quality habitats rose to 11.33%, indicating that habitat quality had reached its peak. This positive change can be attributed to the strong support for the Lingqu Canal's protection and restoration project, launched by Xing'an County in 2016. Through comprehensive environmental management, the ecological integrity and natural functions of the Lingqu Canal were successfully restored. In 2019, the implementation of the "three clean-ups and one change" initiative aimed at reducing river pollution and improving waste management significantly enhanced the region's natural environment and water quality. Despite a subsequent decline in habitat quality, the percentage of high-quality habitats remained at 75.26% in 2023, which suggests that ecological restoration efforts were successful and the overall development trend remained positive.
Furthermore, between 2000 and 2023, the factors influencing the Lingqu Canal's habitat quality shifted. Land use changes continued to be the most significant factor, followed by population density and annual precipitation. The study also revealed that socioeconomic activities have a substantial impact on habitat quality, aligning with the idea that anthropogenic activities—particularly policy decisions and regional development—are the primary drivers of land use changes and population growth. While these economic activities have contributed to the region's improved economic conditions, they have also had unavoidable negative effects on the biological environment and habitat quality. As such, achieving sustainable development in the Lingqu Canal region requires a balance between ecological preservation and economic growth.
From 2000 to 2023, the Lingqu Canal underwent substantial functional diversification, effectively promoting both ecological conservation and sustainable economic development. This process also demonstrated significant spatial synergies. Research indicates that improving local habitat quality can substantially drive economic growth in surrounding areas. In this context, Xing'an County implemented an ecological priority and cultural heritage strategy centered around the Lingqu Canal. By integrating environmental, economic, and cultural resources, the county facilitated a comprehensive regional upgrade. A key milestone in this process was the Lingqu Canal's selection in 2023 as a model for the high-quality development of national water conservancy projects in scenic areas. Between January and November 2023, the Lingqu Canal scenic area welcomed 314,500 visitors, a 471.41% year-over-year increase, while operating revenue reached 4,443,100 yuan, reflecting a 203.58% year-over-year rise. Through initiatives such as Lingqu Heritage Tourism, Qin-Han Cultural Experience, and Historic District Recreation, Xing'an County is actively exploring diverse integration models such as "culture + tourism," "agriculture + tourism," and "water conservancy + tourism." Additionally, the county is promoting the integration of agriculture and tourism by developing rural tourism projects like the "idyllic complex" and "Lingqu Family" tourism belt, which fosters deep integration between agriculture, ecology, and tourism. These efforts are contributing to local economic transformation and supporting sustainable development.

5.2. Recommendations for future development policies for cultural heritage

The study's findings demonstrate that the balance between the development and preservation of the Lingqu Canal, as a historical and cultural legacy, has progressively evolved into a novel approach. The Lingqu Canal not only promotes regional economic growth but also provides an innovative solution for ecological preservation and cultural inheritance by strategically expanding its multiple functions, including irrigation and tourism, and integrating the cross-sectoral integrated development model of "culture + agriculture + water conservation + tourism." The successful implementation of this model illustrates that ecological protection should transcend traditional conservationist thinking and be harmonized with regional economic development, social needs, and cultural heritage preservation to foster sustainable local development. This practice offers valuable insights into historical and cultural heritage sites globally, demonstrating that it is entirely feasible to achieve economic and social win-win outcomes while preserving heritage.
Overall, it exemplifies how a historical and cultural legacy can endure and thrive in contemporary society. The preservation and development of the Lingqu Canal serve as both a model for diversifying the functions of cultural heritage and an inspiration for the sustainable utilization of other cultural heritages.

5.3. Limitations

Although this study provides a valuable theoretical framework and empirical analysis, it is not without limitations. Firstly, the availability of road network data, regional GDP, and tourism income along the Lingqu Canal is limited, necessitating the use of existing data for adjustments or substitutions in our analysis. This may have compromised the accuracy and generalizability of certain results. Secondly, this paper primarily relies on static data to examine the relationship between habitat quality and functional diversification. To provide a more robust scientific foundation for the long-term preservation of the Lingqu Canal and related historical and cultural heritage, future research should explore the relationship between ecological protection and multifunctional development under various policies and development modes using techniques such as scenario simulation.

Author Contributions

Conceptualization, Lei Luo; Data curation, Yifei Guo; Investigation, Meiqing Wu and Yuxin He; Methodology, Liduo Dou; Validation, Meiqing Wu; Writing – original draft, Meiqing Wu; Writing – review & editing, Lanwei Zhu.

Funding

This work was supported by the National Key R&D Program of China (Project No. 2022YFC3800700) and the Innovative Research Program of the International Research Center of Big Data for Sustainable Development Goals (Grant No. CBAS2022IRP09).

Data Availability Statement

The raw data supporting the conclusions of this article will be made available by the authors on request.

Acknowledgments

The authors would like to thank the anonymous reviewers and the editor for their constructive comments and suggestions on this paper.

Conflicts of Interest

The authors declare no conflicts of interest.

References

  1. Jiang, W.; Wang, C.; Liu, N.; et al. Ecological quality of a global geopark at different stages of its development: Evidence from Xiangxi UNESCO Global Geopark, China. Global Ecol. Conserv. 2023, 46, e02617. [Google Scholar] [CrossRef]
  2. Wang, C.; Wang, Q.; Liu, N.; et al. The impact of LUCC on the spatial pattern of ecological network during urbanization: A case study of Jinan City. Ecol. Indic. 2023, 155, 111004. [Google Scholar] [CrossRef]
  3. Wang, J.; Wang, X.; Han, Z.; et al. Research on the impact of urbanization on the Climate and Ecological Environment of World Cultural Heritage Site-- A case study of Fuling Mausoleum in Qing Dynasty. Preprints, 1. Available online. [CrossRef]
  4. Dong, J.; Zhang, Z.; Liu, B.; et al. Spatiotemporal variations and driving factors of habitat quality in the loess hilly area of the Yellow River Basin: A case study of Lanzhou City, China. J. Arid Land 2022, 14, 637–652. [Google Scholar] [CrossRef]
  5. Xu, H.; Dong, B.; Gao, X.; et al. Habitat quality assessment of wintering migratory birds in Poyang Lake National Nature Reserve based on InVEST model. Environ. Sci. Pollut. Res. 2023, 30, 28847–28862. [Google Scholar] [CrossRef] [PubMed]
  6. Xie, X.; Zhu, Q. Research on the Impact of Urban Expansion on Habitat Quality in Chengdu. Sustainability 2023, 15, 6271. [Google Scholar] [CrossRef]
  7. Wang, Z.; Liu, S.; Su, Y. Spatiotemporal evolution of habitat quality and its response to landscape patterns in karst mountainous cities: A case study of Guiyang City in China. Environ. Sci. Pollut. Res. 2023, 30, 114391–114405. [Google Scholar] [CrossRef] [PubMed]
  8. People.com.cn.
  9. Venkat, K.P.; Sivakumar, V.L. Characterisation of Landuse / Landcover Changes and its Comparison in Vijayawada City using Artificial Neural Networks with Minimum Distance to Mean. In Proceedings of the 2023 International Conference on Artificial Intelligence and Knowledge Discovery in Concurrent Engineering (ICECONF), Chennai, India; 2023; pp. 1–7. [Google Scholar] [CrossRef]
  10. Ara, Z.; Jha, R.; Quaff, A.R. Critical Appraisal of Satellite Data for Land Use/Land Cover Classification and Change Detection: A Review. In Lecture Notes in Civil Engineering, Vol. 339; Springer: Singapore, 2023. [Google Scholar] [CrossRef]
  11. Dash, P.; Sanders, S.L.; Parajuli, P.; Ouyang, Y. Improving the Accuracy of Land Use and Land Cover Classification of Landsat Data in an Agricultural Watershed. Remote Sens. 2023, 15, 4020. [Google Scholar] [CrossRef]
  12. Hegde, R.; Hegde, S.K. A Fuzzy-Based Predictive Approach for Soil Classification of Agricultural Land for Efficient Cultivation and Harvesting. In Lecture Notes on Data Engineering and Communications Technologies, Vol. 181; Springer: Cham, 2023. [Google Scholar] [CrossRef]
  13. Bhatt, J.; Nijhawan, R.; Gangodkar, D.; Singh, A.K. A.K. A Novel Meta-Classifier Framework Approach for Land Use Land Cover Classification. In Lecture Notes in Networks and Systems, Vol. 467; Springer: Singapore, 2023. [Google Scholar] [CrossRef]
  14. Martinez-Sanchez, L.; See, L.; Yordanov, M.; Verhegghen, A.; Elvekjaer, N.; Muraro, D.; d'Andrimont, R.; van der Velde, M. Automatic Classification of Land Cover from LUCAS In-situ Landscape Photos Using Semantic Segmentation and a Random Forest Model. Environ. Model. Softw. 2024, 172, 105931. [Google Scholar] [CrossRef]
  15. Jamali, A.A.; Behnam, A.; Almodaresi, S.A.; et al. Exploring Factors Influencing Urban Sprawl and Land-Use Changes Analysis Using Systematic Points and Random Forest Classification. Environ. Dev. Sustain. 2023. [CrossRef]
  16. Natural Capital Project. InVEST 3.14.2 User’s Guide. Stanford University, University of Minnesota, Chinese Academy of Sciences, The Nature Conservancy, World Wildlife Fund, and Stockholm Resilience Centre: Stanford, CA, USA, 2022.
  17. Tang, F.; Wang, L.; Guo, Y.; et al. Spatio-temporal Variation and Coupling Coordination Relationship Between Urbanisation and Habitat Quality in the Grand Canal, China. Land Use Policy 2022, 117, 106119. [Google Scholar] [CrossRef]
  18. Wang, J.F.; Xu, C.D. Geographical Detector: Principle and Prospect. Acta Geogr. Sin. 2017, 72, 116–134. [Google Scholar]
  19. Wang, J.; Xu, C. Geographic detector: principles and prospects. In Acta Geographica Sinica, 72(1); Science Press: Beijing, China, 2017; pp. 116–134. [Google Scholar]
  20. Pan, Z.; Gao, G.; Fu, B. Spatiotemporal Changes and Driving Forces of Ecosystem Vulnerability in the Yangtze River Basin, China. Sci. Total Environ. 2022, 835, 155494. [Google Scholar] [CrossRef] [PubMed]
  21. Zhang, H.T.; Li, J.L.; Tian, P.; et al. Spatio-temporal Evolution of Habitat Quality in the East China Sea Continental Coastal Zone Based on Land Use Changes. Acta Ecol. Sin. 2023, 43, 1–11. [Google Scholar]
  22. Chen, H.; Zhao, Y.; Fu, X.; et al. Characteristics of Spatio-temporal Evolution and Influence Mechanism of Habitat Quality in the Upper Reaches of the West Liaohe River. Acta Ecol. Sin. 2023, 43, 1–14. [Google Scholar]
  23. Qi, Y.; Hu, Y. Spatiotemporal Variation and Driving Factors Analysis of Habitat Quality: A Case Study in Harbin, China. Land 2024, 13, 67. [Google Scholar] [CrossRef]
  24. Xu, N.; Zhang, S.; Jiang, S. Estimating GDP by Fusing Nighttime Light and Land Cover Data. Can. J. Remote Sens. 2024, 50, 1. [Google Scholar] [CrossRef]
Figure 1. Study area generation: a. DEM map of the 10km buffer zone; b. Irrigation water; c. Imagery map of the study area 2023 along the Lingqu Canal.
Preprints 148036 g001
Figure 2. Land use distribution and changes along the Lingqu Canal:.(a )2000;(b)2005;(c)2010;(d)2015; (e)2020;(f)2023.
Preprints 148036 g002
Figure 3. Spatial and temporal distribution of habitat quality:(a )2000;(b)2005;(c)2010;(d)2015; (e)2020;(f)2023.
Preprints 148036 g003
Figure 4. The explanatory power of the drivers.
Preprints 148036 g004
Figure 5. Localized Moran's I index clustering of habitat quality and tourism income along the Lingqu:(a )2000;(b)2005;(c)2010;(d)2015; (e)2020;(f)2023.
Preprints 148036 g005
Table 1. Maximum impact distance of threatened sources and their weights.
THREAT MAX_DIST WEIGHT DECAY
Cropland 1.8 0.6 Linear
Unit 5 1 Exponential
Barren 8 0.5 Exponential
Highway 2.6 0.5 Linear
Table 2. Habitat suitability of different land classes and their sensitivity to threat sources.
Landuse types Habitat suitability Cropland Unit Barren Highway
Forest 0.9 0.8 0.6 0.2 0.7
Shrub 0.6 0.6 0.6 0.5 0.7
Grassland 0.8 0.7 0.6 0.3 0.35
Cropland 0.7 0.35 0.3 0.15 0.6
Unit 0 0 0 0.1 0
Barren 0.6 0.6 0.6 0 0
Water 0.9 0.75 0.5 0.2 0.6
Table 3. Changes in the area and percentage of different classes of habitat quality along the Lingqu.
HQ level Lower Low Medium High Higher Average HQ
2000 Area /km2 17.70 11.45 60.21 27.82 20.81 0.63
Proportion /% 12.83 8.30 43.63 20.16 15.08
2005 Area /km2 12.95 22.61 80.14 17.61 4.69 0.75
Proportion /% 9.38 16.38 58.07 12.76 3.40
2010 Area /km2 54.06 42.27 7.13 30.31 4.23 0.61
Proportion /% 39.17 30.63 5.17 21.96 3.07
2015 Area /km2 14.66 30.23 23.55 36.91 32.64 0.71
Proportion /% 10.62 21.91 17.06 26.75 23.66
2020 Area /km2 16.67 18.85 23.63 63.22 15.63 0.78
Proportion /% 12.08 13.66 17.12 45.81 11.33
2023 Area /km2 24.49 23.35 21.80 53.48 14.88 0.76
Proportion /% 17.74 16.92 15.80 38.75 10.78
Table 4. Drivers and Codes.
driving force encodings unit (of measure)
GDP X1 billions
Population density X2 Persons/km2
Night time light index X3
Land use change X4
Average annual temperature X5
Average annual rainfall X6 mm
Elevation X7 °
Elevation X8 m
Disclaimer/Publisher’s Note: The statements, opinions and data contained in all publications are solely those of the individual author(s) and contributor(s) and not of MDPI and/or the editor(s). MDPI and/or the editor(s) disclaim responsibility for any injury to people or property resulting from any ideas, methods, instructions or products referred to in the content.
Copyright: This open access article is published under a Creative Commons CC BY 4.0 license, which permit the free download, distribution, and reuse, provided that the author and preprint are cited in any reuse.
Prerpints.org logo

Preprints.org is a free preprint server supported by MDPI in Basel, Switzerland.

Subscribe

Disclaimer

Terms of Use

Privacy Policy

Privacy Settings

© 2025 MDPI (Basel, Switzerland) unless otherwise stated