
Submitted:
29 January 2025
Posted:
29 January 2025
You are already at the latest version
Abstract
The constant evolution of bacteria makes the search for new and effective bactericidal agents essential. In this context, developing antibacterial compounds with luminescent properties offers a promising strategy to investigate intracellular biochemical processes while simultaneously assessing the drug's effects. In the present work, coordination polymers of composition [{M(L1)2}{M(L1)(H2O)2}]n (M = Sm3+, Gd3+, and Yb3+) were obtained from reactions of their respective lanthanide salts with 1.5 equivalent of the ligand 1,2-diphenylethane-1,2-diylidene)diisonicotinohydrazide (H2L1). The techniques used for characterization of the compounds included FTIR, UV-visible spectroscopy, high-resolution mass spectrometry and single-crystal X-ray diffraction. In addition, emission spectra were obtained at room temperature and at 77 K, along with emission spectra in the presence of oxygen or argon. The antibacterial activity of the compounds was evaluated against Escherichia coli, Pseudomonas aeruginosa, Staphylococcus aureus and their clinical resistant strains - MRSA (methicillin-resistant Staphylococcus aureus). It was observed that, upon complexation, there was a general increase in the activity, particularly with a more pronounced percentage of inhibition against bacterial biofilms. Additionally, the complex [{Yb(L1)2}{Yb(L1)(H2O)2}]n was used for functionalization of Bi2O3/Bi2S3 nanoparticles, however, a fluorescence suppression was observed for the Yb-containing nanoparticles. Finally, cellular internalization studies demonstrated that the Ln³⁺ polymers alone could be detected inside Vero cells through their luminescence properties. Altogether, these lanthanide complexes present potential for dual-modality biological performance, combining significant antibacterial activity with the ability for intracellular detection.
Keywords:
Rare earths
; Coordination polymers
; Hydrazones
; Luminescence
; Quantum dots
; Antibacterial assays
; Biomarkers
1. Introduction
The prolonged or inappropriate use of traditional antibiotics increased the emergence of drug-resistant bacterial strains significantly compromising the effectiveness of available treatments [1,2]. The epidemiological analysis of the global burden of antimicrobial resistance estimates that in 2019, 4.95 million deaths were caused by microorganisms with antimicrobial drug resistance and estimates that 192 million of disability-adjusted life years were lost by mortality and morbidity by these infections worldwide [3]. Among the main pathogens associated with these infections are: Escherichia coli, Pseudomonas auriginosa, Staphylococcus aureus, Klebsiella pneumoniae, and Mycobacterium tuberculosis [3,4], posing a significant threat to human health, as they present the issue of antibacterial resistance, with drugs losing effectiveness due to frequent use [5]. Therefore, it is essential to develop new agents the treatment of bacterial diseases that can address current therapy challenges and inhibit the growth of pathogenic microorganisms, particularly when the first-line drugs are not active.
Medicinal Inorganic Chemistry has gained significant attention for its potential to address limitations in current therapeutic strategies. This field enables the development of innovative agents for challenging diseases, leveraging the distinctive properties of metal ions [6,7,8,9]. Metal ions play a crucial role by enhancing drug activity, targeting specific biological sites and offering novel opportunities due to their intrinsic physicochemical characteristics. For instance, lanthanide complexes exhibit exceptional photophysical and magnetic properties due to their unpaired electrons (in most cases) and characteristic emissions [10]. These properties make lanthanides valuable in medicinal chemistry for applications such as biomedical diagnostics, magnetic resonance imaging and biomarkers [11,12,13]. However, lanthanide ions inherently have low absorptivity and require coordination with organic ligands to exhibit useful luminescence. The ligands enable the "antenna effect," wherein they absorb energy and transfer it to the central metal ion, sensitizing it for luminescence [12]. This coordination is essential, as lanthanides alone cannot achieve the sensitization needed for such applications.
Hydrazone-based ligands are well-suited for coordination with lanthanide ions due to their O and N donor atoms, which exhibit strong affinities for hard Lewis acids [14]. These organic compounds are characterized by the functional group R₂C=NNHC(=O)-R and are typically synthesized via the reaction of an aldehyde or ketone with a hydrazide [15,16], such as isoniazid, a drug used in the treatment of tuberculosis [17,18]. When a diketone or a dialdehyde is used, bis(hydrazones) can be obtained. This class of ligands has garnered significant attention for its versatile coordination modes and its ability to stabilize d- and f-block metal complexes [11]. Furthermore, hydrazones are notable for their diverse biological activities, including antioxidant, anticancer, anti-inflammatory, and antimicrobial properties [11,19,20,21]. Consequently, these ligands hold high potential for a range of applications, such as the development of luminescent probes and antibacterial agents [22,23].
This work focused on the preparation and structural characterization of a bis(hydrazone) ligand derived from isoniazid, followed by its coordination with some lanthanide ions to form coordination polymers. These materials were subsequently evaluated for their photophysical properties and antibacterial activity, including their ability to inhibit biofilm formation. Aiming to enhance the photophysical properties of the complexes, the combination between one of the coordination compounds and Bi₂O₃/Bi₂S₃ nanoparticles was carried out, providing additional insights. Furthermore, preliminary investigations into the potential use of these complexes as biomarkers in VERO cells are presented.
2. Materials and Methods
2.1. Materials
The reagents: benzil, isoniazide, sodium hydroxide, precursors Sm(NO3)3∙6H2O, Gd(NO3)3∙6H2O, Yb(NO3)3∙H2O, 1-ethyl-3-(3-dimethylaminopropyl) carbodiimide (EDC), N-hydroxysuccinimide (NHS), bismuth(III) acetate and thioglycerol were commercially obtained from Sigma-Aldrich. The sodium borate buffer solution was obtained from Dinamica.
2.2. General Methods
The melting points were determined using a PF1500 FARMA GEHAKA instrument. The IR spectra were recorded using a PerkinElmer FT-IR Frontier Single Range spectrophotometer in the region between 4000 and 220 cm−1. The sample analyses were performed in the solid state using Attenuated Total Reflectance (ATR) with a diamond crystal accessory. The electronic spectra were measured using a Shimadzu UV-2501 spectrophotometer in methanol solutions. The photoluminescence measurements at 298 K were conducted using a 355 nm LED (~3.49 eV) focused on a spot with a radius of ~200 μm, recorded with a multichannel spectrometer model Avantes operating between 200 to 1100 nm. The positive ion electrospray ionization mass spectra (ESI-MS) were recorded using an Agilent 6210 ESI-TOF mass spectrometer (Agilent Technologies, Santa Clara, CA, USA). The cellular internalization was evaluated using an inverted microscope model Zensis telaval 31 – Zeiss Deutschland.
2.3. Preparation of the Compounds
2.3.1. Synthesis of H2L1 Ligand
The Schiff base H2L1 was synthesized directly by condensation of benzil and isoniazide according to previously reported procedures [24,25].
(1,2-diphenylethane-1,2-diylidene)di(isonicotinohydrazide) (H2L1) - Color: Colorless. Yield: 79%. Melting Point: 247-249 °C. FTIR (ATR/cm-1): 3238,3200 ν(N-H), 1600 ν(C=N), 1408 ν(C=C), 3029 ν(C-H), 1684 ν(C=O), 1058 ν(N-N) and 687 δ(Py). 1H NMR (DMSO-d6, δ/ppm): 8.92 (m, 4H, Ar), 8.10 (m, 4H, Ar), 11.72 (s, 1H, NH), 11.84 (s, 1H, NH), 7.39-7.67 (m, 10H, Ph). UV-Vis, solution of MeOH concentration 10-5 mol. L-1 [λmax/ε (L mol-1 cm-1)]: 295 nm (41214).
2.3.2. Synthesis of Lanthanide Complexes
To a solution containing 0.2 mmol of the precursors [Ln(NO3)3·6H2O] (Ln = Sm and Gd) or [Yb(NO3)3·H2O] in ethanol (20 mL), 0.3 mmol of H2L1 was added. Subsequently, a solution containing 0.06 mol of NaOH in ethanol (5 mL) was added to the reaction mixture. The resulting solution was refluxed for 15 hours, changing the color from yellow to orange. Subsequently, the solvent was completely removed using a rotary evaporator. The solid obtained was dissolved in dichloromethane (2 mL), and then 3 mL of n-hexane were added, resulting in the formation of orange precipitates which were recrystallized from a mixture of CH2Cl2/methanol (2:1) forming crystalline solids. The orange solids precipitated during this time were filtered off and dried under vacuum. Single-crystal X-ray diffraction (SC-XRD) study of the samarium complex was not feasible due to the inadequate quality of the crystals.
[{Sm(L1)2}{Sm(L1)(H2O)2}]n (1): Color: Orange. Yield: 68% (0.1155 g). Molecular formula for the monomer (Molar mass): C78H58N18O8Sm2 (1676.13 g.mol-1). Melting Point: 279- 281 °C. FTIR (ATR/cm-1): 3055, 3030, 2970 ν(C-H), 1655, 1605 ν(C=O), 1571 ν(C=N), 1408 ν(C=C), 1058 ν(N-N) and 687 δ(Py). ESI (+) (m/z) calculated for the ion [Sm(HL1)2]+ (C52H38SmN12O4): 1046.2336; found: 1046.2354. UV-Vis, solution of MeOH concentration 10-4 mol L-1 [λmax/ε (L mol-1 cm-1)]: 275 nm (35234), 325 (28044), 440 (24285). Luminescence, solution of MeOH at 298 K [λexc = 340 nm]: 515 nm.
[{Gd(L1)2}{Gd(L1)(H2O)2}]n (2): Color: Orange. Yield: 59% (0.1012 g). Molecular formula for the monomer (Molar mass): C78H58Gd2N18O8 (1689.91 g.mol-1). Melting Point: 316-318 °C. FTIR (ATR/cm-1): 3059, 3030, 2973 ν(C-H), 1605 ν(C=O), 1572 ν(C=N), 1414 ν(C=C), 1059 ν(N-N) and 687 δ(Py). UV-Vis, solution of MeOH concentration 10-4 mol L-1 [λmax/ε (L mol-1 cm-1)]: 275 nm (24490), 330 (28807), 440 (26626). Luminescence, solution of MeOH at 298 K [λexc =340 nm]: 523 nm.
[{Yb(L1)2}{Yb(L1)(H2O)2}]n (3): Color: Orange. Yield: 65% (0.1130 g). Molecular formula for the monomer (Molar mass): C78H58N18O8Yb2 (1721.52 g.mol-1). Melting Point: 217-218 °C. FTIR (ATR/cm-1): 3361 ν(OH), ), 3060, 3025, 2930 ν(C-H), 1657, 1605 ν(C=O), 1570 ν(C=N), 1441 ν(C=C), 1070 ν(N-N), 683 δ(Py) and. ESI (+) (m/z) calculated for the ion [Yb(HL1)2]+ (C52H38YbN12O4): 1068.25; found: 1068.2488. UV-Vis, solution of MeOH concentration 10-5 mol L-1 [λmax/ε (L mol-1 cm-1)]: 280 nm (30704), 323 (31549), 435 (19119).
2.3.3. Functionalization of the Bi2O3/Bi2S3 Nanoparticles with the Ytterbium Complex
Bi2O3/Bi2S3 nanoparticles were produced in aqueous solutions at 80 °C for 30 minutes using bismuth (III) acetate (1 M) and 1-thioglycerol. The synthesis of the nanoparticles containing [{Yb(L1)2}{Yb(L1)(H2O)2}]n (3) were carried out from the Bi2O3/Bi2S3 nanoparticles. Briefly, a solution containing NHS (40 mg), EDC (40 mg), and sodium borate buffer solution (1 mL) was added to the solution of the complex (15.6 mg) dispersed in ultrapure water. Next, a solution containing the previously prepared Bi2O3/Bi2S3 nanoparticles (20 mg) dispersed in ultrapure water was added [26]. The resulting solution was stirred for 3 hours. Then, the resulting product was centrifuged at 6000 rpm and filtered for subsequent analyses. NP/3: Colour: Black. FTIR (ATR/cm-1): 1637 ν(C=O), 679 ν(Bi-O), 1158 ν(Bi-S). Photoluminescence: NP: 600 nm, Yb3+ complex: 620 nm, NP/ 3: 570 nm.
2.4. Crystal Structure Determinations
The data collection for the X-ray determinations of the free ligand and of the gadolinium complex (2∙4MeOH) were collected on a Bruker APEX-II CCD instrument using Mo-Kα (λ = 0.71073 Å) and Cu-Kα (λ = 1.54178) radiations, respectively. X-ray diffraction data for the ytterbium complex were acquired using a STOE IPDS 2T diffractometer with Mo-Kα radiation. The various temperatures applied are due to the experimental setup of the different diffractometers. Semi-empirical or numerical absorption corrections were carried out by the SADABS or X-RED32 programs [27,28]. The solutions and refinements of the structures were carried out using the programs SHELXS97 and SHELXL2014 [29,30], included in OLEX2 [31]. The hydrogen atom positions were calculated at idealized positions and treated using the "riding model" option in the SHELXL2014 program [30]. The representation of molecular structures was done using the program MERCURY [32]. A summary of the crystallographic data and structure refinement for H2L1 and 3 is provided in Table 1. The data quality of 2∙4MeOH is not good and is presented only in the supplementary material (Table S1). Attempts to grow better crystals did not succeed.
2.5. Luminescence Studies
The steady-state emission measurements of luminescence were performed using a Horiba Fluoromax-4 spectrofluorometer. Spectra in liquid medium were obtained in quartz cuvettes with four polished sides and an optical path length of 1.0000 cm, using 5.00 nm slits in both excitation and emission monochromators. All solutions were adjusted so that the absorption range fell between 0.1 and 0.2 at the excitation wavelength. The measurements were conducted in oxygen-aerated and argon-aerated methanol. Measurements in a glassy medium (77 K) were performed in a Dewar flask with liquid nitrogen, where the samples were dissolved in a mixture of ethanol/methanol 4:1 (v/v).
2.6. Biological Assays
The compounds Sm3+, Gd3+, and Yb3+ and the ligand H2L1 were tested against the bacterial strains: E. coli ATCC 25922, P. aeruginosa ATCC 27853, Staphylococcus aureus ATCC 29213 and its clinical resistant strain – MRSA (methicillin-resistant Staphylococcus aureus). The stock cultures were maintained at -80 °C in Brain Heart Infusion (BHI) broth supplemented with 20% (v/v) glycerol. The bacteria were cultured in BHI broth at 37 °C and grown overnight before the experiments. The effect of the complexes on bacterial growth was quantified using a broth microdilution assay as described by Perini et al. (2024) with modifications [33]. Overnight cultures of all bacterial strains were adjusted to McFarland’s 0.5 standard (~1x10⁸ UFC/mL) and diluted 1000.000 times (1x102 UFC/mL). Then, 100 µL of this culture was transferred to a 96-well plate containing 100 µL of BHI broth (control) and 100 µL of the complexes and free ligand at final concentrations of 100, 50, 25, 12.5, and 6.25 µg/mL per well. The plates were incubated for 18 hours at 37 °C. Then, the absorbance was measured at 475 nm. The growth inhibition was presented as the percentage reduction in growth compared to the control condition. For each bacterium, the experiment was conducted in three replicated wells per microtiter plate at three times. Chloramphenicol was used as the negative control
Two assays were conducted regarding biofilm inhibition following the methodology adaptation by Rocha et al. [34]. In the first assay, the complexes were incubated together with the bacteria to assess their ability to inhibit adhesion and biofilm formation. In the second assay, biofilm formation was allowed first, followed by treatment with the complexes to evaluate their action in the preformed biofilms. For the anti-biofilm formation assay, overnight cultures of all bacterial strains were incubated in BHI broth and adjusted to a McFarland standard of 0.5. Then, 100 µL of culture was transferred to a 96-well polystyrene microtiter plate containing 100 µL of fresh BHI broth (control) and BHI broth containing sub-inhibitory concentrations of nanocomposites that showed inhibitory activity against bacterial growth. After incubation for 24 hours at 37 °C, the culture medium was discarded, and the wells were washed three times with saline solution (0.85% NaCl) to remove non-adherent cells. The biofilms were fixed with 200 µL of cold methanol (Synth) for 15 minutes. The methanol was removed, and the biofilms were air-dried at room temperature. Then, 100 µL of crystal violet solution (1%) was added, and after 15 minutes, the plates were washed three times with 200 µL of saline solution. The biofilms were air-dried at room temperature, and then 200 µL of 33% acetic acid solution was added for 20 minutes to solubilize the crystal violet. The total biomass of the biofilm was measured by absorbance at 600 nm, and the percentage inhibition of biofilm formation was expressed using the formula: 1-(ODtreated/ODcontrol) x 100.
To verify the action against preformed biofilms, 200 µL of adjusted bacterial suspensions (1x10⁸ UFC/mL) were added in the 96-well polystyrene plates and incubated at 37 °C for 24 h. Then, the plates were washed with sterile saline solution and treated with compounds as described. Plates were incubated at 37 °C for 24 h, washed 3 times and 10 µL of MTT (3-[4,5-dimethylthiazol-2-yl]-2,5- diphenyltetrazolium bromide) solution (5 mg/mL – Sigma-Aldrich) were added and incubated for 4 h at 37°C. After incubation, 100 µL of DMSO (dimethyl sulfoxide) were added to solubilize formazan formed by viable cells and plates read in spectrophotometer in 470 and 550 nm. Percentage cell viability in the preformed biofilms were relativized with control condition (untreated). All experiments were performed in triplicate in three independent occasions.
2.7. Evaluation of the Cellular Viability and Internalization of Compounds
The Vero CCL-81 cells were maintained in complete RPMI medium, containing 50 mM Hepes (GIBCO, USA), 5% heat-inactivated fetal bovine serum (EUROBIO, France), 2 mM L-glutamine (GIBCO, USA), and 40 μg/mL gentamicin (ARISTON, Brazil). Cells were cultured in 25 cm² culture flasks and stored in an incubator at 37 °C with 5% carbon dioxide (CO2). When cells were passaged or used for subsequent assays, they were detached from the flask using PBS/EDTA (0.25%) and trypsin. The cells were detached and transferred to 96-well plates (1x10⁶ cells/mL) and incubated for 12 hours (37 °C, 5% CO2) for adhesion. After cellular adhesion, treatment with the compounds/composites ([{Sm(L1)2}{Sm(L1)(H2O)2}]n (1), [{Gd(L1)2}{Gd(L1)(H2O)2}]n (2), [{Yb(L1)2}{Yb(L1)(H2O)2}]n (3), Bi2O3/Bi2S3 (NP) and NP/3) was performed starting from an initial concentration of 200 µg/ml and serially diluted at a ratio of 2, with the final concentration being 6.125 µg/ml for each compound. The positive control was performed using cells without treatment, while the negative control involved cells treated with 2% PFA (paraformaldehyde). The cytotoxicity was performed after 24h of treatment. After incubation with compounds Fluorescence readings (at 550 nm and 590 nm) were taken from wells containing only RPMI medium and wells containing RPMI medium with the compounds, but no cells, to establish baseline fluorescence levels. After 24 hours of treatment, resazurin (C12H7NO4 - 2.5 mg/ml) was added, and fluorescence readings were performed using an EnSpire® reader (Perkin Elmer, Germany) with excitation at 550 nm and emission at 590 nm. The internalization of the compounds was performed in the fluorescence microscope (EVOS®) with acquisition of fluorescence with DAPI filter – 360 nm excitation and 460 nm emission.
The cells were detached and transferred to 96-well plates (1x10^6 cells/mL) and incubated for 12 hours (37°C, 5% CO2) for adhesion.The cells were detached and transferred to 96-well plates (1x10^6 cells/mL) and incubated for 12 hours (37°C, 5% CO2) for adhesion.The cells were detached and transferred to 96-well plates (1x10^6 cells/mL) and incubated for 12 hours (37°C, 5% CO2) for adhesion.The cells were detached and transferred to 96-well plates (1x10^6 cells/mL) and incubated for 12 hours (37°C, 5% CO2) for adhesion.
3. Results and Discussion
3.1. Synthesis and Characterization
The reactions between the precursors Sm(NO3)3∙6H2O, Gd(NO3)3∙6H2O and Yb(NO3)3∙H2O with 1.5 equivalent of the ligand H2L1 in ethanol in the presence of NaOH produced complexes of the composition [{Sm(L1)2}{Sm(L1)(H2O)2}]n (1), [{Gd(L1)2}{Gd(L1)(H2O)2}]n (2), and [{Yb(L1)2}{Yb(L1)(H2O)2}]n (3), respectively (Scheme 1). For all the complexes, orange solids were obtained with yields of 68%, 59%, and 65% for complexes 1, 2, and 3, respectively. Regarding solubility, all complexes are soluble in DMSO, dichloromethane, and chloroform, and partially soluble in methanol, ethanol, and acetonitrile.
The infrared spectra of the complexes showed significant changes compared to the free ligand H2L1 (see Figure S1.1) . The disappearance of the υ(N-H) bands was observed, indicating the formation of neutral complexes. Two bands corresponding to the carbonyl stretching υ(C-O) were observed around 1600 cm-1 for all complexes, except for complex 2 (see Figure S1.3) , where only one band was observed. Additionally, a stretching band υ(C=N) around 1570 cm-1 was observed for all complexes. Furthermore, only for complex 3 a broad band at 3361 cm-1 was observed (see Figure S1.4), corresponding to the υ(OH) of the water molecule in the ytterbium complex, while for the complexes 1 and 2 this band can not be undoubtly identified. For all complexes, bands related to pyridine around 680 cm-1 are observed. The main bands can be observed in Table S2.
The 1H NMR spectrum of the free H₂L1 (Figure S2.1) present all the expected signals. The singlet signals corresponding to the NH groups were observed at chemical shifts of 11.84 and 11.72 ppm. These groups are subject to deprotonation when coordinated to the lanthanide ions. Additionally, multiplet signals corresponding to the aromatic groups were observed in the region between 7 and 8 ppm. The assignments for the ¹H NMR peaks of the free ligand can be verified in Table S3.
Complexes 1-3 were analysed by high-resolution electrospray ionization mass spectrometry (ESI+-MS). The molecular ion peak [M(HL1)2]+ of the complex 1 (see Figure S3.1) was observed at m/z 1046.2354, which corresponds well with the calculated value of m/z 1046.2336. The complex 3 (see Figure S3.3) also exhibited a peak of the molecular ion [M(HL1)2]+ at m/z 1068.2488 (calculated value m/z: 1068.2568). The complex 2 (see Figure S3.2) did not exhibit a clear spectrum like the others. Therefore, it is concluded that ionization in positive mode leads to the cleavage of polymer bonds, generating monomeric species.
3.2. Crystallographic Studies
The ligand crystallized in an orthorhombic crystal system with the Pbcn space group. The crystal structure of H2L1 presents only half of the molecule per asymmetric unit (Figure 1), whereas the other part is generated by symmetry. The unit cell of this compound is also depicted in In Figure 1. It is worth noting that the N2-C1 bond length is almost identical to the N2-N1 bond length. It is also noteworthy that the bond length C-O is 1.2211(15) Å, indicative of a double bond character, consistent with an amide group in the ligand. As reported in the literature, O1-H2 is in a trans position while N2-O1 are cis [24]. Additionally, intermolecular hydrogen bonds of the N–H∙∙∙O type can be observed in this structure. This interaction occurs between the nitrogen atom N2-H2 and the oxygen of a neighboring molecule generated by symmetry [24].
The complexes [{Gd(L1)2}{Gd(L1)(H2O)2}]n (Figure 2) and [{Yb(L1)2}{Yb(L1)(H2O)2}]n (see Figure S4.1) crystallize in a monoclinic crystal system with the space group P21/c. Selected bond lengths and angles for the complexes are shown in Table 2 for comparison, however, the data for 2 is not good enough due to the poor quality of the crystals and can not support a precise discussion about bond lengths and angles. The Gd(III) and Yb(III) complexes form polymeric structures, as exemplified in Figure 2 and Figure S4.2. The Gd2 metal center is coordinated to two ligand molecules, as expected. However, the presence of a second Gd1 metal center was observed, coordinated to only one ligand molecule, two water molecules, the pyridine N33, and another pyridine from another equivalent center. Therefore, the coordination mode is octacoordinated for both parts. Comparing the bond lengths between the 2 and 3 complexes, it was found that bonding situation in both complexes is very similar.
3.3. Photophysical Studies
The characterization of complexes 1, 2 and 3 by UV electronic spectroscopy (Figure 3) showed three absorption bands very similar to those of the free ligand (See Figure S5.1). For complex 1, absorption maxima were observed at 275 nm (ɛ = 35234 L·mol⁻¹·cm⁻¹), 325 nm (ɛ = 28044 L·mol⁻¹·cm⁻¹), and 440 nm (ɛ = 24285 L·mol⁻¹·cm⁻¹). For complex 2, absorption maxima were observed at 275 nm (ɛ = 24490 L·mol⁻¹·cm⁻¹), 330 nm (ɛ = 28807 L·mol⁻¹·cm⁻¹), and 440 nm (ɛ = 26626 L·mol⁻¹·cm⁻¹). For complex 3, absorption maxima were observed at 280 nm (ɛ = 30704 L·mol⁻¹·cm⁻¹), 323 nm (ɛ = 31549 L·mol⁻¹·cm⁻¹), and 435 nm (ɛ = 419119 L·mol⁻¹·cm⁻¹). The first two bands are attributed to π-π* intraligand transitions, while the last band is attributed to ligand-to-metal charge transfer (LMCT).
The emission spectra of complexes 1, 2, and 3 (Figure 3a) were measured in methanol solutions, and emission maxima were observed to be very close to each other. All complexes exhibited emission quantum yields below 10-3. The compounds were excited using a wavelength of 340 nm, as this wavelength showed the highest emission intensity, except for the Yb complex, where the highest intensity was observed at 440 nm (see Figure S5.3). Thus, a very sharp band with good signal-to-noise ratio was observed in the green region for the complexes with Sm and Gd, except for the Yb complex which exhibited emission in the green-yellow region (Figure 3b). The emission maxima observed were 520 nm for complex 1 and 2, and 550 nm for complex 3. However, these complexes did not exhibit characteristic bands of lanthanide ions, which typically appear as narrow and structured emission bands. This suggests that their bands may be overlapped by bands originated from the ligand [35].
The Stokes shift was calculated for the complexes, resulting in approximately 80 nm for complexes 1 and 2 and 110 nm for complex 3. This shift suggests that the complexes may exhibit phosphorescent character, as there was small overlap between the absorption and emission bands. However, further studies are necessary to determine the emission lifetime. Quenching experiments carried out with molecular O2 were carried out to obtain insights on the nature of the emission properties in methanol solution. Figure S5.2 presents the comparative emission spectra of complexes 1 and 3 under argon and oxygen purging conditions. The results demonstrate that oxygen purging leads to lower emission intensities compared to measurements conducted under Ar, with emission maxima observed around 530 nm, indicating the phosphorescent nature of these molecules. For the ytterbium complex, the emission bands exhibit notably reduced intensity under oxygen purging compared to other complexes, further confirming its phosphorescent character.
Further information was obtained from temperature-dependent emission studies. The emission spectra at 298 and 77 K were also obtained. Figure S5.4 compares the emission spectra of the complexes at 298 K and 77 K. The results show that the emission spectra at room temperature and low temperature are similar for all complexes, except for the ytterbium complex which exhibits a hypsochromic shift in the emission maxima at 77 K. The band observed at low temperature is characteristic of intraligand transitions, indicating the absence of a rigidochromic effect in the molecule. This behavior is consistent with MLCT emissions [35]. For the ytterbium complex, the emission spectrum at low temperature suggest that the additional bands are likely to be caused by the rigidity effect in the molecule, given the absence of such charge transfer in this system. Moreover, the structuring of the emission band at low temperature can be attributed to a reduction in the molecule's vibrational states, as reported in related studies [35,36,37].
3.4. Antibacterial Activity of Lanthanide (III) Ion Complexes
Complexes of Samarium (1), Gadolinium (2), and Ytterbium (3), as well as the free ligand H2L1, were evaluated against different types of gram-positive bacteria (S. aureus and MRSA) and gram-negative bacteria (E. coli and P. aeruginosa). Pure bacteria were used as positive controls, and chloramphenicol was used as a negative control, commonly used in a variety of bacterial infections. Thus, through the analysis of experimental data (Figure S6.1 and Table S4), it was found that Yb3+ and Gd3+ complexes exhibited a greater inhibition capacity against E. coli and P. aeruginosa than against Gram-positive bacterial strains. However, in some cases, they were inactive at the MIC of 6.25 µg/mL. The Sm3+ complex showed no effect on E. coli bacteria. Regarding the ligand, E. coli, P. aeruginosa, and S. aureus showed a high percentage of inhibition at the MIC of 100 µg/mL. MRSA bacteria exhibit resistance to various antibiotics and cause serious infections in humans, posing a health threat [38,39]. The results obtained for this bacterium have shown promise. The antibacterial activity of the ligand can be attributed to the presence of the isoniazid fragment in its structure. The increased activity observed after complexation can be attributed to the presence of the metal ion, as there are differences in results observed among different metal centers for certain types of bacteria. Thus, the activity is potentiated, limiting the growth and replication of microorganisms by blocking essential reactions [40].
Biofilms are processes in which bacteria grow protected for a polymeric extracellular matrix, even in environments unfavourable to their survival, since there is nutrient exchange within the medium [41]. Bacterial strains with biofilm formation capacity are less susceptible to conventional treatments and are often associated with persistent and chronic infections [42,43]. Therefore, since the biofilm is a structure of resistance, we analysed the effect of our compounds against preformed biofilms Figure 4 and Table S5. The Yb3+ complex showed a better percentage of inhibition at the MIC of 100 µg/mL, specifically against E. coli and P. aeruginosa. Furthermore, the Gd3+ complex exhibited greater inhibition against E. coli, P. aeruginosa, S. aureus and MRSA. Thus, the results proved promising as the complexes were more active than their respective free ligands [44,45]. For example, at the MIC of 6.25 µg/mL, the Sm3+ complex showed a high percentage of inhibition against almost all types of bacteria. It is noteworthy that MRSA showed a 50% inhibition percentage for the Sm3+ and Gd3+ complexes at the lowest MIC (6.25 µg/mL).
3.5. Functionalizaton of Bi2O3/Bi2S3 Nanoparticles with the Yb3+ Complex
The combination of nanoparticles and the complex was carried out using EDC and NHS as coupling agents and borate buffer to maintain the pH. The synthesis of the Bi2O3/Bi2S3:[{Yb(L1)2}{Yb(L1)(H2O)2}] nanoparticles was performed by varying the concentration of 1-thioglycerol. The solution was stirred under an argon atmosphere, followed by centrifugation and filtration to obtain the final product, which was then analysed. Significant changes were observed after functionalizing Bi2O3/Bi2S3 nanoparticles with the ytterbium complex. New bands appeared in the spectrum (Figure S7.1), while some bands common to both components were retained. Table S6 highlights the key stretching bands, including υ(C=O), υ(OH), υ(Bi-O), and υ(Bi-S). The absence of the υ(OH) band post-functionalization suggests that water molecules in the complex were replaced. The Bi-O stretching band at 679 cm⁻¹ showed increased intensity in the NP/3 spectrum, confirming the formation of a new material through nanoparticle-complex interaction. The photoluminescence spectra (Figure S7.2) showed emission bands for all systems in the range between 500 and 650 nm. The Bi2O3/Bi2S3 nanoparticles alone emit at 600 nm (excitation: 355 nm), typical of quantum dots [46], while the complex alone emitted at 620 nm (excitation: 340 nm). After the interaction, a hypsochromic shift to 570 nm (excitation: 355 nm) was verified. Therefore, both infrared and photoluminescence data suggests the binding between the ytterbium complex and the Bi2O3/Bi2S3 nanoparticles, however, it was observed that this combination of them resulted in the suppression of photoluminescence since a reduction in the luminescence intensity was observed.
3.6. Cytotoxicity Evaluation
The compounds showed MICs ranging from 6.25 to 200 µg/mL when tested against the VERO CCL-81 cell line, aiming to determine the viability or cytotoxicity index (CI). When evaluating the cytotoxicity of a compound, it is common to use this type of cell because they are easy to cultivate in the laboratory, making them useful for such applications. Figure 5 shows that none of the compounds exhibited 50% cytotoxicity in the treated cells, indicating no significant impact on their survival.
3.7. Biomarker Evaluation
The obtained materials were incubated in Vero cells, and their ability to internalize into the cells was evaluated through the analysis of the compounds’ luminescence. The data (Figure 6) revealed that within the tested time interval, neither the free nanoparticles nor the functionalized NP/Complex were detected inside the cells. This suggests that functionalization suppressed luminescence, making it challenging to observe cellular internalization directly. However, the complexes demonstrated the ability to cross the cell membrane, as indicated by the red arrows in Figure 8. This finding is particularly favourable, as it shows that the neutral complexes could successfully penetrate cells, corroborating previous studies [47,48]. These results are noteworthy because they indicate that the complexes may have potential to act against intracellular bacteria, being a promising approach for monitoring the bactericidal action of the compounds [49].
4. Conclusions
A hydrazone ligand derived from isoniazid was synthesized, enabling the formation of three polymeric lanthanide complexes (Sm3+, Gd3+, Yb3+) with good yields. These complexes exhibited unique coordination features and notable photophysical properties, including a combination of fluorescent and phosphorescent emissions. Antibacterial studies revealed high efficacy against both Gram-positive (Staphylococcus aureus and MRSA) and Gram-negative bacteria (Escherichia coli and Pseudomonas aeruginosa). Additionally, the complexes exhibited strong biofilm inhibition against E. coli, P. aeruginosa, and S. aureus. Cytotoxicity tests showed that the free complexes exhibited minimal toxicity, while the NPs alone demonstrated higher cytotoxic effects. Furthermore, intracellular observation of the free complexes was successfully achieved using their intrinsic luminescence properties, a feature not observed for the NPs. Upon functionalizing the Bi2O3/Bi2S3 nanoparticles (NPs) with the ytterbium complex, the FTIR analysis indicated structural changes. However, this combination resulted in reduced emission intensity. Cytotoxicity tests revealed minimal toxicity for the free complexes, while the NPs alone showed higher cytotoxic effects. Finally, the intracellular observation of the free complexes was successfully achieved using their intrinsic luminescence properties, a feature not observed for the NPs. In conclusion, these lanthanide coordination polymers not only exhibit significant antibacterial activity, but also have the potential to eliminate bacteria within intracellular environments also serving as intracellular probes.
Supplementary Materials
The following supporting information can be downloaded at the website of this paper posted on Preprints.org, Table S1: Refinement data for [{Gd(L1)2}{Gd(L1)(H2O)2}]n∙4MeOH (2∙4MeOH). Figure S1.1: IR (ATR) spectrum of H2L1; Figure S1.2: IR (ATR) spectrum of [{Sm(L1)2}{Sm(L1)(H2O)2}]n (1); Figure S1.3: IR (ATR) spectrum of [{Gd(L1)2}{Gd(L1)(H2O)2}]n (2); Figure S1.4: IR (ATR) spectrum of {Yb(L1)2}{Yb(L1)(H2O)2}]n (3); Table S2: Selected absorption bands in the infrared region for free ligands and complexes; Figure S2.1: 1H NMR spectrum of H2L1 in DMSO-d6; Table S3: Assignments for the 1H NMR spectrum of the ligand in DMSO-d6 (δ ppm); Figure S3.1: ESI(+) MS spectrum of [{Sm(L1)2}{Sm(L1)(H2O)2}]n (1); Figure S3.2: ESI(+) MS spectrum of [{Gd(L1)2}{Gd(L1)(H2O)2}]n (2); Figure S3.3: ESI(+) MS spectrum of ESI(+) MS spectrum of [{Yb(L1)2}{Yb(L1)(H2O)2}]n (3); Figure S4.1: Crystal structure of the complex [{Yb(L1)2}{Yb(L1)(H2O)2}]n (3); Figure S4.2: Polymeric structure of the complex [{Yb(L1)2}{Yb(L1)(H2O)2}]n (3); Figure S5.1: Electronic spectra of H2L1 (10-5 M CH3OH solution); Figure S5.2: Emission spectra of the complexes [{Sm(L1)2}{Sm(L1)(H2O)2}]n (1) (green line), complex [{Gd(L1)2}{Gd(L1)(H2O)2}]n (2) (blue line) and complex [{Yb(L1)2}{Yb(L1)(H2O)2}]n (3) (wine line) bubbled with argon (solid line) and O2 (dashed line) in MeOH at 298 K; λexc = 340 nm (for 3); Figure S5.3: Emission spectra of the complexes [{Sm(L1)2}{Sm(L1)(H2O)2}]n (1), [{Gd(L1)2}{Gd(L1)(H2O)2}]n (2) and [{Yb(L1)2}{Yb(L1)(H2O)2}]n (3) under different excitation wavelengths; Figure S5.4: Experimental emission spectra of complex [{Sm(L1)2}{Sm(L1)(H2O)2}]n (1) (green line), complex [{Gd(L1)2}{Gd(L1)(H2O)2}]n (2) (blue line) and complex [{Yb(L1)2}{Yb(L1)(H2O)2}]n (3) (wine line) in ethanol: methanol 4:1 at 77 K (dashed line) and at 298 K (solid line), λexc = 340 nm; Figure S6.1: Graphics of the antibacterial activity of the ligand and its samarium, gadolinium and ytterbium complexes.; Table S4. Antibacterial activity of the ligand and its samarium, gadolinium and ytterbium complexes.; Table S5. Antibacterial activity of the ligand its samarium, gadolinium and ytterbium complexes on the bacterial biofilm. Figure S7.1: IR (ATR) spectrum of the Bi2O3/Bi2S3 nanoparticles (gray), Yb3+ complex (blue) and NP/Complex combination (red); Figure S7.2: Photoluminescence spectra of Bi2O3/Bi2S3 nanoparticles, Yb3+ complex, and NP/Complex; Table S6. Main absorption bands in the infrared region of compounds in ATR (cm-1).
Author Contributions
Conceptualization, I.A.T.G., M.M.S.O., A.O.T.P., M.V.S., R.S.S., P.I.S.M.; methodology, I.A.T.G., A.O.T.P., M.V.S., R.S.S., P.I.S.M..; validation, I.A.T.G., M.M.S.O., H.F.P., B.S.M., A.P.B., M.E.G.C.; formal analysis, I.A.T.G., M.M.S.O., H.F.P., B.S.M., A.O.T.P., M.V.S., R.S.S., P.I.S.M.; investigation, I.A.T.G., M.M.S.O., H.F.P., B.S.M., A.P.B., M.E.G.C., P.I.S.M..; resources, A.O.T.P., M.V.S., R.S.S., P.I.S.M.; data curation, I.A.T.G., M.M.S.O., H.F.P.; writing—original draft preparation, I.A.T.G., P.I.S.M.; writing—review and editing, I.A.T.G., M.M.S.O., H.F.P., A.O.T.P., M.V.S., R.S.S., P.I.S.M.; visualization, P.I.S.M.; supervision, A.O.T.P., M.V.S., R.S.S., P.I.S.M..; project administration, P.I.S.M.; funding acquisition, P.I.S.M. All authors have read and agreed to the published version of the manuscript.
Funding
This research was funded by the CNPq: (grants: 309462/2021-5, 408926/2021-0, 311747/2023-0 and 404025/2024-2), FAPEMIG (grants: APQ-03174-18 and APQ-00834-24) and Coordenação de Aperfeiçoamento de Pessoal de Nível Superior (CAPES). Iara A. T. Gaia would like to thank FAPEMIG (Grant: BPD-00186-22) for the scholarship. The authors are also thankful to the Rede Mineira de Materiais Inorgânicos (RM2I), a research group supported by FAPEMIG (RED-00116-23).
Institutional Review Board Statement
Not applicable.
Informed Consent Statement
Not applicable.
Data Availability Statement
The data could be requested from authors.
Acknowledgments
We acknowledge the assistance of the Core Facility BioSupraMol supported by the DFG.
Conflicts of Interest
The authors declare no conflict of interest.
References
- Li, M; Liu, Y; Gong, Y.; Yan, X; Wang, L; Zheng, W; Zhao, Y. Recent advances in nanoantibiotics against multidrug-resistant bacteria. Nanoscale Adv. 2023, 5, 6278-6317. [CrossRef]
- Walsh, T. R; Gales, A. C; Laxminarayan, R; Dodd, P. C. Antimicrobial resistance: addressing a global threat to humanity. PLoS Medicine 2023, 20, e1004264. [CrossRef]
- Antimicrobial Resistance Collaborators. Global burden of bacterial antimicrobial resistance in 2019: a systematic analysis. Lancet 2022, 399, 629–55. [CrossRef]
- Moriel, D. G.; Piccioli, D.; Raso, M. M.; Pizza, M. The overlooked bacterial pandemic. Semin. Immunopathol. 2024, 45, 481–491. [CrossRef]
- Huang, T.; Zheng, Y.; Yan, Y.; Yang, L.; Yao, Y.; Zheng, J.; Wu, L.; Wang, X.; Chen, Y.; Xing, J.; Yan, X. Probing minority population of antibiotic-resistant bacteria. Biosens. Bioelectron. 2016, 80, 323-330. [CrossRef]
- Lobana, T. S.; Kumari, P.; Hundal, G.; Butcher, R. J. Metal derivatives of N1- substituted thiosemicarbazones with divalent metal ions (Ni, Cu): Synthesis and structures. Polyhedron. 2010, 29, 1130-1136. [CrossRef]
- Sousa, E. H. S.; Pontes, D. L.; Diógenes, I. C. N.; Lopes, L. G. F.; Oliveira, J. S.; Basso, L. A.; Santos, D. S.; Moreira, Í. S. Electron transfer kinetics and mechanistic study of the thionicotinamide coordinated to the pentacyanoferrate (III)/(II) complexes: a model system for the in vitro activation of thionamides anti-tuberculosis drugs. J. Inorg. Bioch. 2005, 99, 368-375. [CrossRef]
- Tarallo, M. B.; Urguiola, C.; Monge, A.; Costa, B. P.; Ribeiro, R. R.; Costa-Filho, A. J.; et al. Design of novel iron compounds as potential therapeutic agents against tuberculosis. J. Inorg. Biochem. 2010, 104, 1164-1170. [CrossRef]
- Ronconi, L.; Sadler, P. J. Using coordination chemistry to design new medicines. Coord. Chem. Rev. 2007, 251, 1633-1648. [CrossRef]
- Heffern, M. C.; Matosziuk, L. M.; Meade, T. J. Lanthanide probes for bioresponsive imaging. Chem. Rev. 2014, 114, 4496- 4539. dx.doi.org/10.1021/cr400477t.
- Taha, Z. A.; Ababneh, T. S.; Hijazi, A. K.; Abu-Salem, Q.; Ajlouni, M. A.; Ebwany, S. Synthesis, density functional theory calculations and luminescence of lanthanide complexes with 2,6- bis [(3-methoxybenzylidene) hydrazinocarbonyl] pyridine Schiff base ligand. Luminescence. 2018, 33, 79-88. [CrossRef]
- D’Aléo, A.; Pointillart, F.; Ouahab, L.; Andraud, C.; Maury, O.; Charge transfer excited states sensitization of lanthanide emitting from the visible to the near-infra-red. Coord. Chem. Rev. 2012, 256, 1604-1620. [CrossRef]
- Sousa Filho, P. C. de; Serra, O. A. Terras raras no Brasil: histórico, produção e perspectivas. Quim. Nova. 2014, 37, 753-760. [CrossRef]
- Theppitak, C; Kielar, F; Dungkaew, W; Sukwattanasinitt, M.; Kangkaew, L; Sahasithiwat, S; Chainok, K. The coordination chemistry of benzhydrazide with lanthanide (III) ions: Hydrothermal in situ ligand formation, structures, magnetic and photoluminescence sensing properties. RSC Adv. 2021, 11, 24709-24721. [CrossRef]
- Mali, S. N; Thorat, B. R; Gupta, D. R; Pandey, A. Mini-review of the importance of hydrazides and their derivatives—Synthesis and biological activity. Eng. Proc. 2021, 11, 21. [CrossRef]
- Pisk, J; Đilovic, I; Hrenar, T; Cvijanovic, D; Pavlovic, G; Vrdoljak, V. Effective methods for the synthesis of hydrazones, quinazolines, and Schiff bases: Reaction monitoring using a chemometric approach, RSC Adv. 2020, 10, 38566–38577. [CrossRef]
- Verma, G.; Marella, A.; Shaquiquzzaman, M.; Akhtar, M.; Ali, M. R.; Alam, M. M. A review exploring biological activities of hydrazones. J. Pharm. Bioall. Sci. 2014, 6, 69. 10.4103/0975-7406.129170.
- Alvarado-Peña, N.; Galeana-Cadena, D.; Gómez-García, I. A.; Mainero, X. S.; Silva-Herzog, E. The microbiome and the gut-lung axis in tuberculosis: interplay in the course of disease and treatment. Front. Microbiol., 2023, 14, 1237998. [CrossRef]
- Alpha, B.; Ballardini, R.; Balzani, V.; Lehn, J. M.; Perathoner, S.; Sabbatini, N.; Antenna Effect in Luminescent Lanthanide Cryptates: A Photophysical Study. Photochem. Photobiol. 1990, 52, 299-306. [CrossRef]
- Pavan, F. R.; Maia, P. I. S.; Leite, S.R.A.; Deflon, V. M.; Batista, A. A.; Sato, D. N.; Franzblau, S. G.; Leite, C. Q. F. Thiosemicarbazones, semicarbazones, dithiocarbazates and hydrazide/hydrazones: Anti-mycobacterium tuberculosis activity and cytotoxicity. Eur. J. Med. Chem. 2010, 45, 1898-1905. [CrossRef]
- Mohammed, M. Synthesis and characterization of bis-acylhydrazone derivatives as tetradentate ligands and their dinuclear metal(II) complexes. Periodica Polytech. 2012, 56, 83-90. [CrossRef]
- Leitao, R. C; Silva, F; Ribeiro, G. H; Santos, I. C; Guerreiro, J. F; Mendes, F; Deflon, V. M. Gallium and indium complexes with isoniazid-derived ligands: Interaction with biomolecules and biological activity against cancer cells and Mycobacterium tuberculosis. J. Inorg. Biochem. 2023, 240, 112091. [CrossRef]
- Hegazy, W. H.; Al-Motawaa, I. H. Lanthanide Complexes of Substituted β-Diketone Hydrazone Derivatives: Synthesis, Characterization, and Biological Activities. Bioinorg. Chem. Appl. 2011, 2011, 1-10. [CrossRef]
- López-Torres, E.; Mendiola, M. A. Structural diversity of benzil bis(benzoylhydrazone): Mononuclear, binuclear and trinuclear complexes. Dalton Trans. 2009, 37, 7639–7647. [CrossRef]
- Hussain, N.; Joshi, P.; Bhandari, A.; Dangi, R.; Khanam, R.; Talesara, G. L. Synthesis, Biological Evaluation and Electrochemical Studies of Cu (II) and Ni (II) Complexes of N’, N”-1, 2-Diphenylethane-1, 2- diylidenedibenzohydrazide. Int. J. Pharm. Sci. Drug Res. 2010, 2, 272-274.
- Gaia, I. A. T.; Guimarães, E. V.; Maia, P. I. S.; Milkhail, H. D.; Da Luz, M. S.; Silva, A.C.A.; Silva, R. S. Synthesis and investigation of optical and structural properties of Bi2O3/Bi2S3 nanoparticles in an aqueous solution. Physica B. 2023, 662, 414947. [CrossRef]
- Sheldrick, G. SADABS, vers. 2014/5; University of Göttingen: Göttingen, Germany, 2014.
- Coppens, P. The Evaluation of Absorption and Extinction in Single-Crystal Structure Analysis. Crystallographic Computing; Muksgaard: Copenhagen, Denmark, 1979.
- Sheldrick, G.M. A short history of SHELX. Acta Crystallogr. Sect. A Found. Crystallogr. 2008, 64, 112–122. [CrossRef]
- Sheldrick, G.M. Crystal structure refinement with SHELXL. Acta Crystallogr. Sect. C Struct. Chem. 2015, 71, 3–8. [CrossRef]
- Dolomanov, O.V.; Bourhis, L.J.; Gildea, R.J.; Howard, J.A.; Puschmann, H. OLEX2: A complete structure solution, refinement and analysis program. J. Appl. Crystallogr. 2009, 42, 339–341. [CrossRef]
- Macrae, C.F.; Sovago, I.; Cottrell, S.J.; Galek, P.T.A.; McCabe, P.; Pidcock, E.; Platings, M.; Shields, G.P.; Stevens, J.S.; Towler, M.; et al. Mercury 4.0: From visualization to analysis, design and prediction. J. Appl. Crystallogr. 2020, 53, 226–235. [CrossRef]
- Perini, H. F.; Pereira, B. B.; Sousa, E. G.; Matos, B. S.; Prado, L. C. S.; Azevedo, V. A. C.; Soares, S. C.; Silva, M. V. Inhibitory effect of Bacillus velezensis 1273 strain cell-free supernatant against developing and preformed biofilms of Staphylococcus aureus and MRSA. Microb. Pathog. 2024, 197, 107065. [CrossRef]
- Rocha, K. R.; Perini, H. F.; De Souza, C. M.; Schueler, J.; Tosoni, N. F.; Furlaneto, M. C.; Maia, L.F. Inhibitory effect of bacteriocins from enterococci on developing and preformed biofilms of Listeria monocytogenes, Listeria ivanovii and Listeria innocua. World J. Microbiol. Biotechnol. 2019, 35, 1-11. [CrossRef]
- Lees, A. J. The luminescence rigidochromic effect exhibited by organometallic complexes: rationale and applications. Comments Inorg. Chem. 1995, 17, 319-346. [CrossRef]
- Ramos, C. L.; Prado, F. S.; Carmo, M. E. G.; Farias, G.; Souza, B.; Machado, A. E. H.; Patrocinio, A. O. T. Temperature dependent emission properties of ReI tricarbonyl complexes with dipyrido-quinoxaline and phenazine ligands. J. Braz. Chem. Soc. 2022, 33, 425-436. [CrossRef]
- do Carmo, M. E; de Matos, P. A; Maia, P. I. S.; Machado, A. E. H; Beletti, M. E; Tsubone, T. M; Patrocinio, A. O. T. The photophysics of Ir (III) cyclometalated complexes containing the 2-(2-pyridyl) benzimidazole ancillary ligand: Protonation effect and their potential as specific lysosome probes in cells. J. Photochem. Photobiol. A: Chem. 2024, 448, 115339. [CrossRef]
- Diekema, D. J.; Pfaller, M. A.; Schmitz, F. J.; Smayevsky, J.; Bell, J.; Jones, R. N.; Beach, M. Survey of Infections Due to Staphylococcus Species: Frequency of Occurrence and Antimicrobial Susceptibility of Isolates Collected in the United States, Canada, Latin America, Europe, and the Western Pacific Region for the SENTRY Antimicrobial Surveillance Program, 1997–1999. Clin. Infect. Dis., 2011, 32, S114–S132. [CrossRef]
- Lakhundi, S.; Zhang, K. Methicillin-Resistant Staphylococcus aureus: Molecular Characterization, Evolution, and Epidemiology. Clin. Microbiol. Rev. 2018, 31, 10.1128/cmr.00020-18. [CrossRef]
- Obaleye, J. A.; Adediji, J. F.; Adebayo, M. A. Synthesis and biological activities on metal complexes of 2, 5-diamino-1, 3, 4-thiadiazole derived from semicarbazide hydrochloride. Molecules 2011, 16, 5861-5874. [CrossRef]
- Costerton, J. W.; Stewart, P. S.; Greenberg, E. P. Bacterial biofilms: a common cause of persistent infections. Science 1999, 284, 1318-1322. [CrossRef]
- Park, K.-H.; Kim, D.; Jung, M.; Kim, D. Y.; Lee, Y.-M.; Lee, M. S.; Hong, K.-W.; Bae, I.-G.; Hong, S. I.; Cho, O.-H. Effects of sub-inhibitory concentrations of nafcillin, vancomycin, ciprofloxacin, and rifampin on biofilm formation of clinical methicillin-resistant Staphylococcus aureus. Microbiol. Spectrum 2024, 12:e03412-23. [CrossRef]
- Qiu, Y.; Wu, Y.; Lu, B.; Zhu, G.; Gong, T.; Wang, R.; Peng, Q.; Li, Y. Inhibition of methicillin-resistant Staphylococcus aureus (MRSA) biofilm by cationic poly (D, L-lactide-co-glycolide) nanoparticles. Biofouling 2020, 36(2), 159–168. [CrossRef]
- Abu-Yamin, A. A., Abduh, M. S., Saghir, S. A. M., Al-Gabri, N. (2022). Synthesis, characterization and biological activities of new Schiff base compound and its lanthanide complexes. Pharmaceuticals 2022, 15, 454. [CrossRef]
- Cheeseman, S.; Christofferson, A. J.; Kariuki, R.; Cozzolino, D.; Daeneke, T.; Crawford, R. J.; Elbourne, A. Antimicrobial metal nanomaterials: from passive to stimuli-activated applications. Adv. Sci. 2020, 7, 1902913. [CrossRef]
- Pavanelli, A. L.; Máximo, L. N.; Da Silva, R. S.; Borissevitch, I. E. Effect of Serum Albumin on Porphyrin-Quantum Dot Complex Formation, Characteristics and Spectroscopic Analysis. Nanomaterials 2021, 11(7), 1674. [CrossRef]
- Monteiro, J. H. Recent advances in luminescence imaging of biological systems using lanthanide (III) luminescent complexes. Molecules 2020, 25, 2089. [CrossRef]
- Sy, M., Nonat, A., Hildebrandt, N., Charbonnière, L. J. Lanthanide-based luminescence biolabelling. Chem. Commun. 2016, 52, 5080-5095. [CrossRef]
- Charbonnière, L. J.; Hildebrandt, N. Lanthanide Complexes and Quantum Dots: A Bright Wedding for Resonance Energy Transfer. Eur. J. Inorg. Chem. 2008, 2008, 3241-3251. [CrossRef]
Scheme 1.
Synthesis of the complexes [{Sm(L1)2}{Sm(L1)(H2O)2}]n (1), [{Gd(L1)2}{Gd(L1)(H2O)2}]n (2) and [{Yb(L1)2}{Yb(L1)(H2O)2}]n (3).
Scheme 1.
Synthesis of the complexes [{Sm(L1)2}{Sm(L1)(H2O)2}]n (1), [{Gd(L1)2}{Gd(L1)(H2O)2}]n (2) and [{Yb(L1)2}{Yb(L1)(H2O)2}]n (3).
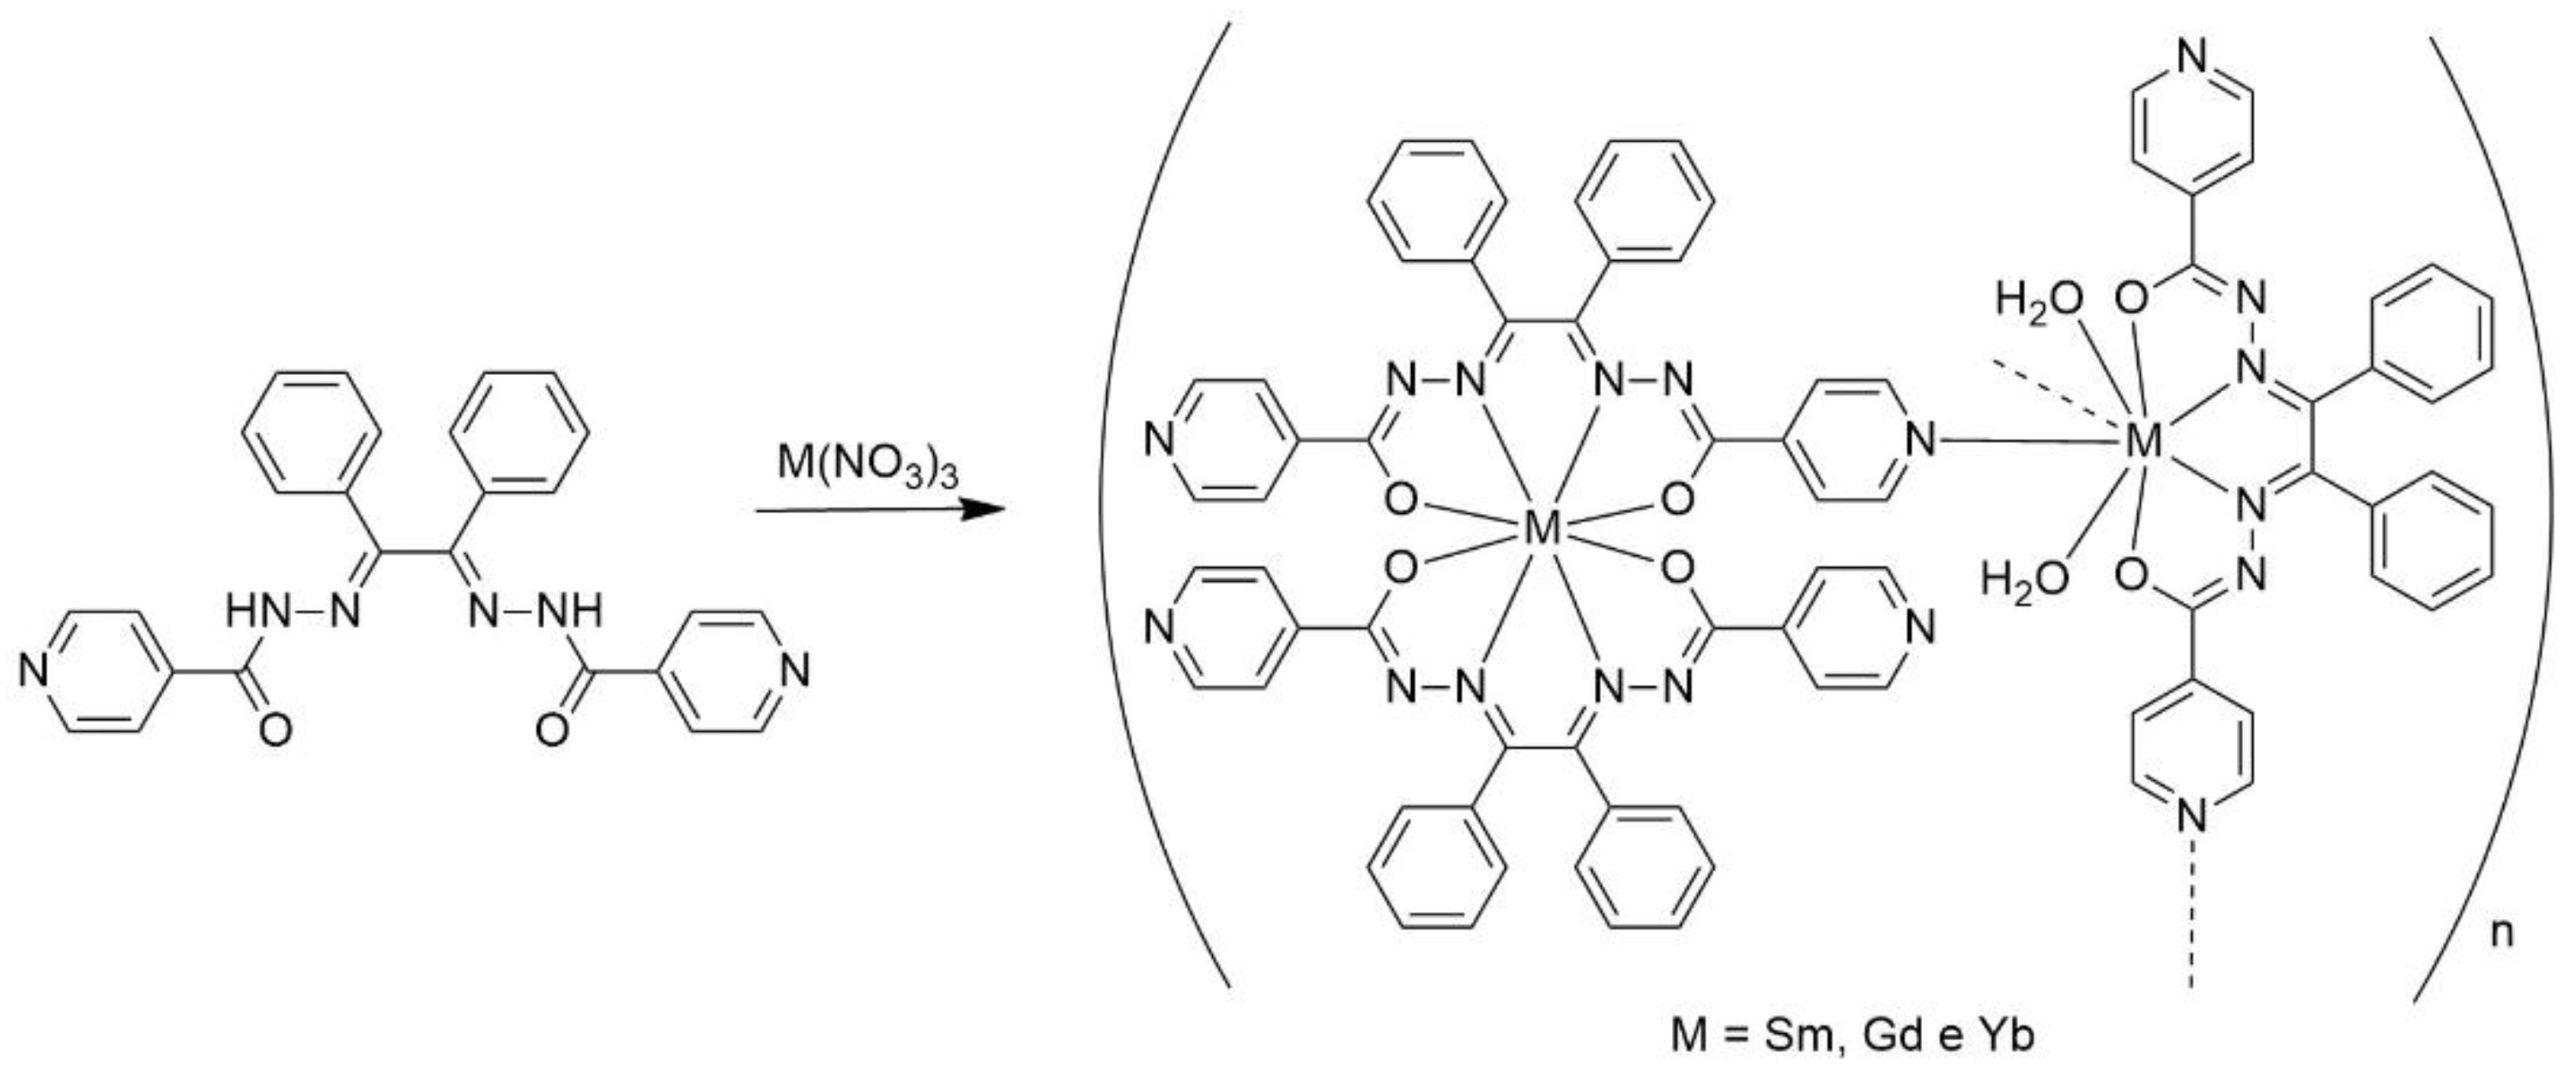
Figure 1.
Crystalline and molecular structure (left) and unit cell (right) of the ligand H2L1.
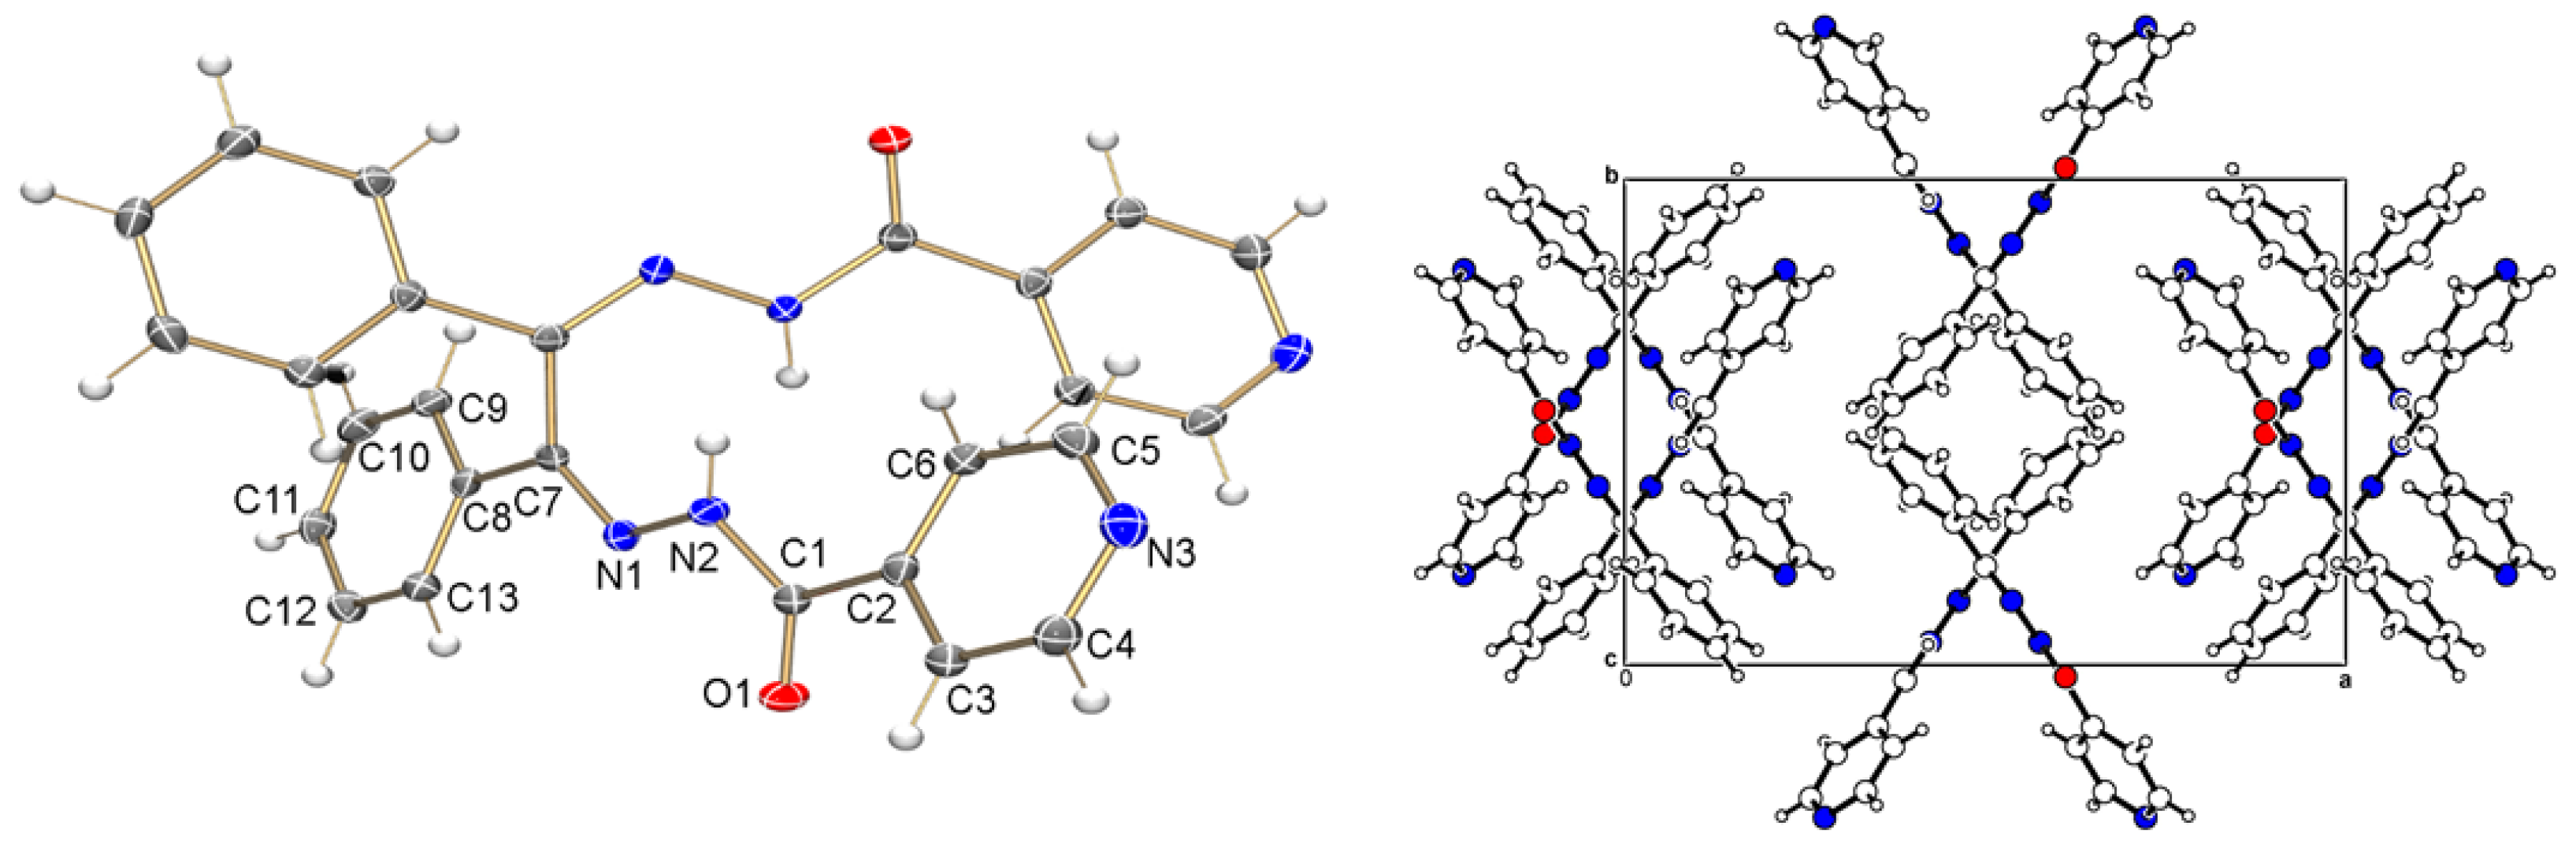
Figure 2.
Asymmetric unit of the coordination polymer [{Gd(L1)2}{Gd(L1)(H2O)2}]n (left) and crystal structure of the complex [{Gd(L1)2}2{Gd(L1)(H2O)2}]n (right). Solvent molecules were omitted for clarity. Atoms N1'' and Gd1' were generated by symmetry. The symmetry operations to generate equivalent atoms are: (') x, 1.5-y, -1/2+z (''); x, 1.5-y, 1/2+z. .
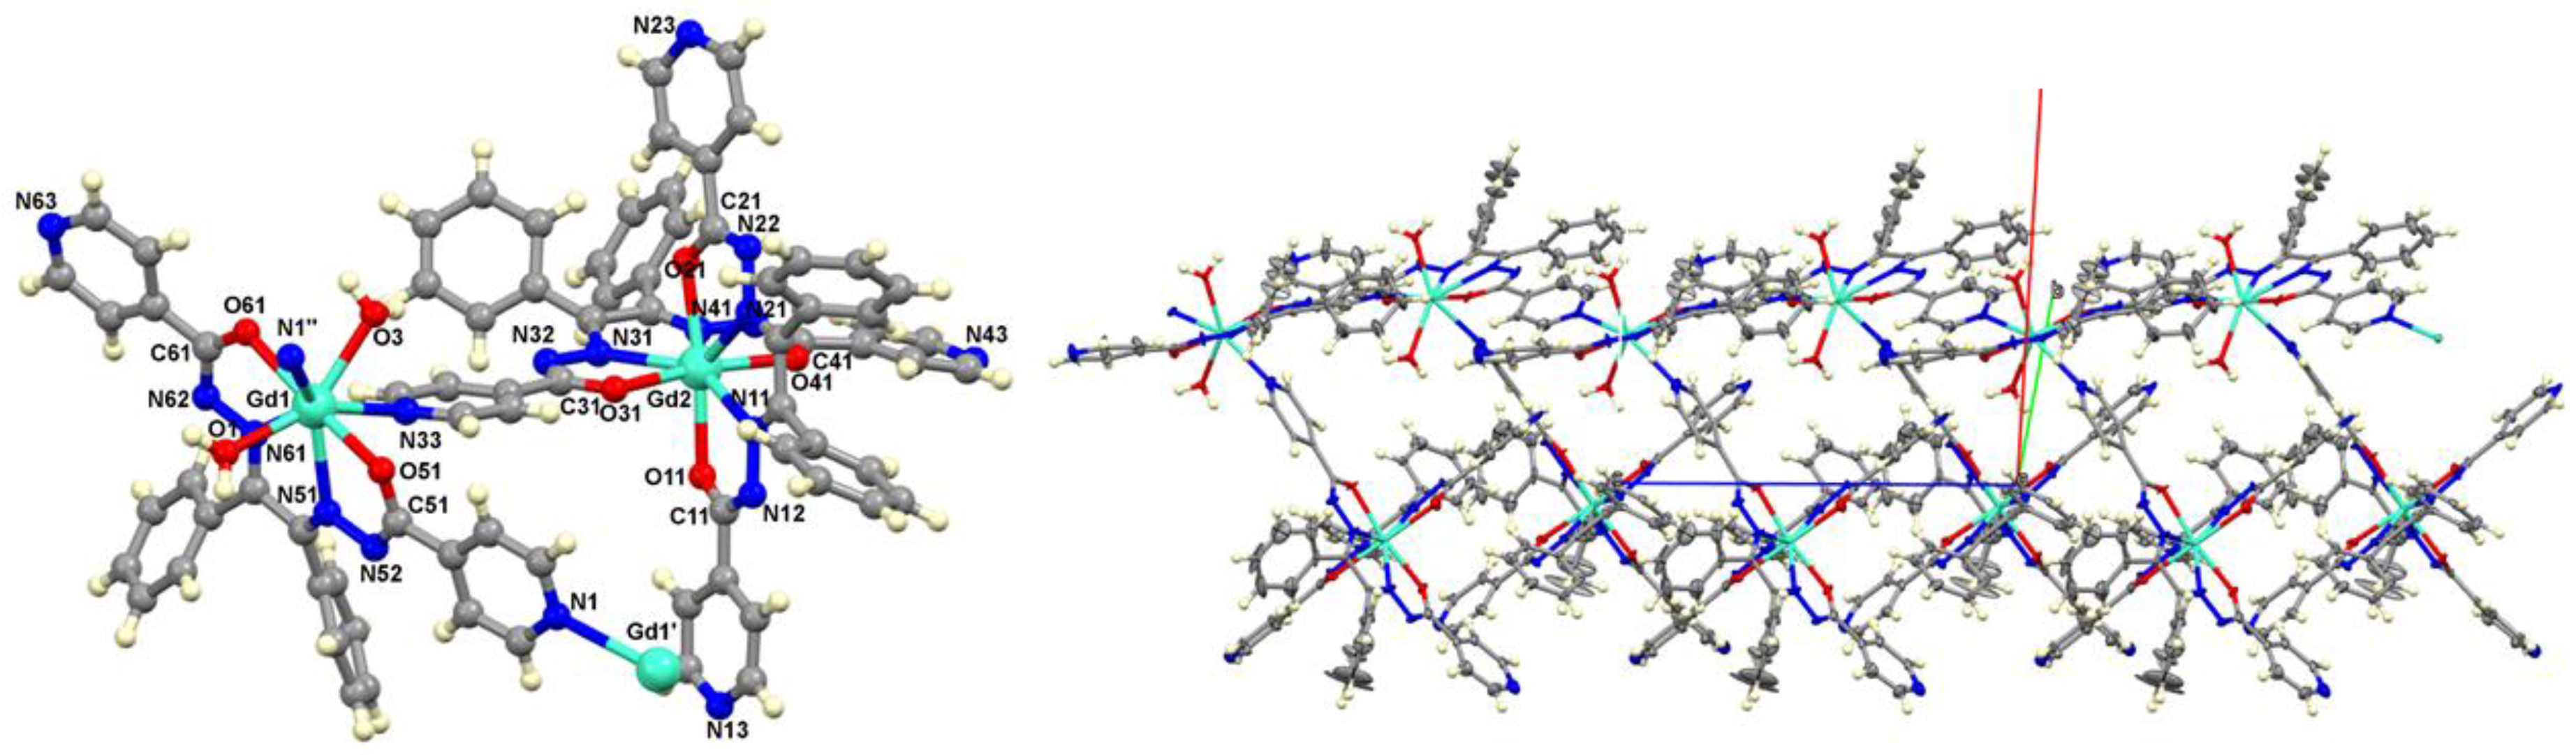
Figure 3.
(Left) Absorption spectrum (solid line) and emission at 298 K (dotted line) of complexes 1 (green line), 2 (blue line), and 3 (wine-coloured line). (Right) Yb³⁺ complex solution without (on the left) and with irradiation (on the right).
Figure 3.
(Left) Absorption spectrum (solid line) and emission at 298 K (dotted line) of complexes 1 (green line), 2 (blue line), and 3 (wine-coloured line). (Right) Yb³⁺ complex solution without (on the left) and with irradiation (on the right).
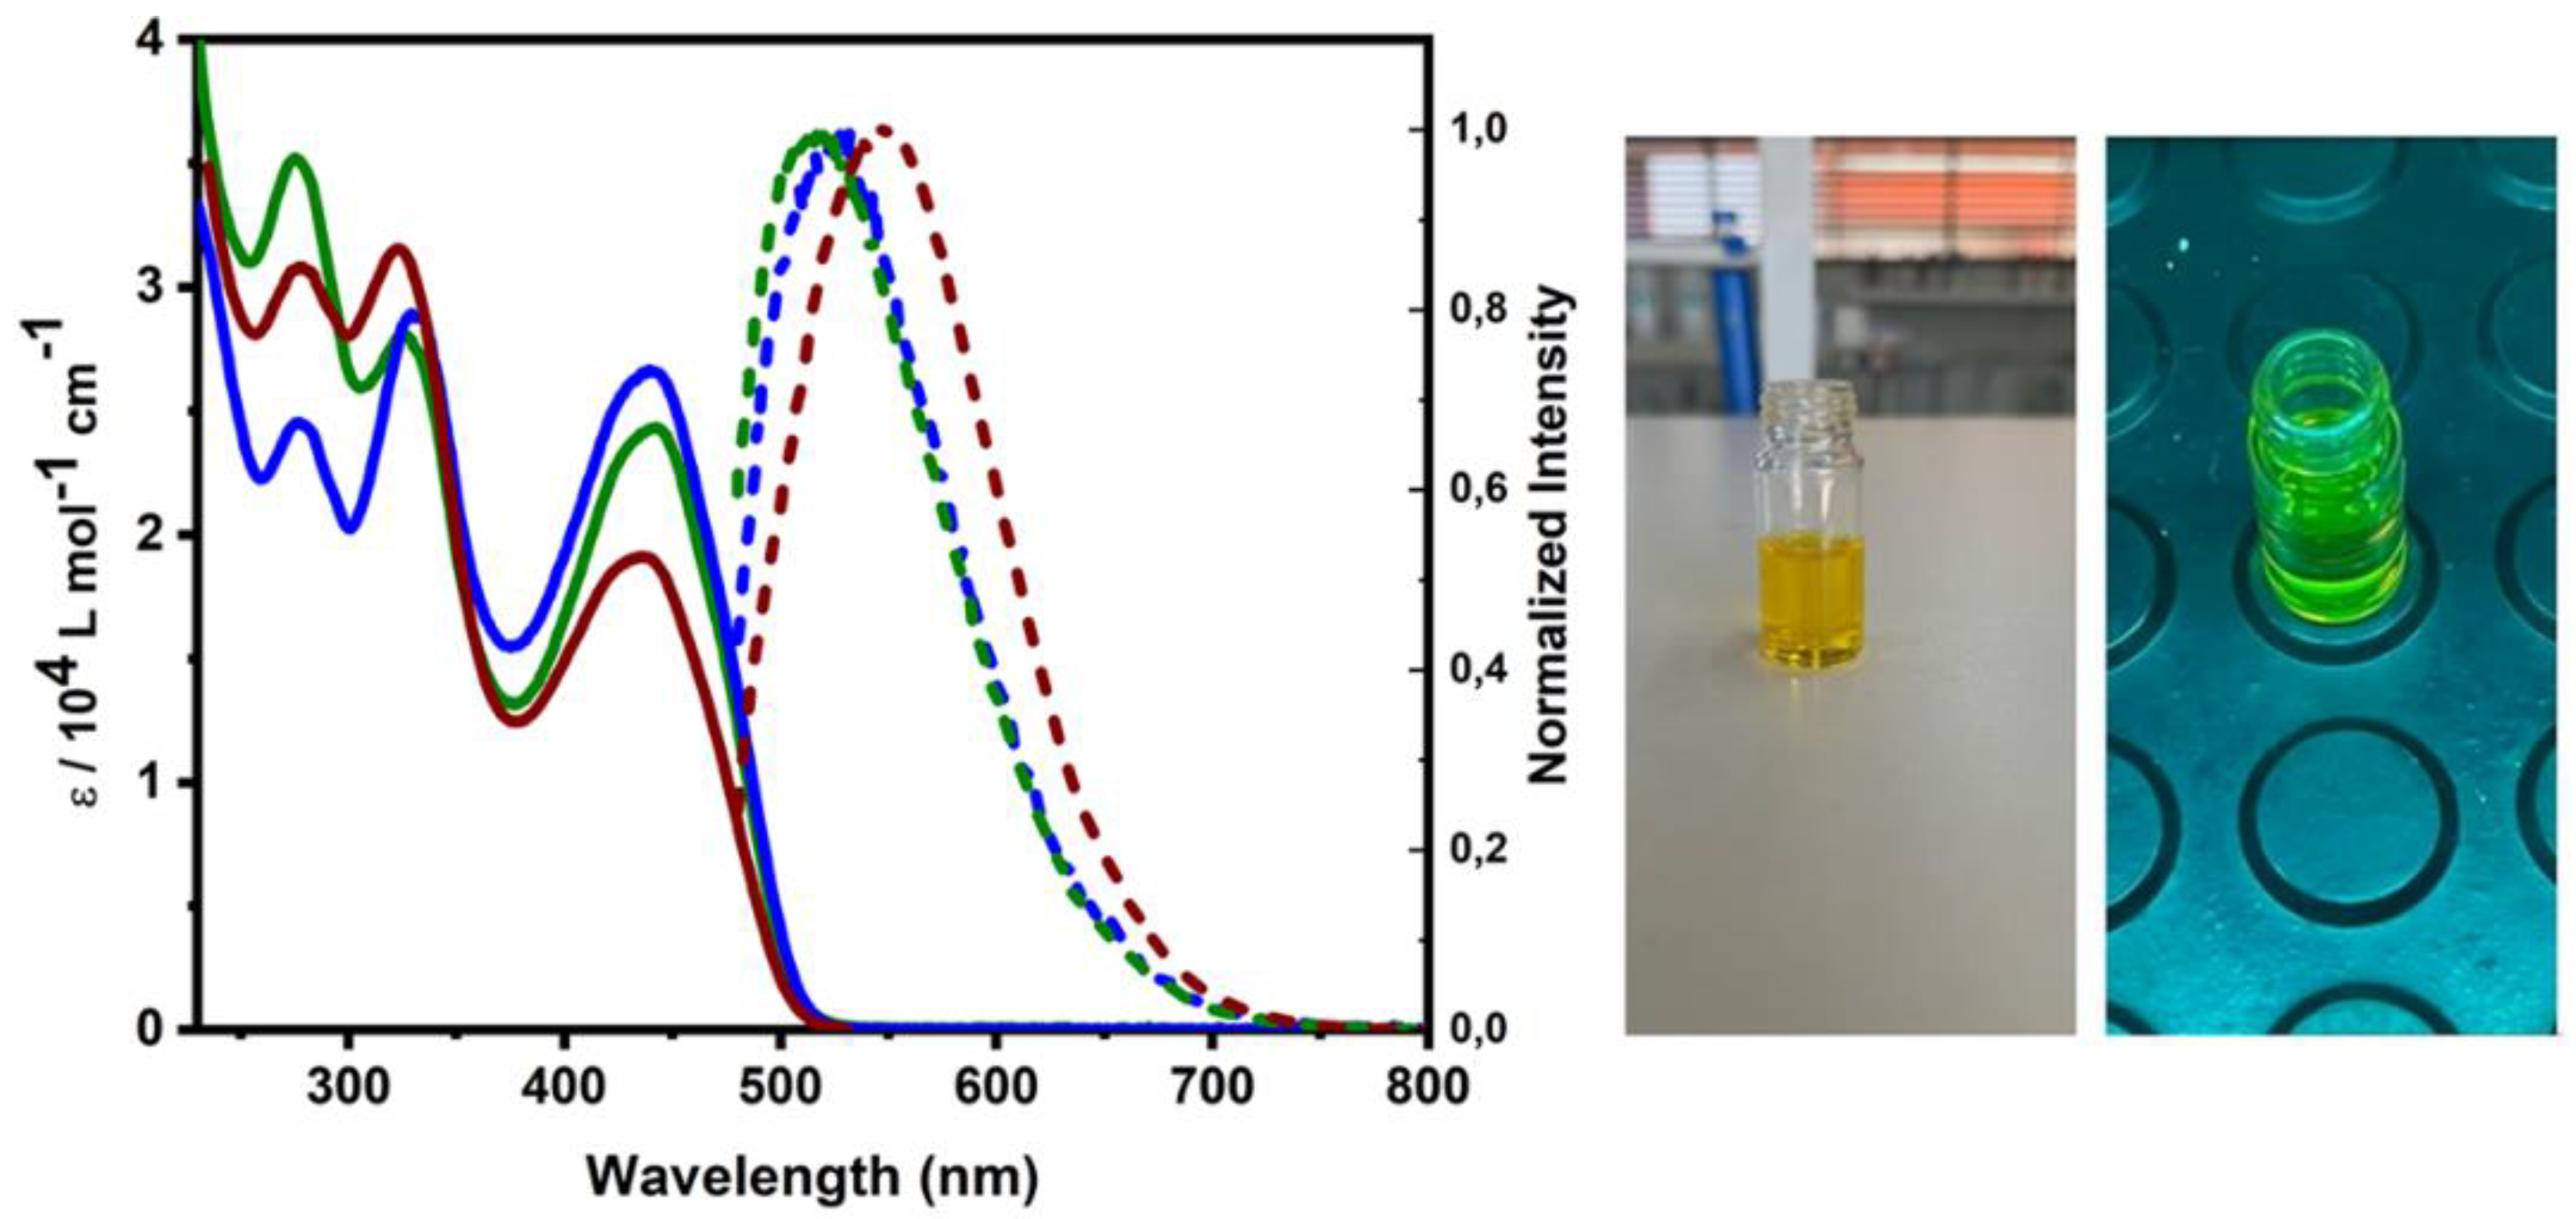
Figure 4.
Graph of the antibacterial activity of the ligand and its Samarium, Gadolinium, and Ytterbium complexes on bacterial biofilm against E coli, P. aeruginosa, S. aureus and MRSA bacteria.
Figure 4.
Graph of the antibacterial activity of the ligand and its Samarium, Gadolinium, and Ytterbium complexes on bacterial biofilm against E coli, P. aeruginosa, S. aureus and MRSA bacteria.
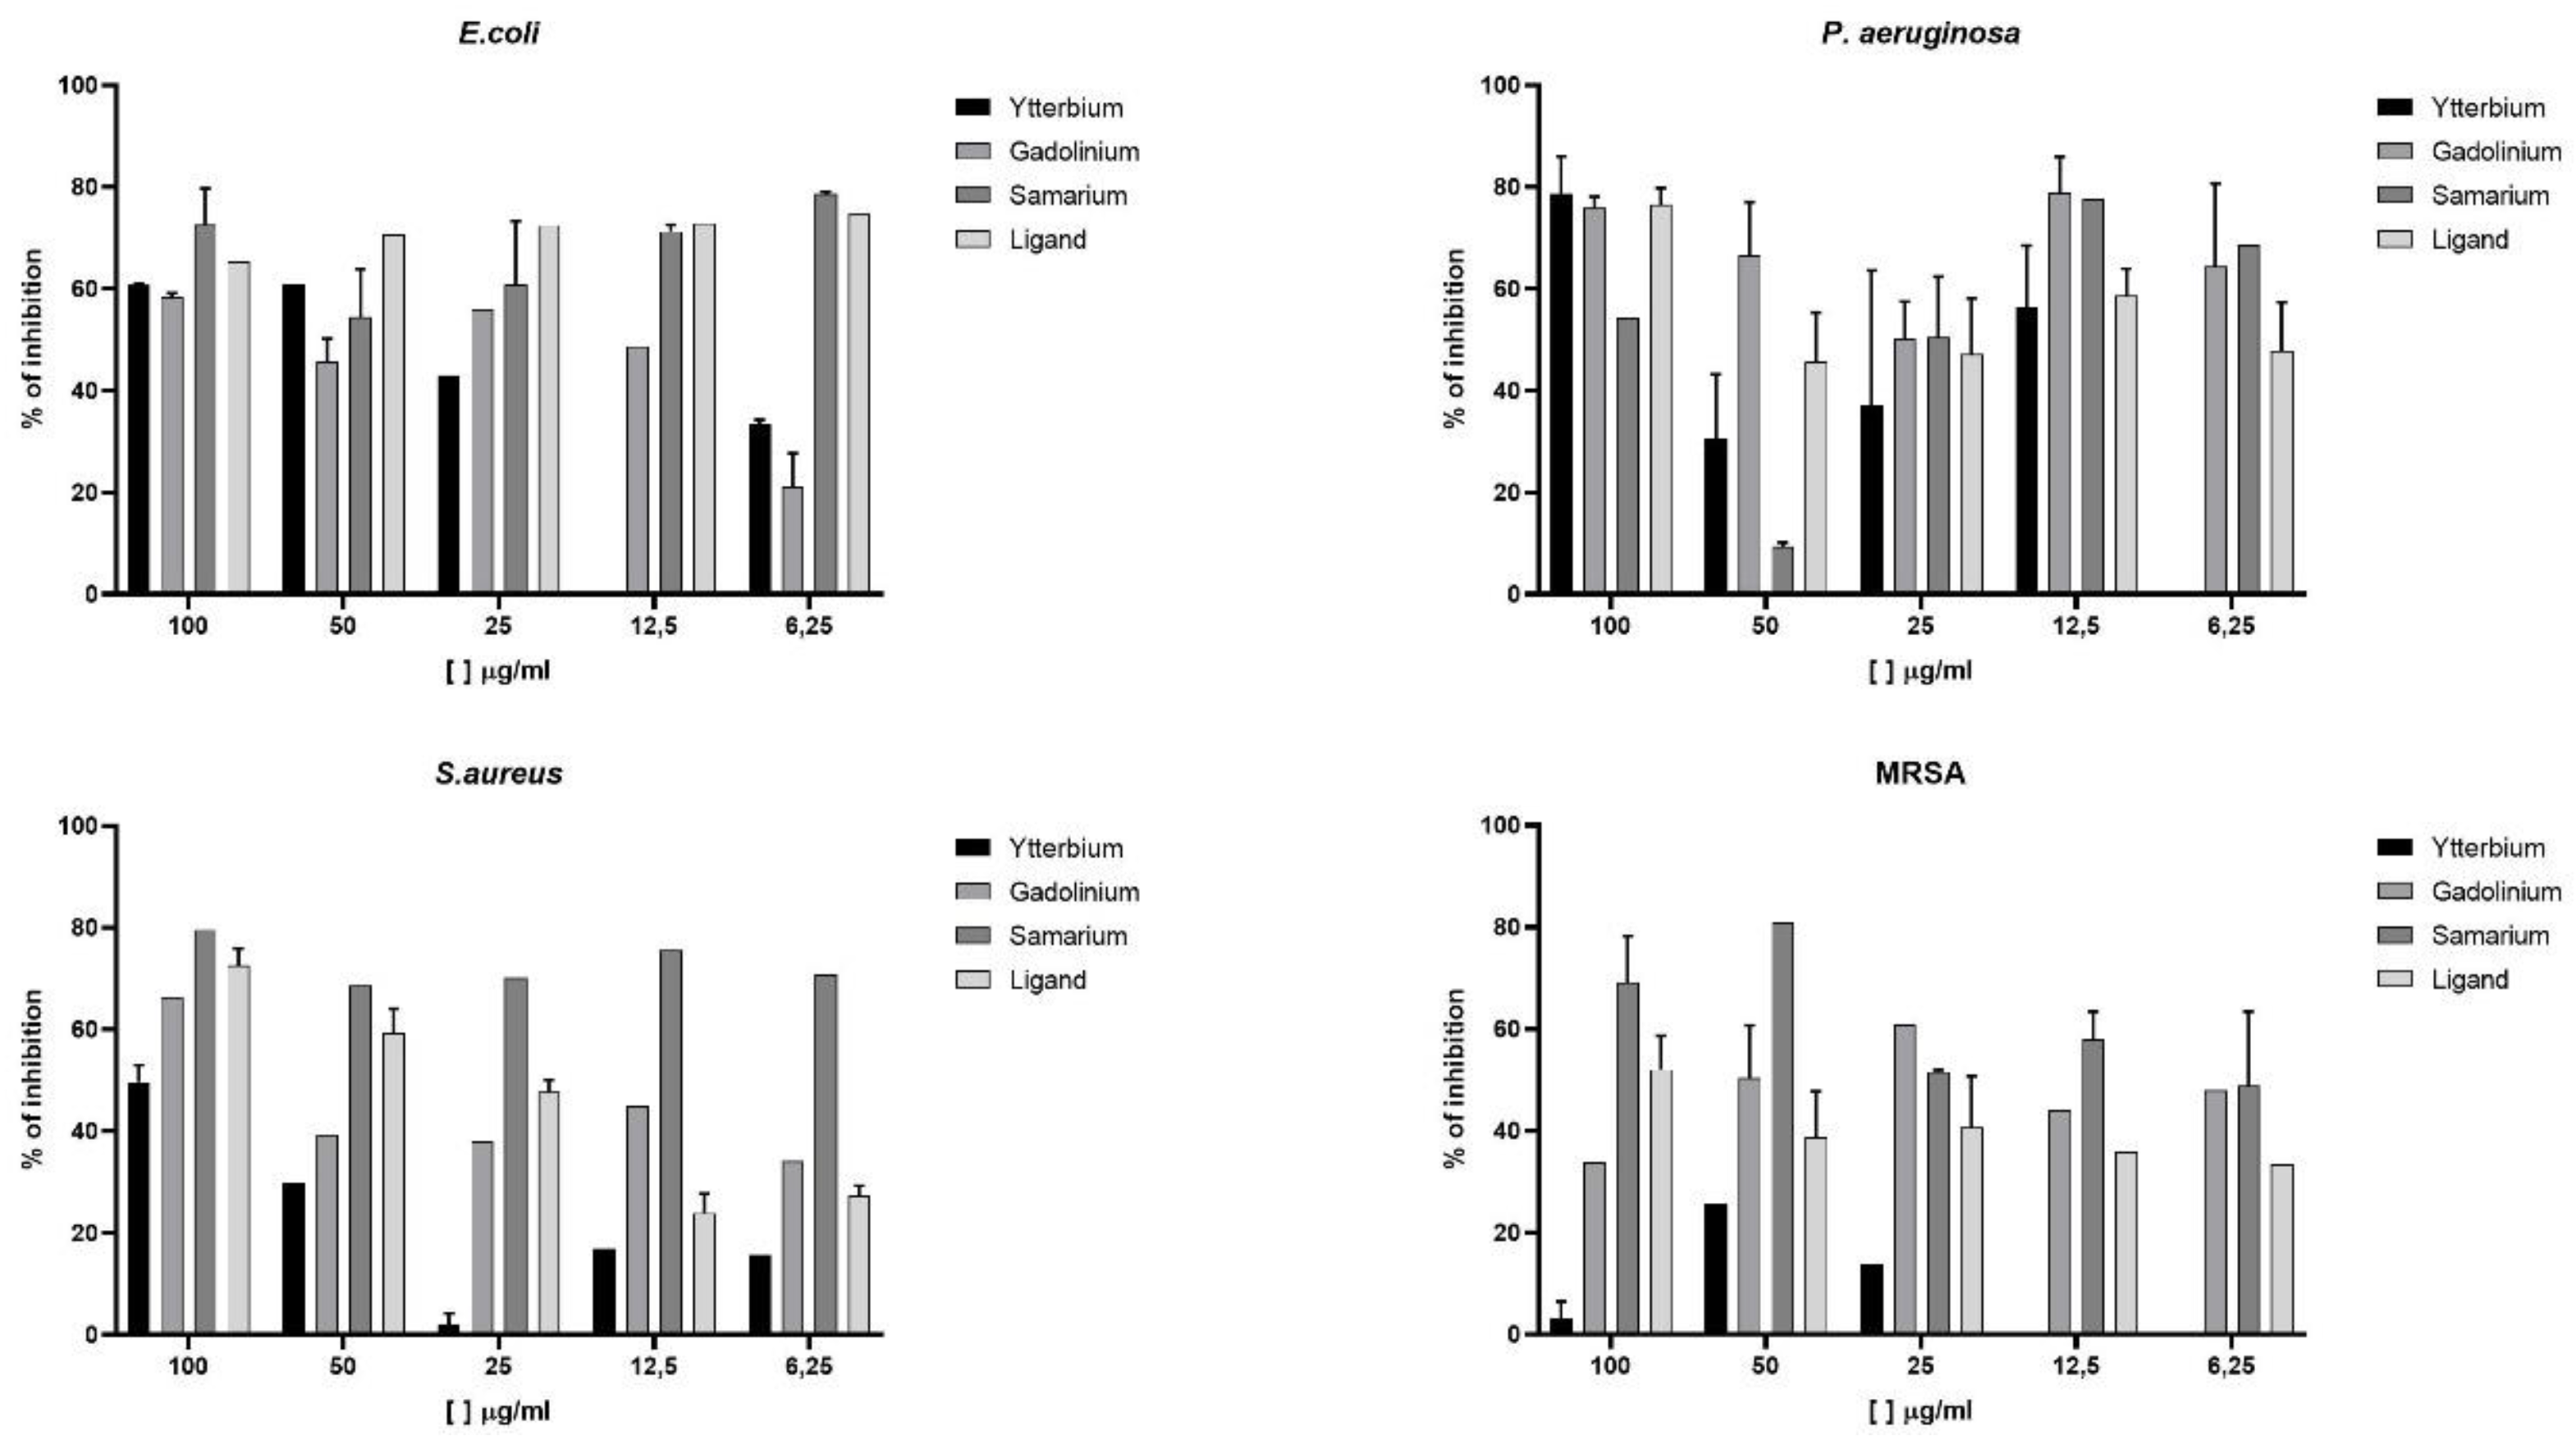
Figure 5.
A viability of Vero CCL-81 cells after 24 hours of treatment at concentrations of 200, 100, 50, 25, 12.5, and 6.25 µg/mL.
Figure 5.
A viability of Vero CCL-81 cells after 24 hours of treatment at concentrations of 200, 100, 50, 25, 12.5, and 6.25 µg/mL.
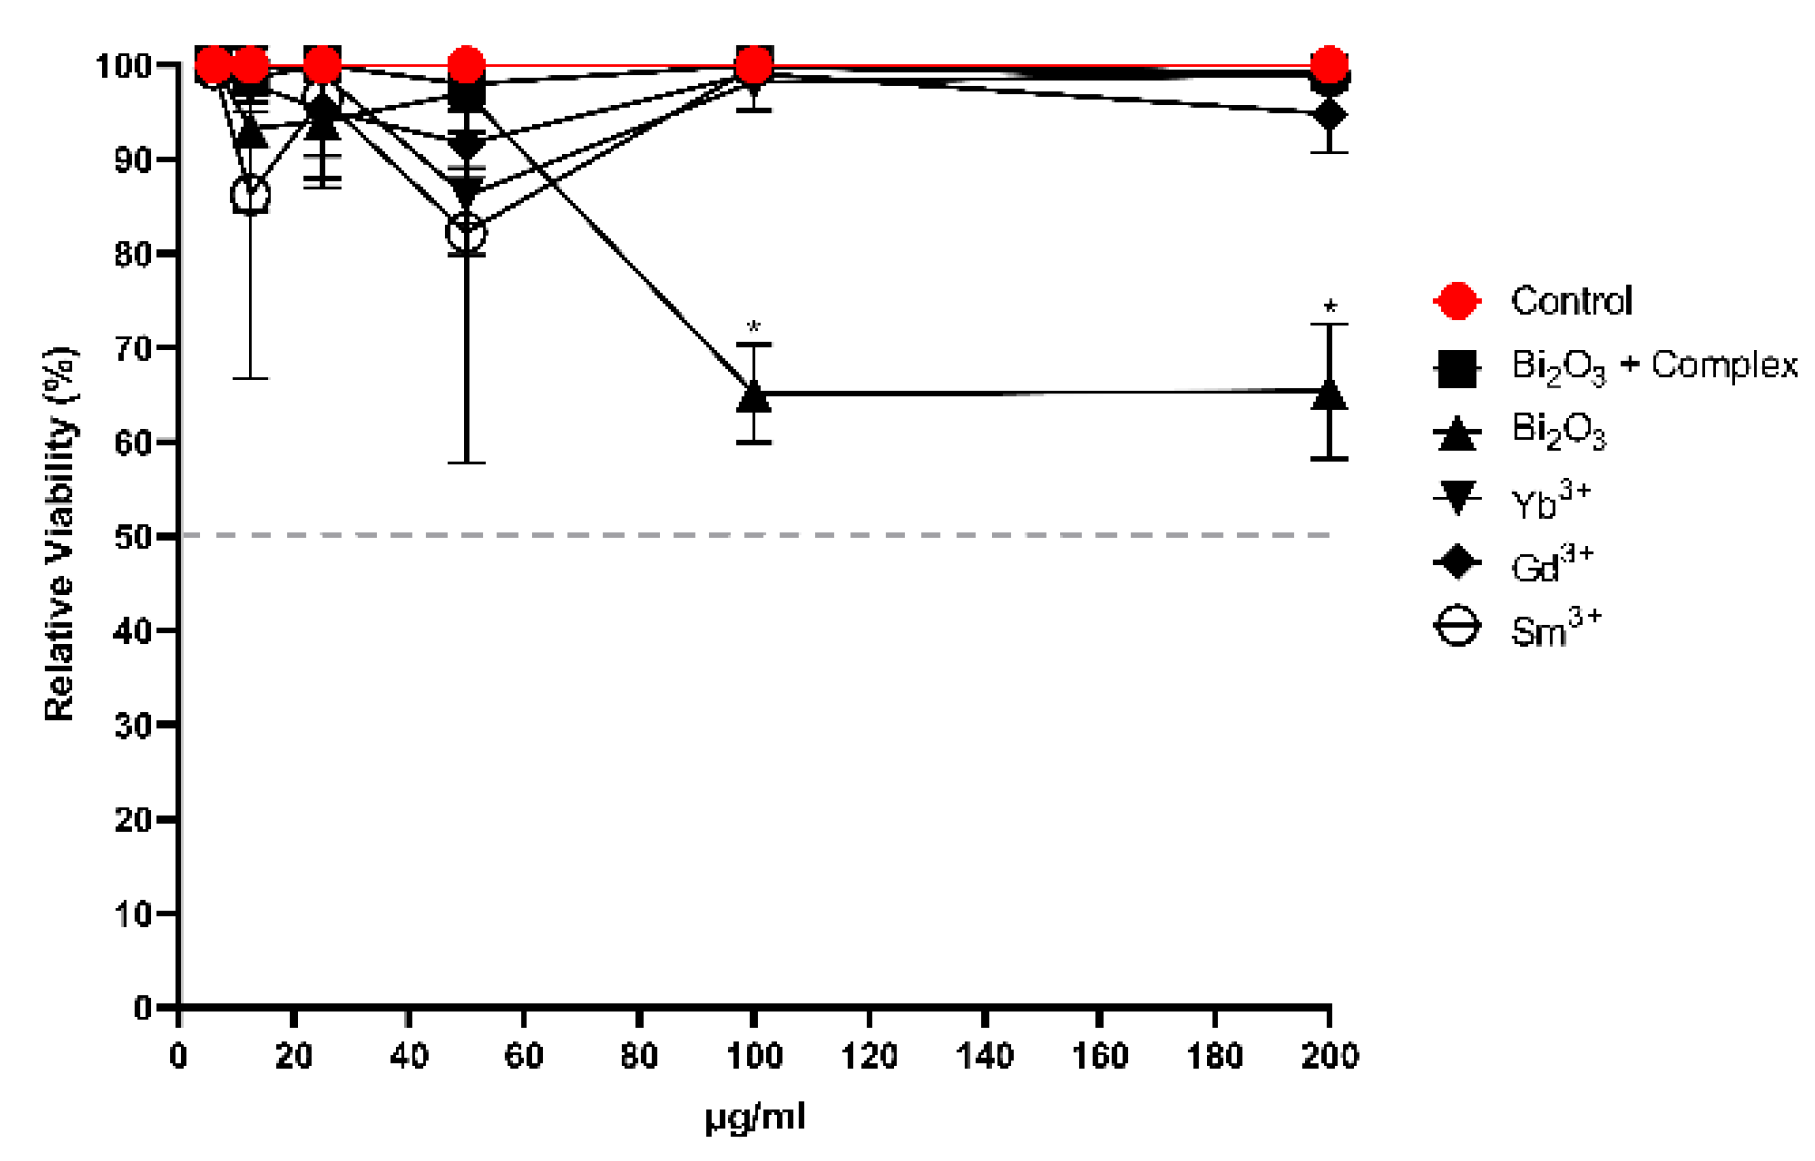
Figure 6.
Treatments with the compounds (200 µg/mL): Vero Cells Control (A), Bi2O3/Bi2S3 + Yb3+ (B), Bi2O3/Bi2S3 (C), Yb3+ (D), Gd3+ (E), and Sm3+ (F). Acquisition of fluorescence with DAPI filter – 360 nm excitation and 460 nm emission.
Figure 6.
Treatments with the compounds (200 µg/mL): Vero Cells Control (A), Bi2O3/Bi2S3 + Yb3+ (B), Bi2O3/Bi2S3 (C), Yb3+ (D), Gd3+ (E), and Sm3+ (F). Acquisition of fluorescence with DAPI filter – 360 nm excitation and 460 nm emission.
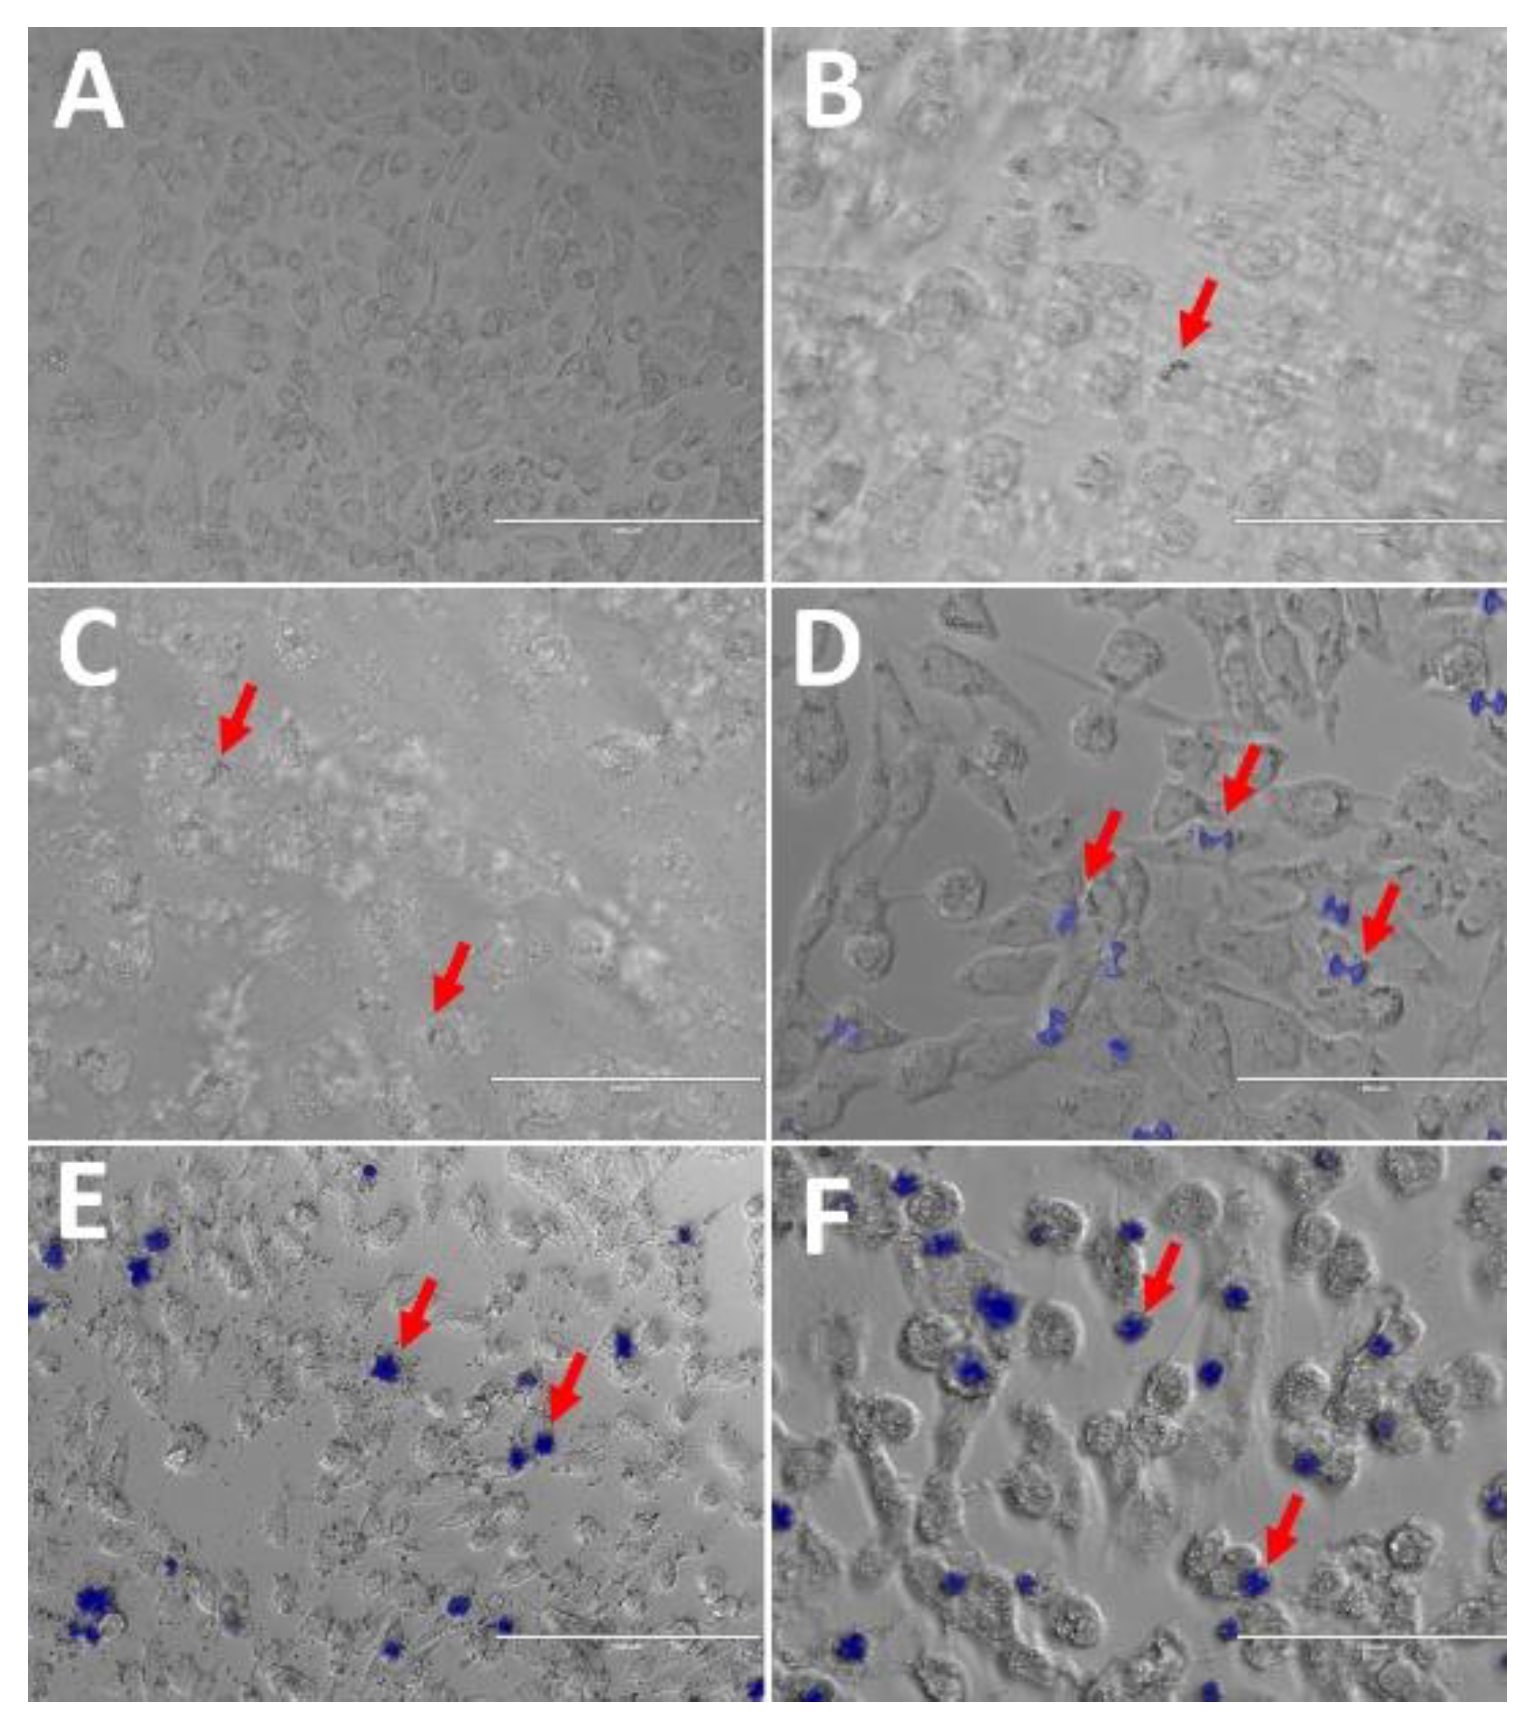

Table 1.
Refinement data for H2L1 and [{Yb(L1)2}{Yb(L1)(H2O)2}]n∙MeOH∙1/2MeCN (3∙MeOH∙1/2MeCN).
| H2L1 | 3∙MeOH∙1/2MeCN | |
|---|---|---|
| Formula | C26H20N6O2 | C80H63.5N18.5O9Yb2 |
| MM | 448.48 | 1774.07 |
| Crystal System | Orthorhombic | Monoclinic |
| Space Group | Pbcn | P21/c |
| a (Å) | 17.6288(5) | 16.4392(11) |
| b (Å) | 11.8423(4) | 40.4341(17) |
| c (Å) | 10.0084(3) | 14.7031(9) |
| α (°) | 90 | 90 |
| β (°) | 90 | 93.581(5) |
| γ (°) | 90 | 90 |
| V (Å3) | 2089.41(11) | 9754.1(10) |
| Z | 4 | 4 |
|
ρcalcd (g∙cm–3) |
1.426 | 1.208 |
| μ (mm–1) | 0.765 | 1.961 |
| Reflections Collected |
45483 | 59312 |
| Independent reflections/ Rint | 2149 [R(int) = 0.0506] | 20576 [R(int) = 0.1216] |
| Data/restrictions/param. | 2149 / 0 / 154 | 20576 / 0 / 992 |
| Absorption Correction | None | Integration |
| R1 [I > 2σ(I)] | 0.0346 | 0.0603 |
| wR2 [I > 2σ(I)] | 0.0871 | 0.1364 |
| GOF | 1.077 | 0.769 |
| CCDC number | 2419740 | 2419742 |
Table 2.
Bond lengths (Å) and angles (°) selected from the structures of the complexes [{Gd(L1)2}{Gd(L1)(H2O)2}]n and [{Yb(L1)2}{Yb(L1)(H2O)2}]n.
Table 2.
Bond lengths (Å) and angles (°) selected from the structures of the complexes [{Gd(L1)2}{Gd(L1)(H2O)2}]n and [{Yb(L1)2}{Yb(L1)(H2O)2}]n.
| [{Gd(L1)2}{Gd(L1)(H2O)2}]n | [{Yb(L1)2}{Yb(L1)(H2O)2}]n | |
|---|---|---|
| Bond lengths (Å) | ||
| M(1)-O(3) | 2.390(11) | 2.252(7) |
| M(1)-O(1) | 2.319(11) | 2.314(7) |
| M(1)-N(33) | 2.562(14) | 2.551(8) |
| M(2)-O(31) M(2)-O(11) M(2)-N(31) |
2.342(10) 2.398(12) 2.506(14) |
2.258(7) 2.290(6) 2.417(9) |
| Bond angles (°) | ||
| O(1)-M(1)-N(33) | 147.2(4) | 148.1(3) |
| O(61)-M(1)-O(51) | 169.0(4) | 164.2(2) |
| O(1)-M(1)-O(3) O(21)-M(2)-O(11) O(41)-M(2)-O(31) N(31)-M(2)-N(11) |
143.5(4) 171.3(4) 168.9(4) 143.0(4) |
144.5(3) 164.1(2) 164.1(2) 129.2(3) |
Disclaimer/Publisher’s Note: The statements, opinions and data contained in all publications are solely those of the individual author(s) and contributor(s) and not of MDPI and/or the editor(s). MDPI and/or the editor(s) disclaim responsibility for any injury to people or property resulting from any ideas, methods, instructions or products referred to in the content. |
© 2025 by the authors. Licensee MDPI, Basel, Switzerland. This article is an open access article distributed under the terms and conditions of the Creative Commons Attribution (CC BY) license (http://creativecommons.org/licenses/by/4.0/).
Copyright: This open access article is published under a Creative Commons CC BY 4.0 license, which permit the free download, distribution, and reuse, provided that the author and preprint are cited in any reuse.


