Submitted:
27 January 2025
Posted:
28 January 2025
You are already at the latest version
Abstract
This study investigates the integration of deep learning for single-modality and multimodal data within materials science. Traditional methods for materials discovery are often resource-intensive and slow, prompting the exploration of machine learning to streamline the prediction of material properties. While single-modality models have been effective, they often miss the complexities inherent in material data. The paper explores multimodal data integration—combining text, images, and tabular data—and demonstrates its potential to improve predictive accuracy. Utilizing the Alexandria dataset, the research introduces a custom methodology involving multimodal data creation, model tuning with AutoGluon framework, and evaluation through targeted fusion techniques. Results reveal that multimodal approaches enhance predictive accuracy and efficiency, particularly when text and image data are integrated. However, challenges remain in predicting complex features like band gaps. Future directions include incorporating new data types and refining specialized models to improve materials discovery and innovation.
Keywords:
Deep Learning
; Multimodalities
; Multimodal Models
; Materials Science
1. Introduction
Materials science is a multidisciplinary field focused on understanding and optimizing the properties, performance, and synthesis of materials for a wide range of applications. The advent of advanced computational techniques, combined with the rapid growth of available data, has opened new opportunities in the field, enabling the development of predictive models and simulations that can accelerate the discovery and design of novel materials. Traditional methods of materials discovery, while effective, are often time-consuming and resource-intensive, highlighting the need for more efficient, data-driven approaches. The integration of machine learning into materials research provides a powerful solution to these challenges by enabling the creation of predictive models that streamline the materials discovery pipeline. However, accurately predicting material properties remains a complex task due to the diverse and intricate nature of material data. While single-modality machine learning models (e.g., those using tabular data, text, or images) have achieved notable success, recent studies indicate that multimodal data integration—combining multiple data types—can further enhance predictive accuracy by capturing complementary insights. Multimodal approaches offer a richer representation of material properties, encompassing compositional, structural, and spatial information that single-modality models may fail to capture.
This study investigates the impact of multimodal data on predictive accuracy, focusing on how combining text, images, and tabular data can enhance material property predictions. Its significance lies in advancing materials science by leveraging cutting-edge deep learning and data integration techniques. Despite the potential of multimodal deep learning in this field, there is limited understanding of how different modality combinations influence predictive performance across various material properties. Single-modality models, while effective in specific scenarios, often struggle to capture the full complexity of material characteristics, leading to suboptimal predictions for properties with intricate dependencies. To address this gap, this paper systematically evaluates different modality combinations and examines their influence on predictive accuracy for key material properties. By integrating diverse data types and employing advanced deep learning methodologies, this research seeks to improve the efficiency and effectiveness of materials discovery and innovation.
In traditional machine learning workflows, methodologies such as CRISP-DM [1] guide the work through a sequence of structured steps, from data understanding to deployment [2]. However, this work deviated from these traditional methodologies to adopt a workflow specifically designed to address the unique requirements of multimodal data integration and the optimization capabilities offered by AutoGluon framework. We used a custom methodology developed for this work, which focused on multimodal data creation, streamlined data preparation, and fine-tuning and hyperparameter selection. By leveraging a structured multimodal dataset (Alexandria [3]), this approach allowed us to prioritize building the multimodal dataset and applying targeted fusion techniques.
Building on these advancements and addressing the challenges associated with multimodal data integration in materials science, this study achieves several key milestones that highlight its contributions to the field:
- Development of a custom multimodal methodology: This study introduces a tailored methodology for integrating multimodal data—text, images, and tabular representations—in materials science. This methodology includes unique workflows for data creation, alignment, and representation, specifically addressing challenges associated with multimodal datasets.
- Utilization of the Alexandria dataset: By leveraging the extensive Alexandria dataset, the research successfully generates a multimodal dataset comprising chemical compositions (text), crystal structures (images), and structural properties (tabular data). This approach highlights the potential of combining diverse data sources for material property predictions.
- Implementation of advanced model automation: The study integrates AutoGluon for model tuning, significantly reducing the manual effort required for hyperparameter optimization. This automation ensures efficient development and fine-tuning of deep learning models across multiple modalities.
- Improved predictive accuracy with multimodal integration: Results demonstrate that combining text and image modalities improves the predictive accuracy of material property models compared to single-modality approaches. The fusion techniques employed capture complementary information, enhancing model performance.
This paper outlines a targeted approach to leveraging deep learning for material property prediction, focusing on the integration of multimodal data to address the limitations of traditional and single-modality methods in capturing the complexity of material characteristics. Section 1 introduces the study’s foundation in materials science, underscoring the time-intensive nature of traditional discovery methods and the promise of machine learning to streamline material discovery. While single-modality machine learning has shown limited success, multimodal data integration is identified as a more comprehensive approach. The paper employs a custom methodology to address challenges specific to multimodal data, incorporating data understanding, dataset construction, model building, and evaluation using AutoGluon. Section 2 outlines the core data modalities: tabular data for numerical properties, image data for visual atomic structures, and text data for chemical composition. It describes single-modality deep learning models, such as BERT (Bidirectional Encoder Representations from Transformers) for text, graph neural networks like CGCNN (Crystal Graph Convolutional Neural Network) and PotNet (Potential Network) for structural data, and CNNs (Convolutional Neural Networks) and vision transformers for image analysis. Section 3 focuses into multimodal learning models and frameworks, explaining the benefits and challenges of fusion techniques—early, late, and hybrid fusion—and introduces models such as CLIP (Contrastive Language-Image Pre-Training), MultiMat (Multimodal Learning for Materials), and AutoGluon-Multimodal (AutoMM), highlighting their applicability to materials science. Challenges discussed include computational complexity, data integration, and interpretability issues. Section 4 describes the construction of the multimodal dataset using the Alexandria dataset, detailing the steps for creating text, image, and tabular representations, feature selection, and data alignment. PotNet embeddings, a web application for image generation, and methods for formatting text data as chemical compositions were employed. The model-building phase used AutoGluon’s MultiModalPredictor to automate the workflow, optimize models, and evaluate performance. Section 5 concludes by affirming that multimodal approaches, especially integrating text and image data, consistently enhance predictive accuracy compared to single-modality models. However, single-modality models relying solely on tabular data were less accurate. Notably, certain features, such as band gap, remain challenging to predict. Future research directions include expanding datasets, incorporating additional data types, and exploring specialized models for materials science. The study ultimately reinforces multimodal integration’s promise in advancing material property predictions and accelerating novel materials discovery.
2. Modalities
In the rapidly advancing fields of representation learning and artificial intelligence, the concept of multimodality plays a pivotal role, striving to emulate the human cognitive ability to process and integrate information from diverse sources. The world around us is inherently multimodal—we perceive objects through sight, hear sounds, feel textures, smell odors, and more [4]. As noted by Summaira et al. [5], this multifaceted nature of our world underscores the importance of multimodality. In broad terms, a modality refers to the manner in which something is perceived or experienced [4]. To fully capture and convey information about objects in the world, various cognitive signals describing different aspects of the same object are represented across multiple media types, such as text, images, videos, sound, and graphs [6]. With this perspective, multimodality emerges as a critical research direction for advancing the capabilities of AI systems.
Unimodal, or single-modality, machine learning is a paradigm that focuses on processing and learning from representations of a single data type [7]. This approach has been extensively utilized in machine learning and AI research in recent years [8], with examples including systems designed to learn from text, images, or graphs [9]. Thanks to advances in unimodal machine learning, researchers have gained a deeper understanding of the unique characteristics and complexities of individual modalities [10,11]. This progress has enabled the development of algorithms capable of learning from large datasets and leveraging this knowledge to make accurate predictions. Unimodal machine learning thus serves as a robust foundation for creating increasingly sophisticated and advanced algorithms, laying the groundwork for the integration of multiple modalities into unified, multimodal models.
In contrast to unimodal machine learning, multimodal machine learning integrates two or more types of data (modalities) into a single model. The importance of leveraging multiple modalities has grown significantly, as many real-world applications rely on information from diverse sources. For instance, autonomous driving systems must process data from cameras, lidar, and radar sensors to make real-time decisions. Similarly, in speech recognition, combining audio and text modalities enhances accuracy [9].
Effectively integrating information from diverse modalities remains a significant challenge in multimodal machine learning. To tackle this, researchers have developed various approaches, including fusion-based, graph-based, and attention-based methods, each offering distinct strategies for combining multimodal data. By successfully uniting information from different modalities, these approaches enable the creation of robust machine learning algorithms capable of addressing complex real-world scenarios.
A recent review on multimodal learning highlights several core challenges that are central to this field [9]:
- Multimodal alignment: Developing universal principles to govern interactions across modalities is a key objective, with a strong emphasis on identifying and understanding cross-modal interactions [12].
- Compositionality: Foundational to neural networks, this principle supports hierarchical learning by transforming raw data into higher-level representations, enabling reasoning and generalization to out-of-distribution scenarios [9].
- Representation generation: Research focuses on creating efficient, modality-specific representations, often leveraging encoder-decoder architectures to capture modality-specific nuances [13].
- Transferability of representations: Modern multimodal frameworks emphasize using pre-trained models to accelerate new tasks with minimal data, promoting representation transfer within and across modalities [13].
- Representation fusion: Among the most complex challenges, representation fusion aims to seamlessly integrate diverse semantic data types (e.g., images, text, or knowledge graphs). This process requires normalization and embedding before integration, which is crucial for building scalable multimodal learning systems [9].
These open challenges highlight the immense potential of multimodal learning to broaden the scope of machine learning applications by integrating diverse data types and enhancing model adaptability and efficiency.
2.1. Data Modalities
Understanding and predicting material properties require data that encapsulates the complex interactions and characteristics inherent to different materials. In materials science, data is available in various modalities—distinct forms of information, each offering unique insights into a material’s properties, structure, and behavior. Machine learning models can harness these modalities to enhance predictive accuracy and facilitate the discovery of novel materials with desired properties. This discussion focuses on key data modalities commonly used in materials science, emphasizing the distinct contributions of each. The primary modalities include tabular data, images, and textual composition data. Individually, these data types provide valuable yet limited perspectives on a material. However, when integrated within multimodal learning frameworks, they collectively offer a comprehensive and powerful understanding of material properties.
2.1.1. Tabular Data
Tabular data is a foundational modality in materials science, representing structured numerical information about a material’s atomic and physical properties. Typically organized in a table format, each row corresponds to a unique material, while columns capture specific properties or features, such as atomic coordinates, bond lengths, elemental compositions, or calculated thermodynamic properties. Due to its structured nature, tabular data is extensively used in machine learning, enabling precise, quantitative analysis that can be easily processed by models well-suited for numerical data, such as linear regression, support vector machines, and neural networks.
In materials science, tabular data is often derived from computational chemistry calculations or experimental measurements. For instance, large datasets like the Materials Project database provide tabular representations of millions of materials, with properties computed using Density Functional Theory (DFT) [14]. These datasets encompass critical information about materials, including:
- Atomic structure: Including details like atomic coordinates, bond types, and lattice parameters that define the spatial arrangement of atoms within a crystal.
- Electronic properties: Such as band gaps, electronic densities, and magnetic properties.
- Thermodynamic and mechanical properties: Like enthalpy of formation, elasticity, and thermal conductivity, which are crucial for predicting material stability and suitability for various applications.
Models can leverage tabular data either to directly predict material properties or to generate embeddings—representations that encapsulate essential patterns within the data. For example, models like PotNet [15] utilize interatomic potentials to produce tabular embeddings of crystal structures, enabling a detailed and structured representation of atomic interactions.
2.1.2. Image Data
Image data in materials science captures the spatial and visual representation of materials, particularly their atomic and crystal structures. These images enable researchers to visually examine the arrangement and geometry of atoms, offering critical insights into a material’s properties and behaviors. Unlike tabular or textual data, which represent materials in structured formats or compositional descriptions, image data allows machine learning models to directly analyze and interpret spatial contexts and structural patterns. Such image data is often derived from simulations or visualization tools like Crystal Toolkit, which render 3D structures into 2D formats such as PNG or JPEG [16]. These images can depict materials at various scales, ranging from the microscopic level—showing atomic bonds and lattice configurations—to the macroscopic level, where grain boundaries or phase structures in metals and alloys are visible. These visualizations provide valuable information about lattice symmetry, bond lengths, angles, and defects, all of which are crucial for understanding a material’s mechanical, thermal, and electrical properties.
2.1.3. Text Data
Text data in materials science primarily represents the chemical composition and elemental makeup of materials. This modality conveys essential information about the elements present, their quantities, and, in some cases, structural details through descriptive text. Unlike image data, which provides visual representations, or tabular data, which organizes quantitative properties, text data offers a straightforward way to express compositional information using formulas, symbols, or chemical notations. In machine learning applications, text data can be utilized to predict material properties based solely on elemental composition. Models process this data as sequences of symbols or tokens (e.g., for iron oxide), learning the relationships between compositions and their associated material properties. Text data is particularly important in materials science as it provides a high-level view of composition, aiding in the identification of basic properties such as whether a material is metallic, non-metallic, or likely to exhibit magnetic behavior. This makes it a valuable modality for understanding and predicting material characteristics.
The Alexandria dataset [3] is a comprehensive, large-scale, open-source resource providing detailed data on the chemical compositions and properties of millions of materials. It includes calculations for one-dimensional (1D), two-dimensional (2D), and three-dimensional (3D) materials, primarily derived from density functional theory (DFT) [3]. As one of the most extensive datasets in materials science, Alexandria encompasses composition-based data, structural properties, and calculated material attributes, making it invaluable for both single-modality and multimodal machine learning applications. This dataset serves as a rich source of text data, with each material’s chemical formula represented in text form, enabling text-based machine learning models to train on millions of examples. Its wide compositional coverage enhances the generalization capability of models, allowing predictions even for novel or less common compounds. Furthermore, the inclusion of high-quality, computationally derived properties allows researchers to validate and refine models, improving predictive accuracy. Alexandria’s integration of text (composition) and tabular (structural properties) data makes it particularly well-suited for multimodal machine learning frameworks. These frameworks can combine compositional text data with structural embeddings or images to achieve a more holistic understanding of material properties. The dataset’s vast scale also makes it ideal for data augmentation and transfer learning. Machine learning models can pre-train on Alexandria’s extensive data and transfer the acquired knowledge to smaller or specialized datasets, significantly broadening the scope and accuracy of predictions across various material types.
2.2. Single Modality Machine Learning Models
Single-modality machine learning models in materials science rely on a single type of data to predict material properties. For instance, composition-based models focus exclusively on chemical composition data (text modality) to infer properties such as stability, hardness, conductivity, or elasticity based solely on the elements and their ratios within a material. These models are computationally efficient and effective, particularly in scenarios where structural or visual data may not be available [9]. By utilizing text representations of materials, such as elemental formulas, they identify patterns between element types and corresponding properties. Although composition-based models lack structural information, they have demonstrated remarkable predictive capabilities when leveraging large datasets and advanced neural network architectures like transformers [17]. Notable models in this category include CrabNet (Compositionally Restricted Attention-Based Network), which excels at making accurate predictions using compositional data, and BERT, a foundational model in Natural Language Processing (NLP).
2.2.1. Composition-Based Models
BERT, introduced by Devlin et al. [18], stands for Bidirectional Encoder Representations from Transformers and represents a significant advancement over traditional, unidirectional language models (e.g., OpenAI’s GPT [19]), which predict tokens based on either left-to-right or right-to-left context [20]. BERT’s architecture employs a bidirectional transformer encoder that simultaneously leverages context from both directions, enabling a deeper understanding of language. This design enhances performance across a variety of NLP tasks, including question answering, language inference, and named entity recognition. BERT relies on two primary pre-training tasks to capture linguistic patterns and relationships:
- Masked Language Modeling (MLM): Inspired by the Cloze task [21], MLM randomly masks 15% of tokens in a sequence and tasks the model with predicting the masked tokens using context from both directions. This objective encourages BERT to develop a nuanced, bidirectional understanding of language, differentiating it from traditional unidirectional models.
- Next Sentence Prediction (NSP): This task trains BERT to identify relationships between sentence pairs. Half of the training pairs are consecutive sentences, while the other half are randomly paired. The model learns to predict whether the second sentence logically follows the first, a capability particularly useful for tasks like question answering and natural language inference.
Once pre-trained, BERT can be fine-tuned on specific NLP tasks by adding minimal task-specific layers, making it highly versatile. During fine-tuning, the pre-trained bidirectional embeddings are adjusted to learn task-specific patterns, significantly improving performance without extensive task-specific architecture engineering. BERT achieves state-of-the-art results across various benchmarks, including GLUE (General Language Understanding Evaluation) [22], SQuAD (Stanford Question Answering Dataset) [23], and SWAG (Situations With Adversarial Generations) [24]. Both pre-training and fine-tuning use the same architecture, differing only in the output layers. Pre-trained parameters initialize the models for downstream tasks, with all parameters fine-tuned during training. [CLS], a special token, is prepended to each input sequence for classification tasks, while [SEP] is used as a separator between input segments (e.g., questions and answers). BERT’s architecture and training methodology have set a new benchmark for pre-trained language models, inspiring numerous transformer-based models, such as MatBERT (Materials Bidirectional Encoder Representations from Transformers) [25], tailored for materials science. Its adaptability across tasks and minimal task-specific engineering requirements have established BERT as a foundational model in NLP, driving advancements in transfer learning and model interpretability.
CrabNet (Compositionally Restricted Attention-Based Network) is a state-of-the-art model for predicting material properties based solely on chemical composition data. This approach introduces the self-attention mechanism to the task of materials property predictions, dynamically learning and updating individual element representations based on their chemical environment. This is enabled by a featurization scheme that represents and preserves individual element identities while sharing information between elements [26]. The network uniquely employs the transformer architecture, originally developed for NLP tasks. Transformers use an attention mechanism that allows the model to focus on specific parts of the input sequence—elements within the chemical formula in this case—to capture relevant relationships among them. Transformers are particularly effective for sequence-based data, and in CrabNet, this architecture interprets the elements and their proportions within a chemical formula as a sequential arrangement. By learning to focus on different tokens (i.e., elements) in the formula, CrabNet captures complex interactions, much like how a language model interprets sentences. By analyzing only the elemental composition, CrabNet has demonstrated high accuracy in predicting a range of material properties, such as band gaps, formation energies, and mechanical strength. This model is especially useful when structural information is unavailable, as it can still provide valuable insights based solely on compositional data. However, when structural data is available, GNNs offer a more comprehensive method for dealing with material structures.
2.2.2. Graph Neural Networks
Graph Neural Networks (GNNs) have emerged as a powerful framework for processing graph-structured data, where nodes represent entities and edges capture the relationships between them [27]. This structure makes GNNs particularly effective for modeling complex interactions and dependencies, which are common in multimodal datasets [28]. GNNs leverage message-passing mechanisms to capture dependencies within graphs by enabling nodes to iteratively exchange information with their neighbors. Over recent years, GNN variants such as Graph Convolutional Networks (GCNs), Graph Attention Networks (GATs), and Graph Recurrent Networks (GRNs) have achieved significant advancements in a variety of deep learning tasks [29,30]. Unlike composition-based models, which rely solely on elemental formulas, Graph Neural Networks (GNNs) are uniquely suited to handle structured data that captures the spatial arrangement of atoms. This makes them ideal for materials science applications, where materials can be represented as graphs with nodes corresponding to atoms (or chemical groups) and edges representing chemical bonds. Two notable GNN-based models in materials science are the Crystal Graph Convolutional Neural Network (CGCNN) and PotNet. These models demonstrate the capability of GNNs to analyze atomic structures and predict material properties by leveraging graph representations of materials.
The Crystal Graph Convolutional Neural Network (CGCNN) is one of the first and most widely used GNN architectures developed specifically for materials science [31]. It represents each material as a graph based on its crystal structure, where atoms serve as nodes and bonds serve as edges. CGCNN applies convolutional layers over this graph structure, enabling the model to learn from the spatial and relational information among atoms in a crystal lattice. By treating crystal structures as graphs, CGCNN directly processes the spatial and connectivity patterns of atoms, capturing the geometry of the lattice and the relationships between atoms. This graph-based representation allows the model to inherently capture symmetry and periodicity, both of which are essential in crystalline materials. Each node i is represented by a feature vector , encoding the properties of the atom corresponding to that node. Similarly, each edge is represented by a feature vector , corresponding to the k-th bond connecting atoms i and j.
PotNet (Potential Network) is a GNN-based model that extends the concept of modeling atomic structures as graphs by focusing on interatomic potentials rather than solely on atomic bonds [15]. Based on the physical modeling of crystal energy, PotNet explicitly uses interatomic potentials and complete interatomic potentials as input features. These potentials are incorporated into the message-passing mechanism of the graph neural network and approximated efficiently through specialized algorithms. This approach provides a more physics-driven representation of atomic interactions, making PotNet particularly effective in capturing complex behaviors in materials. Unlike conventional GNNs that consider only direct, nearest-neighbor interactions, PotNet utilizes a complete set of interatomic potentials to represent atomic interactions. This enables it to capture long-range forces that influence material properties. In PotNet, each node (atom) is connected to every other atom in the structure through potential-based edges, forming a fully connected graph. These connections are weighted by the calculated potentials, providing a nuanced representation of atomic interactions. PotNet employs message-passing algorithms where each atom’s representation is iteratively updated based on both short- and long-range interactions. This process results in embeddings that capture subtle variations in potential energy landscapes, offering a detailed spatial understanding of atomic forces and their impact on material properties.
The network architecture employed in PotNet is designed following commonly used settings and shares similarities with existing methods for 3D graphs [31,32,33,34]. It consists of three main components: an input block, an interaction block, and a readout block. The inputs include atomic features and potentials, where is the 92-dimensional atomic feature for any atom i, as defined in CGCNN [31].
- Input block: This block includes a Linear layer and an Embedding layer. Each node’s input features are transformed into 256-dimensional vectors using the Linear layer. For edges, an Embedding layer maps Coulomb potentials and infinite potential summations into 256-dimensional embeddings.
- Interaction block: Comprising multiple interaction layers, this block updates each node’s feature vector by incorporating features from neighboring nodes and edge embeddings. For each neighboring node, embeddings are concatenated along the edge dimension and then with node features along the feature dimension, as in CGCNN [31].
- Readout block: This block includes an AvgPooling layer followed by a Linear layer. The AvgPooling layer aggregates features from all nodes, and the Linear layer maps the aggregated 256-dimensional hidden features to a final scalar output.
PotNet is particularly effective for predicting properties that depend on long-range atomic interactions, such as thermal conductivity, electrical behavior, and mechanical resilience.
2.2.3. Image-Based Models
Image-based models in materials science utilize visual data to analyze and predict material properties by leveraging spatial and structural characteristics captured in images. Unlike text-based or tabular data, which represent materials through compositional or numerical formats, image data provides a direct visual depiction of a material’s atomic or microscopic structure. These images often illustrate the geometric arrangement of atoms, grains, or crystal lattices, capturing critical details such as spatial orientation, symmetry, molecular patterns, and defects that significantly influence material properties. Image data in materials science is typically derived from techniques like electron microscopy, X-ray diffraction, or visualizations of crystal structures generated using software such as Crystal Toolkit [16]. This modality is particularly valuable for capturing features that are difficult to convey through other formats, such as grain boundaries, surface morphologies, and structural defects—key factors in determining material strength, conductivity, and stability.
For image-based models, two primary architectures used for image analysis are Convolutional Neural Networks (CNNs) and Transformer-based models. CNNs are designed for local feature extraction, using convolutional layers to capture hierarchical patterns—progressing from simple textures in early layers to more complex structures in deeper layers [35]. This makes CNNs particularly well-suited for detecting fine-grained details, such as atomic bonds and lattice arrangements, which are critical for analyzing material properties at a microscopic level. ResNet [36] and EfficientNet [37] are among the most popular CNN architectures in materials science, known for their ability to capture such structural nuances effectively. Originally developed for natural language processing, transformers have been adapted for vision tasks and utilize self-attention mechanisms to capture global dependencies across an entire image [20]. By processing images as sequences of patches, transformers excel at understanding broad contextual relationships and long-range patterns that CNNs might overlook. Vision Transformer (ViT) [38] and Swin Transformer [39] are widely used in materials science to capture both local and global patterns, making them valuable for comprehensive material analysis.
TIMM (Torchvision Image Models) is a versatile library for PyTorch, offering a wide range of pre-trained image models and utilities for training and fine-tuning models on custom image datasets. TIMM is particularly valuable in materials science due to its support for diverse model architectures and pre-trained weights, making it highly adaptable for applications involving high-resolution images of material structures. The library includes over 600 pre-trained models, such as ResNet [36], EfficientNet [37], Vision Transformer (ViT)[38], and Swin Transformer[39]. These models are trained on large datasets like ImageNet [40], making them effective for transfer learning in specialized domains. TIMM provides flexible customization options, such as architecture modifications, layer freezing, and model fine-tuning, which are particularly useful for adapting models to materials science images. Researchers can leverage its transfer learning capabilities to fine-tune pre-trained models for high-resolution 3D images representing crystal structures, tailoring them to domain-specific needs.
In materials science, TIMM’s pre-trained models can be fine-tuned to classify and analyze images of crystal structures, capturing spatial relationships critical for property prediction. For example, ResNet or EfficientNet architectures pre-trained on ImageNet can be adapted to identify and interpret structural features in crystal images. Features extracted from these models can also be integrated with other modalities, such as composition and structure, in a multimodal framework to enable more comprehensive property predictions. For instance, a Vision Transformer (ViT) from TIMM could generate embeddings that represent spatial arrangements in crystal images, effectively complementing compositional and structural embeddings for enhanced analysis and prediction.
3. Multimodal Learning Models and Frameworks
Multimodal machine learning focuses on building models capable of processing and integrating information from multiple data modalities [4]. Due to the heterogeneous nature of multimodal data, this field presents unique challenges for computational researchers. In materials science, multimodal learning has transformative potential, enabling models to combine data from composition (text), structure (tabular), and visual representations (images) to achieve a more holistic understanding of materials.
By leveraging the strengths of each modality, multimodal models can uncover deeper insights into the relationships between material composition, atomic structure, and physical properties. However, integrating these diverse data types requires specialized techniques known as fusion techniques. Fusion techniques determine how and when information from different modalities is combined within the model, ensuring that each modality contributes meaningfully to the final prediction. Effective fusion strategies significantly enhance a model’s ability to generalize, handle missing data, and make accurate predictions, even for complex materials with intricate property dependencies. This makes multimodal learning a powerful approach for advancing materials science research and applications.
3.1. Fusion Techniques
Multimodal fusion is a foundational topic in multimodal machine learning, with earlier surveys highlighting approaches such as early, late, and hybrid fusion [41,42]. Technically, multimodal fusion refers to the integration of information from multiple modalities to predict an outcome, whether it is a class label (e.g., happy vs. sad) via classification or a continuous value (e.g., sentiment positivity) via regression. Fusion approaches are typically categorized into three types:
- Early Fusion (Feature-Based): Features from different modalities are integrated immediately after extraction, often by concatenating their representations.
- Late Fusion (Decision-Based): Integration occurs after each modality has been independently processed, with decisions (e.g., classifications or regressions) from individual modalities combined in the final stage.
- Hybrid Fusion [43]: Combines the outputs from early fusion with predictions from individual unimodal models, leveraging both feature-level and decision-level information.
3.1.1. Early Fusion
Early fusion, also known as feature-level fusion, represents one of the initial approaches in multimodal representation learning. It focuses on exploiting the correlations and interactions between low-level features of each modality. A key advantage of early fusion is that it requires training only a single model, simplifying the training pipeline compared to late and hybrid fusion approaches. In this method, data from each modality is transformed into a common representation, typically through embeddings or feature vectors, which are then concatenated or integrated into a single unified input. This fused representation is processed through the model as a cohesive input, enabling it to learn interactions between modalities from the outset.
In materials science, early fusion might involve transforming data such as composition (text), structural embeddings (tabular), and image data into feature vectors, which are then concatenated into a unified input for the model. By training on this combined input, the model can learn cross-modal relationships, such as how compositional elements interact with structural features or how atomic arrangements influence visual patterns.
Early fusion is particularly effective for tasks where capturing correlations between modalities from the beginning is crucial. For instance, in materials science, this approach is ideal for understanding how interactions between composition, structure, and images contribute to a material’s properties. By integrating modalities early in the learning process, the model can generate richer feature representations and allow each modality to influence the others during training. This cross-modal interaction can significantly improve prediction accuracy, especially for complex tasks involving intricate relationships between modalities.
3.1.2. Late Fusion
In contrast, late fusion, or decision-level fusion, combines unimodal decision outputs using a fusion mechanism such as averaging, weighted summation, or a meta-classifier that merges the outputs into a final prediction [4]. This approach allows different models to be tailored to each modality, enabling each model to specialize in processing its respective data type. This flexibility can lead to better performance, as each modality is handled by the most suitable predictor.
Late fusion is particularly advantageous in scenarios where one or more modalities may be missing, as predictions can still be made based on the available data. Additionally, it supports training without requiring parallel data across modalities. However, a limitation of late fusion is that it overlooks low-level interactions between modalities, as integration occurs only after unimodal predictions are generated.
In materials science, late fusion might involve training separate models for compositional data, structural data, and image data. Each model independently produces predictions, which are then combined to generate a final output. This approach is especially useful when the relationships between modalities are independent or weakly correlated, allowing each modality to contribute individually to the overall decision.
Late fusion also offers computational efficiency for high-dimensional inputs, as each modality is processed independently before integration. Furthermore, it reduces the risk of overfitting, as each model specializes in one modality, and the fusion step leverages the strengths of each. However, since interactions between modalities are not learned until the final layer, late fusion may fail to capture complex interdependencies between modalities. This limitation makes it less effective for tasks where deep interactions between data types are critical for accurate predictions.
3.1.3. Hybrid Fusion
Hybrid fusion combines the strengths of both early and late fusion approaches within a unified framework. It has been successfully applied in tasks such as multimodal speaker identification [44] and multimedia event detection (MED) [45]. This method integrates modalities at multiple points within the model architecture, leveraging elements of both feature-level (early) and decision-level (late) fusion.
In hybrid fusion, each modality is initially processed individually to extract modality-specific features. Intermediate representations are then fused at various stages of the model, creating shared representations that enable joint learning across modalities. This approach provides the flexibility to capture interactions at multiple levels, balancing the benefits of independent feature extraction and cross-modal integration.
In materials science, hybrid fusion is particularly useful for multimodal models that require both modality-specific processing and joint learning. For instance, composition and structural data could be processed separately in the early layers of the model, while their intermediate representations are fused with image data in deeper layers. This allows the model to learn joint representations that capture both independent modality characteristics and cross-modal interactions, making it a powerful approach for tasks involving complex material properties.
3.2. CLIP
One of the most widely used techniques is CLIP (Contrastive Language-Image Pre-Training), a pioneering model developed by OpenAI that utilizes contrastive learning to align textual and visual representations [46]. By training on a large dataset of images paired with their corresponding text descriptions, CLIP learns a shared embedding space where images and their associated textual descriptions are closely aligned. This shared space enables powerful capabilities such as cross-modal retrieval, zero-shot learning, and a wide range of other applications.
CLIP uses a contrastive learning objective to align image and text pairs in a shared latent space. The model is trained to maximize the similarity between embeddings of matched image + text pairs (positive pairs) while minimizing the similarity between embeddings of mismatched pairs (negative pairs). This is achieved using a contrastive loss function, such as the InfoNCE loss, which encourages the model to distinguish correct pairs from incorrect ones [47]. CLIP employs a dual-encoder architecture comprising:
- Image Encoder: A convolutional neural network (CNN) or a vision transformer (ViT) that processes images and maps them into the shared latent space.
- Text Encoder: A transformer-based model that processes text descriptions and maps them into the same latent space as the images.
The dual-encoder setup enables CLIP to process images and texts independently while ensuring that their embeddings are directly comparable in the shared space. CLIP is trained on a large-scale dataset of image + text pairs collected from the internet. The diversity and scale of this dataset are essential for the model’s ability to generalize across a wide range of concepts and perform effectively in zero-shot learning scenarios. This extensive dataset allows CLIP to capture a broad array of visual and textual contexts, making it highly versatile and capable of performing various cross-modal tasks [46].
This method offers several applications across the following areas:
- Zero-Shot Learning: CLIP excels at zero-shot learning by leveraging its shared embedding space to link unseen classes to seen ones through textual descriptions. This capability allows it to retrieve relevant images for new class descriptions without explicit training on those classes.
- Cross-Modal Retrieval: CLIP performs effectively in cross-modal retrieval, enabling the retrieval of images based on text queries and the identification of text descriptions based on images. This functionality is particularly useful for search engines, content recommendation systems, and other applications requiring robust cross-modal interactions [48].
- Content Moderation and Filtering: CLIP supports content moderation by matching inappropriate text with corresponding images, helping platforms manage large volumes of user-generated content and ensure compliance with community guidelines.
- Enhanced Image Captioning: By aligning images and text in a shared latent space, CLIP improves image captioning quality. It produces more accurate and contextually relevant captions that closely match the visual content, enhancing the overall captioning experience [49].
CLIP marks a significant advancement in multimodal representation learning, providing a robust framework for aligning textual and visual data within a shared embedding space. Ongoing research focuses on enhancing CLIP’s robustness, efficiency, and interpretability, broadening its applicability across diverse real-world scenarios.
Contrastive representation learning is a foundational technique in multimodal embedding, enabling the integration and alignment of diverse data sources within a shared latent space. By leveraging methods such as SimCLR [47], CMC [50], and CLIP [51], models can effectively learn representations that improve performance across various multimodal tasks. These approaches have been instrumental in advancing multimodal learning by providing a structured way to align heterogeneous data.
3.3. MultiMat
The MultiMat framework, as detailed in Viggo Moro’s paper “Multimodal Learning for Materials” [52], is a comprehensive system designed to integrate and process multimodal data specifically for materials science applications. MultiMat is a framework for training a foundation model for crystalline materials, enabling the incorporation of multiple modalities. At its core, MultiMat employs a multimodal pre-training method that maps high-dimensional material properties (i.e., modalities) into a shared latent space. This approach produces highly effective material representations that can be transferred to a variety of downstream tasks, making it a versatile tool for advancing research and applications in materials science.
The MultiMat framework trains a foundation model for materials by aligning the latent spaces of encoders across multiple information-rich modalities, such as crystal structures, density of states (DOS), charge density, and textual descriptions. This alignment process creates shared latent spaces that enable effective material representations, which can be utilized for various downstream tasks. For example, the crystal encoder can be transferred and fine-tuned for material property prediction, offering improved predictive performance compared to traditional training methods. Additionally, by aligning the latent spaces of different modalities, MultiMat facilitates a novel strategy for material discovery. This involves screening large crystal-structure databases by comparing target properties with candidate crystals based on latent-space similarity.
Finally, the MultiMat framework enhances interpretability by enabling exploration of the latent space using dimensionality reduction techniques. This allows researchers to gain insights into the relationships between materials and their properties, further demonstrating the power and versatility of the MultiMat approach.
The MultiMat framework utilizes graph-based structures to represent multimodal data, where nodes correspond to material properties, and edges represent the relationships between these properties. This representation naturally integrates diverse data types, enabling the capture of complex dependencies in materials science [52]. Each node and edge in the MultiMat framework is associated with specific features that encapsulate the properties and relationships of materials. These features are essential for large multimodal models (LMMs) to learn effective representations that encode multimodal information [52]. To process and learn from the graph-structured data, MultiMat employs advanced Graph Neural Network (GNN) architectures, such as Graph Convolutional Networks (GCNs) and Graph Attention Networks (GATs). These architectures facilitate the propagation of information through the graph, enabling the model to capture intricate dependencies and interactions between different material properties. By leveraging these techniques, MultiMat provides a robust framework for understanding and predicting material behaviors [52].
3.4. AutoGluon-Multimodal
AutoGluon Multimodal (AutoMM) is a Python-based, open-source AutoML framework developed by Amazon Web Services (AWS) that is specifically designed for multimodal learning with foundation models [53]. AutoMM enables efficient integration of diverse data types—such as text, tabular data, images, and even time series—into a unified predictive model. Tailored to simplify the model-building process, AutoGluon handles critical tasks automatically, including data preprocessing, model selection, hyperparameter tuning, and multimodal fusion. This streamlined approach makes it accessible for both experts and non-experts, empowering users to develop robust and effective machine learning models with minimal manual intervention. AutoMM supports both unimodal and multimodal data, enabling seamless fine-tuning of foundation models for basic classification and regression tasks as well as more advanced applications.
In the context of materials science, AutoGluon’s multimodal capabilities are particularly valuable, allowing researchers to integrate diverse data types—such as composition (text), structural properties (tabular data), and crystal structure images—without the need to manually engineer complex fusion mechanisms. This streamlined integration facilitates a more comprehensive understanding of materials, ultimately enhancing predictive accuracy for complex properties such as thermal stability, electrical conductivity, and mechanical strength.
AutoGluon automates model selection and hyperparameter tuning by training multiple models in parallel and selecting the best-performing model through an ensemble approach. This eliminates the need for manual tuning, enabling researchers to focus on improving data quality and interpreting results. This automated tuning feature is particularly valuable in materials science, where selecting and optimizing multimodal architectures can be time-intensive. By testing a wide range of model architectures and parameters, AutoGluon identifies the optimal configuration for a given multimodal dataset, whether it involves compositional, structural, or visual data. AutoGluon’s MultimodalPredictor is specifically designed to handle and fuse data from multiple modalities. Each data type is processed using modality-specific encoders—such as convolutional neural networks (CNNs) for images, transformers for text, and dense layers for tabular data—before being combined into a unified representation. This design ensures seamless integration of diverse data types into a cohesive predictive framework.
The framework is built to handle large datasets, making it well-suited for materials science applications that rely on extensive databases like the Materials Project or Alexandria. Its ability to parallelize training across multiple modalities allows for efficient processing and model optimization, even when dealing with large-scale multimodal datasets with high-dimensional features.
3.5. Challenges in Multimodal Learning
Multimodal learning offers significant advantages by combining diverse data types to enhance predictive power, but it also presents unique challenges, particularly in complex domains like materials science. These challenges include high computational demands, difficulties in integrating data across modalities, and challenges with model interpretability. Overcoming these obstacles is essential for developing robust multimodal models that are scalable, accurate, and interpretable.
Multimodal models are inherently complex due to the need to process and fuse multiple types of data, such as text, images, and structured data. Each modality often requires a specialized encoder—such as CNNs for images, transformers for text, and dense layers for tabular data—which increases the model’s size and computational demands. This complexity often results in high memory usage and longer training times, particularly when working with large datasets. Training multimodal models on large datasets presents additional challenges due to the increased data volume and the diverse preprocessing requirements for each modality. Scaling these models typically requires distributed computing resources and advanced hardware, such as GPUs or TPUs, which may not be accessible to researchers in resource-constrained environments. Balancing accuracy and computational efficiency in multimodal models is particularly challenging. These models require careful tuning of each modality’s encoder, the fusion layers, and the overall architecture, significantly increasing the complexity of hyperparameter optimization. Techniques like knowledge distillation—where a smaller model learns to mimic a larger one—and model pruning can help reduce model size and improve efficiency. However, these approaches add extra steps to the training process, further increasing the complexity of model development. One of the primary challenges in multimodal learning is aligning diverse data types with inherently different structures and scales. For example, text data (composition) is sequential, tabular data (structure) is numerical, and image data (crystal structures) is spatial. Developing an effective fusion strategy to combine these varied data types into a coherent representation, while preserving essential information, is a complex task. In real-world datasets, missing data in one or more modalities is common. For instance, some materials may lack high-quality images or detailed structural data. Multimodal models must either handle missing modalities gracefully or employ data imputation methods. However, these approaches increase model complexity and can introduce bias if not implemented carefully. Techniques like zero-imputation (filling in missing data with zeros) or cross-modal inference (using available modalities to predict missing data) can mitigate these issues but require thoughtful design to avoid negatively impacting model performance. Consistency across modalities is another critical aspect, particularly when one data type is more informative than others. In such cases, the model should dynamically weigh the contribution of each modality based on its relevance to the prediction task. This requires adaptive fusion techniques, such as attention mechanisms, to prioritize the most important modalities while still considering the potential contributions of others. These techniques are crucial for ensuring the model captures and utilizes the most relevant information from all available data types.
Multimodal models are often considered “black boxes” due to their complexity, making it difficult to interpret how different modalities contribute to the final prediction. For instance, a model predicting material stability might integrate data from composition, structure, and images, but understanding the specific role each modality plays in the prediction is challenging. Interpretability is especially important in materials science, where researchers need insights into the factors driving material properties to guide material design. However, multimodal models, particularly those based on deep learning architectures like neural networks, inherently lack transparency. This makes it difficult to trace the decision-making process across modalities, further complicating efforts to understand and validate model predictions. In multimodal models, it is crucial to understand not only the contributions of individual modalities but also the interactions between them. Cross-modal interpretability is particularly challenging, as models often rely on subtle relationships between modalities that are difficult to disentangle. Techniques such as attention maps and SHAP values (SHapley Additive exPlanations) are commonly used to interpret the contributions of individual modalities. However, adapting these techniques for multimodal settings is not straightforward and requires further research to ensure that the explanations are both reliable and accessible. In materials science, domain-specific explanations are vital for validating model predictions. For instance, if a multimodal model predicts high thermal conductivity, researchers need to determine whether the prediction is influenced by atomic arrangements (structure), specific compositional patterns, or visual features in crystal images. Developing explanations that align with domain knowledge not only helps validate the model but also builds trust in its predictions. In materials discovery, automated interpretability can provide actionable insights by identifying which features—such as specific atomic arrangements or structural characteristics—drive a material’s predicted stability or conductivity. These domain-aligned explanations are invaluable for guiding scientific decisions and accelerating innovation, yet they remain a significant challenge within multimodal frameworks.
4. Empirical Study
At the outset of this work, several key data sources were considered to construct a dataset suitable for multimodal machine learning in materials science. Options included established repositories such as the Materials Project [14] and the next-generation Alexandria dataset [3]. These databases provide comprehensive material data, including chemical composition, structural properties, and various material characteristics. However, a common limitation of these sources is that the data is primarily stored in JSON format, resulting in tabular representations rich in numerical, structural, and categorical information but lacking diversity in data modalities. This JSON-based structure inherently restricted the data to tabular modalities, excluding other critical formats such as visual representations. For multimodal learning, where the goal is to integrate diverse data types (e.g., text, images, and structured numerical data), it was necessary to extend beyond tabular data. Consequently, a key focus of this work became transforming the JSON-based tabular data from the Alexandria dataset into a fully multimodal dataset incorporating text, tabular, and visual modalities. Given the scale of the Alexandria dataset, which includes data on millions of materials, a random sample of 1,000 materials from the complete 3D JSON database was selected. This decision was driven by limitations in computational power and processing capacity required to handle the entire dataset, ensuring that the transformation process was manageable while still providing a representative sample for multimodal learning.
4.1. Data Understanding
Building upon the selection and sampling of the Alexandria dataset, the subsequent step involved a detailed examination of its structure and content to facilitate its transformation into a multimodal dataset. The structure of each record is designed to provide comprehensive information on the material’s composition, properties, and atomic structure.
Each record begins with metadata fields, such as @module and @class, which indicate that the data originates from Python’s pymatgen library, a widely used toolkit in computational materials science. These metadata fields are primarily for compatibility with pymatgen-based workflows but are not directly used in material property analysis. The energy field provides the computed total energy of the material. The composition field specifies the material’s elemental composition, with elements (e.g., Ba, Sr, Pd) as keys and their corresponding quantities as values. This field defines the stoichiometry of the material. The entry_id field serves as a unique identifier for the record, which may be None if not explicitly assigned. The energy_adjustments field contains a list of corrections applied to the computed energy, with each correction represented by a dictionary that includes fields like @module, @class, @version, and value. These adjustments account for systematic biases or corrections applied during energy calculations. Additionally, the parameters field is included as a placeholder for other computational parameters, though it is often empty in the dataset.
Detailed material-specific data is stored under the data field. This includes a unique material identifier (mat_id), a structural prototype identifier (prototype_id), and the file location of the material’s computational results (location). The formula field provides the chemical formula in a human-readable format. The elements field lists the constituent elements of the material. The spg field specifies the material’s space group number, while nsites indicates the number of atomic sites in the unit cell. The stress tensor, represented as a matrix, is stored in the stress field. The data field also contains computed properties, such as the total energy (energy_total), total magnetic moment (total_mag), indirect and direct band gaps (band_gap_ind and band_gap_dir), the density of states at the Fermi level (dos_ef), corrected energy (energy_corrected), energy above the convex hull (e_above_hull), formation energy (e_form), and energy related to phase separation (e_phase_separation). Decomposition information is provided in the decomposition field, specifying possible breakdown products of the material.
The structure field contains detailed information about the material’s atomic structure. It begins with metadata fields like @module and @class, followed by the material’s total charge (charge). The lattice information is provided under the lattice field, which includes a matrix of lattice vectors (matrix), periodic boundary conditions (pbc), lattice constants (a, b, c), lattice angles (alpha, beta, gamma), and the unit cell volume (volume). The atomic sites within the unit cell are listed under the sites field. Each site is represented as a dictionary containing the species present at the site, defined by the species field, which specifies the element (element) and its occupancy (occu). The fractional coordinates (abc) and Cartesian coordinates (xyz) of the site are also included. The label field provides the element symbol for easy reference. Each site also has associated properties, such as the magnetic moment (magmom), charge, and atomic forces (forces), which are represented as a list of force components.
This structure makes the Alexandria dataset a highly detailed and versatile resource for materials science research, enabling users to explore material properties comprehensively.
4.2. Dataset Construction and Multimodal Generation
The process of constructing the dataset and generating multimodal representations was crucial to enabling robust multimodal machine learning applications in materials science. The dataset construction encompassed the creation of complementary modalities, including image, tabular, and text representations, alongside the selection and preparation of standardized target features. Each modality provided unique insights into the properties and structure of materials, facilitating a comprehensive understanding and improved predictive performance across a range of machine learning models.
4.2.1. Generating the Image Modality for Multimodal Learning
To generate the image modality for this work, 2D visualizations of each material’s 3D crystal structure were created. These images provide a spatial representation of atomic arrangements, capturing critical structural details that complement the text and tabular data modalities. The images were produced using the same framework employed to render 3D objects in the Materials Project Web Interface, ensuring consistent and high-quality visualizations.
The image generation process involved designing a web application to render and capture 3D visualizations of each material. The implementation utilized the Dash framework for the web interface and Crystal Toolkit, integrated with pymatgen, to display the 3D structures interactively. For each material, a 3D model was rendered in the web interface and automatically screenshotted, saving the result as a 2D PNG file in a designated directory. The workflow began by loading the dataset from a pickle file and initializing the Dash application. A Crystal Toolkit component was configured to render the 3D structures in the web application, with specific settings optimized for the 2D view. These settings included disabling the compass, displaying bonds outside the unit cell, and centering and scaling the structure appropriately within the viewport. A layout was defined to display the structures, with an update interval of five seconds to progress through the dataset automatically. At each interval, a callback function was triggered when the structure data was updated. This function requested a PNG image of the rendered scene after a one-second delay to ensure the structure was fully rendered before capturing the screenshot. The captured image was saved to a specified directory and named using the material’s mat_id, maintaining alignment with the dataset. The entire image generation process required approximately 70 min to produce 1,000 images. The resulting dataset included visualizations of various materials, examples of which are presented in Table 1.
This automated workflow ensured efficient processing of the dataset while maintaining consistency and uniformity across all generated images. The final output comprised a collection of 2D images named according to their corresponding material’s mat_id, serving as an intuitive reference to the original dataset. This streamlined process facilitated the integration of a visual modality into the multimodal dataset while ensuring scalability, enabling the creation of a large, standardized set of images that effectively represent the 3D atomic structures of the materials.
4.2.2. Standardizing Structural Data for Tabular Representation
For the tabular modality, the dataset initially had a structured format that could be easily transformed into tabular data. However, incorporating the structure object—one of the most critical sources of information—posed a significant challenge. The structure object varied substantially across materials due to differences in the number of atomic sites and coordination environments. This variability rendered it impractical to create a consistent tabular format, as the number of columns and entries differed for each material. Without a fixed column structure, standard tabular models could not effectively process the data, necessitating the development of alternative methods to represent structural information consistently across all materials.
To address this challenge, the PotNet architecture was employed as a solution. PotNet is designed to generate fixed-size embeddings of a material’s structure, capturing essential features such as atomic positions and interatomic relationships. Although PotNet is typically utilized for property predictions, its workflow was adapted by freezing the prediction phase, enabling the extraction of fixed-length vectors representing each material’s structure. These fixed-length embeddings were then incorporated into the tabular dataset, providing a consistent and comprehensive representation of the structural information.
Generating PotNet embeddings required several preparatory steps. PotNet relies on interatomic potentials as input features to capture spatial and bonding characteristics. These potentials describe atomic interactions based on relative positions, offering critical insights into the physical and chemical properties of the material. To compute these potentials, the atomic structure data of each material was used. The structural data for each material was first converted into Crystallographic Information File (CIF) format. CIF files are a standard format for storing crystal structure data, including lattice parameters, atomic coordinates, and symmetry information. Using the pymatgen library, the structure object for each material was transformed into a CIF file, which was saved in a designated directory with filenames corresponding to unique material IDs. This organization ensured efficient referencing and retrieval of structural data. The CIF files were then processed using jarvis-tools to convert them into the JARVIS Atoms format, which enables compatibility with various computational workflows. This format allowed the extraction of atomic data into a Pandas DataFrame, enabling efficient manipulation and preparation for further analysis. Node attributes, representing the properties of individual atoms, and edge indices, defining bonds or potential interactions between atoms, were calculated to transform each material’s structure into a graph-based format suitable for PotNet. The computational environment was configured with the necessary dependencies, including pymatgen, jarvis-tools, torch-geometric, and dgl. These libraries facilitated the processing of crystal structures, the creation of graph representations, and the application of advanced graph neural network functionalities. Additionally, the GNU Scientific Library (GSL) was installed to handle advanced numerical computations.
PotNet was then initialized and configured with three convolution layers, defining dimensions for both atom and edge features along with an output vector size. An output size of 128 dimensions was chosen to adequately capture the structural complexity of the materials. Attribute tensors were constructed for each atom, using properties such as atomic numbers to represent atoms as feature vectors. These tensors were processed through convolutional and transformer layers, utilizing PotNetConv and TransformerConv to extract embeddings from node and edge features. After processing through convolutional and transformer layers, global mean pooling was applied to aggregate node features into a single vector representation for the entire structure. This vector was further refined through a fully connected layer, producing the final embedding. The embeddings for all materials were stored as rows in a tensor, which was subsequently converted into a Pandas DataFrame. This DataFrame was saved as a pickle file, providing a tabular representation of structural features with 128 dimensions for each material.
By employing PotNet to generate standardized structural embeddings, the variability inherent in the structure object was effectively resolved. This approach enabled the seamless incorporation of structural information into the tabular modality, addressing the challenges posed by inconsistent atomic site counts and coordination environments.
4.2.3. Generating the Text Modality for Multimodal Learning
The text modality was created using RoboCrystallographer to generate detailed descriptions of each material’s crystal structure and composition. RoboCrystallographer is a tool designed to emulate the analysis performed by a crystallographer, providing textual descriptions of crystal structures. It integrates seamlessly with the Materials Project and is compatible with pymatgen formats, producing detailed structural summaries.
The descriptions generated by RoboCrystallographer included advanced structural details such as space groups, coordination polyhedra, and complex bonding motifs. However, these intricate details posed challenges for the machine learning model. The specialized terms and high specificity of the descriptions often introduced noise, making it difficult for the model to generalize across materials. The unique nature of each material’s description provided limited common ground for the model to identify patterns, reducing its ability to generalize to new data points. While such detailed descriptions are valuable for human interpretation, their complexity proved to be less effective for training the model.
Based on these observations, the approach to text representation was adjusted to focus on the composition of each material. Inspired by CrabNet’s architecture, which effectively handles compositional data, the revised strategy simplified text descriptions by representing compositions in a standardized text format. Each element in the material, along with its atom count, was included in the text description, with elements and counts separated by spaces. This method was designed to simplify tokenization for the generic BERT model used within AutoGluon, enabling the model to interpret the compositional data effectively.
This simplified approach also aimed to enhance generalization by creating uniformity across composition texts. By standardizing the format, with elements followed by their counts and separated by spaces, the model was better equipped to recognize common elemental compositions and identify useful patterns. For instance, a material such as AcHg2Cd2, composed of five atoms with the composition {Ac: 1.0, Hg: 2.0, Cd: 2.0}, was converted to the text representation “Ac Hg 2 Cd 2”. This streamlined representation facilitated the integration of text data into the multimodal framework, providing a balance between simplicity and informativeness to optimize model performance.
4.2.4. Target Feature Selection
From the initial dataset, it was essential to identify and select specific target features for prediction. These features were carefully chosen to serve as benchmarks for the models, enabling consistent comparison across different modalities and architectures. By focusing on a standardized set of material properties, the study ensured clear objectives for each model—whether unimodal or multimodal—facilitating robust performance assessment and evaluation across all predicted features.
To define the target features, relevant columns from the dataset were utilized, and transformations were applied to standardize the data and enhance its utility for machine learning models. The following target features were selected:
- Gap (eV): This represents the band gap in electron volts, a key indicator of a material’s electronic behavior, such as whether it functions as a conductor, insulator, or semiconductor. The values were directly retrieved from the band_gap_ind.
- Eform (eV atom−1): The formation energy per atom in electron volts, reflecting the thermodynamic stability of the material. This feature was sourced directly from the e_form.
- Ehull (eV atom−1): Energy above the convex hull per atom in electron volts, indicating the material’s stability relative to potential phase separation. These values were derived from the e_above_hull.
- Etot/atom (eV atom−1): The total energy per atom in electron volts, representing the cumulative stability and binding energy of the atomic configuration. This feature was calculated by dividing the energy_total by the number of atomic sites (nsites).
- Mag/vol ( Å−3): The magnetic moment per unit volume, measured in micro-Bohr magnetons per cubic angstrom, providing a normalized measure of the material’s magnetism. This value was computed by dividing the total_mag by the volume.
- Vol/atom (Å3 atom−1): The atomic volume per atom in cubic angstroms, offering insights into atomic packing density. This feature was calculated by dividing the volume by nsites.
- DOS/atom (states (eV atom)−1): The density of electronic states per atom at the Fermi level, which provides insights into the material’s electronic and conductive properties. This feature was computed by dividing the dos_ef by nsites.
These features collectively offer a comprehensive representation of material properties, with each feature normalized or structured to ensure compatibility across different modalities. This systematic approach to feature selection and preparation not only facilitated robust model training but also supported meaningful comparisons of model performance across the chosen modalities.
4.3. Dataset Alignment
To construct the final dataset with aligned modalities, a systematic approach was followed to integrate tabular features, image, text, and structural embedding data into a unified format. This process ensured that each material was represented comprehensively across all modalities, facilitating effective multimodal machine learning.
The process began with the preparation of the initial dataset. The sample dataset was loaded and converted into a Pandas DataFrame, where predefined feature columns essential for model predictions, such as Etot/atom, Mag/vol, Vol/atom, and DOS/atom, were calculated. Non-essential columns were removed to focus solely on target features and identifiers necessary for modality integration and merging. For the image modality, a compressed file containing 2D visualizations of 3D material structures was extracted. Each material’s unique identifier, represented by its mat_id, was used to merge the image data with the feature dataset. A new column referencing the file paths of the images was added to the DataFrame, effectively incorporating the image modality for each material entry. The text modality was integrated next. A dataset containing textual representations of material compositions was joined with the main DataFrame. This textual data described the chemical makeup of each material, providing an additional descriptive modality that complemented the numerical and visual data. Structural embeddings generated by PotNet were also incorporated into the dataset. These 128-dimensional fixed-size vectors captured atomic relationships and structural patterns, representing the structure object in a consistent format. The PotNet embeddings were added as part of the tabular modality, enriching the dataset with detailed structural information.
By aligning all modalities—tabular features, image data, textual descriptions, and structural embeddings—within a single Pandas DataFrame, a unified multimodal dataset was created. This final DataFrame was then exported as a pickle file, ensuring the complete representation of each material across all modalities in a format ready for machine learning applications.
4.4. Multimodal Training Pipeline
For the model-building phase, an automated pipeline was developed to streamline the processes of training, prediction, and evaluation. This pipeline offered significant flexibility, accommodating various combinations of selected modalities and target features. The dataset was divided into 85% for training and 15% for testing, ensuring a robust sample for model development while reserving an independent test set for unbiased evaluation.
The pipeline leveraged AutoGluon’s MultiModalPredictor, which required minimal configuration to initiate training. By specifying the target feature and selecting the input modalities—such as tabular, image, text, or combinations thereof—the pipeline dynamically adapted to diverse data types. The high-quality preset in AutoGluon was utilized to enhance model performance, incorporating advanced training techniques and hyperparameter optimization. With AutoGluon managing the complexity of architecture selection, data processing, and model optimization, the pipeline efficiently streamlined the entire training workflow. Additionally, the framework automatically saved the best-performing model for future use.
The computational infrastructure for model building and training included an NVIDIA T4 GPU, enabling efficient processing. Depending on the number of modalities involved, training times ranged from a few minutes to approximately two hours. This infrastructure facilitated the rapid development and evaluation of models across multiple input configurations, providing an adaptable and efficient approach for multimodal learning without requiring extensive manual setup.
4.5. Evaluation and Analysis
The evaluation of the multimodal learning models focused on assessing their predictive performance on the test dataset across various combinations of modalities and target features. The results, presented in the following tables and figures, provide critical insights into the efficacy of integrating diverse modalities for predicting material properties and the influence of modality interactions on overall model performance.
To quantify predictive performance, two primary error metrics—mean absolute error (MAE) and root mean square error (RMSE)—were utilized, as defined in Equations 1 and 2:
In these equations, , represents the true value, is the predicted value, and N is the total number of samples. The MAE quantifies the average absolute difference between predicted and actual values, providing a direct measure of prediction accuracy. In contrast, the RMSE emphasizes larger deviations, penalizing models more heavily for significant errors due to its quadratic nature. Together, these metrics offer a comprehensive view of the models’ performance, balancing typical errors (captured by MAE) and outliers (captured by RMSE). The results presented in Table 2 provide a comprehensive analysis of the MAE across different modalities and their combinations for predicting various material properties, with the lowest value for each target feature highlighted in bold for clarity and emphasis.
For the Gap prediction, the combination of images and text achieves the lowest MAE of 0.093 eV, outperforming all other modality combinations. This result underscores the complementary nature of these two modalities, where image-based structural details and textual compositional data provide synergistic insights into the material’s electronic band gap. Among individual modalities, images yield the best performance (0.109 eV), demonstrating their strength in capturing structural features relevant to Gap prediction. Tabular data alone, in comparison, performs less effectively, with an MAE of 0.147 eV, indicating that tabular features may lack sufficient detail for this task. For Eform, the MAE is minimized when all three modalities (tabular, images, and text) are combined, achieving a value of 0.334 eV atom−1. This highlights the benefit of multimodal integration for predicting formation energy, as each modality contributes unique information—tabular data provides numerical summaries, images capture structural nuances, and text represents compositional details. The individual performance of images (0.377 eV atom−1) and text (0.376 eV atom−1) demonstrates that these modalities are particularly effective independently, while their combination further enhances prediction accuracy. For Ehull, the combination of images and text once again achieves the lowest MAE at 0.283 eV atom−1. This finding reinforces the complementary roles of visual and textual modalities in capturing the stability of materials relative to phase separation. Interestingly, the addition of tabular data to this combination results in slightly higher errors, suggesting potential redundancy or noise introduced by the tabular features. In the case Etot/atom, text as a standalone modality delivers the best performance, with an MAE of 5.416 eV atom−1. This result indicates that compositional information encoded in the text format is particularly effective for predicting total energy per atom. The addition of tabular data slightly increases the error (5.430 eV atom−1), while the inclusion of all three modalities results in a marginally higher error (5.660 eV atom−1). For Mag/vol, the lowest MAE of 0.005 Å−3 is achieved by both the images + text and tabular + images + text combinations. This indicates that multimodal approaches can effectively capture the complex magnetic behavior of materials, with images and text contributing significantly to this performance. Tabular data alone performs slightly worse (0.009 Å−3) , likely due to limited feature representation for magnetic properties. For Vol/atom, the combination of images and text once again yields the lowest MAE of 2.286 Å3 atom−1, indicating that visual and textual modalities together provide the most accurate representation of atomic packing density. This performance is superior to that of individual modalities, with images (2.679 Å3 atom−1) and text (2.728 Å3 atom−1) performing moderately well independently. Finally, for DOS/atom, the lowest MAE of 0.208 states (eV atom)−1 is achieved with the images + text combination. This again emphasizes the complementary nature of visual and textual modalities for capturing electronic properties at the Fermi level. The integration of all three modalities results in slightly higher errors, suggesting that the additional tabular features may not significantly enhance prediction accuracy for this property. Table 2 demonstrates the advantages of multimodal learning, particularly the combination of images and text, which consistently achieves the lowest errors across several target features.
Figure 1 provides a comprehensive visualization of the MAE across various modality combinations and target features, complementing the results summarized in Table 2. The figure effectively illustrates the performance variations between single-modal and multimodal configurations. Notably, the combination of text and image modalities demonstrates a significant reduction in MAE for key properties such as Gap, Ehull, Mag/vol, Vol/atom and DOS/atom. The integration of all three modalities—tabular, text, and images—consistently achieves competitive performance, highlighting the advantages of leveraging multimodal approaches. The error bars reflect the variability in predictions, further supporting the robustness and reliability of multimodal configurations.
The results presented in Table 3 offer a detailed evaluation of the RMSE across various modality combinations for predicting material properties, complementing the analysis in Table 2, with the lowest value for each target feature similarly highlighted in bold for clarity and emphasis. For the prediction of Gap, the text modality alone achieves the lowest RMSE (0.239 eV), indicating its superior ability to capture electronic structure information. Similarly, for Eform and Ehull, the combination of images and text yields the best performance, with RMSE values of 0.451 eV atom−1 and 0.449 eV atom−1, respectively. These results emphasize the synergistic benefits of integrating visual and textual information when predicting these features. In the case of Etot/atom, the text modality achieves the lowest RMSE (9.579 eV atom−1), underscoring its capability to represent energy-related properties effectively. The combination of all three modalities (tabular, images, and text) also performs competitively (9.822 eV atom−1), demonstrating the strength of multimodal learning in enhancing predictive accuracy. For Mag/vol, all combinations show comparable RMSE values, with the lowest error (0.011 Å−3) achieved by both the image + text combination and the integration of all three modalities. This result suggests that these modalities contribute complementary information for magnetic properties. The prediction of Vol/atom benefits the most from the image + text combination, which achieves the lowest RMSE (3.240 Å3 atom−1). This indicates that structural and compositional information encoded in images and text is crucial for accurately modeling atomic volume. Similarly, for DOS/atom, the image + text combination outperforms other configurations with an RMSE of 0.289 states (eV atom)−1 showcasing its effectiveness in capturing electronic properties. Table 3 demonstrates that multimodal approaches, particularly the combination of images and text, consistently outperform single-modal configurations across most target features. These results align closely with the MAE findings, reinforcing the complementary nature of the modalities and the advantage of integrating diverse data representations to enhance model performance. The tabular modality, while effective in certain cases, often benefits from being augmented with additional modalities, particularly for complex properties such as Eform, Ehull, and Vol/atom.
The RMSE results visualized in Figure 2 closely align with the trends observed in the MAE results depicted in Figure 1. Both figures consistently demonstrate the superior performance of multimodal approaches, particularly the combination of images and text, across most target features. In both cases, this modality combination achieves the lowest errors for complex properties such as Ehull, Vol/atom, and DOS/atom, highlighting the complementary nature of these data representations. While the MAE focuses on average prediction errors, RMSE emphasizes larger deviations due to its sensitivity to outliers. The higher sensitivity of RMSE results in slightly greater variability, as shown by the error bars in Figure 2, compared to Figure 1. Despite this, the overall ranking of modality combinations remains consistent between the two metrics, reinforcing the robustness of the findings. The figures collectively underscore the benefits of multimodal integration, as configurations that combine tabular, text, and image data consistently outperform single-modal setups. The integration of all three modalities (tabular + images + text) also demonstrates competitive performance in both metrics, further validating the advantage of multimodal learning frameworks in capturing the complex relationships underlying material properties.
To facilitate a more normalized comparison across target features, scaled versions of these metrics, MAE Scaled and RMSE Scaled, were also employed. These metrics contextualize prediction errors by accounting for the inherent variability of the target feature values, thereby enabling robust comparisons across data with differing numerical ranges or distributions. The MAE Scaled is defined in Equation 3:
This metric measures the mean absolute error relative to the mean absolute deviation (MAD) of the target data. The numerator represents the average prediction error, while the denominator captures the average deviation of the true values from their mean. By normalizing MAE in this manner, the MAE Scaled effectively adjusts for the inherent variability in the target feature, providing a direct comparison of prediction performance across features with different scales or ranges. A lower MAE Scaled indicates that the model achieves higher accuracy relative to the natural variability of the data.
Similarly, the RMSE Scaled is defined in Equation 4:
This metric compares the root mean square error (RMSE) of the predictions to the root mean square deviation (RMSD) of the target values. The numerator, RMSE, captures the quadratic mean of the differences between predicted and actual values, making it particularly sensitive to larger errors. The denominator, RMSD, reflects the inherent variability in the data by measuring the quadratic mean deviation of true values from their mean. The RMSE Scaled thereby provides a normalized evaluation of model performance, indicating how well the model predicts compared to the baseline variability of the target feature. A value close to 1 suggests that the model’s prediction error is similar to the data’s natural variability, while a value substantially below 1 indicates that the model outperforms the baseline expectation.
The MAE Scaled results in Table 4 provide a normalized perspective on prediction errors by accounting for the variability within the target features. Similar trends to the unscaled MAE are observed, where multimodal combinations, particularly the images + text configuration, consistently yield the lowest scaled errors for most target features. This highlights the complementary nature of these modalities. For Gap, the combination of images and text achieves the best performance (1.427), indicating that integrating structural insights from images with compositional details from text enhances the predictive capability. This aligns with the unscaled MAE results, where this combination also achieved the lowest error. For Eform and Ehull, the images + text combination similarly demonstrates superior performance, achieving scaled errors of 0.648 and 0.529, respectively. These results emphasize the importance of combining visual and textual modalities in capturing both structural stability and formation energy. Notably, the inclusion of all three modalities marginally improves the performance for Eform (0.645), suggesting the tabular data adds complementary value for this property. In the case of Etot/atom, text as a standalone modality achieves the lowest scaled error (0.306), consistent with earlier MAE observations. This result underscores the strength of compositional information in predicting total energy per atom. For Mag/vol, the lowest scaled error (0.681) is achieved by the images + text combination, showcasing its ability to capture magnetic behavior effectively. Similarly, for Vol/atom and DOS/atom, the same combination exhibits the best performance, with scaled errors of 0.363 and 0.687, respectively, further validating the complementary role of these modalities. Overall, the MAE Scaled results reinforce the findings from the unscaled MAE, highlighting the effectiveness of multimodal combinations, particularly images and text, in minimizing prediction errors relative to the natural variability of the target features.
The RMSE Scaled results in Table 5 offer a quadratic perspective on prediction errors normalized by the variability within the target features. Consistent with the scaled MAE and unscaled RMSE results, the images + text combination achieves the best performance across most target features. For Gap, the text modality alone achieves the lowest scaled error (1.175), slightly outperforming the images + text combination (1.239). This result emphasizes the strength of compositional information for capturing electronic band gap properties. For Eform and Ehull, the images + text combination achieves the lowest scaled errors, with values of 0.556 and 0.632, respectively. These results align with the unscaled RMSE findings, showcasing the synergistic benefits of integrating visual and textual data for predicting stability-related properties. In the case of Etot/atom, text alone achieves the lowest scaled error (0.378), reaffirming its dominance for energy-related properties. The inclusion of all three modalities results in a slightly higher error (0.388), indicating that tabular data may introduce some redundancy for this target feature. For Mag/vol, the lowest scaled error (0.871) is achieved by the tabular + images + text combination. This suggests that incorporating tabular data alongside images and text helps to capture magnetic behavior more comprehensively. Finally, for Vol/atom and DOS/atom, the images + text combination once again demonstrates the best performance, achieving scaled errors of 0.420 and 0.752, respectively. These results highlight the robustness of multimodal approaches for modeling both atomic volume and electronic density of states.
The plots of MAE Scaled and RMSE Scaled in Figure 3 offer a concise visualization of prediction errors across various modality combinations and target features, effectively normalizing the results by accounting for the inherent variability in the data. The left panel of the figure shows the MAE Scaled results for each modality combination across all target features. For most features, the combination of images and text achieves the lowest scaled errors, reinforcing their complementary nature in capturing structural and compositional information. For properties like Gap, Vol/atom, and DOS/atom, the images + text combination consistently outperforms all other configurations, achieving the smallest scaled error. Text alone also performs well for Etot/atom, achieving the lowest MAE Scaled value, highlighting the strength of compositional information for this property. Interestingly, tabular data as a single modality shows higher scaled errors for most features, particularly Gap, where its error is substantially larger compared to multimodal combinations. The inclusion of all three modalities (tabular, images, and text) generally results in competitive scaled errors but does not always outperform the images + text combination. This pattern suggests that while tabular data may add some value, its contribution is often redundant or less impactful compared to the synergies between images and text. Notably, Eform benefits slightly from the inclusion of all modalities, as shown by a marginal improvement in scaled errors. The right panel of the figure displays the RMSE Scaled results, which align closely with the trends observed in MAE Scaled. The combination of images and text consistently achieves the lowest scaled errors for features such as Eform, Ehull, Vol/atom, and DOS/atom. These results emphasize the value of integrating structural and compositional information to improve predictive accuracy across a range of material properties. For Etot/atom, text alone maintains the lowest scaled RMSE, mirroring its performance in MAE Scaled and underscoring the importance of compositional data for energy-related properties. In contrast, tabular data as a single modality generally exhibits higher RMSE Scaled values, particularly for Gap, where its scaled error is the largest among all modality combinations. This suggests that tabular features alone struggle to capture the complexity of certain target properties without augmentation from other modalities. Both MAE Scaled and RMSE Scaled highlight consistent patterns across target features, with multimodal combinations, particularly images + text, delivering superior performance compared to single-modal configurations. The close alignment of the two metrics underscores the robustness of these observations, as both scaled error metrics confirm the advantage of leveraging diverse data representations to capture complex material properties.
The heat maps in Figure 4 provide a detailed comparison of the MAE Scaled and RMSE Scaled results across various modality combinations and target features. Darker shades indicate higher scaled errors, while lighter shades represent lower errors. For both metrics, the combination of images and text generally achieves the lightest shades across most target features, emphasizing its effectiveness in minimizing prediction errors. Particularly for Eform, Ehull, and Vol/atom, this combination stands out as a consistently strong performer. On the other hand, the tabular modality exhibits darker shades, especially for Gap and Mag/vol, indicating higher errors when used alone. The inclusion of all three modalities (tabular, images, and text) shows mixed results, with some improvement for Eform but slightly higher errors for other features like Gap. These visualizations reinforce the conclusion that multimodal combinations, particularly images and text, are highly effective for reducing scaled prediction errors while aligning with the inherent variability of the data.
5. Conclusion
This study highlights the transformative potential of multimodal learning for material property prediction, demonstrating how integrating diverse data modalities can significantly enhance predictive accuracy across a wide range of material features. The proposed framework systematically incorporated tabular, textual, and image modalities, each contributing unique and complementary insights into the underlying physical and chemical properties of materials. By leveraging these modalities, the study provided a comprehensive strategy to tackle the inherent complexity of materials data, setting a benchmark for future research in multimodal deep learning in materials science.
The results clearly illustrate the advantages of multimodal learning, with the combination of images and text emerging as the most effective configuration for many target features, such as formation energy (Eform), energy above the convex hull (Ehull), and atomic volume (Vol/atom). This synergistic effect highlights the complementary nature of image and text modalities, where visual representations capture intricate structural details while textual descriptions provide precise compositional information. The integration of tabular data further improved predictive performance in certain cases, such as (Eform), demonstrating the utility of numerical summaries in complementing multimodal architectures. The introduction of scaled error metrics (MAE Scaled and RMSE Scaled) offered an innovative perspective on evaluating model performance. These metrics normalized prediction errors relative to the natural variability of the target features, enabling a fair and meaningful comparison across properties with differing scales or distributions. The consistent alignment of scaled and unscaled metrics underscores the robustness of the multimodal approach, with scaled results reinforcing the utility of integrating diverse data modalities.
A significant contribution of this work is the development of a flexible and automated pipeline for multimodal data integration and machine learning model development. By utilizing AutoGluon’s MultiModalPredictor, the study streamlined the processes of training, predicting, and evaluating models across multiple modality combinations. This automation reduced the need for extensive manual intervention while ensuring consistent hyperparameter optimization and model selection. The use of high-quality presets and advanced deep learning techniques, coupled with the power of GPU computing, allowed for efficient handling of computationally intensive tasks, ensuring scalability and robustness. Another major advancement was the generation and alignment of multimodal data. Images of 3D crystal structures, textual descriptions of compositions, and tabular features were seamlessly integrated into a unified dataset. This comprehensive dataset enabled the exploration of the relative contributions of each modality and their combinations, providing valuable insights into their strengths and limitations for different material properties.
The findings of this study have significant implications for materials discovery and property prediction. The demonstrated ability of multimodal learning to outperform single-modality approaches highlights its potential to address the challenges posed by complex material systems. By capturing a more holistic representation of materials through the integration of multiple data types, this approach can accelerate the identification of promising candidates for specific applications, such as energy storage, catalysis, or semiconductors. The scalability of the proposed framework also makes it suitable for large-scale datasets, such as those from high-throughput computational screenings or experimental databases. Furthermore, the use of normalized metrics, such as MAE Scaled and RMSE Scaled, ensures that the models can be effectively compared across a diverse range of material properties, facilitating the adoption of multimodal learning in broader applications.
While the results are promising, several challenges remain to be addressed. The predictive accuracy for certain properties, such as the band gap (Gap), demonstrated room for improvement, suggesting that additional modalities or enhanced feature extraction techniques may be required. The inclusion of experimental data, such as spectroscopy or diffraction patterns, could further enrich the dataset and provide valuable real-world insights. Additionally, the interpretability of multimodal models remains a critical challenge. Developing methods to elucidate the contribution of each modality and its features to the final prediction is essential for building trust and ensuring the practical applicability of these models. The computational complexity associated with multimodal learning also warrants further investigation. As datasets grow larger and more complex, optimizing the efficiency of data preprocessing, model training, and evaluation will become increasingly important. Techniques such as transfer learning, model pruning, or distributed computing could play a vital role in addressing these challenges.
Author Contributions
Conceptualization, V.C., J.M.O. and P.R.; methodology, V.C., J.M.O. and P.R.; software, V.C., J.M.O. and P.R.; validation, V.C., J.M.O. and P.R.; formal analysis, V.C., J.M.O. and P.R.; investigation, V.C., J.M.O. and P.R.; resources, V.C., J.M.O. and P.R.; data curation, V.C., J.M.O. and P.R.; writing—original draft preparation, V.C., J.M.O. and P.R.; writing—review and editing, V.C., J.M.O. and P.R.; visualization, V.C., J.M.O. and P.R.; All authors have read and agreed to the published version of the manuscript.
Funding
This research received no external funding.
Data Availability Statement
A publicly available dataset was used in this study. The data can be found here: https://alexandria.icams.rub.de/ (accessed on 25 September 2024).
Acknowledgments
This article is based upon work from COST Action Data-driven Applications towards the Engineering of Functional Materials: an Open Network (DAEMON), CA22154, supported by COST (European Cooperation in Science and Technology
Conflicts of Interest
The authors declare no conflict of interest.
References
- Chapman, P.; Clinton, J.; Kerber, R.; Khabaza, T.; Reinartz, T.; Shearer, C.; Wirth, R. CRIPS-DM 1.0 Step by Step Data Mining Guide. Technical report, CRISP-DM Consortium, 2000.
- Ramos, P.; Oliveira, J.M. Robust Sales Forecasting Using Deep Learning with Static and Dynamic Covariates. Applied System Innovation 2023, 6. [Google Scholar] [CrossRef]
- Schmidt, J.; Cerqueira, T.F.; Romero, A.H.; Loew, A.; Jäger, F.; Wang, H.C.; Botti, S.; Marques, M.A. Improving machine-learning models in materials science through large datasets. Materials Today Physics 2024, 48, 101560. [Google Scholar] [CrossRef]
- Baltrusaitis, T.; Ahuja, C.; Morency, L.P. Multimodal Machine Learning: A Survey and Taxonomy. IEEE Trans. Pattern Anal. Mach. Intell. 2019, 41, 423–443. [Google Scholar] [CrossRef]
- Summaira, J.; Li, X.; Shoib, A.M.; Li, S.; Jabbar, A. Recent Advances and Trends in Multimodal Deep Learning: A Review. arXiv 2021. [Google Scholar] [CrossRef]
- Guo, W.; Wang, J.; Wang, S. Deep Multimodal Representation Learning: A Survey. IEEE Access 2019, 7, 63373–63394. [Google Scholar] [CrossRef]
- Teixeira, M.; Oliveira, J.M.; Ramos, P. Enhancing Hierarchical Sales Forecasting with Promotional Data: A Comparative Study Using ARIMA and Deep Neural Networks. Machine Learning and Knowledge Extraction 2024, 6, 2659–2687. [Google Scholar] [CrossRef]
- Oliveira, J.M.; Ramos, P. Investigating the Accuracy of Autoregressive Recurrent Networks Using Hierarchical Aggregation Structure-Based Data Partitioning. Big Data and Cognitive Computing 2023, 7. [Google Scholar] [CrossRef]
- Škrlj, B. From Unimodal to Multimodal Machine Learning: An overview; SpringerBriefs in Computer Science, Springer Cham, 2024. [CrossRef]
- Oliveira, J.M.; Ramos, P. Cross-Learning-Based Sales Forecasting Using Deep Learning via Partial Pooling from Multi-level Data. In Proceedings of the Engineering Applications of Neural Networks; Iliadis, L.; Maglogiannis, I.; Alonso, S.; Jayne, C.; Pimenidis, E., Eds., Cham, 2023; pp. 279–290. [CrossRef]
- Oliveira, J.M.; Ramos, P. Evaluating the Effectiveness of Time Series Transformers for Demand Forecasting in Retail. Mathematics 2024, 12. [Google Scholar] [CrossRef]
- Liang, P.P.; Zadeh, A.; Morency, L.P. Foundations & Trends in Multimodal Machine Learning: Principles, Challenges, and Open Questions. ACM Comput. Surv. 2024, 56. [Google Scholar] [CrossRef]
- Chen, Y.; Wei, F.; Sun, X.; Wu, Z.; Lin, S. A Simple Multi-Modality Transfer Learning Baseline for Sign Language Translation. In Proceedings of the 2022 IEEE/CVF Conference on Computer Vision and Pattern Recognition (CVPR); 2022; pp. 5110–5120. [Google Scholar] [CrossRef]
- Jain, A.; Ong, S.P.; Hautier, G.; Chen, W.; Richards, W.D.; Dacek, S.; Cholia, S.; Gunter, D.; Skinner, D.; Ceder, G.; et al. Commentary: The Materials Project: A materials genome approach to accelerating materials innovation. APL Materials 2013, 1, 011002. [Google Scholar] [CrossRef]
- Lin, Y.; Yan, K.; Luo, Y.; Liu, Y.; Qian, X.; Ji, S. Efficient Approximations of Complete Interatomic Potentials for Crystal Property Prediction. In Proceedings of the 40th International Conference on Machine Learning; Krause, A.; Brunskill, E.; Cho, K.; Engelhardt, B.; Sabato, S.; Scarlett, J., Eds. PMLR, 23–29 Jul 2023, Vol. 202, Proceedings of Machine Learning Research, pp. 21260–21287. [CrossRef]
- Horton, M.; Shen, J.X.; Burns, J.; Cohen, O.; Chabbey, F.; Ganose, A.M.; Guha, R.; Huck, P.; Li, H.H.; McDermott, M.; et al. Crystal Toolkit: A Web App Framework to Improve Usability and Accessibility of Materials Science Research Algorithms. arXiv 2023. [Google Scholar] [CrossRef]
- Xu, P.; Zhu, X.; Clifton, D.A. Multimodal Learning With Transformers: A Survey. IEEE Transactions on Pattern Analysis & Machine Intelligence 2023, 45, 12113–12132. [Google Scholar] [CrossRef]
- Devlin, J.; Chang, M.W.; Lee, K.; Toutanova, K. BERT: Pre-training of Deep Bidirectional Transformers for Language Understanding. In Proceedings of the 2019 Conference of the North American Chapter of the Association for Computational Linguistics: Human Language Technologies, Volume 1 (Long and Short Papers); Burstein, J.; Doran, C.; Solorio, T., Eds., Minneapolis, Minnesota, 6 2019; pp. 4171–4186. [CrossRef]
- Radford, A.; Narasimhan, K.; Salimans, T.; Sutskever, I. Radford, A.; Narasimhan, K.; Salimans, T.; Sutskever, I. Improving Language Understanding by Generative Pre-Training. 2018. Available online: https://cdn.openai.com/research-covers/language-unsupervised/language_understanding_paper.pdf.
- Vaswani, A.; Shazeer, N.; Parmar, N.; Uszkoreit, J.; Jones, L.; Gomez, A.N.; Kaiser, L.u.; Polosukhin, I. Attention is All you Need. In Proceedings of the Advances in Neural Information Processing Systems, 2017, Vol. 30, pp. 5998–6008. [CrossRef]
- Taylor, W.L. “Cloze Procedure”: A New Tool for Measuring Readability. Journalism Quarterly 1953, 30, 415–433. [Google Scholar] [CrossRef]
- Wang, A.; Singh, A.; Michael, J.; Hill, F.; Levy, O.; Bowman, S. GLUE: A Multi-Task Benchmark and Analysis Platform for Natural Language Understanding. In Proceedings of the 2018 EMNLP Workshop BlackboxNLP: Analyzing and Interpreting Neural Networks for NLP; Linzen, T.; Chrupała, G.; Alishahi, A., Eds., Brussels, Belgium, 2018; pp. 353–355. [CrossRef]
- Rajpurkar, P.; Zhang, J.; Lopyrev, K.; Liang, P. SQuAD: 100,000+ Questions for Machine Comprehension of Text. In Proceedings of the 2016 Conference on Empirical Methods in Natural Language Processing; Su, J.; Duh, K.; Carreras, X., Eds., Austin, Texas, 11 2016; pp. 2383–2392. [CrossRef]
- Zellers, R.; Bisk, Y.; Schwartz, R.; Choi, Y. SWAG: A Large-Scale Adversarial Dataset for Grounded Commonsense Inference. In Proceedings of the 2018 Conference on Empirical Methods in Natural Language Processing; Riloff, E.; Chiang, D.; Hockenmaier, J.; Tsujii, J., Eds., Brussels, Belgium, 2018; pp. 93–104. [CrossRef]
- MatBERT GitHub. MatBERT: A pretrained BERT model on materials science literature. 2021. Available online: https://github.com/lbnlp/MatBERT.
- Wang, A.Y.T.; Kauwe, S.K.; Murdock, R.J.; Sparks, T.D. Compositionally restricted attention-based network for materials property predictions. npj Computational Materials 2021, 7, 77. [Google Scholar] [CrossRef]
- Scarselli, F.; Gori, M.; Tsoi, A.C.; Hagenbuchner, M.; Monfardini, G. The Graph Neural Network Model. IEEE Transactions on Neural Networks 2009, 20, 61–80. [Google Scholar] [CrossRef] [PubMed]
- Wu, Z.; Pan, S.; Chen, F.; Long, G.; Zhang, C.; Yu, P.S. A Comprehensive Survey on Graph Neural Networks. IEEE Transactions on Neural Networks and Learning Systems 2021, 32, 4–24. [Google Scholar] [CrossRef]
- Kipf, T.N.; Welling, M. Semi-Supervised Classification with Graph Convolutional Networks. In Proceedings of the International Conference on Learning Representations, 2017. [CrossRef]
- Veličković, P.; Cucurull, G.; Casanova, A.; Romero, A.; Liò, P.; Bengio, Y. Graph Attention Networks. In Proceedings of the International Conference on Learning Representations; 2018. [Google Scholar] [CrossRef]
- Xie, T.; Grossman, J.C. Crystal Graph Convolutional Neural Networks for an Accurate and Interpretable Prediction of Material Properties. Phys. Rev. Lett. 2018, 120, 145301. [Google Scholar] [CrossRef] [PubMed]
- Gasteiger, J.; Groß, J.; Günnemann, S. Directional Message Passing for Molecular Graphs. In Proceedings of the International Conference on Learning Representations; 2020. [Google Scholar] [CrossRef]
- Gasteiger, J.; Becker, F.; Günnemann, S. GemNet: Universal Directional Graph Neural Networks for Molecules. In Proceedings of the 35th International Conference on Neural Information Processing Systems; Ranzato, M.; Beygelzimer, A.; Dauphin, Y.; Liang, P.; Vaughan, J.W., Eds. Curran Associates, Inc., 2021, Vol. 34, pp. 6790–6802. [CrossRef]
- Schütt, K.T.; Kindermans, P.J.; Sauceda, H.E.; Chmiela, S.; Tkatchenko, A.; Müller, K.R. SchNet: A continuous-filter convolutional neural network for modeling quantum interactions. In Proceedings of the 31st International Conference on Neural Information Processing Systems, Red Hook, NY, USA, 2017; NIPS’17, p. 992–1002. [CrossRef]
- Lecun, Y.; Bottou, L.; Bengio, Y.; Haffner, P. Gradient-based learning applied to document recognition. Proceedings of the IEEE 1998, 86, 2278–2324. [Google Scholar] [CrossRef]
- He, K.; Zhang, X.; Ren, S.; Sun, J. Deep Residual Learning for Image Recognition. In Proceedings of the 2016 IEEE Conference on Computer Vision and Pattern Recognition (CVPR), 2016, pp. 770–778. [CrossRef]
- Tan, M.; Le, Q.V. EfficientNet: Rethinking Model Scaling for Convolutional Neural Networks. In Proceedings of the 36th International Conference on Machine Learning, ICML 2019, 9-15 June 2019, Long Beach, California, USA; Chaudhuri, K.; Salakhutdinov, R., Eds. PMLR, 2019, Vol. 97, Proceedings of Machine Learning Research, pp. 6105–6114. [CrossRef]
- Dosovitskiy, A.; Beyer, L.; Kolesnikov, A.; Weissenborn, D.; Zhai, X.; Unterthiner, T.; Dehghani, M.; Minderer, M.; Heigold, G.; Gelly, S.; et al. An Image is Worth 16x16 Words: Transformers for Image Recognition at Scale. In Proceedings of the International Conference on Learning Representations, 2021. [CrossRef]
- Liu, Z.; Lin, Y.; Cao, Y.; Hu, H.; Wei, Y.; Zhang, Z.; Lin, S.; Guo, B. Swin Transformer: Hierarchical Vision Transformer using Shifted Windows . In Proceedings of the 2021 IEEE/CVF International Conference on Computer Vision (ICCV), Los Alamitos, CA, USA, 10 2021; pp. 9992–10002. [CrossRef]
- Deng, J.; Dong, W.; Socher, R.; Li, L.J.; Li, K.; Fei-Fei, L. ImageNet: A large-scale hierarchical image database. In Proceedings of the 2009 IEEE Conference on Computer Vision and Pattern Recognition, 2009, pp. 248–255. [CrossRef]
- D’mello, S.K.; Kory, J. A Review and Meta-Analysis of Multimodal Affect Detection Systems. ACM Comput. Surv. 2015, 47. [Google Scholar] [CrossRef]
- Zeng, Z.; Pantic, M.; Roisman, G.I.; Huang, T.S. A Survey of Affect Recognition Methods: Audio, Visual, and Spontaneous Expressions. IEEE Transactions on Pattern Analysis and Machine Intelligence 2009, 31, 39–58. [Google Scholar] [CrossRef] [PubMed]
- Atrey, P.K.; Hossain, M.A.; El Saddik, A.; Kankanhalli, M.S. Multimodal fusion for multimedia analysis: A survey. Multimedia Systems 2010, 16, 345–379. [Google Scholar] [CrossRef]
- Wu, Z.; Cai, L.; Meng, H. Multi-level Fusion of Audio and Visual Features for Speaker Identification. In Proceedings of the Advances in Biometrics; Zhang, D.; Jain, A.K., Eds., Berlin, Heidelberg, 2005; pp. 493–499. https://doi.org/10.1007/11608288_66. [CrossRef]
- Lan, Z.z.; Bao, L.; Yu, S.I.; Liu, W.; Hauptmann, A.G. Double Fusion for Multimedia Event Detection. In Proceedings of the Advances in Multimedia Modeling; Schoeffmann, K.; Merialdo, B.; Hauptmann, A.G.; Ngo, C.W.; Andreopoulos, Y.; Breiteneder, C., Eds., Berlin, Heidelberg, 2012; pp. 173–185. [CrossRef]
- Radford, A.; Kim, J.W.; Hallacy, C.; Ramesh, A.; Goh, G.; Agarwal, S.; Sastry, G.; Askell, A.; Mishkin, P.; Clark, J.; et al. Learning Transferable Visual Models From Natural Language Supervision. In Proceedings of the International Conference on Machine Learning; 2021. [Google Scholar] [CrossRef]
- Chen, T.; Kornblith, S.; Norouzi, M.; Hinton, G. A simple framework for contrastive learning of visual representations. In Proceedings of the 37th International Conference on Machine Learning. JMLR.org, 2020, ICML’20. [CrossRef]
- Zheng, Z.; Zheng, L.; Garrett, M.; Yang, Y.; Xu, M.; Shen, Y.D. Dual-path Convolutional Image-Text Embeddings with Instance Loss. ACM Trans. Multimedia Comput. Commun. Appl. 2020, 16. [Google Scholar] [CrossRef]
- Xu, K.; Ba, J.; Kiros, R.; Cho, K.; Courville, A.; Salakhudinov, R.; Zemel, R.; Bengio, Y. Show, Attend and Tell: Neural Image Caption Generation with Visual Attention. In Proceedings of the 32nd International Conference on Machine Learning; Bach, F.; Blei, D., Eds., Lille, France, 07–09 Jul 2015; Vol. 37, Proceedings of Machine Learning Research, pp. 2048–2057. [CrossRef]
- Tian, Y.; Krishnan, D.; Isola, P. Contrastive Multiview Coding. In Proceedings of the Computer Vision – ECCV 2020; Vedaldi, A.; Bischof, H.; Brox, T.; Frahm, J.M., Eds., Cham, 2020; pp. 776–794. [CrossRef]
- Li, Z.; Xie, C.; Cubuk, E.D. Scaling (Down) CLIP: A Comprehensive Analysis of Data, Architecture, and Training Strategies. arXiv 2024. [Google Scholar] [CrossRef]
- Moro, V.; Loh, C.; Dangovski, R.; Ghorashi, A.; Ma, A.; Chen, Z.; Kim, S.; Lu, P.Y.; Christensen, T.; Soljačić, M. Multimodal Learning for Materials. arXiv 2024. [Google Scholar] [CrossRef]
- Tang, Z.; Fang, H.; Zhou, S.; Yang, T.; Zhong, Z.; Hu, C.; Kirchhoff, K.; Karypis, G. AutoGluon-Multimodal (AutoMM): Supercharging Multimodal AutoML with Foundation Models. In Proceedings of the Third International Conference on Automated Machine Learning; Eggensperger, K.; Garnett, R.; Vanschoren, J.; Lindauer, M.; Gardner, J.R., Eds. PMLR, 09–12 Sep 2024, Vol. 256, Proceedings of Machine Learning Research, pp. 15/1–35. [CrossRef]
Figure 1.
Visualization of MAE across various modality combinations and target features.
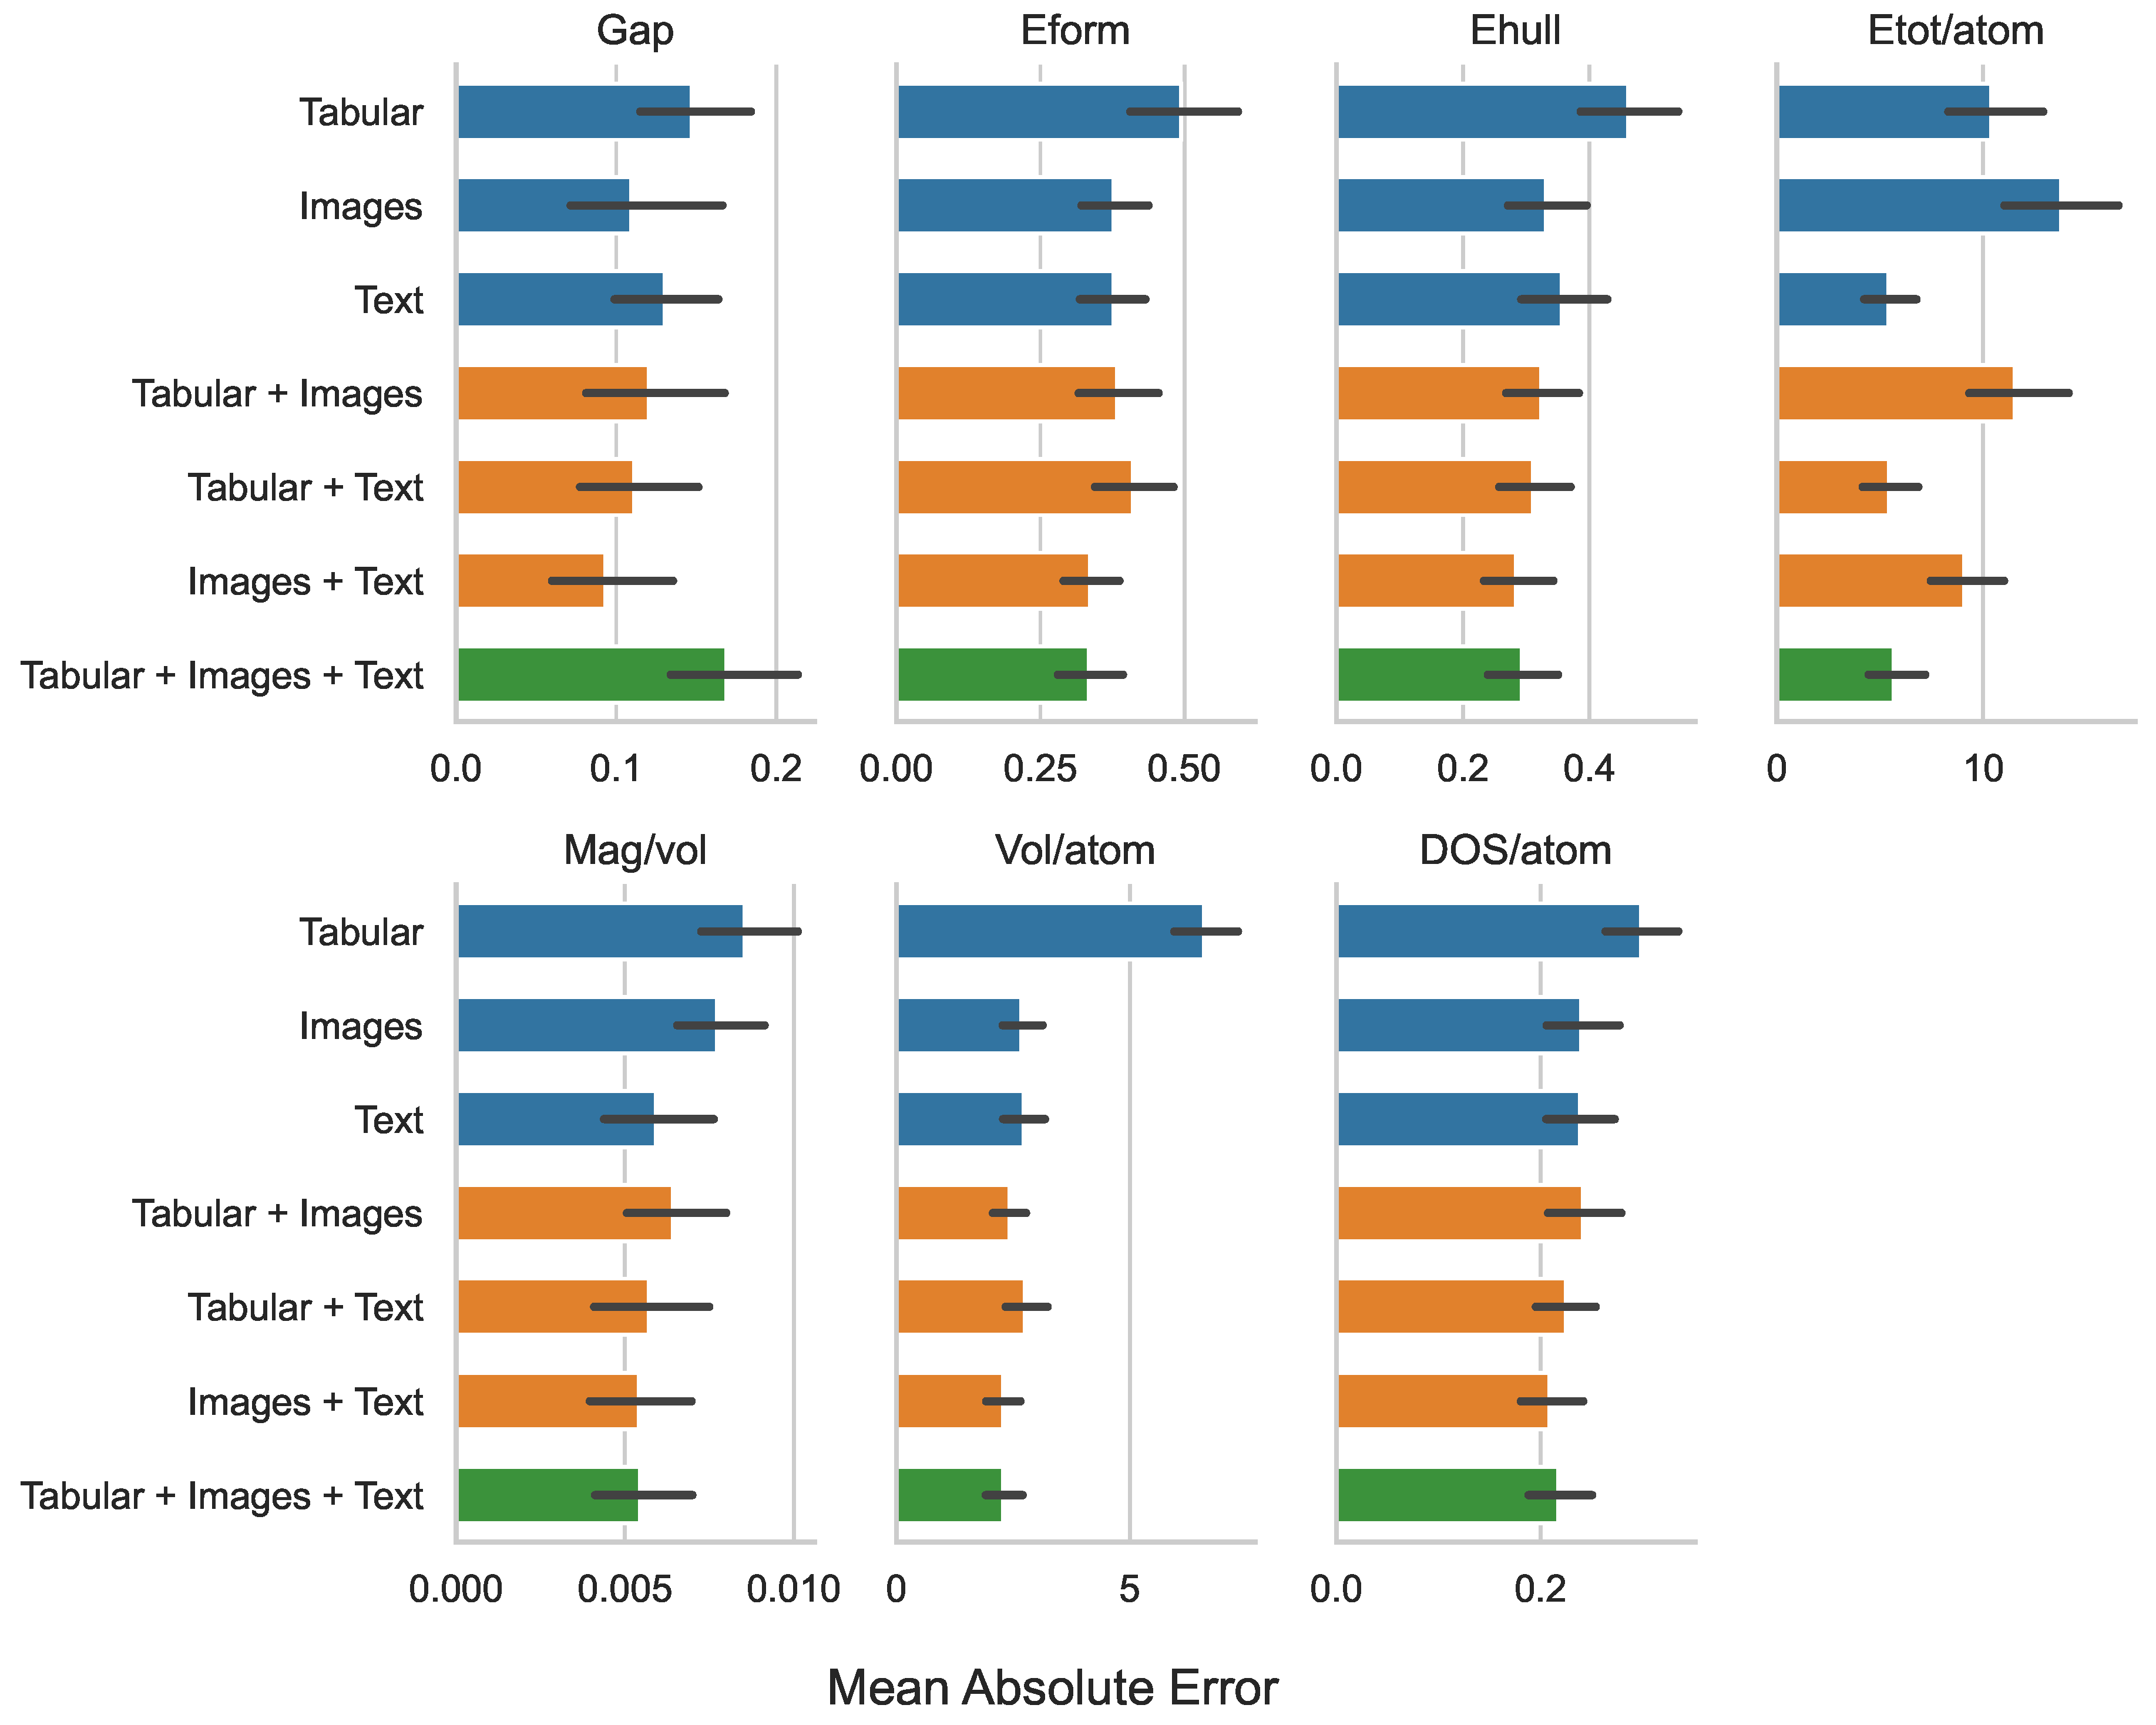
Figure 2.
Visualization of RMSE across various modality combinations and target features.
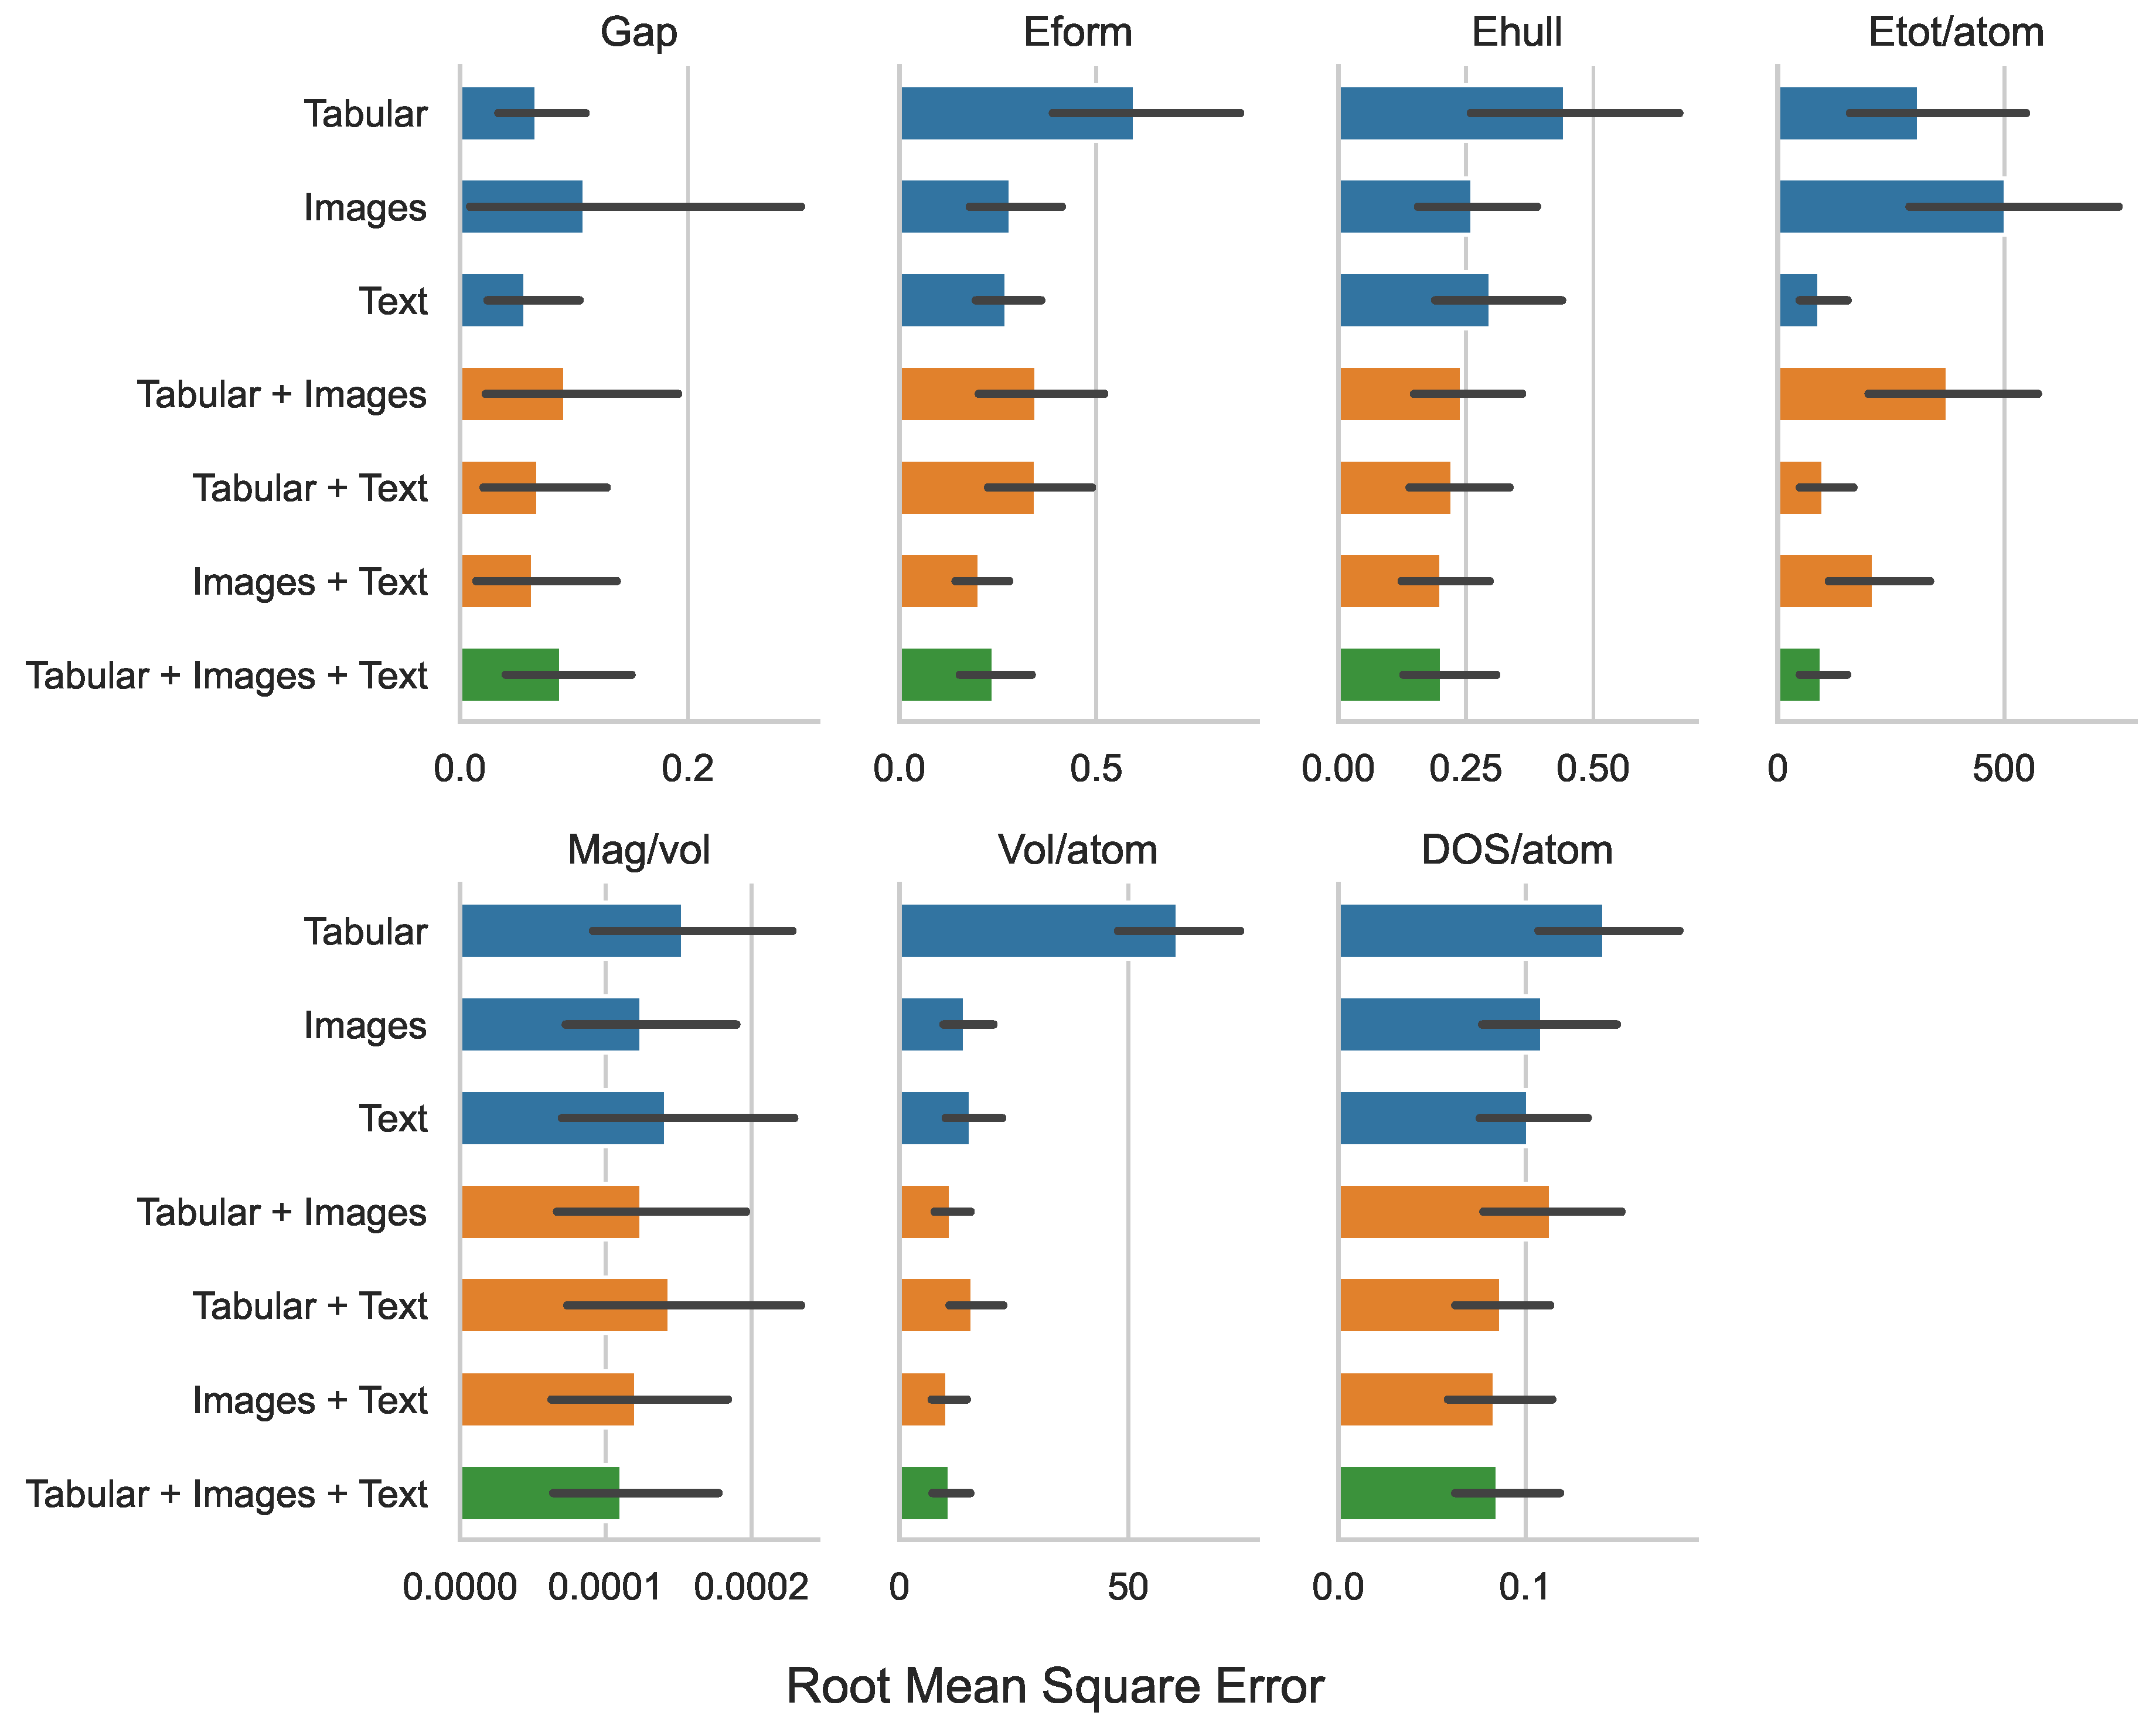
Figure 3.
MAE Scaled (left) and RMSE Scaled (right) results for different combinations of modalities across target features.
Figure 3.
MAE Scaled (left) and RMSE Scaled (right) results for different combinations of modalities across target features.
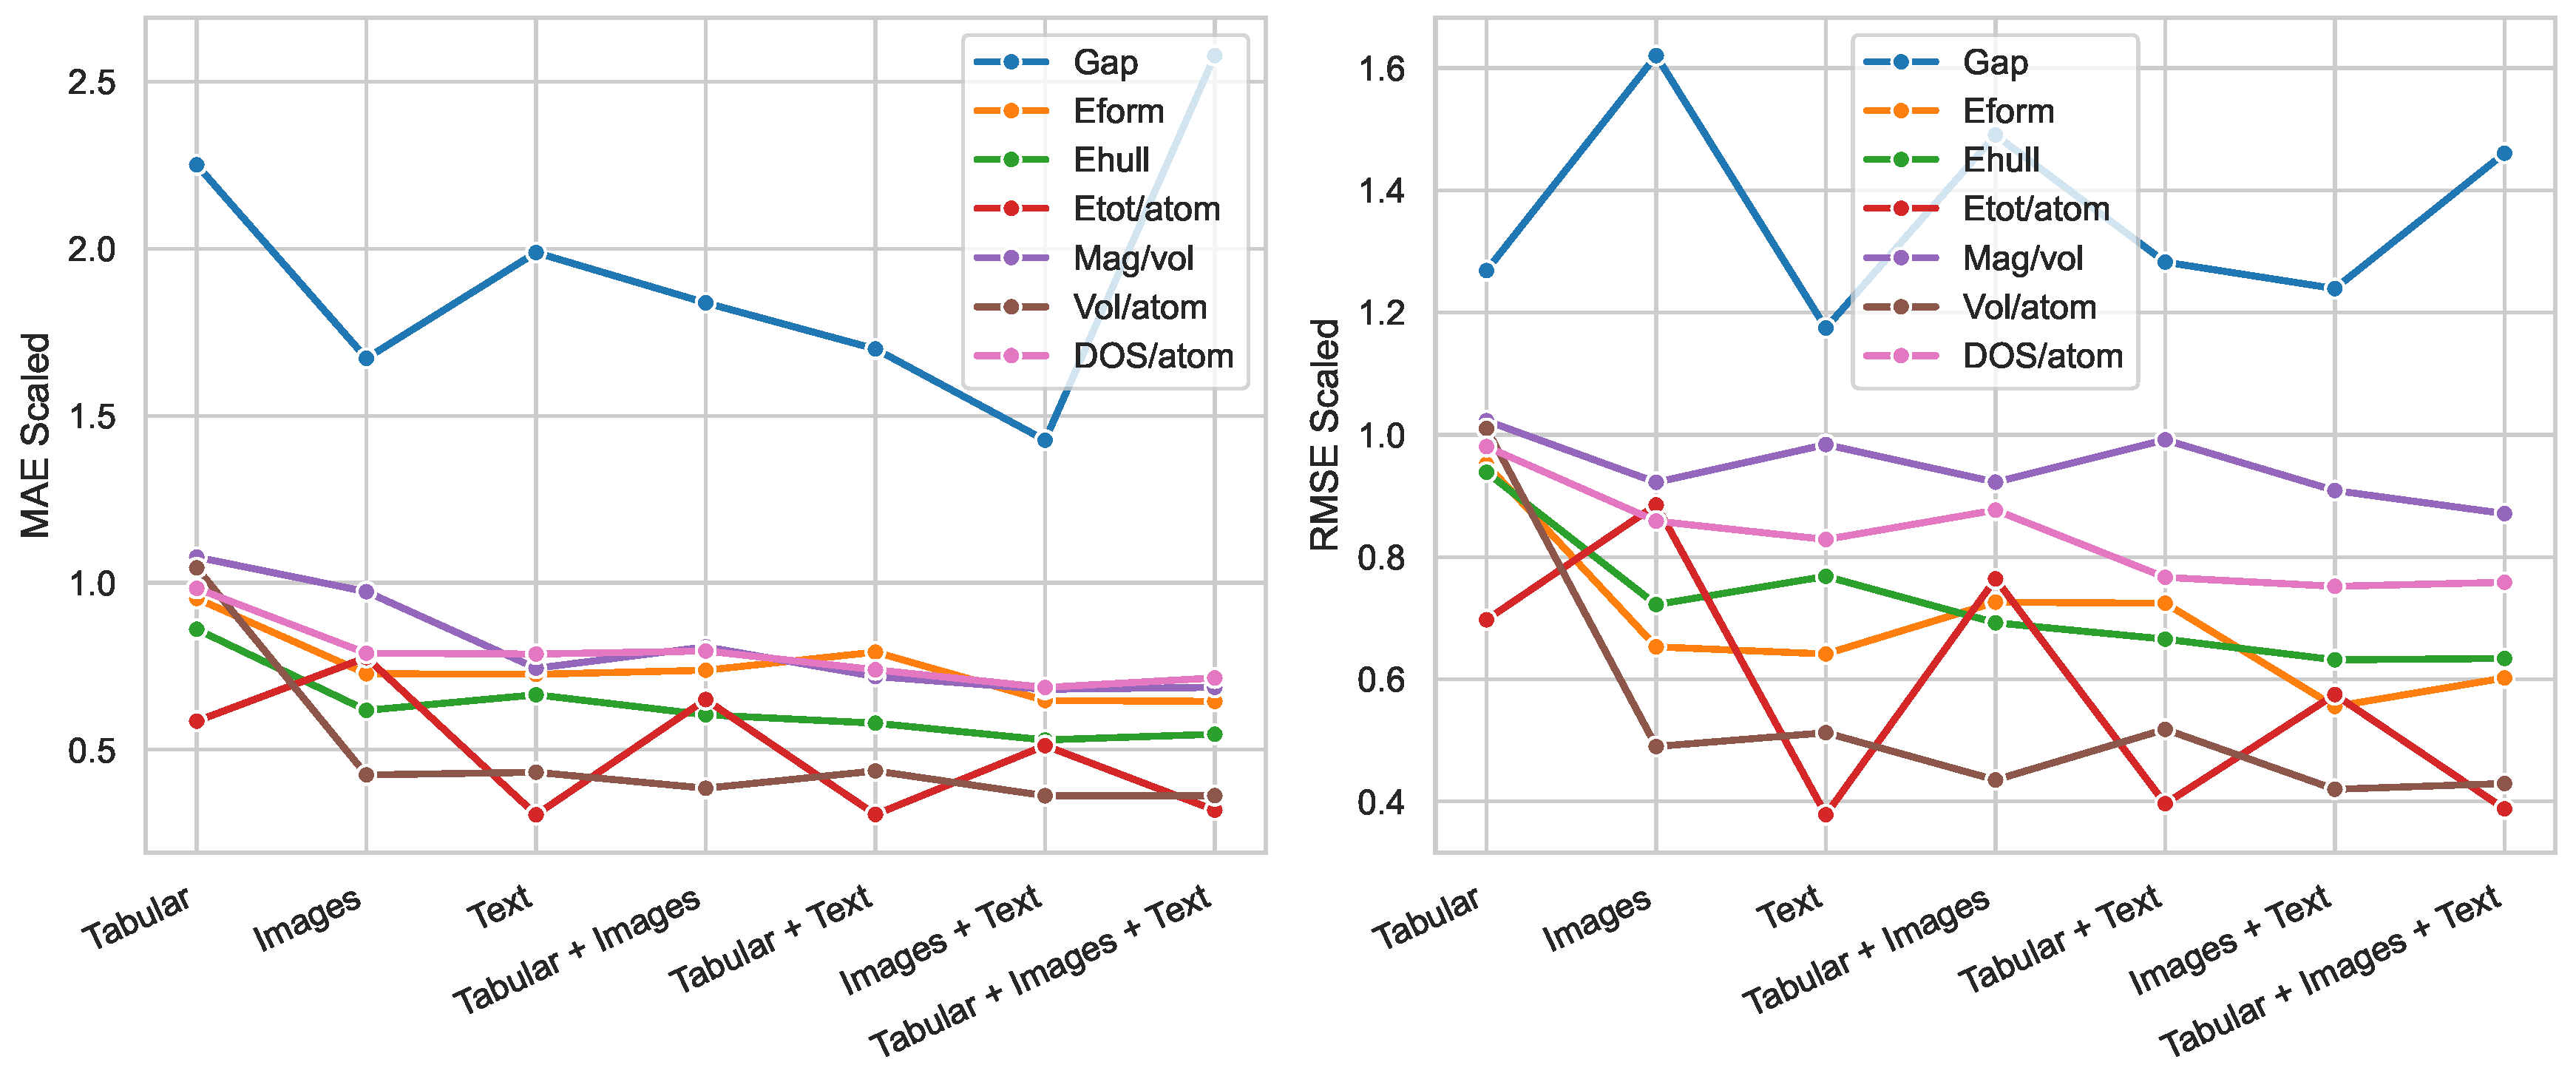
Figure 4.
Heat maps of MAE Scaled (left) and RMSE Scaled (right) results for different modality combinations across target features.
Figure 4.
Heat maps of MAE Scaled (left) and RMSE Scaled (right) results for different modality combinations across target features.
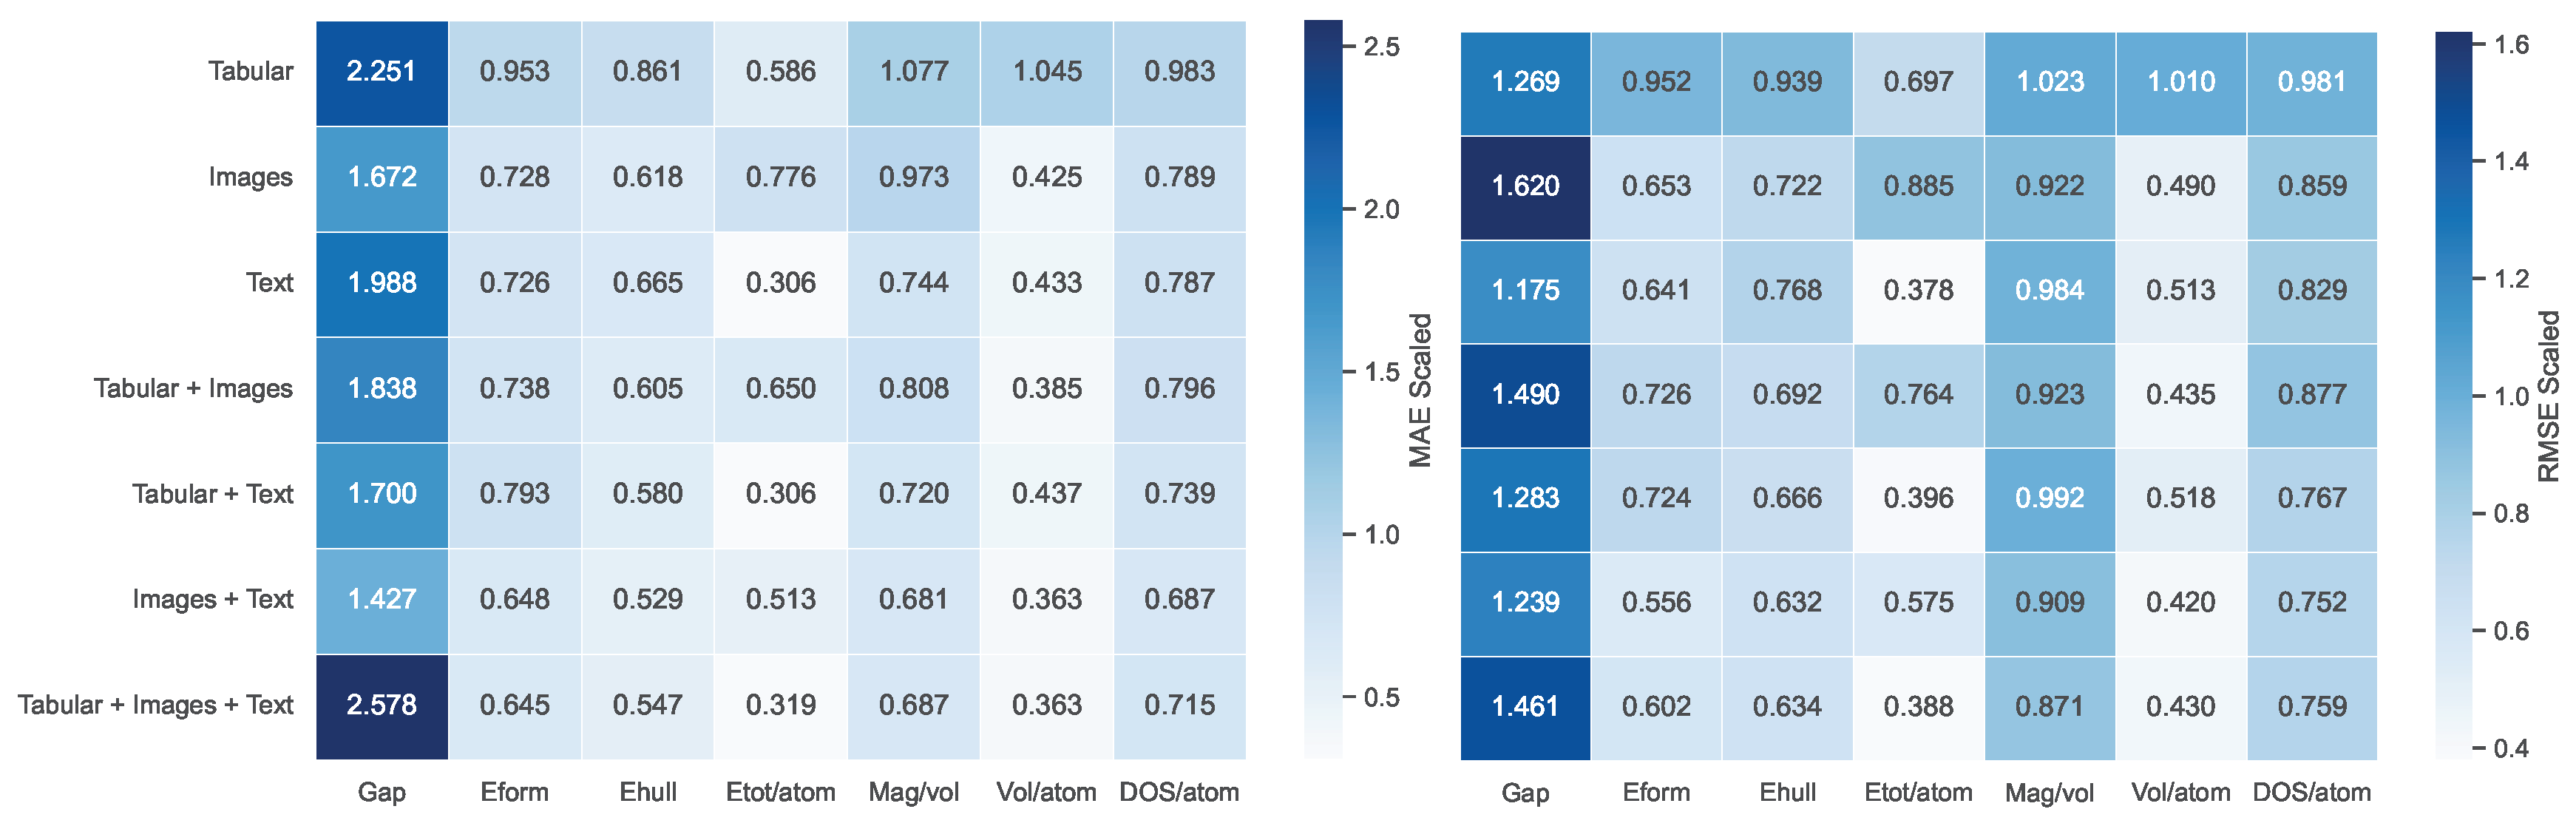

Table 1.
Example materials and their corresponding 2D visualizations generated from 3D crystal structures.
Table 1.
Example materials and their corresponding 2D visualizations generated from 3D crystal structures.
 |
 |
 |
 |
 |
|---|---|---|---|---|
 |
 |
 |
 |
 |
 |
 |
 |
 |
 |
| BeCoSi |
Table 2.
MAE results for different combinations of modalities across target features.
| Modalities | Gap | Eform | Ehull | Etot/atom | Mag/vol | Vol/atom | DOS/atom |
|---|---|---|---|---|---|---|---|
| (eV) | (eV atom−1) | (eV atom−1) | (eV atom−1) | ( Å−3) | (Å3 atom−1) | (states (eV atom)−1) | |
| Tabular | 0.147 | 0.494 | 0.461 | 10.384 | 0.009 | 6.588 | 0.299 |
| Images | 0.109 | 0.377 | 0.331 | 13.761 | 0.008 | 2.679 | 0.240 |
| Text | 0.130 | 0.376 | 0.356 | 5.416 | 0.006 | 2.728 | 0.239 |
| Tabular + Images | 0.120 | 0.383 | 0.324 | 11.528 | 0.006 | 2.427 | 0.242 |
| Tabular + Text | 0.111 | 0.411 | 0.310 | 5.430 | 0.006 | 2.754 | 0.225 |
| Images + Text | 0.093 | 0.336 | 0.283 | 9.085 | 0.005 | 2.286 | 0.208 |
| Tabular + Images + Text | 0.169 | 0.334 | 0.292 | 5.660 | 0.005 | 2.288 | 0.217 |
Table 3.
RMSE results for different combinations of modalities across target features.
| Modalities | Gap | Eform | Ehull | Etot/atom | Mag/vol | Vol/atom | DOS/atom |
|---|---|---|---|---|---|---|---|
| (eV) | (eV atom−1) | (eV atom−1) | (eV atom−1) | ( Å−3) | (Å3 atom−1) | (states (eV atom)−1) | |
| Tabular | 0.259 | 0.773 | 0.667 | 17.654 | 0.012 | 7.792 | 0.377 |
| Images | 0.330 | 0.531 | 0.513 | 22.411 | 0.011 | 3.780 | 0.330 |
| Text | 0.239 | 0.521 | 0.546 | 9.579 | 0.012 | 3.954 | 0.319 |
| Tabular + Images | 0.304 | 0.590 | 0.492 | 19.348 | 0.011 | 3.358 | 0.337 |
| Tabular + Text | 0.261 | 0.589 | 0.473 | 10.036 | 0.012 | 3.997 | 0.295 |
| Images + Text | 0.253 | 0.451 | 0.449 | 14.555 | 0.011 | 3.240 | 0.289 |
| Tabular + Images + Text | 0.298 | 0.489 | 0.450 | 9.822 | 0.011 | 3.313 | 0.292 |
Table 4.
MAE Scaled results for different combinations of modalities across target features.
| Modalities | Gap | Eform | Ehull | Etot/atom | Mag/vol | Vol/atom | DOS/atom |
|---|---|---|---|---|---|---|---|
| (eV) | (eV atom−1) | (eV atom−1) | (eV atom−1) | ( Å−3) | (Å3 atom−1) | (states (eV atom)−1) | |
| Tabular | 2.251 | 0.953 | 0.861 | 0.586 | 1.077 | 1.045 | 0.983 |
| Images | 1.672 | 0.728 | 0.618 | 0.776 | 0.973 | 0.425 | 0.789 |
| Text | 1.988 | 0.726 | 0.665 | 0.306 | 0.744 | 0.433 | 0.787 |
| Tabular + Images | 1.838 | 0.738 | 0.605 | 0.650 | 0.808 | 0.385 | 0.796 |
| Tabular + Text | 1.700 | 0.793 | 0.580 | 0.306 | 0.720 | 0.437 | 0.739 |
| Images + Text | 1.427 | 0.648 | 0.529 | 0.513 | 0.681 | 0.363 | 0.687 |
| Tabular + Images + Text | 2.578 | 0.645 | 0.547 | 0.319 | 0.687 | 0.363 | 0.715 |
Table 5.
RMSE Scaled results for different combinations of modalities across target features.
| Modalities | Gap | Eform | Ehull | Etot/atom | Mag/vol | Vol/atom | DOS/atom |
|---|---|---|---|---|---|---|---|
| (eV) | (eV atom−1) | (eV atom−1) | (eV atom−1) | ( Å−3) | (Å3 atom−1) | (states (eV atom)−1) | |
| Tabular | 1.269 | 0.952 | 0.939 | 0.697 | 1.023 | 1.010 | 0.981 |
| Images | 1.620 | 0.653 | 0.722 | 0.885 | 0.922 | 0.490 | 0.859 |
| Text | 1.175 | 0.641 | 0.768 | 0.378 | 0.984 | 0.513 | 0.829 |
| Tabular + Images | 1.490 | 0.726 | 0.692 | 0.764 | 0.923 | 0.435 | 0.877 |
| Tabular + Text | 1.283 | 0.724 | 0.666 | 0.396 | 0.992 | 0.518 | 0.767 |
| Images + Text | 1.239 | 0.556 | 0.632 | 0.575 | 0.909 | 0.420 | 0.752 |
| Tabular + Images + Text | 1.461 | 0.602 | 0.634 | 0.388 | 0.871 | 0.430 | 0.759 |
Disclaimer/Publisher’s Note: The statements, opinions and data contained in all publications are solely those of the individual author(s) and contributor(s) and not of MDPI and/or the editor(s). MDPI and/or the editor(s) disclaim responsibility for any injury to people or property resulting from any ideas, methods, instructions or products referred to in the content. |
© 2025 by the authors. Licensee MDPI, Basel, Switzerland. This article is an open access article distributed under the terms and conditions of the Creative Commons Attribution (CC BY) license (http://creativecommons.org/licenses/by/4.0/).
Copyright: This open access article is published under a Creative Commons CC BY 4.0 license, which permit the free download, distribution, and reuse, provided that the author and preprint are cited in any reuse.


