Submitted:
27 January 2025
Posted:
27 January 2025
You are already at the latest version
Abstract
Mesenchymal–epithelial transition (MET) gene amplification is a critical biomarker in non-small cell lung cancer (NSCLC), significantly influencing treatment decisions and prognostic evaluations. However, current detection methods such as fluorescence in situ hybridization (FISH) and next-generation sequencing (NGS) have limitations in speed, cost, and specificity, particularly when distinguishing between focal MET amplification and MET polysomy.
This study introduces a novel digital PCR (dPCR) assay designed not only to detect MET amplification but also to differentiate between its focal and non-focal subtypes. The assay was evaluated against established FISH and targeted NGS panels using 55 NSCLC samples with known MET amplification statuses (26 positive and 29 negative) confirmed by FISH and NGS. The dPCR assay demonstrated high sensitivity (96.0%) and specificity (96.7%), achieving 100% concordance with FISH in differentiating focal MET amplification from MET polysomy. Additionally, the assay exhibited excellent precision, accuracy, and linearity (R² = 1.00) in MET copy number quantification, surpassing NGS in diagnostic performance.
Offering a robust, cost-effective, and efficient alternative to FISH, the dPCR assay significantly reduces turnaround time (3 hours versus 2 days) and provides a quantitative and objective method for MET amplification detection and subtype differentiation. This makes it suitable for clinical laboratories with limited molecular expertise. This study highlights the potential of the dPCR assay to complement existing molecular diagnostic techniques, delivering reliable and actionable results for MET-targeted therapy selection in NSCLC patients and thereby advancing precision oncology.
Keywords:
MET
; MET amplification
; digital PCR
; FISH
; NGS
; lung cancer
; non-small cell lung cancer
; NSCLC
; focal MET amplification
; non-focal amplification
; MET polysomy
1. Introduction
Lung cancer is the leading cause of cancer-related deaths worldwide, with non-small cell lung cancer accounting for approximately 85% of all lung cancer cases. (Shrivastava, 2018) (Bodén et al., 2023) While early-stage lung cancer patients have the best prognosis, the majority of patients are diagnosed with advanced or metastatic disease, resulting in a dismal 5-year survival rate of only 4%. (Weart et al., 2018) Precision medicine has emerged as a promising approach to improve outcomes for patients with lung cancer, with targeted therapies directed at specific genetic alterations playing a crucial role. The most well-known targetable gene alterations in lung cancer include mutations or amplifications in EGFR (10-15% of cases), ALK (2-7%), and KRAS (25-30%). (Choi & Chang, 2023)(Yu & Snyder, 2016) However, an increasing number of less common but still clinically relevant genetic targets, such as MET (Mesenchymal–epithelial transition) (3-7% of cases), are being identified and incorporated into treatment guidelines.(Choi & Chang, 2023)
MET, the proto-oncogene encoding the tyrosine kinase receptor for hepatocyte growth factor, has been found to be an important oncogenic driver in lung cancers, particularly in the adenocarcinoma subtype (Kumaki et al., 2023) (Yang et al., 2024) . MET can be altered through various mechanisms, including gene amplification, mutations, and exon 14 skipping. MET amplification is estimated to occur in approximately 3-5% of non-small cell lung cancer cases, while MET mutations and exon 14 skipping are observed in 3-4% and 3-5% of cases, respectively. (Korpanty et al., 2014) This genetic alteration can lead to aberrant activation of the MET signaling pathway, promoting cell proliferation, survival, and metastasis. MET amplification can be classified into two distinct subtypes: focal MET amplification, where the MET gene is selectively amplified, and non-focal amplification, which occurs due to polysomy of chromosomal 7, which is sometimes refer to as MET polysomy. Importantly, MET amplification has been associated with sensitivity to MET-targeted therapies. (Smit et al., 2021) (Ahn et al., 2021) The focal subtype of MET amplification, where the MET gene is selectively amplified, has been identified as a potential mechanism of resistance to EGFR tyrosine kinase inhibitors. This is particularly relevant, as patients with the focal MET amplification subtype may benefit from treatment with MET-targeted therapies that can overcome the resistance conferred by this genetic alteration. (Lai et al., 2019)(Corte et al., 2014) (Steen et al., 2019) Accurately detecting and differentiating between focal and non-focal MET amplification is critical for guiding appropriate treatment selection and management for these patients, yet it presents a significant challenge. (Kumaki et al., 2023) Recognizing the clinical significance of MET amplification, leading oncology guidelines, such as the National Comprehensive Cancer Network (NCCN) and the European Society for Medical Oncology (ESMO), have recommended routine testing for MET alterations in patients with lung cancer. (DiBonaventura et al., 2017)
The current common methods for MET amplification assessment in lung cancer, such as fluorescence in situ hybridization (FISH) and targeted next-generation sequencing panel (Targeted NGS panel), have limitations. FISH analysis for MET amplification has been hampered by a lack of consensus in interpretation, as well as technical challenges that necessitate scoring by medical experts, particularly in cases with high tumor heterogeneity and limited tissue availability. (Castiglione et al., 2018)(Hieggelke & Schultheis, 2020)(Tang et al., 2020) Targeted NGS panel, while more comprehensive for covering more actionable targets, can be costly and time-consuming, and lacking well defined cutoff and cannot differentiate between focal and non-focal MET amplification.(Wu et al., 2020)(Lee et al., 2021)(Guo et al., 2020). Digital PCR (dPCR) has emerged as a promising technique with high sensitivity and specificity for the absolute quantification of nucleic acids. Previous studies have demonstrated the feasibility of using droplet digital PCR (ddPCR) to detect MET amplification in Non-small-cell lung cancer (NSCLC) patients with EGFR-TKI resistance.(Oscorbin et al., 2022)(Heydt et al., 2019)(Fan et al., 2022) However, there has not been a study applying dPCR in the detection and differentiation of focal and non-focal MET amplification in lung cancer using Formalin fixed paraffin embedded (FFPE) tissue samples. Further research is needed to validate and optimize this approach not only for the accurate detection and also differentiation of focal and non-focal MET amplification in lung cancer.
To address these challenges, we have developed a novel dPCR assay at the molecular laboratory, Department of Pathology, Pamela Youde Nethersole Eastern Hospital, Hong Kong, that can accurately detect and discriminate between focal and non-focal MET amplification in lung cancer samples. The study will provide a streamlining workflow for the dPCR assay to make the assay more accessible and efficient, providing a simple user-friendly and cost-effective workflow for easy adoption for clinical laboratories, even for laboratories with limited expertise in molecular techniques.
2. Materials and Methods
2.1. Study Design
This is a retrospective study involving 55 lung cancer patients between Jan 2023 and Oct 2024. Lung tissues were obtained from all the patients and targeted NGS panel results encompassing MET amplification status were obtained for all samples. There were in total 26 MET amplification positive samples and 29 MET amplification negative samples selected from the retrospective NGS results performed in the Molecular Laboratory, Pamela Youde Nethersole Eastern Hospital, Hong Kong. The samples selected were subsequently tested with our in-house dPCR assay and FISH to evaluate the performance of the dPCR assay in MET amplification detection and the differentiation of focal MET amplification and MET polysomy. In addition, commercial standard (Seraseq™ Lung & Brain CNV Mix) was used to evaluate the linearity and precision of the MET copy number (CN) quantification. This study was approved by the Central Institutional Review Board (CIRB) of the Hospital Authority Hong Kong (Approval No. HKECREC-2021-053).
2.2. DNA Isolation from FFPE Tissue Samples
Nucleic acid was extracted from FFPE tissue samples using the EZ2 AllPrep DNA/RNA FFPE Kit (Qiagen, Hilden, Germany) following the manufacturer's protocol. FFPE tissue sections of 10 µm thickness were cut and obtained, approximately totaling up to 2 mm3 of tissue. The sections were deparaffinized with the Paraffin Removal Solution (PRS) supplied in the EZ2 AllPrep DNA/RNA FFPE Kit at 56°C for 3 min, followed by centrifugation at 20,000 x g for 2 min. The supernatant was removed, and the tissue pellet was resuspended by adding 150 µl of Buffer PKD and 10 µL of Proteinase K, then incubated at 56°C for 15 min at 500 rpm. The supernatant was transferred to a new 1.5 mL microcentrifuge tube for RNA preparation, and the tissue pellet was kept for DNA preparation. Subsequently, 180 µL of Buffer ATL and 40 µL of Proteinase K were added to the tissue pellet, which was then overlaid with 200 µl of PRS. mixture was loaded onto the EZ2 AllPrep DNA/RNA FFPE reagent cartridge, and the subsequent extraction was performed on the EZ2 Connect instrument (Qiagen, Hilden, Germany), with a 50 μL elution volume. The quantification of DNA extracts was performed following the manufacturer's recommendations, using the Qubit® dsDNA HS Assay Kit and the Qubit® Fluorometer (Thermo Fisher Scientific).
2.3. MET Amplification Detection Using FISH
FISH analysis was performed on selected FFPE tissue sections to assess MET gene amplification. The tissue sections were first deparaffinized, then underwent hybridization with a MET/CCP7 Dual Color FISH Probe (CytoTest Inc., Rockville, MD, catalog number CT-PAC014) according to the manufacturer's instructions. The MET gene is labeled with red fluorescence, while CCP7 is labeled with green fluorescence. All FISH results were scored by qualified pathologists. For scoring, a total of 50 representative tumor cells from random areas with homogeneous MET signal distribution were selected, and the non-overlapping nuclei were examined across multiple fields on each slide. The mean copy number (CN) of each probe was recorded for all the 50 cells, along with the percentage of cells exhibiting MET signal clusters and the percentage of cells with ≥ 5 copies of the MET signal. The MET/CCP7 ratio was calculated from the scores obtained from overall scoring. Based on previous reports, MET amplification was defined as having a MET CN ≥ 5 and a MET/CCP7 ratio ≥ 2.0. In contrast, MET polysomy was characterized as having a MET CN ≥ 5 combined with a MET/CCP7 ratio < 2.0. Cases that did not meet these criteria were considered as MET amplification negative. (Tong et al., 2016)(Lai et al., 2019)(Tanaka et al., 2012) Images of FISH including the different subtypes of MET amplification status are shown in Figure 1.
2.4. MET Amplification Detection Using NGS
The extracted DNA samples were analyzed using the Thermo Fisher Scientific Oncomine Precision Assay GX (Thermo Fisher Scientific) on the Ion Torrent Genexus Integrated Sequencer (Thermo Fisher Scientific), following the manufacturer's instructions. This assay enables simultaneous detection of hotspot mutations across 50 cancer driver genes, which includes MET amplification. The library preparation was performed in the automated Ion Torrent Genexus Integrated Sequencer, utilizing 10 ng of FFPE-extracted DNA as the input. Sequencing was conducted on the Ion Torrent GX5 chip, and the sequencing data were mapped to the hg19 reference genome. Subsequently, the sequencing data were analyzed using the Ion Torrent software (Genexus software V.6.8.1.1 Thermo Fisher Scientific). MET amplification was called when the MET CN ≥ 5. All NGS results were reviewed and reported by qualified pathologists.
2.5. MET Amplification Detection Using dPCR in FFPE Samples
DNA extracted from FFPE tissue samples was tested using our in-house developed dPCR assay for detecting MET amplification. The assay determines the CN of the MET gene and a reference gene locus (REF1), specifically the CELF2 gene locating on a different chromosome (chromosome 10), as well as the ratio between the MET gene and another reference gene locus (REF2), specifically the BRAF gene locating on the same chromosome (chromosome 7). Primer and probe sequences are listed in Table 1. This approach allows for the detection of MET amplification and also for differentiation between focal MET amplification and MET polysomy.
The dPCR assay comprises two separate reaction mixes. Reaction 1 contains primers and probes targeting the MET gene and REF1. This reaction is used to determine the MET gene copy number within the tumor cell fraction in the sample. Since the tissue samples contain both tumor and normal cells, and normal cells are assumed to have a diploid status, we derived a formula to provide a more accurate calculation of the MET gene copy number in the tumor cell fraction. The wildtype copy number (CN) for both genes were determined through the multiplication of the overall CN of REF1 obtained from dPCR by the wildtype cell percentage (WT%), specifically calculated as 100% minus the pathologist-scored tumor percentage. Subsequently, the tumor fraction CN for both the MET and REF1 genes was derived by subtracting the overall CN of both genes obtained in dPCR from the calculated wildtype CN. It is postulated that each tumor cell maintains a normal diploid status for the REF1 gene, therefore the actual MET CN within an individual tumor cell was calculated by dividing the tumor fraction MET CN by the tumor fraction REF1 CN and multiplied by two. However, reaction 1 alone can only indicate the presence of MET gene amplification. It cannot differentiate between MET focal amplification and chromosome 7 polysomy.
Reaction 2 is the key for differentiating between MET focal amplification and non-focal MET amplification i.e. MET polysomy. It contains primers and probes targeting MET gene and REF2. The reaction is intended for determining the ratio between the MET gene and REF2 on the same chromosome. If the MET amplification is focal, only the MET CN would increase, while the REF2 CN would remain at 2, giving rise to a ratio ≥ 2. If the MET amplification is due to chromosome 7 polysomy, both the MET and REF2 (BRAF gene) copy numbers would increase proportionally, maintaining a ratio close to 1. Data analysis was performed to calculate the tumor fraction CN for both MET gene and REF2, subsequently the ratio between them. The overall CN from dPCR was determined for both the MET gene and REF2. The wildtype CN for both genes was calculated by multiplying the overall CN of REF2 obtained from dPCR by the WT%. Subsequently, the tumor fraction CN for both MET gene and REF2 was derived by subtracting the overall CN of both genes obtained from dPCR from the calculated wildtype CN. The tumor fraction MET/REF2 ratio was then calculated by dividing the tumor fraction MET CN by tumor fraction REF2 CN. Formula for result analysis for both reactions are summarized in Figure 2.
The analyzed results from both reactions are considered together for interpretation and summarized in Table 2. The MET amplification status is categorized into three subtypes: focal MET amplification, MET polysomy and MET amplification negative. Focal MET amplification is defined as having a tumor fraction MET CN ≥ 5 in reaction 1, and simultaneously a tumor fraction MET/BRAF ratio ≥ 2 in Reaction 2; MET polysomy is defined as having a tumor fraction MET CN ≥5 in reaction 1, but a tumor fraction MET/REF2 ratio < 2; MET amplification negative is defined as having a tumor fraction MET CN <5 in reaction 1.
2.6. Statistical Analysis
The inter-run, intra-run precision, accuracy of CN calling and linearity for MET CN quantification were calculated based on the tested results obtained using commercial standard (Seraseq™ Lung & Brain CNV Mix). Linear Regression (R2) was calculated for assessing the consistency and linearity of the data. While the performance of the dPCR assay in detecting MET amplification was evaluated by comparing the results to those obtained from the FISH and targeted NGS panel. Diagnostic performance (sensitivity, specificity, positive predictive value (PPV) and negative predictive value (NPV)) of the dPCR assay were established with respective to the orthogonal tests including FISH and targeted NGS panel on the selected clinical samples.
3. Results
3.1. Inter-Run/Intra-Run Precision, Accuracy of MET CN Calling and Linearity for MET CN Quantification Using Commercial Standard
The inter-run and intra-run precision, as well as the accuracy of MET CN calling and linearity for MET CN quantification, were evaluated at three different MET CN levels: +2 CN, +6 CN, and +12 CN. These MET CN levels were determined using commercially available DNA standards with known MET gene CNs (Seraseq™ Lung & Brain CNV Mix), as well as a normal sample verified to confirm the absence of MET amplification. All levels were tested in triplicates across three separate runs. The inter-run and intra-run precision were calculated based on the coefficient of variation (CV%) of the triplicate measurements at each CN level. The mean CNs obtained from the dPCR assay were 2.21 (Range: 2.04-2.47; SD:0.19; CV:0.09; 95%CI) at the +2 CN level, 6.87 (Range: 6.83-6.95; SD:0.06; CV:0.01; 95%CI) at the +6 CN level, and 12.47 (Range: 12.19-12.85; SD:0.27; CV:0.02; 95%CI) at the +12 CN level. The mean CNs obtained for the three levels were in perfect correlation with the expected MET CNs, demonstrating the high precision and consistency of the MET CNs reported by the dPCR assay. While for accuracy, the observed MET CN by dPCR were 110.5%, 114.5%, and 103.9% of the expected values at the +2, +6, and +12 CN levels, respectively. Excellent linearity (R2: 1.00) was also observed for the dPCR MET CN quantification. (Figure 3)
3.2. Overview of Result Obtained from the NGS, dPCR and FISH
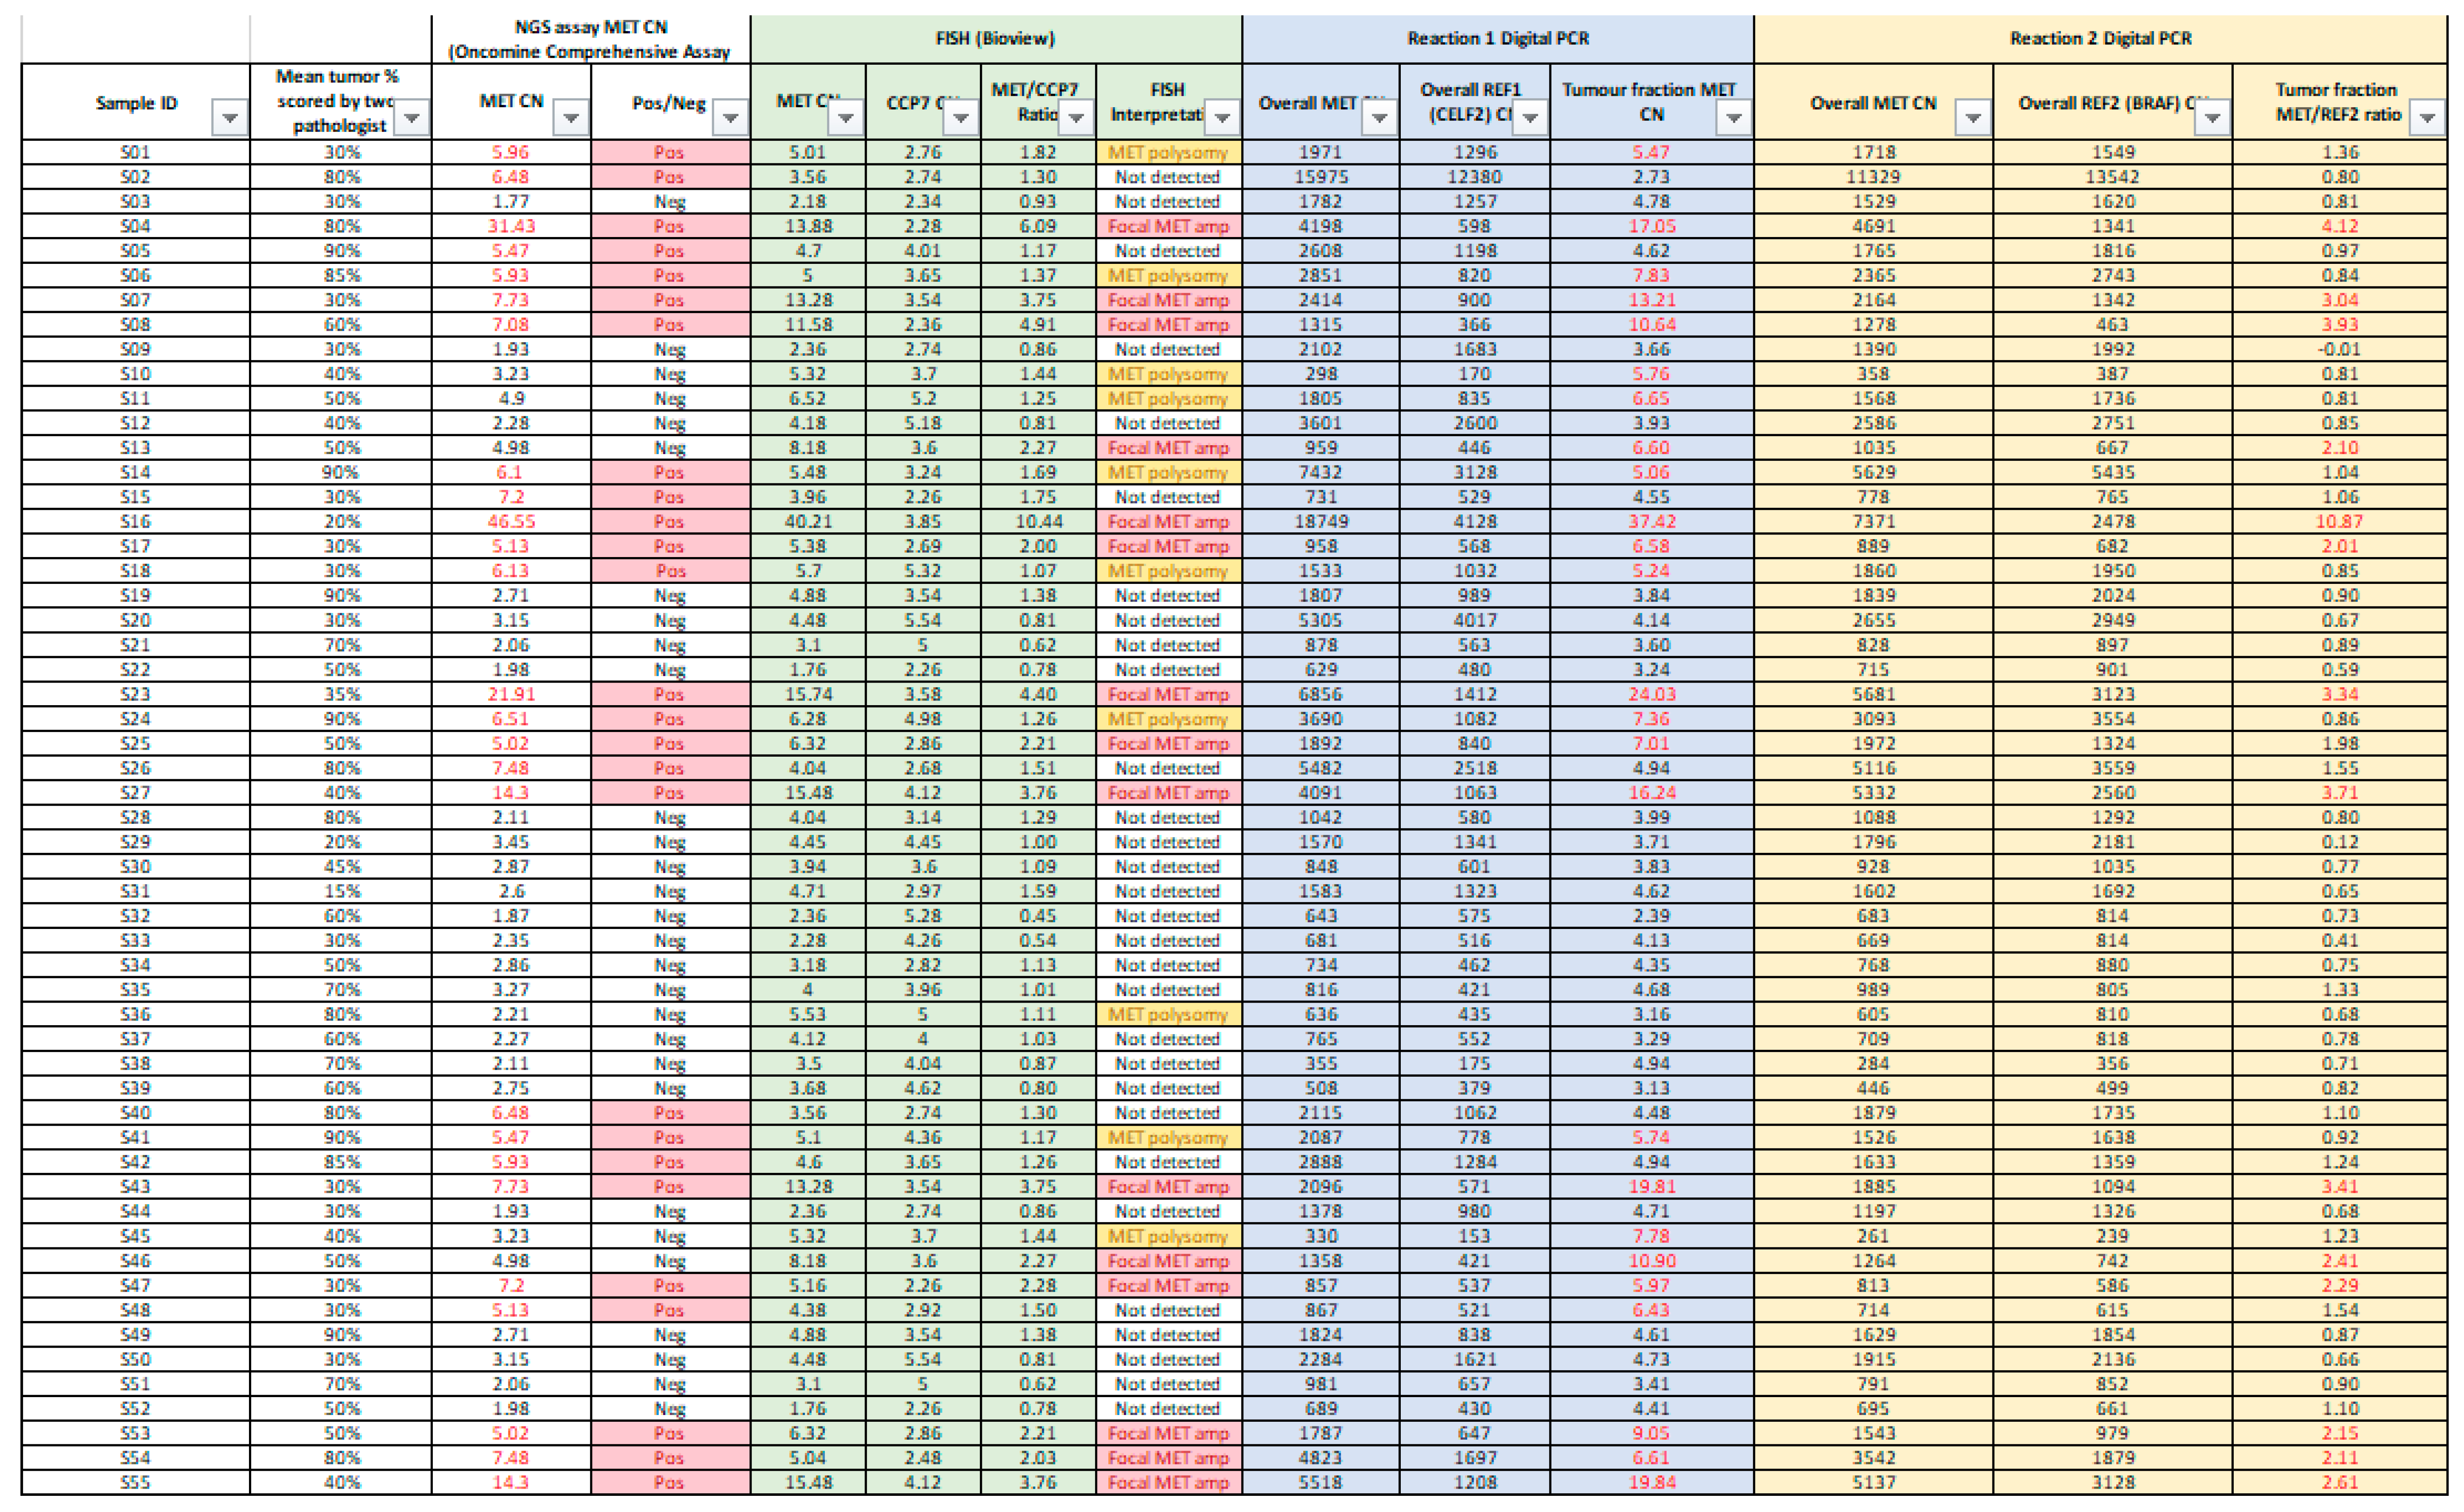
This study presents a comprehensive evaluation of the in-house dPCR for detection and classification of MET amplification against FISH and targeted NGS panel for FFPE tissues collected from 55 lung cancer patients. Overall results were summarized in Appendix A. Concordance of the positive results obtained by dPCR, FISH and NGS was shown in Figure 4.
3.3. Assessing the Correlation Between dPCR and FISH on MET Amplification Detection and Differentiation
Among the 55 samples selected, 25 samples were detected with MET amplification by FISH, 15 of which were interpreted as focal MET amplification (MET CN ≥ 5 and MET/CEP7 ratio ≥2) and 10 samples as MET polysomy (MET CN ≥ 5 and MET/CEP7 ratio <2). The remaining 30 samples were FISH negative for MET amplification. Using FISH as gold standard result for assessing the performance of the dPCR assay, 24 out of 25 FISH-positive cases were detected as MET amplification positive by dPCR. For focal MET amplification, all of the 15 FISH positive cases were successfully detected and differentiated by dPCR, while for MET polysomy, 9 out of 10 FISH positive cases were correctly detected. For FISH negative cases, 29 out of 30 cases were correctly detected. Therefore, for MET amplification detection with reference to FISH results, the sensitivity, specificity, positive predictive value (PPV) and negative predictive value (NPV) were 96.0%, 96.7%, 96.0% and 96.7% respectively. For differentiation between focal MET amplification and MET polysomy, there was a 100% concordant rate between dPCR and FISH interpretation for all the dPCR positive cases. Also, for CN quantification and MET/REF2 ratio calculation, dPCR and FISH showed a good linear association (R=0.91 for CN quantification; R=0.93 for MET/REF2 ratio calculation) (Figure 5).
3.4. Compare the Performance Between dPCR and NGS on MET Amplification Detection
In our current clinical practice, NGS is used for comprehensive gene panel testing of lung cancer patients. MET amplification is detected based on MET copy number variation (CNV), with a cutoff for NGS-positive MET amplification at MET CN greater than or equal to 5. However, NGS serves primarily as a screening tool, and any detected MET amplification requires subsequent confirmation by FISH. An assessment of NGS performance in detecting MET amplification, compared to FISH as the gold standard, revealed that out of 25 FISH-positive cases, NGS detected 19 as MET amplification positive, including 13 cases of focal MET amplification and 6 cases of MET polysomy. For the remaining 6 FISH-positive cases, NGS failed to detect the MET amplification. Among the 30 FISH-negative cases, 23 were also detected as MET amplification-negative by NGS, while 7 were detected as MET amplification positive. The sensitivity, specificity, positive predictive value, and negative predictive value of NGS were 76.0%, 76.7%, 73.1%, and 79.3%, with a linear regression R2 value was 0.81, indicating a fair level of consistency. (Figure 6) In comparison, the dPCR assay developed in this study demonstrated significantly better performance in terms of sensitivity, specificity, PPV, and NPV. Performance indicators of dPCR and NGS with reference to FISH including sensitivity, specificity, positive predictive value, and negative predictive value are listed in Table 3 for comparison.
Direct comparison of results of dPCR and NGS for MET amplification calling was performed. Comparison of the dPCR and NGS results on the 55 selected cases showed that 20 out of 26 NGS-positive cases were detected as MET-amplified by the dPCR assay, including 12 cases of focal MET amplification and 8 cases of MET polysomy. The remaining 6 NGS-positive cases were not detected as MET-amplified by the dPCR assay. Among the NGS-negative cases, 24 out of 29 were also tested as MET amplification-negative by the dPCR assay. The remaining 5 cases were detected as MET amplification-positive by dPCR. The positive percentage agreement, negative percentage agreement, and overall percentage agreement between dPCR and NGS were 79.9%, 82.8%, and 80%, respectively. Overall, dPCR and NGS showed a linear association. (R2: 0.78). (Figure 7)
4. Discussion
MET amplification has been associated with sensitivity to MET-targeted therapies. Growing evidence suggests that MET amplification is related to EGFR-TKI resistance and may contribute to acquired resistance in EGFR-mutated NSCLC patients treated with EGFR-TKIs. Accurately detecting and differentiating between focal and non-focal MET amplification is crucial for guiding appropriate treatment selection and management for these patients. In this study, we have developed and validated a novel digital PCR (dPCR) assay that enables the detection of MET amplification and the ability to differentiate between focal MET amplification and MET polysomy. Importantly, this study provides a comprehensive dataset consisting of results from NGS, dPCR, and FISH analyses, allowing for a thorough and objective performance comparison of these methodologies in detecting MET amplification.
The dPCR assay demonstrated high sensitivity and specificity of 96.0% and 96.7% respectively. It can also provide accurate MET CNs quantification comparable to the MET CN obtained from FISH, with a regression (R2) of 1.0. The dPCR also achieved a 100% concordance rate with FISH for the differentiation of focal MET amplification and MET polysomy. The results demonstrate that the dPCR assay can offer performance comparable to the gold standard FISH, yet it possesses several advantages over FISH. Though FISH is the current gold standard for MET amplification detection, it is a labor-intensive process that requires specialized medical expertise, as the FISH scoring must be performed by qualified pathologists. Additionally, the FISH results interpretation can be subjective due to variations in scoring area selection, tumor heterogeneity, tissue section quality, and nucleic acid preservation. In contrast, the dPCR assay is faster, easier, simpler, less expensive, and more objective in quantifying gene CN comparing to FISH. The turn-around time (TAT) for the dPCR assay is around 3 hours versus at least 2 days for FISH.
In addition to FISH, NGS is another emerging method for lung cancer molecular diagnostics. NGS enables comprehensive gene panel testing, allowing it to assess a broad range of genetic targets for diagnostic and therapeutic purposes. While targeted NGS panels excel at detecting hotspot mutations at low variant allele frequencies (VAF), achieving accurate CNV calling, such as for MET amplification, can be challenging.(Singh et al., 2021)(Kumar et al., 2022) Factors like varied amplicon region coverage, amplification biases and artifacts, poor DNA quality from FFPE samples, and limitations of computational alignment tools can undermine the reliability of gene-level CNV assessments by NGS. As a result, detecting MET amplification through amplicon-based NGS approaches may not be as reliable as the more robust FISH and dPCR method. The findings of this study echo the above statements, the NGS-based assay showed a relatively lower sensitivity and specificity of 76.0% and 76.7% respectively in detecting MET amplification compared to the gold standard FISH method. The performance indicators, such as sensitivity, specificity, PPV and NPV, as well as the direct comparison between the dPCR and NGS results, demonstrated the superior performance of the dPCR assay over NGS in detecting MET amplification. Additionally, the dPCR assay can provide accurate differentiation between focal and non-focal amplification subtype, further enhancing its clinical utility, while NGS cannot. The dPCR assay developed in this study is also easy to adopt in the clinical laboratory, and it has the potential to serve as a reliable, accurate, and cost-effective alternative to FISH and a supplementary tool to NGS gene panel results for MET amplification detection and discrimination in lung cancer patients.
While the dPCR assay demonstrated good performance, there were two discordant cases between the dPCR assay and the FISH results. In one case, the dPCR assay found the sample to be positive, while FISH found it to be negative. In the other case, the dPCR assay found the sample to be negative, but FISH found it to be positive. For the dPCR-positive and FISH-negative case, the dPCR assay reported a tumor fraction MET CN of 6.43, while the MET CN obtained from FISH was 4.38, which is marginally below the cutoff of 5. For the dPCR-negative and FISH-positive case, the dPCR assay reported a tumor fraction MET CN of 3.16, while the MET CN obtained from FISH was 5.53 with a MET/CCP7 ratio at 1.11 (less than 2), which is marginally above the cutoff of 5 and hence interpreted as marginally MET polysomy. This discrepancy could be due to several reasons. The tumor cellularity across different tissue sections may vary, so the FISH result may not be fully representative of the entire tumor sample. In contrast, the dPCR assay is tested on DNA extracted from multiple tissue sections. Additionally, tumor heterogeneity is commonly observed among the tumor cells in a single tissue section, leading to varied MET CN counts from different tumor cells. The MET CN obtained from FISH is the average of 50 selected tumor cells, while dPCR quantifies the overall MET CN in the DNA samples representing the entire tumor sample. When considering the NGS result for the same cases, the MET CN detected for the dPCR-positive and FISH-negative case was 5.13, while for the dPCR-negative and FISH-positive case was 2.21, which was having aligned interpretation as the result of dPCR and reported as marginally positive and negative respectively. Therefore, the MET CN of this case is likely near the cutoff, and the discrepancy among the three testing methods is likely due to the differences in tumor cell abundance and genetic material heterogeneity. Despite these rare discordant cases, the overall performance of the dPCR assay was highly concordant with FISH, demonstrating its robust and reliable capability in detecting and differentiating MET amplification subtypes. The dPCR approach provides a more quantitative and objective assessment of MET copy numbers, which can complement the FISH results and help resolve challenging cases. These discordant cases also highlight the challenges in accurately detecting gene amplification, especially near the cutoff CN level, and the importance of utilizing complementary techniques like dPCR, FISH, and NGS to reach a reliable diagnosis. Therefore, FISH, while considered the gold standard, is not a perfect technique, and its results can be influenced by subjective interpretation, sample quality, and technical variations. The scoring of FISH signals by pathologists can be challenging, especially in samples with low-level amplification or tumor heterogeneity. This subjectivity in FISH interpretation may contribute to occasional discrepancies between FISH and other more quantitative techniques like dPCR. Besides, the dPCR assay developed in this study relies on the quantification of MET gene copies relative to a reference gene. While the assay demonstrated excellent linearity and precision, there may be rare instances where the reference gene copy number is also altered, leading to a skewed MET copy number assessment by dPCR.
There are several limitations to this study. The sample size is relatively small due to limited samples collected within the study period, impacting the ability to establish an accurate cutoff value for MET amplification calling. The current cutoff is based on general FISH standards. With a larger sample size, a more comprehensive comparison between dPCR, FISH, and NGS could be conducted, refining the cutoff value using Receiver Operating Characteristic (ROC) analysis. Based on our current data, adjusting the cutoff to a CN value between 4.5 to 5 may enhance concordance between dPCR and orthogonal tests. Additionally, the study did not assess the clinical utility of the dPCR assay in relation to treatment outcomes. Furthermore, exploring the assay's performance on alternative dPCR platforms could enhance its adaptability for varied clinical laboratory settings.
5. Conclusions
In conclusion, this study demonstrates the robustness and reliable performance of our in-house developed dPCR assay. The assay accurately detects and differentiates MET amplification subtypes, quantifies MET CN with high precision, and shows good concordance with the current gold standard FISH technique. It is seen to be a valuable complement to FISH and NGS testing for MET amplification assessment in clinical practice, offering advantages such as cost-effectiveness, faster turnaround time, and reduced sample requirements for a comprehensive molecular diagnostic for lung cancer patients in clinical use.
Appendix A
References
- Ahn, B., Lee, J. H., Kim, M. H., Pyo, K., Lee, C., Lim, S. M., Kim, G., Cho, B. C., & Hong, M. H. (2021). Distinct Characteristics and Clinical Outcomes to Predict the Emergence of MET Amplification in Patients with Non-Small Cell Lung Cancer Who Developed Resistance after Treatment with Epidermal Growth Factor Receptor Tyrosine Kinase Inhibitors. In B. Ahn, J. H. Lee, M. H. Kim, K. Pyo, C. Lee, S. M. Lim, G. Kim, B. C. Cho, & M. H. Hong, Cancers (Vol. 13, Issue 12, p. 3096). Multidisciplinary Digital Publishing Institute. [CrossRef]
- Bodén, E., Sveréus, F., Olm, F., & Lindstedt, S. (2023). A Systematic Review of Mesenchymal Epithelial Transition Factor (MET) and Its Impact in the Development and Treatment of Non-Small-Cell Lung Cancer [Review of A Systematic Review of Mesenchymal Epithelial Transition Factor (MET) and Its Impact in the Development and Treatment of Non-Small-Cell Lung Cancer]. Cancers, 15(15), 3827. Multidisciplinary Digital Publishing Institute. [CrossRef]
- Castiglione, R., Alidousty, C., Holz, B., Wagener, S., Baar, T., Heydt, C., Binot, E., Zupp, S., Kron, A., Wolf, J., Merkelbach-Bruse, S., Reinhardt, H. C., Büttner, R., & Schultheis, A. M. (2018). Comparison of the genomic background of MET-altered carcinomas of the lung: biological differences and analogies. In R. Castiglione, C. Alidousty, B. Holz, S. Wagener, T. Baar, C. Heydt, E. Binot, S. Zupp, A. Kron, J. Wolf, S. Merkelbach-Bruse, H. C. Reinhardt, R. Büttner, & A. M. Schultheis, Modern Pathology (Vol. 32, Issue 5, p. 627). Elsevier BV. [CrossRef]
- Choi, H. Y., & Chang, J. (2023). Targeted Therapy for Cancers: From Ongoing Clinical Trials to FDA-Approved Drugs [Review of Targeted Therapy for Cancers: From Ongoing Clinical Trials to FDA-Approved Drugs]. International Journal of Molecular Sciences, 24(17), 13618. Multidisciplinary Digital Publishing Institute. [CrossRef]
- Corte, C. D., Fasano, M., Papaccio, F., Ciardiello, F., & Morgillo, F. (2014). Role of HGF–MET Signaling in Primary and Acquired Resistance to Targeted Therapies in Cancer [Review of Role of HGF–MET Signaling in Primary and Acquired Resistance to Targeted Therapies in Cancer]. Biomedicines, 2(4), 345. Multidisciplinary Digital Publishing Institute. [CrossRef]
- DiBonaventura, M., Wong, W. B., Shah-Manek, B., & Schulz, M. (2017). Real-world usage and clinical outcomes of alectinib among post-crizotinib progression anaplastic lymphoma kinase positive non-small-cell lung cancer patients in the USA. In M. DiBonaventura, W. B. Wong, B. Shah-Manek, & M. Schulz, OncoTargets and Therapy (p. 75). Dove Medical Press. [CrossRef]
- Fan, Y., Sun, R., Wang, Z., Zhang, Y., Xiao, X., Liu, Y., Xin, B., Xiong, H., Lu, D., & Ma, J. (2022). Detection of MET amplification by droplet digital PCR in peripheral blood samples of non-small cell lung cancer. In Y. Fan, R. Sun, Z. Wang, Y. Zhang, X. Xiao, Y. Liu, B. Xin, H. Xiong, D. Lu, & J. Ma, Journal of Cancer Research and Clinical Oncology (Vol. 149, Issue 5, p. 1667). Springer Science+Business Media. [CrossRef]
- Guo, R., Luo, J., Chang, J. C., Rekhtman, N., Arcila, M. E., & Drilon, A. (2020). MET-dependent solid tumours — molecular diagnosis and targeted therapy. In R. Guo, J. Luo, J. C. Chang, N. Rekhtman, M. E. Arcila, & A. Drilon, Nature Reviews Clinical Oncology (Vol. 17, Issue 9, p. 569). Nature Portfolio. [CrossRef]
- Heydt, C., Becher, A.-K., Wagener-Ryczek, S., Ball, M., Schultheis, A. M., Schallenberg, S., Rüsseler, V., Büttner, R., & Merkelbach-Bruse, S. (2019). Comparison of in situ and extraction-based methods for the detection of MET amplifications in solid tumors. In C. Heydt, A.-K. Becher, S. Wagener-Ryczek, M. Ball, A. M. Schultheis, S. Schallenberg, V. Rüsseler, R. Büttner, & S. Merkelbach-Bruse, Computational and Structural Biotechnology Journal (Vol. 17, p. 1339). Elsevier BV. [CrossRef]
- Hieggelke, L., & Schultheis, A. M. (2020). Anwendungen der FISH in der Diagnostik von Lungenkarzinomen. In L. Hieggelke & A. M. Schultheis, Der Pathologe (Vol. 41, Issue 6, p. 582). Springer Science+Business Media. [CrossRef]
- Korpanty, G., Graham, D. M., Vincent, M., & Leighl, N. B. (2014). Biomarkers That Currently Affect Clinical Practice in Lung Cancer: EGFR, ALK, MET, ROS-1, and KRAS [Review of Biomarkers That Currently Affect Clinical Practice in Lung Cancer: EGFR, ALK, MET, ROS-1, and KRAS]. Frontiers in Oncology, 4. Frontiers Media. [CrossRef]
- Kumaki, Y., Oda, G., & Ikeda, S. (2023). Targeting MET Amplification: Opportunities and Obstacles in Therapeutic Approaches. In Y. Kumaki, G. Oda, & S. Ikeda, Cancers (Vol. 15, Issue 18, p. 4552). Multidisciplinary Digital Publishing Institute. [CrossRef]
- Kumar, A., Loeys, B., Beek, G. van de, Peeters, N., Wuyts, W., Laer, L. V., Vandeweyer, G., & Alaerts, M. (2022). varAmpliCNV: analyzing variance of amplicons to detect CNVs in targeted NGS data. In A. Kumar, B. Loeys, G. van de Beek, N. Peeters, W. Wuyts, L. V. Laer, G. Vandeweyer, & M. Alaerts, Bioinformatics (Vol. 39, Issue 1). Oxford University Press. [CrossRef]
- Lai, G., Lim, T. H., Lim, J., Liew, P. J. R., Kwang, X. L., Nahar, R., Aung, Z. W., Takano, A., Lee, Y. Y., Lau, D. P., Tan, G. S., Tan, S. H., Tan, W. L., Ang, M., Toh, C., Tan, B. S., Anantham, D., Too, C. W., Gogna, A., … Tan, D. S.-W. (2019). Clonal MET Amplification as a Determinant of Tyrosine Kinase Inhibitor Resistance in Epidermal Growth Factor Receptor–Mutant Non–Small-Cell Lung Cancer. In G. Lai, T. H. Lim, J. Lim, P. J. R. Liew, X. L. Kwang, R. Nahar, Z. W. Aung, A. Takano, Y. Y. Lee, D. P. Lau, G. S. Tan, S. H. Tan, W. L. Tan, M. Ang, C. Toh, B. S. Tan, D. Anantham, C. W. Too, A. Gogna, … D. S.-W. Tan, Journal of Clinical Oncology (Vol. 37, Issue 11, p. 876). Lippincott Williams & Wilkins. [CrossRef]
- Lee, M., Jain, P., Wang, F., Patrick, C., Borczuk, A., & Halmos, B. (2021). MET alterations and their impact on the future of non-small cell lung cancer (NSCLC) targeted therapies. In M. Lee, P. Jain, F. Wang, C. Patrick, A. Borczuk, & B. Halmos, Expert Opinion on Therapeutic Targets (Vol. 25, Issue 4, p. 249). Taylor & Francis. [CrossRef]
- Oscorbin, I. P., Smertina, M. A., Pronyaeva, K. A., Voskoboev, M. E., Boyarskikh, U. A., Kechin, A., Демидoва, И., & Филипенкo, М. Л. (2022). Multiplex Droplet Digital PCR Assay for Detection of MET and HER2 Genes Amplification in Non-Small Cell Lung Cancer. In I. P. Oscorbin, M. A. Smertina, K. A. Pronyaeva, M. E. Voskoboev, U. A. Boyarskikh, A. Kechin, И. Демидoва, & М. Л. Филипенкo, Cancers (Vol. 14, Issue 6, p. 1458). Multidisciplinary Digital Publishing Institute. [CrossRef]
- Shrivastava, J. P. (2018). Lung cancer: the global killer. In J. P. Shrivastava, Journal of Lung Pulmonary & Respiratory Research (Vol. 5, Issue 2). MedCrave Group. [CrossRef]
- Singh, A., Olsen, M. F., Lavik, L. A. S., Vold, T., Drabløs, F., & Sjursen, W. (2021). Detecting copy number variation in next generation sequencing data from diagnostic gene panels. In A. Singh, M. F. Olsen, L. A. S. Lavik, T. Vold, F. Drabløs, & W. Sjursen, BMC Medical Genomics (Vol. 14, Issue 1). BioMed Central. [CrossRef]
- Smit, E. F., Dooms, C., Raskin, J., Nadal, E., Tho, L. M., Le, X., Mazières, J., How, S. H., Morise, M., Zhu, V. W., Tan, D. S. W., Holmberg, K., Ellers-Lenz, B., Adrian, S., Brutlach, S., Schumacher, K., Karachaliou, N., & Wu, Y. (2021). INSIGHT 2: a Phase II Study of Tepotinib Plus Osimertinib in MET -Amplified NSCLC and First-Line Osimertinib Resistance. In E. F. Smit, C. Dooms, J. Raskin, E. Nadal, L. M. Tho, X. Le, J. Mazières, S. H. How, M. Morise, V. W. Zhu, D. S. W. Tan, K. Holmberg, B. Ellers-Lenz, S. Adrian, S. Brutlach, K. Schumacher, N. Karachaliou, & Y. Wu, Future Oncology (Vol. 18, Issue 9, p. 1039). Future Medicine. [CrossRef]
- Steen, N. V. D., Zwaenepoel, K., Mazzaschi, G., Luirink, R. A., Geerke, D. P., Beeck, K. O. de, Hermans, C., Tiseo, M., Schil, P. V., Lardon, F., Germonpré, P., Rolfo, C., Giovannetti, E., Peters, G. J., & Pauwels, P. (2019). The Role of c-MET as a Biomarker and Player in Innate and Acquired Resistance in Non-Small-Cell Lung Cancer: Two New Mutations Warrant Further Studies. In N. V. D. Steen, K. Zwaenepoel, G. Mazzaschi, R. A. Luirink, D. P. Geerke, K. O. de Beeck, C. Hermans, M. Tiseo, P. V. Schil, F. Lardon, P. Germonpré, C. Rolfo, E. Giovannetti, G. J. Peters, & P. Pauwels, Molecules (Vol. 24, Issue 24, p. 4443). Multidisciplinary Digital Publishing Institute. [CrossRef]
- Tanaka, A., Sueoka-Aragane, N., Nakamura, T., Takeda, Y., Mitsuoka, M., Yamasaki, F., Hayashi, S., Sueoka, E., & Kimura, S. (2012). Co-existence of positive MET FISH status with EGFR mutations signifies poor prognosis in lung adenocarcinoma patients. In A. Tanaka, N. Sueoka-Aragane, T. Nakamura, Y. Takeda, M. Mitsuoka, F. Yamasaki, S. Hayashi, E. Sueoka, & S. Kimura, Lung Cancer (Vol. 75, Issue 1, p. 89). Elsevier BV. [CrossRef]
- Tang, C., Zhu, L., Zhang, L., Tan, C., Peng, Z., Liu, B., Liu, W., Hu, H., Bai, Y., Wang, B., Li, L., Liang, J., Li, X., Guo, Y., & Liu, Y. (2020). Establishment and validation of a novel droplet digital PCR assay for ultrasensitive detection and dynamic monitoring of EGFR mutations in peripheral blood samples of non-small-cell lung cancer patients. In C. Tang, L. Zhu, L. Zhang, C. Tan, Z. Peng, B. Liu, W. Liu, H. Hu, Y. Bai, B. Wang, L. Li, J. Liang, X. Li, Y. Guo, & Y. Liu, Clinica Chimica Acta (Vol. 510, p. 88). Elsevier BV. [CrossRef]
- Tong, J. H., Yeung, S. F., Chan, A. W. H., Chung, L. Y., Chau, S. L., Lung, R. W. M., Tong, C. Y., Chow, C., Tin, E. K. Y., Yu, Y. H., Li, H., Pan, Y., Chak, W. P., Ng, C. S. H., Mok, T., & To, K. (2016). MET Amplification and Exon 14 Splice Site Mutation Define Unique Molecular Subgroups of Non–Small Cell Lung Carcinoma with Poor Prognosis. In J. H. Tong, S. F. Yeung, A. W. H. Chan, L. Y. Chung, S. L. Chau, R. W. M. Lung, C. Y. Tong, C. Chow, E. K. Y. Tin, Y. H. Yu, H. Li, Y. Pan, W. P. Chak, C. S. H. Ng, T. Mok, & K. To, Clinical Cancer Research (Vol. 22, Issue 12, p. 3048). American Association for Cancer Research. [CrossRef]
- Weart, T. C., Miller, K. D., & Simone, C. B. (2018). Spotlight on dabrafenib/trametinib in the treatment of non-small-cell lung cancer: place in therapy [Review of Spotlight on dabrafenib/trametinib in the treatment of non-small-cell lung cancer: place in therapy]. Cancer Management and Research, 647. Dove Medical Press. [CrossRef]
- Wu, S., Li, G., Zhao, X., He, J., Lizaso, A., Ye, J., Shi, C., & Chen, L. (2020). High-level gain of mesenchymal-epithelial transition factor (MET) copy number using next-generation sequencing as a predictive biomarker for MET inhibitor efficacy. In S. Wu, G. Li, X. Zhao, J. He, A. Lizaso, J. Ye, C. Shi, & L. Chen, Annals of Translational Medicine (Vol. 8, Issue 11, p. 685). AME Publishing Company. [CrossRef]
- Yang, M., Mandal, E., Liu, F. X., O’Hara, R. M., Lesher, B., & Sanborn, R. E. (2024). Non-small cell lung cancer with MET amplification: review of epidemiology, associated disease characteristics, testing procedures, burden, and treatments. In M. Yang, E. Mandal, F. X. Liu, R. M. O’Hara, B. Lesher, & R. E. Sanborn, Frontiers in Oncology (Vol. 13). Frontiers Media. [CrossRef]
- Yu, K., & Snyder, M. (2016). Omics Profiling in Precision Oncology [Review of Omics Profiling in Precision Oncology]. Molecular & Cellular Proteomics, 15(8), 2525. Elsevier BV. [CrossRef]
Figure 1.
Images of FISH including the different subtypes of MET amplification status.
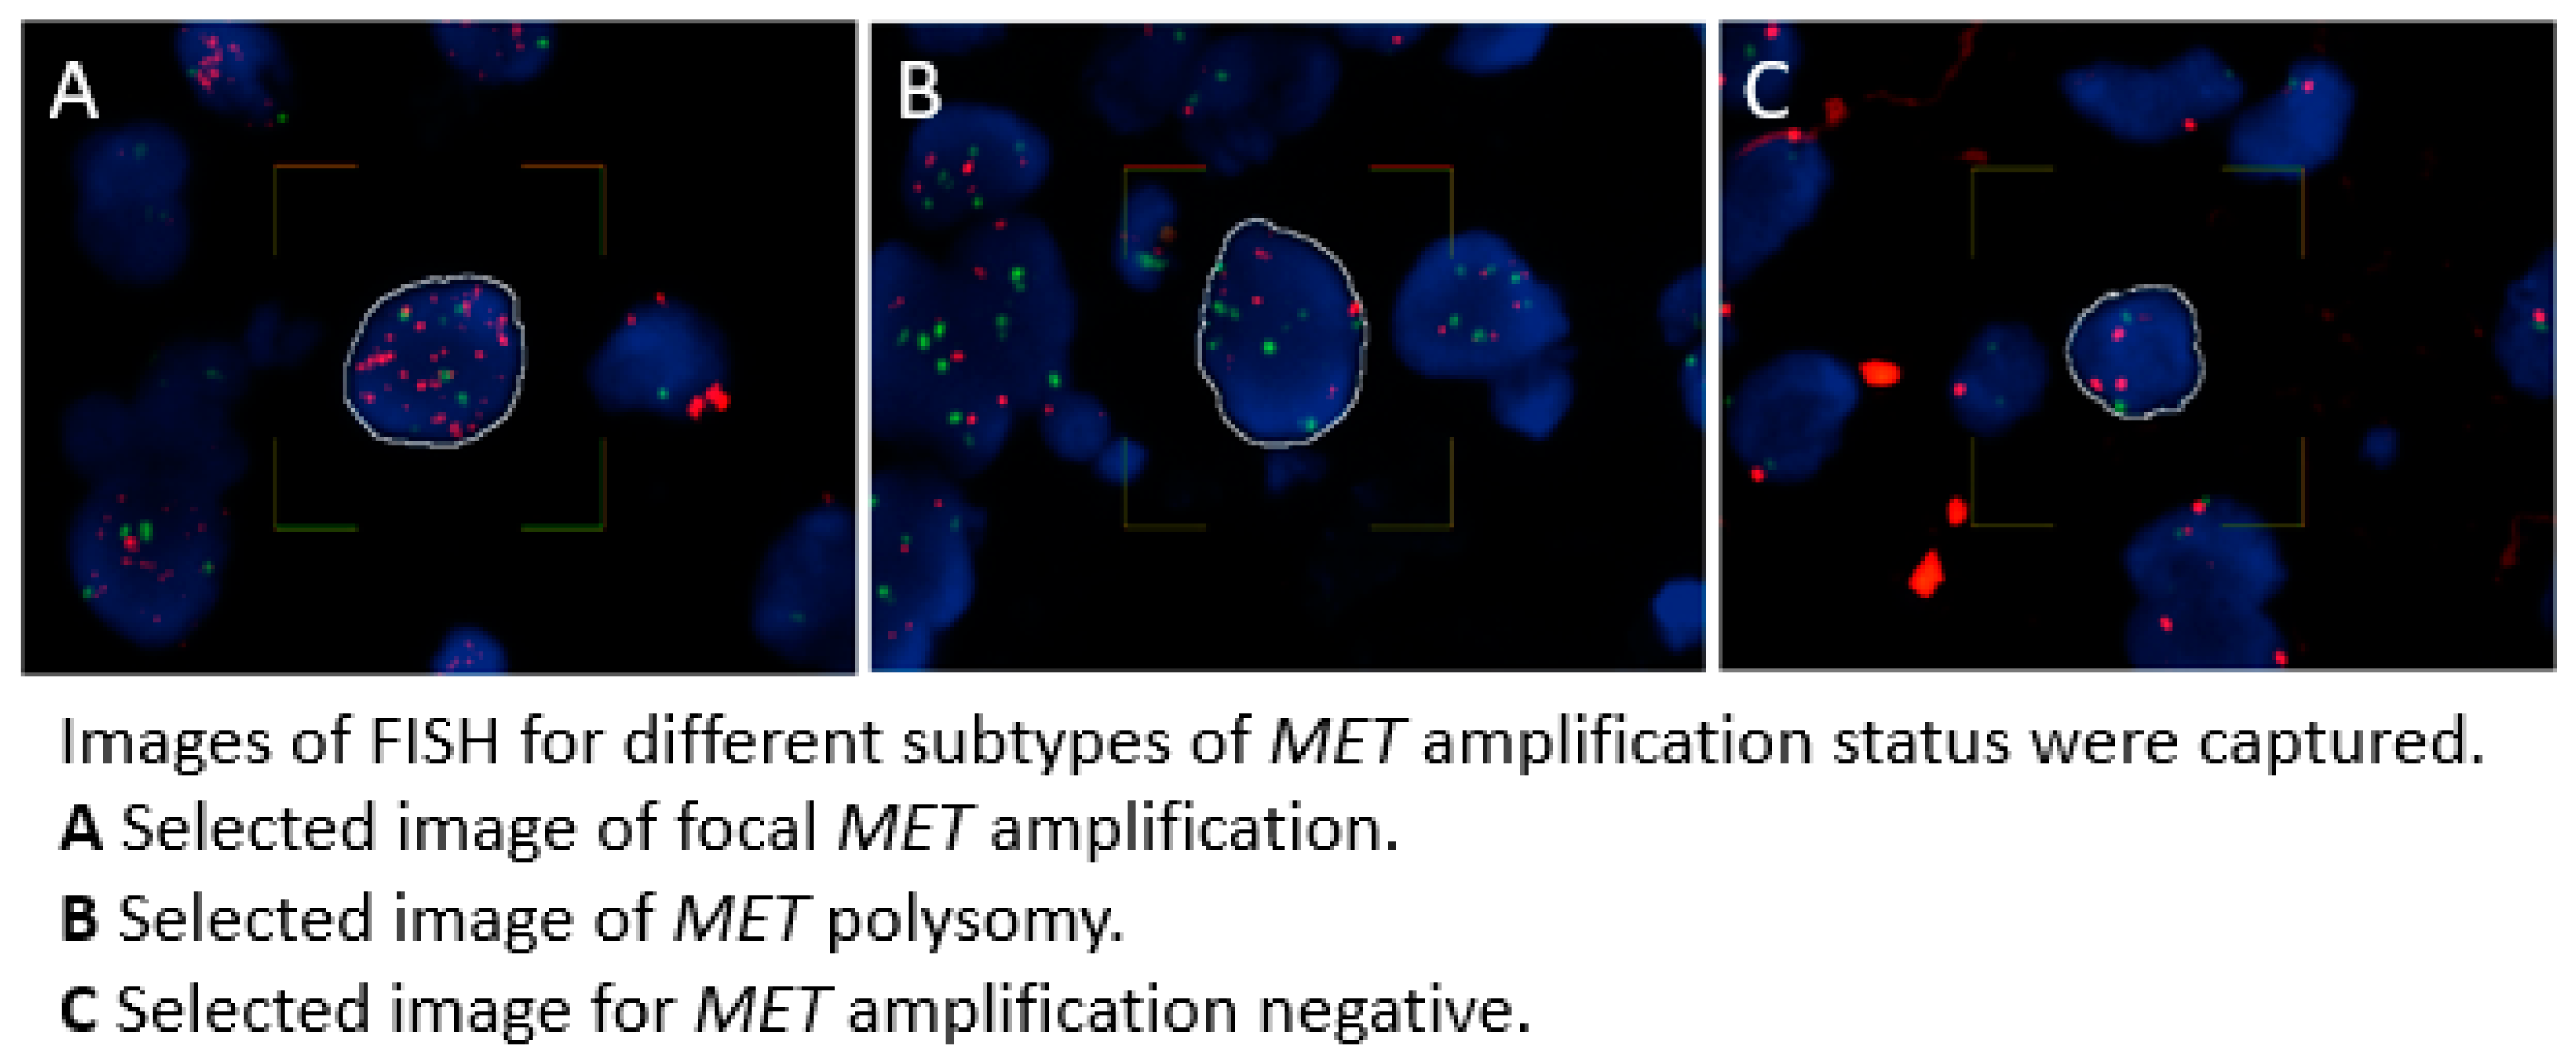
Figure 2.
Formula for dPCR result analysis for both reaction 1 and reaction 2.
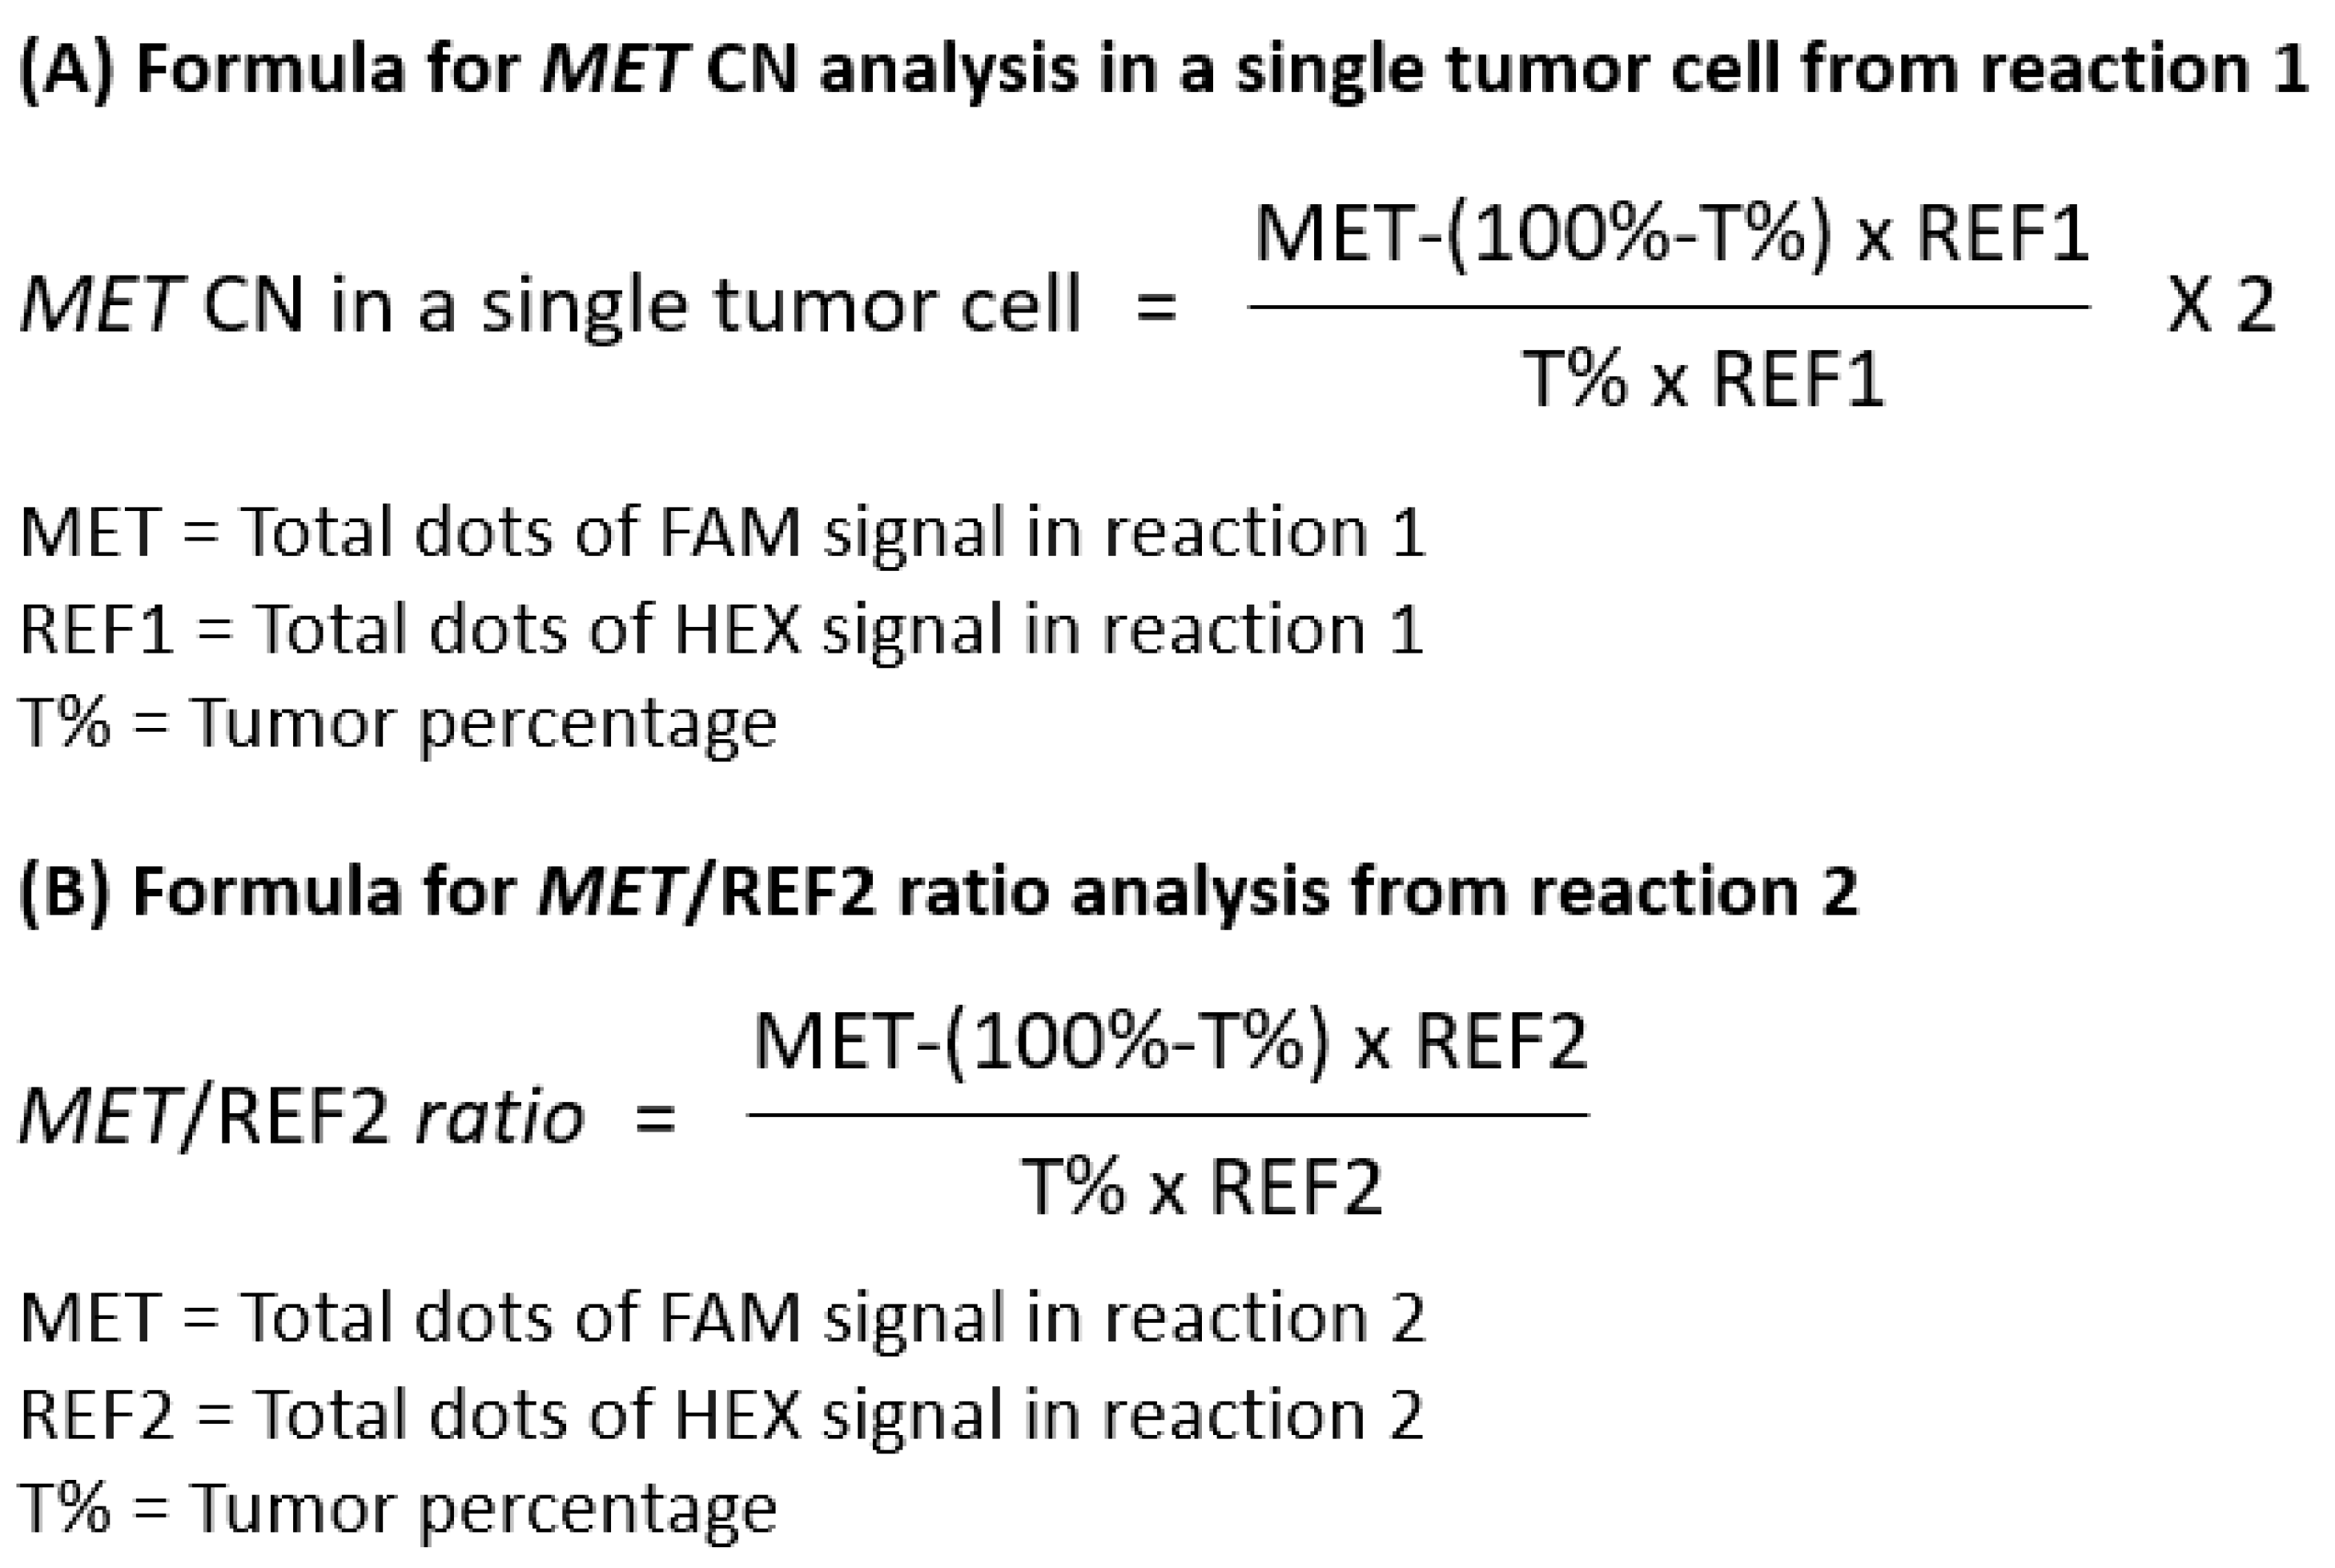
Figure 3.
Correlation of dPCR MET CN quantification with reference.
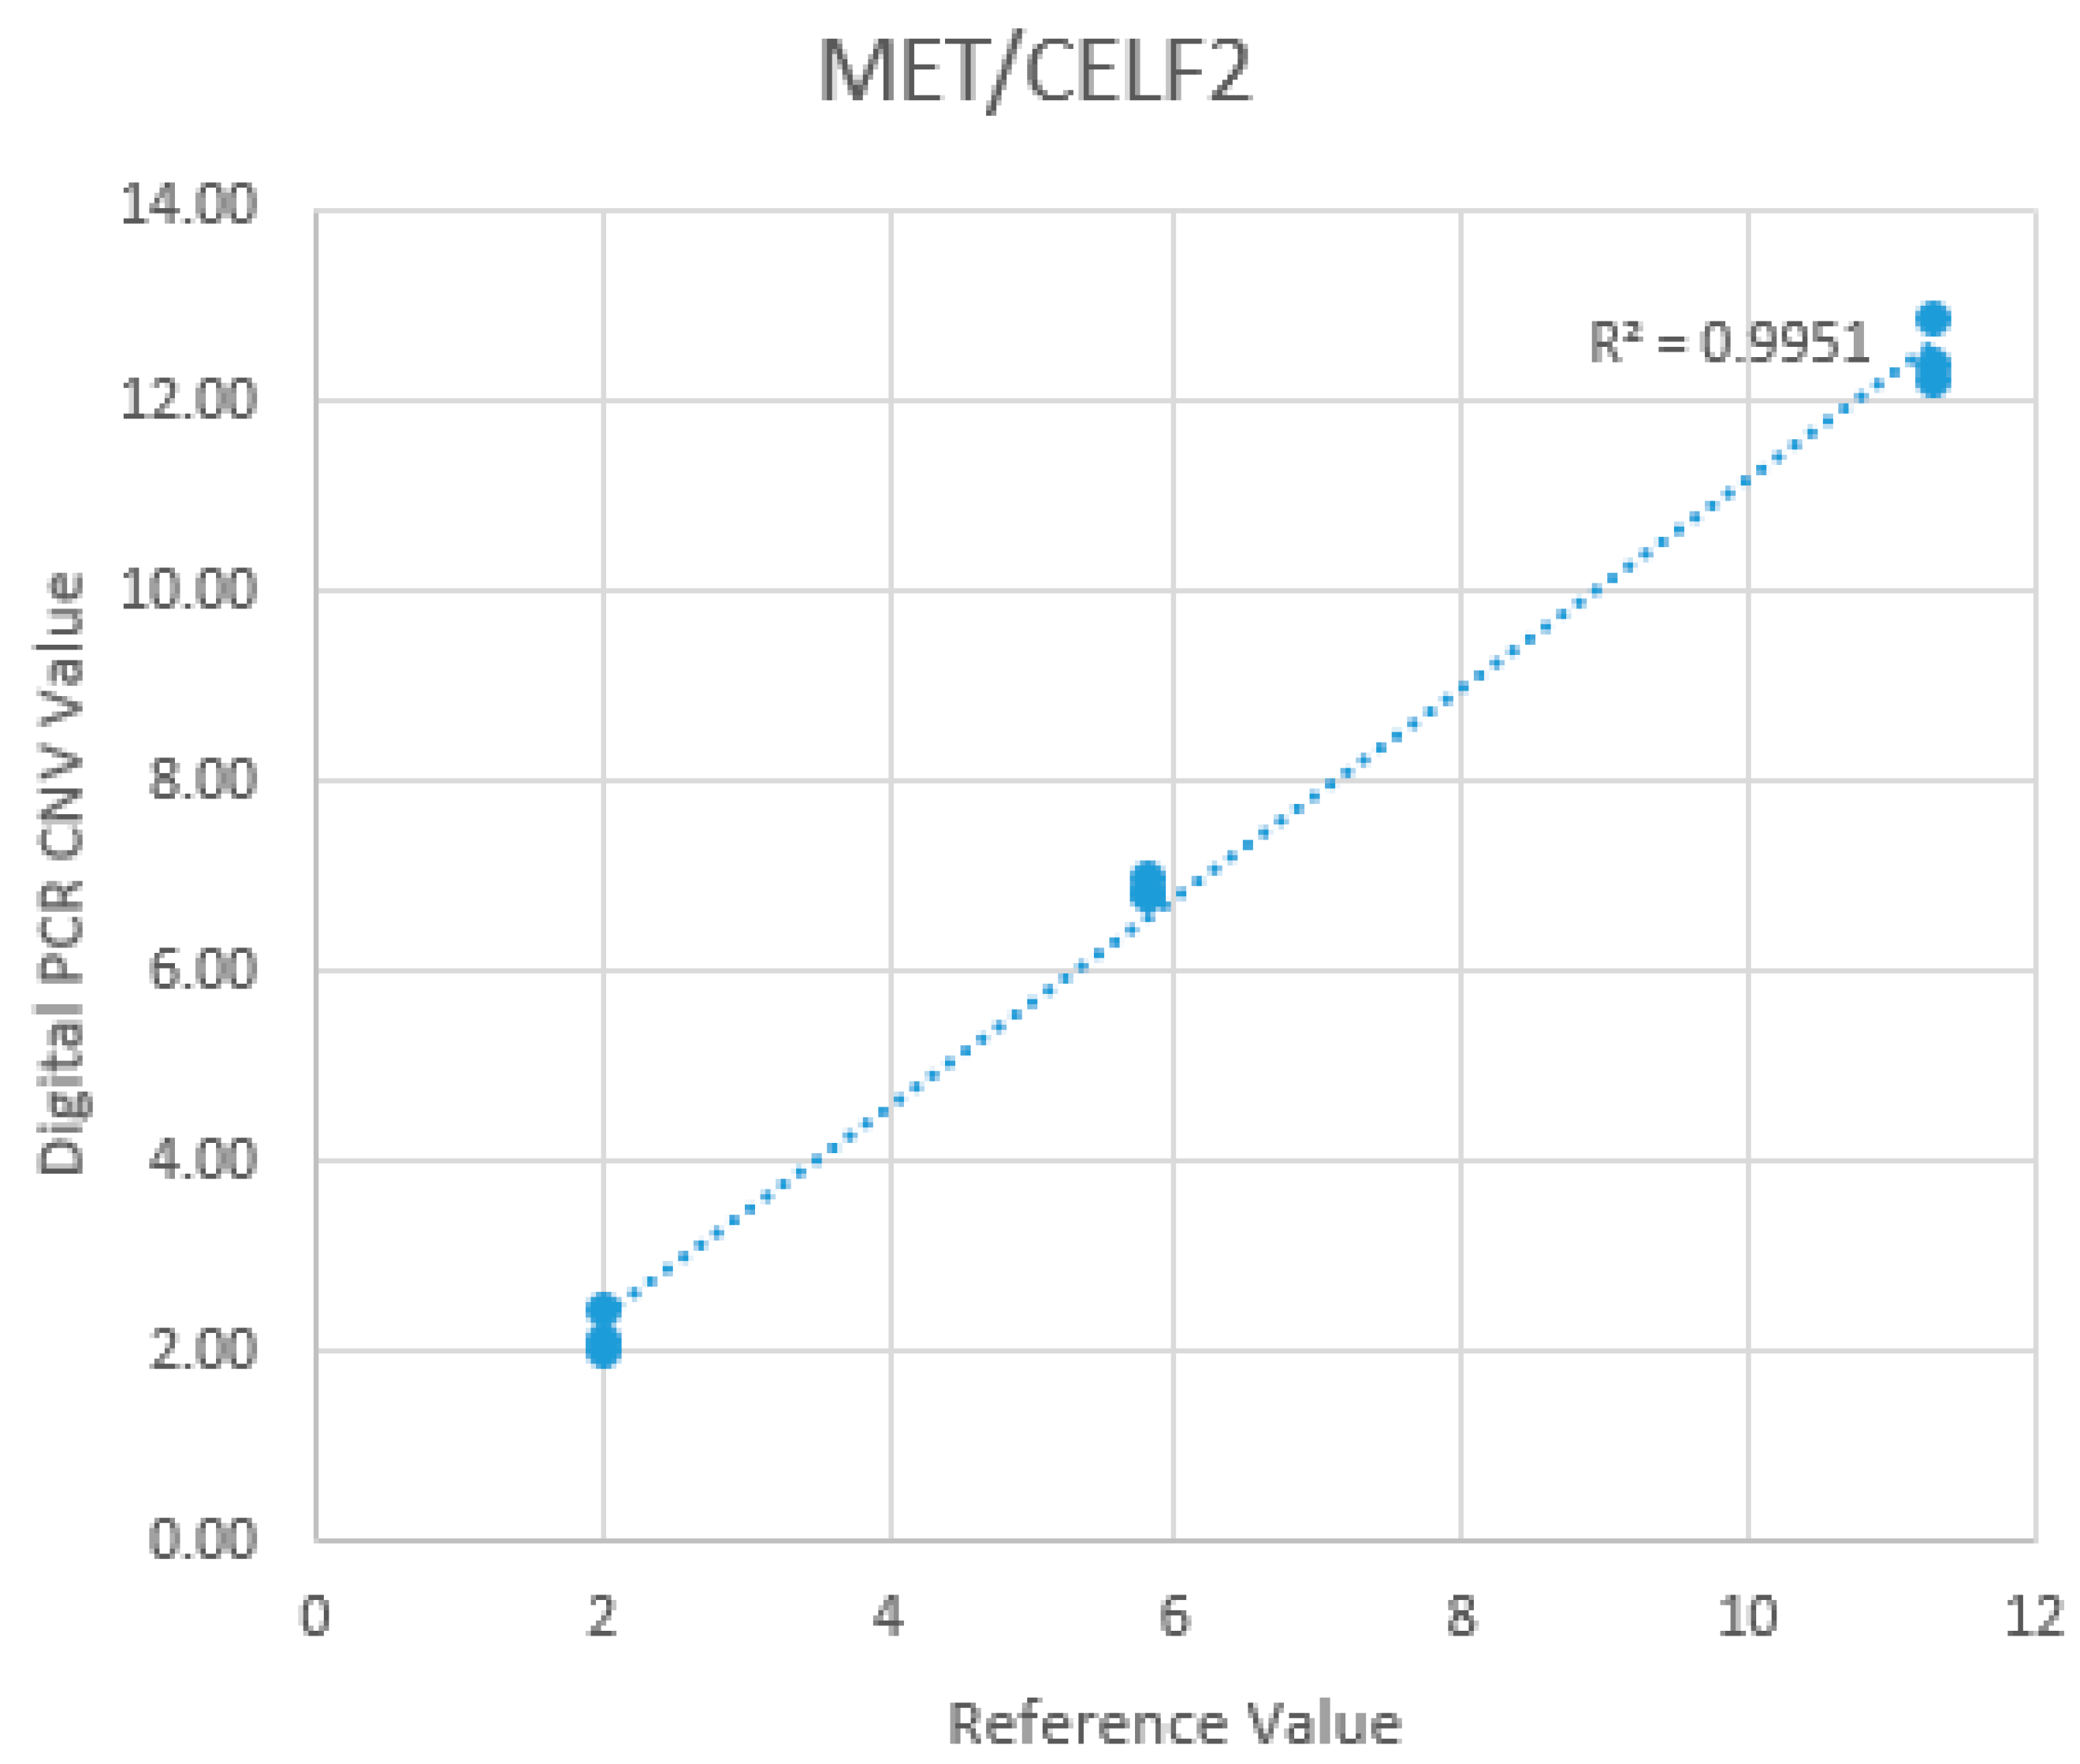
Figure 4.
Concordance of the positive results obtained by dPCR, FISH and NGS.
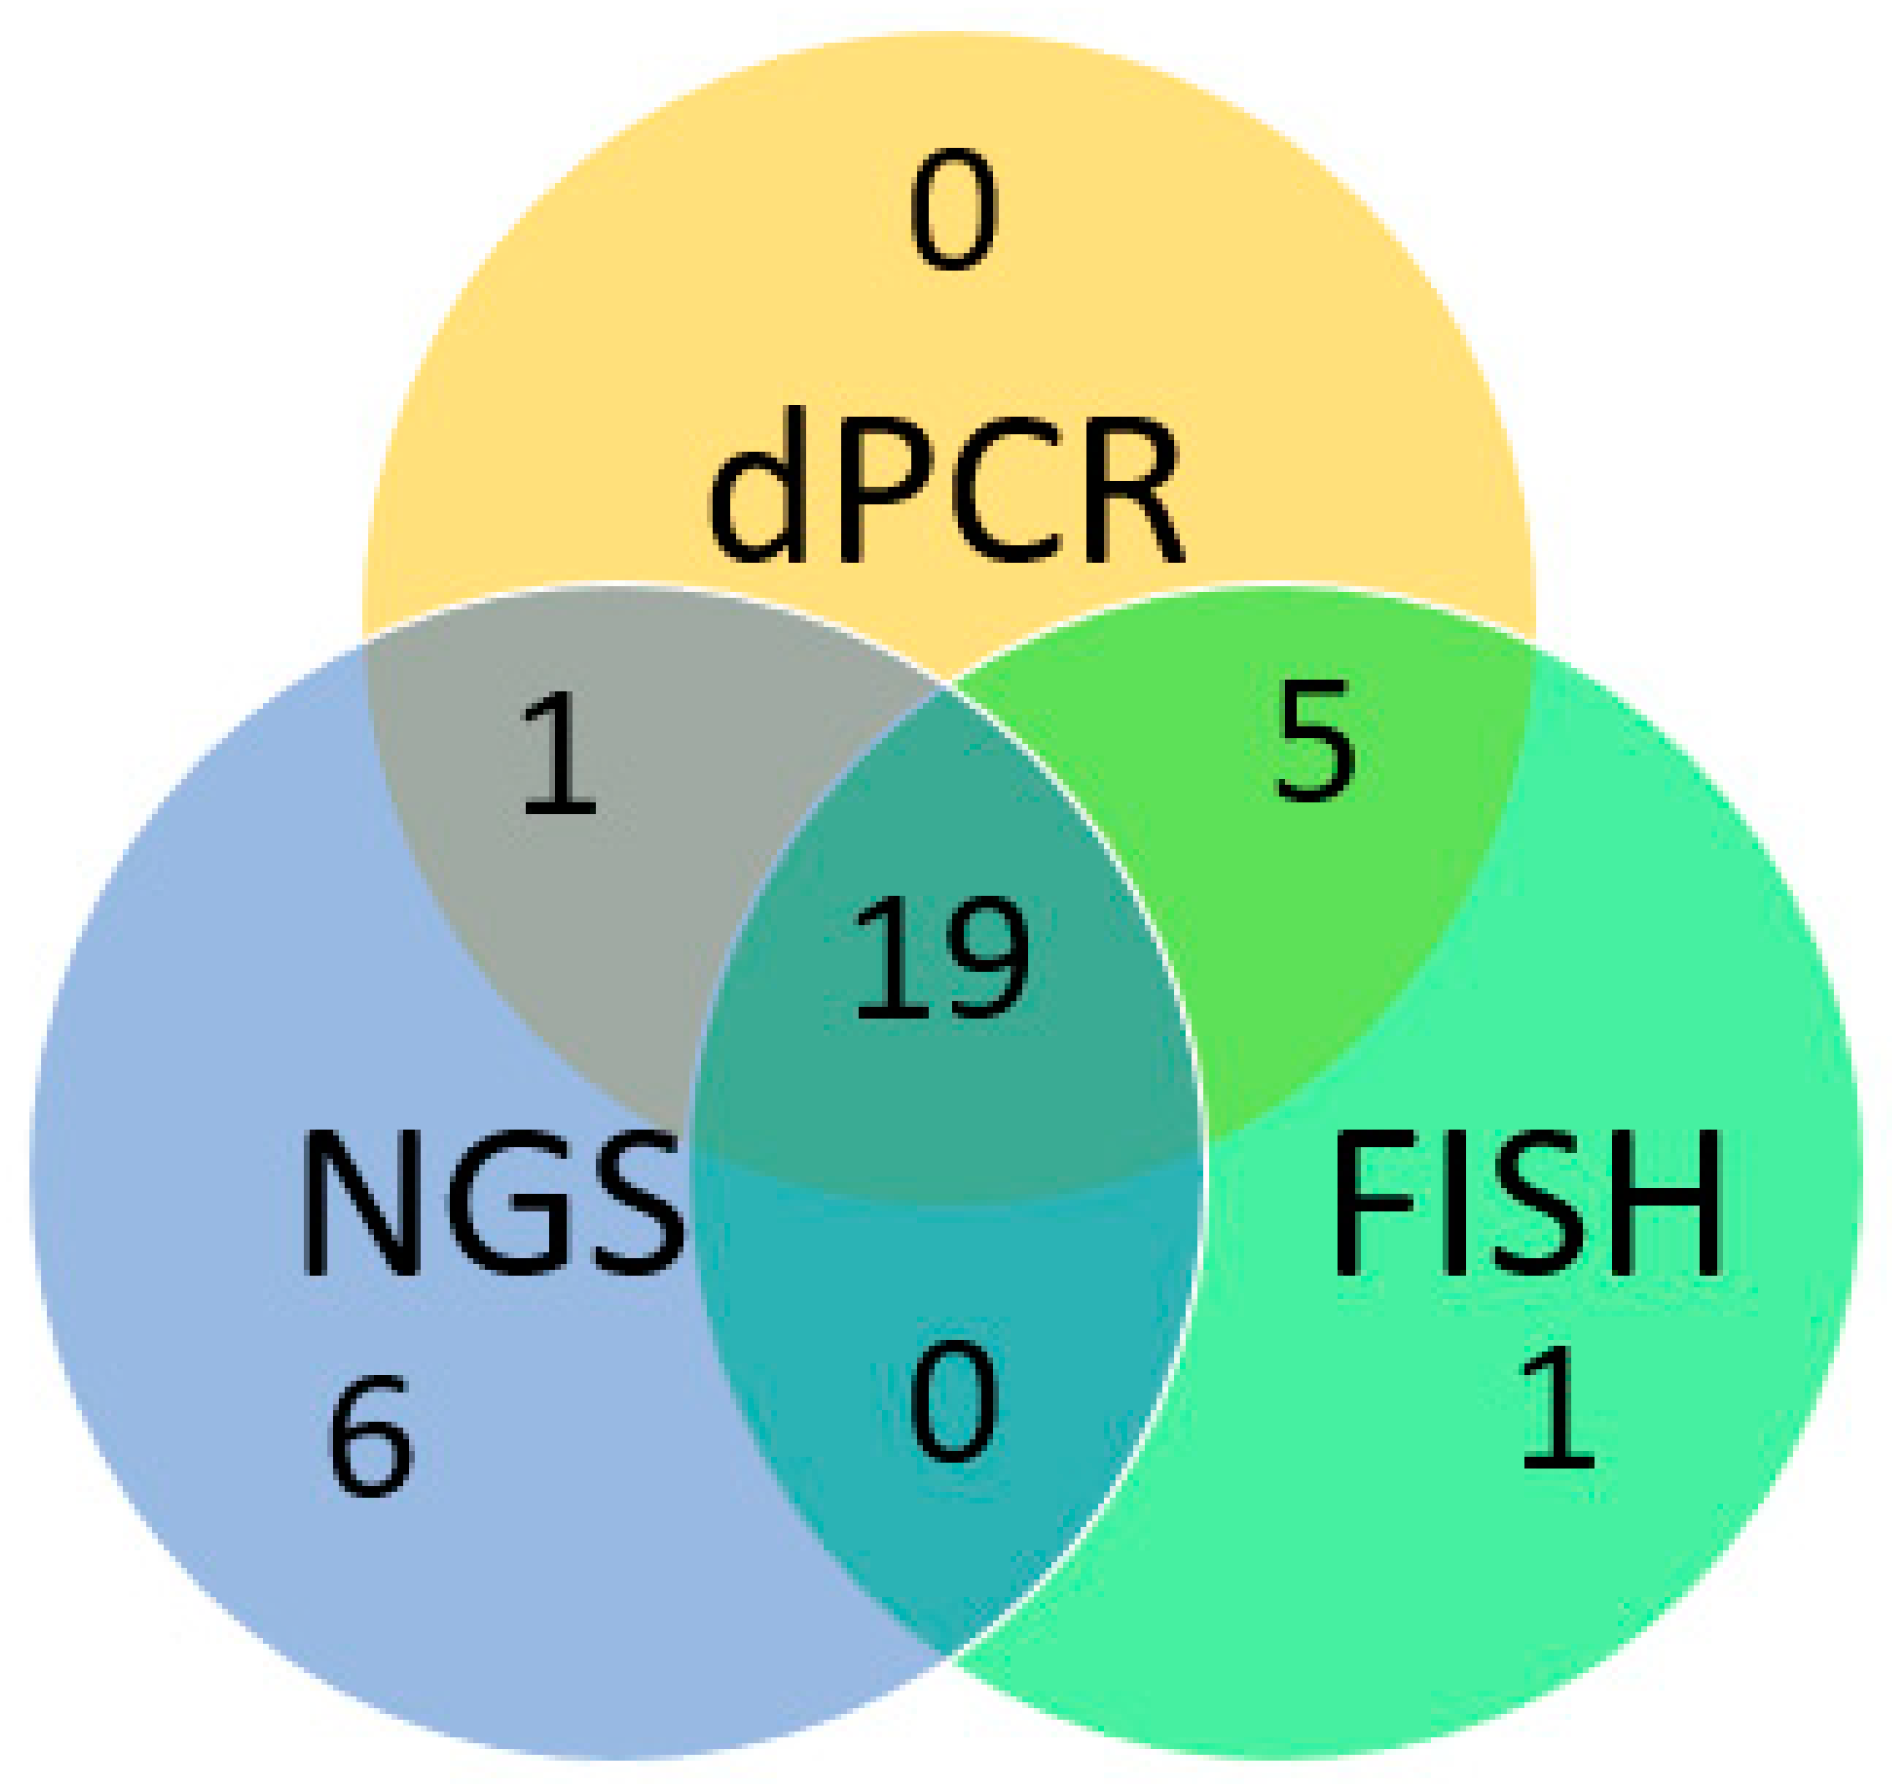
Figure 5.
Concordance between dPCR and FISH.
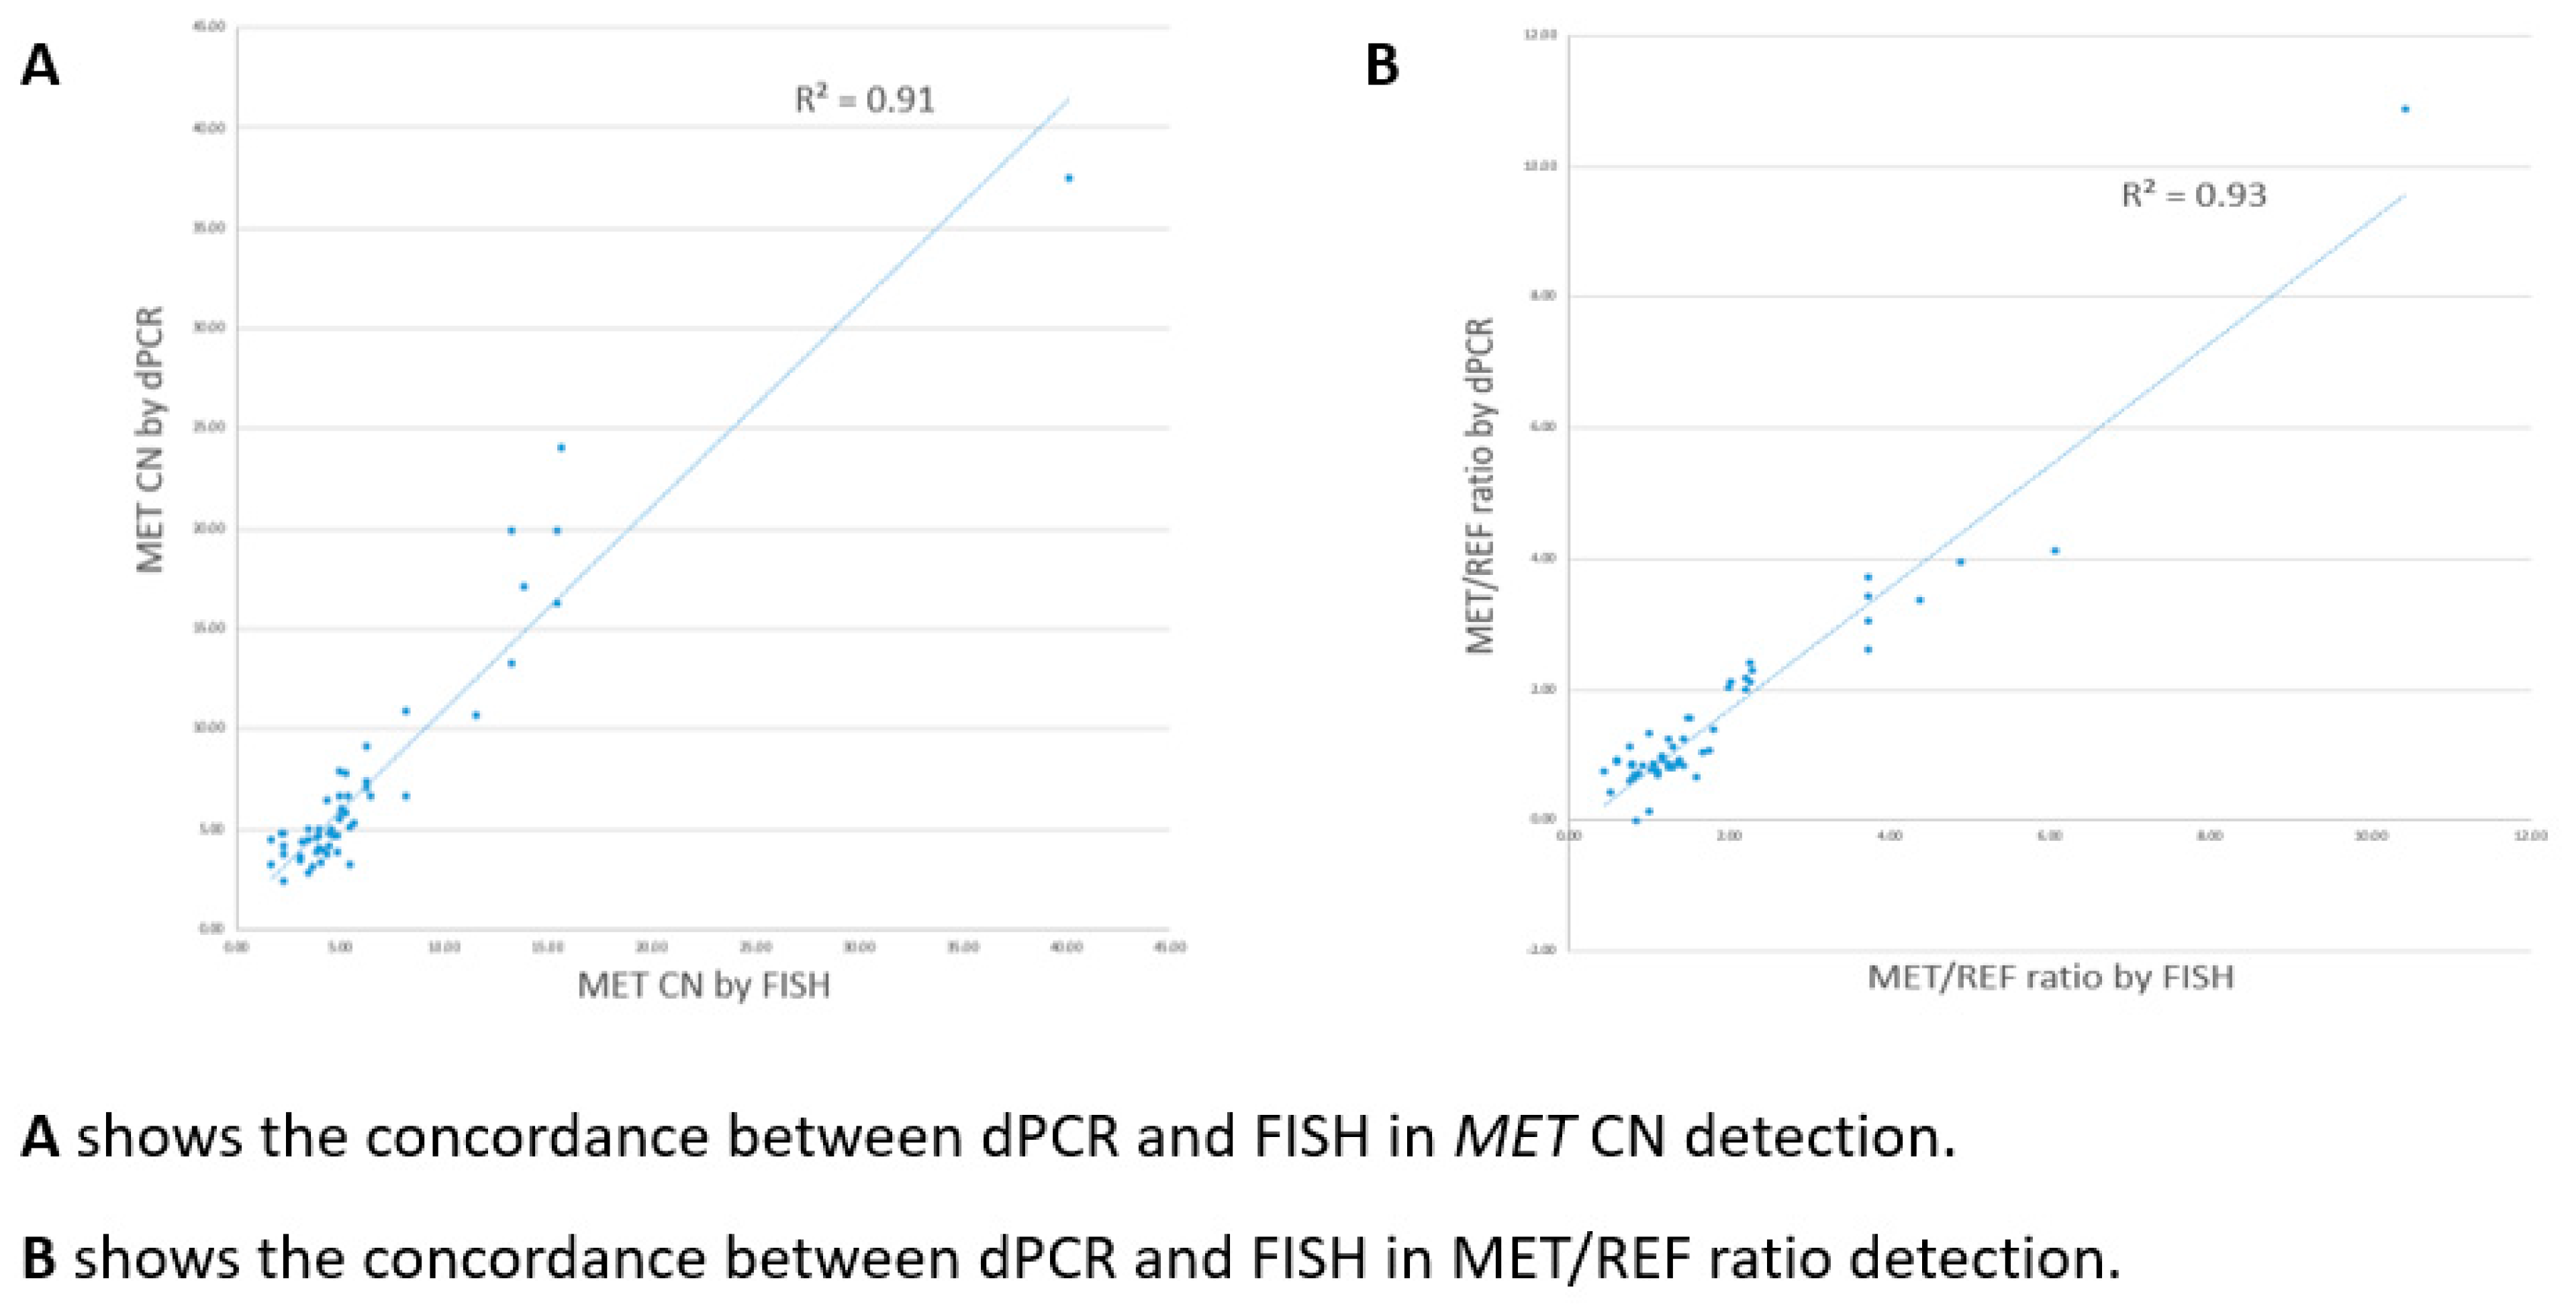
Figure 6.
Concordance between NGS and FISH in MET CN detection.
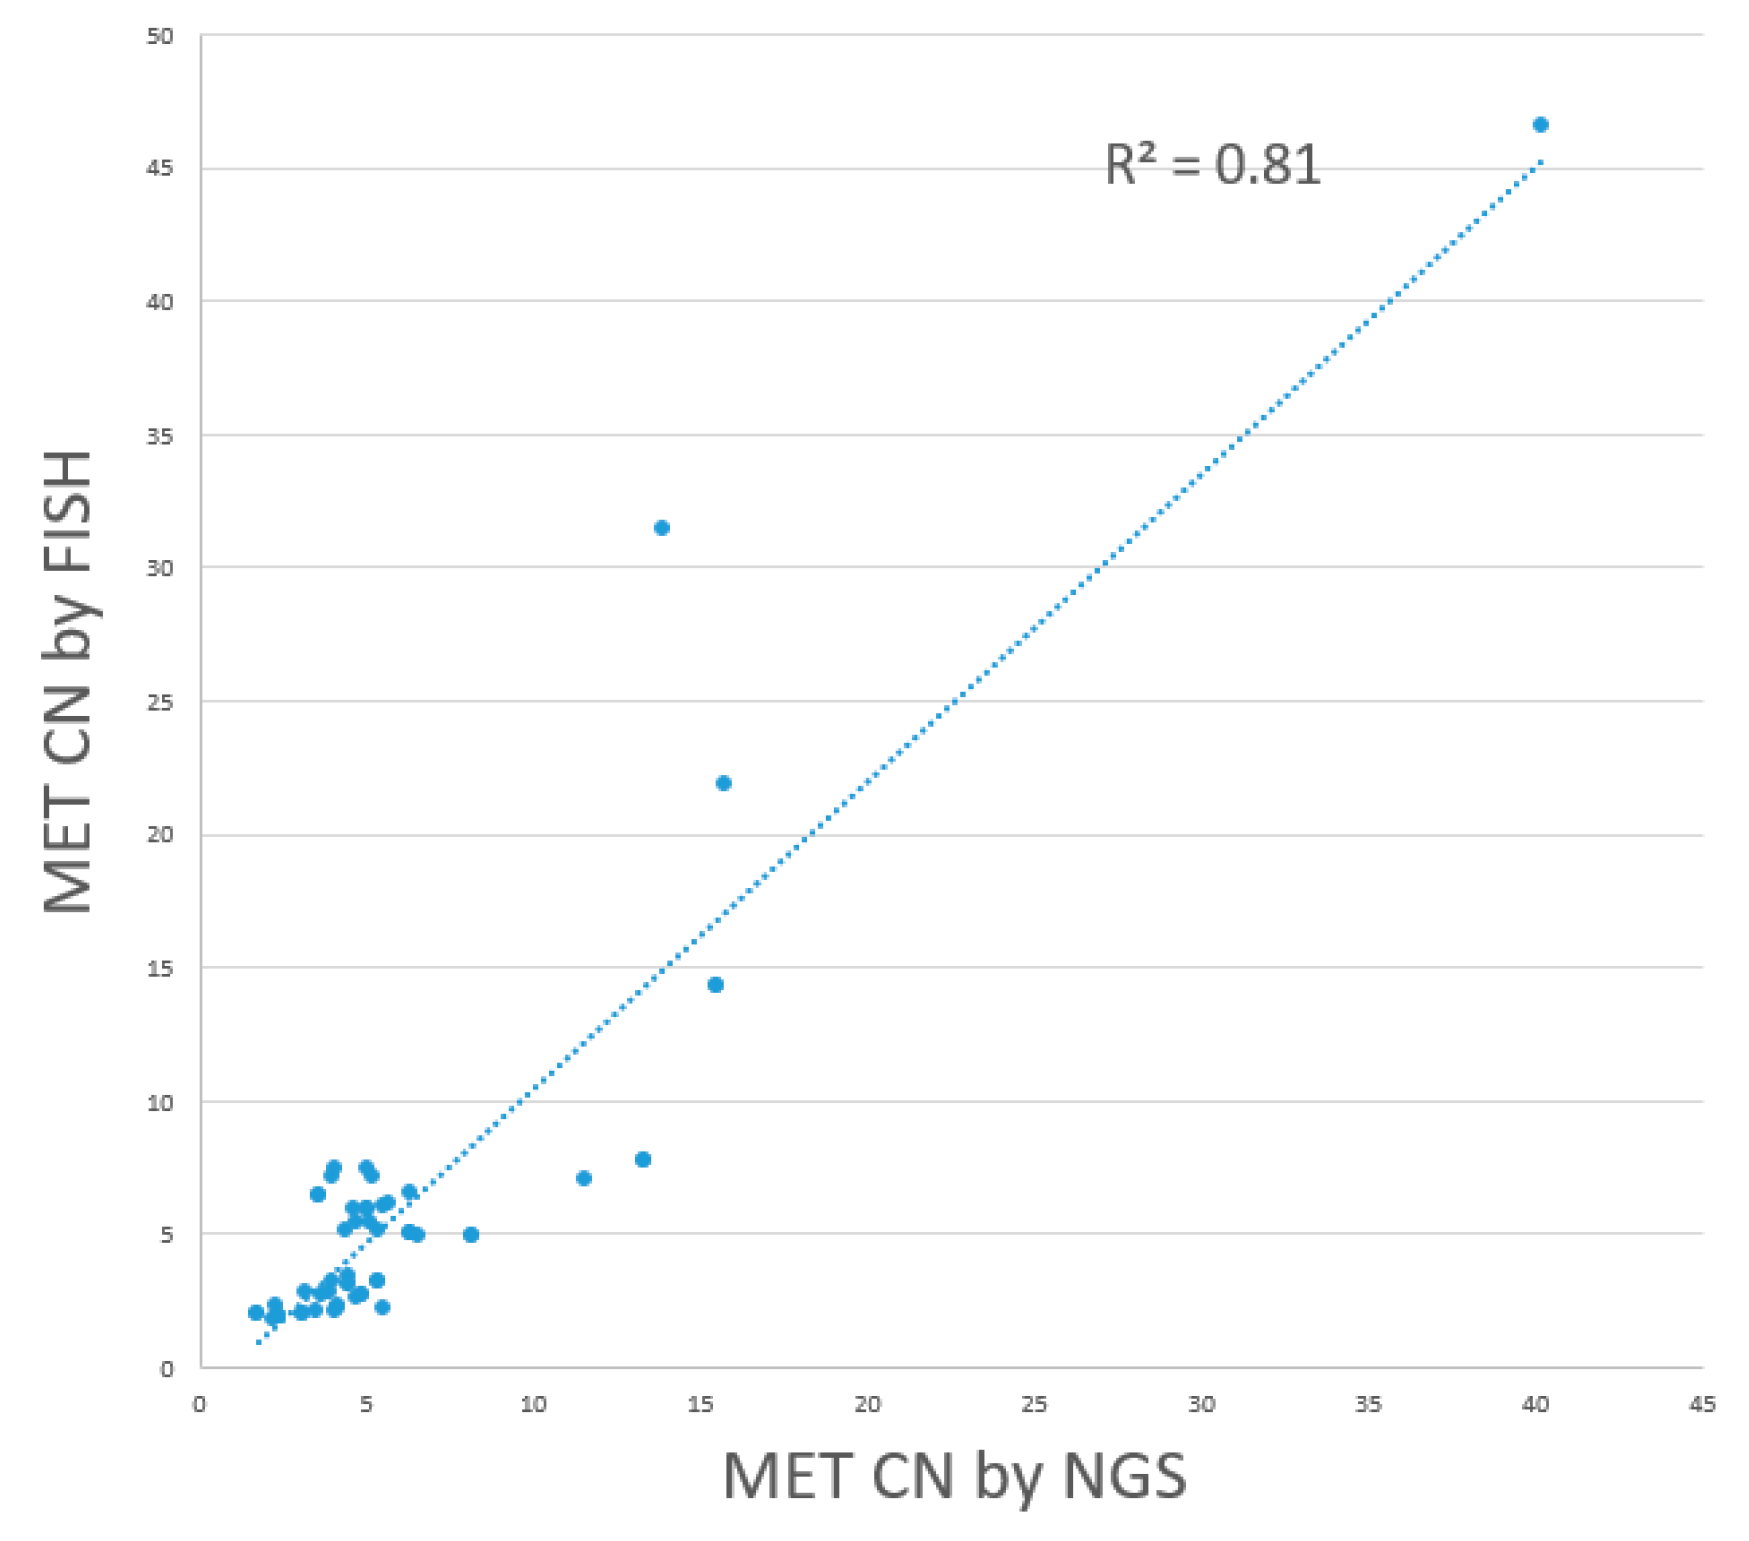
Figure 7.
Concordance between dPCR and NGS in MET CN detection.
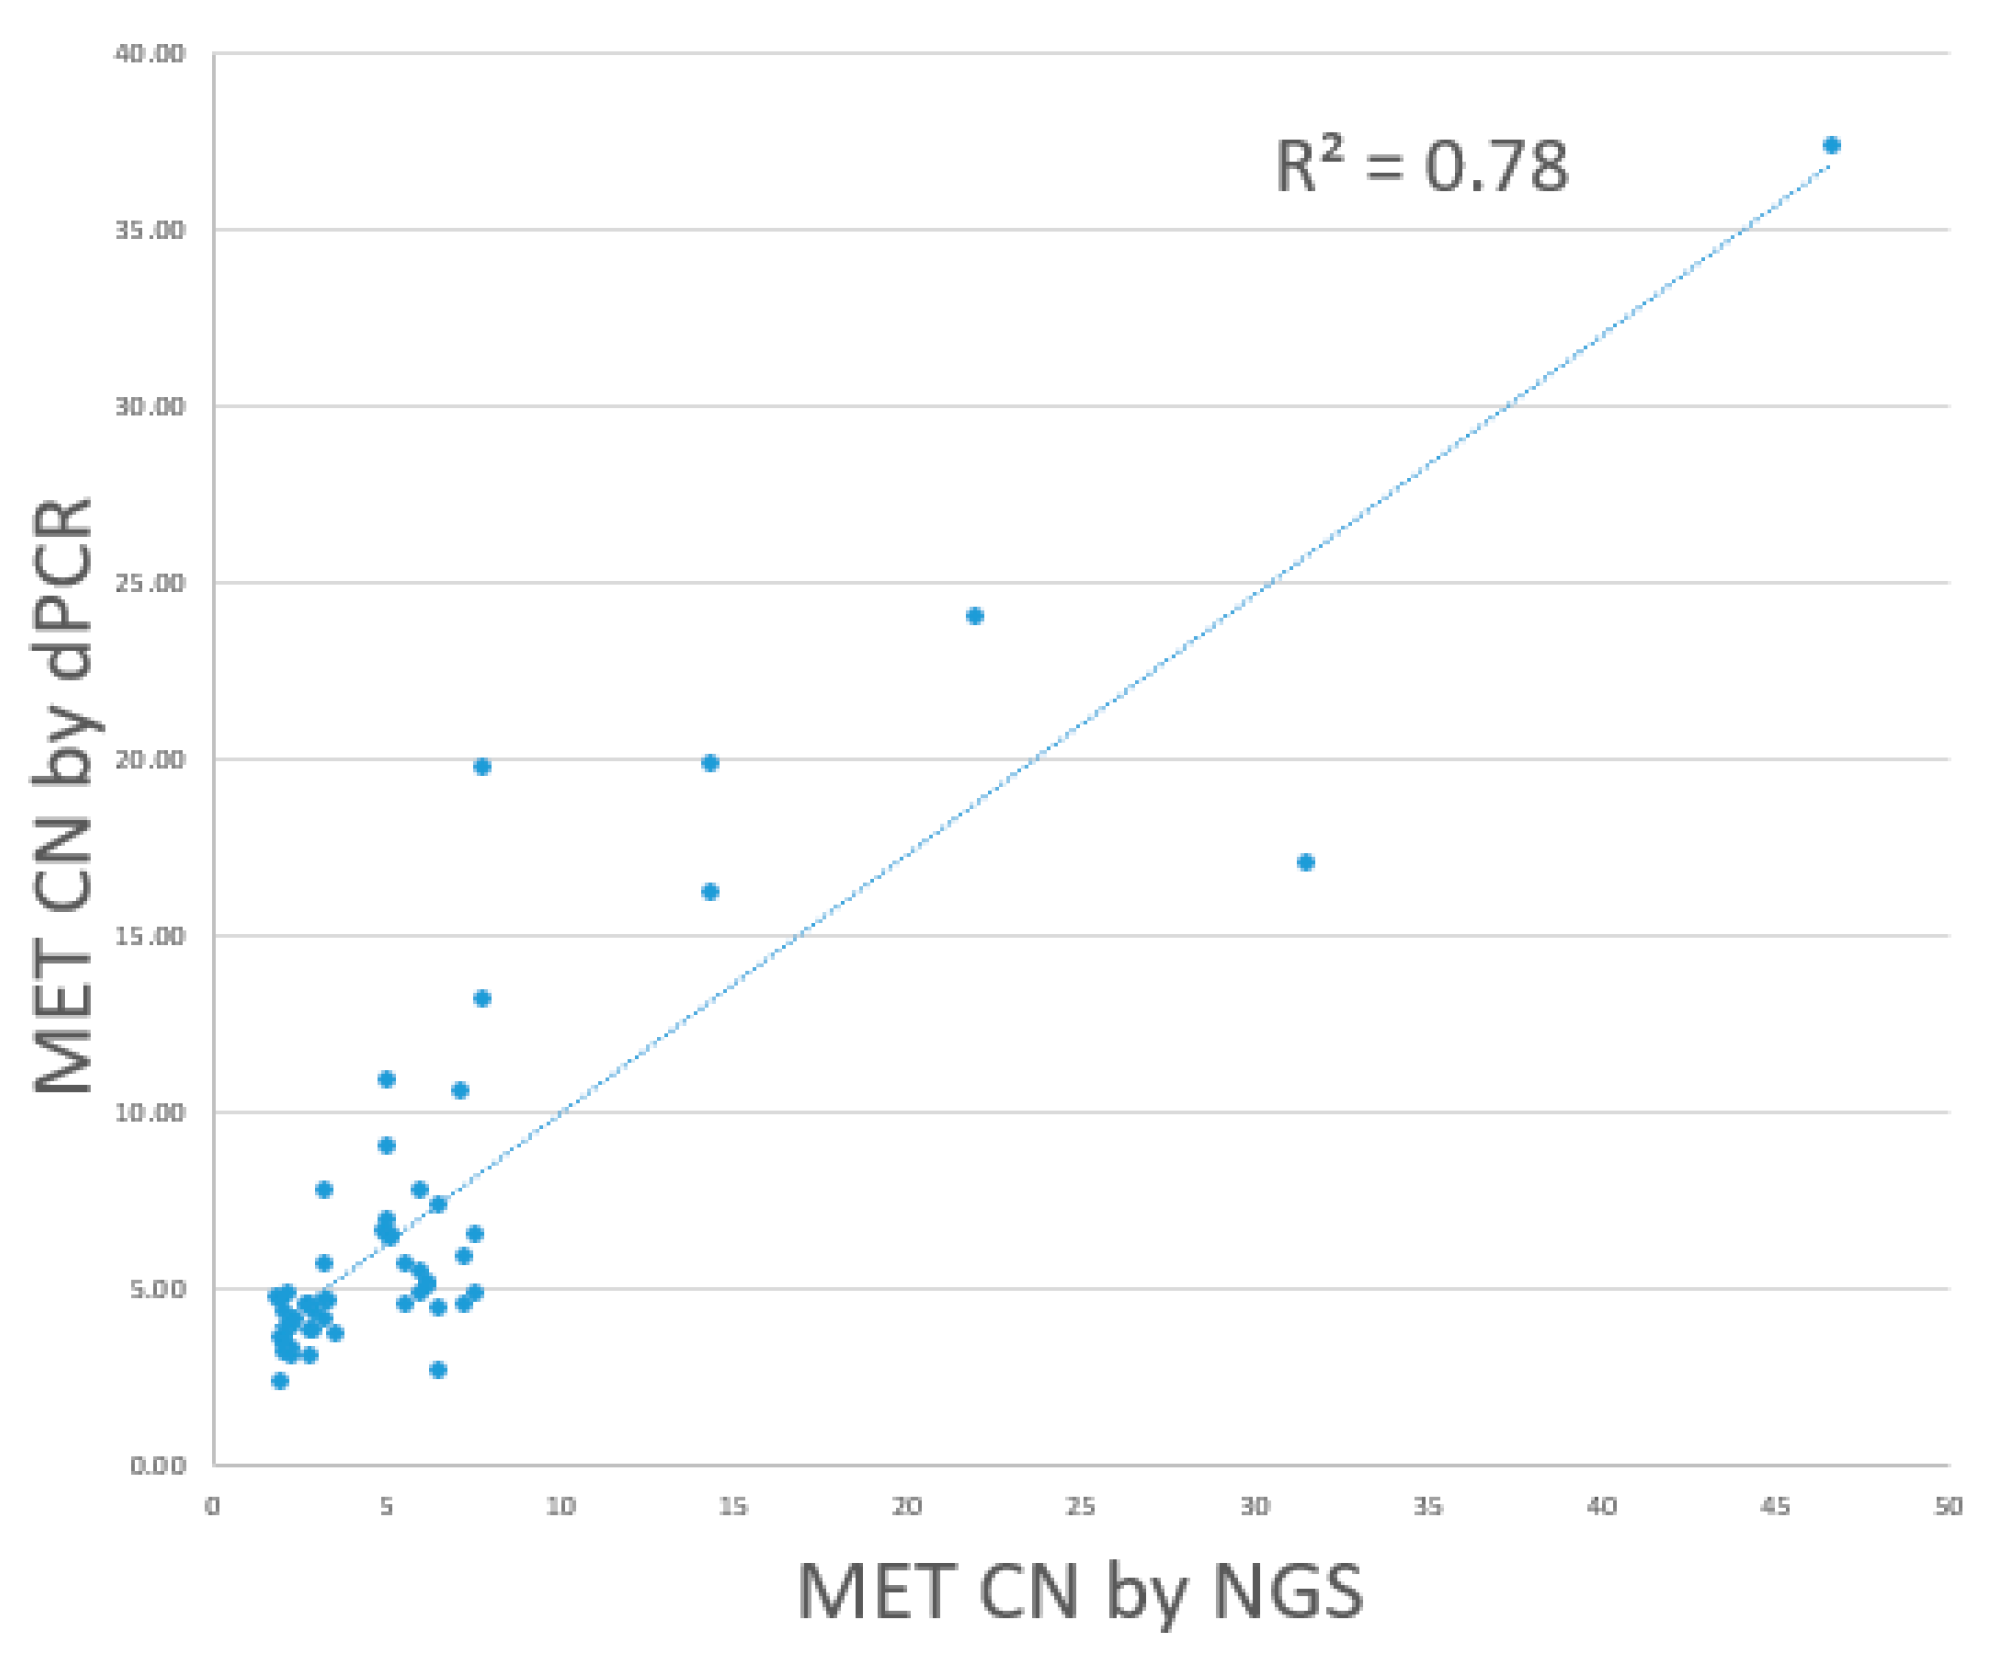

Table 1.
Sequences of the primer and probe used in the dPCR assay.
| Target gene | Primer/Probe | Primer/Probe sequence |
| MET | MET_F | 5’-GACGGACCAGTCCTACATTGA-3’ |
| MET_R | 5’-CTAGAGTTTCCCTTTGGACCG-3’ | |
| MET_P | 5’-FAM-CTTACCCCATTAAGTATGTCCATGCCTTTG-MGB-3’ | |
| CELF2 (REF1) | REF1_F | 5’-AGAGGTTAACTTGGTGGCCT-3’ |
| REF1_R | 5’-AAAACAAGCCGATGTAGTGGA-3’ | |
| REF1_P | 5’-HEX-AGAAGCCAGGAGAAGCACTTACTCCAA-MGB-3’ | |
| BRAF (REF2) | REF2_F | 5’- AATAGAGTCCGAGGCGGG-3’ |
| REF2_R | 5’- CCAATACCACAGGAAGAGGC-3’ | |
| REF2_P | 5’-HEX-GGATGATCCAGATGTTAGGGCAGTCTCT-MGB-3’ |
Table 2.
Result interpretation for the dPCR assay.
| Interpretation | MET copy number in reaction 1 | MET/BRAF ratio in reaction 2 |
| Focal MET amplification | ≥ 5 | ≥ 2 |
| MET polysomy | ≥ 5 | < 2 |
| MET amplification negative | <5 | N/A |
Table 3.
Comparison between dPCR and NGS with reference to FISH for MET amplification detection.
| Method | Sensitivity | Specificity | PPV | NPV | Linear regression (R2) |
| dPCR | 96.0% | 96.7% | 96.0% | 96.7% | 0.91 |
| NGS | 76.0% | 76.7% | 73.1% | 79.3% | 0.81 |
Disclaimer/Publisher’s Note: The statements, opinions and data contained in all publications are solely those of the individual author(s) and contributor(s) and not of MDPI and/or the editor(s). MDPI and/or the editor(s) disclaim responsibility for any injury to people or property resulting from any ideas, methods, instructions or products referred to in the content. |
© 2025 by the authors. Licensee MDPI, Basel, Switzerland. This article is an open access article distributed under the terms and conditions of the Creative Commons Attribution (CC BY) license (http://creativecommons.org/licenses/by/4.0/).
Copyright: This open access article is published under a Creative Commons CC BY 4.0 license, which permit the free download, distribution, and reuse, provided that the author and preprint are cited in any reuse.


