Introduction
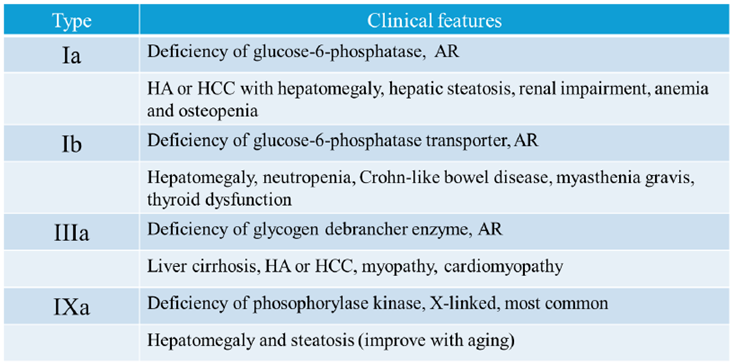
Glycogen storage diseases (GSDs) are rare, inherited disorders of glycogen metabolism caused by a deficiency of enzymes or transporters [
1,
2,
3,
4]. The incidence of GSDs is approximately 1 case per 20,000−40,000 live births. Most types of GSDs are inherited in an autosomal recessive manner, and GSD type IX is inherited in an X-linked manner. The roles of glycogen are the disposal of excess glucose and the provision of energy during fasting or physical activity (
Figure 1). Therefore, hypoglycemia during fasting is initially observed in pediatric patients with GSDs [
1,
2,
3,
4,
5]. Because glycogen is stored in the liver, skeletal muscles, and kidneys, these organs are affected by the excessive accumulation of glycogen or similar substrates (e.g., dextrin) in patients with GSDs [
1,
2,
3,
4]. Dietary therapies involving the continuous uptake of glucose and uncooked cornstarch can prevent hypoglycemia associated with GSDs, which are expected to avoid neurological complications, growth retardation, and hepatic and renal complications [
1,
3,
4,
5]. Nonetheless, liver cirrhosis, hepatic tumors, neutropenia, renal impairment, and myocardial disorders may contribute to the prognosis of GSDs in children and young adults [
1,
2,
3,
4,
6,
7,
8,
9,
10,
11,
12]. Liver or kidney transplantation, or gene therapies are performed in patients with GSDs and critical complications [
1,
4,
13]. Tumor resection is performed in patients with GSD and hepatocellular carcinoma [
9].
Table 1 summarizes the types of GSDs presented in this review.
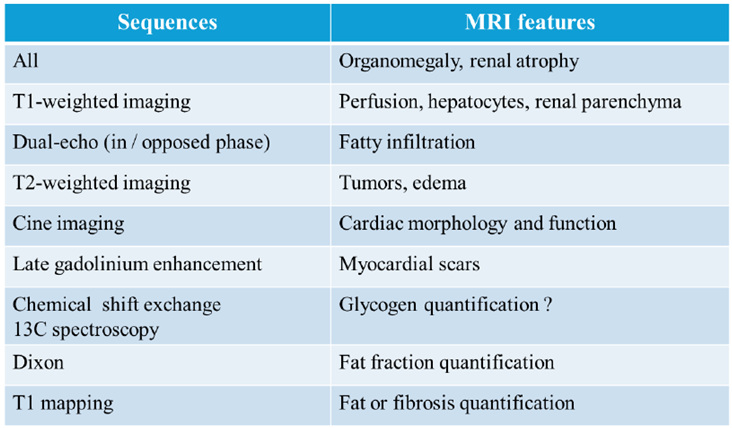
Diagnostic imaging tools are useful for identifying and monitoring complications of GSDs. Ultrasonography is the first-line method observing complications in pediatric patients with GSDs owing to its accessibility, functional assessment capabilities, and lack of requirement for ionizing radiation [
3,
11]. Magnetic resonance imaging (MRI) has advantages over ultrasonography in high soft tissue contrast, including adipose tissue [
3,
7,
8,
9,
10,
11,
12]. The use of contrast agents, including nonspecific gadolinium-based agents (e.g., gadoterate meglumine) and hepatocyte-specific agents (e.g., gadoxetate disodium: Gd-EOB-DTPA), allows for clear recognition, characterization, and monitoring of the complications of GSDs [
7,
8,
9,
10,
11,
12].
The purpose of the pictorial review is to present body MRI sequences available for identifying and monitoring complications of GSDs and clinical examples. We discuss future directions for MRI in GSDs, such as the possible application of quantitative MRI.
3. MRI Findings of Complications Associated with GSDs
3.1. Hepatic Involvement
Hepatomegaly is observed even in young children with GSDs because of the early accumulation of glycogen (
Figure 5) [
3,
5,
6]. Hepatosplenomegaly occurs as hepatic dysfunction progresses, and ultimately liver transplantation can be performed [
1]. MRI is useful for monitoring the size and morphology of the liver and spleen and making a diagnosis of liver cirrhosis.
Hepatic steatosis is often associated with GSDs because of malnutrition and lipid metabolism disorders [
3,
6]. Dual-echo T1-weighted imaging reveals hepatic steatosis (Figures 6A and 7A) [
9]. It is also useful for monitoring the severity of hepatic steatosis. The liver signal normalizes on opposed-phase T1-weighted imaging in patients with GSD type I following successful dietary therapies (
Figure 6B).
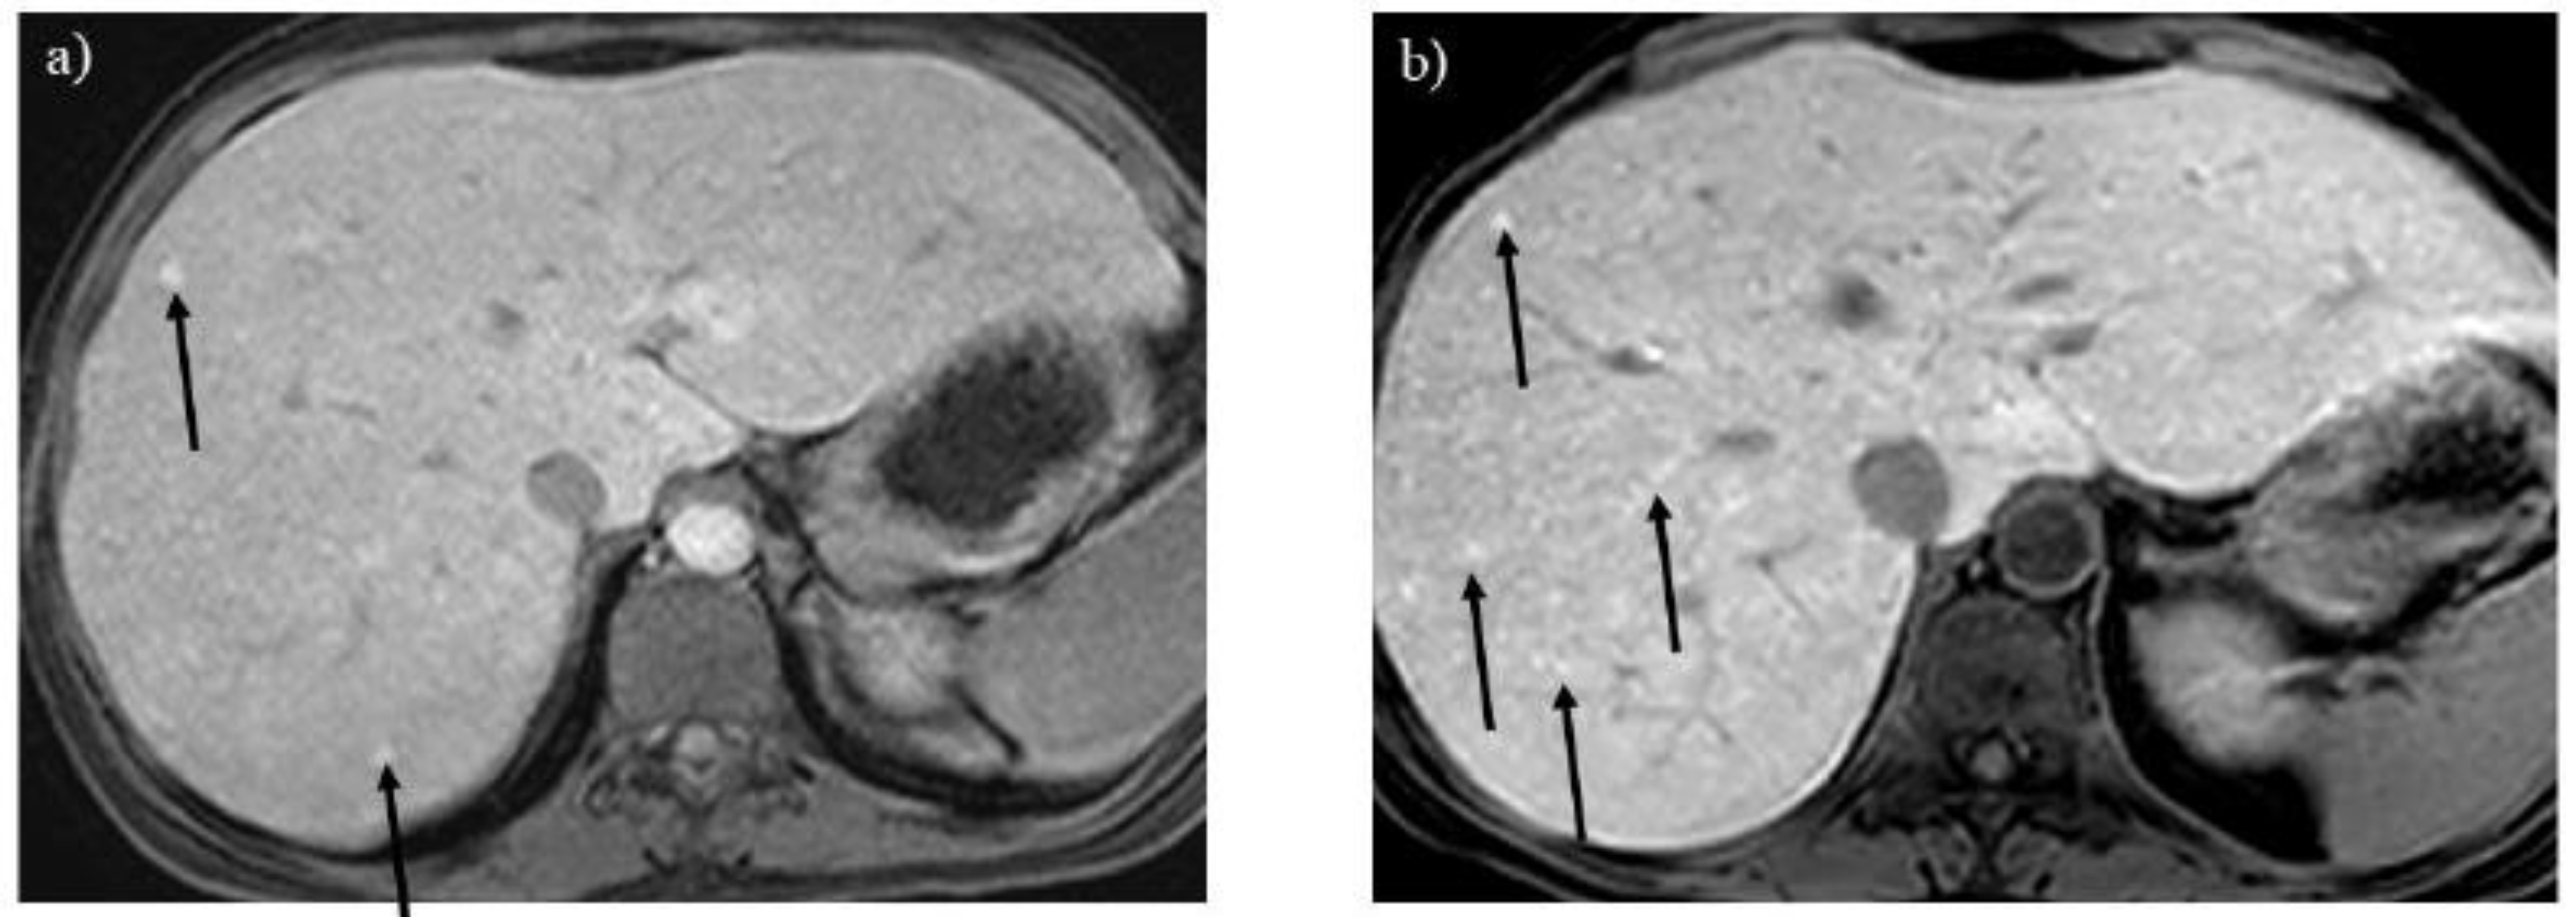
Regenerative nodules are associated with liver cirrhosis. Gd-EOB-DTPA enhanced imaging is useful for differentiating hepatic nodules, and regenerative nodules show high signal intensity in the hepatobiliary phase (
Figure 9) [
17]. As the liver parenchymal damage progresses, the number of regenerative nodules increases, as identified by MRI (
Figure 9B).
Hepatic adenoma and adenomatosis are common complications of GSDs [
1,
2,
3,
6,
7,
8]. Some genetic alternation may contribute to a larger hepatic adenoma in patients with GSD type Ia [
3]. Different from hepatic adenomas without GSDs, those associated with GSDs are often found in male patients and multiple lesions (i.e., hepatic adenomatosis) and increase in size (Figures 3B, C, 7B and C) [
17,
18]. The hepatic adenoma associated with GSDs are not related to contraceptives. It is clinically problematic to differentiate between a growing hepatic adenoma and hepatocellular carcinoma. Indeed, hepatic adenoma can transform into hepatocellular carcinoma in the older patients with GSDs, exhibiting similar imaging appearances in GSDs (Figures 3C, 7B and 8) [
9,
17]. Multimodality imaging surveillance should be performed once a hepatic tumor presenting strong enhancement in the arterial phase is identified in patients with GSDs [
6,
9].
3.2. Renal Impairment
Glycogen and similar materials accumulate in the kidneys, which induces renal complications in patients with GSDs [
1,
2,
3,
5,
14]. MRI is insensitive to renal calculi associated with GSDs, whereas it can detect enlargement or atrophy of the kidneys (Figures 2A and 3A). T1-weighted imaging identifies renal impairment as decreased corticomedullary contrast in the kidneys (
Figure 2A) [
15]. MRI can also be used to investigate transplanted kidneys without contrast agents (
Figure 2B).
3.3. Skeletal Muscular Growth Retardation
Glycogen is consumed in skeletal muscles during physical activity. Growth retardation, atrophy, and clinical symptoms, including muscular weakness and cramping, are observed in children and young adults with GSDs [
1,
2]. MRI may be useful for evaluating the volume and fatty infiltration in skeletal muscles (
Figure 6B). Because MRI can visualize the distribution of involved muscles in a wide range of view, it may be useful for distinguishing GSDs from muscular dystrophies and neuromuscular disorders [
19].
3.4. Myocardial Involvement
GSD type IIIa is known to involve the myocardium and can lead to sudden cardiac death because of severe myocardial hypertrophy or glycogen accumulation in the conduction system [
1,
2,
4]. MRI is the best imaging tool for evaluating tissue characterization of the myocardium. Myocardial edema and scars associated with GSD type IIIa are visualized with T2-weighted and LGE imaging, respectively (
Figure 4) [
10,
11,
12,
16]. LGE is useful for observing myocardial scars that can progress even after liver transplantation (Figures 4B and C). Differential diagnoses of myocardial involvement in GSD include hypertrophic cardiomyopathy, Anderson-Fabry disease, Noonan syndrome, and mitochondrial cardiomyopathies, which exhibit myocardial hypertrophy in children and young adults [
11,
20,
21].
4. Future Directions
MRI is useful for observing the whole body with high spatial and contrast resolution, a wide range of views, and no need for radiation. Tobaly et al. [
19] have applied whole-body MRI to investigate the distribution and severity of skeletal muscles involved by GSD type III.
Some quantitative MRI techniques can be applied to GSDs to evaluate their severity. Chemical shift exchange sequences and
13C MR spectroscopy can be used to estimate glycogen in the organs [
22,
23]. The Dixon sequence can be used to quantify hepatic steatosis associated with GSDs, because it is an established technique for measuring fat fraction in the liver [
3,
24]. Quantitative T1 mapping is used to evaluate myocardial fibrosis and edema in patients with GSD IIIa [
12,
25]. Because T1 mapping does not require gadolinium contrast agents for myocardial tissue characterization, it may be useful for patients with GSD and renal impairment [
25]. T1 mapping may also be used to evaluate the fat fraction or degree of fibrosis in the liver [
26].
5. Conclusions
GSDs, which are rare, inherited metabolic disorders of glycogen metabolism, involve multiple organs from childhood to young adulthood. In this pictorial essay, we reviewed MRI features of their complications to guide and monitor appropriate treatments for GSDs. Because some of these complications predict an unfavorable prognosis in pediatric patients with GSDs, radiologists should be able to recognize them with MRI.
Author Contributions
Conceptualization, Y.A.; methodology, Y.A., N.S. and C.A.; investigation, Y.A., M.I., M.A and R.T.; data curation, Y.A. and M.I.; writing−original draft preparation, Y.A.; writing−review and editing, M.I., M.A. and R.T.
Funding
We have no funding related to this article.
Institutional Review Board Statement
The institutional review board approved this article.
Informed Consent Statement
Informed consent was waived due to the retrospective design of this review.
Data Availability Statement
Data availability is not applicable to this article as no new data were created or analyzed in this study.
Conflicts of Interest
The authors declare that they have no conflicts of interest.
References
- Gumush, E.; Ozen H. Glycogen storage diseases: An update. World. J. Gastroenterol. 2023, 29, 3932-3963. [CrossRef]
- Ellingwood SS; Cheng A. Biochemical and clinical aspects of glycogen storage diseases. J Clin Endocrinol. 2018, 238, R131-141.
- Froissart R; Piraud M; Boudjemline AM; Vianey-Saban C; Petit F; Hubert-Buron A; Eberschweiler PT; Gajdos V; Labrune P. Glucose-6-phosphatase deficiency. Orphanet J Rare Dis. 2011, 6, 27. [CrossRef]
- Hijazi G; Paschall A; Young SA; Smith B; Case LE; Boggs T; Amarasekara S; Austin SL; Pendyal S; El-Gharbawy A; Deak KL; Muir AJ; Kishnani PS. A retrospective longitudinal study and comprehensive review of adult patients with glycogen storage disease type III. Mol Genet Metab. 2021, 29, 100821.
- Fukuda T; Ito T; Hamazaki T; Inui A; Ishige M; Kagawa R; Sakai N; Watanabe Y; Kobayashi H; Wasaki Y; Taura J; Imamura Y; Tsukiuda T; Nakamura K. Blood glucose trends in glycogen storage disease type Ia: a cross-sectional study. J Inherit Metab Dis. 2023, 46, 618-633. [CrossRef]
- Chen ZY; Liu YP; Zheng GJ. Computed tomography and magnetic resonance imaging features of primary and secondary hepatic glycogenosis. Ann Hepatol. 2018, 17, 903-905. [CrossRef]
- Sakamoto A; Hayashi H; Sakamoto I; Isomoto I; Eguchi S; Takatsuki M; Kanematsu T; Abe K; Hayashi T; Uetani M. Multiple hepatocellular adenomas in a patient with glycogen storage disease type I: various enhancement patterns in MRI with Gd-EOB-DTPA. Abdom Imaging. 2012, 37, 239-243. [CrossRef]
- Li X; Jing H; Cheng L; Xia J; Wang J; Li Q; Liu C; Cai P. A case study of glycogen storage disease type Ia presenting with multiple hepatocellular adenomas: an analysis by gadolinium ethoxybenzyl-diethylenetriamine-pentaacetic acid magnetic resonance imaging. Quant Imaging Med Surg. 2021, 11, 2785-2791. [CrossRef]
- Baheti AD; Yeh MM; O’Malley R; Lalwani N. Malignant transformation of hepatic adenoma in glycogen storage disease type-1a: report of an exceptional case diagnosed on surveillance imaging. J Clin Imaging Sci. 2015, 5, 47. [CrossRef]
- Moon JCC; Mundy; Lee PJ; Mohiaddin RH; Pennell DJ. Myocardial fibrosis in glycogen storage disease type III. Circulation. 2003, 107, e47.
- Salemi VM; Demarchi LM; Cabeda EV; Wagenführ J; Tanaka AC. Type III glycogen storage disease mimicking hypertrophic cardiomyopathy. Eur Heart J Cardiovasc Imaging 2012, 13, 197. [CrossRef]
- Wang J; Pu L; Han Y; Chen Y. Glycogen storage disease with massive left ventricular hypertrophy and increased native T1: a case report. Eur Heart J Case Rep. 2023, 7, 1-5.
- Kishnani PS; Sun B; Koebberl D. Gene therapy for glycogen storage diseases. HumMol Genet. 2019, 28(R1), R31-41.
- Hricak H; Crooks L; Sheldon P; Haufman L. Nuclear magnetic resonance imaging of the kidney. Radiology. 1983, 146, 425-432. [CrossRef]
- Hidaka F; Amano Y; Takahama K; Takagi R; Murakami R; Onozawa S; Kumita S. Assessment of renal impairment by non-contrast-enhanced conventional magnetic resonance imaging: comparison with ⁹⁹mTc-DTPA renography. Jpn J Radiol. 2011, 29, 378-385. [CrossRef]
- Abdel-Aty H; Simonetti O; Friedrich MG. T2-weighted cardiovascular magnetic resonance imaging. J Magn Reson Imaging. 2007, 26, 452-459.
- Inchingolo R; Faletti R; Grazioli L; Tricarico E; Gatti M; Percorelli A; Ippolito D. MR with Gd-EOB-DTPA in assessment of liver nodules in cirrhotic patients. World J Hepatol. 2018, 10, 462-473. [CrossRef]
- Bianchi L. Glycogen storage disease I and hepatocellular tumors. Eur J Pediatr. 1993, 152 Suppl 1, S63-70. [CrossRef]
- Tobaly D; Laforet P; Perry A; Habes D; Labrune P; Decostre V; Masingue M, Petit F; Barp A; Bello L; Carlier P; Carlier RY. Whole-body muscle magnetic resonance imaging in glycogen-storage disease type III. Muscle Nerve. 2019, 60, 72-79. [CrossRef]
- Amano Y; Kitamura M; Takano H; Yanagisawa F; Tachi M; Suzuki Y; Kumita S; Takayama M. Cardiac MR imaging of hypertrophic cardiomyopathy: techniques, findings, and clinical relevance. Magn Reson Med Sci. 2018, 17, 120-131. [CrossRef]
- Calabro D; Costa F; Versace AG; Micari A; Aquaro GD; Di Bella G. Cardiac magnetic resonance in HCM phenocopies: from diagnosis to risk stratification and therapeutic management. J Clin Med. 2023, 12, 3481. [CrossRef]
- van Zijl PCM; Lam WW; Xu J; Knutsson L; Stanisz GJ. Magnetization transfer contrast and chemical exchange saturation transfer MRI. features and analysis of the field-dependent saturation spectrum. Neuroimage. 2018, 168, 222-241. [CrossRef]
- Heinicke K; Dimitrov IE; Romain N; Cheshkov S; Ren J; Malloy CR; Haller RG. Reproducibility and absolute quantification of muscle glycogen in patients with glycogen storage disease by 13C NMR spectroscopy at 7 tesla. PLoS. One 2014, 9, e108706.
- Shimizu K, Namimoto T, Nakagawa M, Morita K, Oda S, Nakaura T, Utsunomiya D, Yamashita Y. Hepatic fat quantification using automated six-point Dixon: comparison with conventional chemical shift based sequences and computed tomography. Clin Imaging. 2017, 45, 111-117. [CrossRef]
- Rutherford E; Talle MA; Mangion K; Bell E; Rauhalammi SM; Roditi G; McComb C, Radjenovic A, Welsh P, Woodward R, Struthers AD, Jardine AG, Patel RK, Berry C, Mark PB. Defining myocardial tissue abnormalities in end-stage renal failure with cardiac magnetic resonance imaging using native T1 mapping. Kidney Int. 2016, 90, 845-852. [CrossRef]
- Fujita S; Sano K; Cruz G; Fukumura Y; Kawasaki H; Fukunaga I; Morita Y; Yoneyama M; Kamagata K; Abe O; Ikejima K; Botnar RM; Prieto C; Aoki S. MR fingerprinting for liver tissue characterization: a histopathologic correlation study. Radiology 2023, 306, 150-159. [CrossRef]
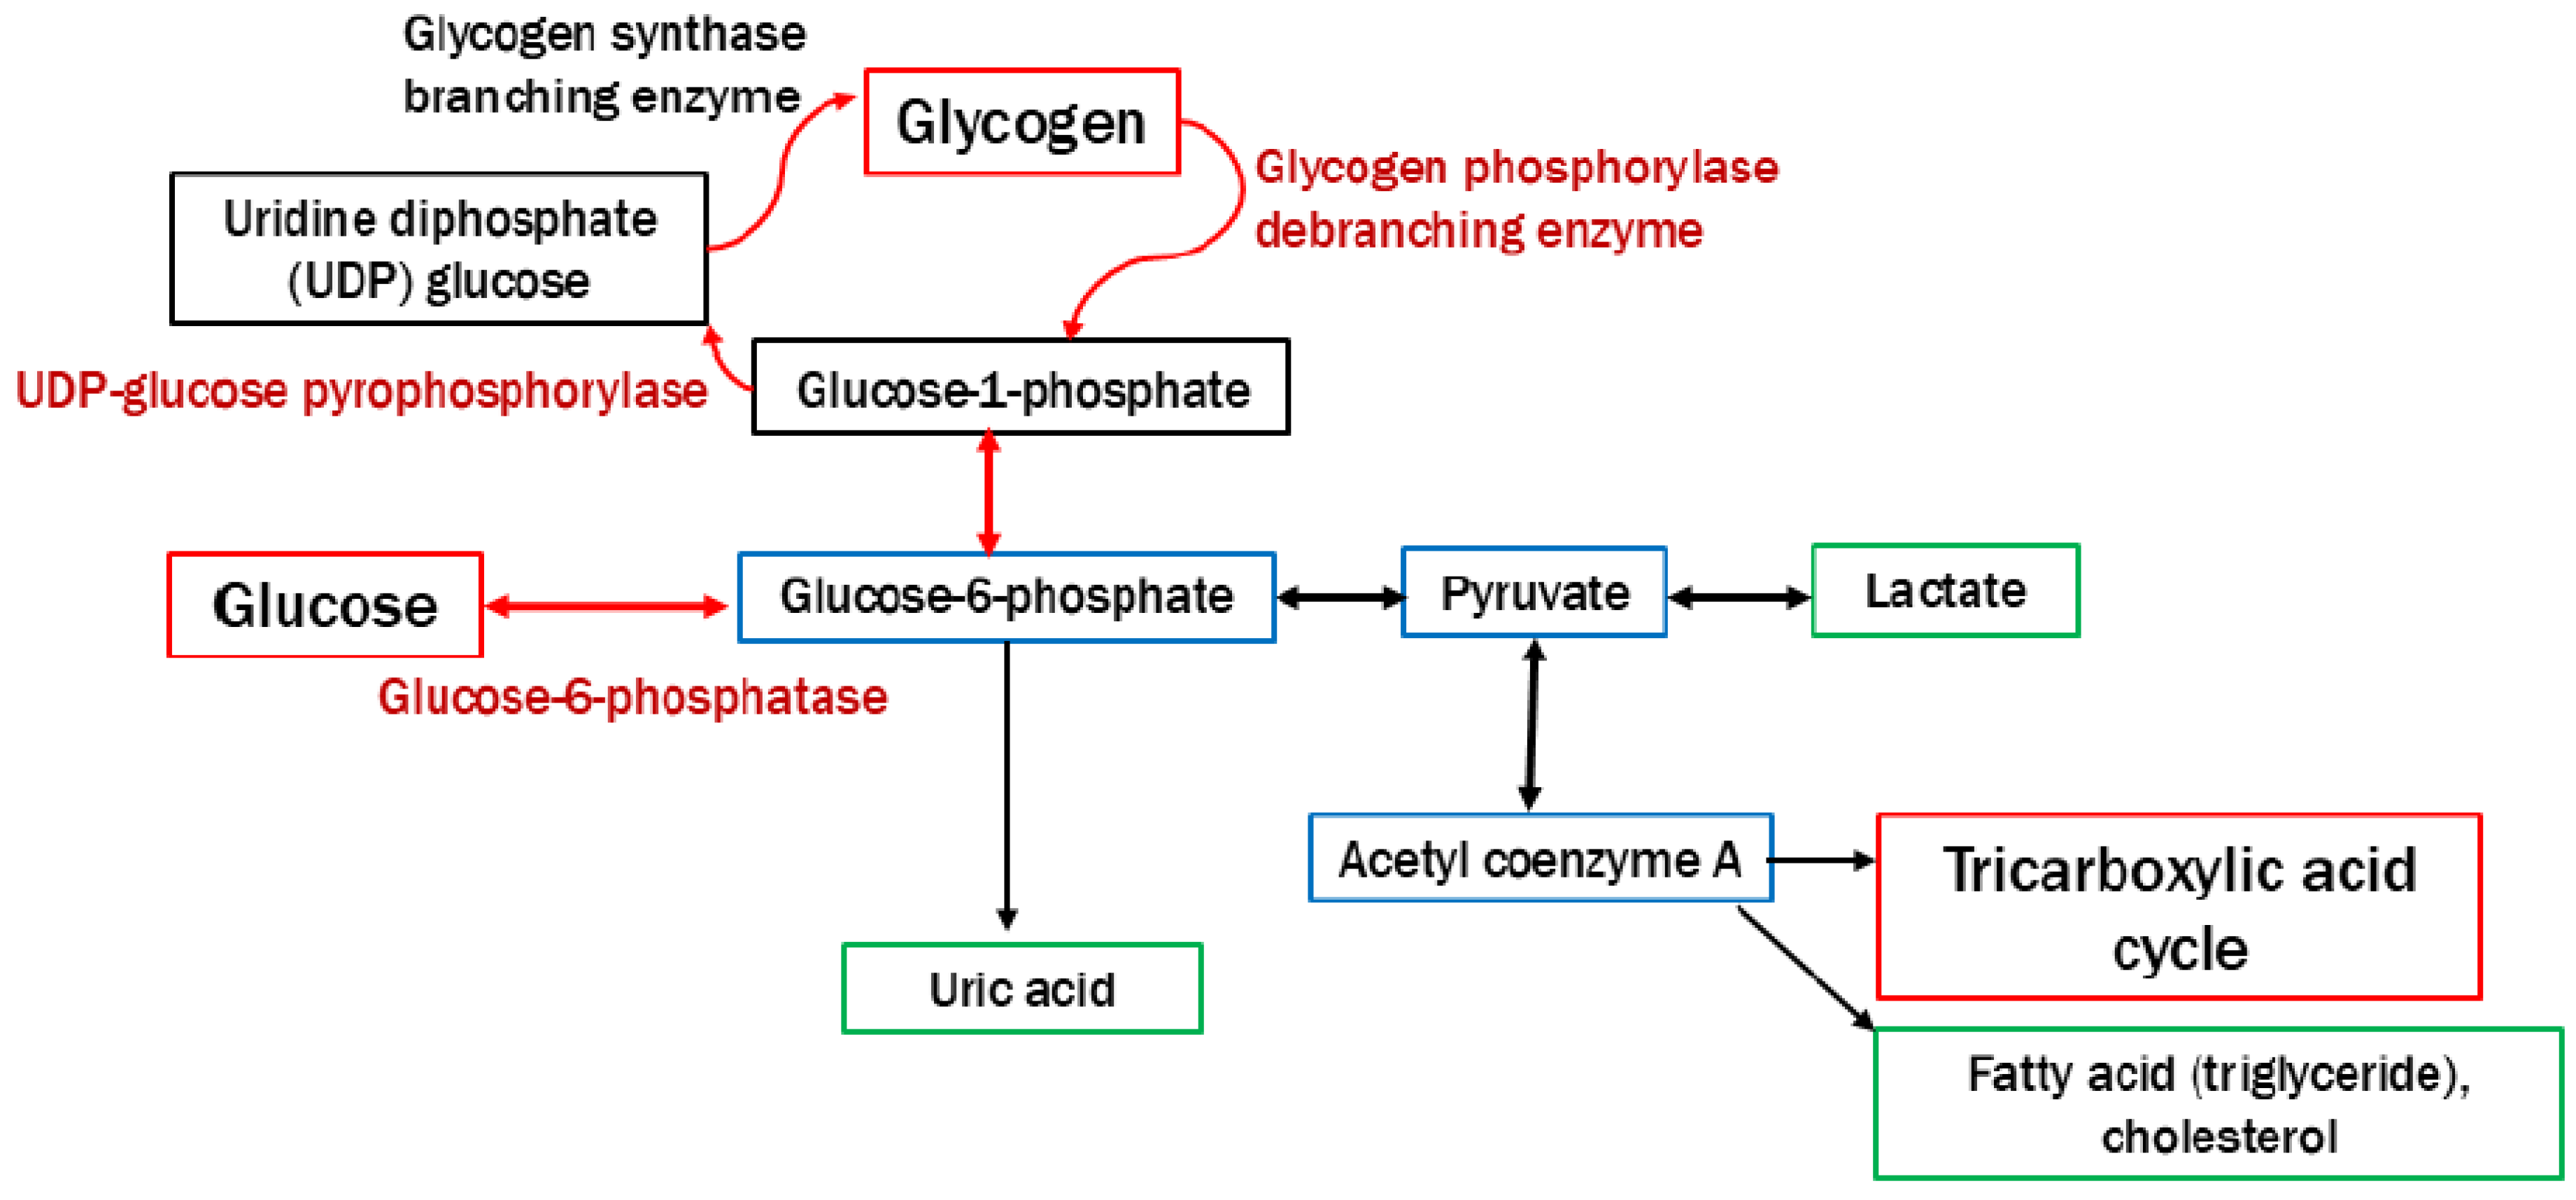
Figure 1.
Pathway of glycogen synthesis and degradation. The roles of glycogen are the disposal of excess glucose and the provision of energy during fasting or physical activity. The deficiency of enzymes and transporters leads to the abnormal accumulation of glycogen in multiple organs.
Figure 1.
Pathway of glycogen synthesis and degradation. The roles of glycogen are the disposal of excess glucose and the provision of energy during fasting or physical activity. The deficiency of enzymes and transporters leads to the abnormal accumulation of glycogen in multiple organs.
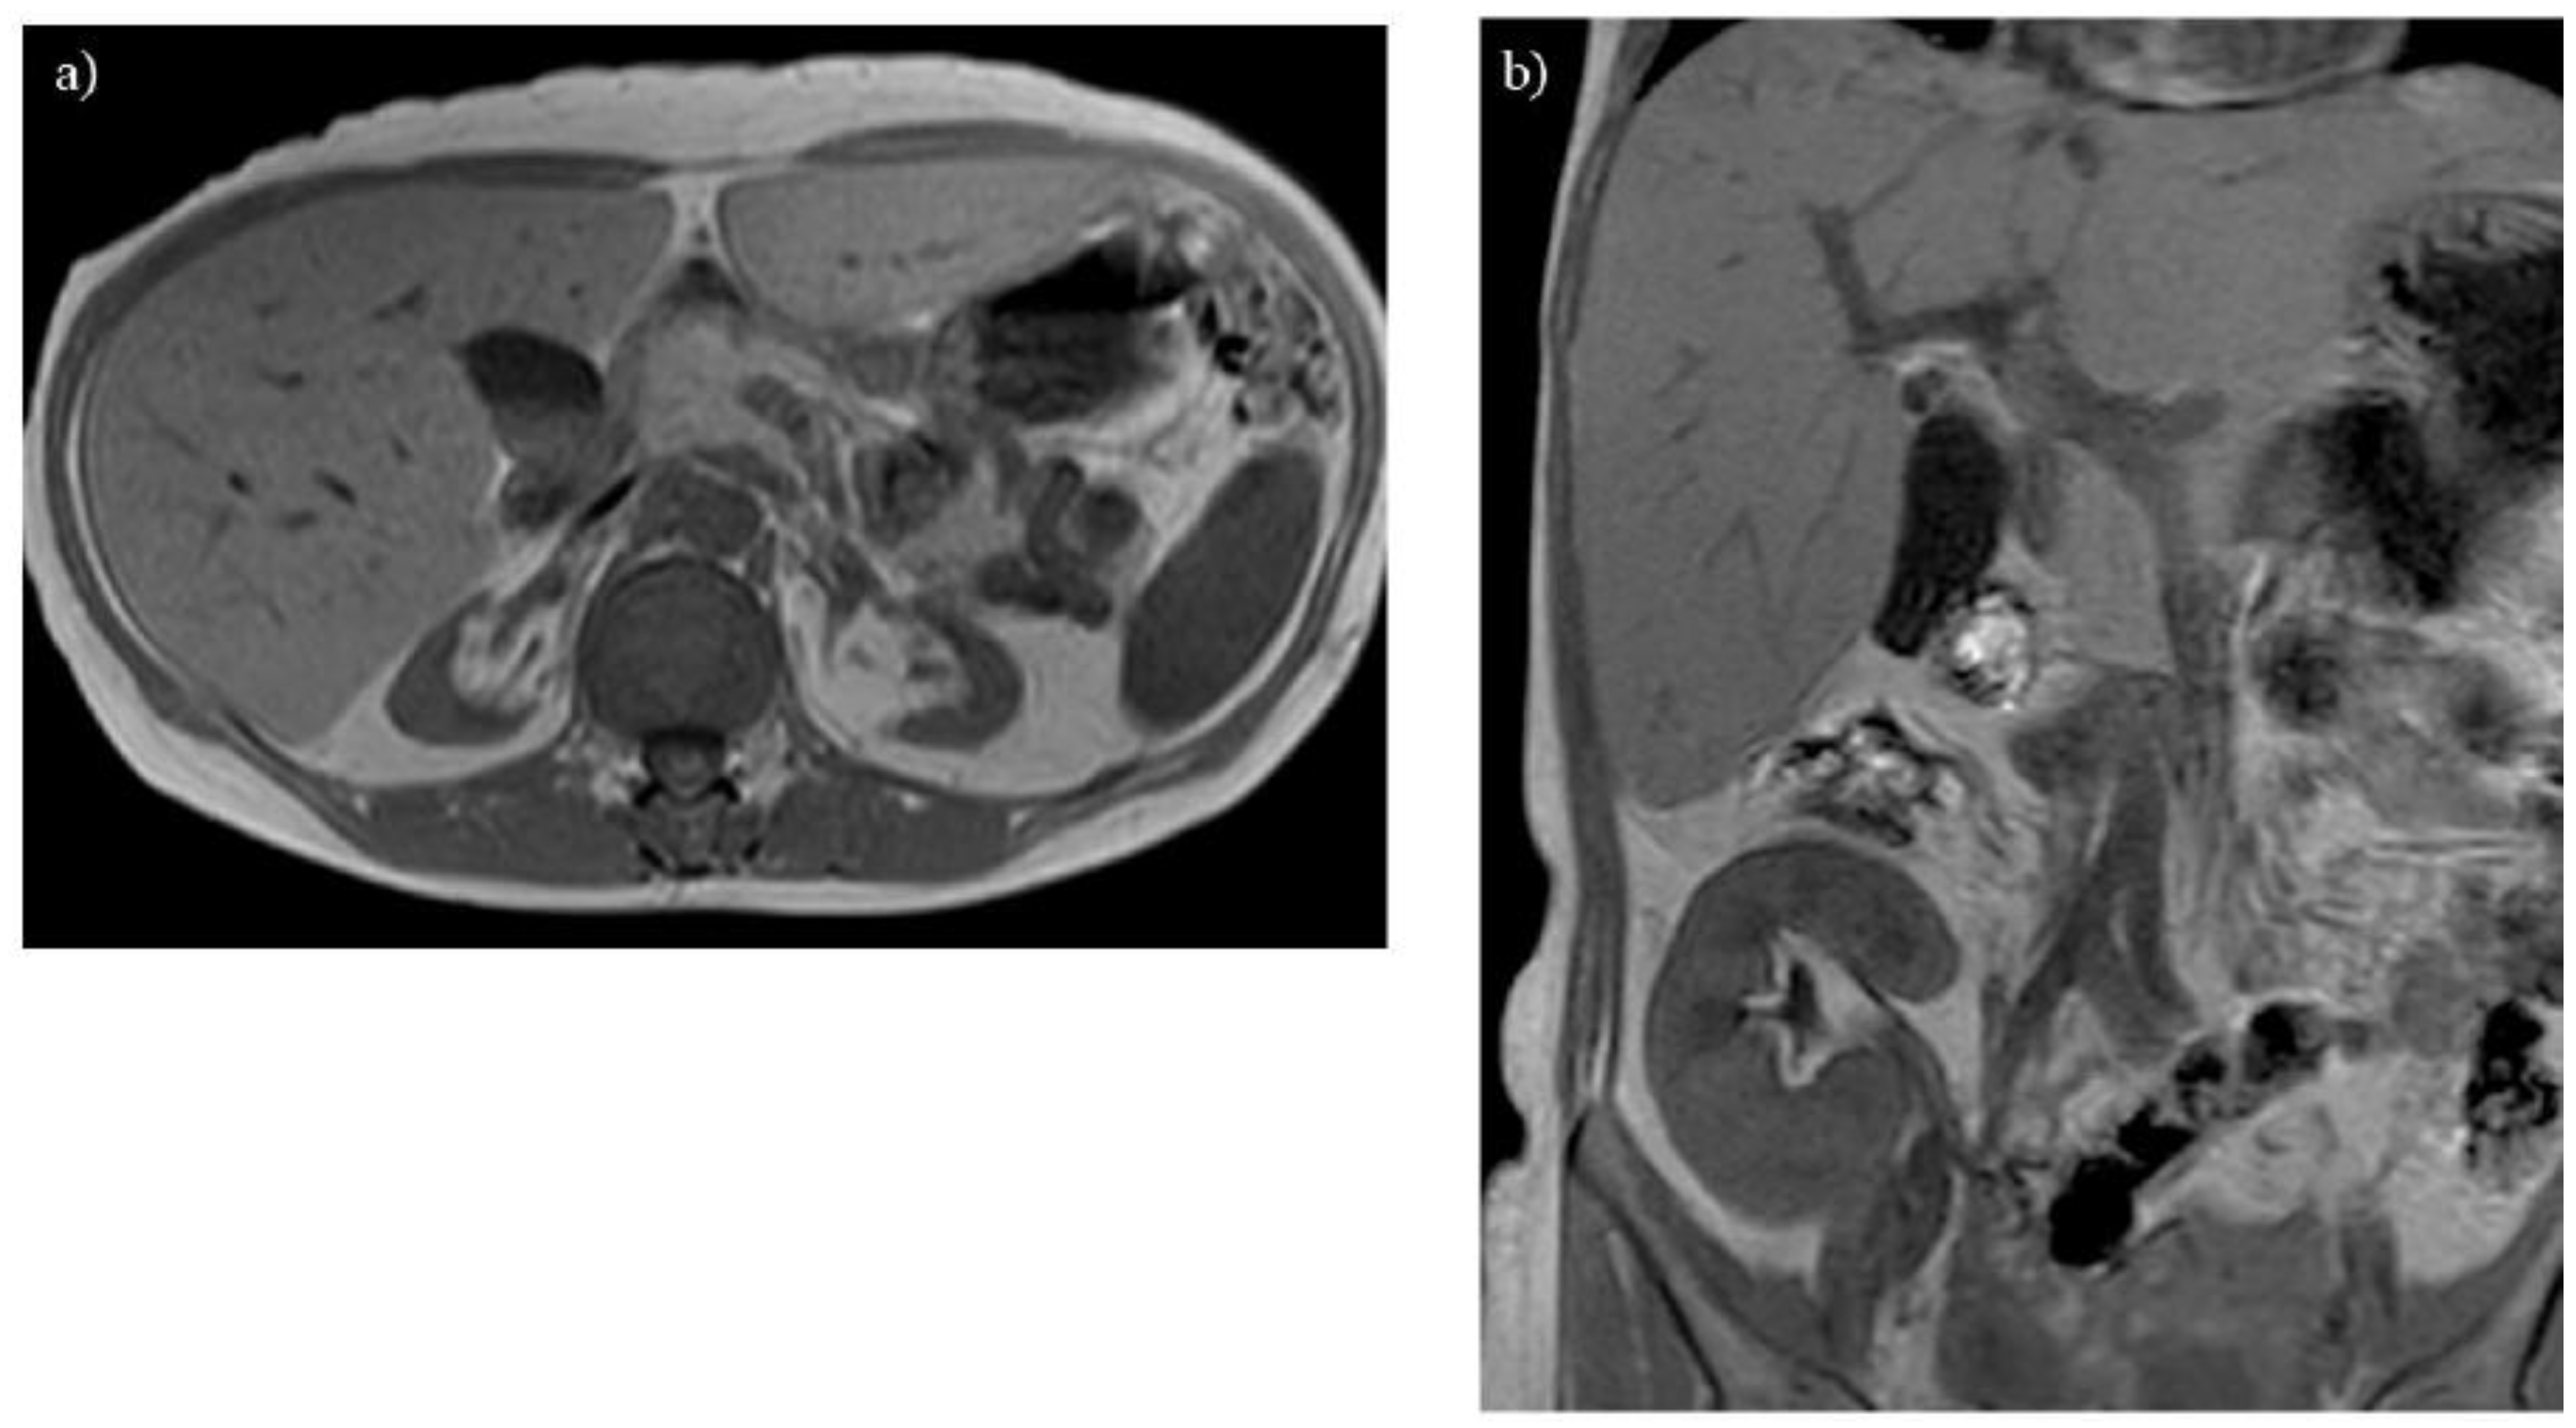
Figure 2.
Renal atrophy is observed on T1-weighted imaging in a 40-year-old woman with glycogen storage disease type Ia. The atrophic kidneys lose corticomedullary contrast on T1-weighted imaging (A). A transplanted kidney shows normal corticomedullary contrast on T1-weighted imaging (B).
Figure 2.
Renal atrophy is observed on T1-weighted imaging in a 40-year-old woman with glycogen storage disease type Ia. The atrophic kidneys lose corticomedullary contrast on T1-weighted imaging (A). A transplanted kidney shows normal corticomedullary contrast on T1-weighted imaging (B).
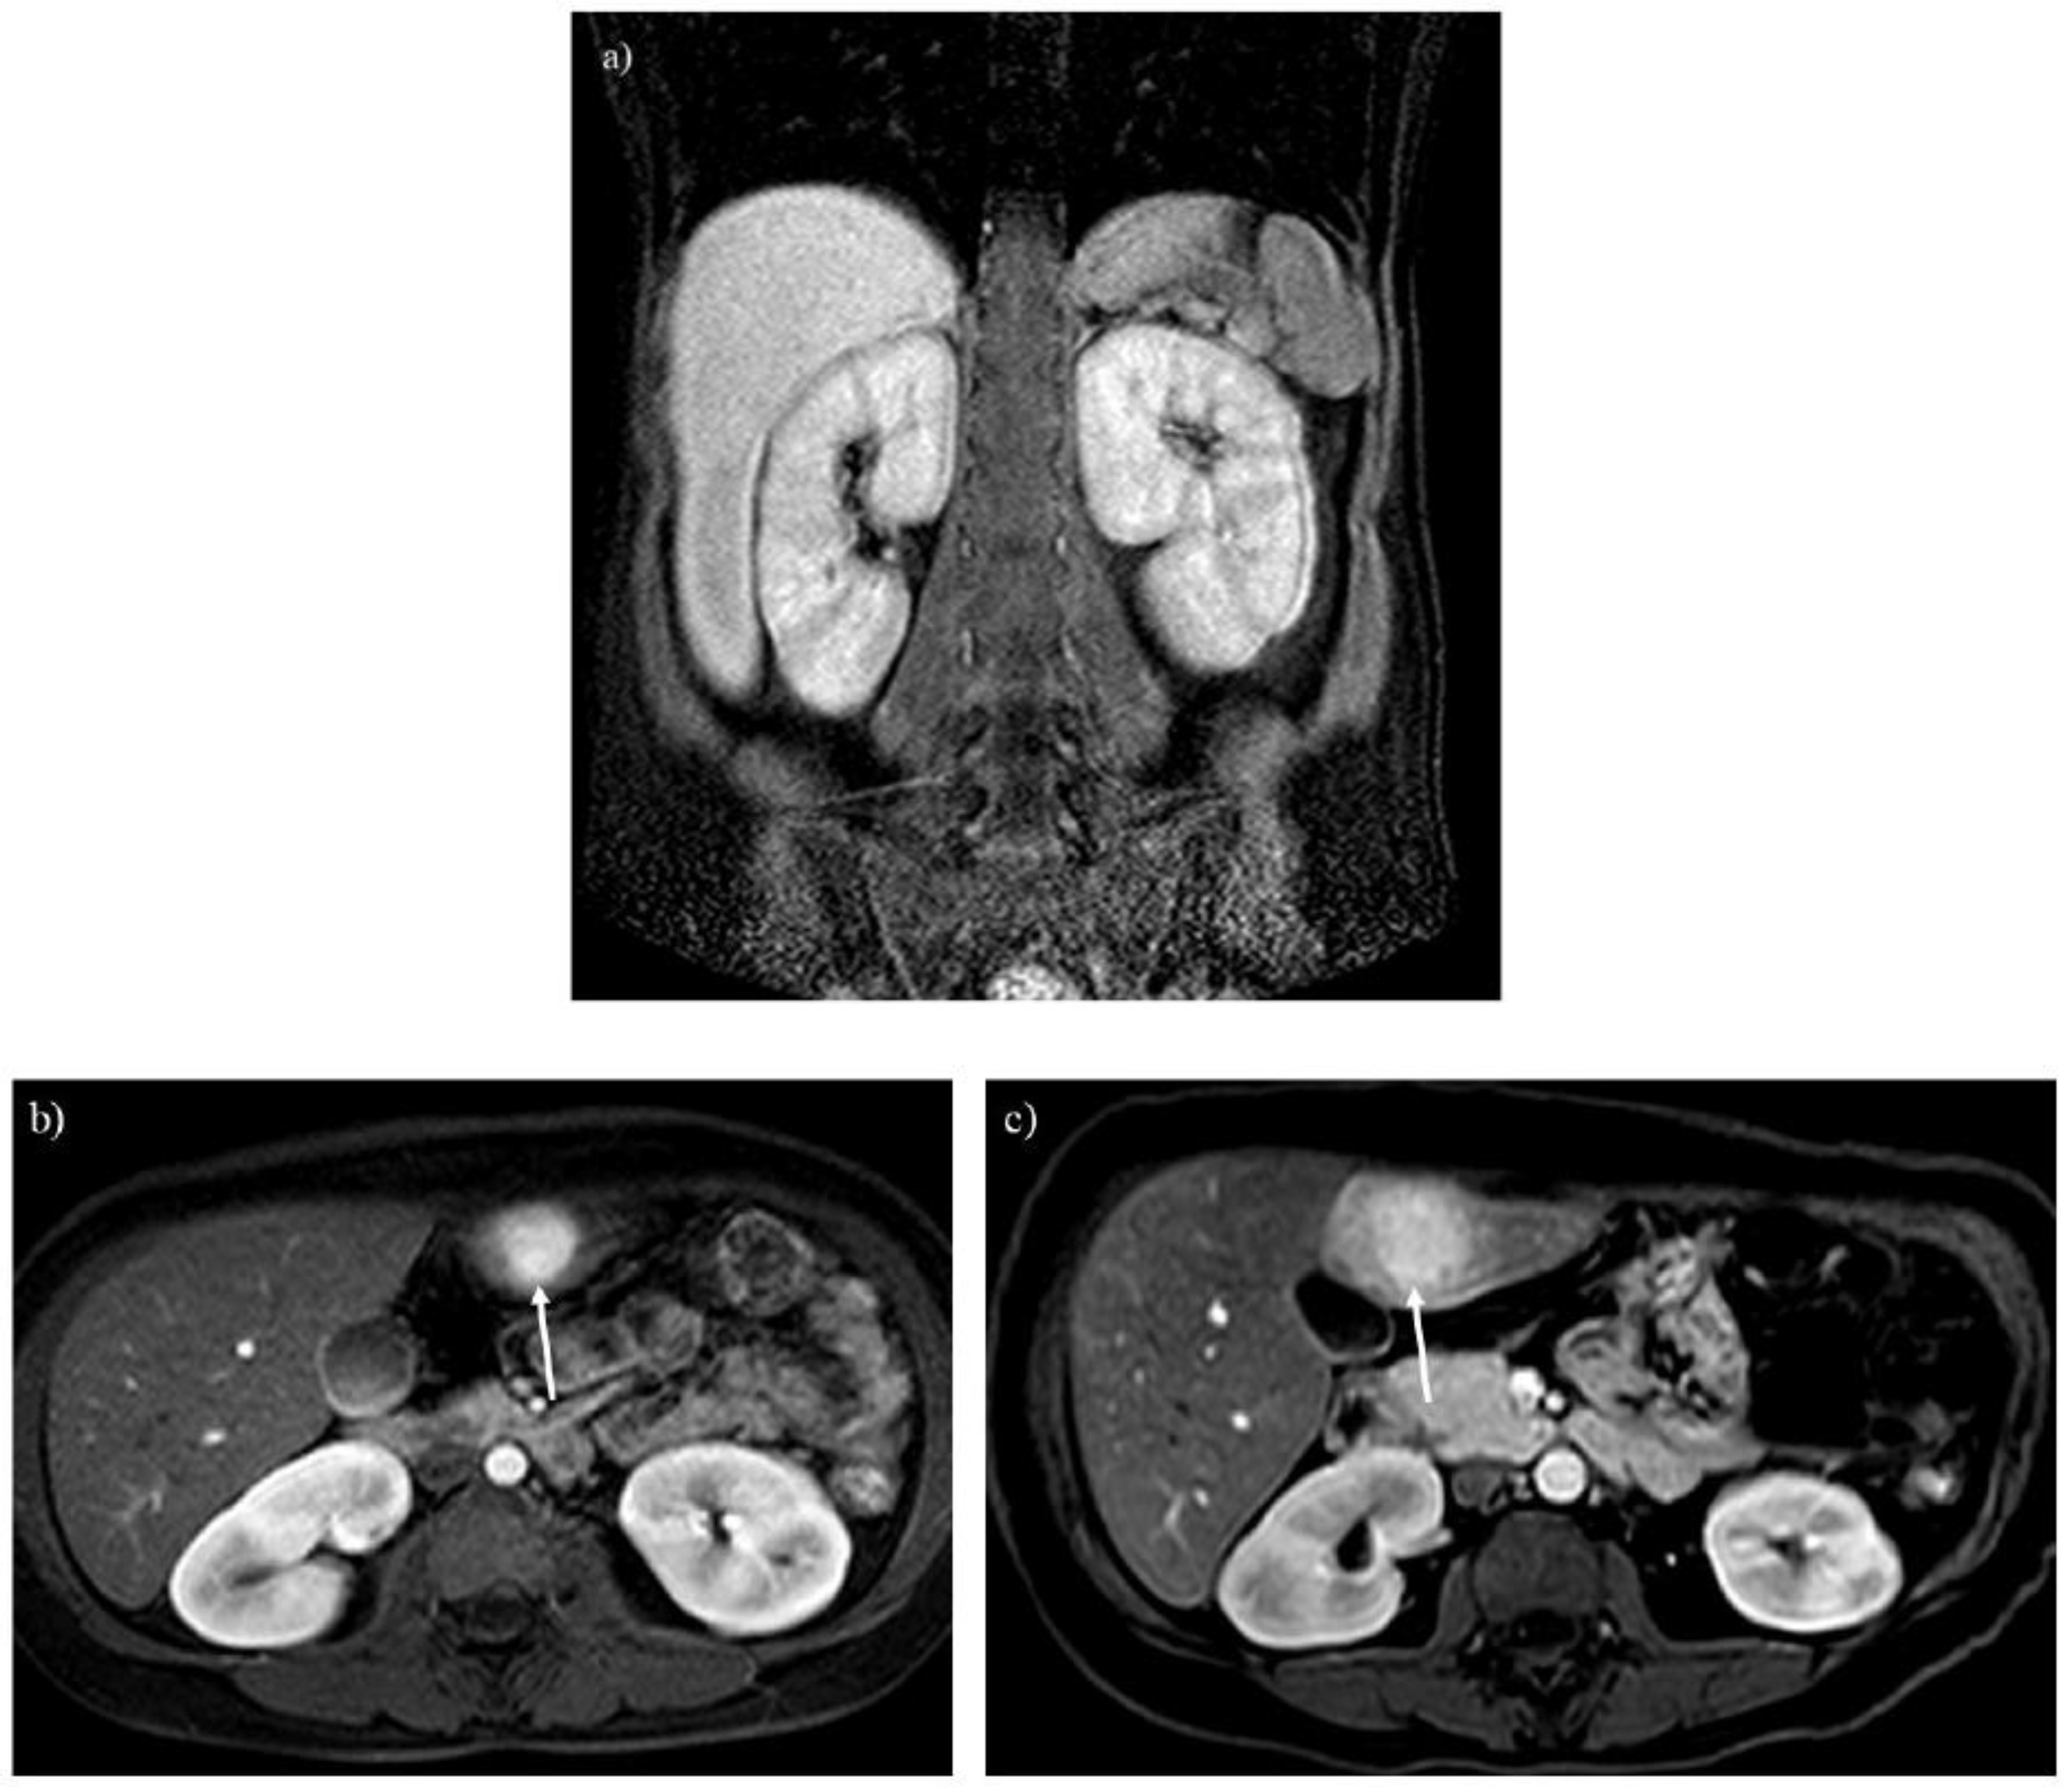
Figure 3.
A 20-year-old woman with glycogen storage disease type Ia exhibiting enlargement of the kidney (A). Dynamic MRI (B) reveals a hepatic adenoma presenting strong enhancement in the arterial phase (arrow), and the tumor gradually enlarged over 13 years (C, arrow).
Figure 3.
A 20-year-old woman with glycogen storage disease type Ia exhibiting enlargement of the kidney (A). Dynamic MRI (B) reveals a hepatic adenoma presenting strong enhancement in the arterial phase (arrow), and the tumor gradually enlarged over 13 years (C, arrow).
Figure 4.
T2-weighted imaging (A) showed myocardial hypertrophy and edema in a 27-year-old man with glycogen storage disease type IIIa (arrow). He had undergone liver transplantation 8 years before. Late gadolinium enhancement (LGE) imaging (B) identifies a myocardial scar in the hypertrophied septum (arrow). The location of LGE is identical to that of myocardial edema (A, B; arrows). Progression of the myocardial scarring was observed at 30 years (C, arrow).
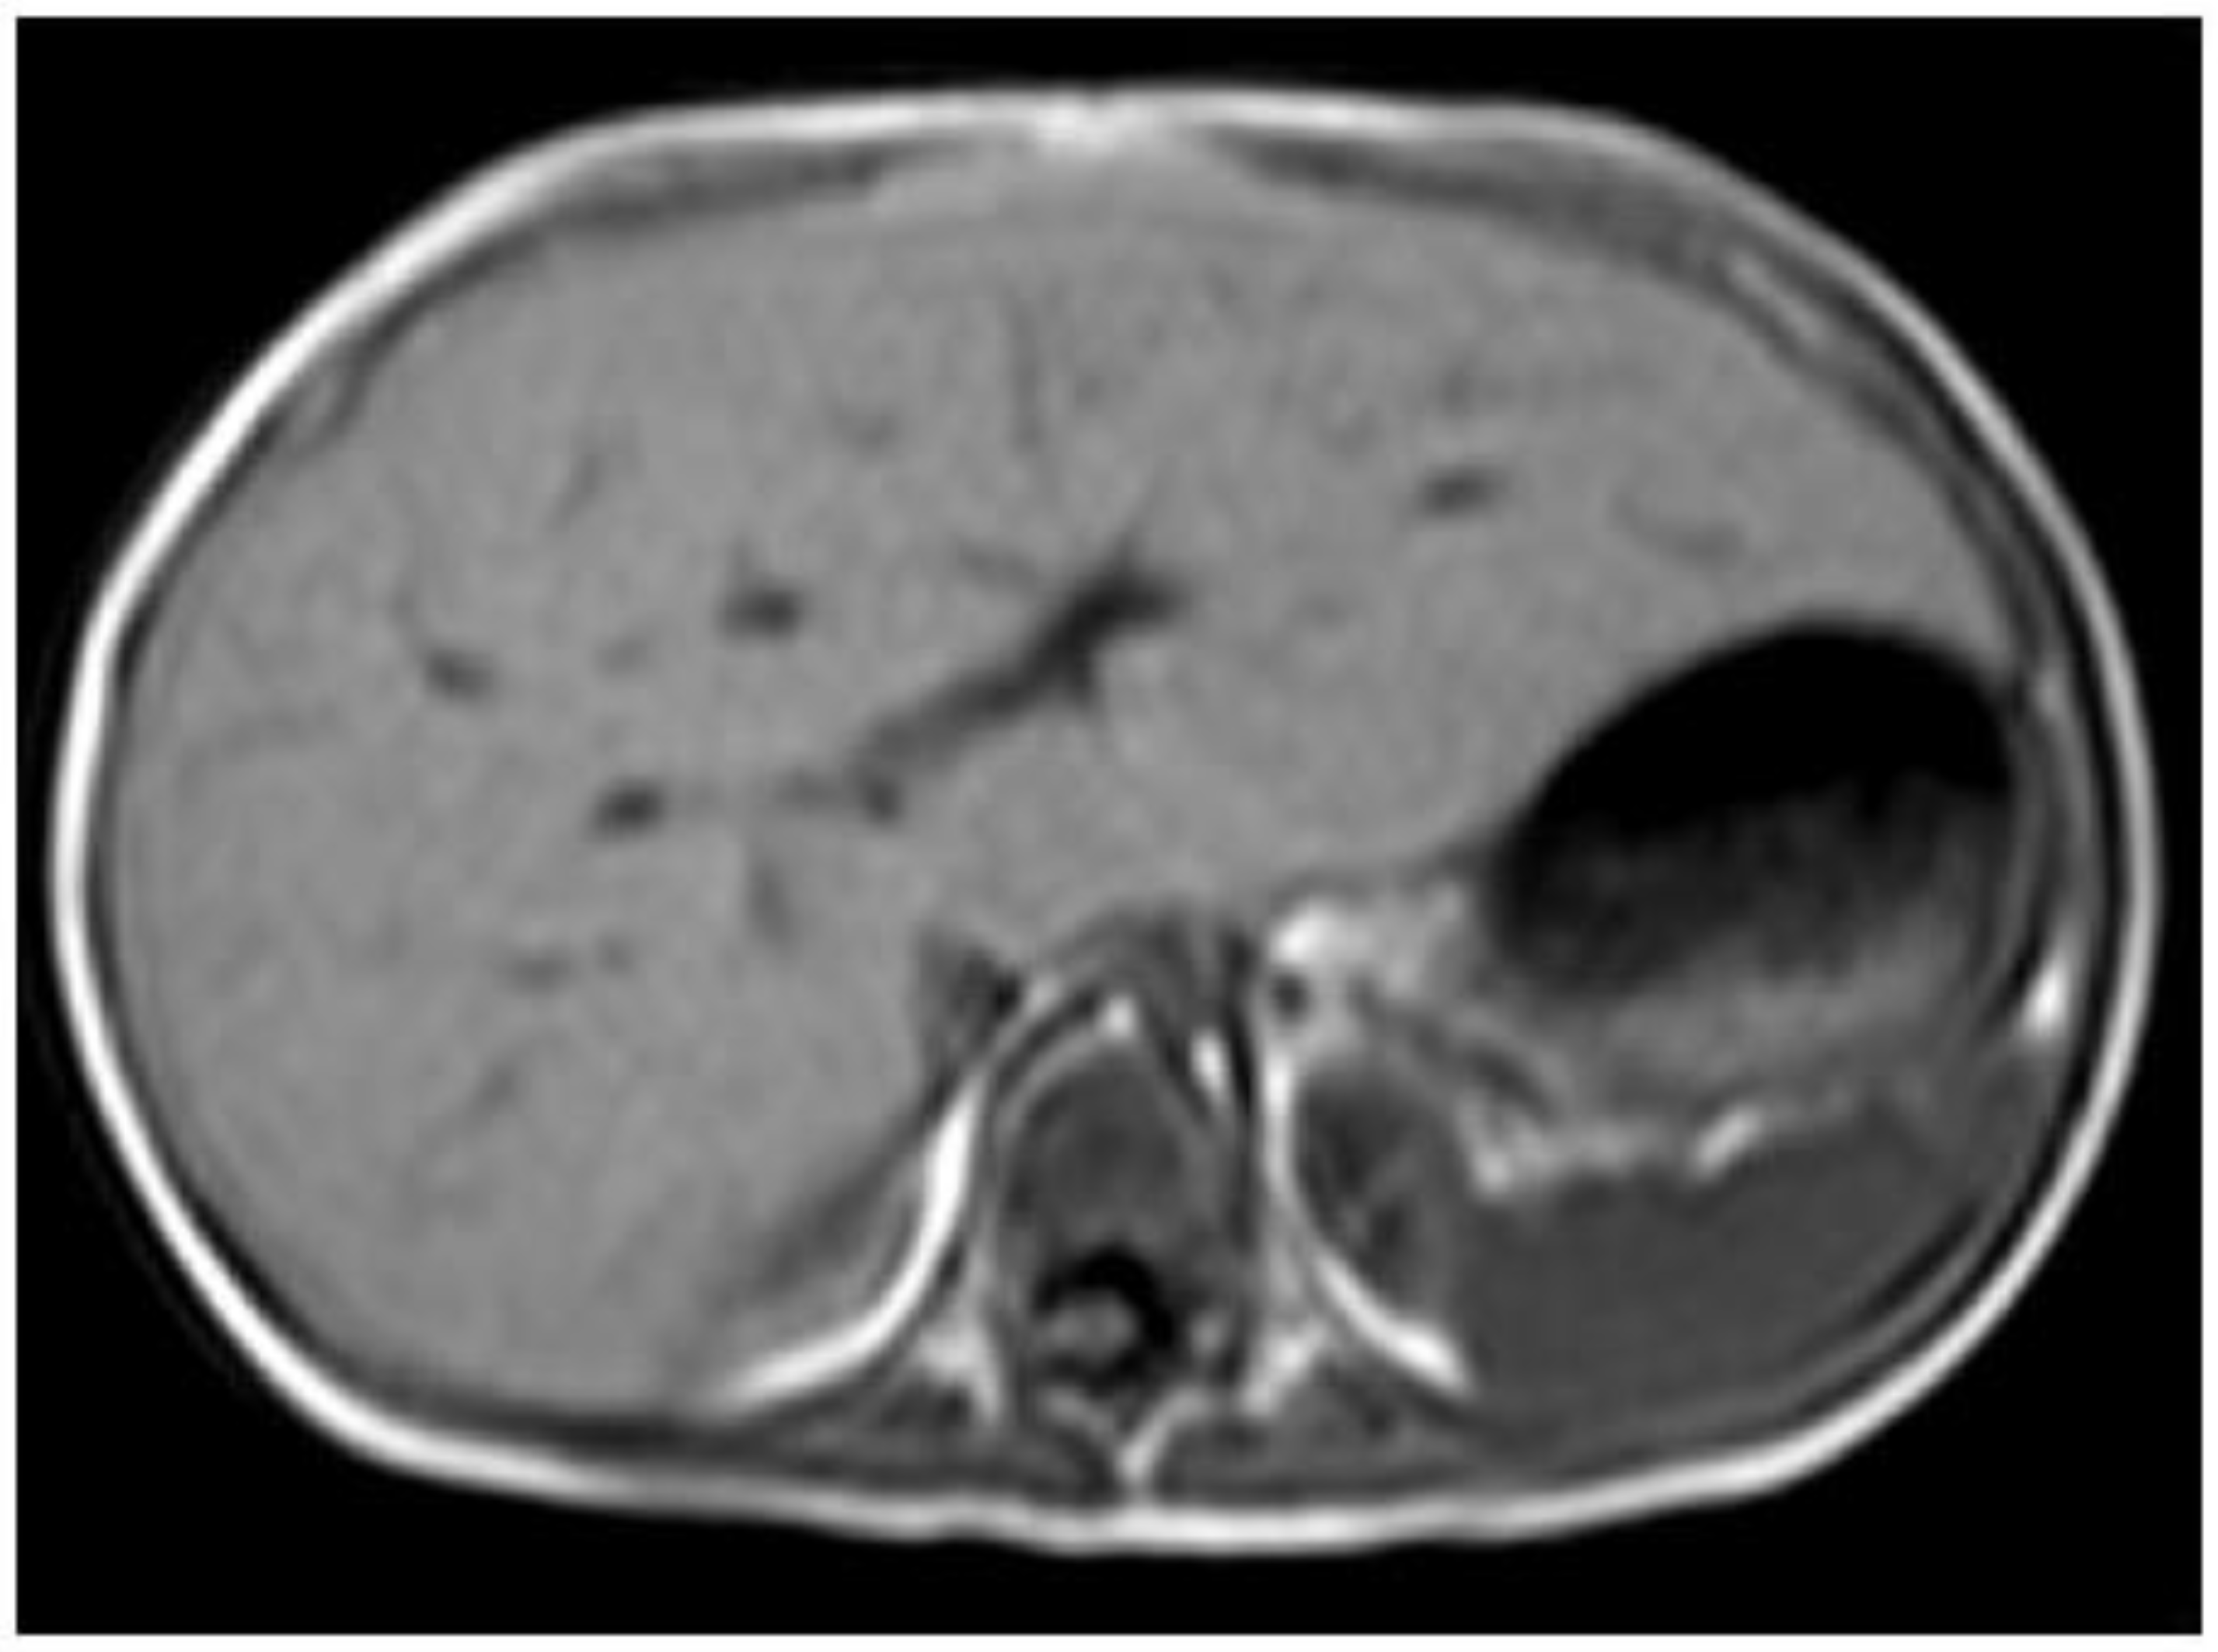
Figure 5.
A 3-year-old boy with glycogen storage disease type IXa presents hepatomegaly but not splenomegaly. This type is known to improve with aging.
Figure 5.
A 3-year-old boy with glycogen storage disease type IXa presents hepatomegaly but not splenomegaly. This type is known to improve with aging.
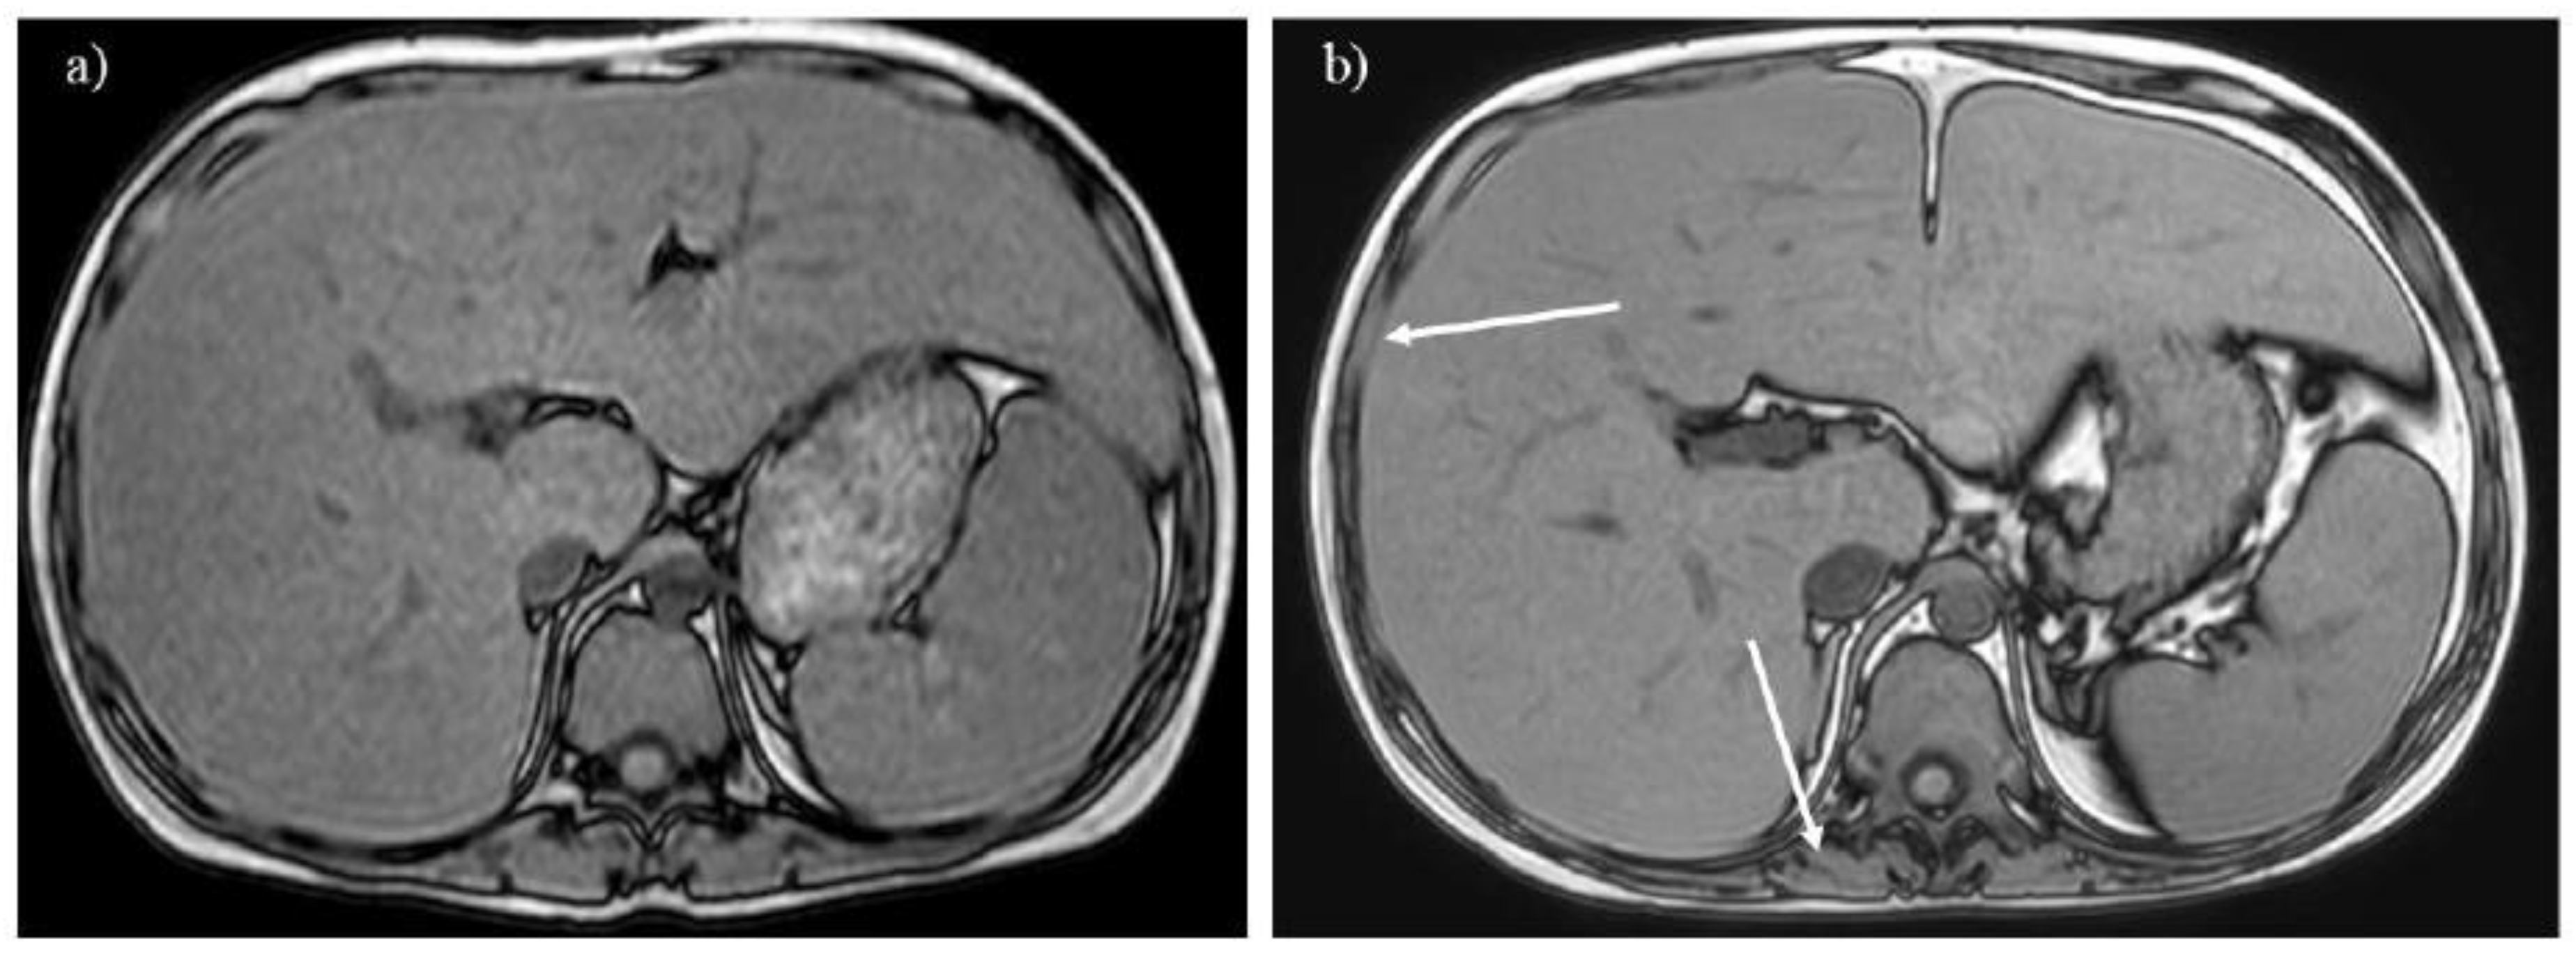
Figure 6.
A 16-year-old boy with glycogen storage disease type Ib. Opposed-phase T1-weighted imaging (A) reveals hepatosplenomegaly with a signal drop in the liver, suggesting hepatic steatosis. After 7 years, the liver signal normalizes, whereas the spinal erector and intercostal muscles do not grow fully (B, arrows). .
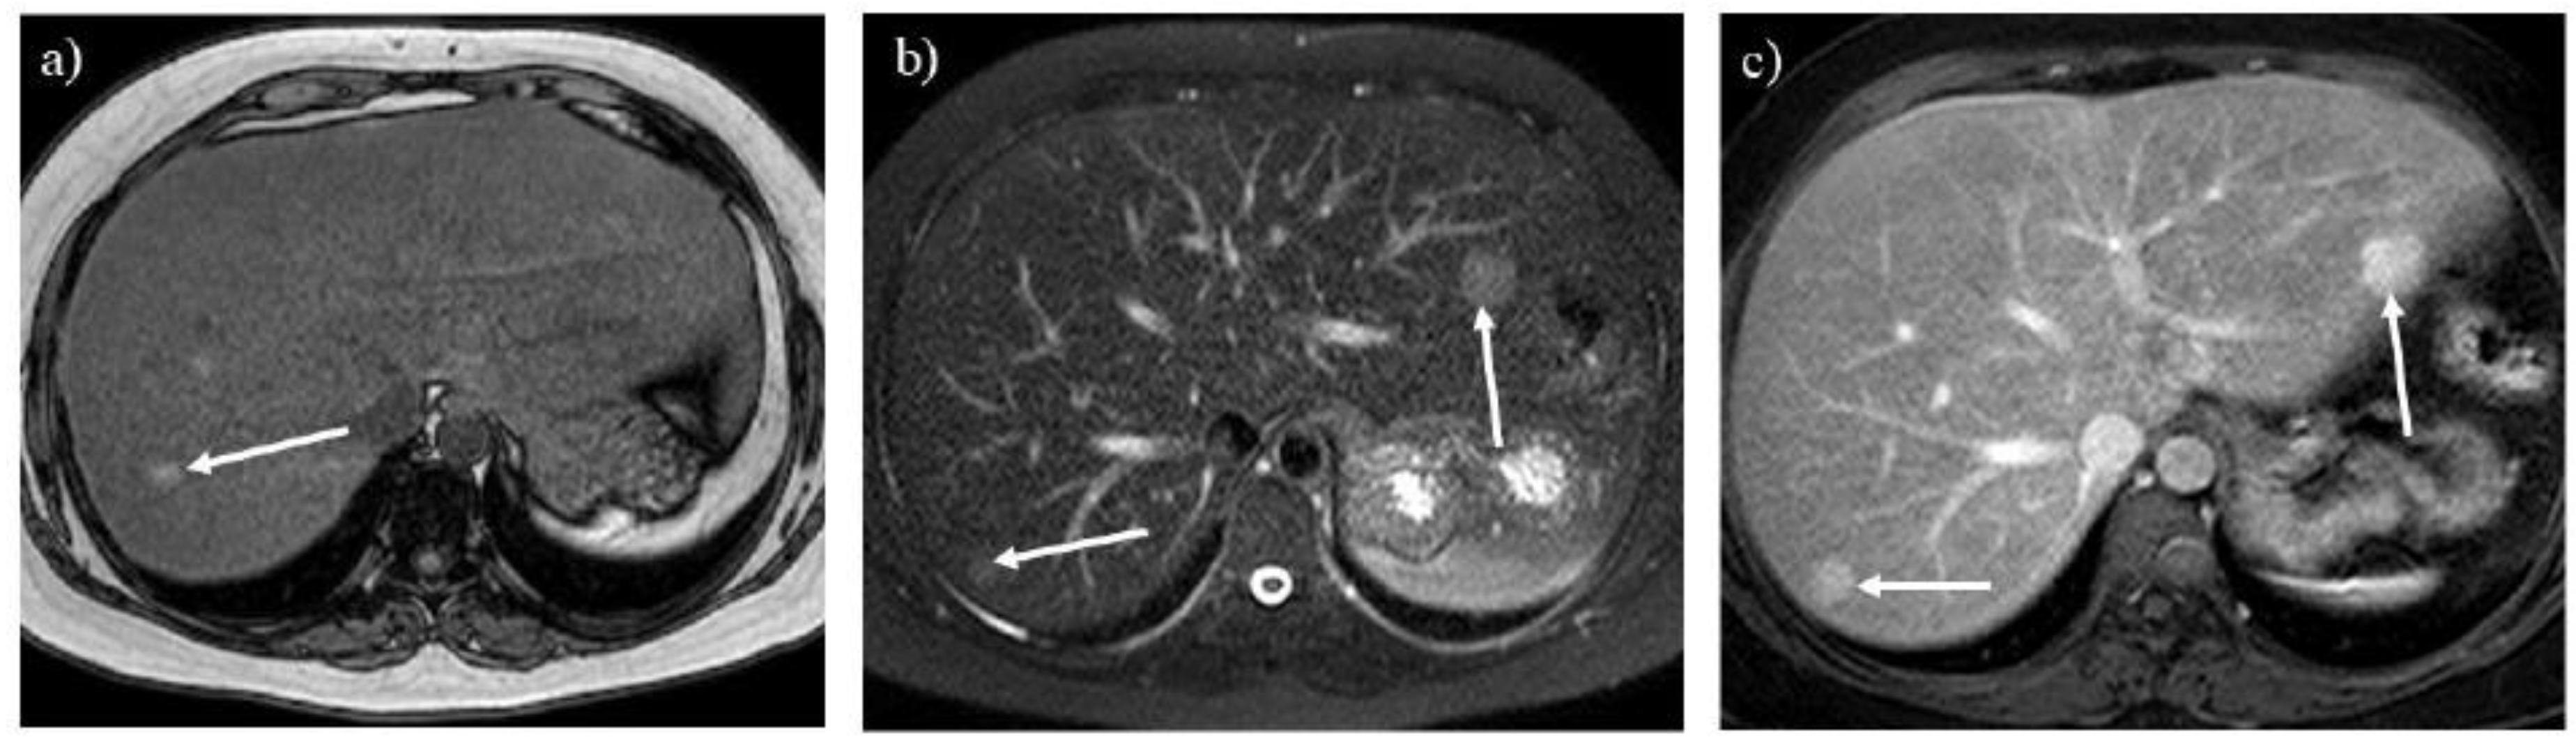
Figure 7.
Opposed-phase T1-weighted imaging (A) demonstrates hepatic steatosis and hepatic adenoma in a 31-year-old woman with glycogen storage disease type Ia (arrow). T2-weighted (B) and contrast-enhanced T1-weighted (C) imaging show hepatic adenomatosis (arrows).
Figure 7.
Opposed-phase T1-weighted imaging (A) demonstrates hepatic steatosis and hepatic adenoma in a 31-year-old woman with glycogen storage disease type Ia (arrow). T2-weighted (B) and contrast-enhanced T1-weighted (C) imaging show hepatic adenomatosis (arrows).
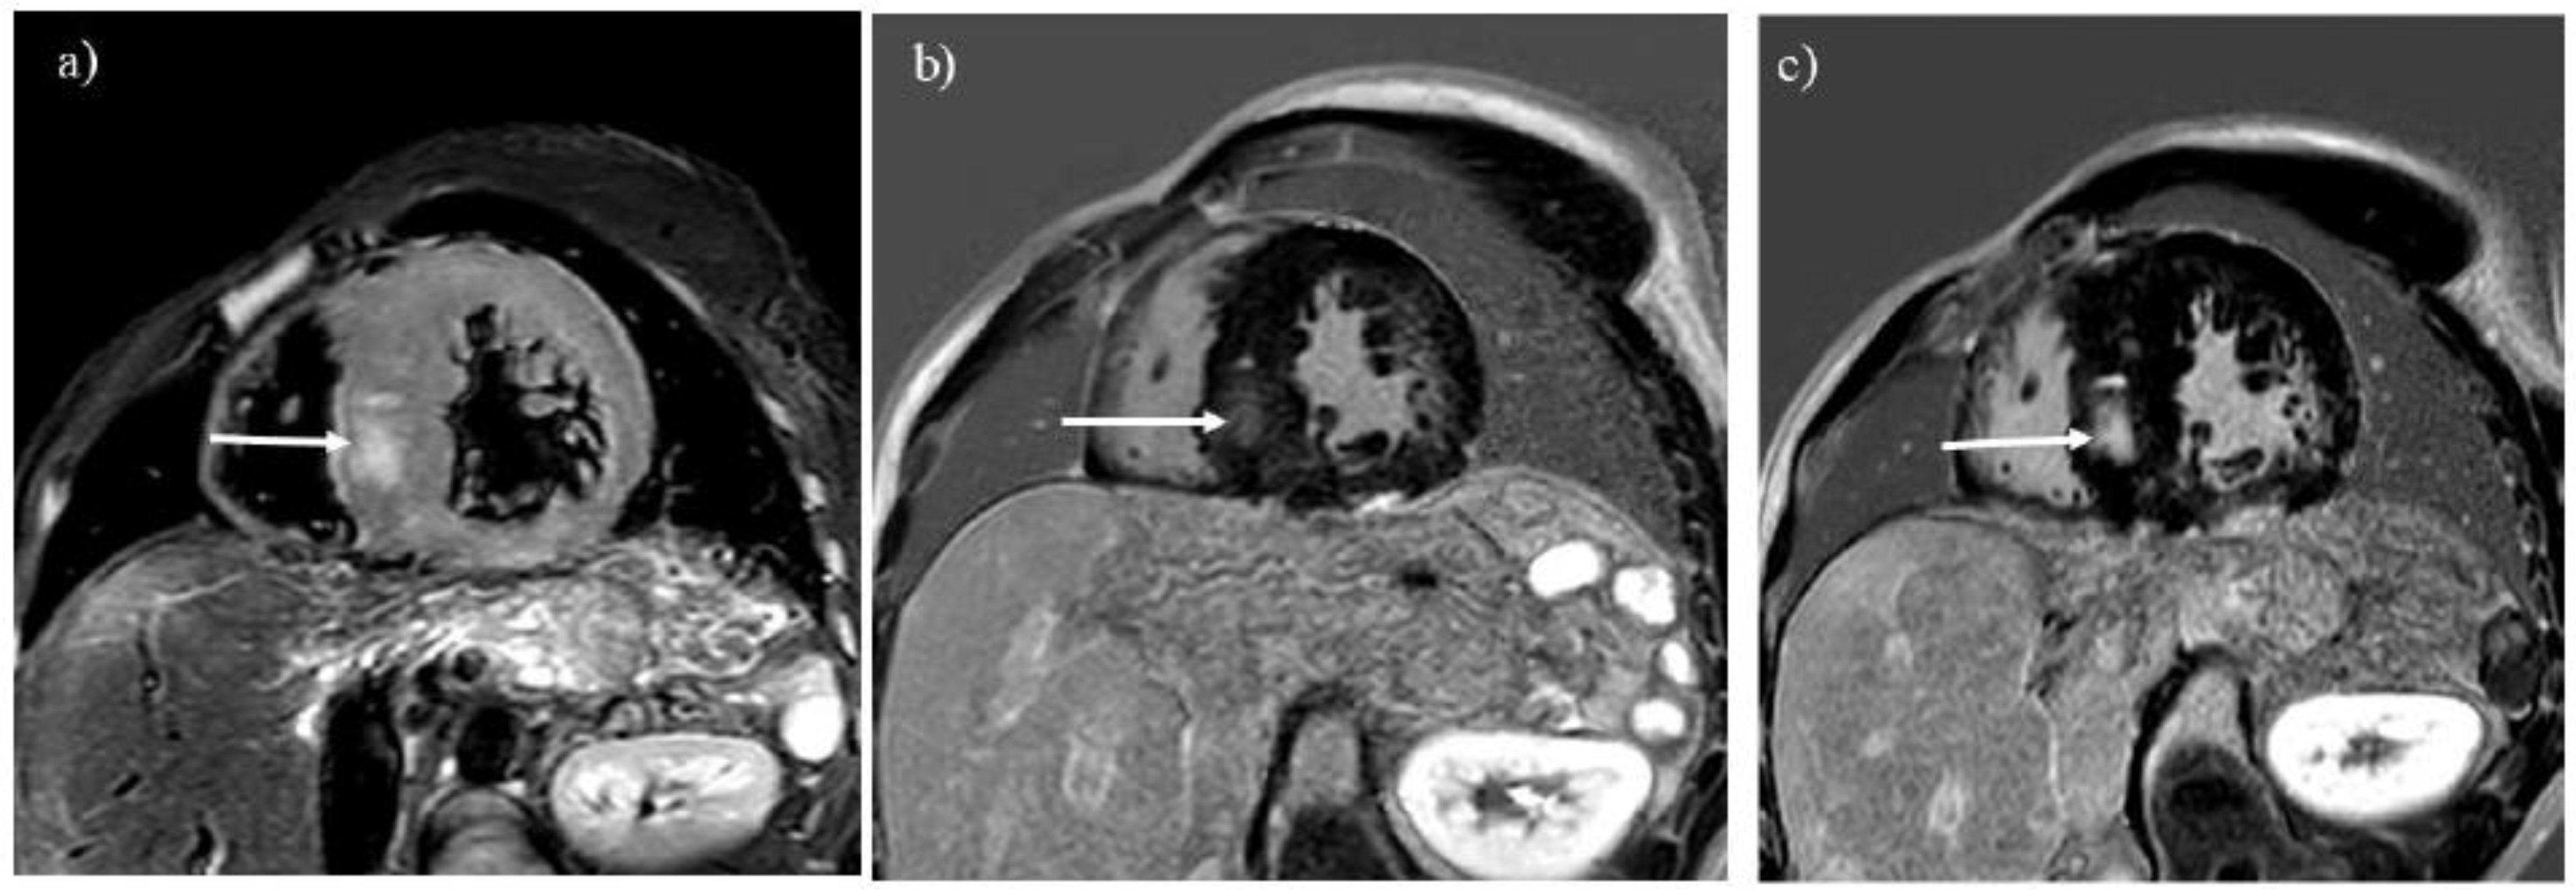
Figure 8.
A liver tumor shows high intensity on T2-weighted imaging (A) in a 55-year-old woman with glycogen storage disease type Ia (arrow). The tumor grew rapidly over 1 year (B, arrow). The tumor shows marked hyperintensity on diffusion-weighted imaging (C, arrow), which is pathologically proven to be a hepatocellular carcinoma.
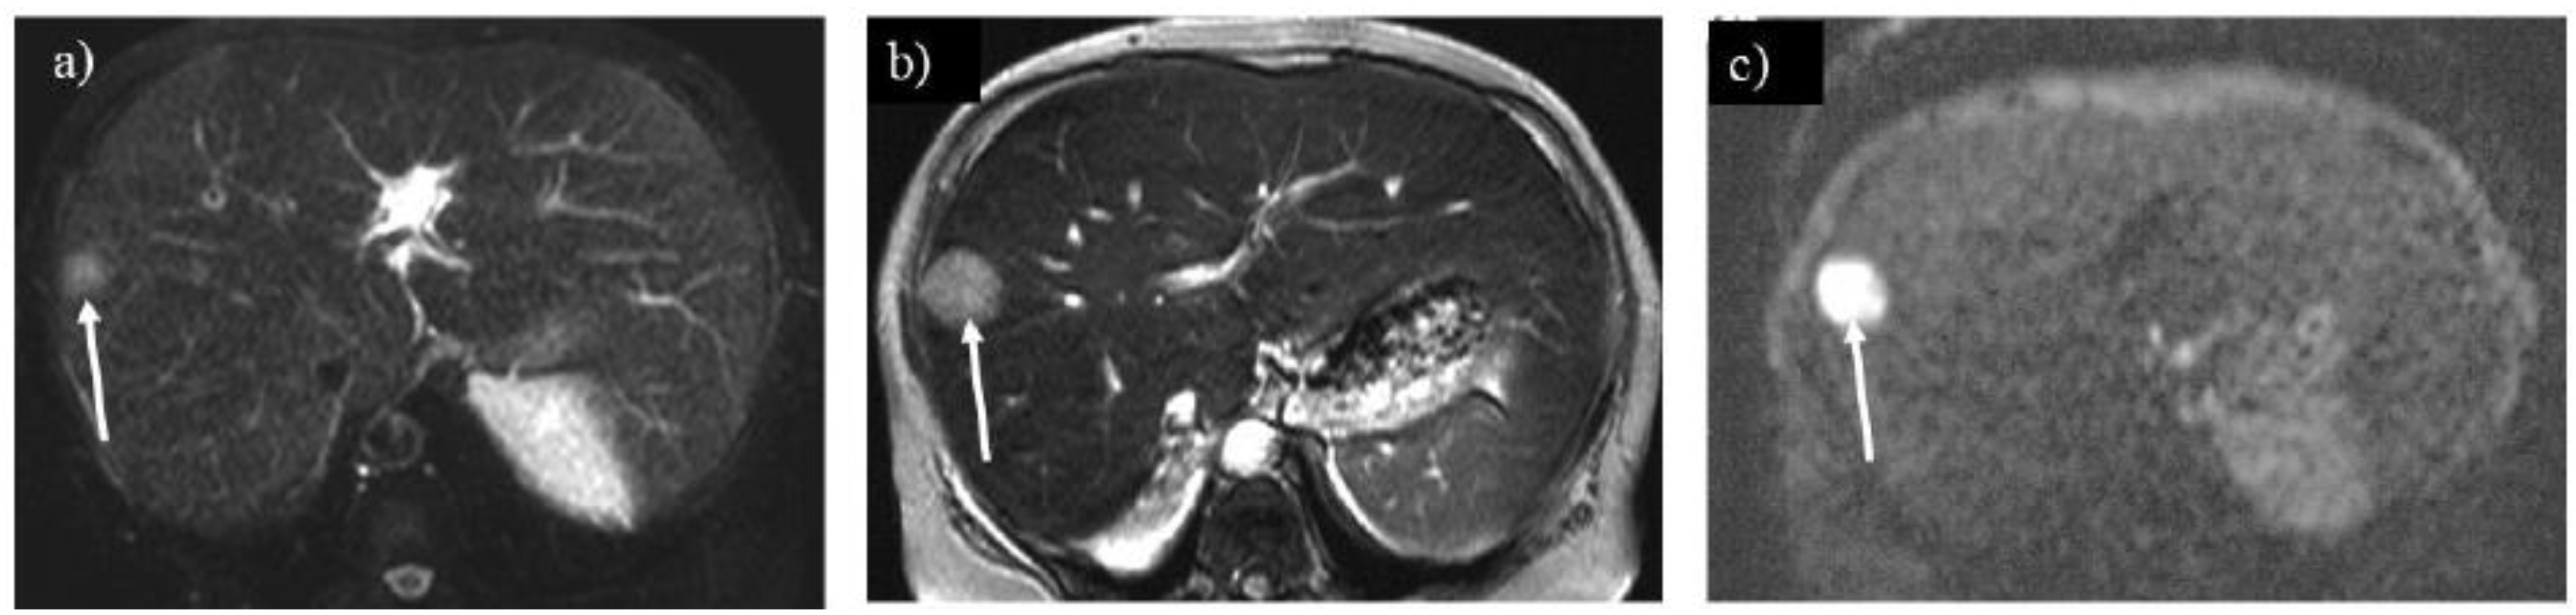
Figure 9.
Regenerative nodules show a tiny high signal on the hepatobiliary phase of Gd-EOB-DTPA enhanced imaging (A) in a 24-year-old woman with glycogen storage disease type Ia (arrows). The number of regenerative nodules increased significantly after 14 years as liver dysfunction progressed (B, arrows). .
Table 1.
Types of Glycogen Storage Diseases presented in This Review.
Table 1.
Types of Glycogen Storage Diseases presented in This Review.
Table 2.
Body MRI Sequences used for Evaluating Complications of Glycogen Storage Diseases.
Table 2.
Body MRI Sequences used for Evaluating Complications of Glycogen Storage Diseases.
|
Disclaimer/Publisher’s Note: The statements, opinions and data contained in all publications are solely those of the individual author(s) and contributor(s) and not of MDPI and/or the editor(s). MDPI and/or the editor(s) disclaim responsibility for any injury to people or property resulting from any ideas, methods, instructions or products referred to in the content. |
© 2025 by the authors. Licensee MDPI, Basel, Switzerland. This article is an open access article distributed under the terms and conditions of the Creative Commons Attribution (CC BY) license (https://creativecommons.org/licenses/by/4.0/).