Submitted:
17 January 2025
Posted:
17 January 2025
You are already at the latest version
Abstract
In this study, we investigate the role of Opnod1, Opnod2 and Optbk1 genes in antiviral and antibacterial immunity of spotted knifejaw, and the expression pattern of Opnod1, Opnod2 and Optbk1 mRNA in different tissues and at different time points were validated using qRT-PCR. The results showed that the open reading frame of Opnod1 gene was 2757 bp in length and encoded 918 amino acids, the open reading frame of Opnod2 gene was 2970 bp in length and encoded 990 amino acids,while Optbk1 gene was 2172 bp in length and encoded 723 amino acids. Both Opnod1 and Opnod2 proteins have three conserved domains (CARD, NOD and LRR), and Optbk1 has a S_TKc domain. The results using real-time quantitative PCR showed that Opnod1, Opnod2 and Optbk1 genes were mainly expressed in immune-related tissues of spotted knifejaw, with the highest relative expression of Opnod1 gene in skin tissues, Opnod2 gene in gill tissues and Optbk1 gene in liver tissues. The expression of Opnod1, Opnod2 and Optbk1 genes changed significantly in the immune tissues after infection with SKIV-SD and Vibrio harveyi. In spotted knifejaw kidney cell, the expression of Opnod1, Opnod2 and Optbk1 showed up-regulation after stimulation by poly I:C and LPS in vitro. The results suggest that the NOD1/2-TBK1 signal pathway may play an important role in the resistance of the spotted knifejaw to virus and bacteria, which will provide valuable basis for resistant disease breeding of spotted knifejaw.
Keywords:
Oplegnathus punctatus
; nod1
; nod2
; tbk1
; immunity
; infection
1. Introduction
Innate immunity, as one of the mechanisms of vertebrate immunity, has a major role in identifying itself with pathogenic microorganisms and is extremely important both for resistance to invasion by pathogenic bacteria and for stimulating the development of acquired immunity [1].The key to innate immunity is the immune recognition and interaction with pathogenic microorganisms [2]. When a pathogenic microorganism invades an organism, immune cells recognize the invading pathogen or intracellular damage signal by means of Pattern Recognize Receptors (PRRs) expressed on the surface of the cell membrane or in the cytoplasmic matrix [3]. The NLRs (nod-like receptor family) are the most widely studied pattern recognition receptors [4], which is located in the cytoplasm and involved in the recognition of bacteria and viruses [5]. Tbk1 is an important serine/threonine kinase that interacts with different junction molecules and mediates the phosphorylation of IRF3 (interferon regulatory factor3), thus playing a central regulatory role in interferon production.
Nod1 (nucleotide-binding oligomerization domain-containing protein 1) and nod2 (nucleotide-binding oligomerization domain-containing protein 2) were first NLR family members to be identified and have important pattern recognition receptors for bacteria and viruses [6,7]. Both nod1 and nod2 contain three conserved domains: the N-terminal Caspase activiting and recruitment domain (CARD), the central nucleotide-binding oligomerization domain (NOD), which mediates intermolecular oligomerisation, and the C-terminal leucine-rich repeat domains (LRRs), which have ligand recognition functions [8,9]. In mammals, nod1 specifically recognises γ-D-Glu-mDAP (iE-DAP) in bacteria [10], and nod2 specifically recognises the Muramyl Dipeptide (MDP) in bacteria, thus triggers an immune response by activating the downstream NF-κB signalling pathway [9,11]. These two proteins are activated by stimulation of pathogenic components of bacteria, then recruit and activate the receptor-interacting serine-threonine kinase 2 (RIPK2) through the CARD domain, which further activates the IKK kinase complex, ultimately promoting the transcription of corresponding genes such as inflammatory cytokines [12,13]. At the same time, nod2 also induces the activation of mitogen-activated protein kinases (MAPK) signaling pathway and promotes cytokine production [14]. In addition to recognizing MDP, nod2 was also found to recognize viral ssRNA and promote interferon regulatory factors to induce the production of type I interferon [15]. Nod2 has an important function in the antiviral immune response by enabling cells to resist viral infection and activating acquired immunity. The nod1 and nod2 genes in some teleost fish have been cloned and functionally studied including Channel Catfish (Ictalurus punctatus) [8], Grass carp (Ctenopharyngodon idella) [16], miiuy croaker (Miichthys Miiuy) [17], zebrafish (Danio rerio) [18] and Nile tilapia (Oreochromis niloticus) [19].
Tbk1 is a serine/threonine kinase commonly expressed in the IKK family, also known as NFkB-activating kinase (NAK), which plays an important role in interferon production and antiviral innate immunity. Following viral infection, virus-specific features are recognized by the PRR and further induce a signaling cascade downstream of the PRR.Tbk1 is an important checkpoint that receives signals from the TLR pathway, the RLR pathway, and the cGAMP synthase (cGAS)) pathway, and is essential in the generation of type I IFN antiviral immune responses in the body. It was found that in addition to its interferon-induced function, tbk1, as a ubiquitously expressed protein, plays a role in the insulin signaling pathway, cellular autophagy and mitophagy, and antiviral and antibacterial immune responses in mammals. This suggests that tbk1 is not only a key molecule in the induction of interferon production, but also an important molecule in cell biological processes. Homologs of tbk1 have been cloned and characterized in a variety of scleractinian fishes, such as zebrafish (Danio rerio) [20], Atlantic salmon (Salmo salar) [21], common carp (Cyprinus carpio) [22], grass carp (Ctenophyngodon idella) [23], cyprinid fish (Mylophyngodon piceus) [24] and crucian carp (Carassius auratus) [25].
Spotted knifejaw is one of the valuable mariculture species in China. However, with the increasing level of aquaculture intensification, disease problems have become a problem that restricts the healthy culture and promotion of spotted knifejaw (Mukherjee et al. 2019). There are three main types of diseases that affect spotted knifejaw aquaculture including viral, bacterial and parasitic diseases. Recently, RSIV-type megalocytivirus (SKIV-ZJ07), SKIV-TJ and ISKNV-type megalocytivirus (SKIV-SD) were isolated from spotted knifejaw [26,27,28]. Bacterial diseases such as black body disease caused by Vibrio harveyi can lead to ascites, enteritis and serious damage to internal organs, which greatly affect the aquaculture industry [29]. Therefore, in this study, the CDS regions of Opnod1, Opnod2 and Optbk1 genes were cloned, and their expression patterns in different tissues of spotted knifejaw were examined by quantitative real-time PCR (qRT-PCR), as well as the expression levels in different tissues after infection by SKIV-SD or V. harveyi, with the aim of further investigating the role of these genes in the immune response of spotted knifejaw. The aim was to lay the groundwork for further studies on the role of this gene in the immune response of the sole.
2. Materials and Methods
2.1. Experimental Fish
The spotted knifejaw used in this experiment were obtained from Shandong Laizhou Mingbo Aquatic Co. The body weight of fish is about 150g, healthy without disease. Before the experiment, they were temporarily kept in a water tank for a week, and the water temperature was maintained at about 25 ℃.
2.2. Sample Processing and Collection
Eleven tissues of liver, spleen, kidney, head kidney, heart, intestine, gills, brain, skin, muscle and blood were collected from five spotted knifejaw randomly after anesthetised by MS-222. The tissues were quickly placed in liquid nitrogen and subsequently transferred to -80°C refrigerator for further experiments.
Twenty healthy spotted knifejaw were selected for the spotted knifejaw SKIV-SD infection experiment. The virus used in this experiment was provided by Professor Qiwei Qin from South China Agricultural University. The individuals were anaesthetised and injected intraperitoneally with 100 µl (109 copies) of virus solution per fish. Samples were taken at five time points: 0 d, 1 d, 4 d, 7 d and 10 d. Three individuals were randomly selected at each time point, and three tissues were taken from each fish: liver, spleen and kidney. Tissues were removed and rapidly frozen in pre-prepared liquid nitrogen, and the tissue samples were subsequently stored in a -80°C refrigerator for subsequent RNA extraction.
Fifty healthy spotted knifejaw were selected for the Vibrio harveyi infection experiment. The V. harveyi used in this experiment were kept in this laboratory. The V. harveyi solution was diluted to 1×10⁹ cfu/mL with PBS, and the spotted knifejaw were anesthetized and injected intraperitoneally with 100 µL of the bacterial solution per fish. Samples were taken at eight time points: 0 h, 6 h, 12 h, 24 h, 48 h, 72 h, 96 h and 120 h. Three spotted knifejaw were sampled at each time point, and three tissues were taken from each fish: liver, spleen and kidney. The tissues were immediately frozen in liquid nitrogen and subsequently stored in a -80°C refrigerator for subsequent experiments.
2.3. Total RNA Extraction and cDNA Synthesis
Total RNA was extracted from each tissue by using an RNA extraction kit (Invitrogen, USA), the integrity of the RNA was authenticated by 1% agarose gel electrophoresis, and the concentration and purity of the RNA was measured by spectrophotometer. The cDNA was synthesized using the Prime Script RT reagent kit with gDNA eraser (TaKaRa, Japan).
2.4. Amplification of the CDS Region of the Opnod1, Opnod2 and Optbk1 Genes
Based on the sequence information of Opnod1, Opnod2 and Optbk1 genes, primers were designed for common PCR amplification using the newly synthesized cDNA as template to verify the integrity of their ORF regions. The reaction system for PCR was KOD TM OneMaster Mix (Toyobo, Japan) 25 μL, ORF F/R 1 μL, cDNA template 2 μL, and The PCR amplification conditions were: 98 ℃ for 5 min; 98 ℃ for 10 s, 59 ℃ for 5 s, 72℃ for 30 s, 35 cycles; 72 ℃ for 7 min, then stored at 4 ℃. PCR products were detected by agarose gel electrophoresis, and target fragments with the correct band size were recovered by gelling using a DNA gel recovery kit (Vazyme, Nanjing). The recovered product was ligated to pEASY-E1 vector (Transgen, China) and transformed into Trans-T1 receptor cells (Transgen, China), which were coated and cultured overnight. Finally, the positive monoclonal clones were selected and sent to Qingdao Ruibiotech Company for sequencing to obtain the ORF region sequences of Opnod1, Opnod2 and Optbk1.
2.5. Sequence Analysis of Opnod1, Opnod2 and Optbk1 Genes
The Opnod1, Opnod2 and Optbk1 genes sequences were analyzed using Editseq software to predict their amino acid sequences, molecular weights and isoelectric points. The sequences were predicted using an online software (http://www.cbs.dtu.dk/services/SignalP/ ) to predict their signal peptides and use the online website (http://www.cbs.dtu.dk/services/TMHMM/ ) for transmembrane analysis. The domain prediction was performed using the online software (http://smart.embl-heidelberg.de/). Homology comparison of amino acid was performed by DNAMAN 8 software and evolutionary trees were constructed by MEGA X software.
2.6. Sequence Analysis of Opnod1, Opnod2 and Optbk1 Genes
Quantitative real-time PCR (qRT-PCR) was applied to detect the reletive expression levels of Opnod1, Opnod2 and Optbk1 genes in different tissues of healthy spotted knifejaw, as well as in immune-related tissues after stimulation with SKIV-SD or V.harveyi. β-actin was chosen as the internal reference gene and the primers used for qRT-PCR are listed in Table 1. Quantification of Opnod1, Opnod2 and Optbk1 genes was performed on an ABI 7500 Fast Real-time (Applied Biosystems, USA) instrument using the SYBR ® Premix Ex Taq TM kit (TaKaRa, Japan) according to the instructions. Three parallel replicates were set up for each sample and the relative expression of genes was calculated using 2–ΔΔCt method (Livak and Schmittgen 2002). All experimental data were expressed as mean ± standard error (Mean±SE) and subjected to one-way ANOVA and Duncan’s multiple comparisons using SPSS16.0 software. Differences were considered significant when P<0.05 and highly significant when P<0.01.
2.7. In Vitro Stimulation of Kidney Cells of O. punctatus with Poly I:C and LPS
The monolayer cultured, well-grown spotted knifejaw kidney cell line was inoculated into a 12-well plate and left for 24h until the cell coverage reached about 90%. The medium of the 12-well plate was aspirated off and washed 3 times with 1×PBS and replaced with fresh L15 medium. Stimulation of spotted knifejaw kidney cells with different concentrations of poly I:C at final concentrations of 0 μg/mL, 50 μg/mL, 100 μg/mL, and 200 μg/mL was added to each well of 12-well plates, and an equal volume of PBS was added to control group. LPS at final concentrations of 0 μg/mL, 10 μg/mL, 50 μg/mL and 100 μg/mL were added to 12-well plates, and an equal volume of PBS was added to the control group. The above cell samples were cultured in a 24℃ incubator for 6 h. The cell samples were collected by Trizol respectively, and stored in a -80℃ refrigerator for use in the subsequent RNA extraction for the preparation of quantitative templates as Method 2.6.
3. Results
3.1. Sequence Characteristics of Opnod1, Opnod2 and Optbk1 Genes
As shown in Figure 1, The ORF region of the Opnod1 gene is 2757 bp that encodes a 918 amino acid (AA) protein with a predicted molecular weight of 103.23 kDa and a theoretical isoelectric point of 6.447. Analysis of the amino acid sequence of the Opnod1 has showed that it has no signal peptide or transmembrane region. The domain prediction revealed that Opnod1 has a CARD domain (12-94 aa), a NOD domain (187-360aa) and seven C-terminal LRR domain (690-717 aa, 743-910 aa). As shown in Figure 2, the ORF region of the Opnod2 gene is 2970 bp in length that encodes a 989 amino acid (aa) protein with a predicted molecular weight of 110 kDa and a theoretical isoelectric point of 6.552 (Figure 3). There is no signal peptide or transmembrane region and the domain prediction revealed that the Opnod2 protein has two CARD domains (1-91 aa and 112–206 aa), a NOD domain (274-444 aa) and six LRR domains at the C-terminus. The ORF region of the Optbk1 gene is 2,172 bp, encoding 723 amino acids, and the predicted molecular weight of the protein is 83.0 kDa, with a theoretical isoelectric point of 4.97. SMART software predictions show that tbk1 has an S_TKc structural domain at amino acid positions 9 to 306 (Figure 3).
3.2. Amino Acid Multiple Sequence Alignment and Phylogenetic Tree Analysis
The amino acid of Opnod1 and Opnod2 were found to have high homology with nod1 and nod2 of other teleosts by BLAST comparison, respectively. As shown in Table 2, the similarity of Opnod1 with Nile tilapia (Oreochromis niloticus) nod1 was 86.27%, with Large yellow croaker (Larimichthys crocea) and Japanese flounder (Paralichthys olivaceus) were 85.07% and 84.39%, respectively; and with mouse ( Mus musculus) and human (Homo sapiens) with 50.33%, 49.6%, respectively. The similarity of Opnod2 with Asian Seabass (Lates calcarifer) was 89.59%, with Japanese flounder (Paralichthys olivaceus) and half-smooth tongue sole (Cynoglossus semilaevis) were 83.22% and 79.27%, respectively. The similarity between Opnod2 with mouse (Mus musculus) and human (Homo sapiens) were 45.54% and 46.26%, respectively.
Multiple comparisons of the amino acid sequences encoded by vertebrate tbk1 using DNAman revealed that the amino acid sequences of tbk1 are conserved among different species. In order to explore to determine the position of zebrafish tbk1 in the process of animal evolution, a phylogenetic tree of vertebrates was constructed by Neighbor-joining method using MAGE 7 software. The results of phylogenetic analysis showed that the Tbk1 of mouse, human and chimpanzee were clustered into one cluster, the African clawed toad was divided into one branch, and the spotted knifejaw Tbk1 was clustered into another cluster with other bony fishes. This suggests that evolutionarily spotted knifejaw Tbk1 is more distantly related to mammals, but more closely related to the bony fish striped knifejaw, and more closely related to other bony fishes such as striped knifejaw and semi-smooth tongue sole
As shown in Figure 3 and Figure 4, the amino acid sequences of nod1 and nod2 were found to be relatively conserved between species, with the CARD, NOD and LRR domains being more conserved. A phylogenetic tree of nod1 and nod2 was constructed by the Neighbor-joining method using MEGA X software. The phylogenetic analysis showed that nod1 and nod2 of the spotted knifejaw were clustered into a single clade with other teleosts, and the nod1 and nod 2 of mammals were gathered in another clade, respectively. Opnod1 is evolutionarily most closely related to large yellow croaker, while Opnod2 is closely related to Asian seabass (Figure 6). The Tbk1 of mouse, human and chimpanzee were clustered into one cluster, the African clawed toad was divided into one branch, and the spotted knifejaw Tbk1 was clustered with other bony fishes into another cluster. This suggests that evolutionarily spotted knifejaw Tbk1 is more distantly related to mammals and more recently to barred knifejaw, and more closely related to other bony fishes such as half-smooth tongue sole (Figure7).
3.3. Expression Patterns of Opnod1, Opnod2 and Optbk1 Genes in Healthy Individuals
Opnod1 and Opnod2 genes were expressed in 11 tissues in healthy individuals. The Opnod1 gene was highly expressed in skin and intestine, while relatively uniformly expressed in liver, spleen, gill and heart, and relatively low in other tissues. Opnod2 gene was relatively highly expressed in gill, blood and skin tissues, followed by kidney, intestine, spleen, head kidney, heart, muscle and brain. The Optbk1 gene was expressed in all tissues, with the highest level of expression in the liver and relatively high levels of expression in the brain, gills, kidney, skin, heart and stomach. (Figure 8).
3.4. Changes in Expression of Opnod1, Opnod2 and Optbk1 Genes After Iridovirus Stimulation
The changes of the expression of Opnod1 gene and Opnod2 gene at different time points in three tissues after infection with SKIV-SD are shown in Figure 9. Compared with the control group at 0d, the relative expression levels of Opnod1 gene in liver showed no significant changes at 1 and 4 days, and increased significantly at 7 days about 22.5 times higher than that at 0 days (P<0.01), and decreased at 10 days; in spleen, the expression of Opnod1 gene showed an overall up-regulation trend, and reached the peak at 10 days, about 3.8 times higher than that at 0 days; in spleen, the expression levels of Opnod1 gene showed an overall up-regulation trend, and reached the peak at 10 days. In the kidney, Opnod1 gene expression level was significantly upregulated at 7 days (P<0.01), about 13.8 times higher than that at day 0, and then decreased to normal at 10 days.
As shown in Figure 10, the expression levels of Opnod2 gene in liver tissues showed no significant changes compared with the control group at 1 and 4 days, increased significantly at 7 days (P<0.01) and decreased to normal levels at 10 days; in spleen tissues, the expression levels of Opnod2 gene showed an overall increasing trend and peaked at 4 days; in kidney tissues, the expression levels of Opnod2 gene were significantly increased and peaked at 7 days (P<0.01) and then decreased to normal levels. Gene expression level in liver tissues was significantly up-regulated at 7 days (P<0.01), and then decreased to normal level.
After intraperitoneal injection of iridovirus, the expression levels of Optbk1 were up-regulated in all three immunized tissues, but the expression patterns were slightly different in different tissues. The expression level of Optbk1 was significantly up-regulated in liver at 1 day and 4 days; in spleen at 4 days post-injection; and in kidney at 1 days, 7 days and 10 days, with the highest expression level at 1 day post-injection, which was 4.3 times higher than that in the control group (Figure 11).
3.5. Changes in the Expression of Opnod1, Opnod2 and Optbk1 Genes After Stimulation by Vibrio harveyi
After V. harveyi infection, Opnod1 gene expression levels were significantly up-regulated in spleen at 12 h after bacterial infection, whereas in the liver at 72h. In kidney, the relative expression level of Opnod1 were significantly up-regulated at 48 h and the peak time was later than spleen (Figure 12).
The express tendency of Opnod2 were similar with Opnod1. In liver, Opnod2 gene expression levels were significantly up-regulated at 72 h. In spleen, the expression pattern of Opnod2 gene also showed a relative higher expression levels at 12 h, and then gradually decreased to a lower level. In kidney, the relative expression did not change significantly (Figure 13).
The expression levels of Optbk1 in all three immune tissues were significantly up-regulated compared with the control group at 12 h of infection, which were 2.2-fold, 1.8-fold and 1.0-fold of the control group, respectively. The expression levels of Optbk1 in liver and spleen were also significantly up-regulated at 72 h of stimulation; the expression levels in kidney were also significantly up-regulated at 0 h and 24 h of stimulation (Figure 14).
3.6. In Vitro Stimulation of Grouper Kidney Cells
Spotted knifejaw kidney cells were stimulated with different concentrations of poly I:C and LPS respectively for 6 h. Real-time fluorescence quantitative PCR was performed to detect the changes of Opnod1, Opnod2 and Optbk1 gene expression. The results showed that the expression level of Opnod1 and Optbk1 were upregulated for 2-3 folds at the concentration of poly I:C of 10-100 μg/mL, while the expression level of Opnod2 in kidney cells showed a tendency of increasing of 60-80 folds with poly I:C stimulation (Figure 15A-C). After the stimulation with LPS, the expression levels of Opnod1, Opnod2 and Optbk1 showed a tendency of increasing for 1.5-4 folds at 50 μg/mL, and then decreasing at 100 μg/mL (Figure 15D-F).
4. Discussion
In this experiment, the full length of the CDS region of the Opnod1 and Opnod2 genes were cloned, and then analyzed for sequence homology and evolutionary analysis with the nod1 and nod2 genes of other species. The results showed that the Opnod1 and Opnod2 possesses all the characteristic domains of the NLR family [13]. The protein domains of Opnod1 and Opnod2 are highly conserved compared to those of other species, suggesting that they share similar functional properties in recognition of pathogenic microorganism. Opnod1 has 7 LRR domains, which are similar to those of Nile tilapia [19] and orange-spotted grouper [30], while Nod1 genes of grass carp, channel catfish and zebrafish have 6 LRR domains [16,31]. The C-terminus of Opnod2 has 6 LRR domains, which are identical to those of miiuy croaker [17] and orange-spotted grouper [30], while in grass carp and zebrafish the number of LRRs is 5. The differences of LRR domains between in vertebrates may be related to the various environment and the replication and differentiation of immune related genes. In the genome-wide identification, we found 34 genes with NACHT domain. Structure analysis demonstrated that these NLRs genes were divided into four subfamilies that will expand our understanding of the NLR family in marine fish.
In this study, we detected that Opnod1 and Opnod2 were widely expressed in various tissues by using qRT-PCR. Opnod1 gene was highly expressed in the skin, which was similar with orange-spotted grouper. In contrast, in healthy zebrafish, grass carp and channel catfish, the relative expression level of nod1 was highest in the spleen and lowest in the blood; Opnod2 gene was highly expressed in gill and skin tissues of spotted knifejaw, and in Nile tilapia, nod2 gene was highly expressed in the spleen, while in orange-spotted grouper nod2 gene was most highly expressed in the kidney, followed by skin and gill. This is similar to the tissue expression pattern of the nod2 gene in spotted knifejaw. Taken together, this suggests that nod1 and nod2 have an important role in the innate immunity of spotted knifejaw. The role of nod1 and nod2 in antibacterial and antiviral immune responses has been reported in a few species of fish such as Indian major carp (Labeo rohita) [32], Mrigalcarp (Cirrhinus mrigala) [33], orange-spotted grouper (Epinephelus coioides) [30], rainbow trout (Oncorhynchus mykiss) [11], grass carp (Ctenopharyngodon idella) [16], channel catfish (Ictalurus punctatus) [8] and zebrafish (Danio rerio) [18]. Nile tilapia showed significant changes in the expression levels of nod1 and nod2 in blood, spleen, kidney, intestine and gills following injection of Streptococcus agalactiae [19]. In Mrigalcarp the expression levels of nod1 and nod2 in the gills, liver, kidney and intestine were significantly increased after infection with either Streptococcus agalactiae or Aeromonas hydrophila [33]. In this study, we found that the relative expression levels of Opnod1 and Opnod2 genes in liver, spleen and kidney tissues of spotted knifejaw were significantly changed after infection by SKIV-SD or V. harveyi, indicating that Opnod1 and Opnod2 play an important role in the immune response of spotted knifejaw.
Studies in mammals have shown that nod1 recognizes the peptidoglycan molecules of γ-D-Glu-mDAP (iE-DAP) to sense the presence of bacterial pathogens. Mammalian nod2 detects Muramyl Dipeptide (MDP) in peptidoglycans of Gram-positive and Gram-negative bacteria, and both receptors trigger immune responses by activating NF-κB [34].Meanwhile, in teleost fishes, the detected ligands of nod1 and nod2 remains unclear. In zebrafish, nod2 responded significantly to MDP stimulation, but not to stimuli in Poly I: C and LPS [18]. This suggests that zebrafish nod2 may be a receptor for MDP, which is consistent with Nile tilapia [19]. In our research, Opnod1 and Opnod2 are terribly possible involved in antiviral and antibacterial infection process, while the activation mechanisms are unclear and need further study.
In mammals, tbk1 has been widely studied as an important molecular bridge connecting the signaling of TLRs (TLR3 and TLR4) and RLRs, which activates the transcription factors IRF3 and IRF7 to produce type I interferons. In this study, we identified the zebra seabream tbk1 gene, and after multiple sequence comparisons we found that the tbk1 sequence is highly conserved, and phylogenetic analysis of tbk1 showed that Optbk1 is more closely related to tbk1 from other teleost, and is likely to be a homologous gene of mammalian tbk1. Tissue expression analysis showed that Optbk1 was expressed in a variety of tissue, which was similar to that in other fish species, but the expression pattern of tbk1 was slightly different in different species. It was shown that grass carp (Ctenopharyngodon idellus) tbk1 was mainly expressed in the spleen [35], and Large yellow croaker (Larimichthys crocea) tbk1 was highly expressed in the brain [36]. The highest level of expression of Optbk1 was found in the liver of the spotted rock seabream, whereas the expression level was lower in the spleen and the head and kidneys, which was similar to that in the dark sandpiper (Odontobutis obscurus) tbk1 tissue expression results were similar [37], and it is hypothesized that Optbk1 is not required in the immune tissues of healthy spotted knifejaw. Black carp (Mylophyngodon piceus) tbk1 exhibits antiviral activity against grass carp SVCV and GCRV [24], large yellow croaker (Larimichthys crocea) tbk1 can interact with the E3 ubiquitin ligase, Nrdp1, to defend against infections [36].
In this study, the expression levels of Opnod1, Opnod2 and Optbk1 were up-regulated to different degrees in immune tissues liver, spleen and kidney after stimulation by SKIV-SD and V.harveyi, in addition spotted knifejaw kidney cell showed up-regulation to different degrees after stimulation by poly I:C and LPS in vitro, the above results suggest that NOD1/2-TBK1 signaling pathway plays an important role in immunity process of teleost, but the molecular mechanism in teleosts are still very limited.
In summary, the present study showed that Opnod1, Opnod2 and Optbk1 are involved in the immune response process of spotted knifejaw, which will provide evidence for further research on the role mechanism of NOD1/2-TBK1 signal pathway in the immunity of spotted knifejaw against diseases.
Author Contributions
Y.S. and L.W. designed the experiments; Y.S., K. L. and M. Z. conducted the experiments; Y. S. and L. W. provided the experimental materials; Y.S. and L.W. wrote the manuscript and S.C. reviewed the manuscript.
Acknowledgments
This work was supported by Shandong Key R&D Program for Academician team in Shandong (2023ZLYS02), Key Research and Development Project of Shandong Province (2021LZGC028, 2022LZGC016), Central Public-interest Scientific Institute Basal Research Fund, CAFS (2023TD20), and Taishan Scholar Climbing Program of Shandong Province.
Conflicts of Interest
The authors have declared that no competing financial interests exist. All data during this study are included in this manuscript.
References
- Netea, MG. Training innate immunity: the changing concept of immunological memory in innate host defence. EUR J CLIN INVEST. 2013 43:881-4.
- Gomez GD, Balcazar JL. A review on the interactions between gut microbiota and innate immunity of fish. FEMS Immunol Med Microbiol. 2008 52:145-54.
- Takeuchi O, Akira S. Pattern recognition receptors and inflammation. CELL. 2010 140:805-20.
- Liao Z, Su J. Progresses on three pattern recognition receptor families (TLRs, RLRs and NLRs) in teleost. DEV COMP IMMUNOL. 2021 122:104131.
- Sahoo, BR. Structure of fish Toll-like receptors (TLR) and NOD-like receptors (NLR). INT J BIOL MACROMOL. 2020 161:1602-17.
- Rietdijk ST, Burwell T, Bertin J, Coyle AJ. Sensing intracellular pathogens-NOD-like receptors. CURR OPIN PHARMACOL. 2008 8:261-6.
- Zhang L, Gao Z, Yu L, Zhang B, Wang J, Zhou J. Nucleotide-binding and oligomerization domain (NOD)-like receptors in teleost fish: Current knowledge and future perspectives. J FISH DIS. 2018 41:1317-30.
- Sha Z, Abernathy JW, Wang S, Li P, Kucuktas H, Liu H, et al. NOD-like subfamily of the nucleotide-binding domain and leucine-rich repeat containing family receptors and their expression in channel catfish. DEV COMP IMMUNOL. 2009 33:991-9.
- Gu T, Lu L, Wang J, Tian L, Wei W, Wu X, et al. The NOD1 and NOD2 in mandarinfish (Siniperca chuatsi): molecular characterization, tissue distribution, and expression analysis. BMC GENET. 2018 19:61.
- Chamaillard M, Hashimoto M, Horie Y, Masumoto J, Qiu S, Saab L, et al. An essential role for NOD1 in host recognition of bacterial peptidoglycan containing diaminopimelic acid. NAT IMMUNOL. 2003 4:702-7.
- Chang M, Wang T, Nie P, Zou J, Secombes CJ. Cloning of two rainbow trout nucleotide-binding oligomerization domain containing 2 (NOD2) splice variants and functional characterization of the NOD2 effector domains. FISH SHELLFISH IMMUN. 2011 30:118-27.
- Motta V, Soares F, Sun T, Philpott DJ. NOD-like receptors: versatile cytosolic sentinels. PHYSIOL REV. 2015 95:149-78.
- Philpott DJ, Sorbara MT, Robertson SJ, Croitoru K, Girardin SE. NOD proteins: regulators of inflammation in health and disease. NAT REV IMMUNOL. 2014 14:9-23.
- Basu M, Paichha M, Lenka SS, Chakrabarty R, Samanta M. Hypoxic stress: impact on the modulation of TLR2, TLR4, NOD1 and NOD2 receptor and their down-stream signalling genes expression in catla (Catla catla). MOL BIOL REP. 2016 43:1-9.
- Sabbah A, Chang TH, Harnack R, Frohlich V, Tominaga K, Dube PH, et al. Activation of innate immune antiviral responses by Nod2. NAT IMMUNOL. 2009 10:1073-80.
- Chen WQ, Xu QQ, Chang MX, Nie P, Peng KM. Molecular characterization and expression analysis of nuclear oligomerization domain proteins NOD1 and NOD2 in grass carp Ctenopharyngodon idella. FISH SHELLFISH IMMUN. 2010 28:18-29.
- Li J, Gao Y, Xu T. Comparative genomic and evolution of vertebrate NOD1 and NOD2 genes and their immune response in miiuy croaker. FISH SHELLFISH IMMUN. 2015 46:387-97.
- Zou PF, Chang MX, Li Y, Xue NN, Li JH, Chen SN, et al. NOD2 in zebrafish functions in antibacterial and also antiviral responses via NF-kappaB, and also MDA5, RIG-I and MAVS. FISH SHELLFISH IMMUN. 2016 55:173-85.
- Gao FY, Pang JC, Lu MX, Yang XL, Zhu HP, Ke XL, et al. Molecular characterization, expression and functional analysis of NOD1, NOD2 and NLRC3 in Nile tilapia (Oreochromis niloticus). FISH SHELLFISH IMMUN. 2018 73:207-19.
- Langevin C, Aleksejeva E, Passoni G, Palha N, Levraud JP, Boudinot P. The antiviral innate immune response in fish: evolution and conservation of the IFN system. J MOL BIOL. 2013 425:4904-20.
- Benavides A, Gutierrez D, Epuyao N, Modak B, Imarai M, Valenzuela B. Alpinone: A positive regulator molecule of immune antiviral response in Atlantic salmon kidney cells. DEV COMP IMMUNOL. 2022 126:104262.
- Li S, Lu LF, LaPatra SE, Chen DD, Zhang YA. Zebrafish STAT6 negatively regulates IFNphi1 production by attenuating the kinase activity of TANK-binding kinase 1. DEV COMP IMMUNOL. 2017 67:189-201.
- Feng X, Su J, Yang C, Yan N, Rao Y, Chen X. Molecular characterizations of grass carp (Ctenopharyngodon idella) TBK1 gene and its roles in regulating IFN-I pathway. DEV COMP IMMUNOL. 2014 45:278-90.
- Yan C, Xiao J, Li J, Chen H, Liu J, Wang C, et al. TBK1 of black carp plays an important role in host innate immune response against SVCV and GCRV. FISH SHELLFISH IMMUN. 2017 69:108-18.
- Wu M, Zhao X, Gong XY, Wang Y, Gui JF, Zhang YB. FTRCA1, a Species-Specific Member of finTRIM Family, Negatively Regulates Fish IFN Response through Autophage-Lysosomal Degradation of TBK1. J IMMUNOL. 2019 202:2407-20.
- Dong C, Weng S, Luo Y, Huang M, Ai H, Yin Z, et al. A new marine megalocytivirus from spotted knifejaw, Oplegnathus punctatus, and its pathogenicity to freshwater mandarinfish, Siniperca chuatsi. VIRUS RES. 2010 147:98-106.
- Liao J, Kang S, Zhang L, Zhang D, Xu Z, Qin Q, et al. Isolation and identification of a megalocytivirus strain (SKIV-TJ) from cultured spotted knifejaw (Oplegnathus punctatus) in China and its pathogenicity analysis. FISH SHELLFISH IMMUN. 2023 141:109034.
- Huang X, Wei J, Zheng Q, Zhang Y, Zhu W, Liu J, et al. Isolation, identification and genomic analysis of an ISKNV-type megalocytivirus from spotted knifejaw (Oplegnathus punctatus). AQUACULTURE. 2021 532:736032.
- Wang J, Chen Z, Xu W, Li Y, Lu S, Wang L, et al. Transcriptomic analysis reveals the gene expression profiles in the spleen of spotted knifejaw (Oplegnathus punctatus) infected by Vibrio harveyi. DEV COMP IMMUNOL. 2022 133:104432.
- Hou QH, Yi SB, Ding X, Zhang HX, Sun Y, Zhang Y, et al. Differential expression analysis of nuclear oligomerization domain proteins NOD1 and NOD2 in orange-spotted grouper (Epinephelus coioides). FISH SHELLFISH IMMUN. 2012 33:1102-11.
- Laing KJ, Purcell MK, Winton JR, Hansen JD. A genomic view of the NOD-like receptor family in teleost fish: identification of a novel NLR subfamily in zebrafish. BMC EVOL BIOL. 2008 8:42.
- Swain B, Basu M, Lenka SS, Das S, Jayasankar P, Samanta M. Characterization and Inductive Expression Analysis of Interferon Gamma-Related Gene in the Indian Major Carp, Rohu (Labeo rohita). DNA CELL BIOL. 2015 34:367-78.
- Basu M, Swain B, Sahoo BR, Maiti NK, Samanta M. Induction of toll-like receptor (TLR) 2, and MyD88-dependent TLR- signaling in response to ligand stimulation and bacterial infections in the Indian major carp, mrigal (Cirrhinus mrigala). MOL BIOL REP. 2012 39:6015-28.
- Caruso R, Nunez G. Innate Immunity: ER Stress Recruits NOD1 and NOD2 for Delivery of Inflammation. CURR BIOL. 2016 26:R508-11.
- Feng H, Liu H, Kong R, Wang L, Wang Y, Hu W, et al. Expression profiles of carp IRF-3/-7 correlate with the up-regulation of RIG-I/MAVS/TRAF3/TBK1, four pivotal molecules in RIG-I signaling pathway. FISH SHELLFISH IMMUN. 2011 30:1159-69.
- Zhang DL, Yu DH, Chen J, Fan S, Wang ZY. Expression profiles and interaction suggest TBK1 can be regulated by Nrdp1 in response to immune stimulation in large yellow croaker Larimichthys crocea. FISH SHELLFISH IMMUN. 2015 46:745-52.
- Chen J, Li ZC, Lu LF, Li P, Li XY, Li S. Functional Characterization of Dark Sleeper (Odontobutis obscura) TBK1 on IFN Regulation. FRONT IMMUNOL. 2019 10:985.
Figure 1.
Amino acid sequence and predicted domains of Opnod1 protein. (A) The translated amino acid sequence is marked below the nucleotide sequence, the start codon “ATG” is marked with a red font, and the stop codon “TAG” is marked with an asterisk. The CARD domain is marked with an underscore “____”, the NOD domain is marked with gray shading, and the LRR domain is markedwith yellow shading. (B) The protein domain prediction of Opnod1. The CARD and NACHT domains are marked with gray shading, and the LRR domain is marked with green shading.
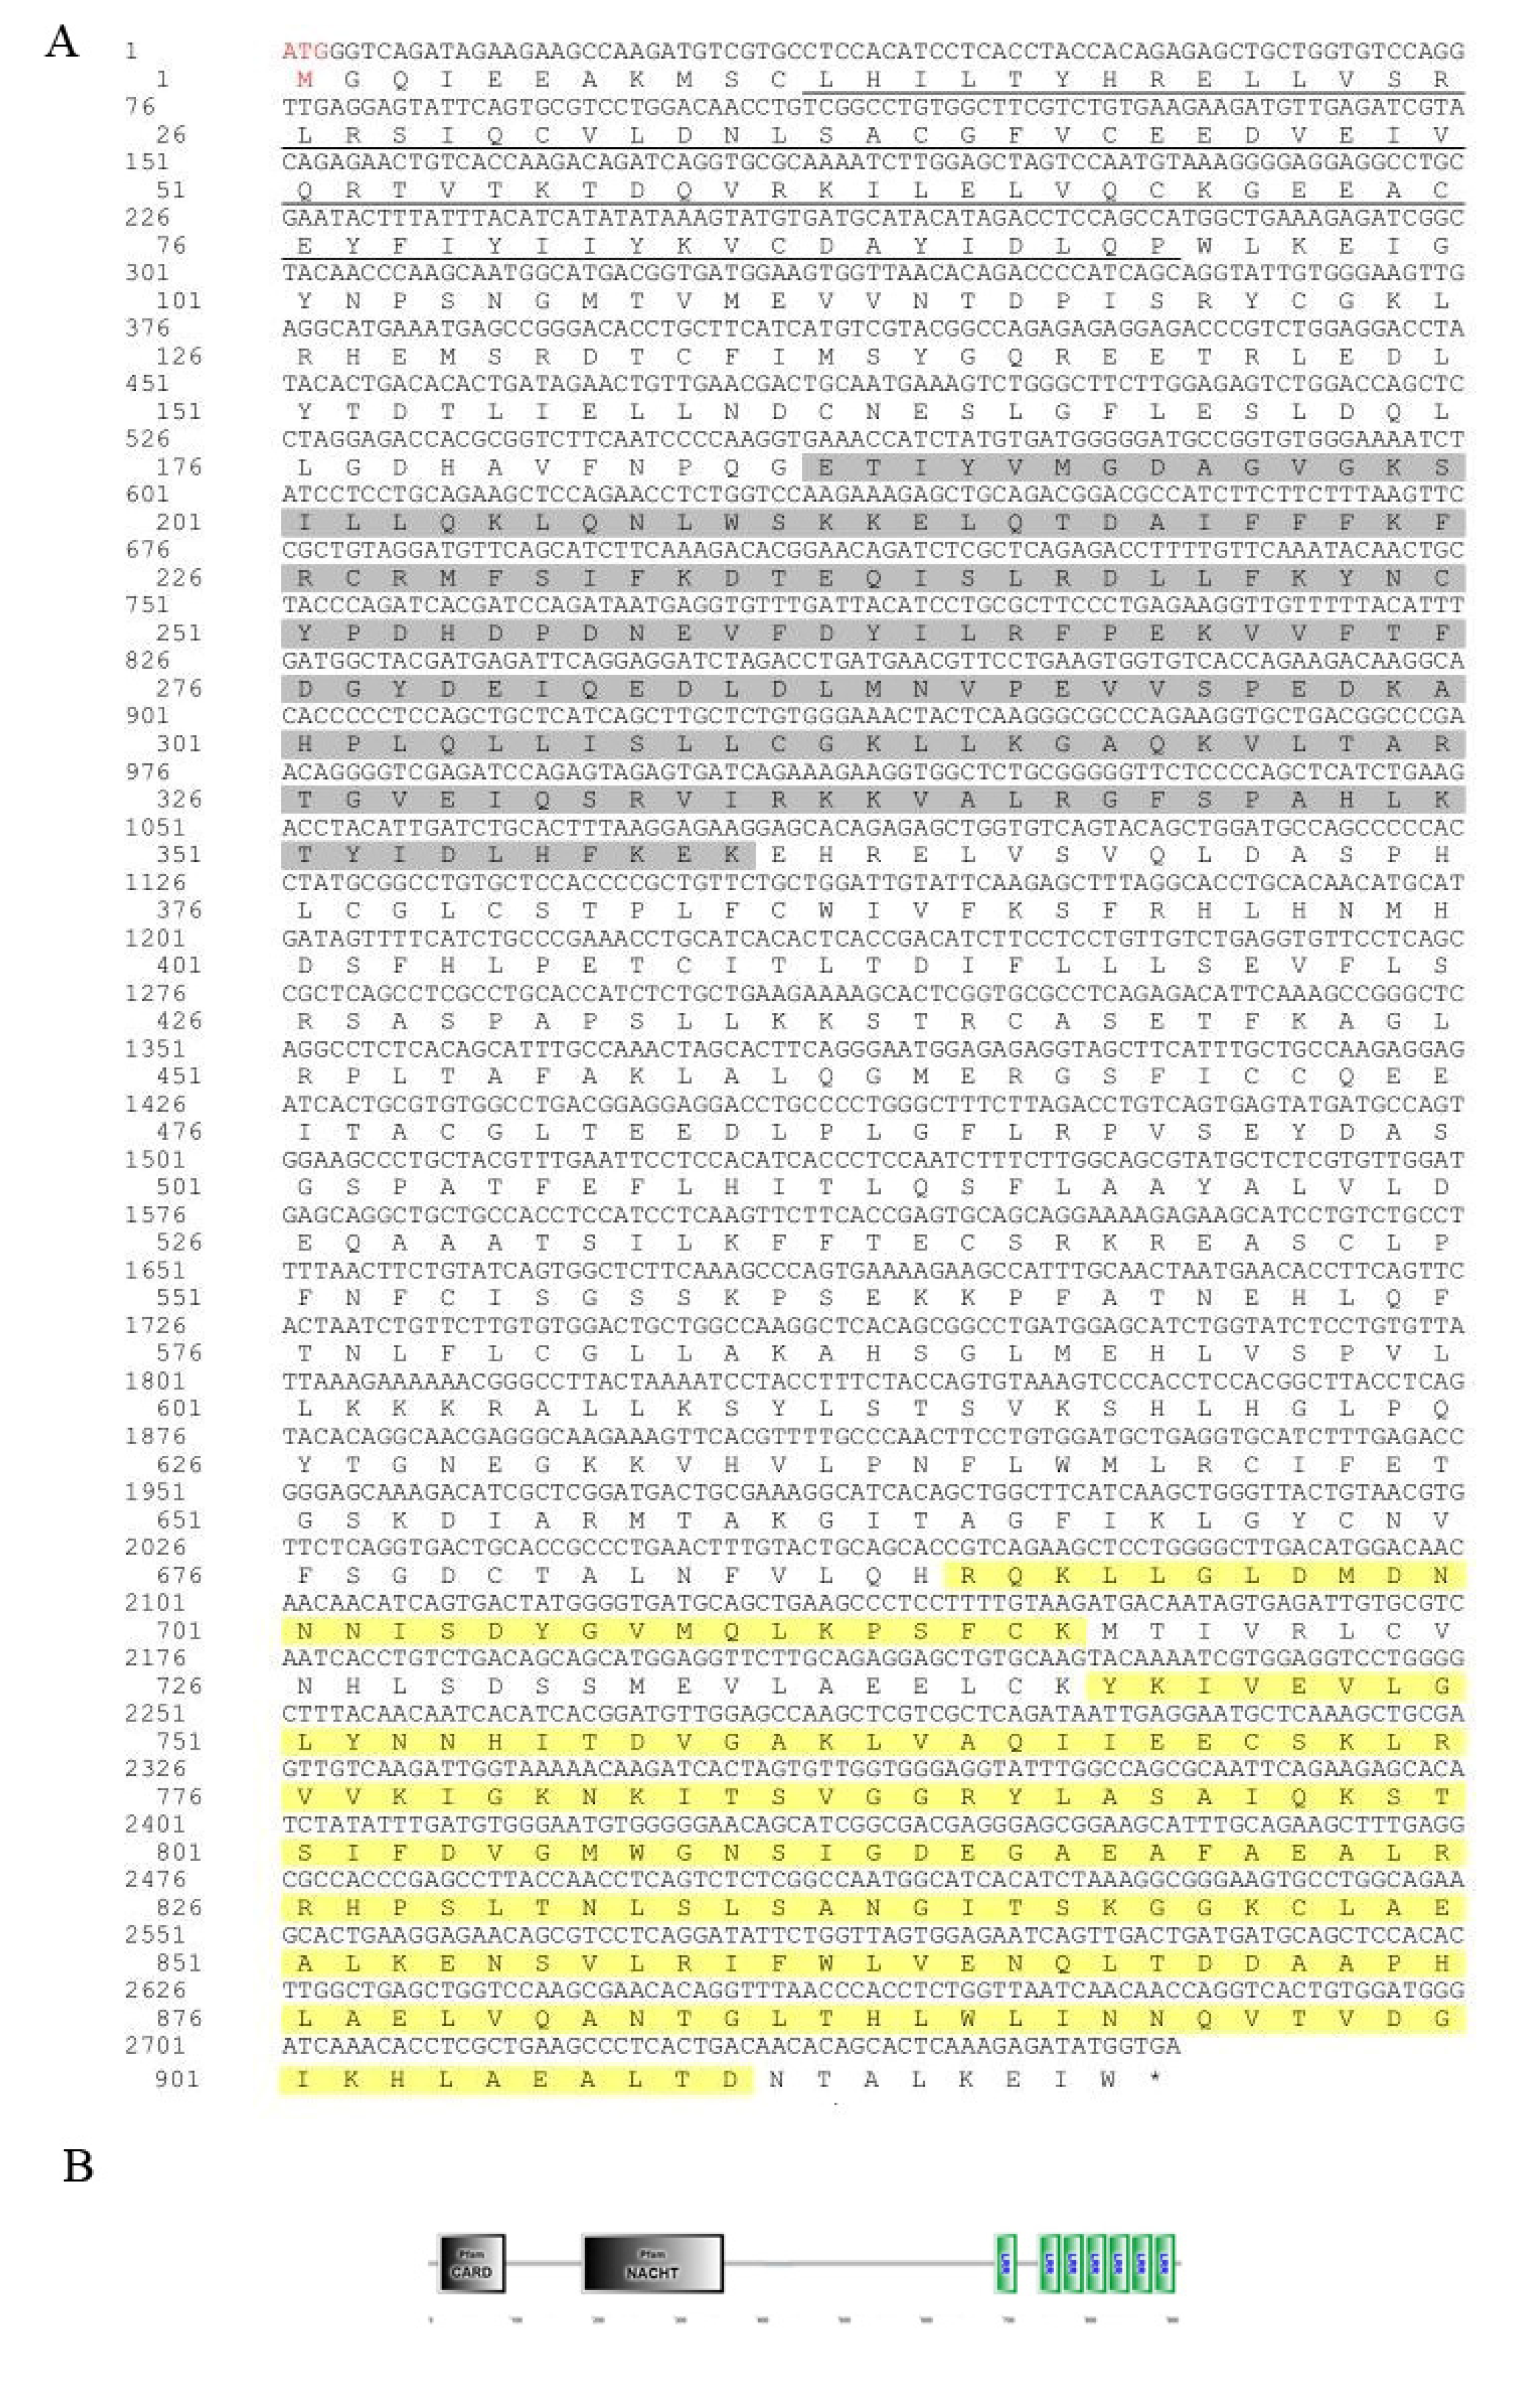
Figure 2.
Amino acid sequence and predicted domains of Opnod2 protein. (A) The translated amino acid sequence is marked below the nucleotide sequence, the start codon “ATG” is marked with a red font, and the stop codon “TGA” is marked with an asterisk. (B) The protein domain prediction of Opnod2. The CARD domain is marked with an underscore, the NACHT domain is marked with gray shading, and the LRR domain is marked with green shading.
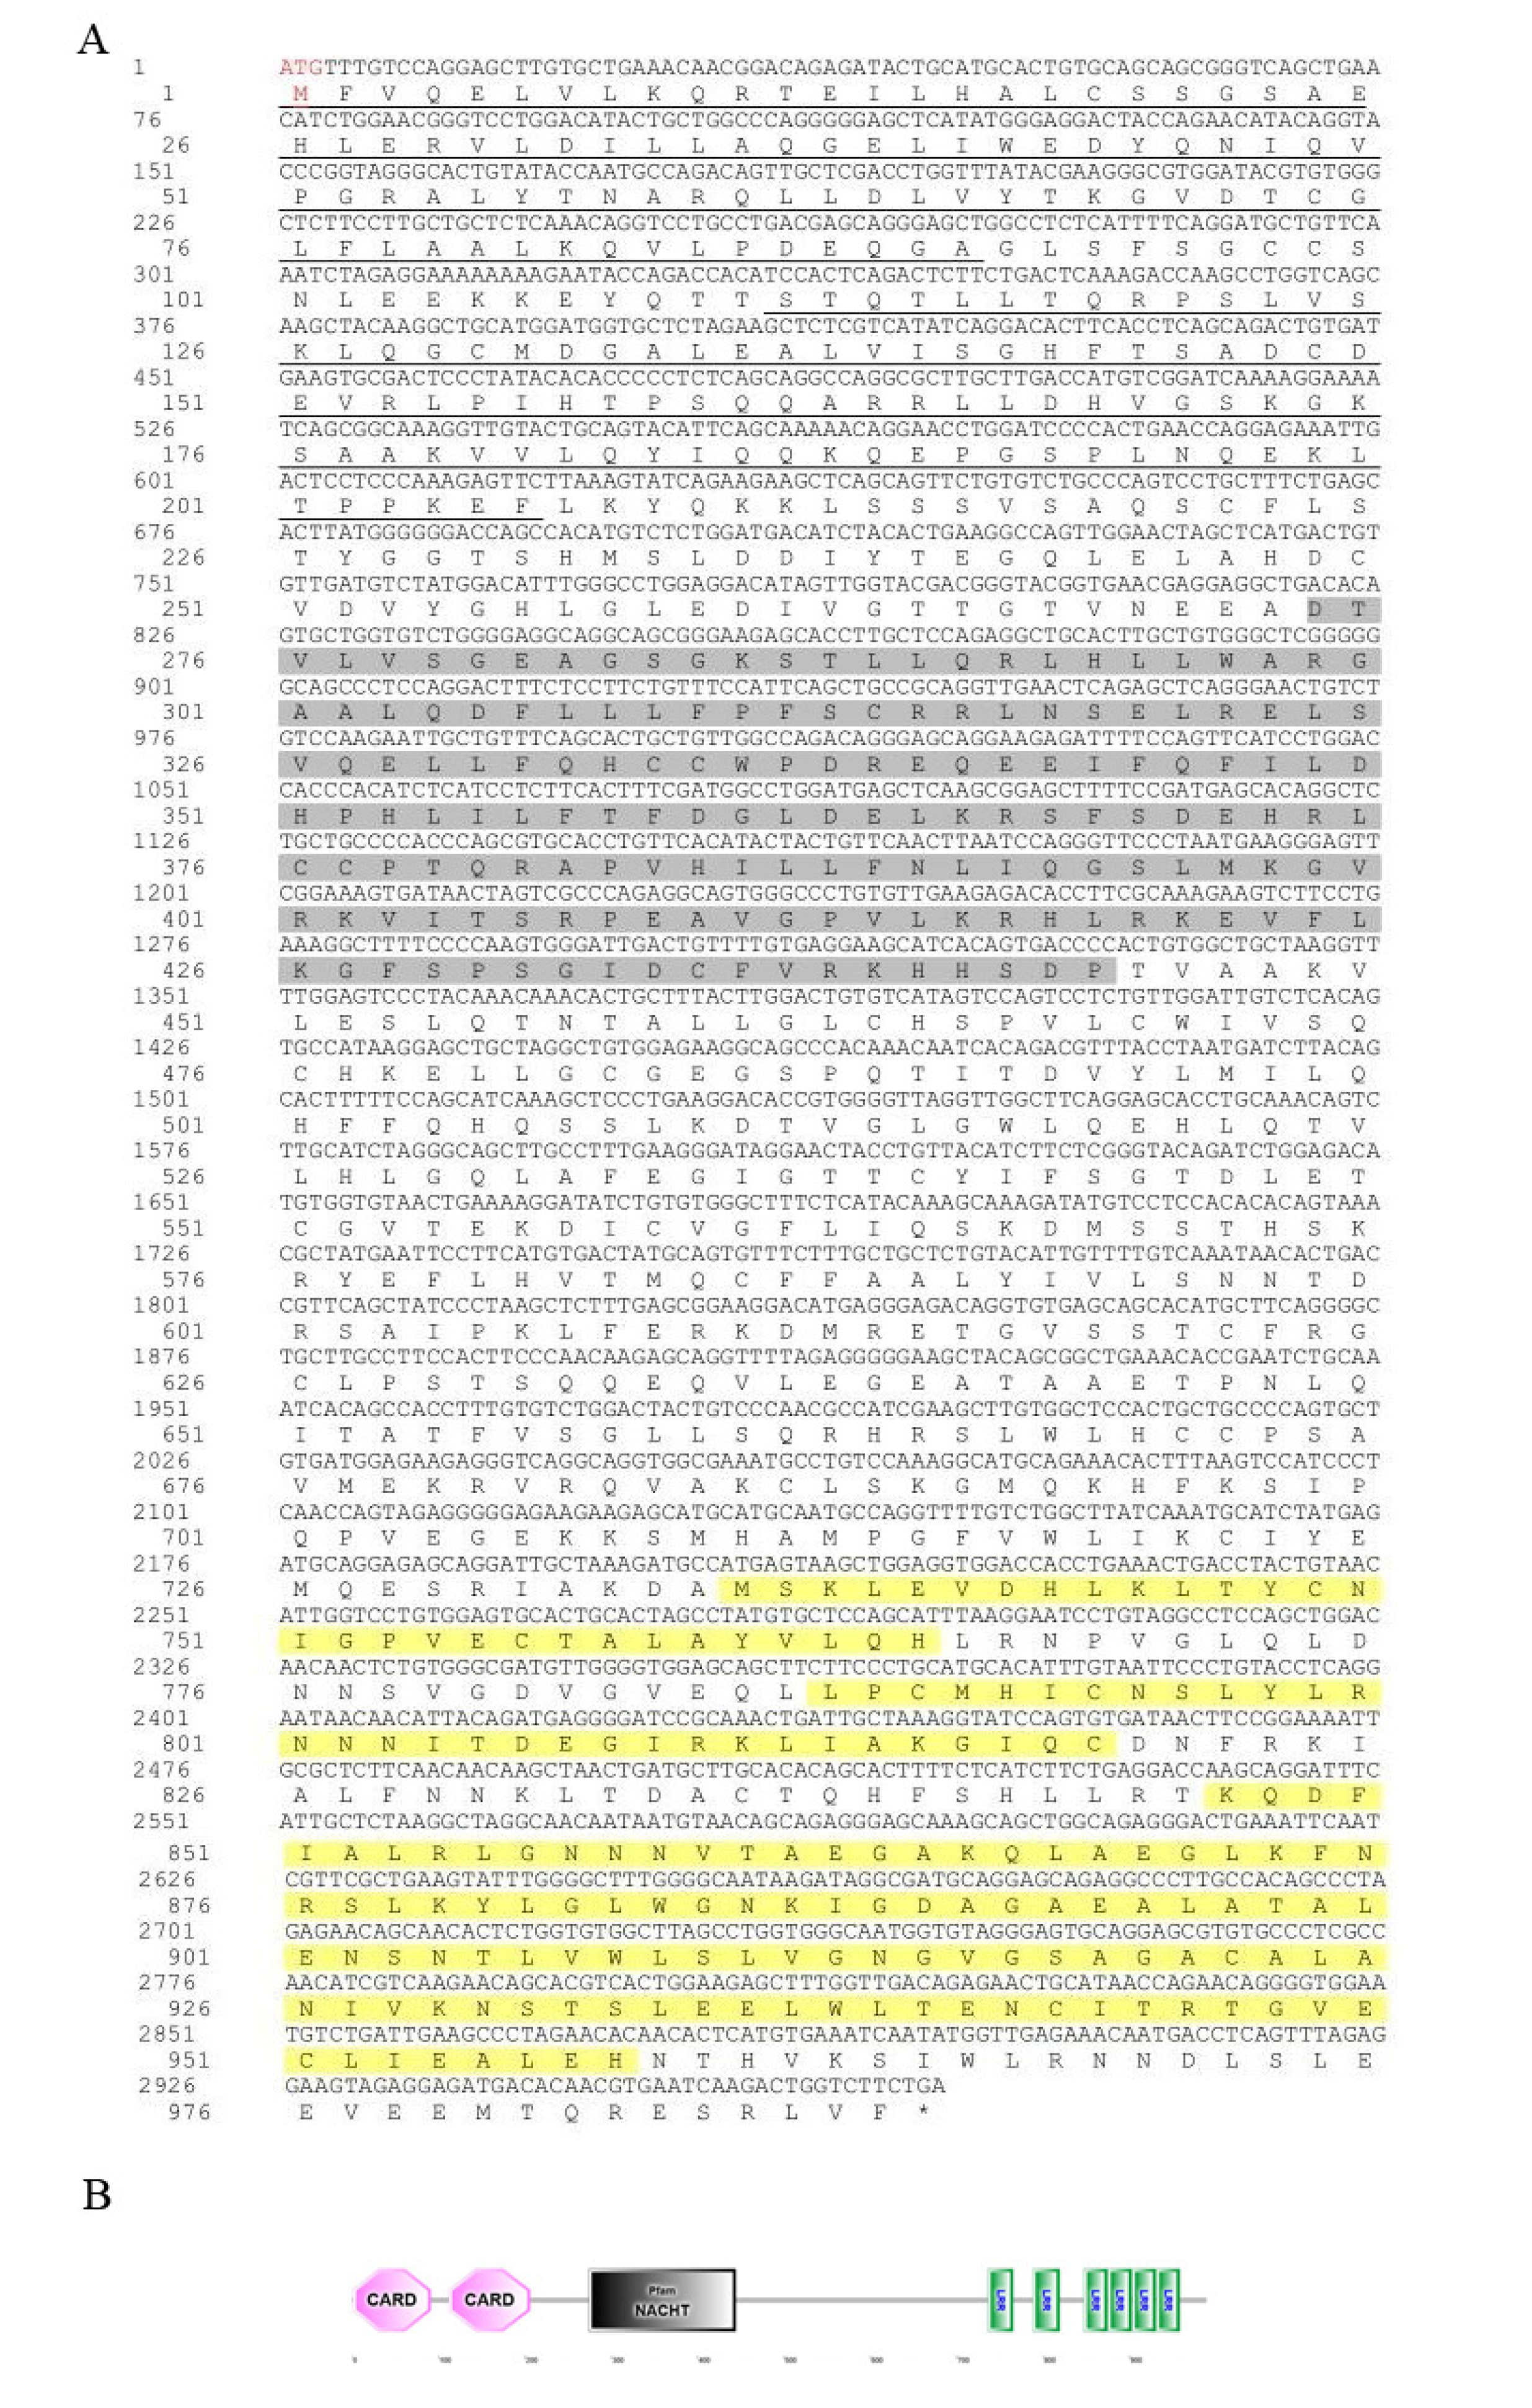
Figure 3.
Amino acid sequence and predicted domains of Optbk1 protein. (A) The translated amino acid sequence is marked below the nucleotide sequence (B) The protein domain prediction of Optbk1. The S-TKc domain is marked with an asterisk.
Figure 3.
Amino acid sequence and predicted domains of Optbk1 protein. (A) The translated amino acid sequence is marked below the nucleotide sequence (B) The protein domain prediction of Optbk1. The S-TKc domain is marked with an asterisk.
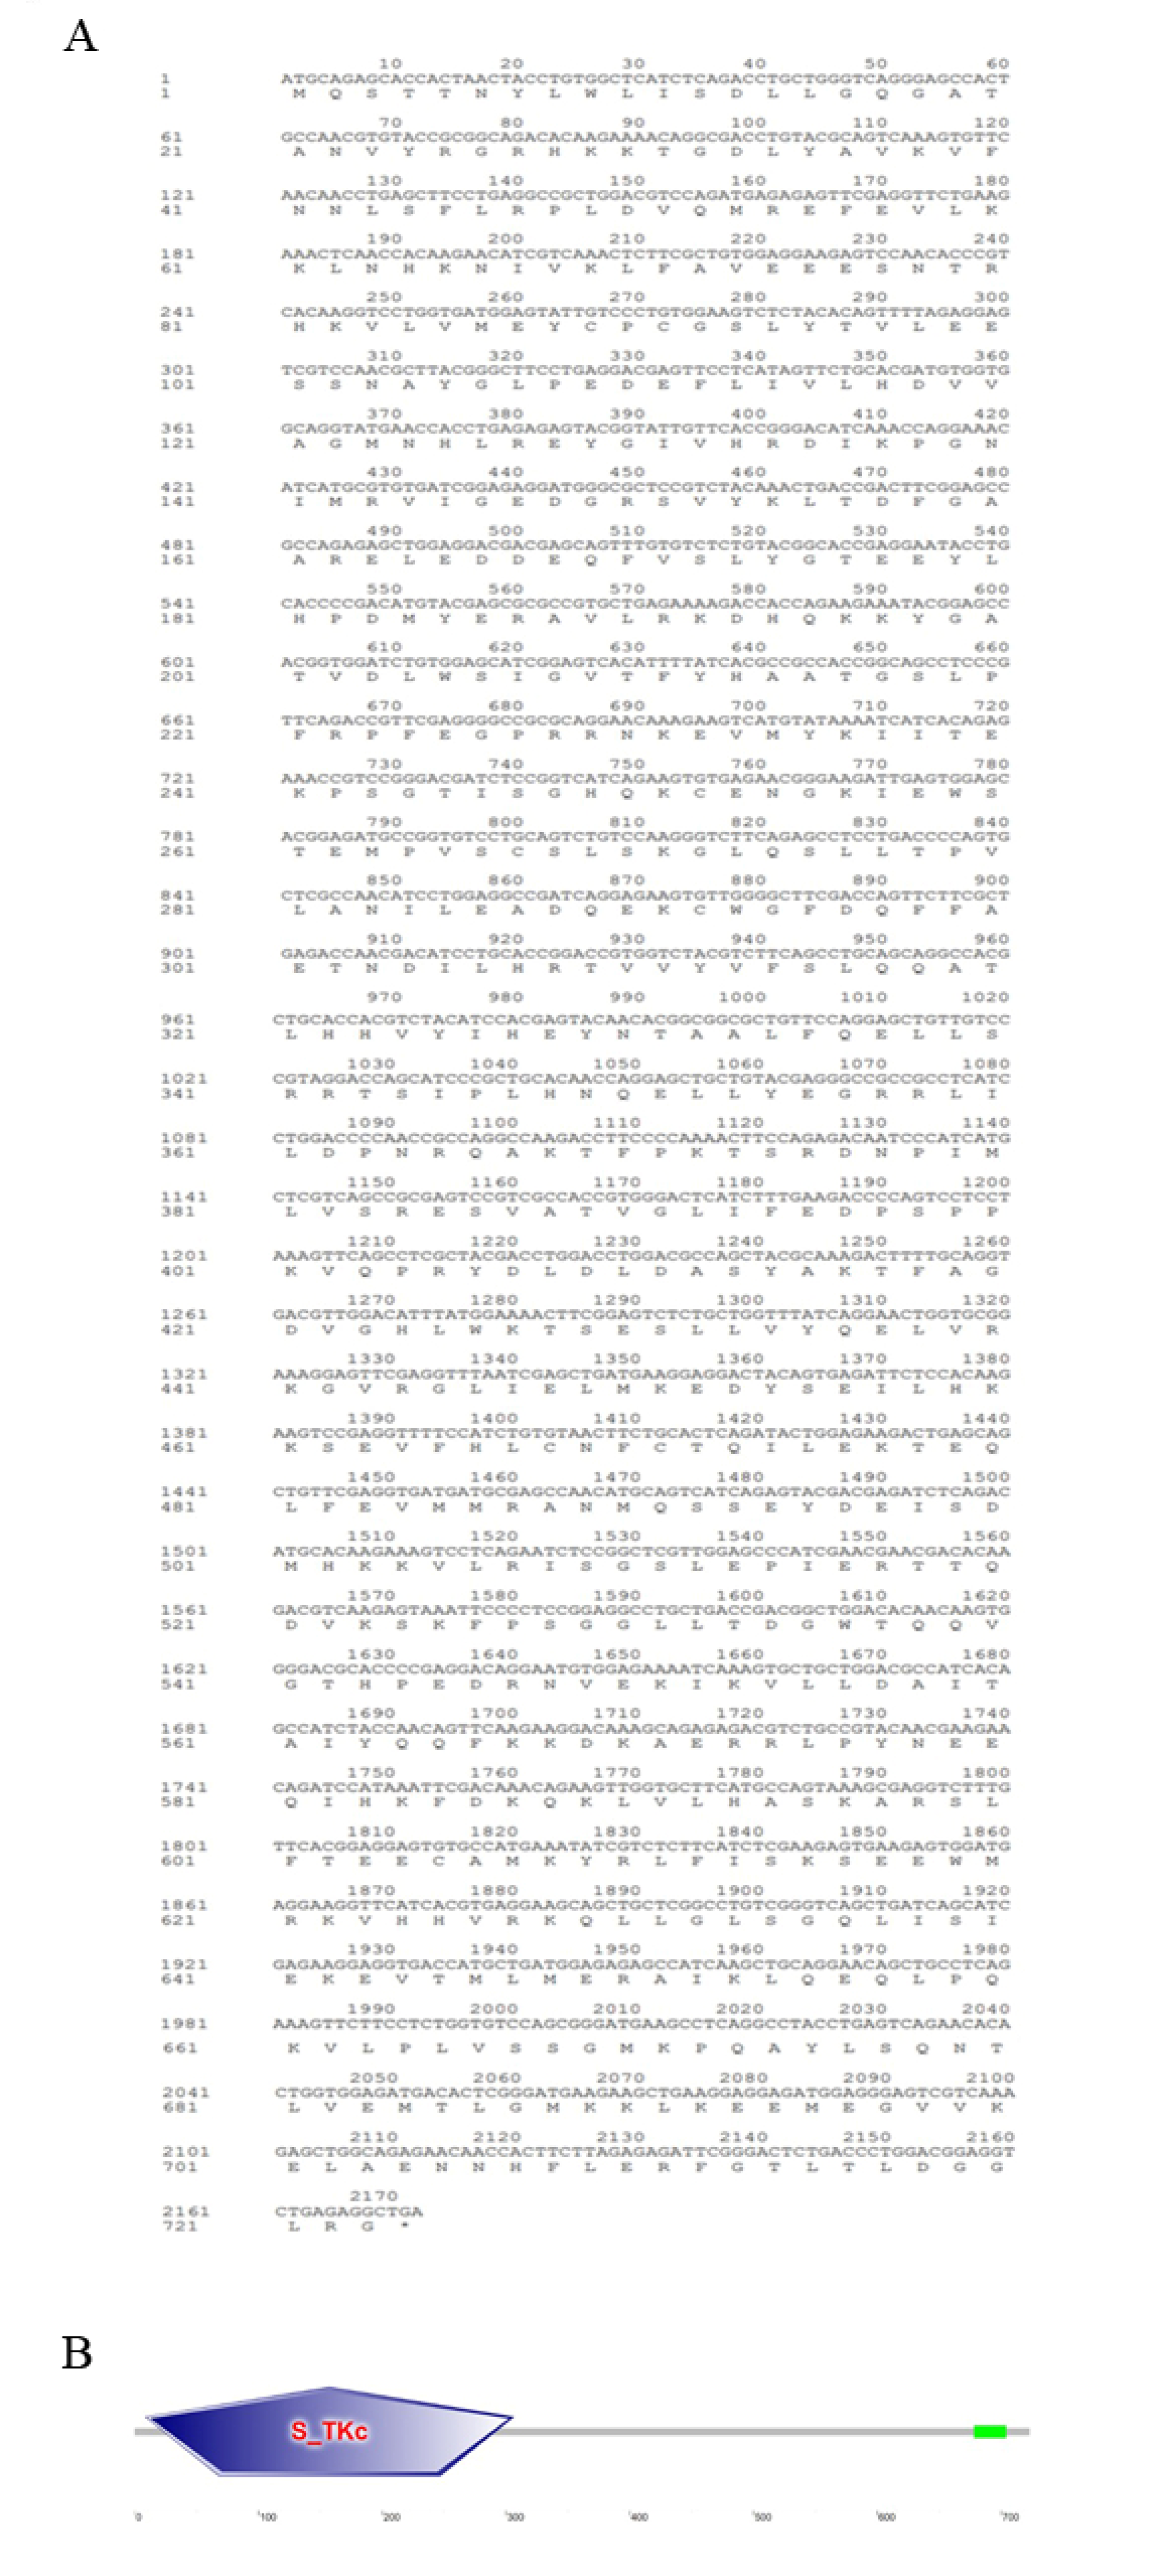
Figure 3.
Multiple alignment of the deduced amino acids of nod1 among Oplegnathus punctatus and other different species.
Figure 3.
Multiple alignment of the deduced amino acids of nod1 among Oplegnathus punctatus and other different species.
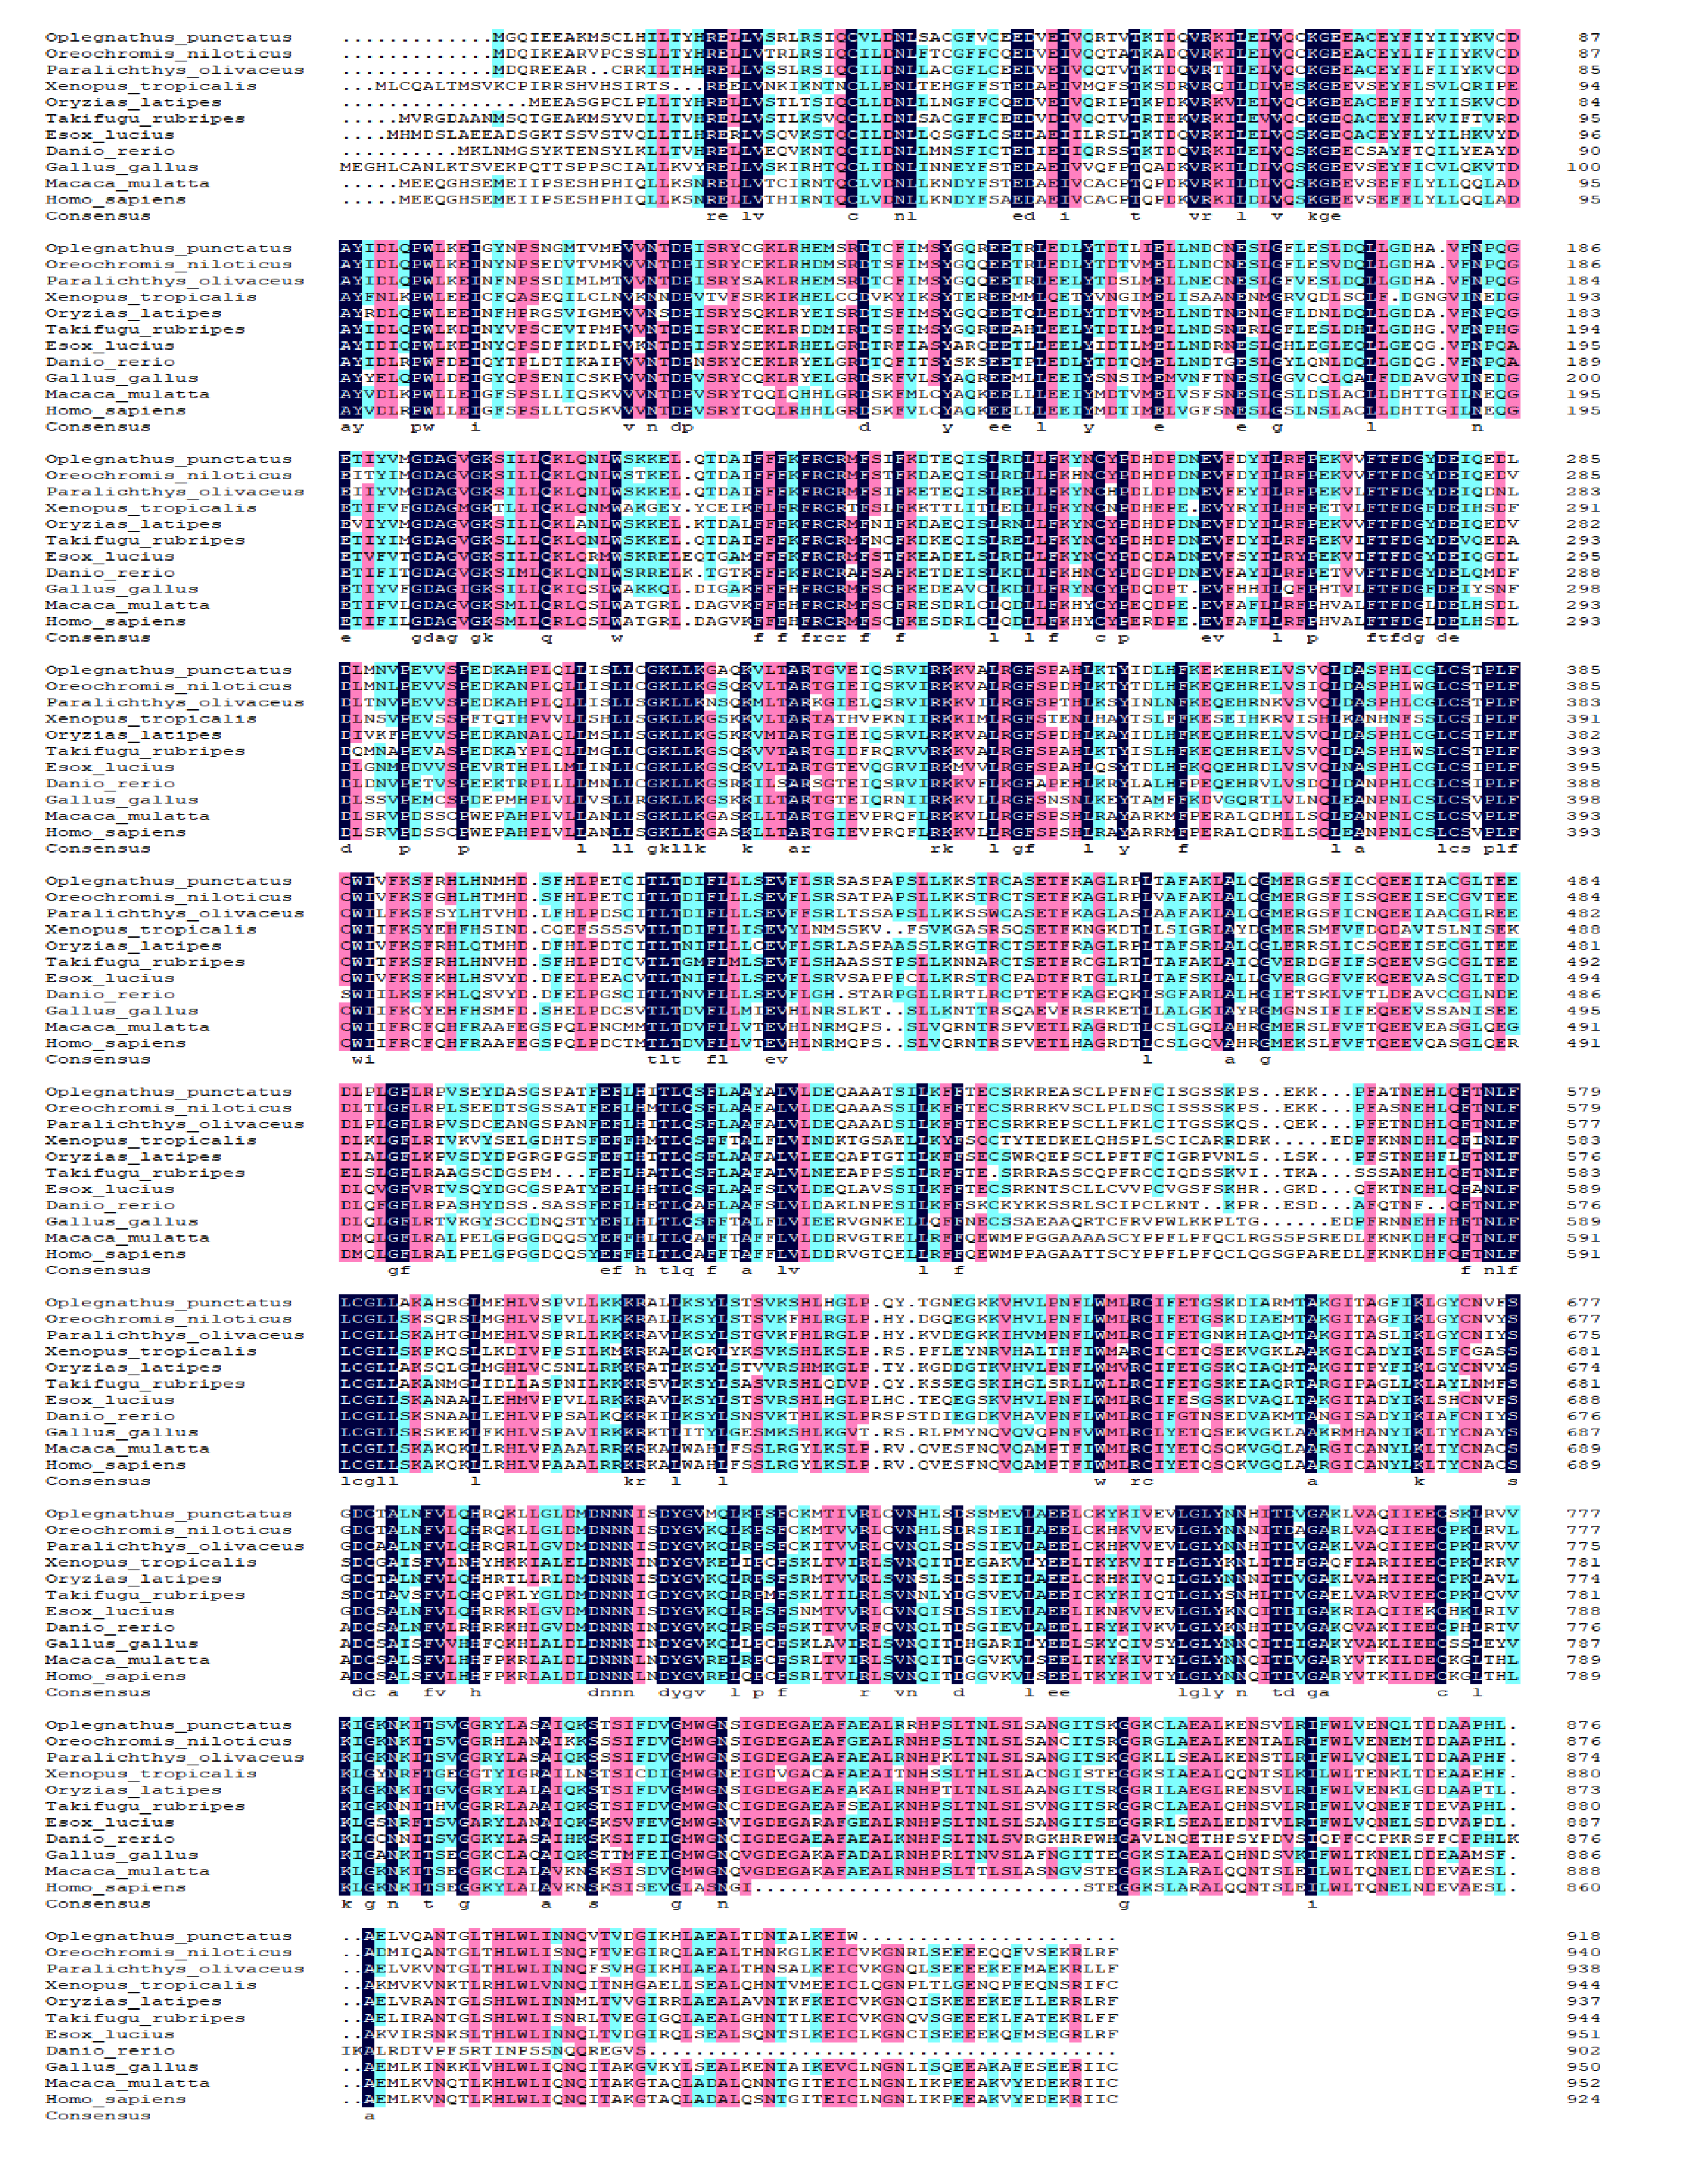
Figure 4.
Multiple alignment of the deduced amino acids of nod2 among Oplegnathus punctatus and other different species.
Figure 4.
Multiple alignment of the deduced amino acids of nod2 among Oplegnathus punctatus and other different species.
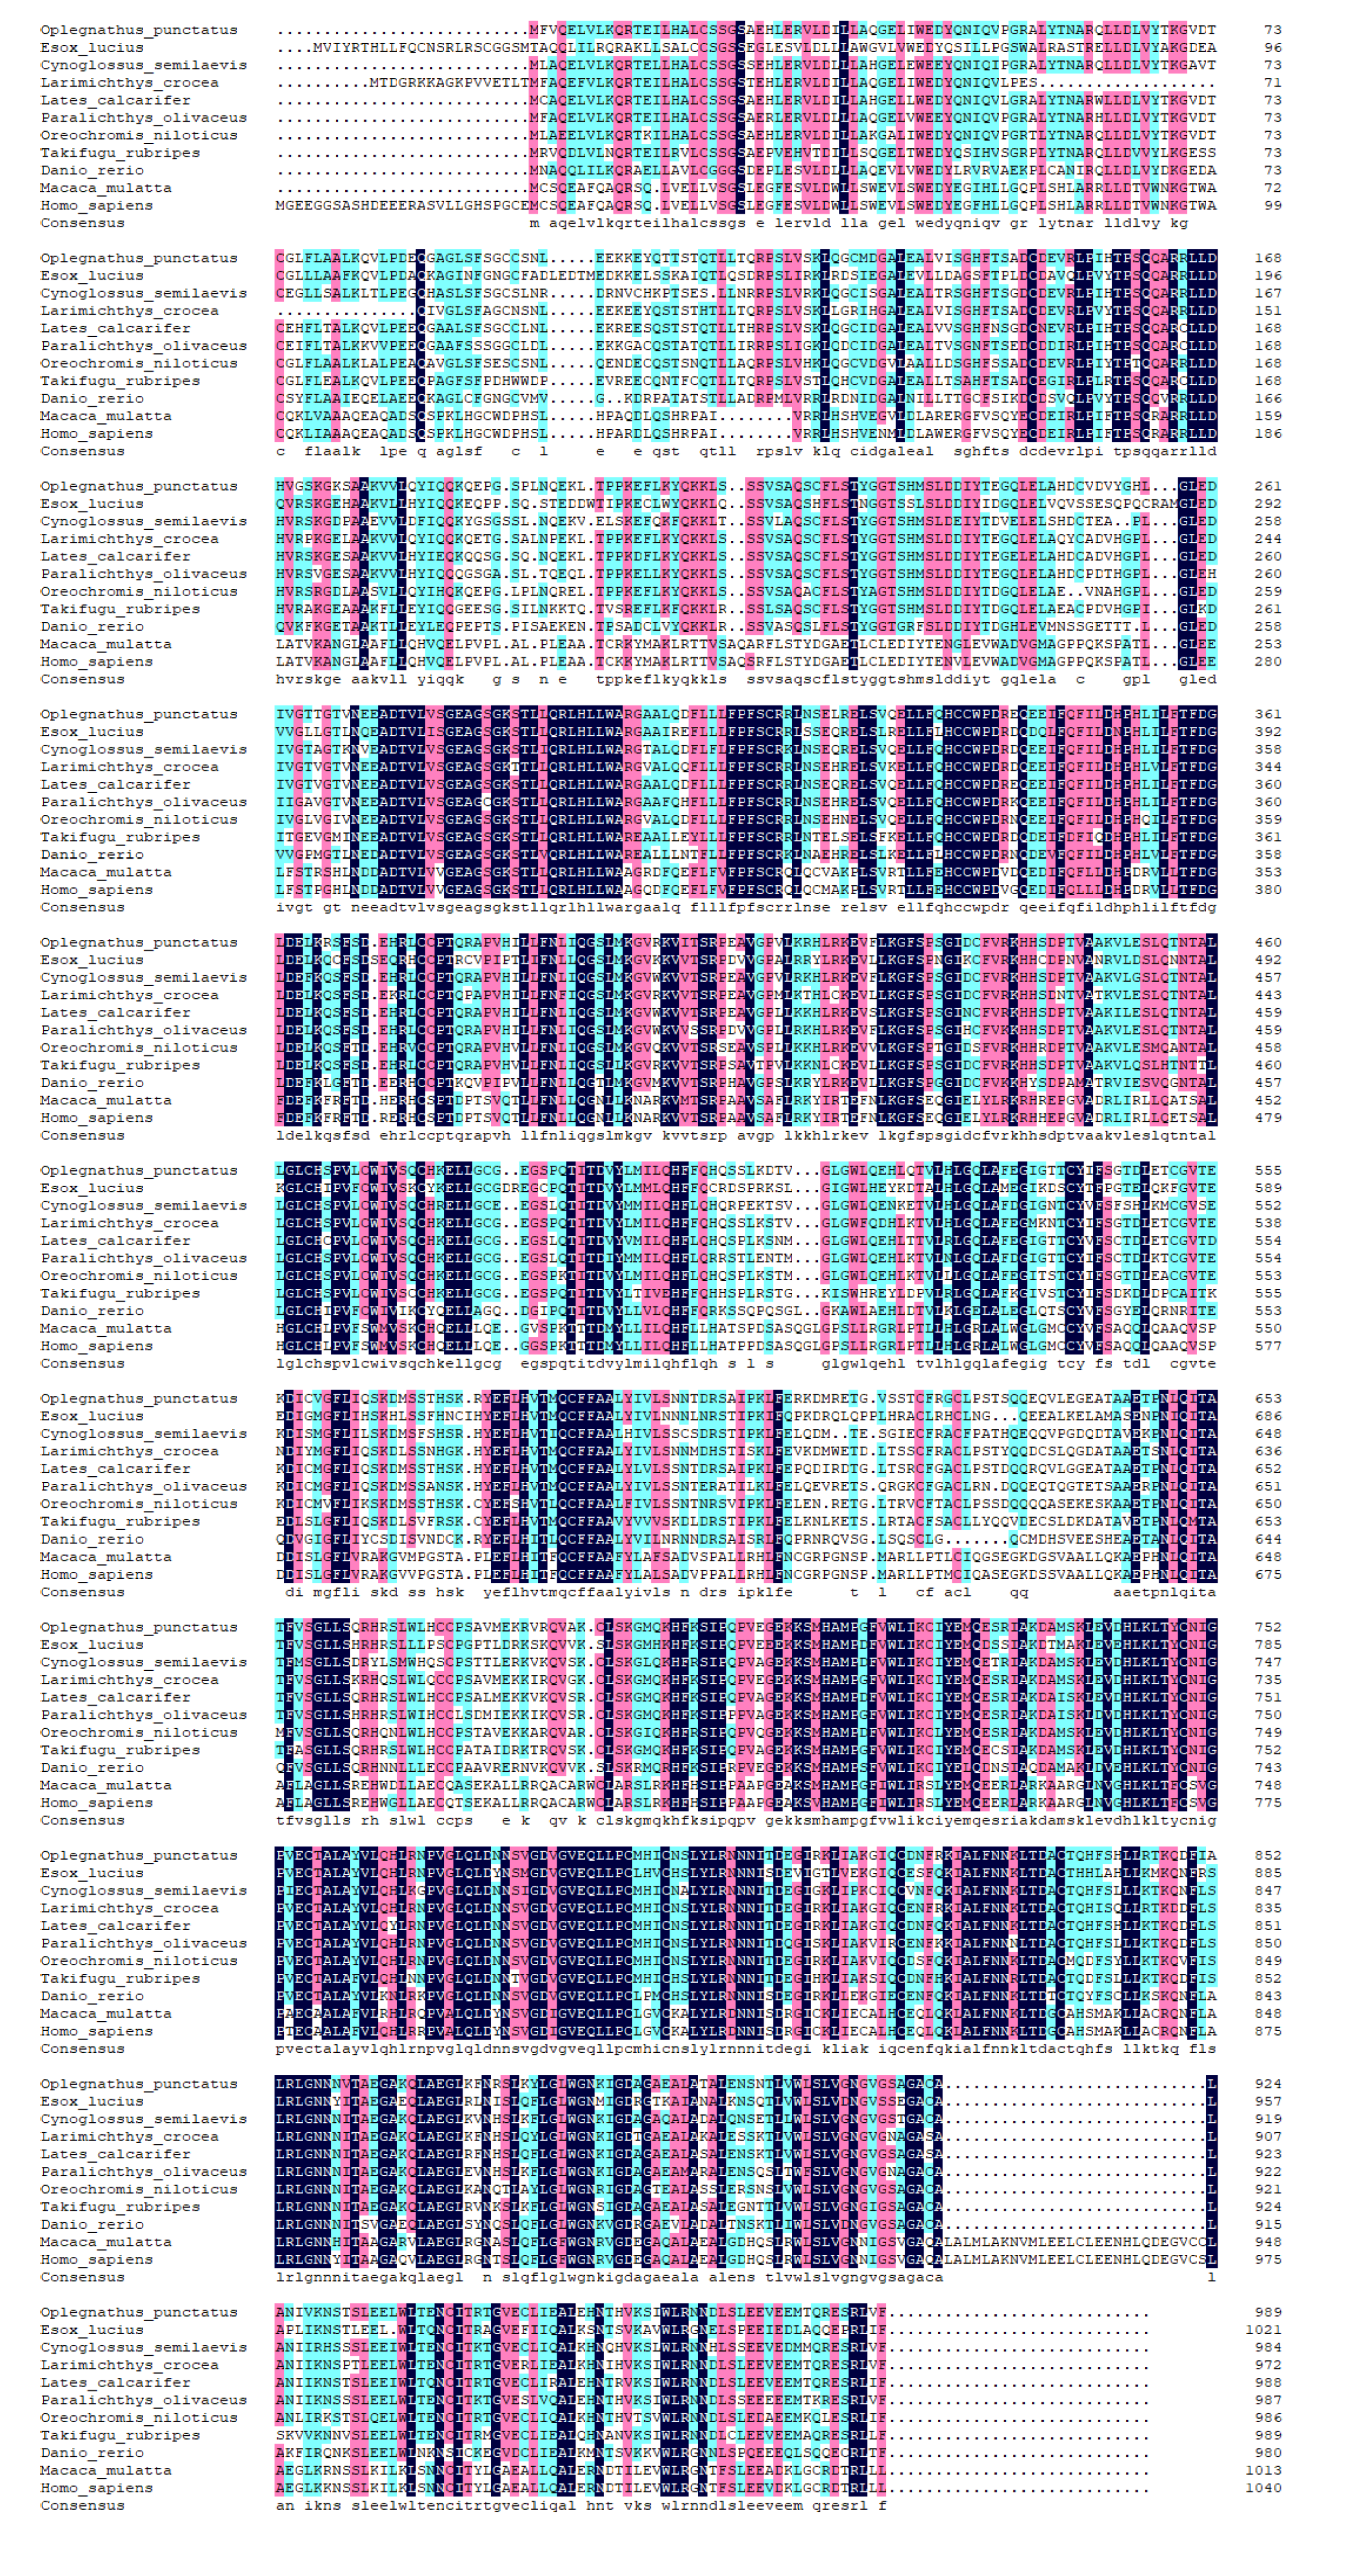
Figure 5.
Multiple alignment of the deduced amino acids of tbk1 among Oplegnathus punctatus and other different species.
Figure 5.
Multiple alignment of the deduced amino acids of tbk1 among Oplegnathus punctatus and other different species.
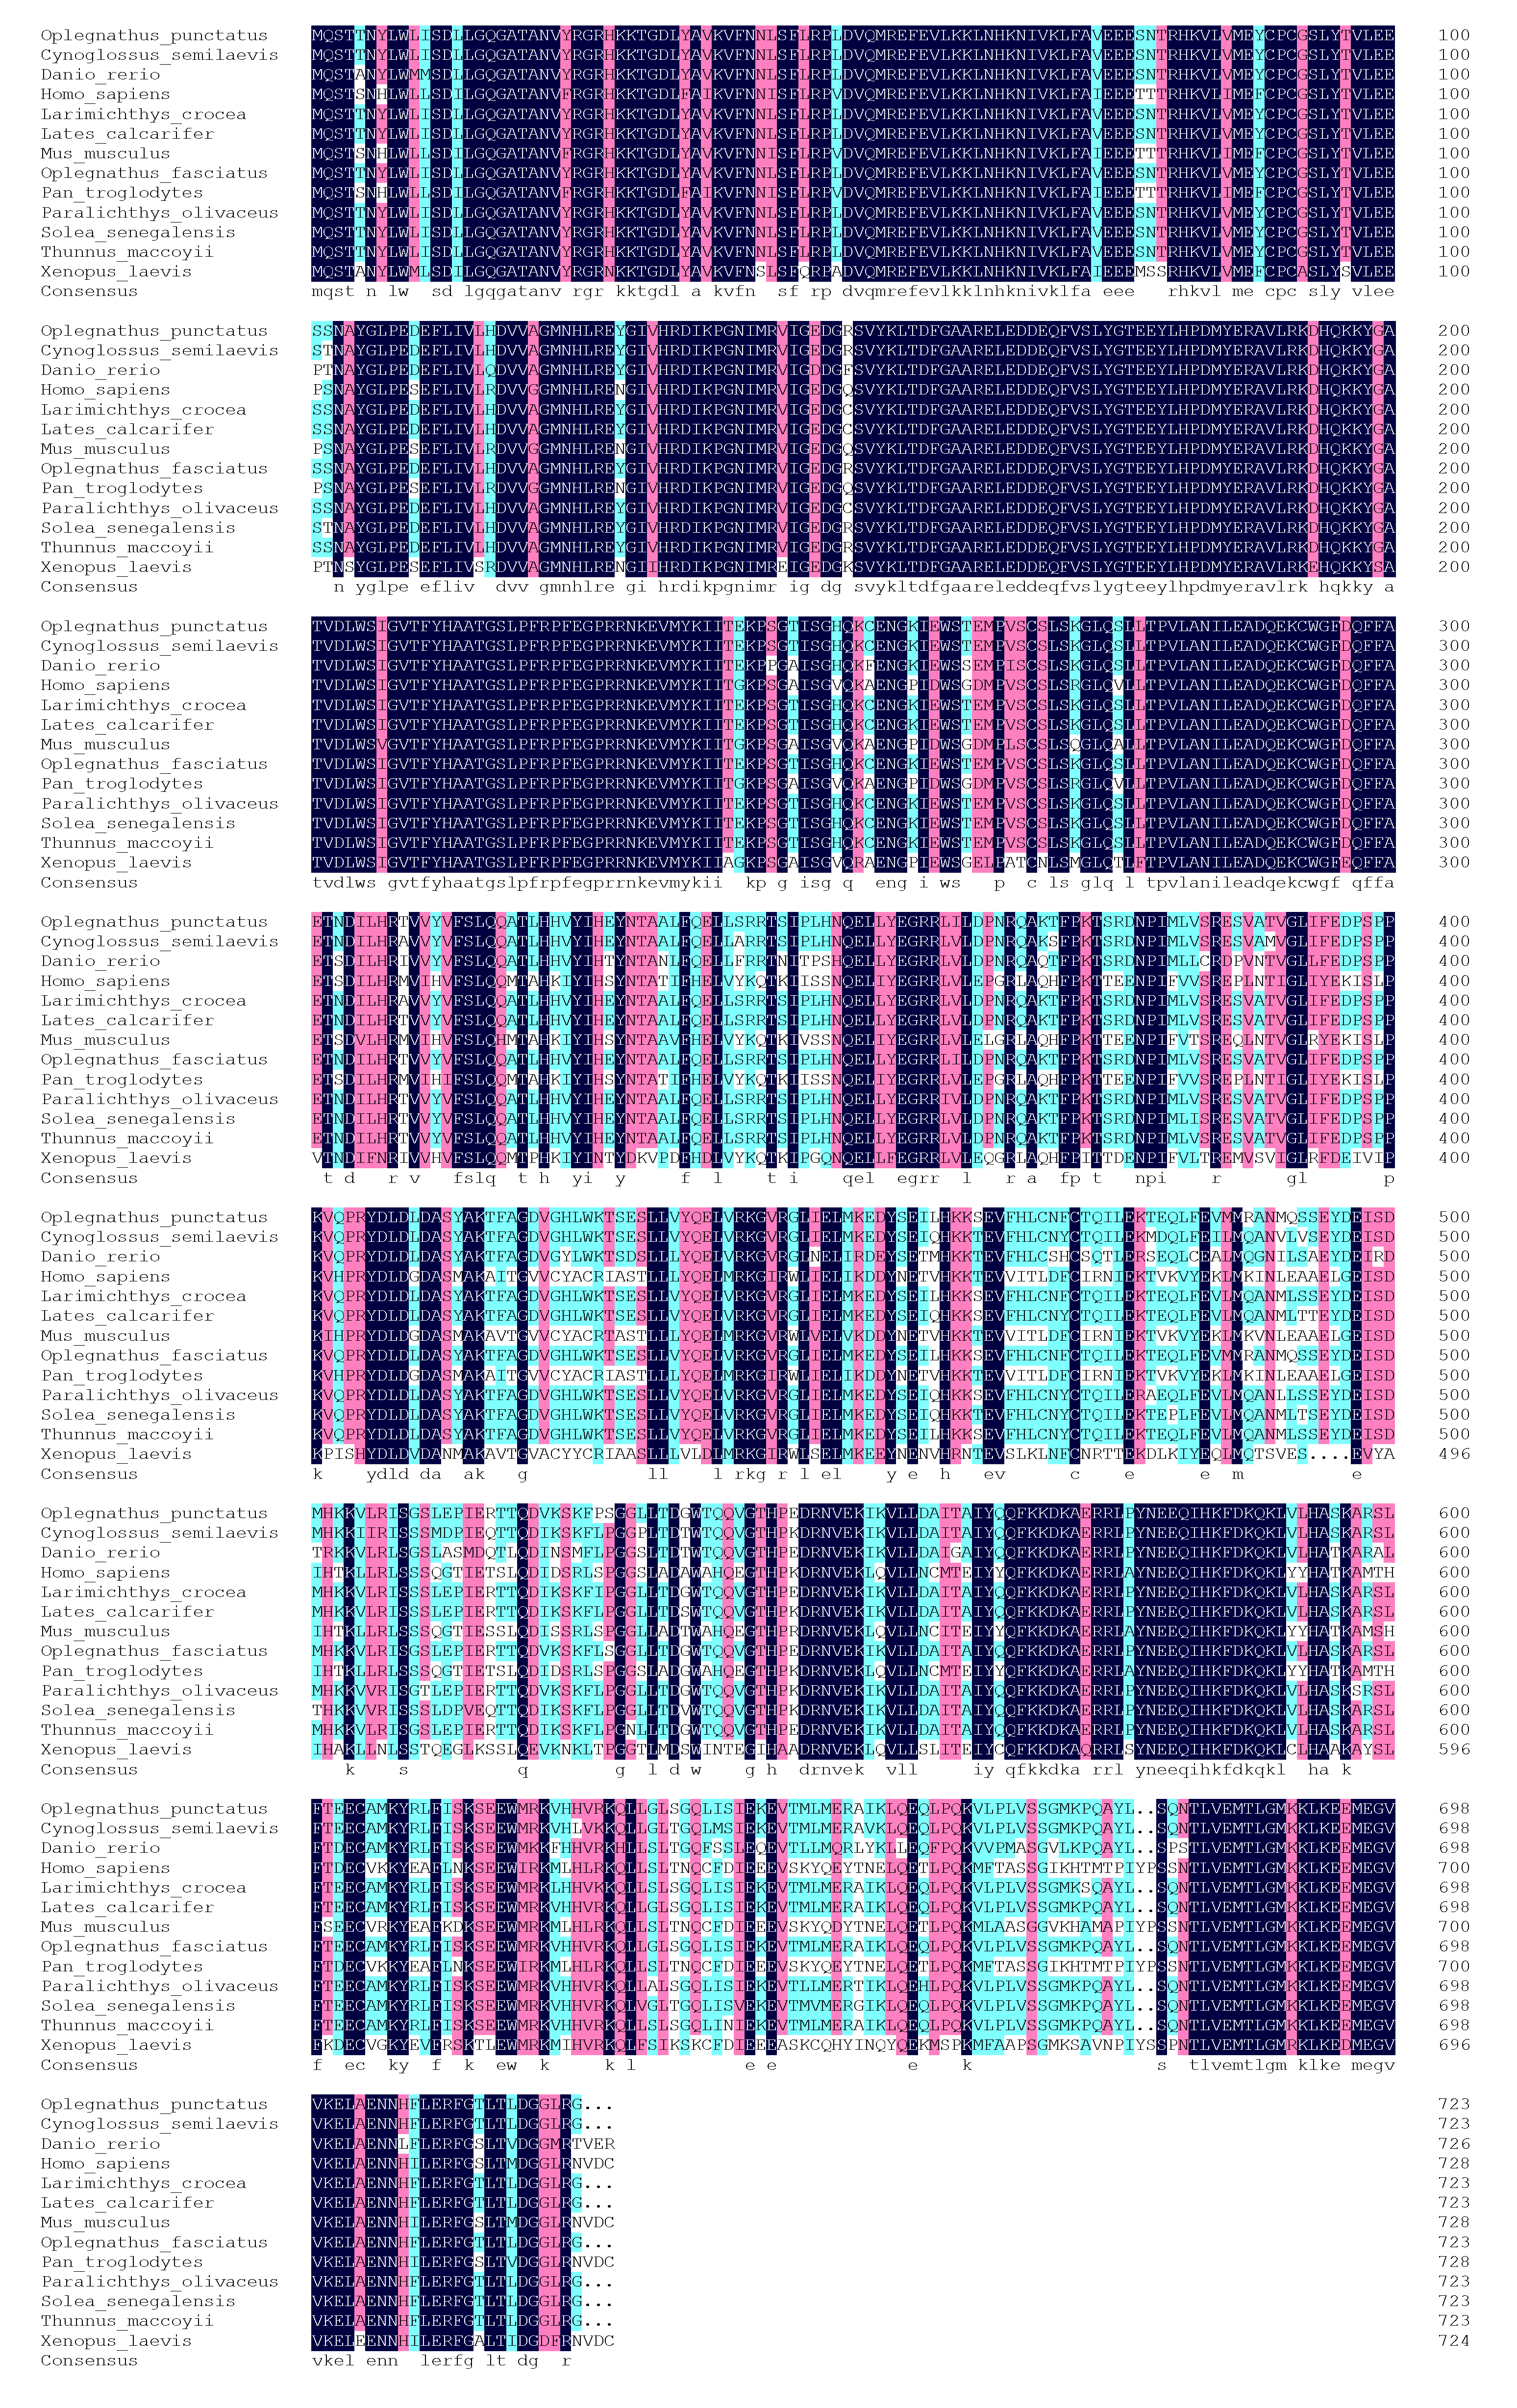
Figure 6.
Phylogenetic tree based on the amino acid sequences of nod1 and nod2 from various species.
Figure 6.
Phylogenetic tree based on the amino acid sequences of nod1 and nod2 from various species.
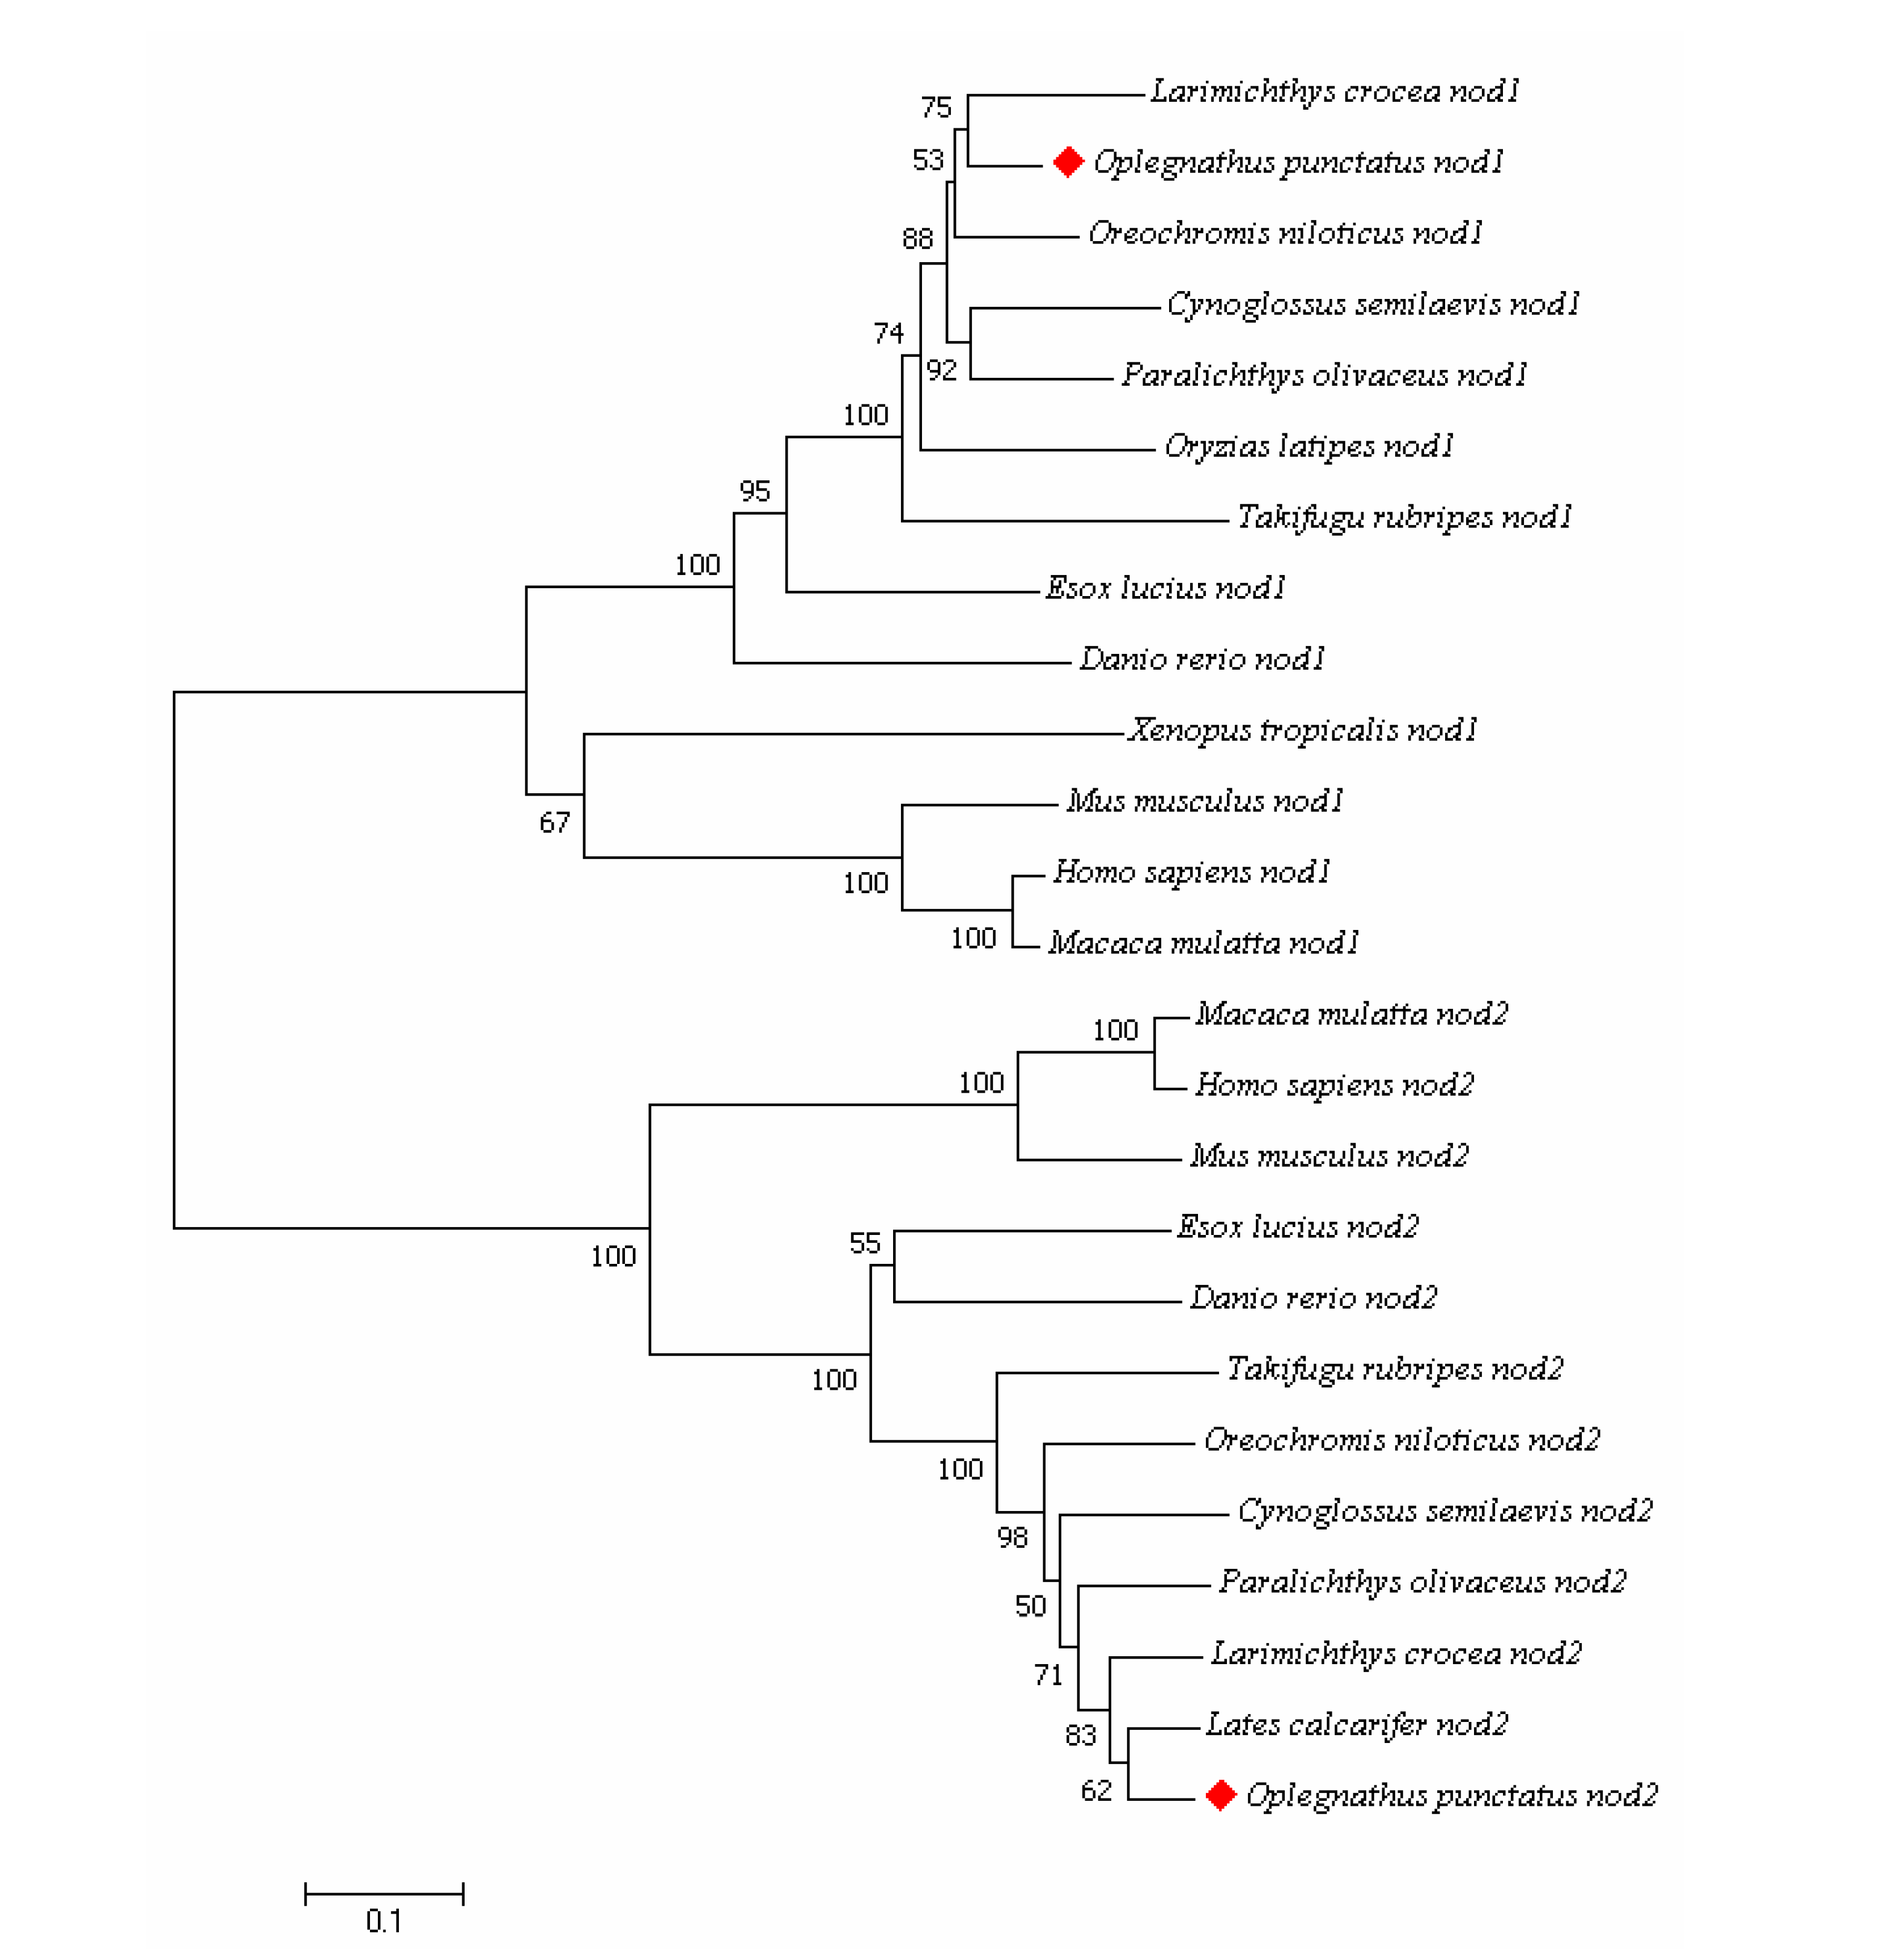
Figure 7.
Phylogenetic tree based on the amino acid sequences of tbk1 from various species.
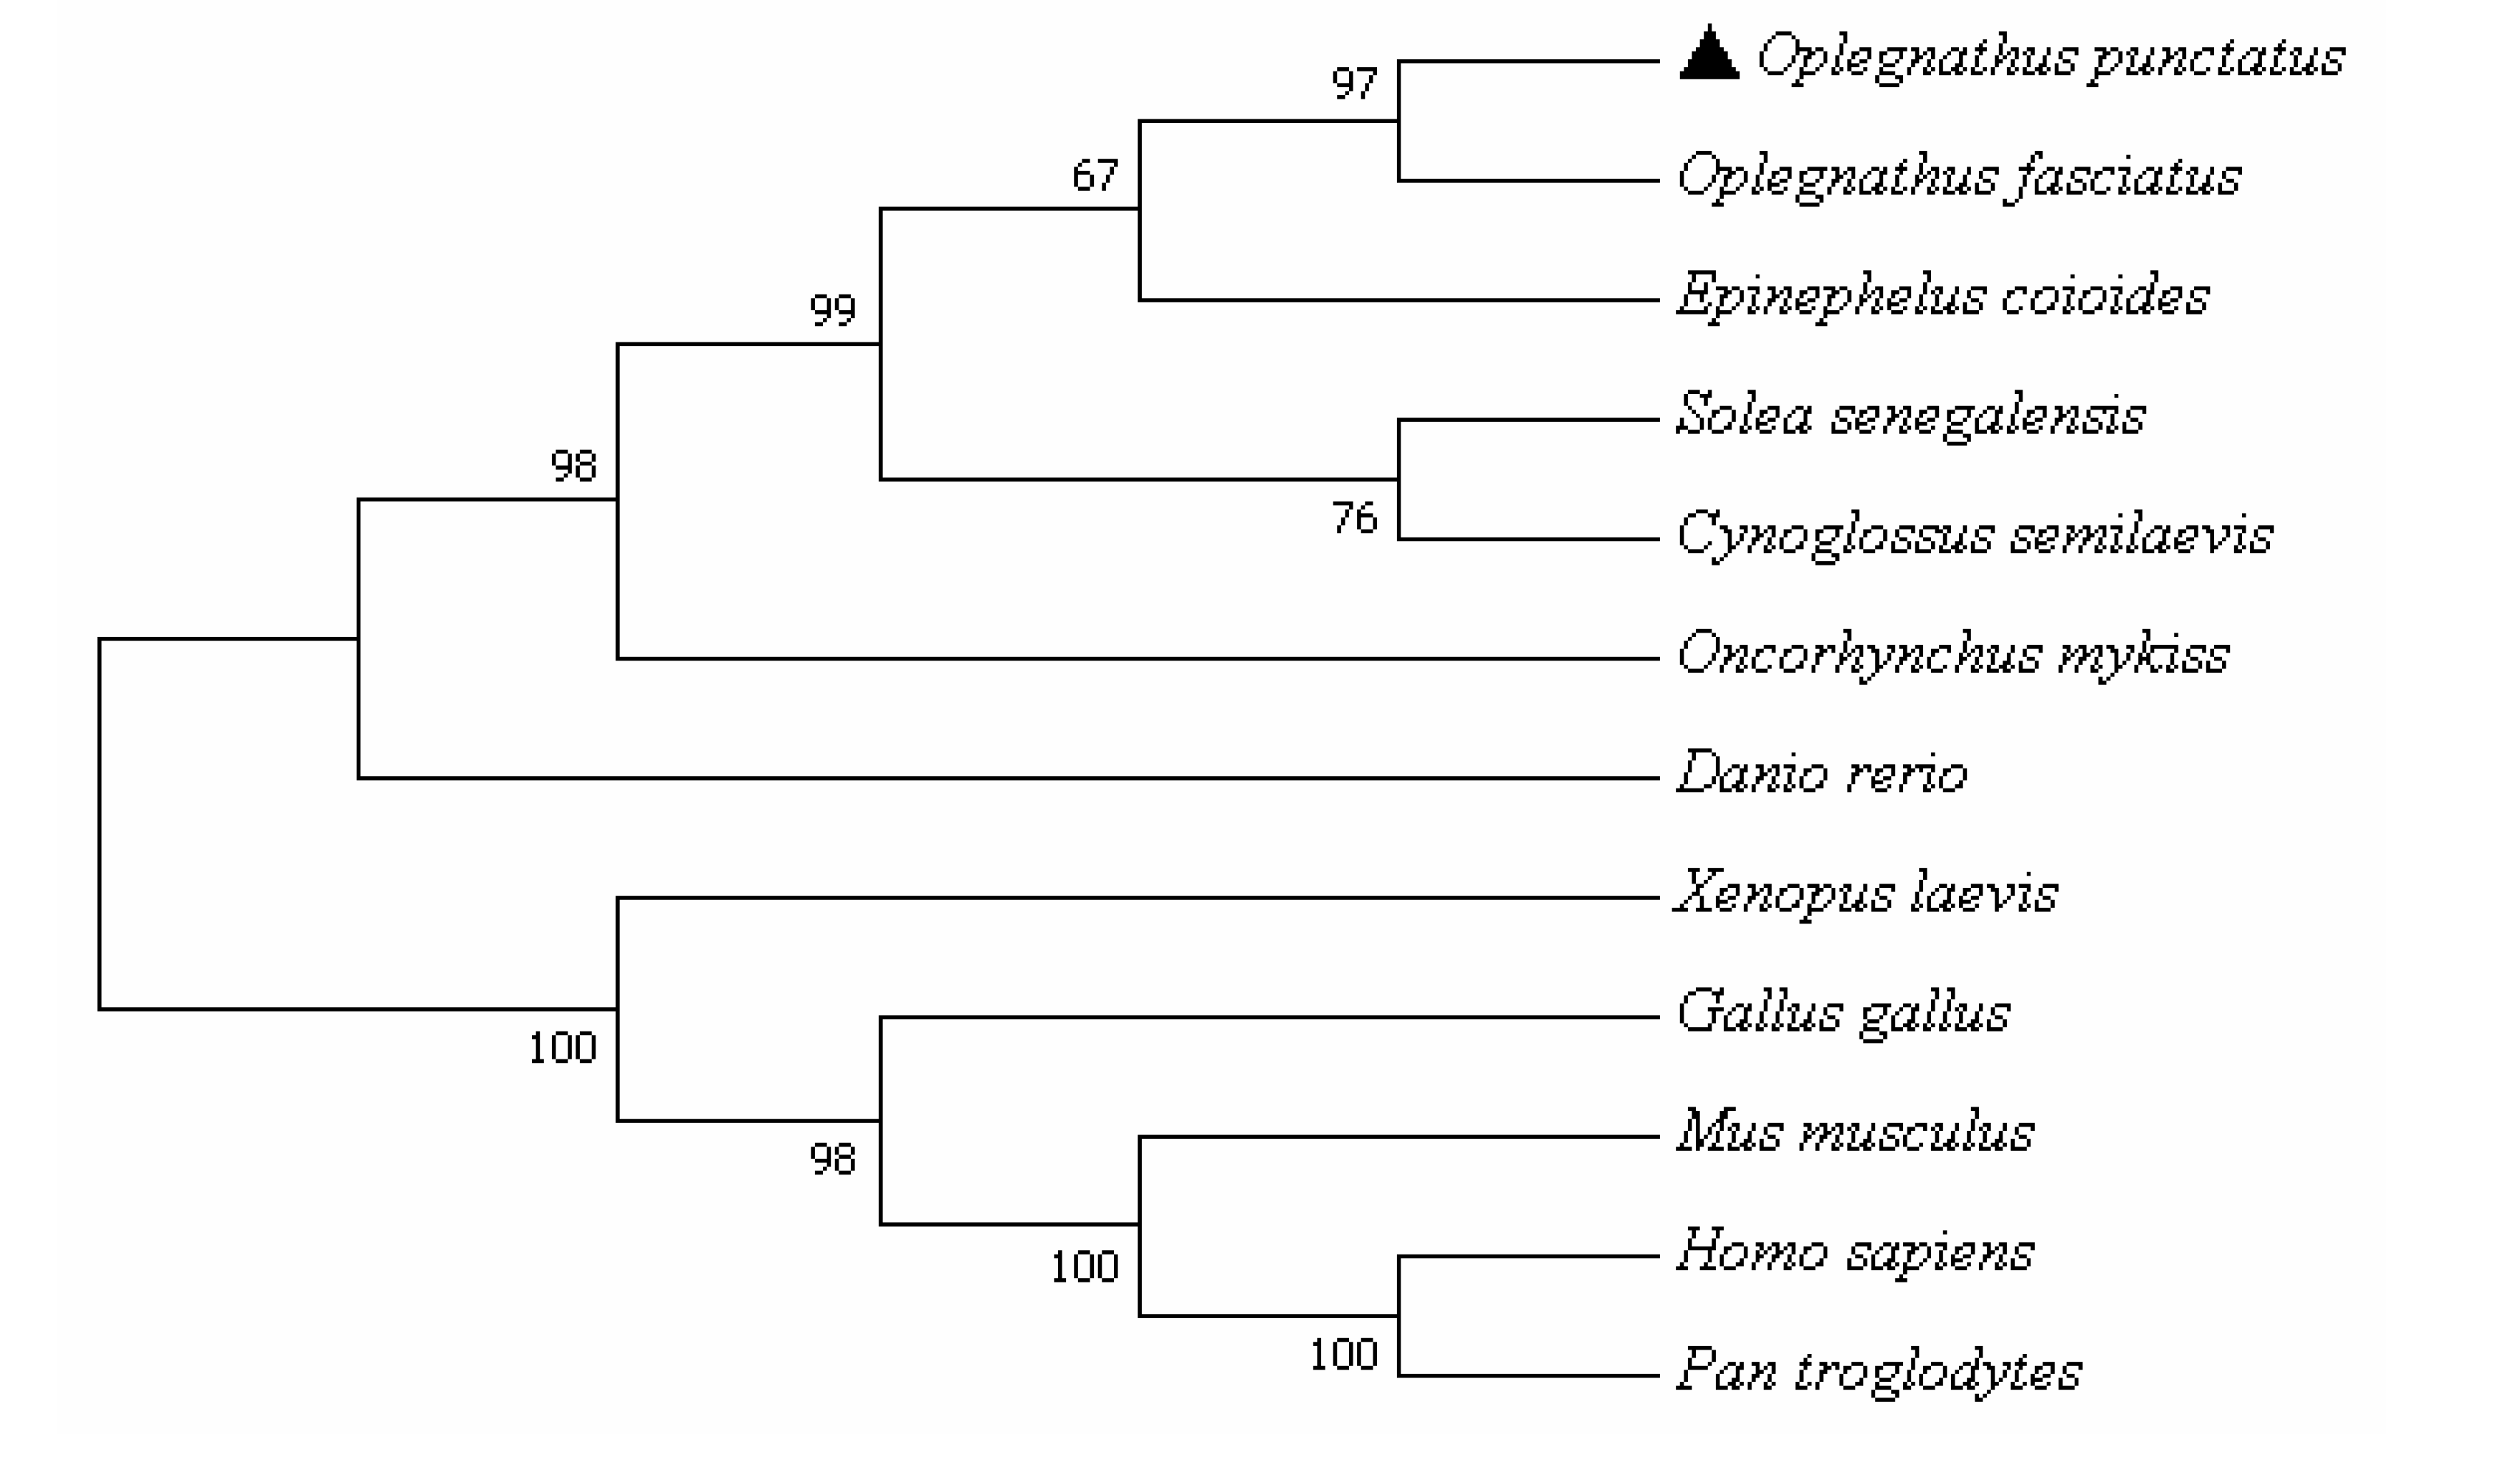
Figure 8.
Expression of Opnod1, Opnod2 and Optbk1 mRNA in different tissues of healthy O. punctatus.
Figure 8.
Expression of Opnod1, Opnod2 and Optbk1 mRNA in different tissues of healthy O. punctatus.
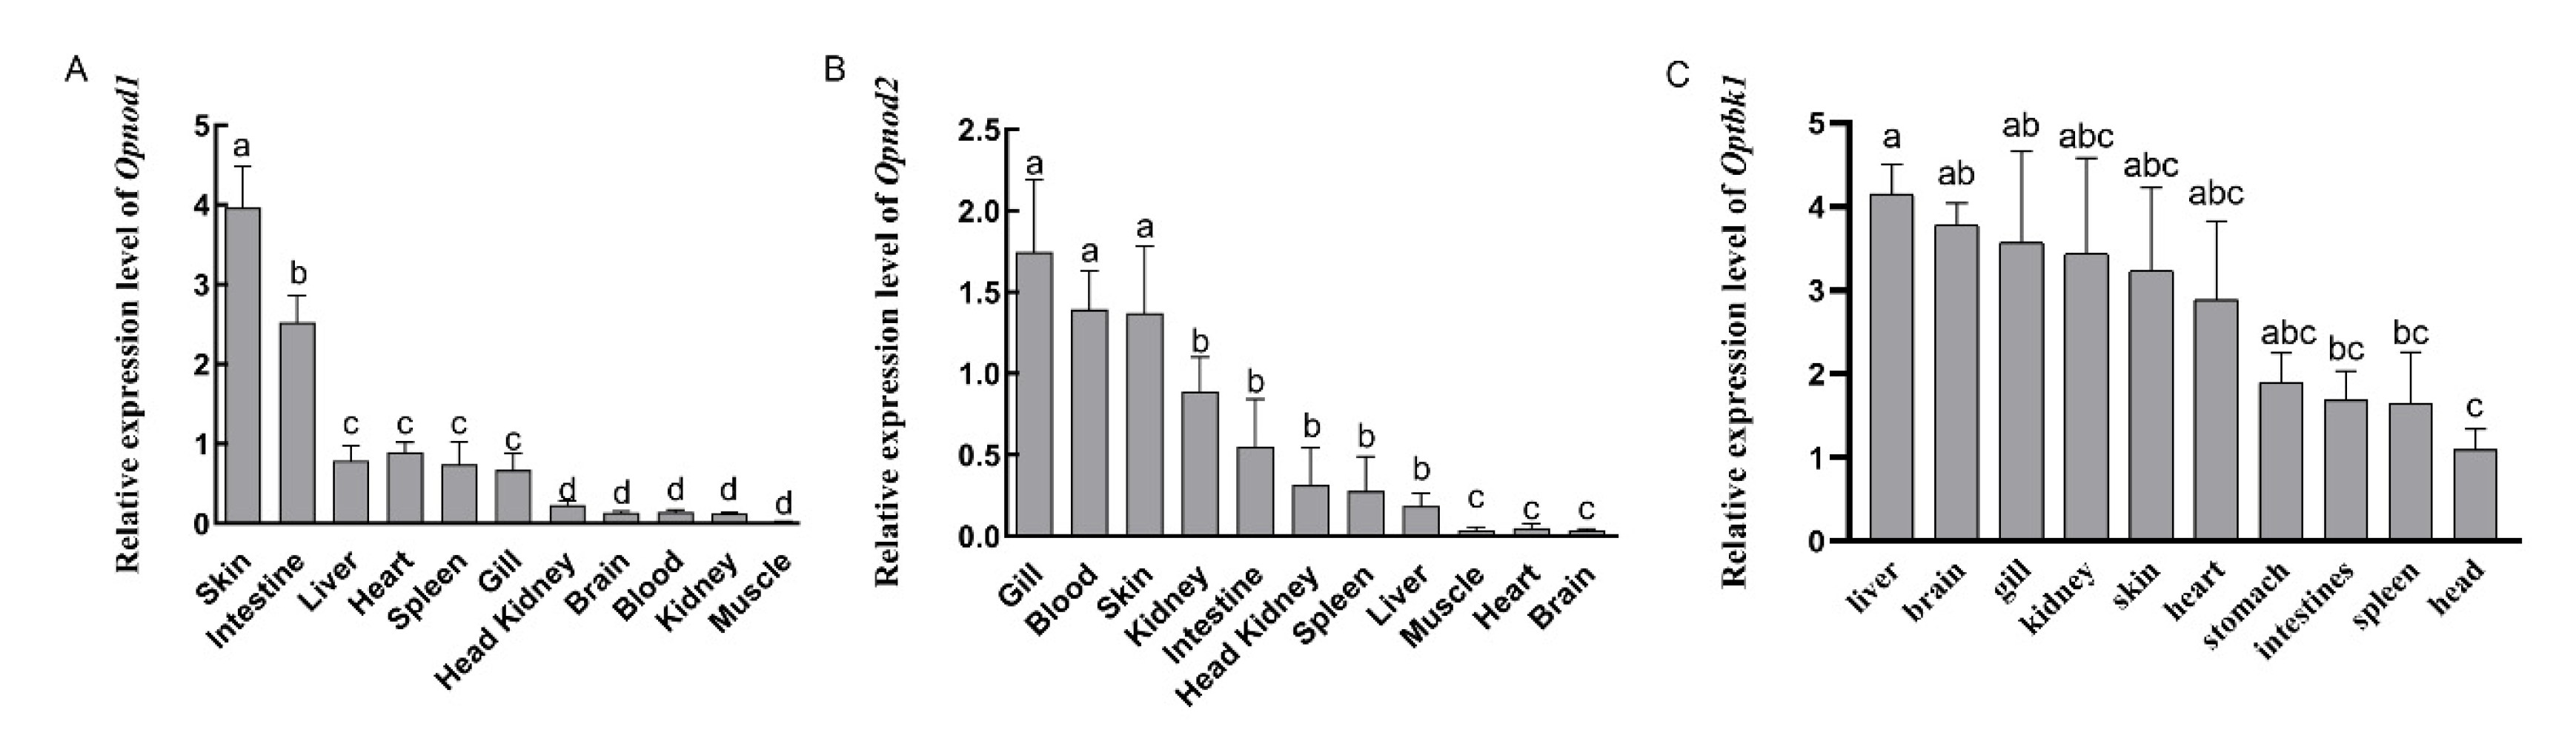
Figure 9.
Relative expression of Opnod1 gene in three tissues (liver, spleen, and kidney) of Oplegnathus punctatus at different time points after SKIV-SD infection. All the data are shown as mean±SE (n=3).The asterisk indicates a significant difference (*P<0.05, **P<0.01, ***P<0.001).
Figure 9.
Relative expression of Opnod1 gene in three tissues (liver, spleen, and kidney) of Oplegnathus punctatus at different time points after SKIV-SD infection. All the data are shown as mean±SE (n=3).The asterisk indicates a significant difference (*P<0.05, **P<0.01, ***P<0.001).
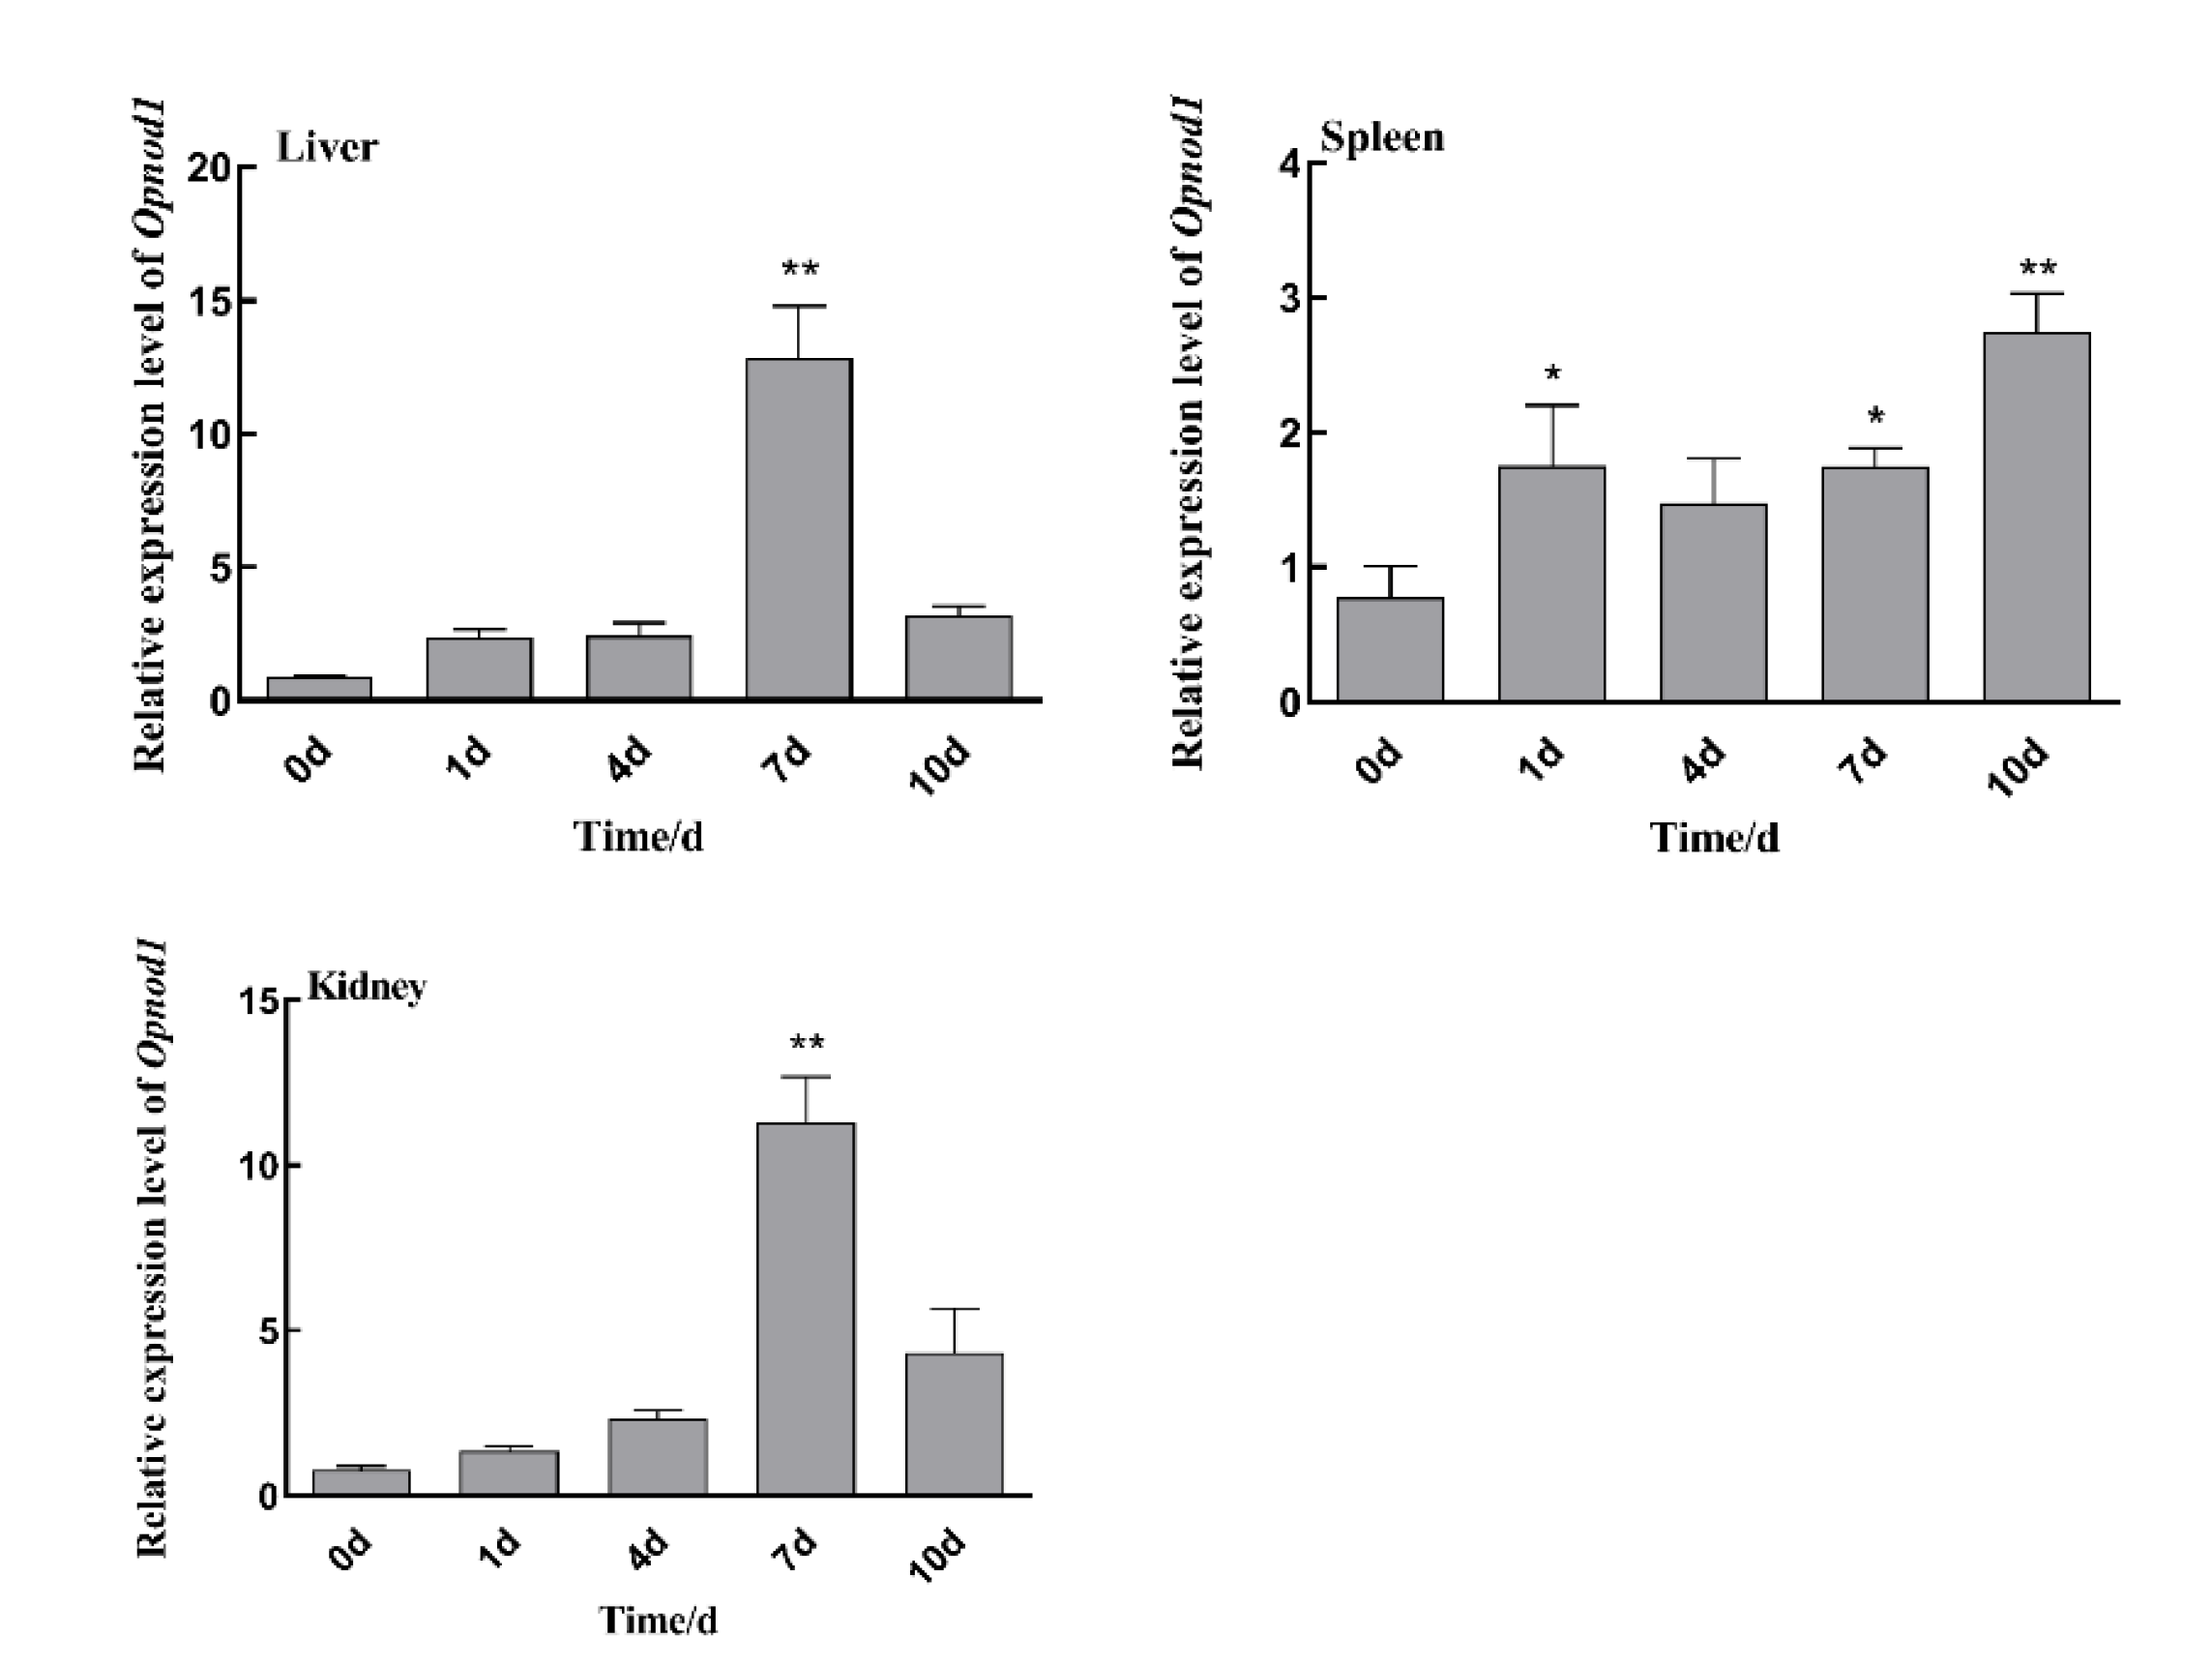
Figure 10.
Relative expression of Opnod2 gene in three tissues (liver, spleen and kidney) of Oplegnathus punctatus at different time points after SKIV-SD infection. All the data are shown as mean±SE (n=3). The asterisk indicates a significant difference (*P<0.05, **P<0.01, ***P<0.001).
Figure 10.
Relative expression of Opnod2 gene in three tissues (liver, spleen and kidney) of Oplegnathus punctatus at different time points after SKIV-SD infection. All the data are shown as mean±SE (n=3). The asterisk indicates a significant difference (*P<0.05, **P<0.01, ***P<0.001).
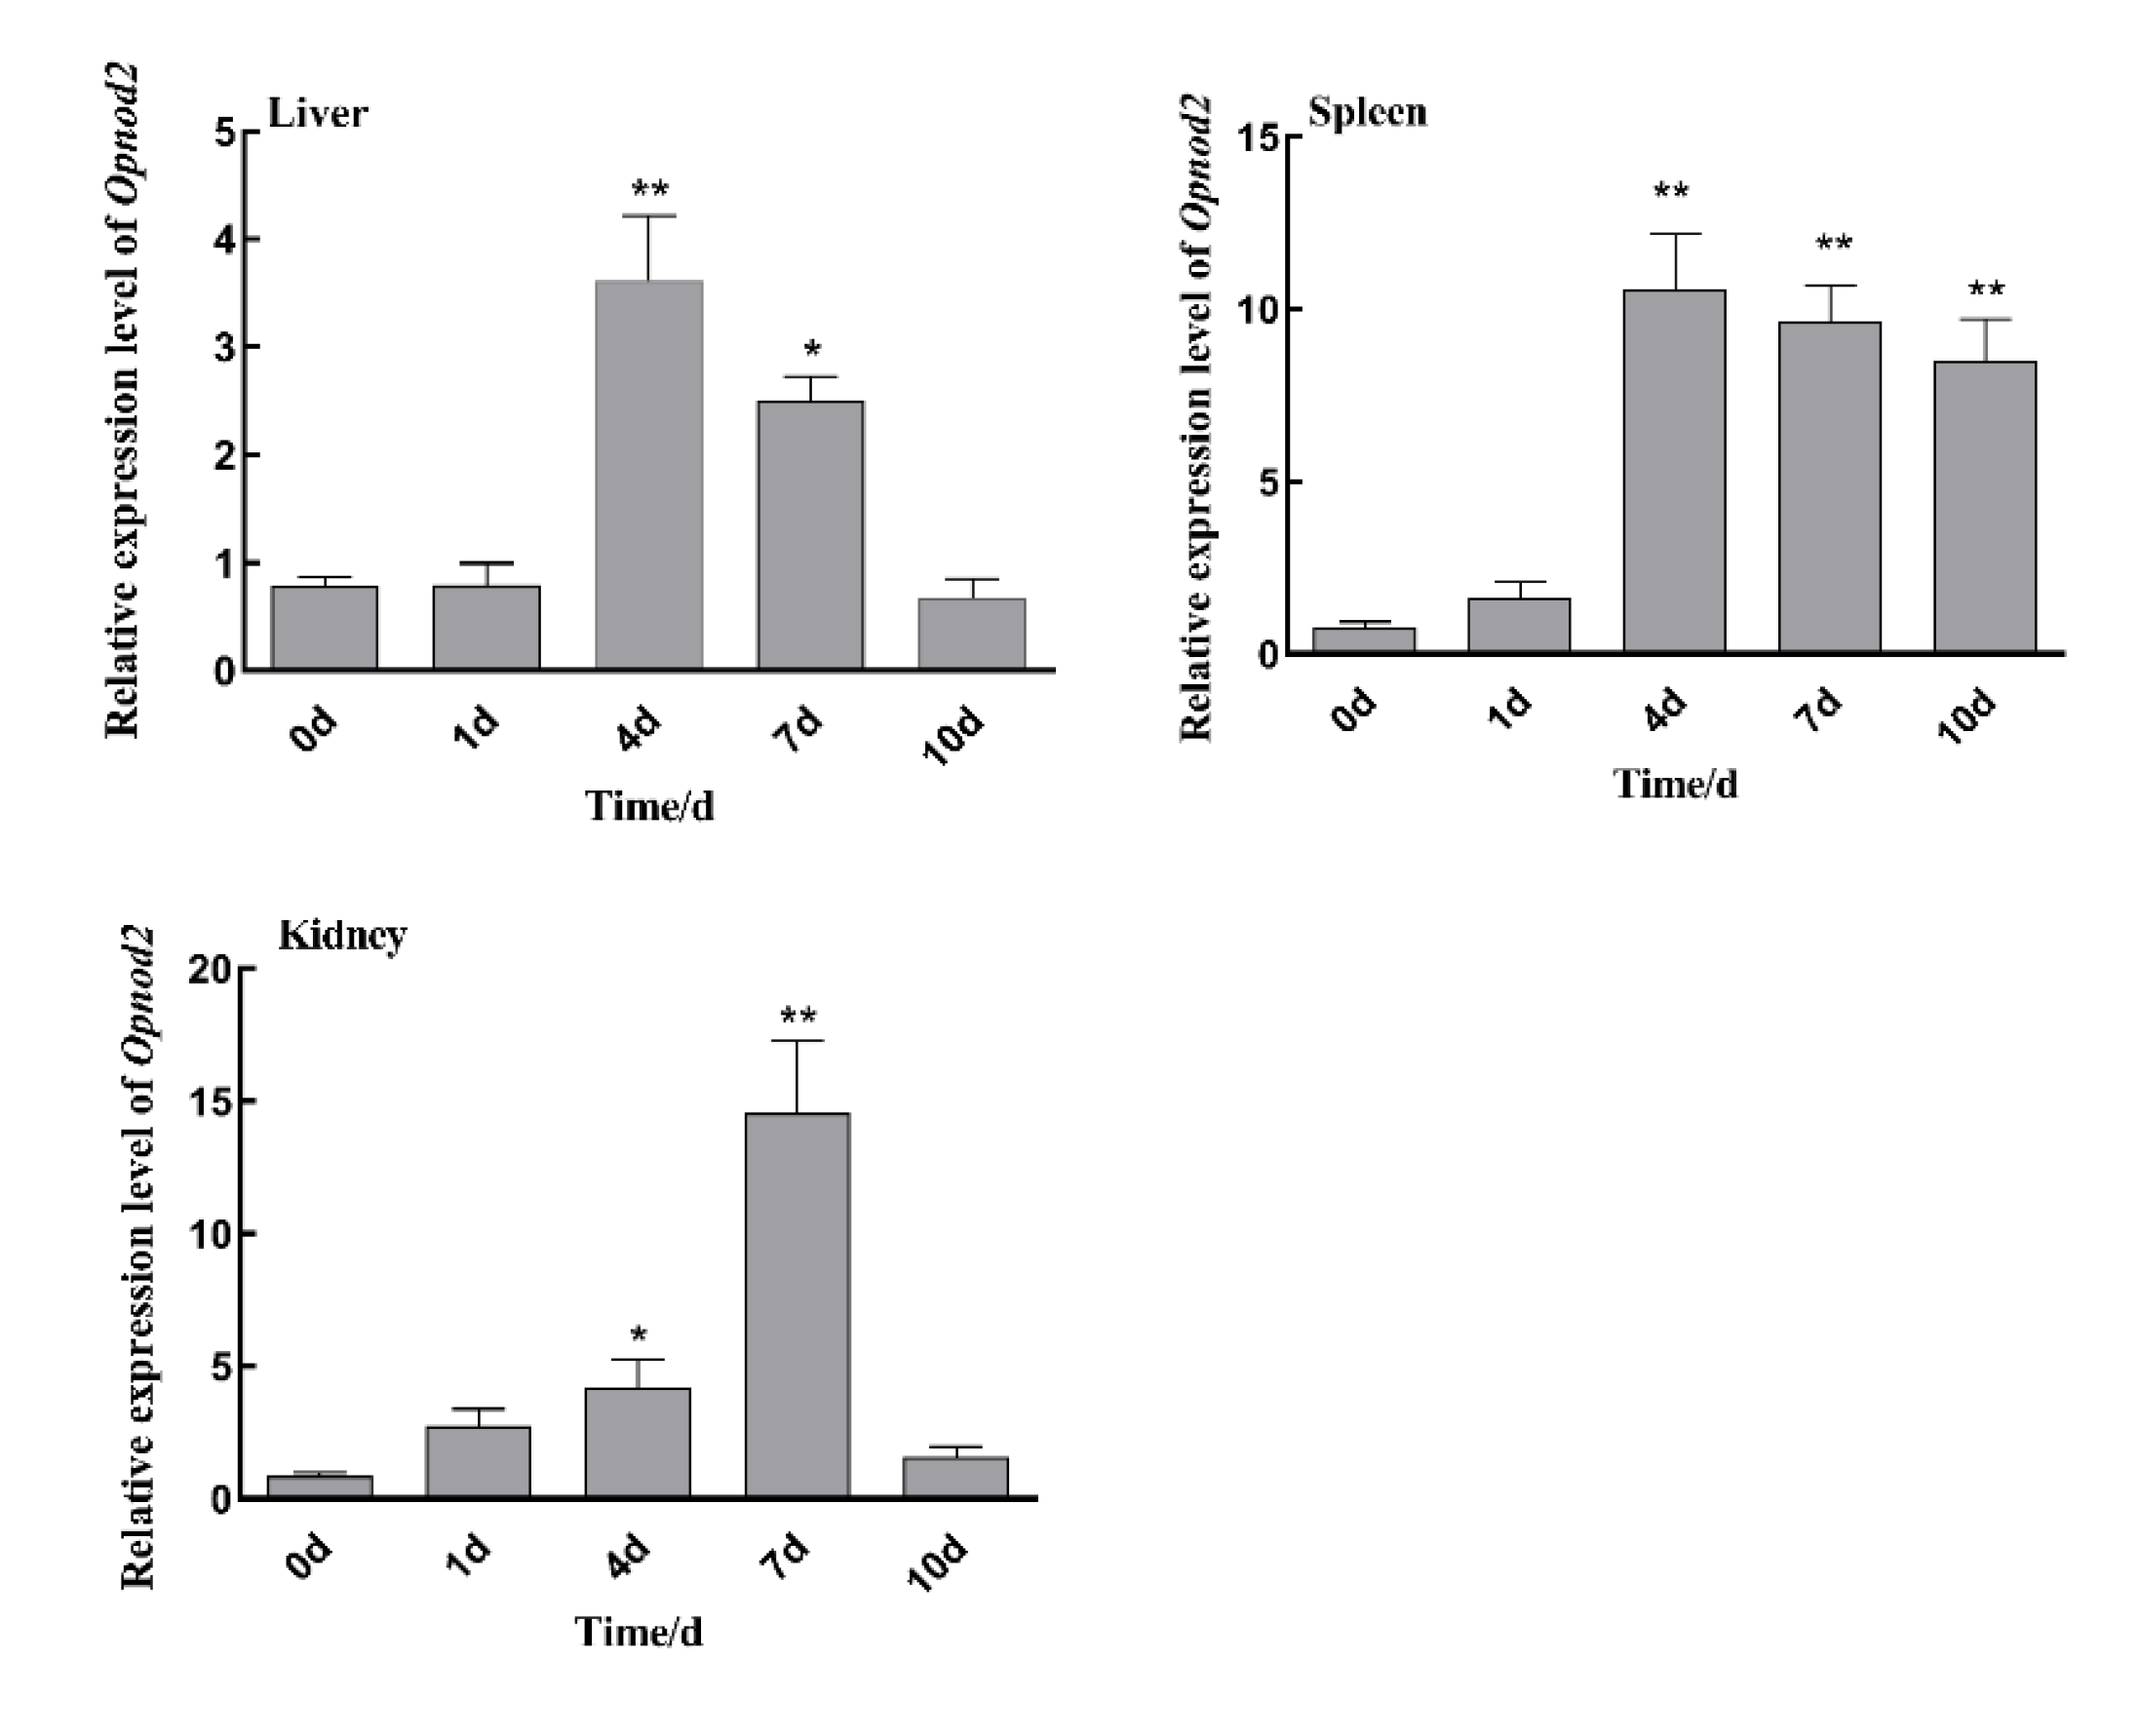
Figure 11.
Relative expression of Optbk1 gene in three tissues (liver, spleen, and kidney) of Oplegnathus punctatus at different time points after SKIV-SD infection. All the data are shown as mean±SE (n=3).The asterisk indicates a significant difference (*P<0.05, **P<0.01, ***P<0.001).
Figure 11.
Relative expression of Optbk1 gene in three tissues (liver, spleen, and kidney) of Oplegnathus punctatus at different time points after SKIV-SD infection. All the data are shown as mean±SE (n=3).The asterisk indicates a significant difference (*P<0.05, **P<0.01, ***P<0.001).
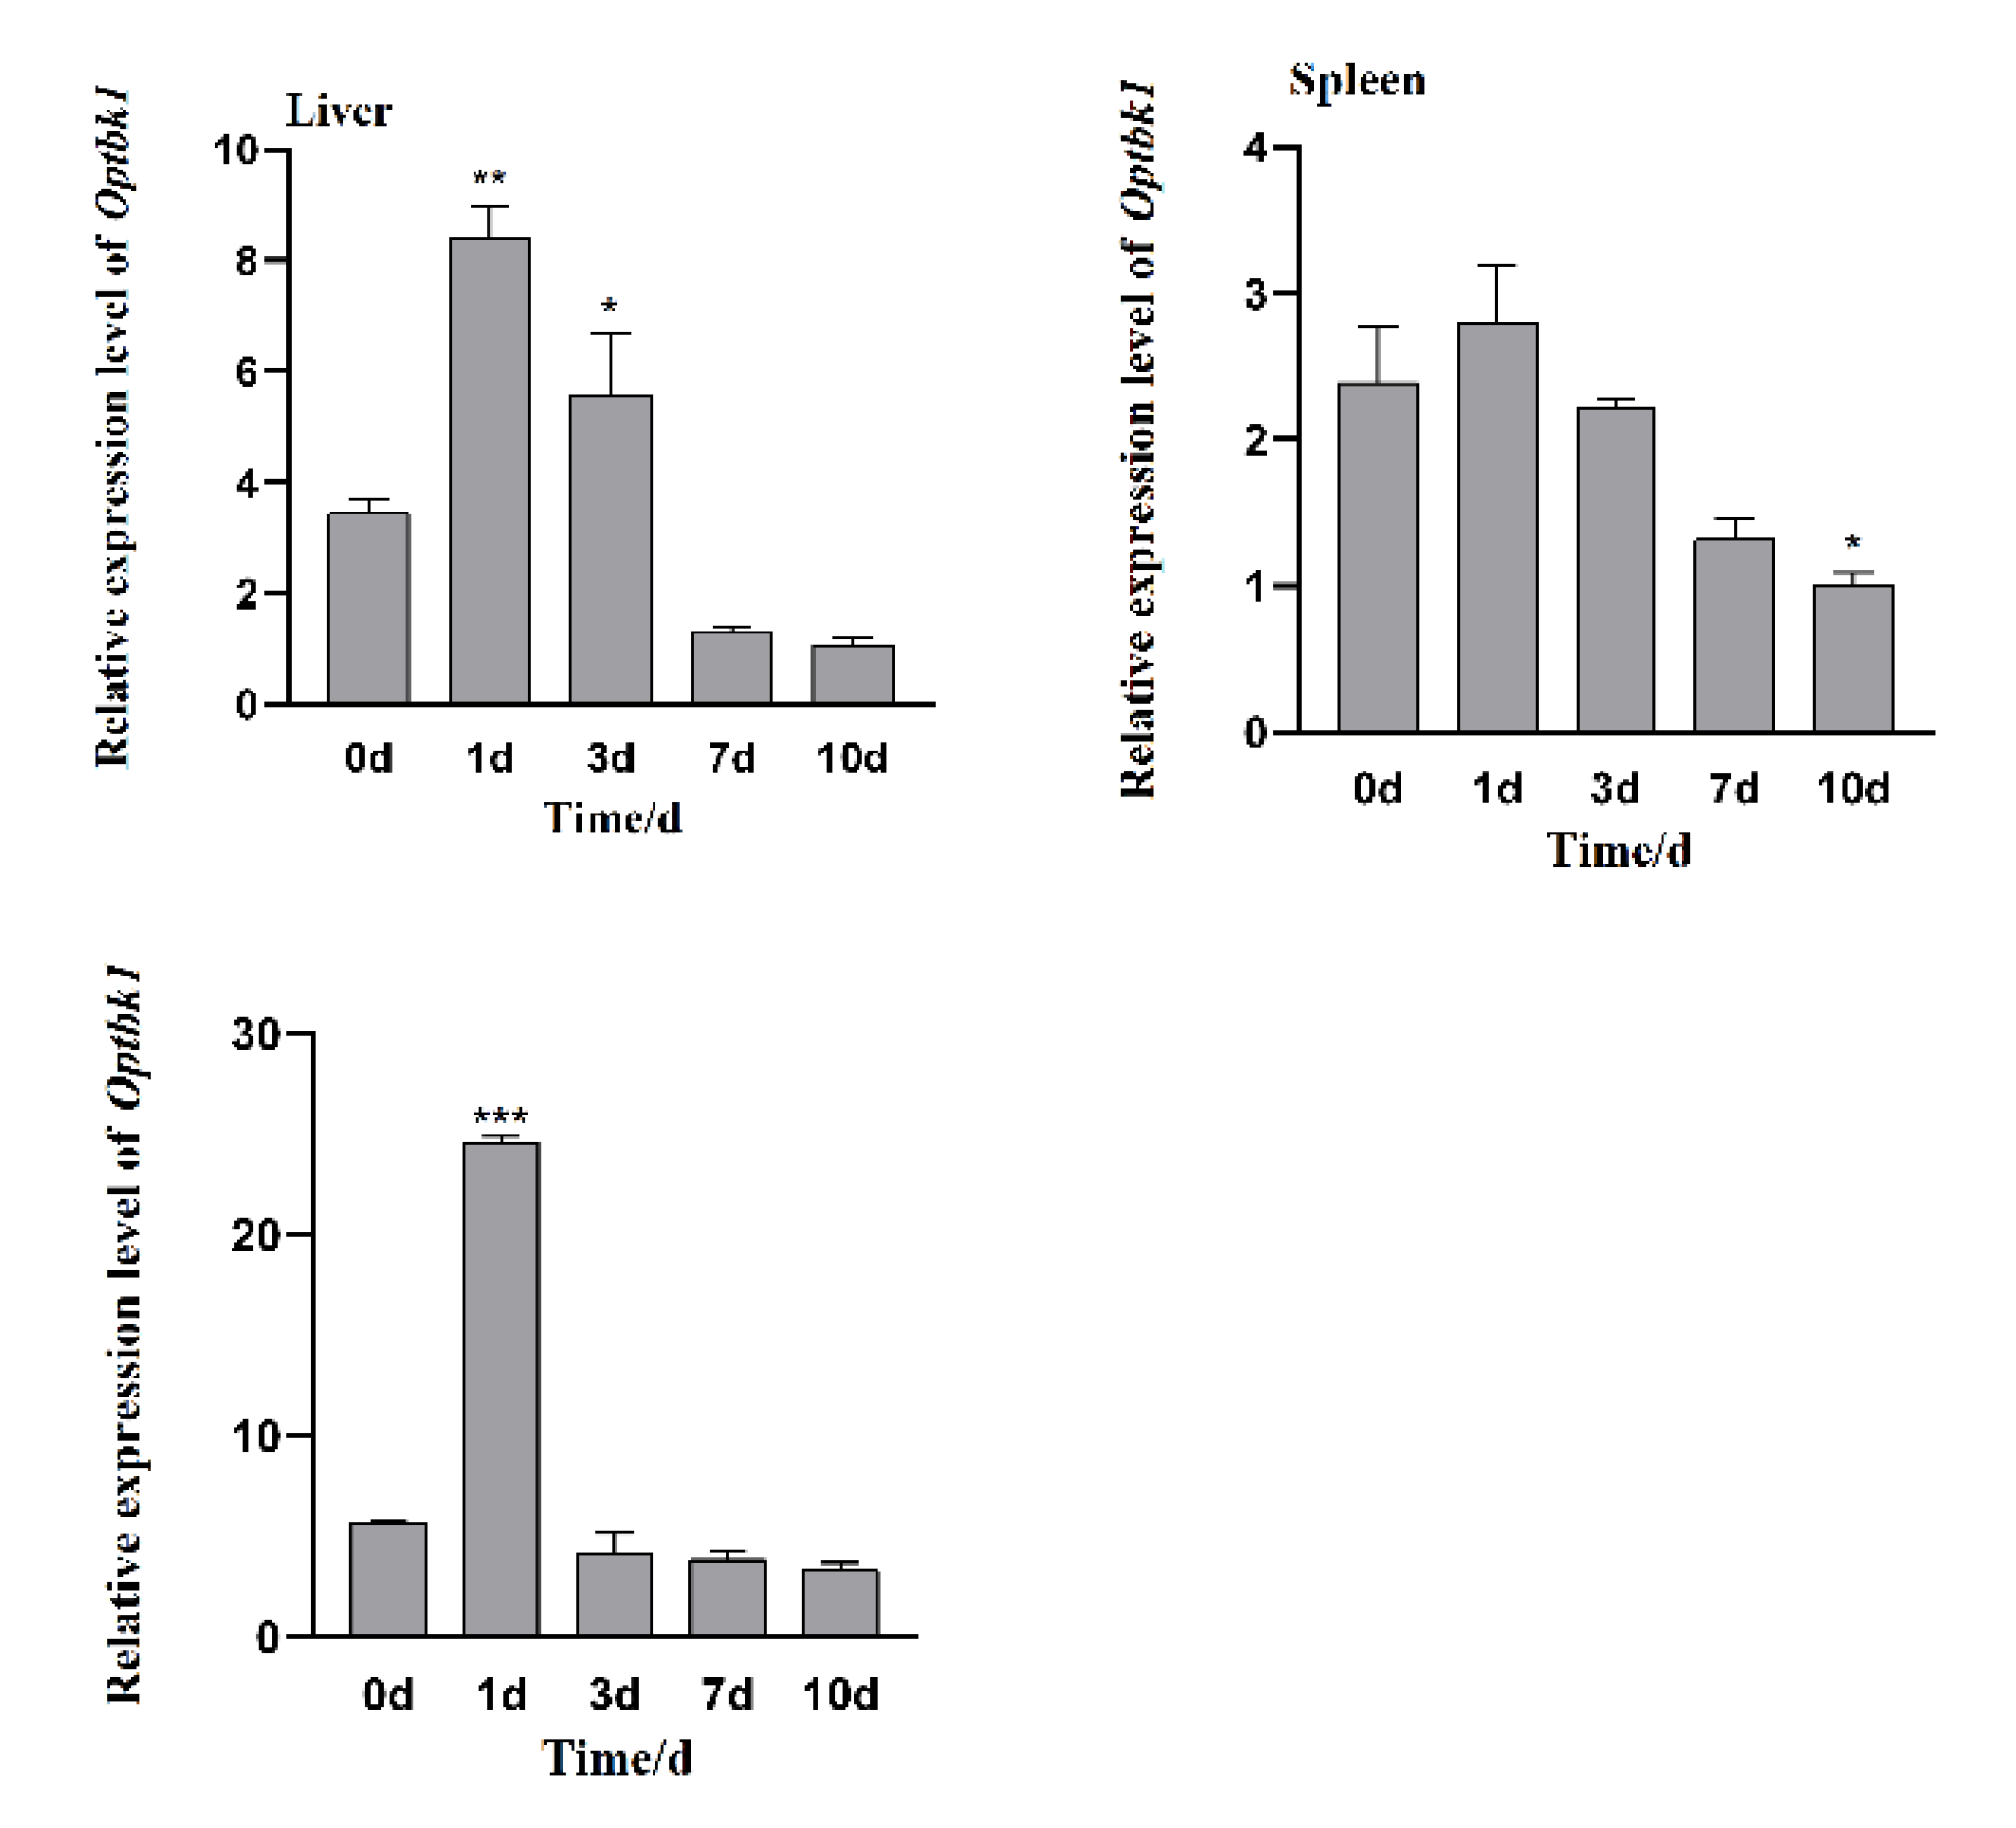
Figure 12.
Relative expression of Opnod1 gene in three tissues (liver, spleen and kidney) of O. punctatus at different time points after V. harveyi infection All the data are shown as mean±SE (n=3). The asterisk indicates a significant difference (*P<0.05, **P<0.01, ***P<0.001).
Figure 12.
Relative expression of Opnod1 gene in three tissues (liver, spleen and kidney) of O. punctatus at different time points after V. harveyi infection All the data are shown as mean±SE (n=3). The asterisk indicates a significant difference (*P<0.05, **P<0.01, ***P<0.001).
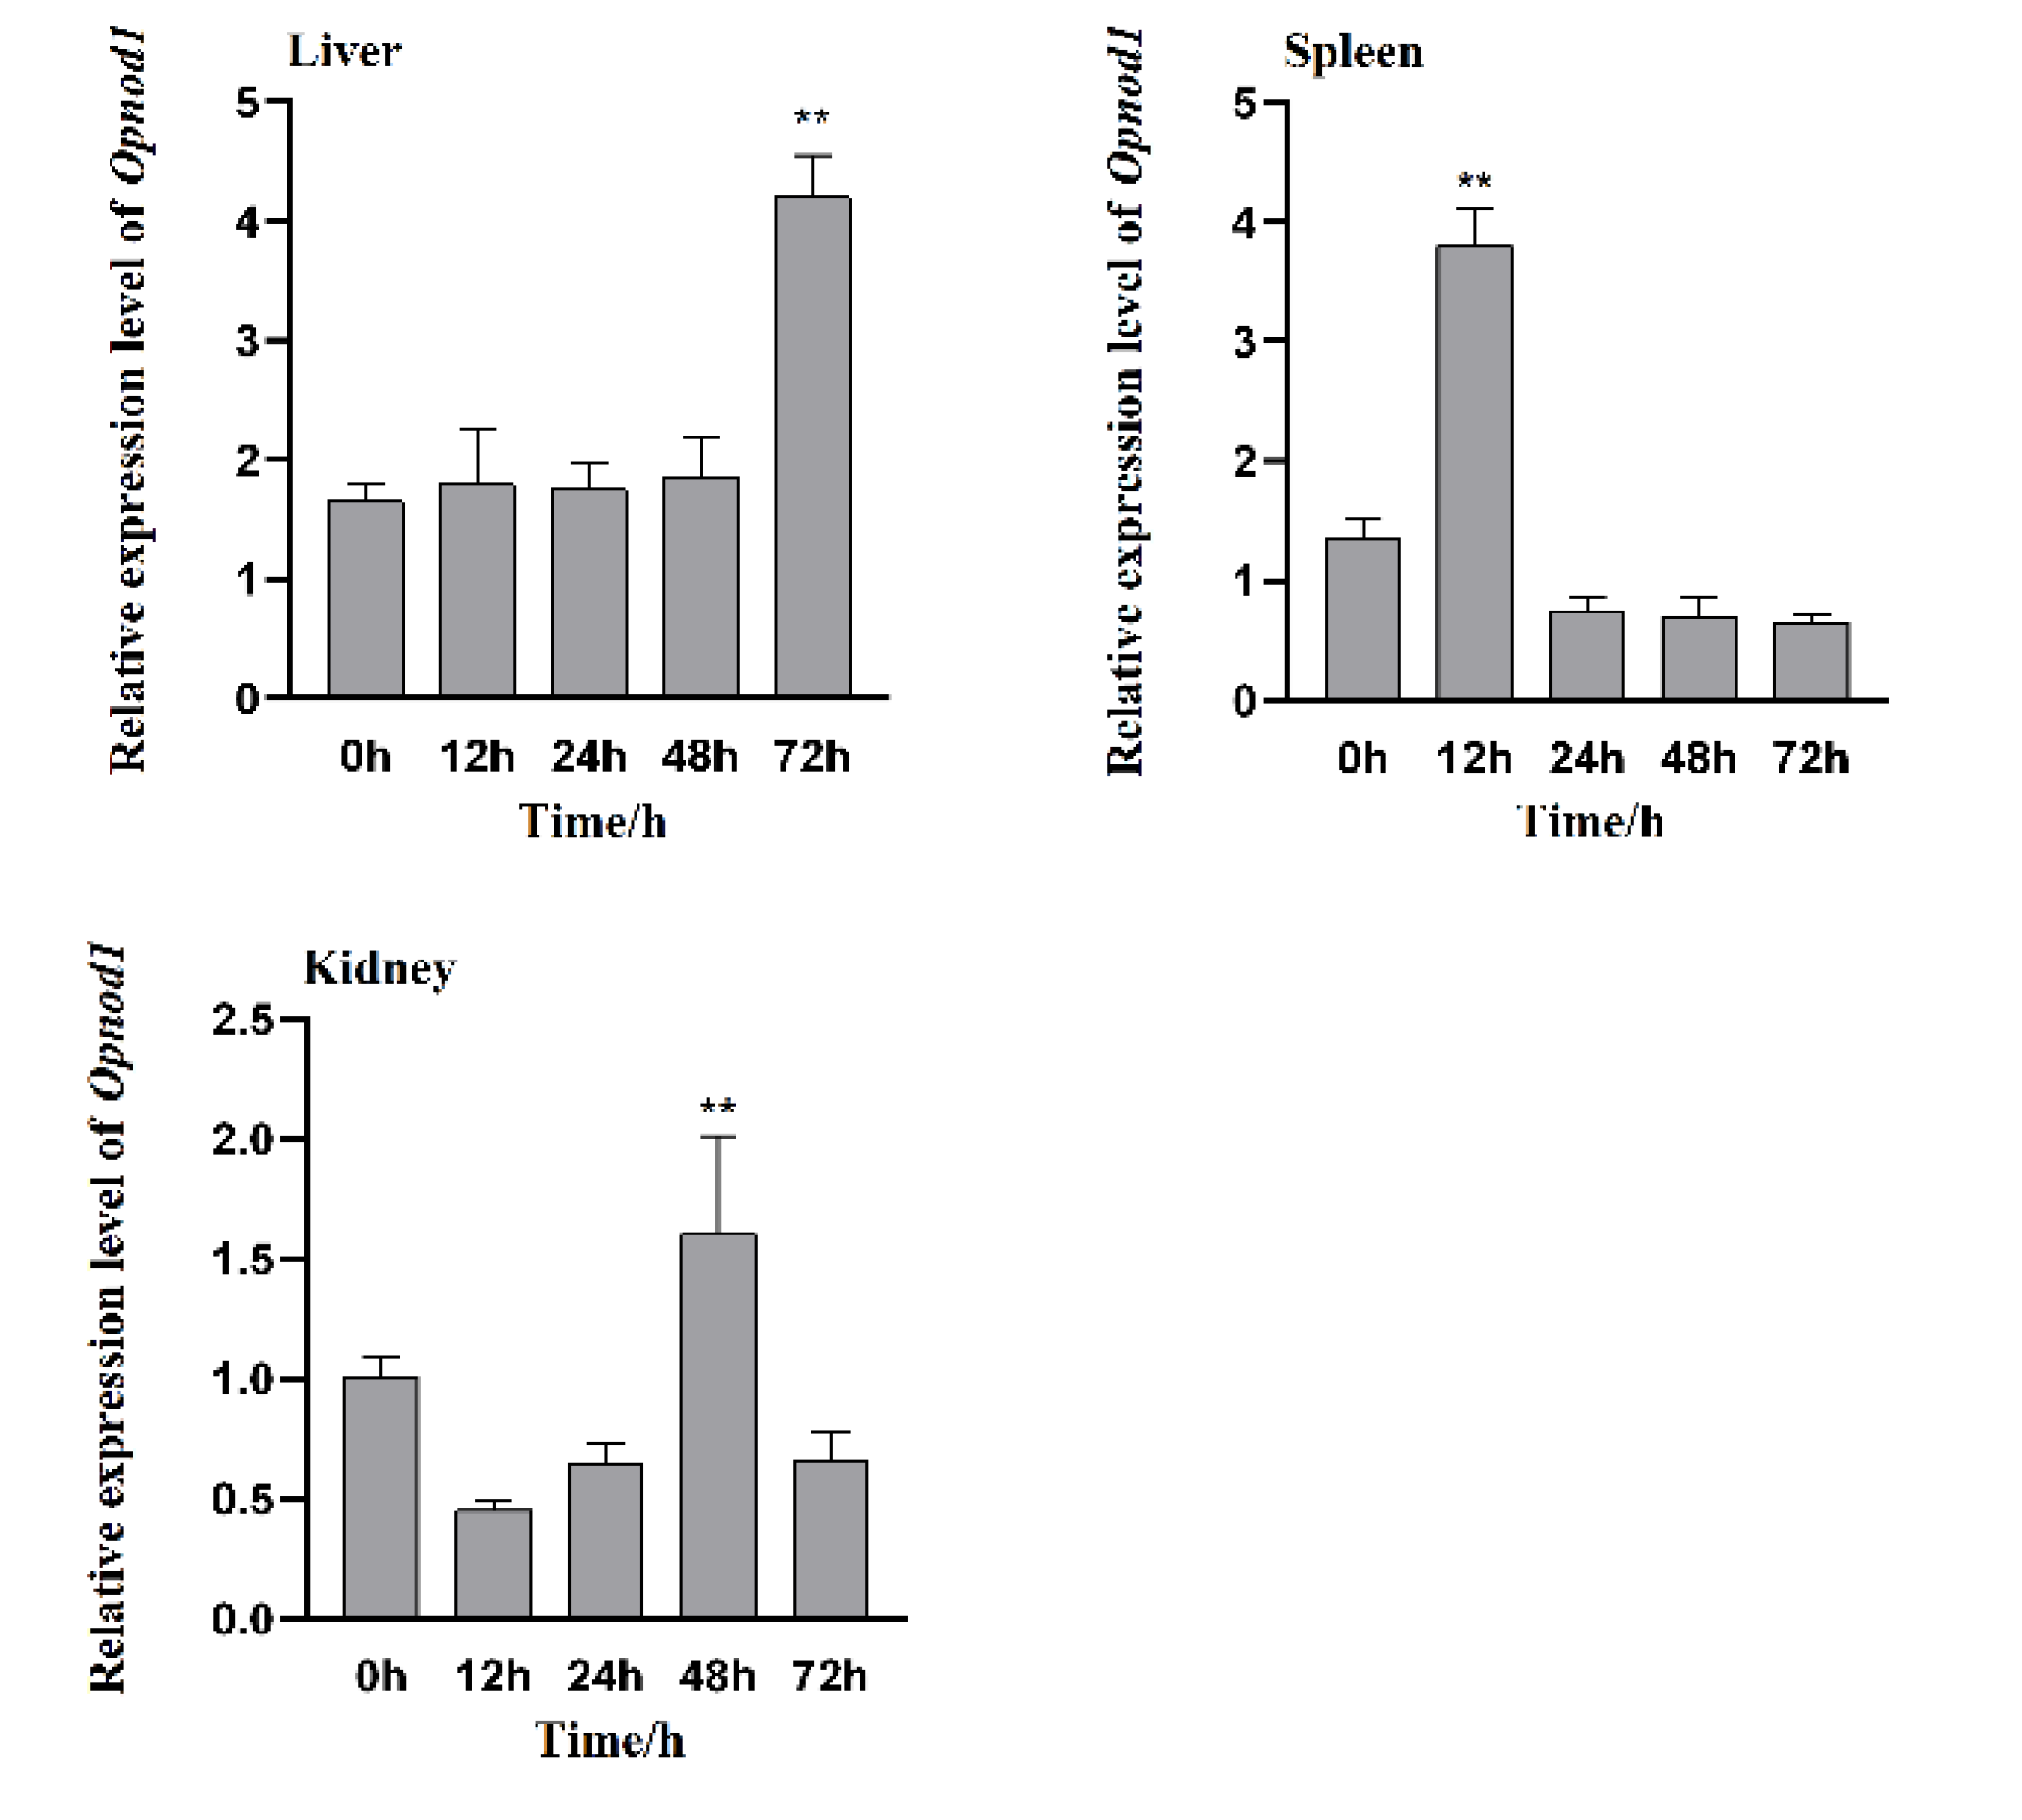
Figure 13.
Relative expression of Opnod2 gene in three tissues (liver, spleen and kidney) of O. punctatus at different time points after V. harveyi infection. All the data are shown as mean±SE (n=3). The asterisk indicates a significant difference (*P<0.05, **P<0.01, ***P<0.001).
Figure 13.
Relative expression of Opnod2 gene in three tissues (liver, spleen and kidney) of O. punctatus at different time points after V. harveyi infection. All the data are shown as mean±SE (n=3). The asterisk indicates a significant difference (*P<0.05, **P<0.01, ***P<0.001).
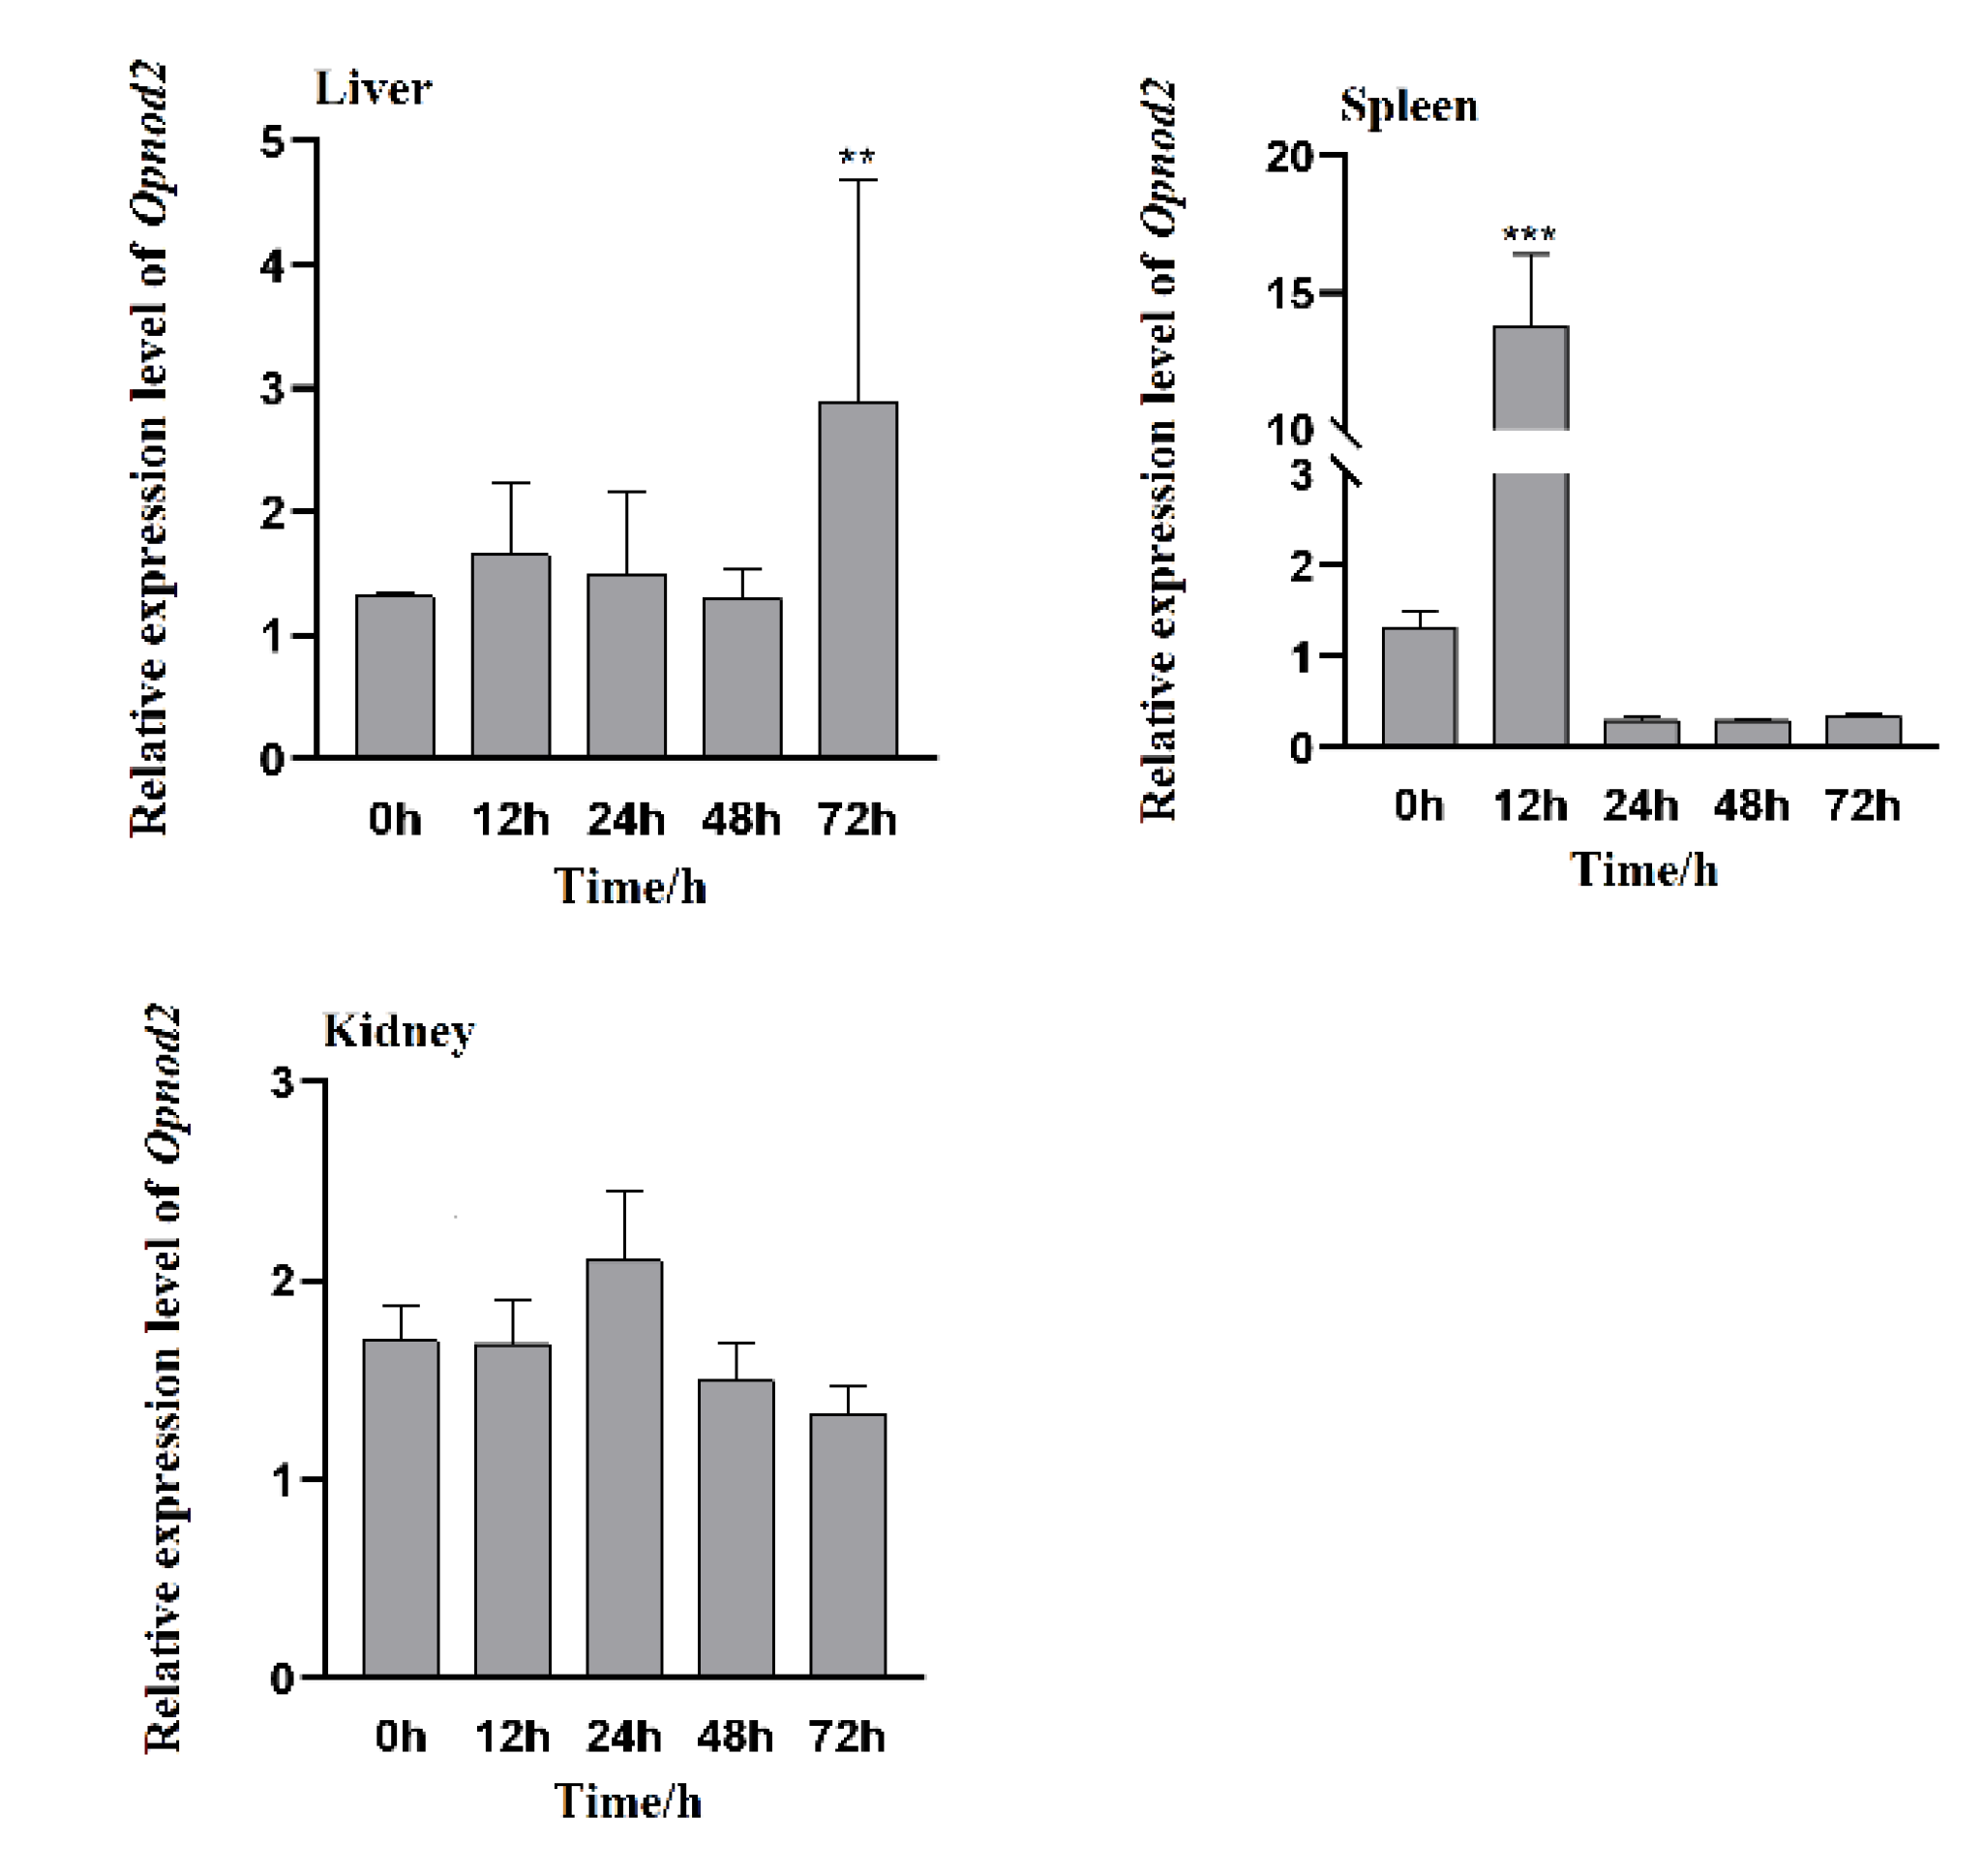
Figure 14.
Relative expression of Optbk1 gene in three tissues (liver, spleen and kidney) of O. punctatus at different time points after V. harveyi infection. All the data are shown as mean±SE (n=3). The asterisk indicates a significant difference (*P<0.05, **P<0.01, ***P<0.001).
Figure 14.
Relative expression of Optbk1 gene in three tissues (liver, spleen and kidney) of O. punctatus at different time points after V. harveyi infection. All the data are shown as mean±SE (n=3). The asterisk indicates a significant difference (*P<0.05, **P<0.01, ***P<0.001).
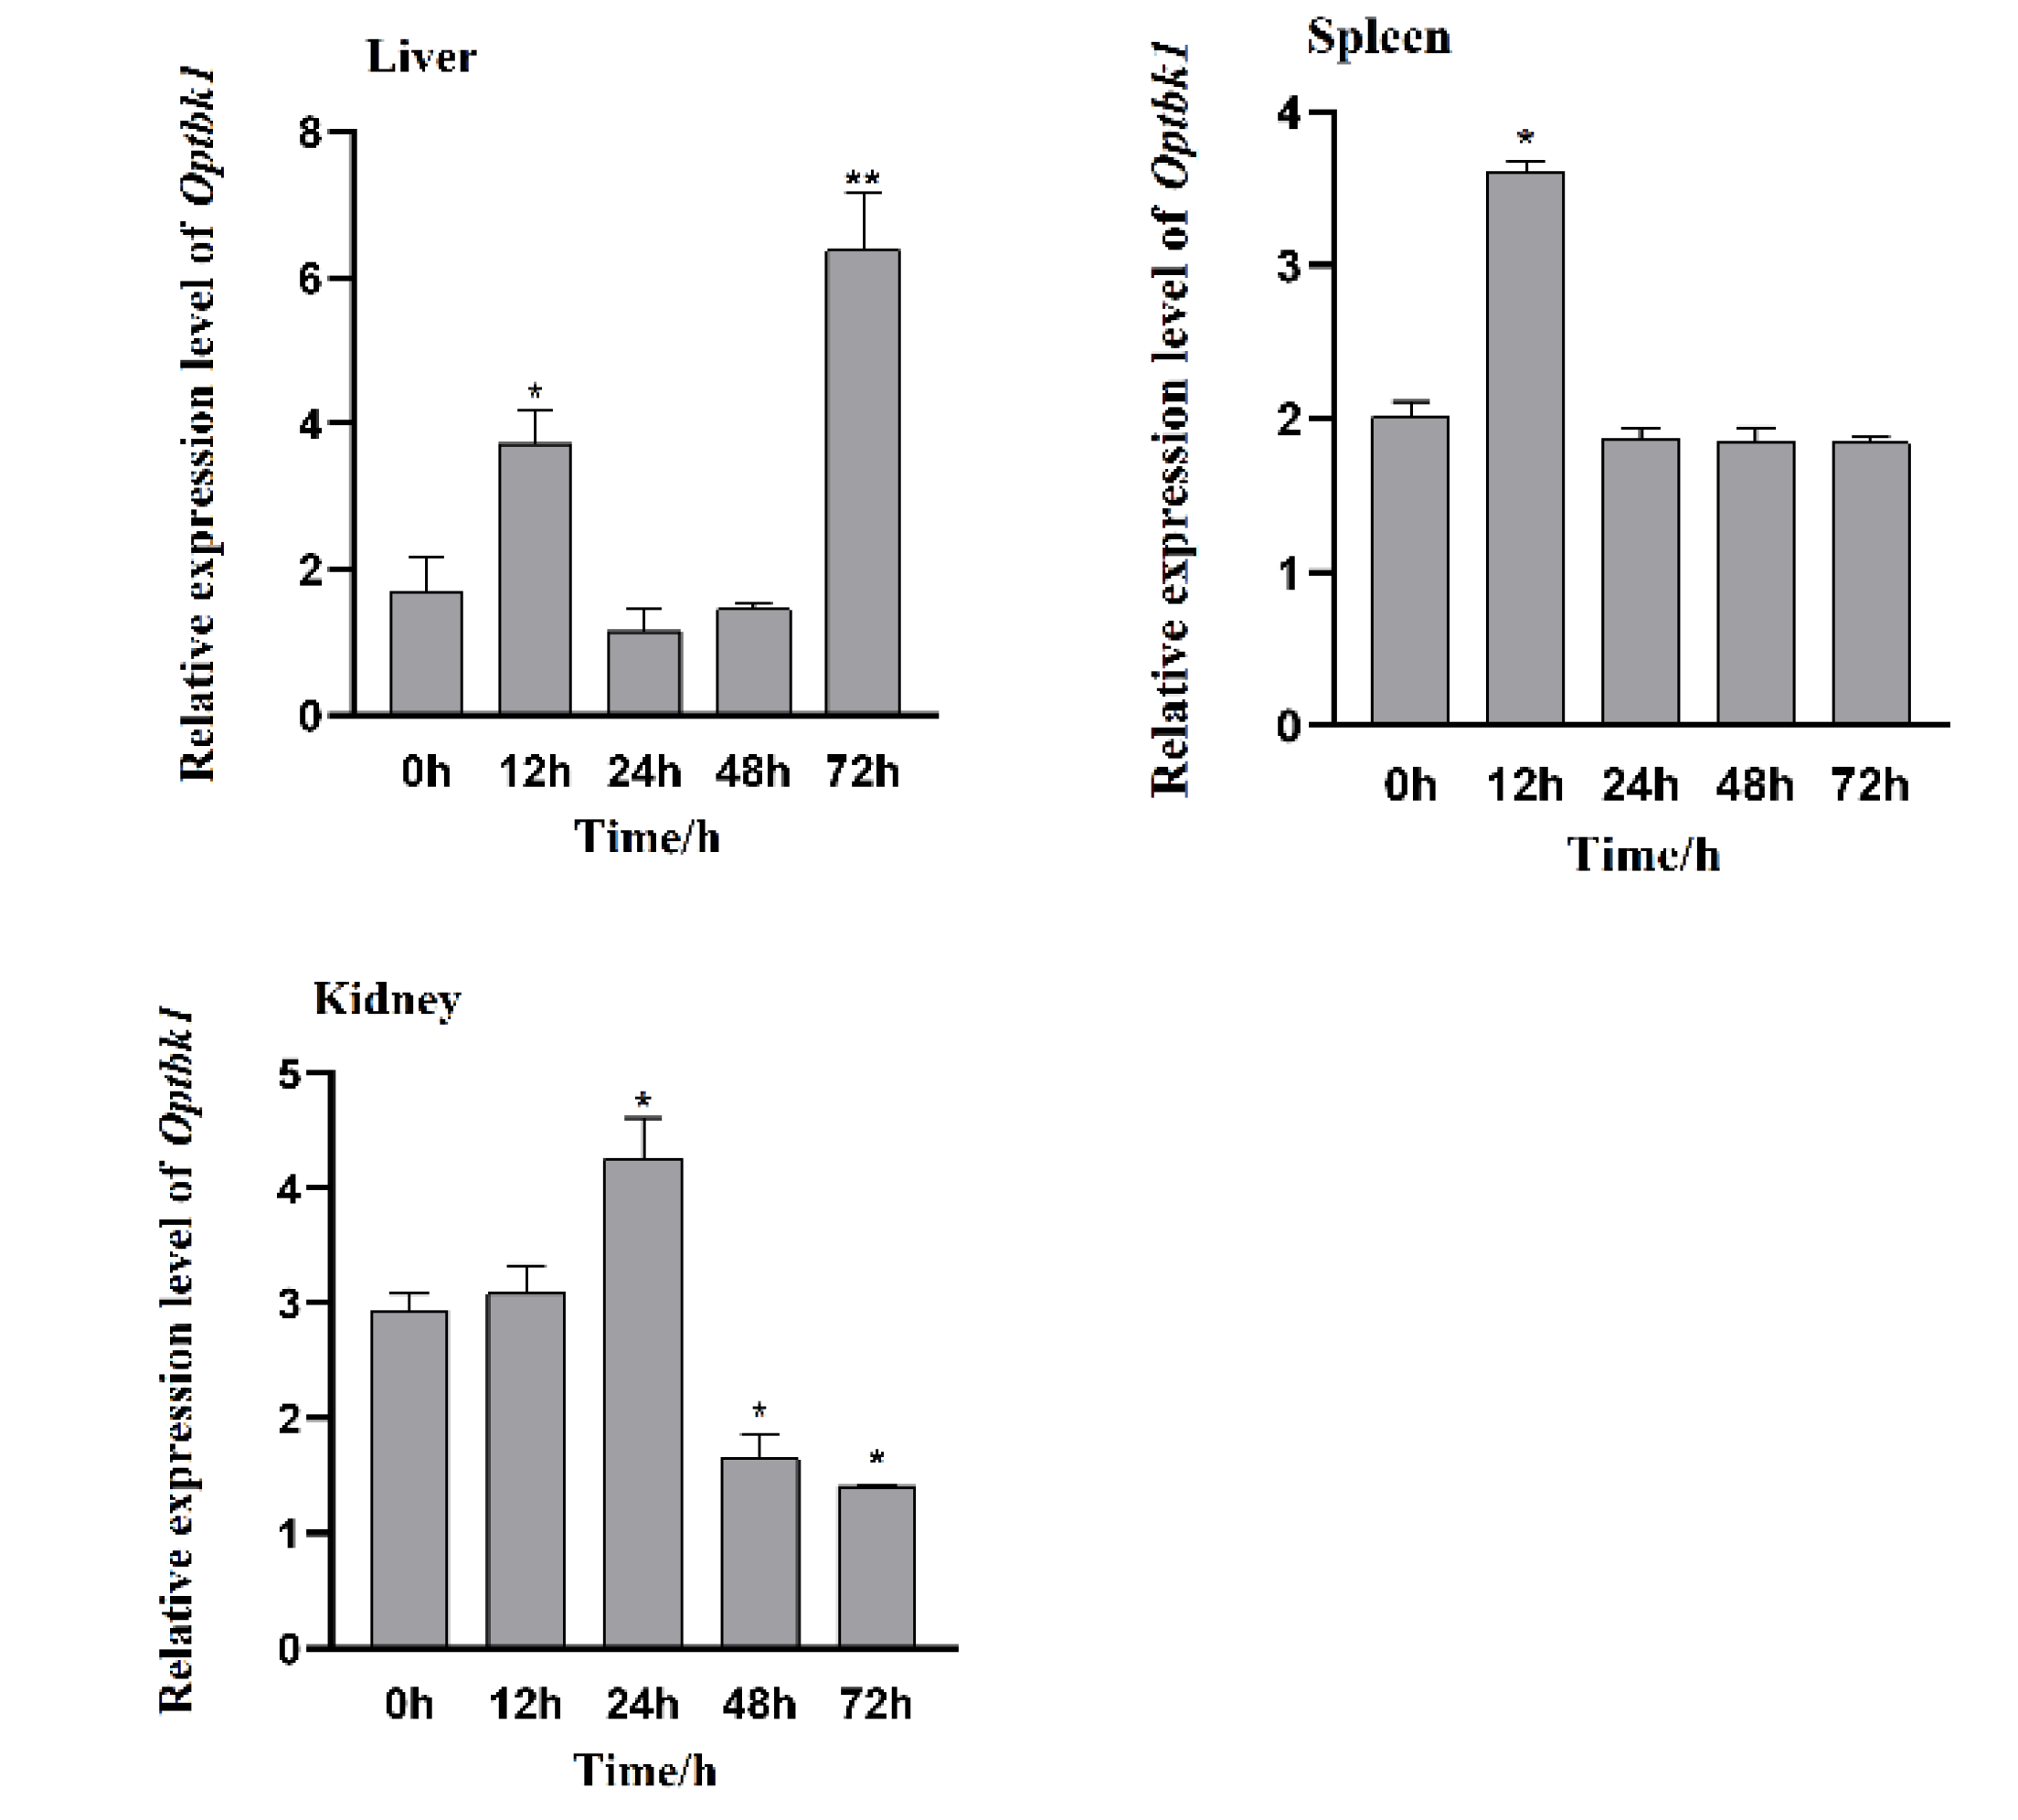
Figure 15.
Expression analysis of Opnod1, Opnod2 and Optbk1 in kidney cells at different concentrations of poly I:C and LPS stimulated. (A-C: different concentrations of poly I:C stimulation of kidney cells; D-E: different concentrations of LPS stimulated kidney cells).
Figure 15.
Expression analysis of Opnod1, Opnod2 and Optbk1 in kidney cells at different concentrations of poly I:C and LPS stimulated. (A-C: different concentrations of poly I:C stimulation of kidney cells; D-E: different concentrations of LPS stimulated kidney cells).
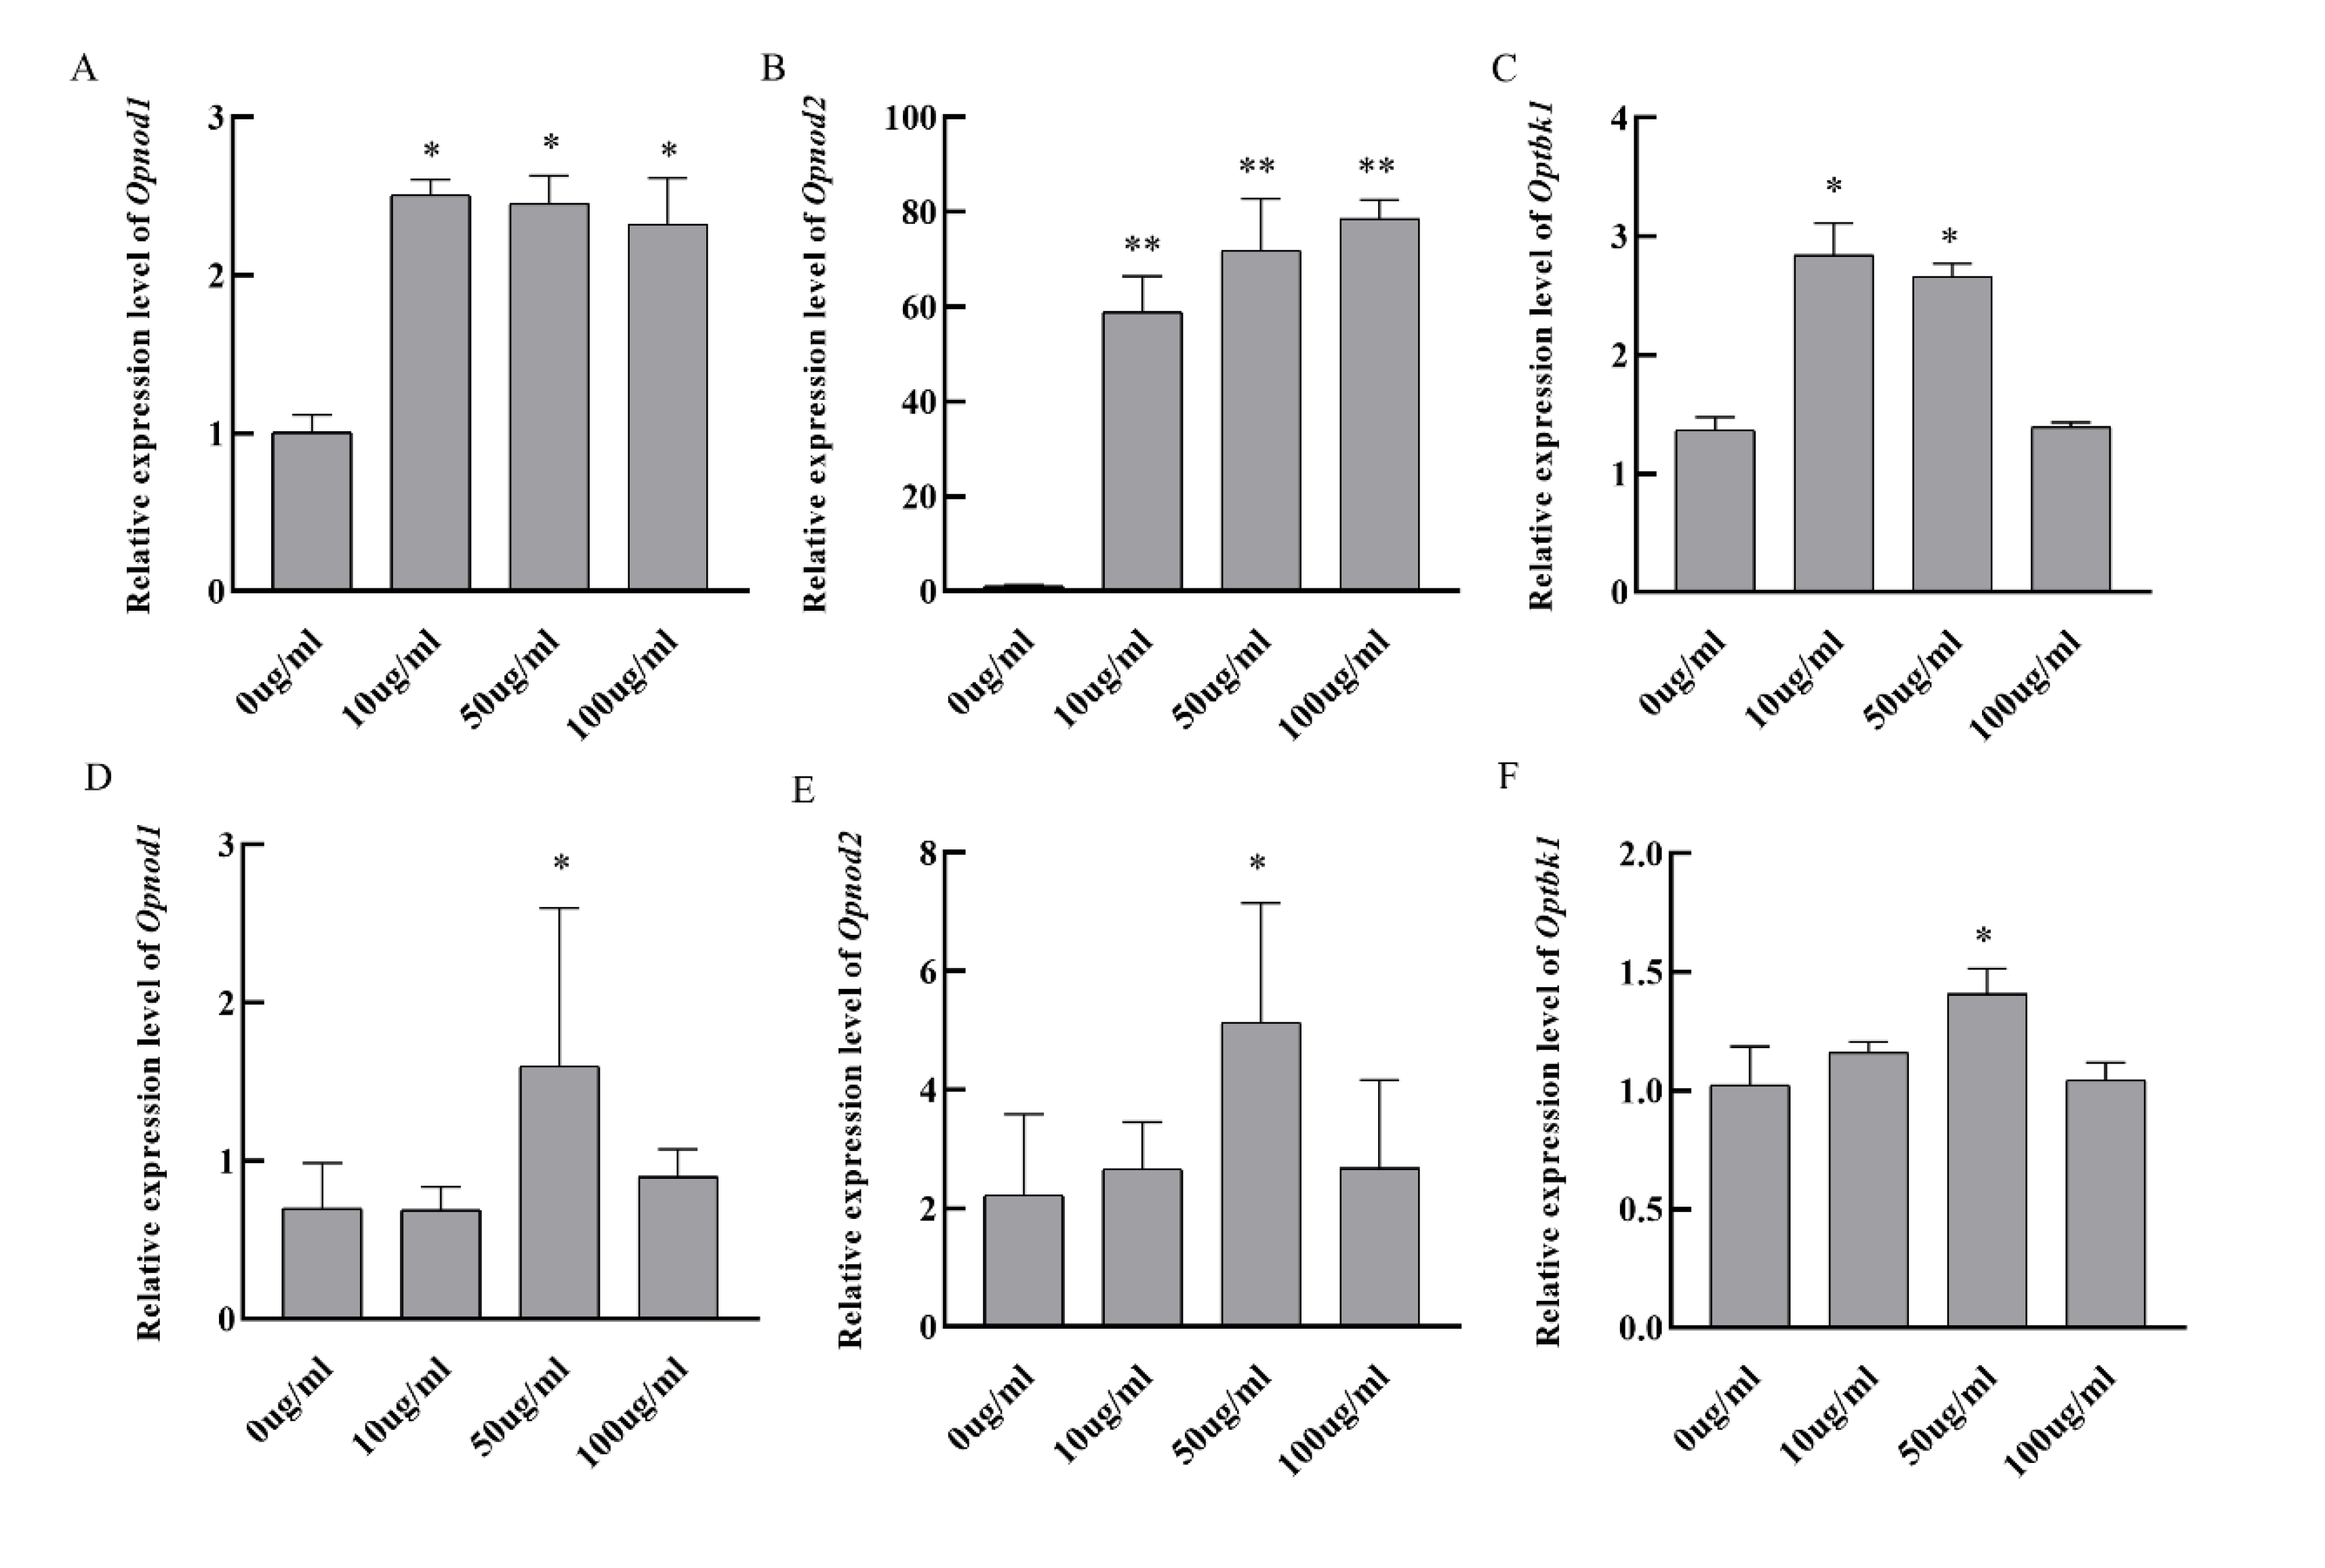

Table 1.
Primers used in this study.
| Primers Primer | Sequence(5′-3′) | Use Application |
|---|---|---|
| Opnod1-ORF-F | ATGGGTCAGATAGAAGAAGCCAAG | ORF verification |
| Opnod1-ORF-R | TCACCATATCTCTTTGAGTGCTGTG | |
| Opnod2-ORF-F | ATGTTTGTCCAGGAGCTTGTGCTG | |
| Opnod2-ORF-R | TCAGAAGACCAGTCTTGATTCACG | |
| Optbk1-ORF-F | ATGCAGAGCACCACTAACTACCTG | |
| Optbk1-ORF-R | TCAGCCTCTCAGACCTCCGTCCAG | |
| Opnod1-qRT-F | GTTGGTGGGAGGTATTTGG | qRT-PCR |
| Opnod1-qRT-R | GTTGGTAAGGCTCGGGTG | |
| Opnod2-qRT-F | GGGGCAATAAGATAGGCG | |
| Opnod2-qRT-R | TGACGATGTTGGCGAGGG | |
| Optbk1-qRT-F | AGGACGACGAGCACTTTGTG | |
| Optbk1-qRT-R | CGTATTTCTTCTGGTGGTCTTTT | |
| β-actin-F | GCTGTGCTGTCCCTGT | |
| β-actin-R | GAGTAGCCACGCTCTGTC |
Table 2.
Amino acid similarity of Nod1, Nod2 and TBK1 proteins among Oplegnathus punctatus and other vertebrates.
Table 2.
Amino acid similarity of Nod1, Nod2 and TBK1 proteins among Oplegnathus punctatus and other vertebrates.
| Species | GenBank Access Number | Similarity/% | |
|---|---|---|---|
| Nod 1 | Oreochromis niloticus | XP_005472430.1 | 86.27 |
| Larimichthys crocea | XP_019134818.2 | 85.07 | |
| Paralichthys olivaceus | XP_019946646.1 | 84.39 | |
| Cynoglossus semilaevis | XP_008322367.1 | 81.05 | |
| Oryzias latipes | XP_020565632.1 | 78.45 | |
| Takifugu rubripes | XP_003965935.3 | 74.4 | |
| Esox lucius | XP_010883447.1 | 71.35 | |
| Danio rerio | XP_002665106.3 | 65.25 | |
| Macaca mulatta | XP_028701734.1 | 50.71 | |
| Mus musculus | NP_001164478.1 | 50.33 | |
| Homo sapiens | XP_011513383.1 | 49.6 | |
| Xenopus laevis | XP_031759856.1 | 48.74 | |
| Nod2 | Lates calcarifer | XP_018522174 | 89.59 |
| Larimichthys crocea | XP_010727419.3 | 85.64 | |
| Oreochromis niloticus | XP_003437591.1 | 83.82 | |
| Paralichthys olivaceus | XP_019935411.1 | 83.22 | |
| Cynoglossus semilaevis | XP_008335431.1 | 79.27 | |
| Takifugu rubripes | XP_029701512.1 | 77.25 | |
| Esox lucius | XP_010894874.4 | 67.4 | |
| Danio rerio | NP_001314973.1 | 64.18 | |
| Macaca mulatta | XP_014981593.2 | 46.26 | |
| Homo sapiens | NP_071445.1 | 46.26 | |
| Mus musculus | AAN84594.1 | 45.54 | |
| Tbk1 | Oplegnathus fasciatus | AHX37216.1 | 99.86 |
| Thunnus maccoyii | XP_042259009.1 | 98.47 | |
| Larimichthys crocea | AKM77645.1 | 98.06 | |
| Epinephelus coioides | ATI15615.1 | 97.93 | |
| Lates calcarifer | XP_018530412.1 | 97.92 | |
| Paralichthys olivaceus | XP_019966450.1 | 97.09 | |
| Solea senegalensis | XP_043878151.1 | 96.26 | |
| Cynoglossus semilaevis | XP_008313509.1 | 95.29 | |
| Danio rerio | NP_001038213.2 | 85.48 | |
| Mus musculus | NP_062760.3 | 71.78 | |
| Homo sapiens | NP_037386.1 | 71.65 | |
| Pan troglodytes | XP_509194.2 | 71.64 | |
| Xenopus laevis | NP_001086516.1 | 64.03 |
Disclaimer/Publisher’s Note: The statements, opinions and data contained in all publications are solely those of the individual author(s) and contributor(s) and not of MDPI and/or the editor(s). MDPI and/or the editor(s) disclaim responsibility for any injury to people or property resulting from any ideas, methods, instructions or products referred to in the content. |
© 2025 by the authors. Licensee MDPI, Basel, Switzerland. This article is an open access article distributed under the terms and conditions of the Creative Commons Attribution (CC BY) license (http://creativecommons.org/licenses/by/4.0/).
Copyright: This open access article is published under a Creative Commons CC BY 4.0 license, which permit the free download, distribution, and reuse, provided that the author and preprint are cited in any reuse.


