Submitted:
14 January 2025
Posted:
15 January 2025
You are already at the latest version
Abstract
Background: Current treatment of gastroesophageal reflux disease (GERD) is focused on decreasing the gastric acid secretion. However, there is still a group of patients not responding to conventional therapy. Proteinase-activated receptors and purinergic receptors have been involved in inflammation, visceral hyperalgesia, and esophageal hypersensitivity. The aim of this study was to evaluate the esophageal expression of PAR2 (F2RL1) and P2RX2, P2RX3 and P2RY2 in GERD patients. Methods: The expression of studied receptors was quantified using real-time PCR in esophageal biopsies in patients with GERD and healthy controls. Correlation between dilated intracellular spaces (DIS) score and patients’ quality of life was investigated. Results: PAR2 receptor expression was higher in ERD compared to NERD and controls (326.10±112.30 vs 266.90±84.76 vs 77.60±28.50; NS).P2X2 exhibited the highest expression in NERD compared to ERD and controls (302.20±82.94 vs 40.18±17.78 vs 26.81±10.27), similarly to P2Y2 which expression was higher in NERD than in ERD and controls (7321.00±1651.00 vs 5306.0±1738.00 vs 3476.00±508.0). Conclusions: We found that the expression of F2RL1, P2RX2 and P2RY2 is positively correlated to DIS score in GERD patients. Higher PAR2, P2X2 and P2Y2 expression could mediate sensitization of esophagus and may be associated with higher intensity of symptoms perceived by NERD patients.
Keywords:
F2RL1
; GERD
; PAR
; P2RX2
; P2X2
; P2RX3
; P2RY2
1. Introduction
Gastroesophageal reflux disease (GERD) is a chronic condition caused by stomach content regurgitation and the lining irritation of the esophagus [1]. It has been estimated that GERD affects of 2.5% in East Asia to up to 25% of the adult population in North America or Europe [2,3]. The molecular basis of GERD seems to be complex and includes esophageal motor abnormalities, visceral hypersensitivity, impaired mucosal resistance and signs of esophageal inflammation [3,4,5]. Current treatment of GERD is focused on decreasing the gastric acid secretion. However, there is still a group of patients not responding to conventional therapy and novel therapeutic approaches are needed [3,6].
Non-erosive reflux disease (NERD) accounting for approximately 70% of GERD cases is mainly characterized by typical gastroesophageal reflux symptoms, with absence of macroscopic damage or visible inflammation in endoscopy [3]. Poor response to proton pump inhibitors (PPIs) and high recurrency rate are characteristic for NERD [7]. Understanding the mechanism involved in NERD is important for developing new therapeutic strategies to improve the clinical outcomes in refractory reflux diseases [4,8].
Protease-activated receptors and purinergic receptors (known also as purinoceptors) are widely expressed in human tissues and seem to regulate the numerous processes, such as visceral pain, motility and immune response [8,9,10,11]. Protease-activated receptor 2 [PAR2, encoded by F2RL1 (coagulation factor II thrombin receptor like trypsin receptor 1) gene] is specifically activated by serine proteases, including trypsin and mast cell-derived tryptase, and belongs to the family of 7-transmembrane G-protein-coupled receptor family [12]. In esophageal squamous cell lines, PAR2 expression was induced by exposure to acid and weakly acidic solutions [1]. When activated by trypsin in refluxate, the trypsin-PAR-2 receptor complex mediates relaxation in the lower esophageal sphincter (LES) in guinea pigs [13,14]. Furthermore, PAR2 induces proinflammatory and neuroinflammatory effects [14,15]. NFkB- and AP-1-dependent increase in IL-8 after PAR2 stimulation by trypsin, seems to be the mechanism causing esophageal inflammation when the distal esophagus is exposed to duodenal reflux containing trypsin [8].
Purinergic receptors are a membrane-bound receptors using nucleoside tri- and diphosphates such as ATD, UTP, ADP and UDP or adenosine as transmitters [5]. Three major subfamilies exist, the P1, P2X, and P2Y, which exert their effect through either ligand-gated ion channels (P2X) or by being G protein–coupled receptors (P1 and P2Y) [5]. The significance of purinergic receptors in the pathogenesis of GERD is still unknown. Animal studies have shown evidence of purinergic upregulation in mucosal tissue and/or afferent nerves in GERD and inflammatory bowel disease [16]. No clear evidence exists on neural purinergic upregulation in GERD in humans, but purinergic receptors could be involved in the pathogenesis of GERD-related symptoms through enhancing esophageal nociception and hypersensitivity. They could thus represent a potential target for future pharmacological treatment of GERD [5]. Nevertheless, there are limited number of studies examined the potential role of protease-activated and purinergic receptors in GERD.
Here, we hypothesize that the expression of PAR2 and selected purinoceptors from P2X and P2Y family may be associated with GERD clinical manifestation. Therefore, we compared the levels of the studied receptors in various groups of patients, including patients with NERD, depending on the microscopic chang es of the esophagus and dilated intercellular spaces (DIS) assessment. An association has been found between DIS and exposure to acid, acid–pepsin, bile, and stress. DIS appear to be associated with symptoms of reflux, even more than other histologic parameters, and disappear with resolution of symptoms after treatment [3,17,18]. DIS in basal and suprabasal areas are giving the refluxate access to the chemosensitive nerves found in the deep layers of the esophageal squamous mucosa. These chemosensitive nerves can then express and activate PAR2, causing symptoms [3,17,18,19].
Moreover, we also assessed F2RL1, P2RX2, P2RY2 and P2RX3 expression in correlation with symptoms affecting patients' quality of life, using a GERD- HRQL questionnaire [20]. It is symptoms based questionnaire, which allows assessing the severity of the disease from the patient's perspective. Using this questionnaire we could check symptoms e.g. heartburn when lying down or standing up, heartburn after meals, difficulty swallowing or pain with swallowing [20].
2. Materials and Methods
Study Group and Sample Collection
Patients were admitted for upper gastrointestinal endoscopy for different indications in the Department of Digestive Tract Diseases at the Barlicki Memorial Hospital in Lodz, Poland from January 2019 to December 2020. Inclusion criteria encompassed patient history of GERD, diagnosed based on the typical symptoms and upper GI tract endoscopy. Patients with any other inflammatory disease of the gastrointestinal tract, Barrett’s esophagus and gastric or esophageal neoplasia were excluded from the study. In total, 53 patients with GERD and 9 sex and age-related healthy controls were enrolled in the study. Among GERD patients, 37 patients with nonerosive reflux disease (NERD) and 16 patients with erosive reflux disease (ERD) were classified according to Los Angeles classification as GERD grade A, B, C or D. Esophageal biopsies were collected from the lower part of the esophagus and kept at –80°C for further analysis. The study was conducted in accordance with the ethical principles of the 1975 Declaration of Helsinki and the independent Bioethics Committees of the Medical University of Lodz approved the study protocols (RNN/12/19/KE). All participating subjects gave written, informed consent prior to enrollment.
RNA Isolation
RNA extraction was performed using commercially available Total RNA Mini Kit (A&A Biotechnology, Gdynia, Poland) according to the manufacturer’s protocol. The purity and quantity of RNA was estimated spectrophotometrically with Colibri Microvolume Spectrometer (Titertek Berthold, Colibri, Germany).
Real-Time PCR
cDNA synthesis was performed with the RevertAid First Strand cDNA Synthesis Kit (Fermentas, Burlington, Canada). 1 µg of RNA was used in the reverse transcription reaction in a total volume of 20 µL with the following incubation steps: 25°C for 10 minutes, 50°C for 15 minutes, 85°C for 5 minutes and 4°C for 10 minutes. Quantification of mRNA expression was performed using the real-time PCR method with FAM dye-labeled TaqMan® probes (Applied Biosystems, Waltham, MA, USA). The reaction mixture consisted of cDNA, TaqManTM Gene Expression Master Mix, TaqManTM Gene Expression Assays (F2RL1: Hs00608346_m1, P2RX2: Hs00247255_m1, P2RX3: Hs01125554_m1 and P2RY2: Hs00925146_m1) and RNase-free water in total volume of 10 μL. Cycle parameters were as follows: initial denaturation at 95°C for 10 minutes, followed by 40 cycles of sequential incubations at 95°C for 15 seconds and at 60°C for 1 minutes. The obtained results were normalized to the expression of hypoxanthine phosphoribosyltransferase 1 gene (HPRT1, Hs02800695_m1) as an endogenous control. All experiments were performed in triplicate. The reaction was performed using LightCycler® 96 Instrument (Roche, Bazylea, Switzerland). The initial amount of the template was evaluated as a Ct parameter. Ct value corresponded to the threshold cycle number at which PCR amplification reached a significant threshold. The relative expression level was calculated as 2−∆Ct × 1000.
Dilated Intracellular Spaces
The DIS score was evaluated during the routine microscopic assessment of esophageal sections. Esophageal specimens were fixed in 10% neutral-buffered formalin for 24 hours at 4°C. After subsequent dehydration in sucrose, esophageal specimens were embedded in paraffin, sectioned at 5 µm and mounted onto slides. Then, sections were stained with hematoxylin and eosin and examined using an Olympus CX43 (Tokyo, Japan). The severity of DIS was calculated in one high-power field as follows: 0 (absent; ≤5 small intercellular spaces), 1 (≥6 small intercellular spaces and ≤5 large intercellular spaces) or 2 (≥6 large intercellular spaces), where small was defined as narrower than one lymphocyte in diameter and large was as equal to or wider than one lymphocyte in diameter. DIS near the periphery of a biopsy may be artifactual and were disregarded in this evaluation.
Health-Related Quality of Life
The Gastroesophageal Reflux Disease-Health Related Quality of Life (GERD-HRQL) instrument was used to assess symptomatic outcomes for the typical symptoms of GERD. This instrument is one of the most frequently used of the symptom severity instruments, and has been recommended for use by the European Association for Endoscopic Surgery. The best possible total GERD-HRQL score is 0 (asymptomatic in all items) and the worst possible score is 50 (incapacitated in all items). Because the total GERD-HRQL score has 51 possible scores, it has a high level of precision [20].
Statistical Analyses
Statistical analysis was performed using GraphPad Prism 8.0 (GraphPad Software Inc., La Jolla, CA, USA). Assumption of the normal distribution of differences was verified with the use of the Shapiro–Wilk test. As the normality assumption was violated, the significance of differences was tested with Mann–Whitney’s U test to compare two independent groups. For multiple comparison, the Kruskal–Wallis test was applied. The data are expressed as median with interquartile range. Analysis of the correlation between F2RL1, P2RX2, P2RX3 and P2RY2 expression and DIS or HRQL score was conducted by calculation of Spearman’s rank correlation coefficient. A heatmap showing the relation between the relative expression of F2RL1, P2RX2, P2RX3 and P2RY2 as well as DIS score was presented in mean values. Outliers were counted using the ROUT method and excluded. p-values<0.05 were considered statistically significant.
3. Results
The Expression of F2RL, P2RX2, P2RX3 and P2RY2 in Patients with GERD
As was shown in the Figure 1, F2RL1, P2RX2, P2RX3 and P2RY2 were detected in the esophagus of healthy controls and patients with GERD. Overall, the relative expression of F2RL1 (77.60±28.50 vs. 284.60±67.72), P2RX2 (26.81±10.27 vs. 274.40±77.46) and P2RY2 (3476.00±508.20 vs. 7215.00±1338.00) were non-significantly higher in esophagus taken from patients with GERD than in healthy controls. Our real-time PCR analysis documented significantly higher expression of P2RX3 (4268±2012 vs. 31353±8815, p<0.01) in esophagus of GERD patients when compared to healthy controls (Figure 1). It is wort to note that the relative P2RX3 expression was more abundant when compared to the relative expression of F2RL1, P2RX2 and P2RY2 in patients esophageal mucosa.
The Expression of F2RL1, P2RX2, P2RX3 and P2RY2 in NERD or ERD Type of GERD Patients
Division of GERD patients into non-erosive and erosive type of GERD revealed that the expression of F2RL1 was non-significantly different in ERD compared to NERD as well as healthy controls (326.10±112.30 vs. 266.90±84.76 vs. 77.60±28.50, Figure 2A). According to Figure 2B and Figure 2C, non-significantly higher expression of P2RX2 (302.20±82.94 vs. 40.18±17.78 vs. 26.81±10.27) and P2RY2 (7321.00±1651.00 vs. 5306.0±1738.00 vs. 3476.00±508.0) in the esophageal mucosa obtained from NERD and ERD patients compared to healthy controls was observed. Of note, lack of differences between the expression of P2RX2 and P2RY2 in NERD compared to ERD were documented. In patients with NERD the expression of P2RX3 in esophageal mucosa was similar as in healthy controls (Figure 2D).
The Association Between F2RL1, P2RX2, P2RX3 and P2RY2 Expression and DIS Score in Patients with GERD
To investigate the association between the expression of F2RL1, P2RX2, P2RX3 and P2RY2 and the score of epithelial damage, correlation coefficient between the level of above-mentioned genes and DIS score was calculated. As shown in Figure 3, we found that the expression of F2RL1 (r = 0.49; p<0.05) and P2RX2 (r = 0.51; p<0.01) correlated positively and gradually with DIS score. In line, in GERD patients the expression of P2RY2 (r = 0.60; p<0.05) correlated positively with the DIS score. The strongest value of correlation concerned the relation between the expression of P2RY2 and DIS score. On the other hand, in patients with GERD the expression of P2RX3 (r = -0.52; p<0.05) correlated negatively and gradually with DIS score (Figure 3).
The Association Between F2RL1, P2RX2, P2RX3 and P2RY2 Expression and HRQL of GERD Patients
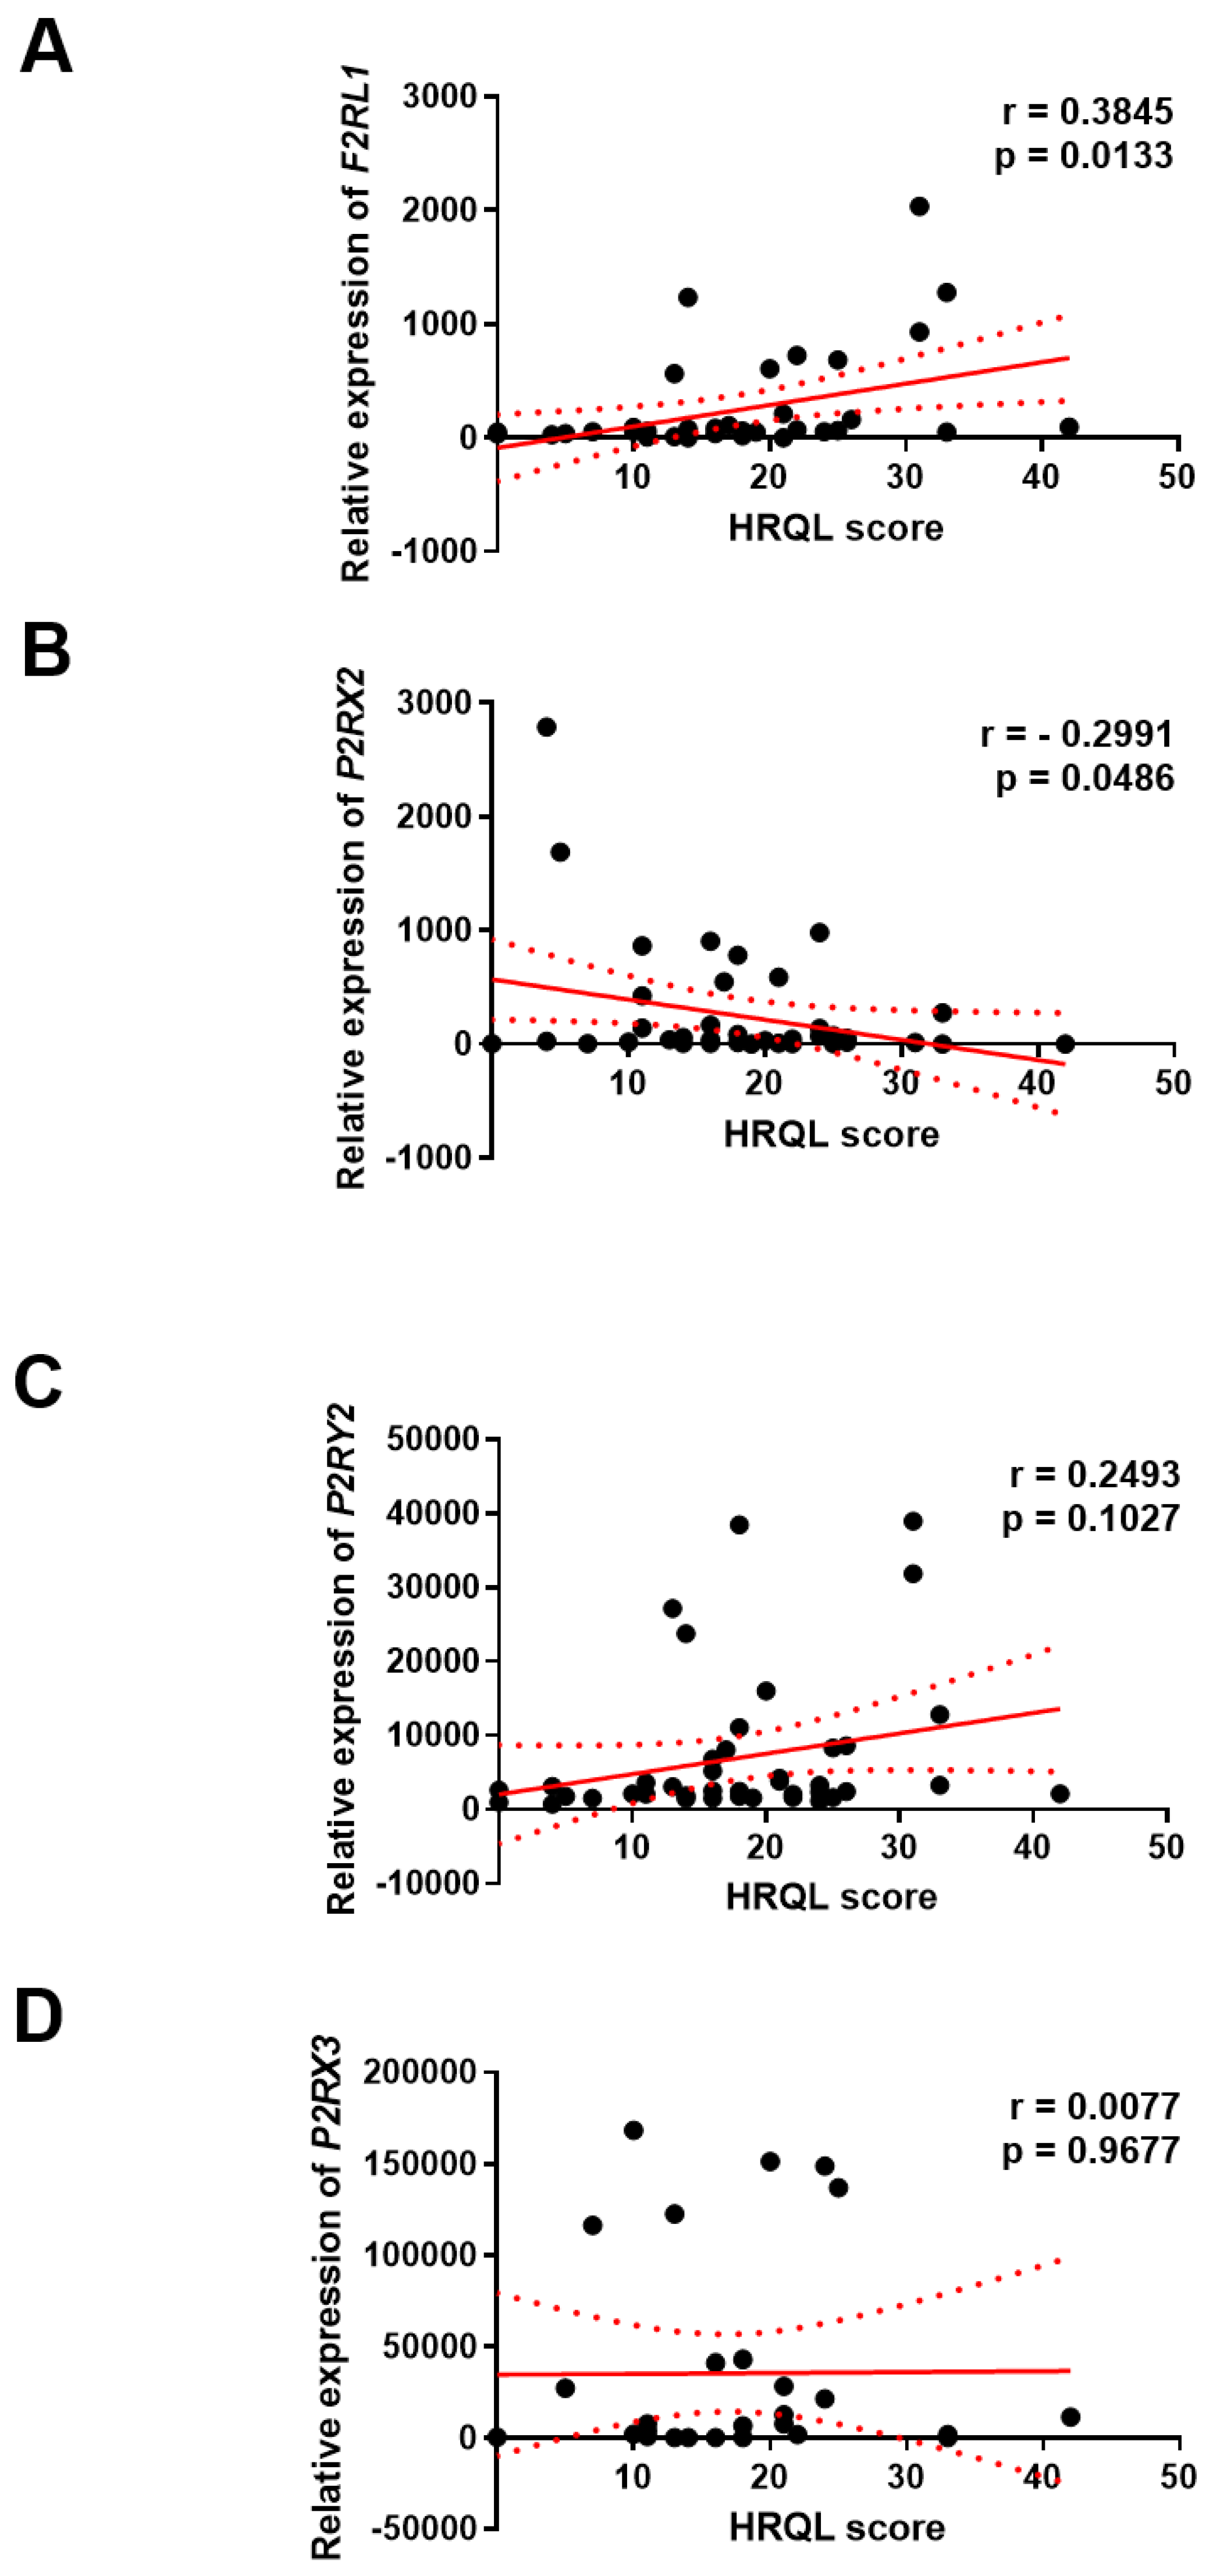
To explore the clinical significance of F2RL1, P2RX2, P2RX3 and P2RY2 expression in GERD, correlation between the level of F2RL1, P2RX2, P2RX3 and P2RY2 gene with the score of GERD – HRQL questionnaire was investigated. We found positive correlation between the level of F2RL1 (r = 0.3845; p<0.01) or P2RY2 (and r = 0.2493; p>0.05) gene with HRQL score in GERD patients, respectively. On the other hand, negative correlation between the level of P2RX2 gene with HRQL score (r = -0.2991; p<0.05) was documented. Of note, the level of P2RX3 gene seems to be not associated with HRQL score (r = 0.0077; p>0.05) in this group (Figure 4).
4. Discussion
Diagnosis, effective treatment and therapy monitoring of GERD patients, especially patients with refractory GERD, are challenging and novel approaches are needed to improve strategies for patients with GERD [6]. Protease-activated receptors and purinergic receptors mediate numerous cellular processes crucial for proper cell homeostasis, proliferation, differentiation or communication [4,5,7]. Here, we evaluated the expression of selected protease-activated and purinergic receptors in the esophagus of GERD patients in the context of its clinical significance.
In our study we noted that PAR-2 (F2RL1) is overexpressed in the esophagus of NERD or ERD patients compared to healthy controls. Our findings are in accordance with the results presented by Kim et al. who noted higher expression of PAR2 in GERD patients and its overexpression in the esophagus of patients with the esophageal reflux symptoms [21]. Similarly, in our study expression of F2RL1 is positively correlated patient’s symptoms according to GERD-HRQL scores. In line, some studies documented overexpression of PAR2 in the esophagus obtained from NERD and ERD patients compared to healthy controls [12,22,23]. Nevertheless, the clinical implication of PAR2 has not been clearly elucidated yet. In previous studies mechanisms by which PAR2 may participate in the GERD exacerbation were pointed. Wulamu et al. noted that stress-induced inflammation in the esophagus of mice is accompanied by PAR2 overexpression [24]. In vitro studies documented that in human esophageal epithelial cells affected by reflux with trypsin up-regulation of PAR2 expression is observed in time- and dose-dependent manner suggesting a crucial role for PAR2 in the inflammation related to GERD [5,25]. In fact, previous studies found that not only acid exposure but also PAR2 activation is needed to increase secretion of IL-8 [26]. It is worth to note that Shan et al. suggested that trypsin and PAR2 action may be directly responsible for the development of refractory GERD in patients under proton pump inhibitor therapy [27]. However, further experimental studies employing in vitro and in vivo approaches are needed to explore clinical potential of PAR2 expression.
In our study expression of PAR-2 is positively correlated to the severity of microscopic damage assessing by DIS. DIS represent impaired epithelial barrier which enables refluxate contents access nerves endings and stimulates nociceptors [3,19]. Our results suggest that PAR2 may be a promising clinical marker for monitoring of epithelial permeability in GERD.
The significance of purinergic receptors in the pathogenesis of GERD is unknown. In GERD, the most explored purinergic receptors are P2RX2 and P2RX3 agonists which according to experimental studies act as regulator of mechanosensory function of esophageal afferents [16]. Observational study where Shieh et al. evaluated numerous purinergic receptors documented that P2RX3 and P2RX7 but not P2RX2, P2RY1, P2RY2, P2RY4, P2RY6 and P2RY12 are up-regulated in ERD when compared to asymptomatic patients or healthy controls [28]. The expression of both purinergic receptors altered in GERD, i.e. P2RX3 and P2RX7 is positively correlated to the expression of transient receptor potential vanilloid receptor 1 (TRPV1), nerve growth factor and glial derived neurotrophic factor [28]. TRPV1 and the above-mentioned neurotrophic factors participate in the development of inflammatory-related hyperalgesia suggesting that P2RX3 may mediate sensitization of inflamed esophagus [29]. Here, we documented significantly higher expression of P2RX3 in the esophagus of GERD patients compared to healthy controls. In line to the results presented by Shieh et al., we found P2RX3 overexpression in ERD but not in NERD , compared to healthy controls [28]. In contrast, our results documented a negative correlation between the expression of P2RX3 and the severity of microscopic damage in GERD which may suggests the protective role of P2RX3 in GERD. Interestingly, the expression of P2RX3 seems to be not corelated with HRQL score.On the other hand, positive correlation between P2RX2 or P2RY2 and DIS score in our study was documented. Higher expression of above-mentioned purinergic receptors in GERD and NERD as well as ERD when compared to healthy controls was observed. The action and function of P2RX2 in the esophagus is poorly understood but our results highlighted negative correlation between P2RX2 expression and HRQL score in GERD patients. In contrast, the expression of P2RY2 is positively correlated with GERD symptoms assessed by GERD-HRQL score.
5. Conclusions
We concluded that expression of selected protease-activated and purinergic receptors such as F2RL1, P2RX2, P2RX3 and P2RY2 may serve for both GERD progression and GERD patients’ quality of life monitoring. Higher PAR2 expression was found in erosive reflux disease and may be associated with higher intensity of symptoms perceived by patients with GERD. As high PAR-2 expression scores were significantly correlated with histologic alterations and severity of symptoms, a major role of PAR2 in the pathogenesis of GERD can be concluded from this study. Relative expression of P2X2 and P2Y2 were increased particularly in NERD, where they could mediate sensitization of esophagus. PAR2, P2X2 and P2Y2 could be in future a therapeutic targets for reflux symptoms and BE prophylaxis.
Author Contributions
Conceptualization, A.M., D.J. and E.M-W; methodology, A.B., A.F., and J.F; software, A.B., A.F. and D.J; validation, A.B., A.F. and D. J.; formal analysis, A.B., A.F. and J.F.; investigation, A.F., J.F., A.W-L. and D.J.; resources, A.M., A.F. and E.M-W.; data curation, A.M., A.B., A.F., A.W-L. and D.J; writing—original draft preparation, A.M., A.W., D.J. and E.M-W.; writing—review and editing, A.M., A.W., D.J. and E.M-W.; visualization, A.B., A.F. and D.J.; supervision, A.M. and E.M-W.; project administration, A.M. and J.F.; funding acquisition, A.M. and E.M-W. All authors have read and agreed to the published version of the manuscript.
Funding
This work was supported by Medical University of Lodz statutory works account [503/1-002-01/503-11-001-19-00]. D.J. was supported by the Foundation for Polish Science (FNP, START 30.2021).
Institutional Review Board Statement
The study was conducted in accordance with the Declaration of Helsinki, and approved by the Institutional Review Board: the independent Bioethics Committees of the Medical University of Lodz approved the study protocols (RNN/12/19/KE).
Informed Consent Statement
Informed consent was obtained from all subjects involved in the study. Written informed consent has been obtained from the patient(s) to publish this paper.
Data Availability Statement
The datasets generated during and/or analyzed during the current study are available from the corresponding author on reasonable request.
Conflicts of Interest
The authors have no relevant financial or non-financial interests to disclose.
References
- Vakil, N.; Van Zanten, S.V.; Kahrilas, P.; Dent, J.; Jones, R.; Bianchi, L.K.; Cesario, K.B. The Montreal Definition and Classification of Gastroesophageal Reflux Disease: A Global Evidence-Based Consensus. Am J Gastroenterol 2006, 101. [Google Scholar] [CrossRef] [PubMed]
- El-Serag, H.B.; Sweet, S.; Winchester, C.C.; Dent, J. Update on the Epidemiology of Gastro-Oesophageal Reflux Disease: A Systematic Review. Gut 2014, 63, 871–880. [Google Scholar] [CrossRef] [PubMed]
- Ustaoglu, A.; Nguyen, A.; Spechler, S.; Sifrim, D.; Souza, R.; Woodland, P. Mucosal Pathogenesis in Gastro-Esophageal Reflux Disease. Neurogastroenterology and motility 2020, 32. [Google Scholar] [CrossRef]
- Lundell, L.; Vieth, M.; Gibson, F.; Nagy, P.; Kahrilas, P.J. Systematic Review: The Effects of Long-Term Proton Pump Inhibitor Use on Serum Gastrin Levels and Gastric Histology. Aliment Pharmacol Ther 2015, 42, 649–663. [Google Scholar] [CrossRef] [PubMed]
- Altomare, A.; Luca Guarino (Sara Emerenziani), M.P.; Cicala, M.; Drewes, A.M.; Krarup, A.L.; Brock, C.; Lottrup, C.; Frøkjær, J.B.; Souza, R.F.; Nardone, G.; et al. Gastrointestinal Sensitivity and Gastroesophageal Reflux Disease. Ann N Y Acad Sci 2013, 1300, 80–95. [Google Scholar] [CrossRef]
- Souza, R.F. Bringing GERD Management up to PAR-2. Am J Gastroenterol 2010, 105, 1944–1946. [Google Scholar] [CrossRef]
- Ustaoglu, A.; Woodland, P. Sensory Phenotype of the Oesophageal Mucosa in Gastro-Oesophageal Reflux Disease. Int J Mol Sci 2023, 24. [Google Scholar] [CrossRef] [PubMed]
- Jacenik, D.; Fichna, J.; Małecka-Wojciesko, E.; Mokrowiecka, A. Protease-Activated Receptors - Key Regulators of Inflammatory Bowel Diseases Progression. J Inflamm Res 2021, 14, 7487–7497. [Google Scholar] [CrossRef] [PubMed]
- Vergnolle, N. Modulation of Visceral Pain and Inflammation by Protease-Activated Receptors. Br J Pharmacol 2004, 141, 1264. [Google Scholar] [CrossRef] [PubMed]
- Sung, T.S.; Lu, H.; Sung, J.; Yeom, J.H.; Perrino, B.A.; Koh, S.D. The Functional Role of Protease-Activated Receptors on Contractile Responses by Activation of Ca2+ Sensitization Pathways in Simian Colonic Muscles. Am J Physiol Gastrointest Liver Physiol 2018, 315, G921–G931. [Google Scholar] [CrossRef] [PubMed]
- Sato, K.; Ninomiya, H.; Ohkura, S.; Ozaki, H.; Nasu, T. Impairment of PAR-2-Mediated Relaxation System in Colonic Smooth Muscle after Intestinal Inflammation. Br J Pharmacol 2006, 148, 200–207. [Google Scholar] [CrossRef] [PubMed]
- Kandulski, A.; Wex, T.; Mönkemüller, K.; Kuester, D.; Fry, L.C.; Roessner, A.; Malfertheiner, P. Proteinase-Activated Receptor-2 in the Pathogenesis of Gastroesophageal Reflux Disease. Am J Gastroenterol 2010, 105, 1934–1943. [Google Scholar] [CrossRef]
- Huang, S.C. Protease-Activated Receptor-1 (PAR1) and PAR2 but Not PAR4 Mediate Relaxations in Lower Esophageal Sphincter. Regul Pept 2007, 142, 37–43. [Google Scholar] [CrossRef]
- Inci, K.; Edebo, A.; Olbe, L.; Casselbrant, A. Expression of Protease-Activated-Receptor 2 (PAR-2) in Human Esophageal Mucosa. Scand J Gastroenterol 2009, 44, 664–671. [Google Scholar] [CrossRef] [PubMed]
- Zagorodnyuk, V.P.; Chen, B.N.; Costa, M.; Brookes, S.J.H. Mechanotransduction by Intraganglionic Laminar Endings of Vagal Tension Receptors in the Guinea-Pig Oesophagus. J Physiol 2003, 553, 575. [Google Scholar] [CrossRef]
- Page, A.J.; O’Donnell, T.A.; Blackshaw, L.A. P2X Purinoceptor-Induced Sensitization of Ferret Vagal Mechanoreceptors in Oesophageal Inflammation. J Physiol 2000, 523 Pt 2, 403–411. [Google Scholar] [CrossRef]
- Calabrese, C.; Fabbri, A.; Bortolotti, M.; Cenacchi, G.; Areni, A.; Scialpi, C.; Miglioli, M.; Di Febo, G. Dilated Intercellular Spaces as a Marker of Oesophageal Damage: Comparative Results in Gastro-Oesophageal Reflux Disease with or without Bile Reflux. Aliment Pharmacol Ther 2003, 18, 525–532. [Google Scholar] [CrossRef] [PubMed]
- Appelman, H.D.; Streutker, C.; Vieth, M.; Neumann, H.; Neurath, M.F.; Upton, M.P.; Sagaert, X.; Wang, H.H.; El-Zimaity, H.; Abraham, S.C.; et al. The Esophageal Mucosa and Submucosa: Immunohistology in GERD and Barrett’s Esophagus. Ann N Y Acad Sci 2013, 1300, 144–165. [Google Scholar] [CrossRef]
- Barlow, W.J.; Orlando, R.C. The Pathogenesis of Heartburn in Nonerosive Reflux Disease: A Unifying Hypothesis. Gastroenterology 2005, 128, 771–778. [Google Scholar] [CrossRef]
- Velanovich, V. The Development of the GERD-HRQL Symptom Severity Instrument. Dis Esophagus 2007, 20, 130–134. [Google Scholar] [CrossRef]
- Kim, J.J.; Kim, N.; Choi, Y.J.; Kim, J.S.; Jung, H.C. Increased TRPV1 and PAR2 MRNA Expression Levels Are Associated Only with the Esophageal Reflux Symptoms, but Not with the Extraesophageal Reflux Symptoms. Medicine 2016, 95, e4387. [Google Scholar] [CrossRef] [PubMed]
- Yoshida, N.; Kuroda, M.; Suzuki, T.; Kamada, K.; Uchiyama, K.; Handa, O.; Takagi, T.; Yoshikawa, T.; Kuramoto, H. Role of Nociceptors/Neuropeptides in the Pathogenesis of Visceral Hypersensitivity of Nonerosive Reflux Disease. Dig Dis Sci 2013, 58, 2237–2243. [Google Scholar] [CrossRef] [PubMed]
- Abd El-Rehim, D.M.; Fath El-Bab, H.K.; Kamal, E.M. Expression of Proteinase-Activated Receptor-2 in the Esophageal Mucosa of Gastroesophageal Reflux Disease Patients: A Histomorphologic and Immunohistochemical Study. Appl Immunohistochem Mol Morphol 2015, 23, 646–652. [Google Scholar] [CrossRef]
- Wulamu, W.; Yisireyili, M.; Aili, A.; Takeshita, K.; Alimujiang, A.; Aipire, A.; Li, Y.; Jiang, Y.; Aizezi, M.; Li, Z.; et al. Chronic Stress Augments Esophageal Inflammation, and Alters the Expression of Transient Receptor Potential Vanilloid 1 and Protease-activated Receptor 2 in a Murine Model. Mol Med Rep 2019, 19, 5386–5396. [Google Scholar] [CrossRef] [PubMed]
- Altomare, A.; Guarino, M.P.L.; Cocca, S.; Emerenziani, S.; Cicala, M. Gastroesophageal Reflux Disease: Update on Inflammation and Symptom Perception. World J Gastroenterol 2013, 19, 6523–6528. [Google Scholar] [CrossRef] [PubMed]
- Winkelsett, L.; Malfertheiner, P.; Wex, T.; Kandulski, A. Mucosal Two-Step Pathogenesis in Gastroesophageal Reflux Disease: Repeated Weakly Acidic Stimulation and Activation of Protease-Activated Receptor-2 on Mucosal Interleukin-8 Secretion. Digestion 2018, 98, 19–25. [Google Scholar] [CrossRef]
- Shan, J.; Oshima, T.; Chen, X.; Fukui, H.; Watari, J.; Miwa, H. Trypsin Impaired Epithelial Barrier Function and Induced IL-8 Secretion through Basolateral PAR-2: A Lesson from a Stratified Squamous Epithelial Model. Am J Physiol Gastrointest Liver Physiol 2012, 303. [Google Scholar] [CrossRef] [PubMed]
- Shieh, K.R.; Yi, C.H.; Liu, T.T.; Tseng, H.L.; Ho, H.C.; Hsieh, H.T.; Chen, C.L. Evidence for Neurotrophic Factors Associating with TRPV1 Gene Expression in the Inflamed Human Esophagus. Neurogastroenterology and motility 2010, 22. [Google Scholar] [CrossRef] [PubMed]
- Amaya, F.; Shimosato, G.; Nagano, M.; Ueda, M.; Hashimoto, S.; Tanaka, Y.; Suzuki, H.; Tanaka, M. NGF and GDNF Differentially Regulate TRPV1 Expression That Contributes to Development of Inflammatory Thermal Hyperalgesia. Eur J Neurosci 2004, 20, 2303–2310. [Google Scholar] [CrossRef]
Figure 1.
The expression of F2RL1, P2RX2, P2RX3 and P2RY2 in healthy controls (n = 9) and patients with GERD (n = 53). The Mann–Whitney test was used to compare the values; ## p<0.01 vs. respective control.
Figure 1.
The expression of F2RL1, P2RX2, P2RX3 and P2RY2 in healthy controls (n = 9) and patients with GERD (n = 53). The Mann–Whitney test was used to compare the values; ## p<0.01 vs. respective control.
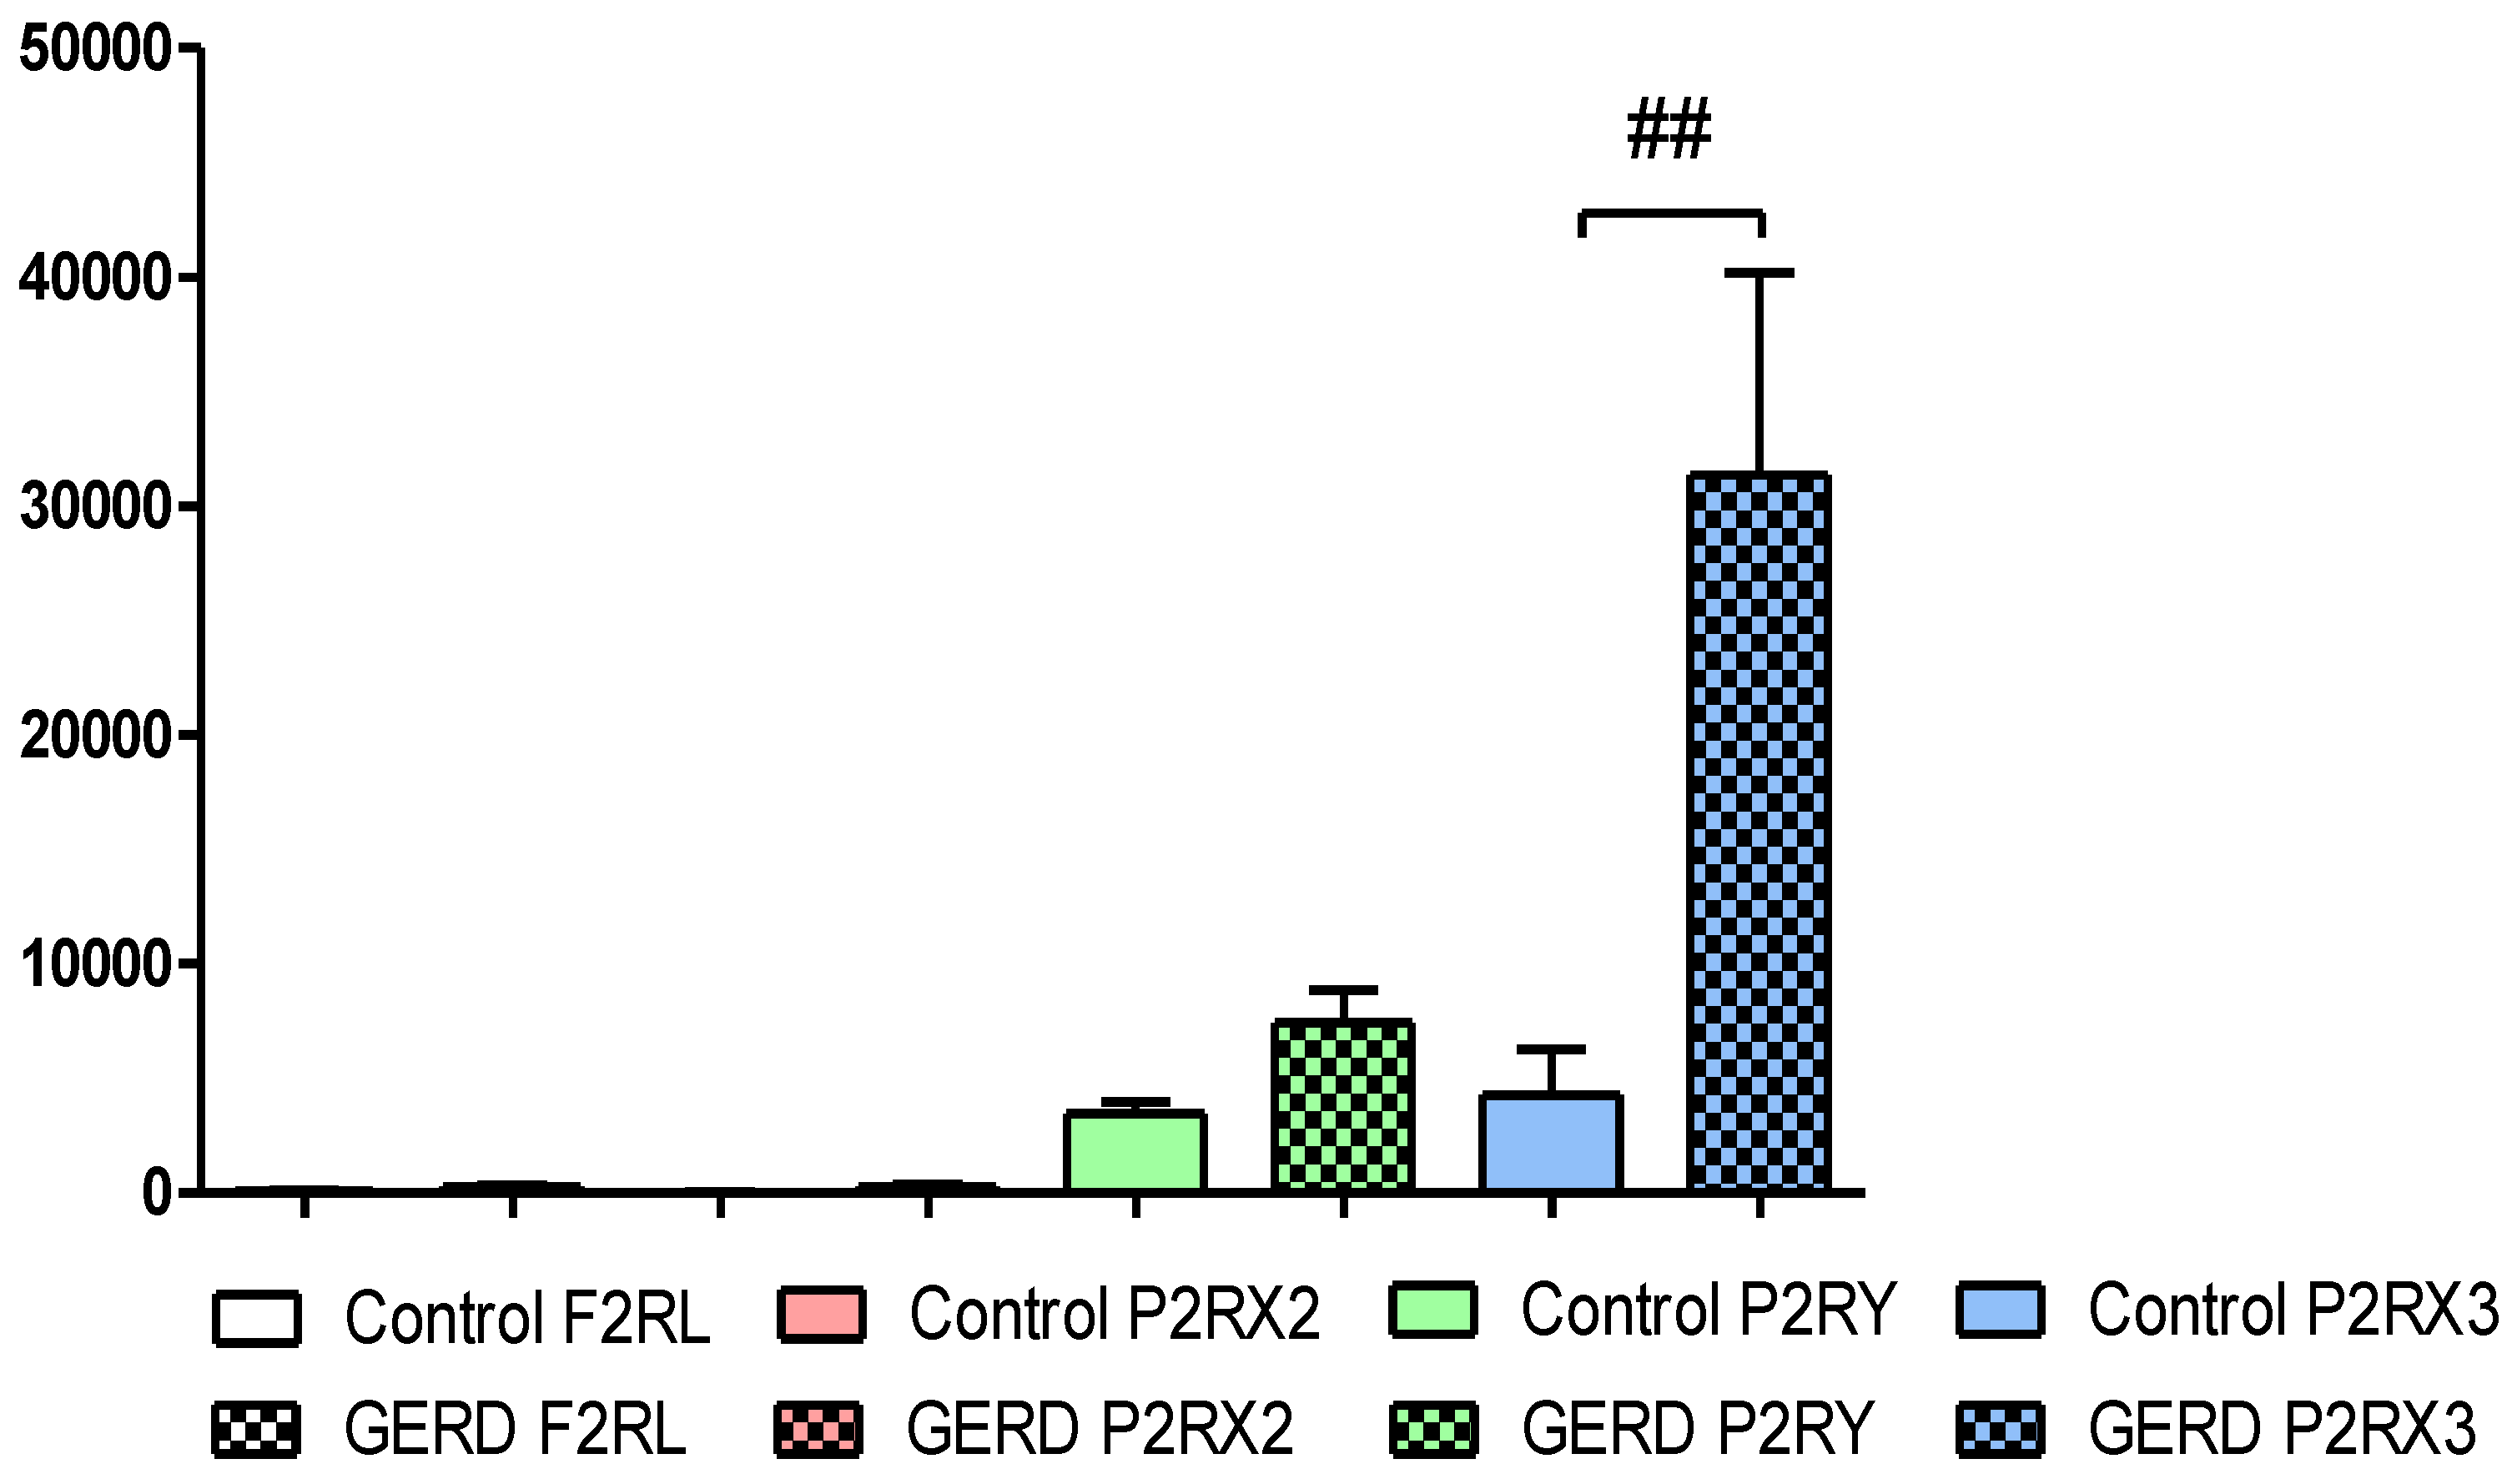
Figure 2.
The expression of F2RL1 (A), P2RX2 (B), P2RX3 (C) and P2RY2 (D) in healthy controls (n = 9) and GERD patients with NERD (n = 32 – 36) or ERD (n = 12 – 15). The Kruskal–Wallis test was used to compare the values.
Figure 2.
The expression of F2RL1 (A), P2RX2 (B), P2RX3 (C) and P2RY2 (D) in healthy controls (n = 9) and GERD patients with NERD (n = 32 – 36) or ERD (n = 12 – 15). The Kruskal–Wallis test was used to compare the values.
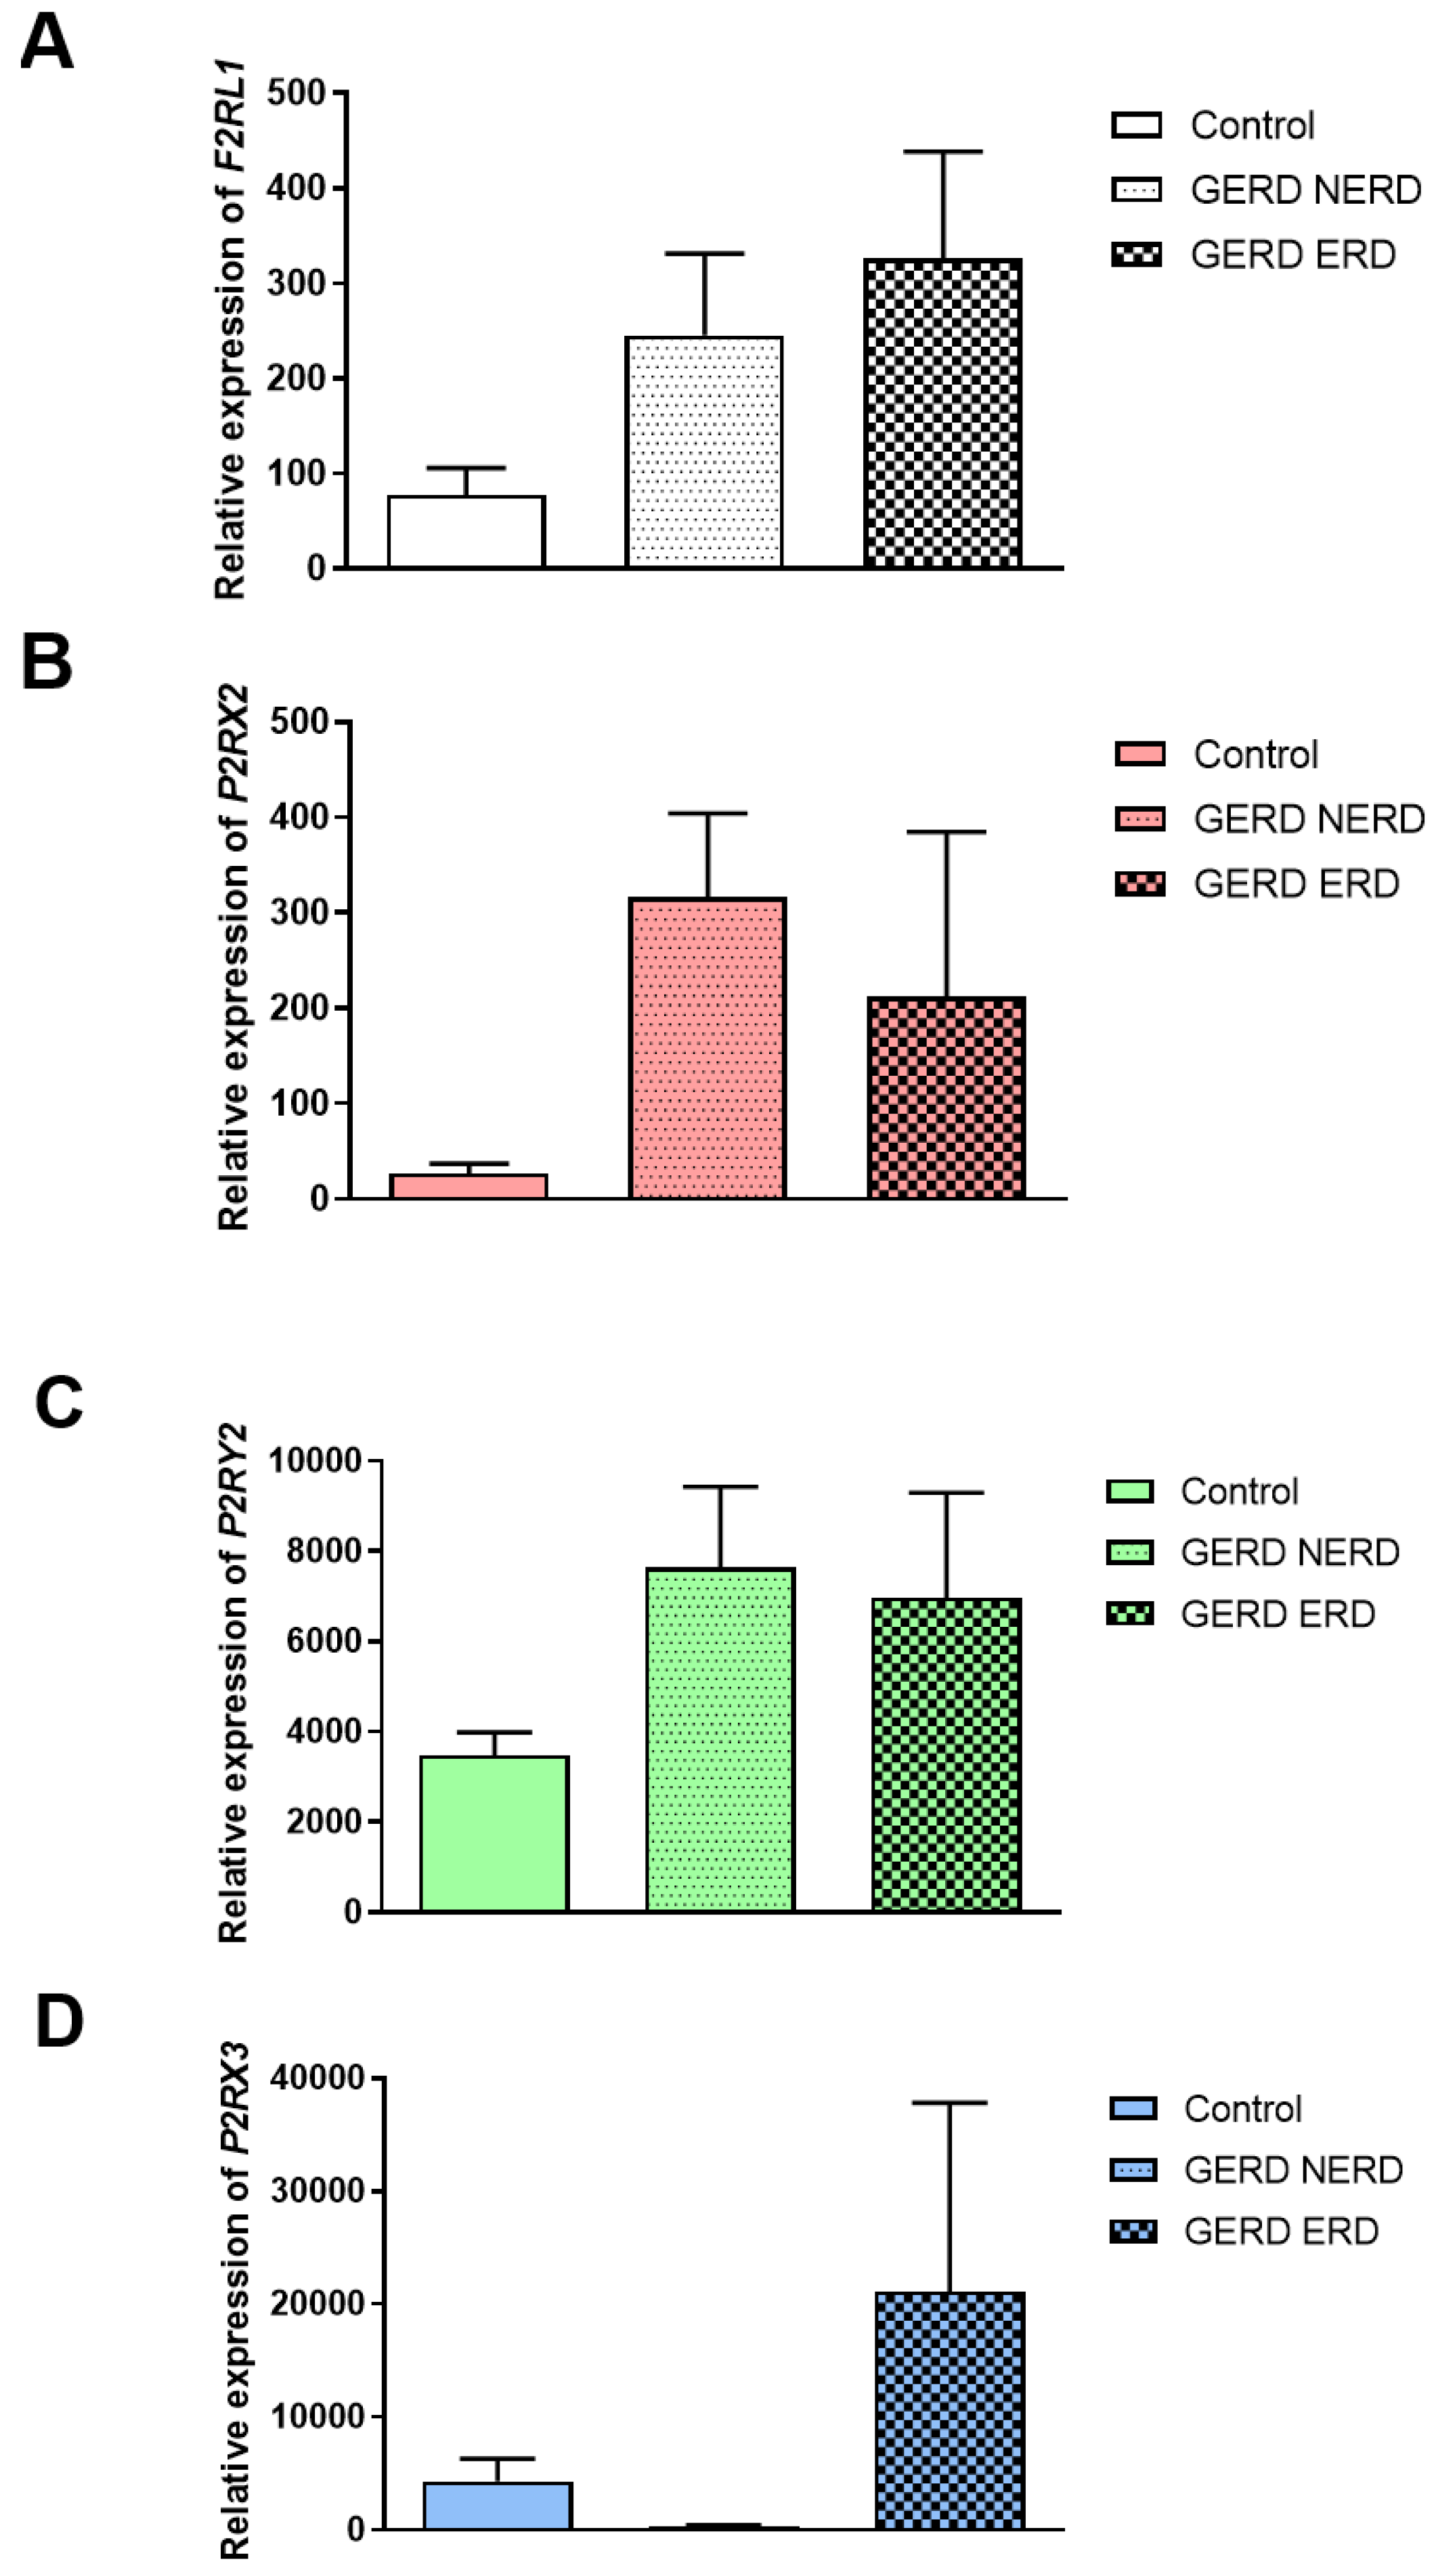
Figure 3.
Heatmap showing the relation between the expression of F2RL1, P2RX2, P2RX3 and P2RY2 and DIS score (n = 24 – 30). The Spearman rank correlation test was used to analyzed the association between the expression of genes and DIS score; # p<0.05, ## p<0.01 vs. respective control.
Figure 3.
Heatmap showing the relation between the expression of F2RL1, P2RX2, P2RX3 and P2RY2 and DIS score (n = 24 – 30). The Spearman rank correlation test was used to analyzed the association between the expression of genes and DIS score; # p<0.05, ## p<0.01 vs. respective control.
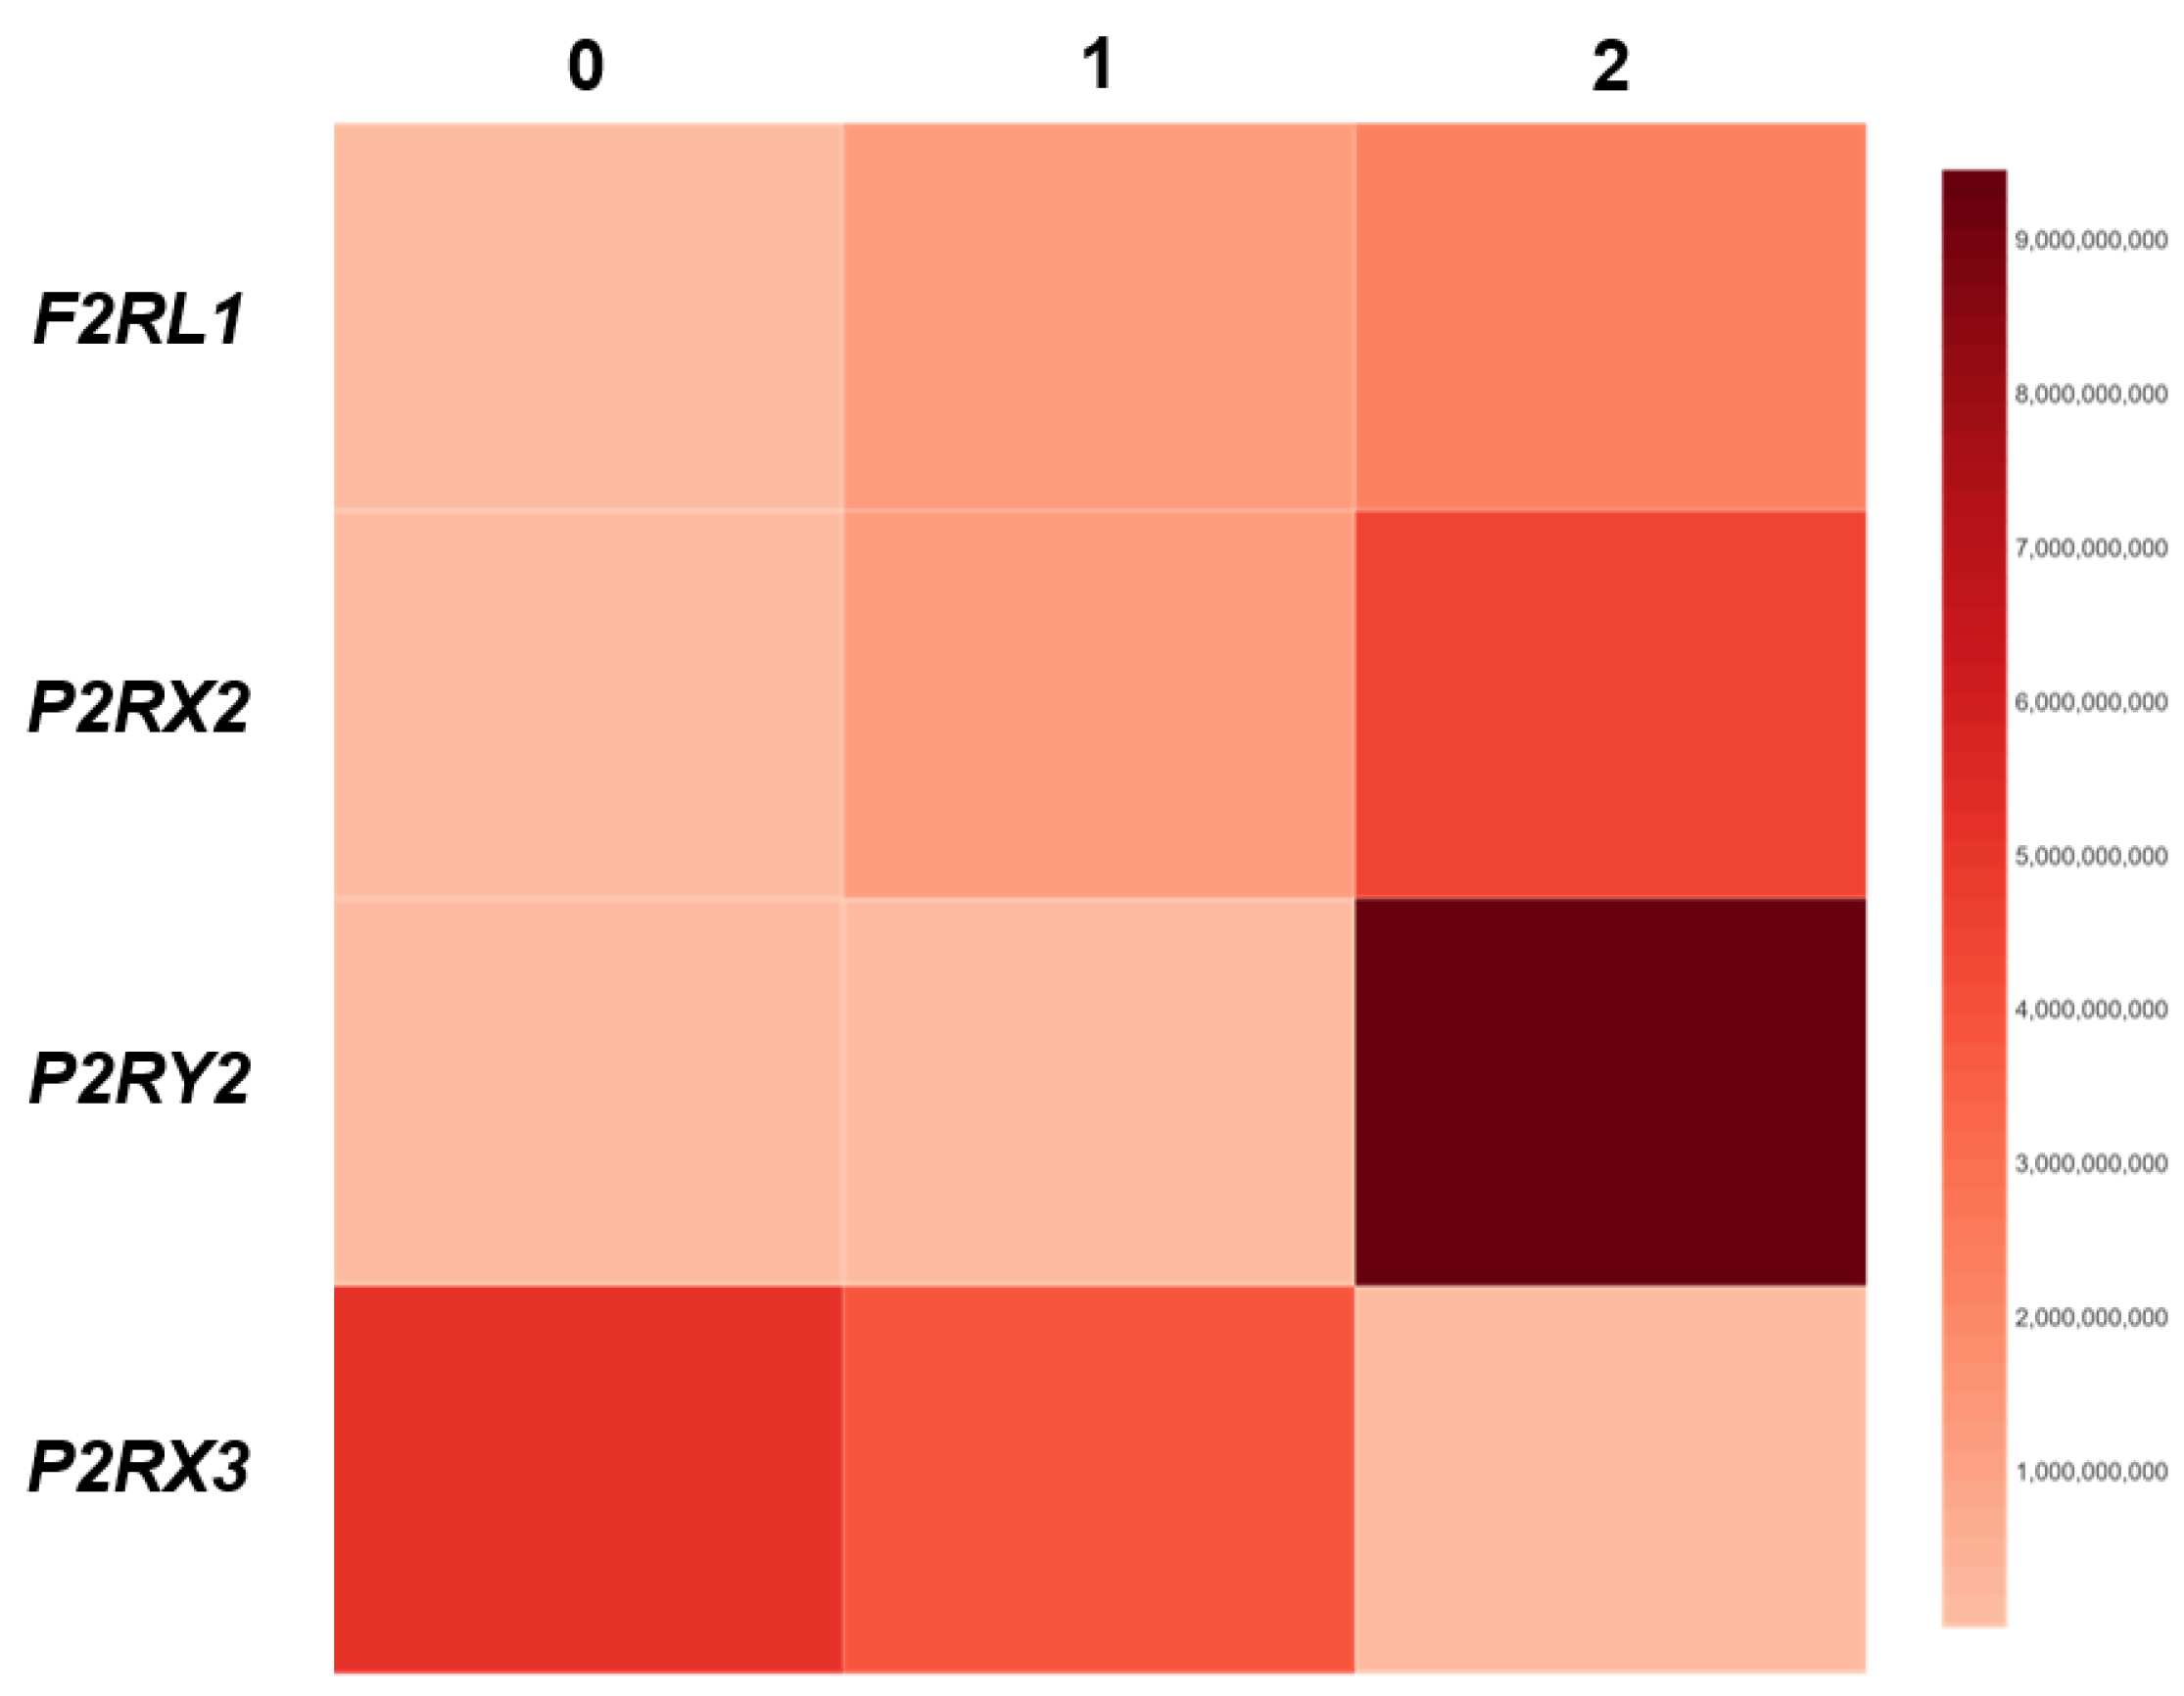
Figure 4.
Correlations between the expression of F2RL1 (A), P2RX2 (B), P2RX3 (C) and P2RY2 (D) and HRQL in patients with GERD. The Spearman rank test was used to analyzed the association between the expression of genes and GERD-HRQL; # p<0.05, ## p<0.01 vs. respective control.
Figure 4.
Correlations between the expression of F2RL1 (A), P2RX2 (B), P2RX3 (C) and P2RY2 (D) and HRQL in patients with GERD. The Spearman rank test was used to analyzed the association between the expression of genes and GERD-HRQL; # p<0.05, ## p<0.01 vs. respective control.
Disclaimer/Publisher’s Note: The statements, opinions and data contained in all publications are solely those of the individual author(s) and contributor(s) and not of MDPI and/or the editor(s). MDPI and/or the editor(s) disclaim responsibility for any injury to people or property resulting from any ideas, methods, instructions or products referred to in the content. |
© 2025 by the authors. Licensee MDPI, Basel, Switzerland. This article is an open access article distributed under the terms and conditions of the Creative Commons Attribution (CC BY) license (http://creativecommons.org/licenses/by/4.0/).
Copyright: This open access article is published under a Creative Commons CC BY 4.0 license, which permit the free download, distribution, and reuse, provided that the author and preprint are cited in any reuse.


