
Submitted:
04 January 2025
Posted:
07 January 2025
You are already at the latest version
Abstract
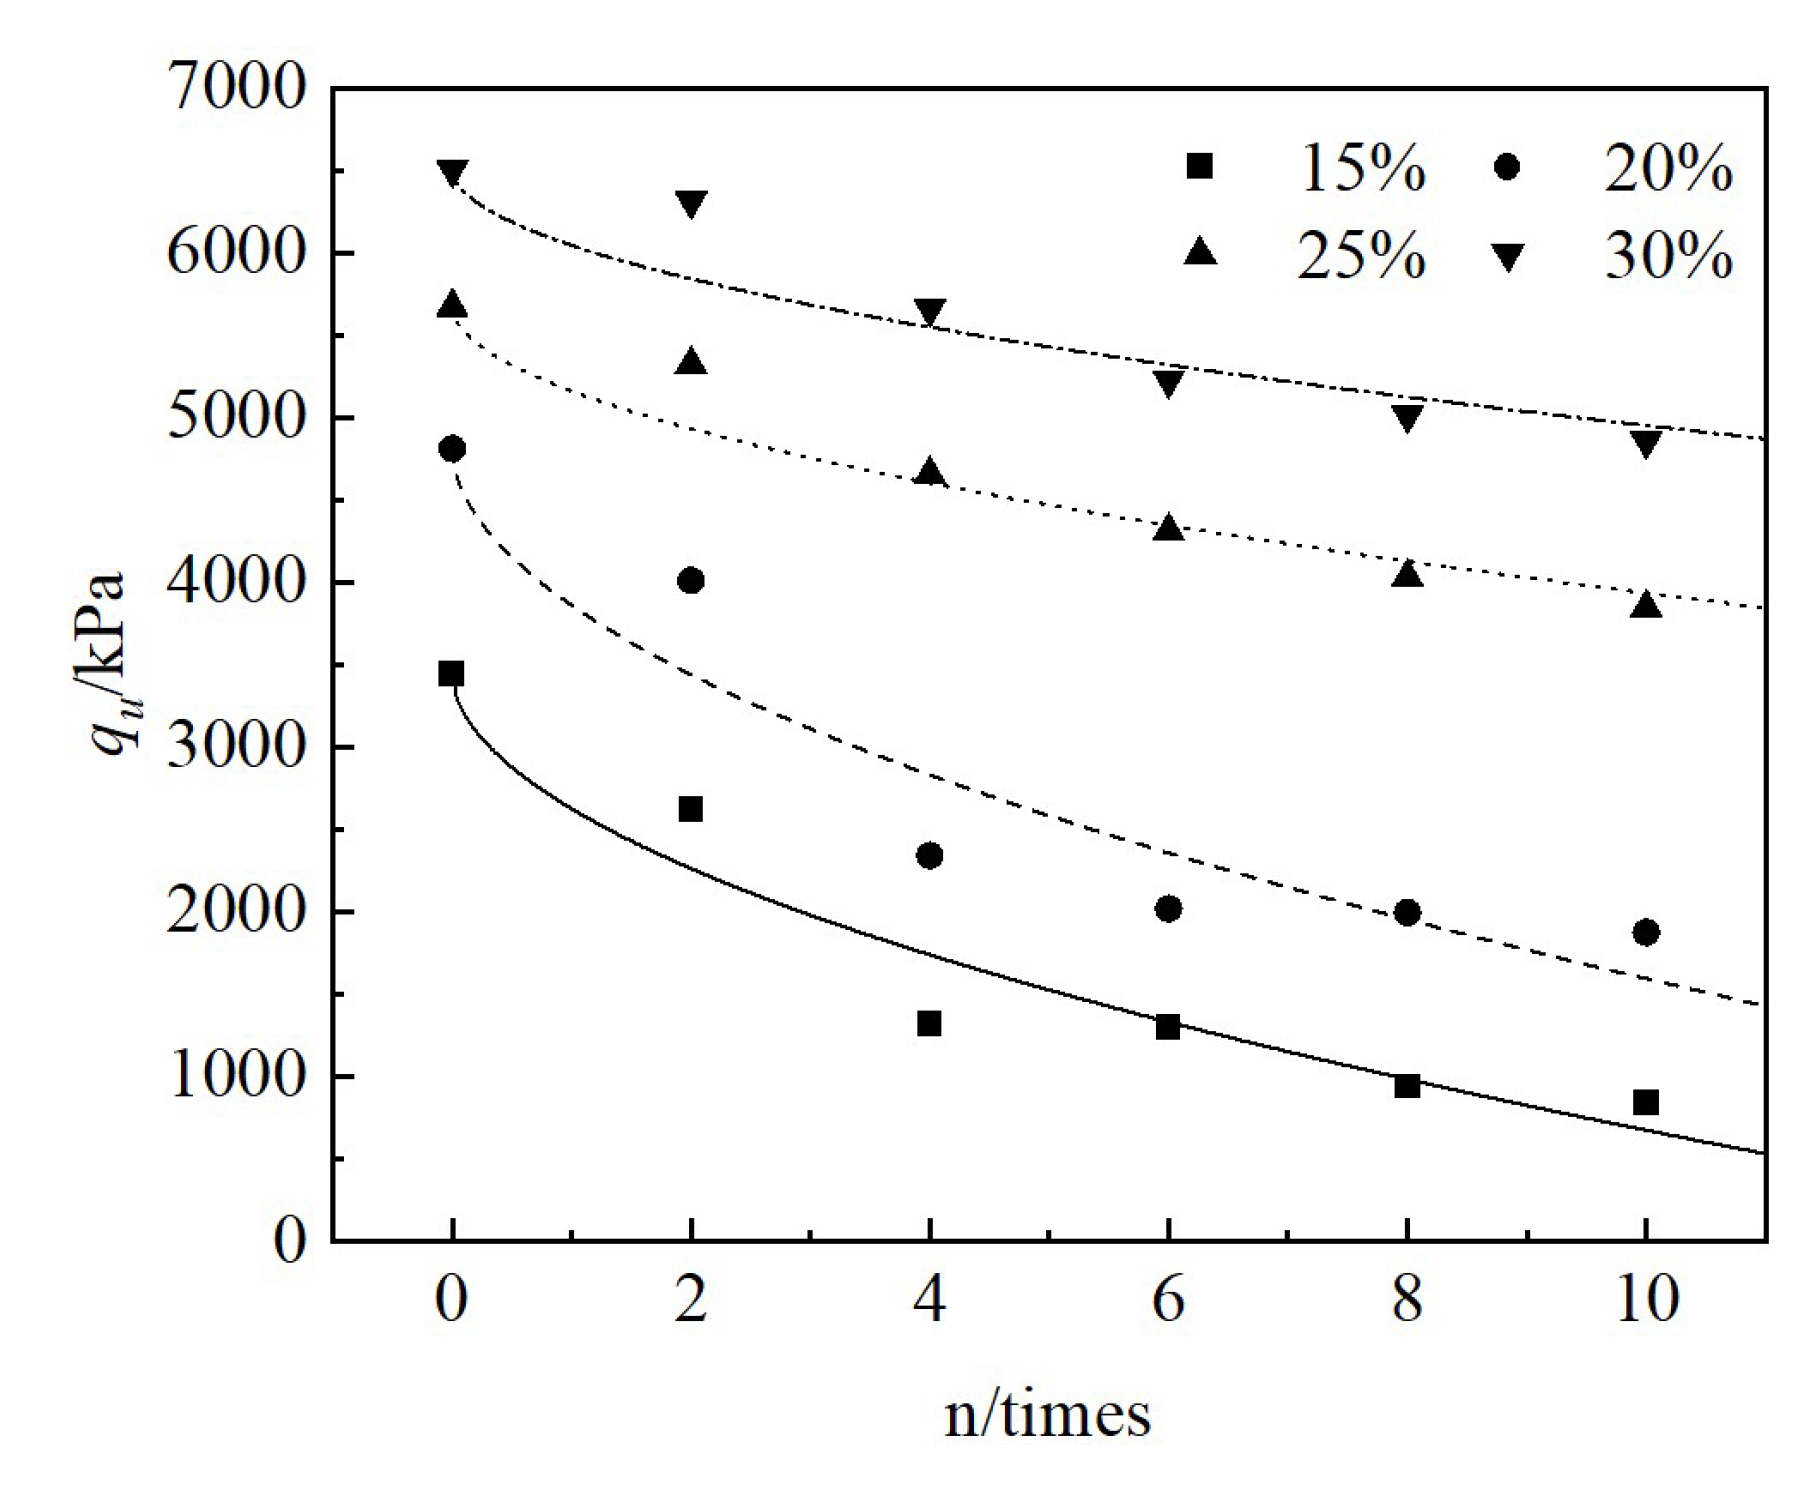
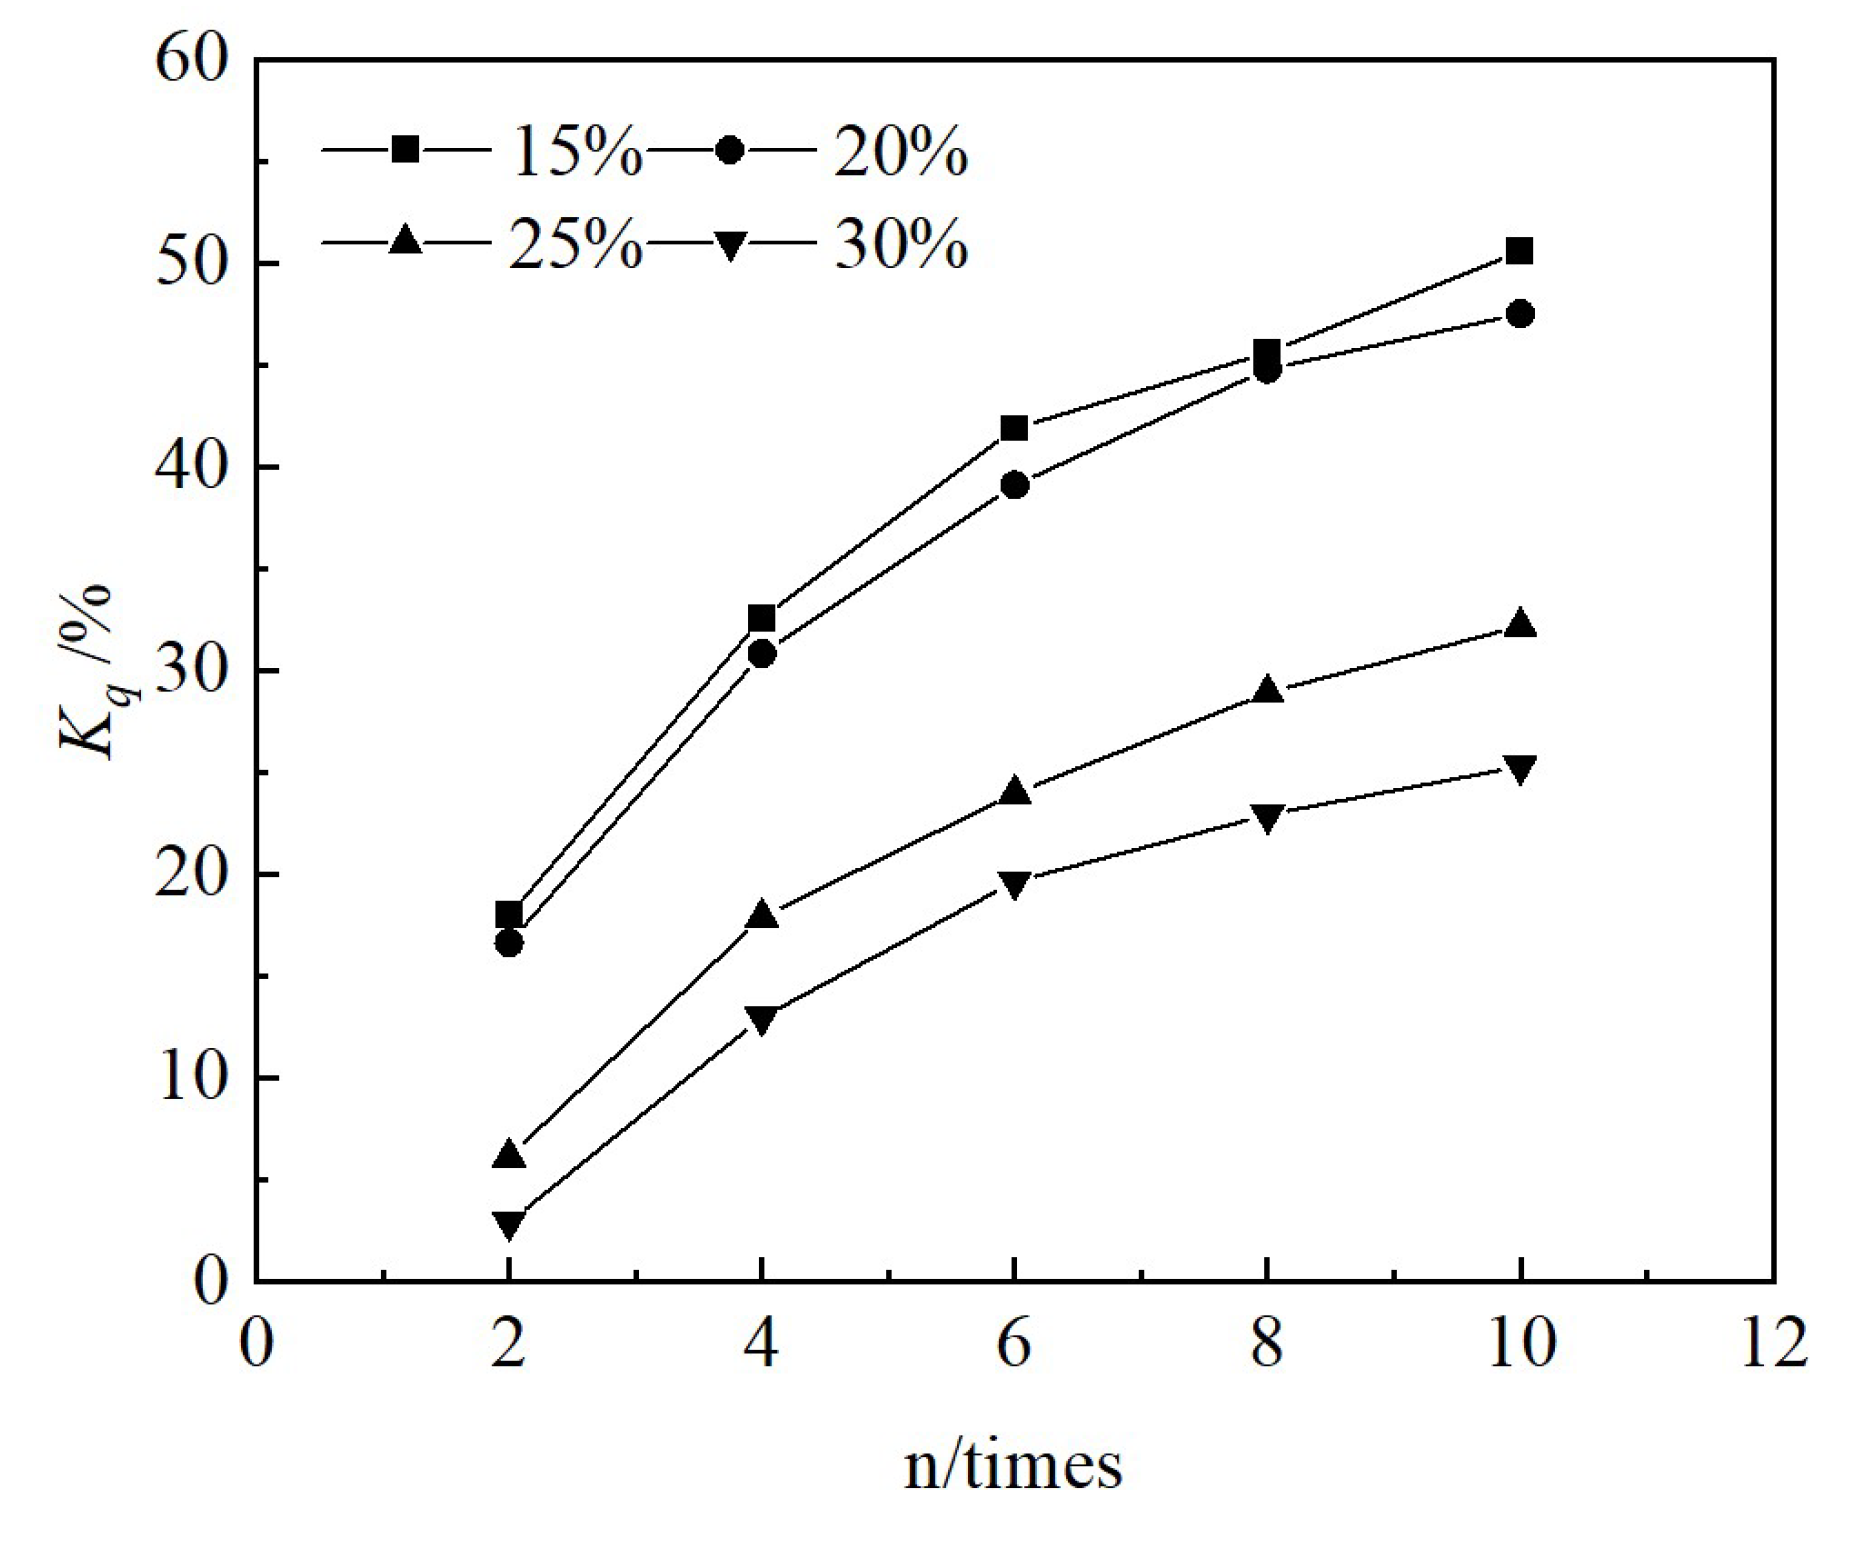
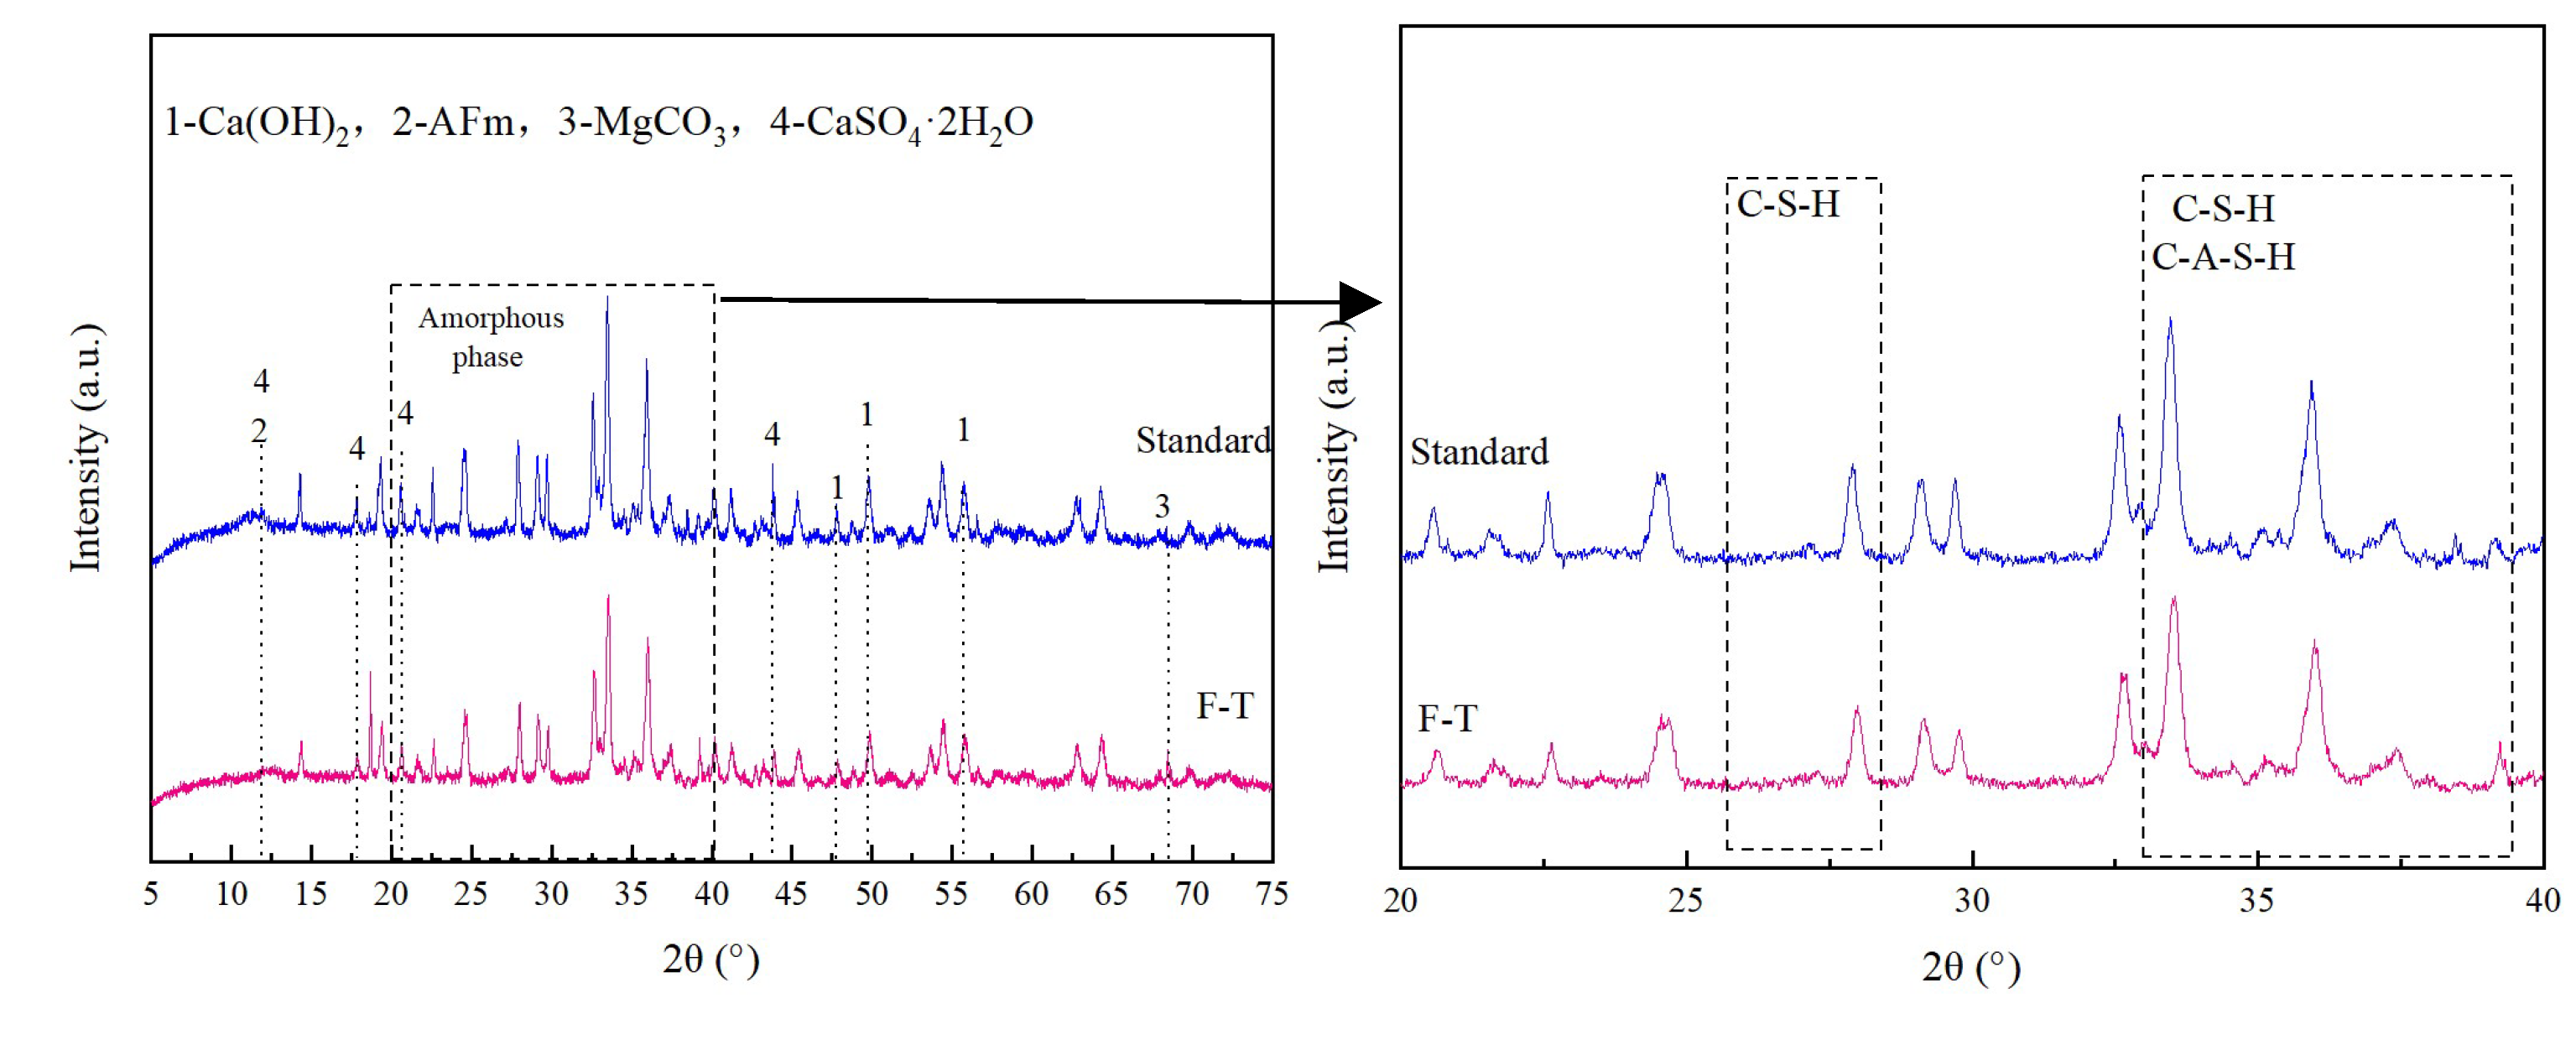
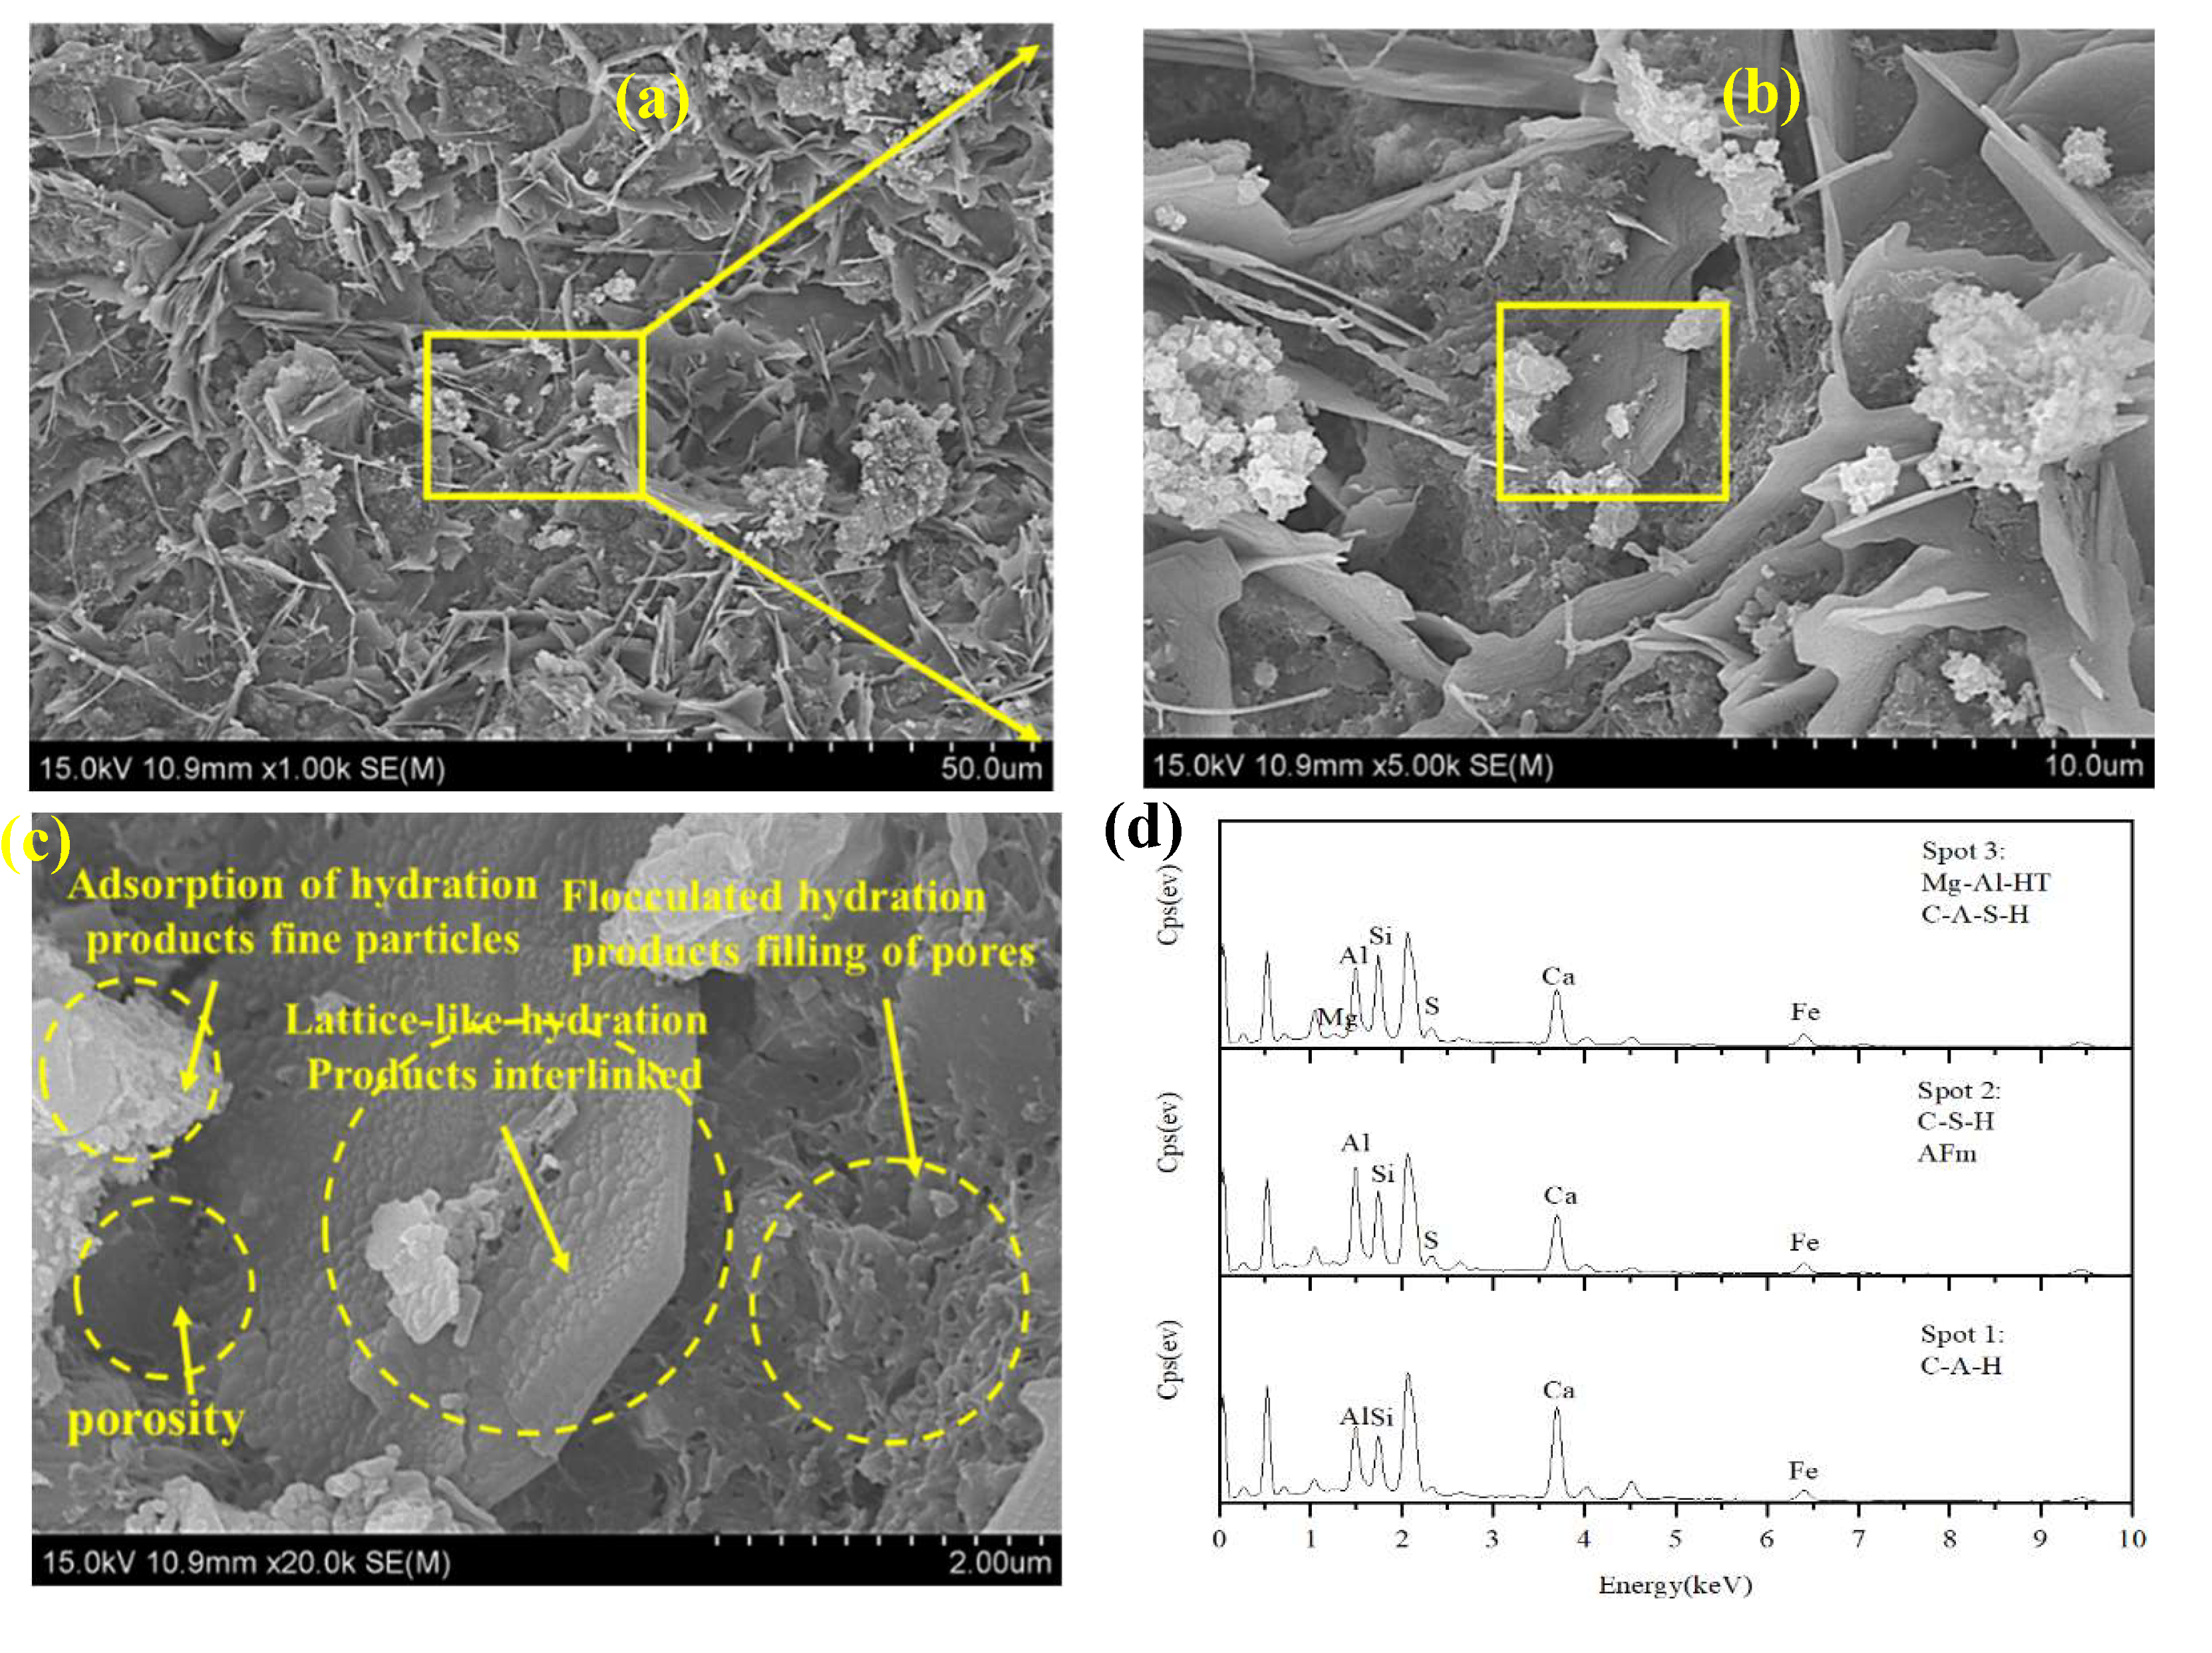
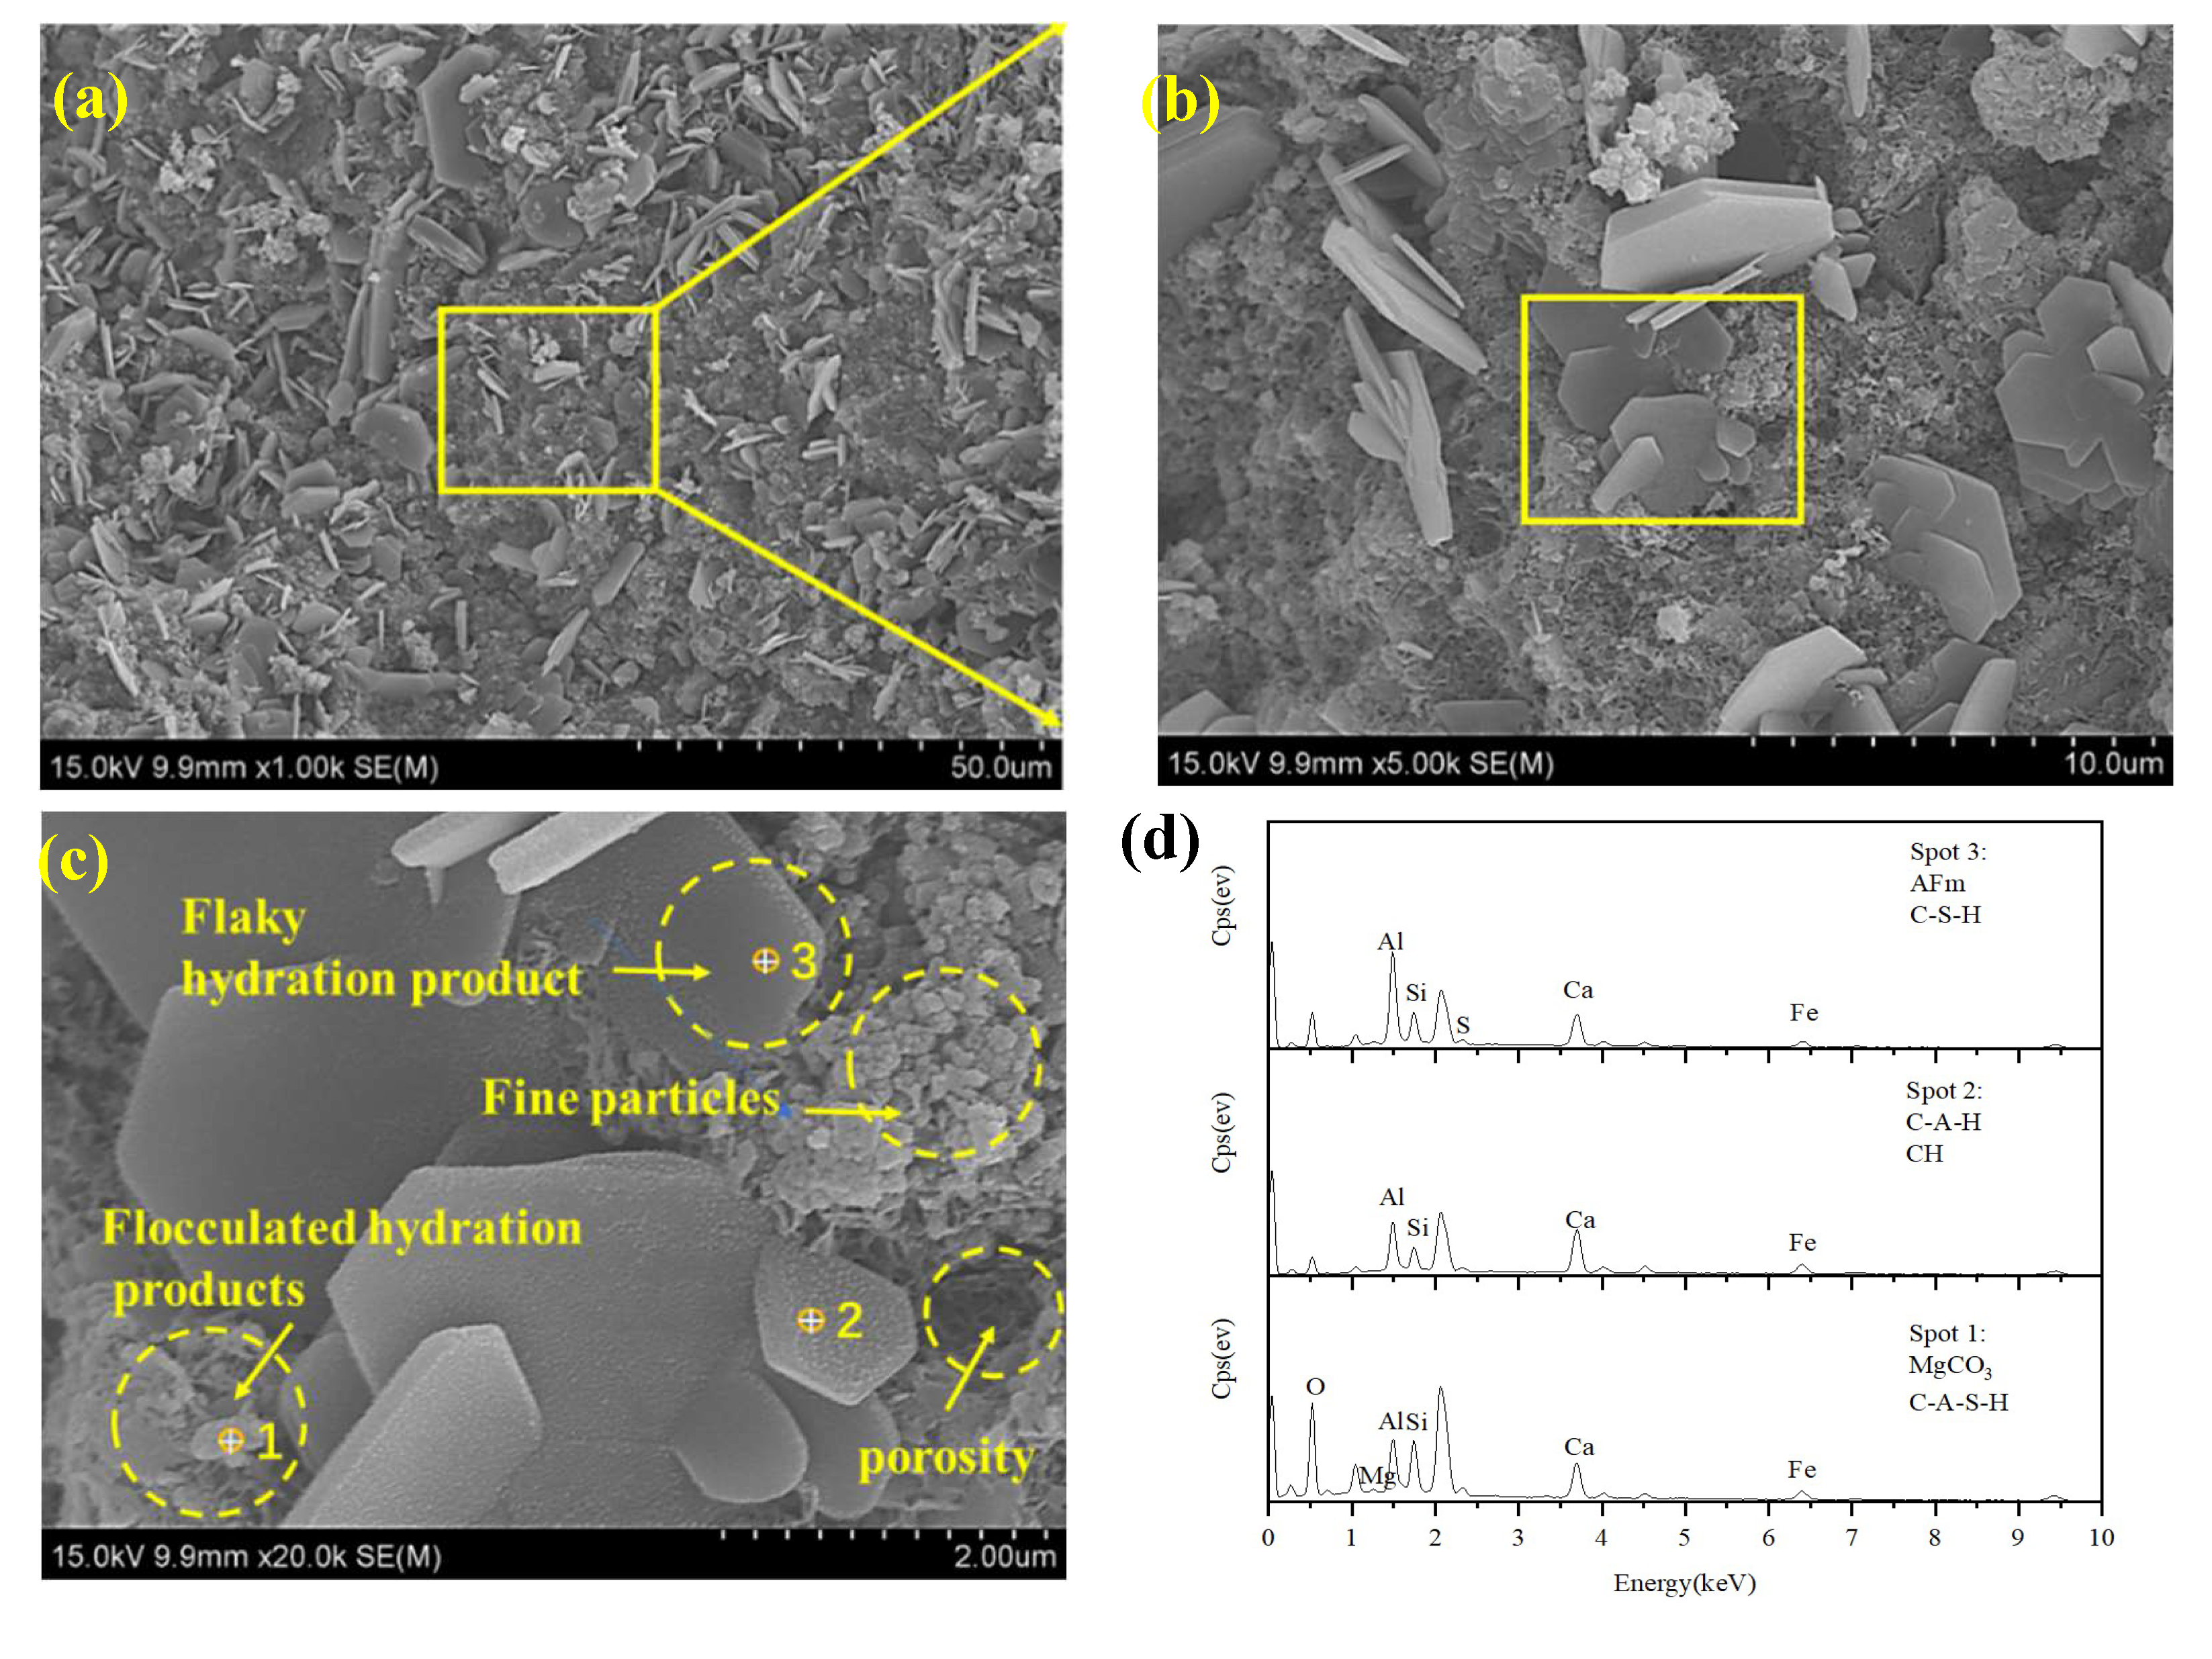
Red mud is a kind of solid waste in the production process of aluminum industry. Long-term stockpiling of red mud not only occupies a large amount of land, but also causes environmental pollution. In order to improve the strength, reduce the alkalinity and toxicity of red mud, and to study its durability under freeze-thaw cycles, this paper CGFPA binders were adopted to solidify/stabilize red mud with calcium carbide residue, ground granulated blast furnace slag, fly ash, phosphogypsum and graphene as components. The effects and the mechanism of freeze-thaw cycling on the unconfined compressive strength, pH value, and toxic leaching of the solidified/stabilized red mud was investigated. The results of the study showed that the mass, unconfined compressive strength, and pH of the solidified/stabilized red mud decreased gradually with the increase in the number of freeze-thaw cycles, while the leaching concentration of pollutants increased gradually. The rate of loss of unconfined compressive strength satisfies an exponential function with the number of cycles, and the logarithm of pollutant concentration satisfies a linear relationship with the number of cycles. The cumulative loss of unconfined compressive strength after 10 freeze-thaw cycles was 50.6%, 47.5%, 32.2%, and 25.3% when the binder mixing ratio was 15%, 20%, 25%, and 30%. The gelling products generated by the hydration reaction of the binders were mainly C-S-H, C-A-S-H, C-A-H, AFm, etc. Under the action of freeze-thaw cycles, the lattice-like structure of the solidified/stabilized red mud was damaged, resulting in the decrease of its unconfined compressive strength and the increase of pollutant leaching concentration. The research results can provide a theoretical basis for the use of red mud in permafrost regions.
Keywords:
1. Introduction
2. Materials and Methods
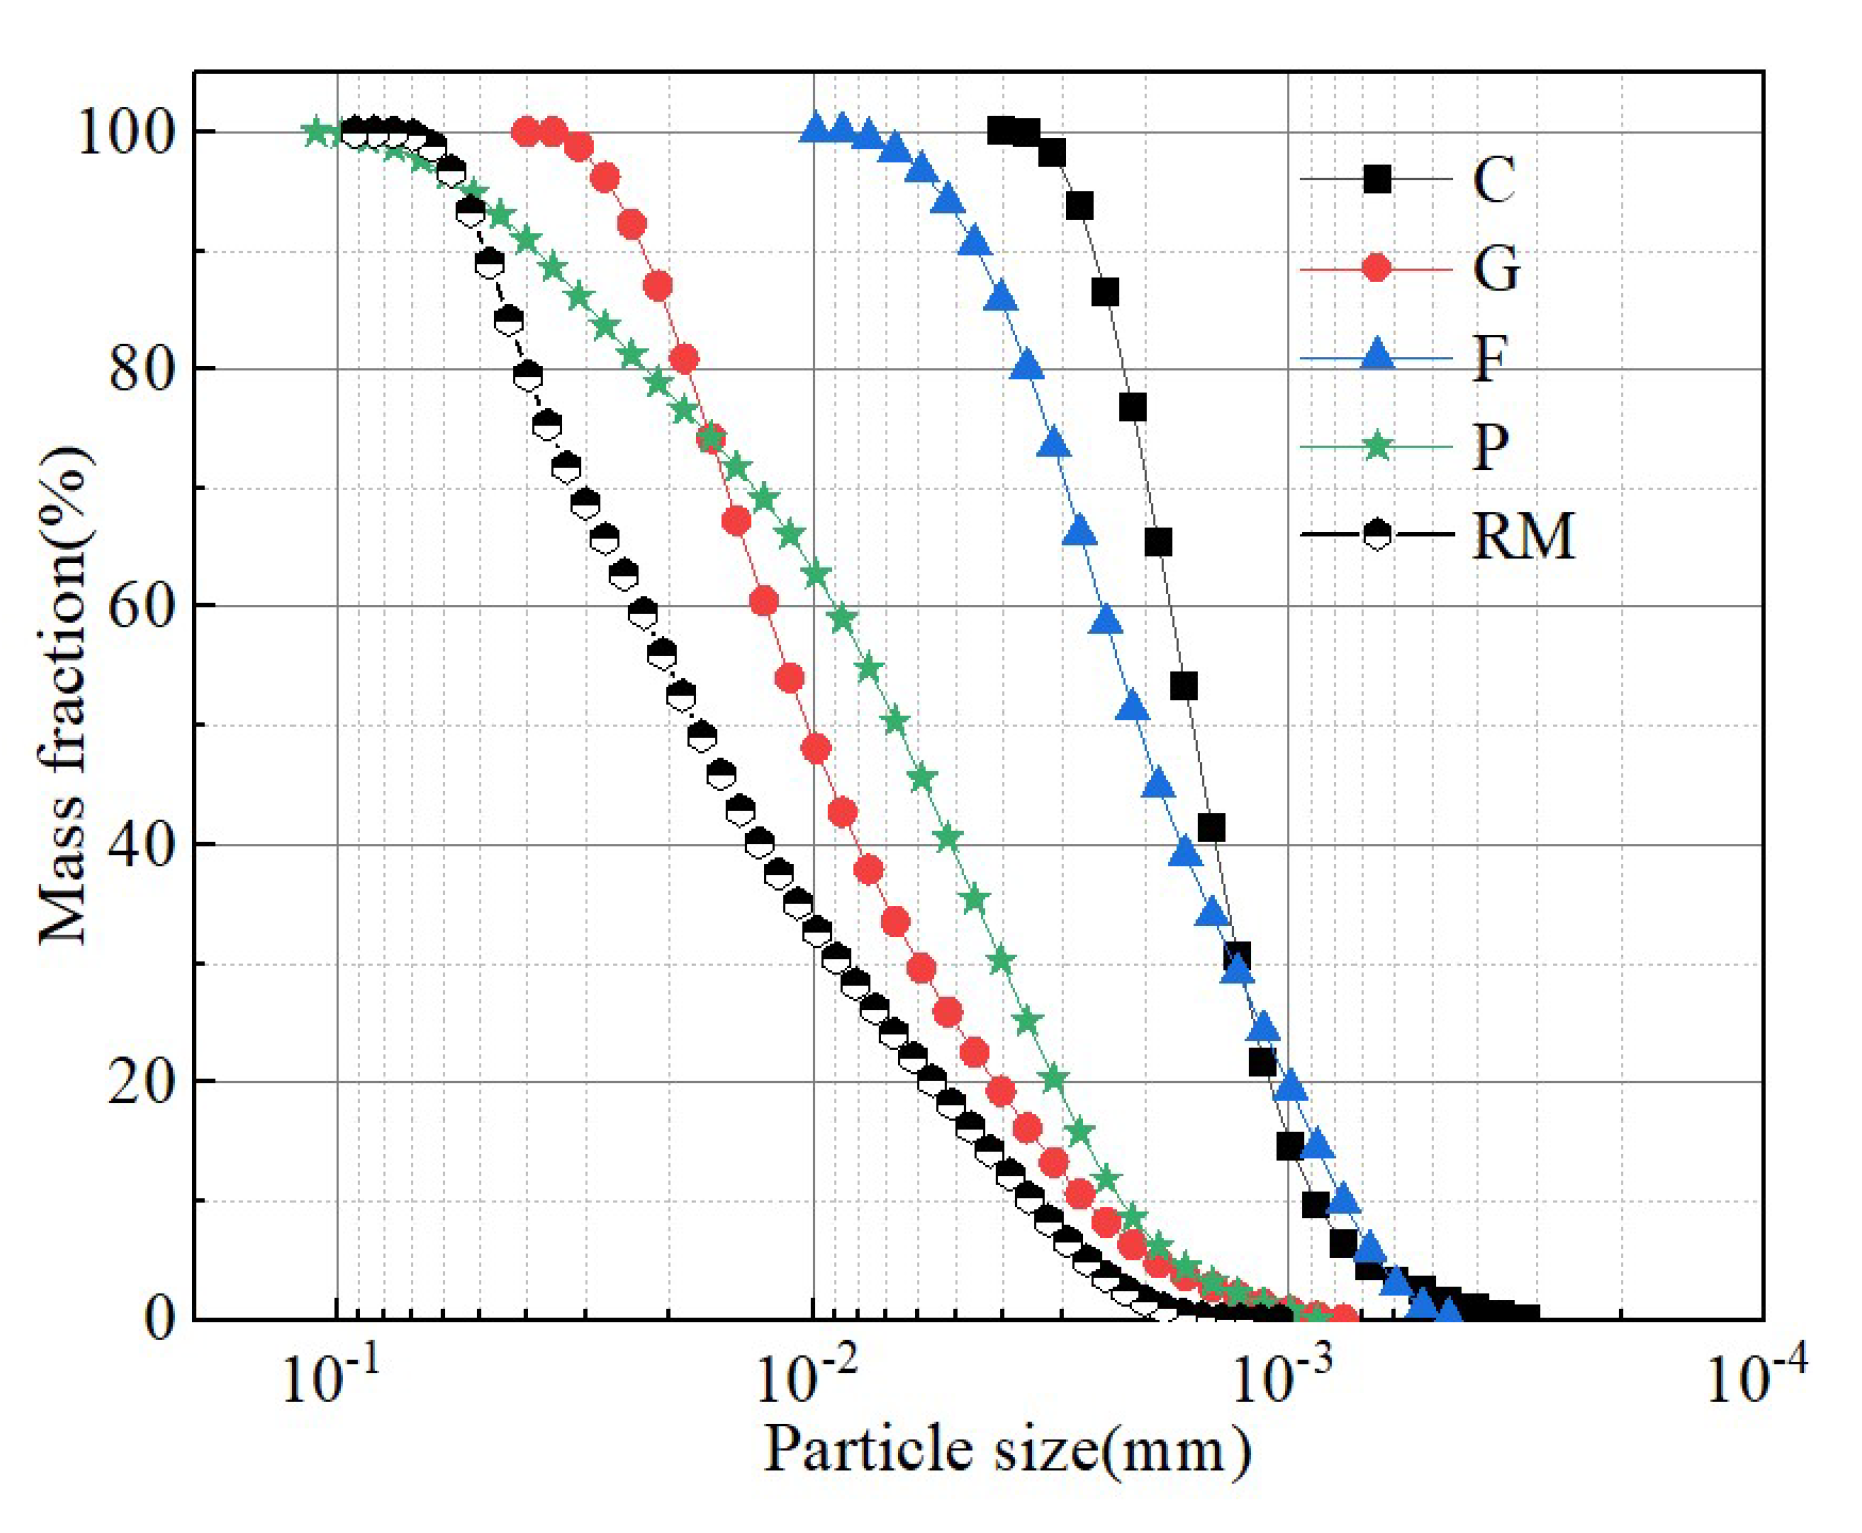
2.1. Test Materials
1.2. Test Program

| Test soil | Type of binder | Mixing ratio of binder (%)a | Total water content ratio | Curing age (d) | Number of cycles | Test content | Curing environment |
| Red mud | CGFPA | 15 | 1.0 | 28 | 0、2、4、6、8、10 | Unconfined compressive strength Acidity and alkalinity Toxicity leaching XRD、SEM-EDS FT-IRb |
Freeze-thaw cycle |
| 20 | 1.2 | ||||||
| 25 | 1.3 | ||||||
| 30 | 1.4 |
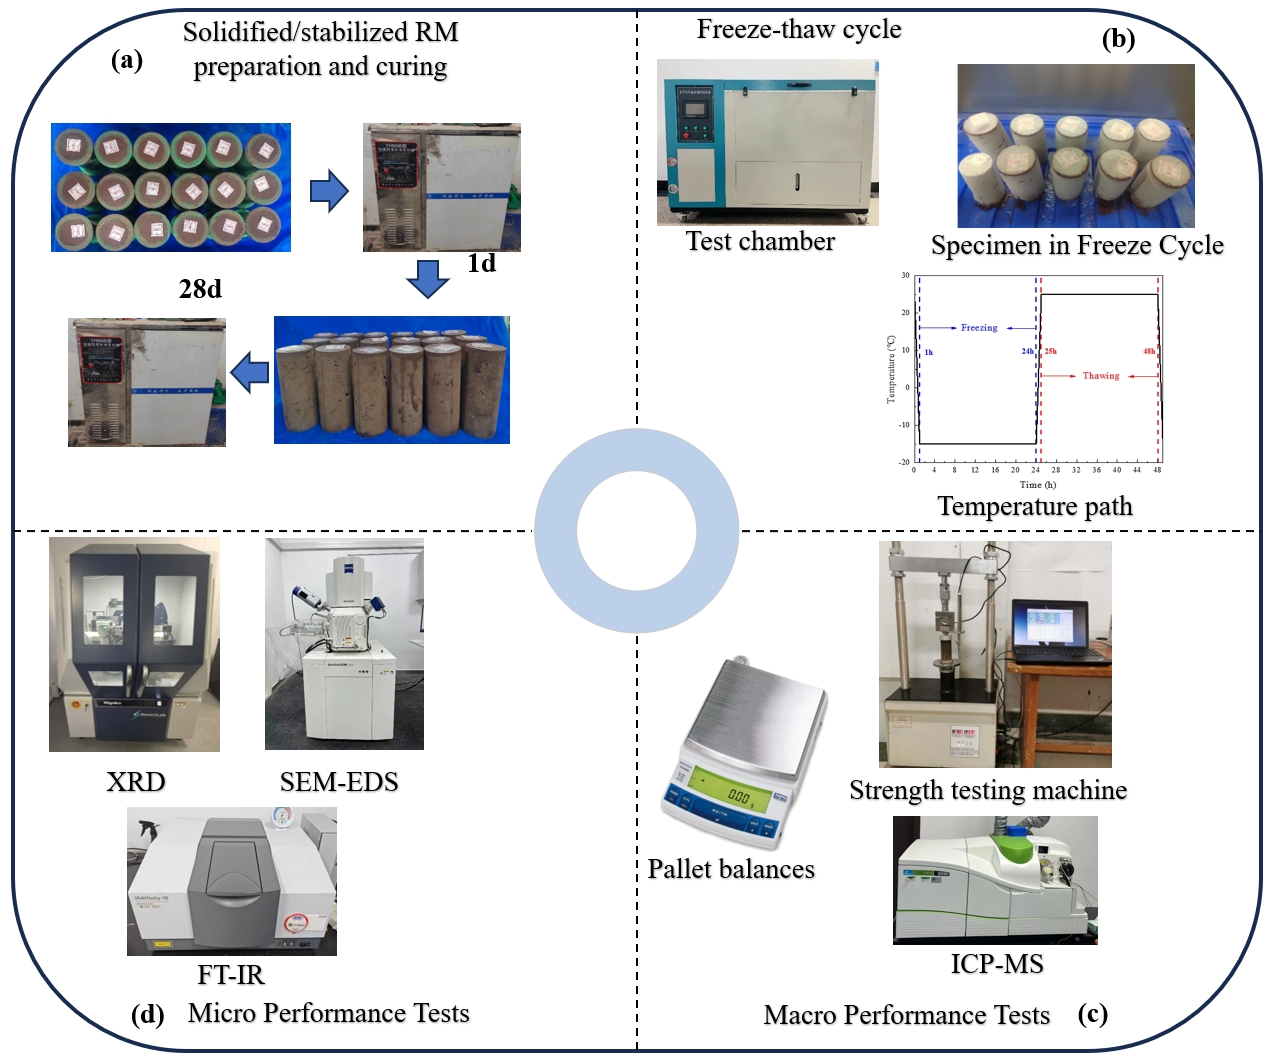
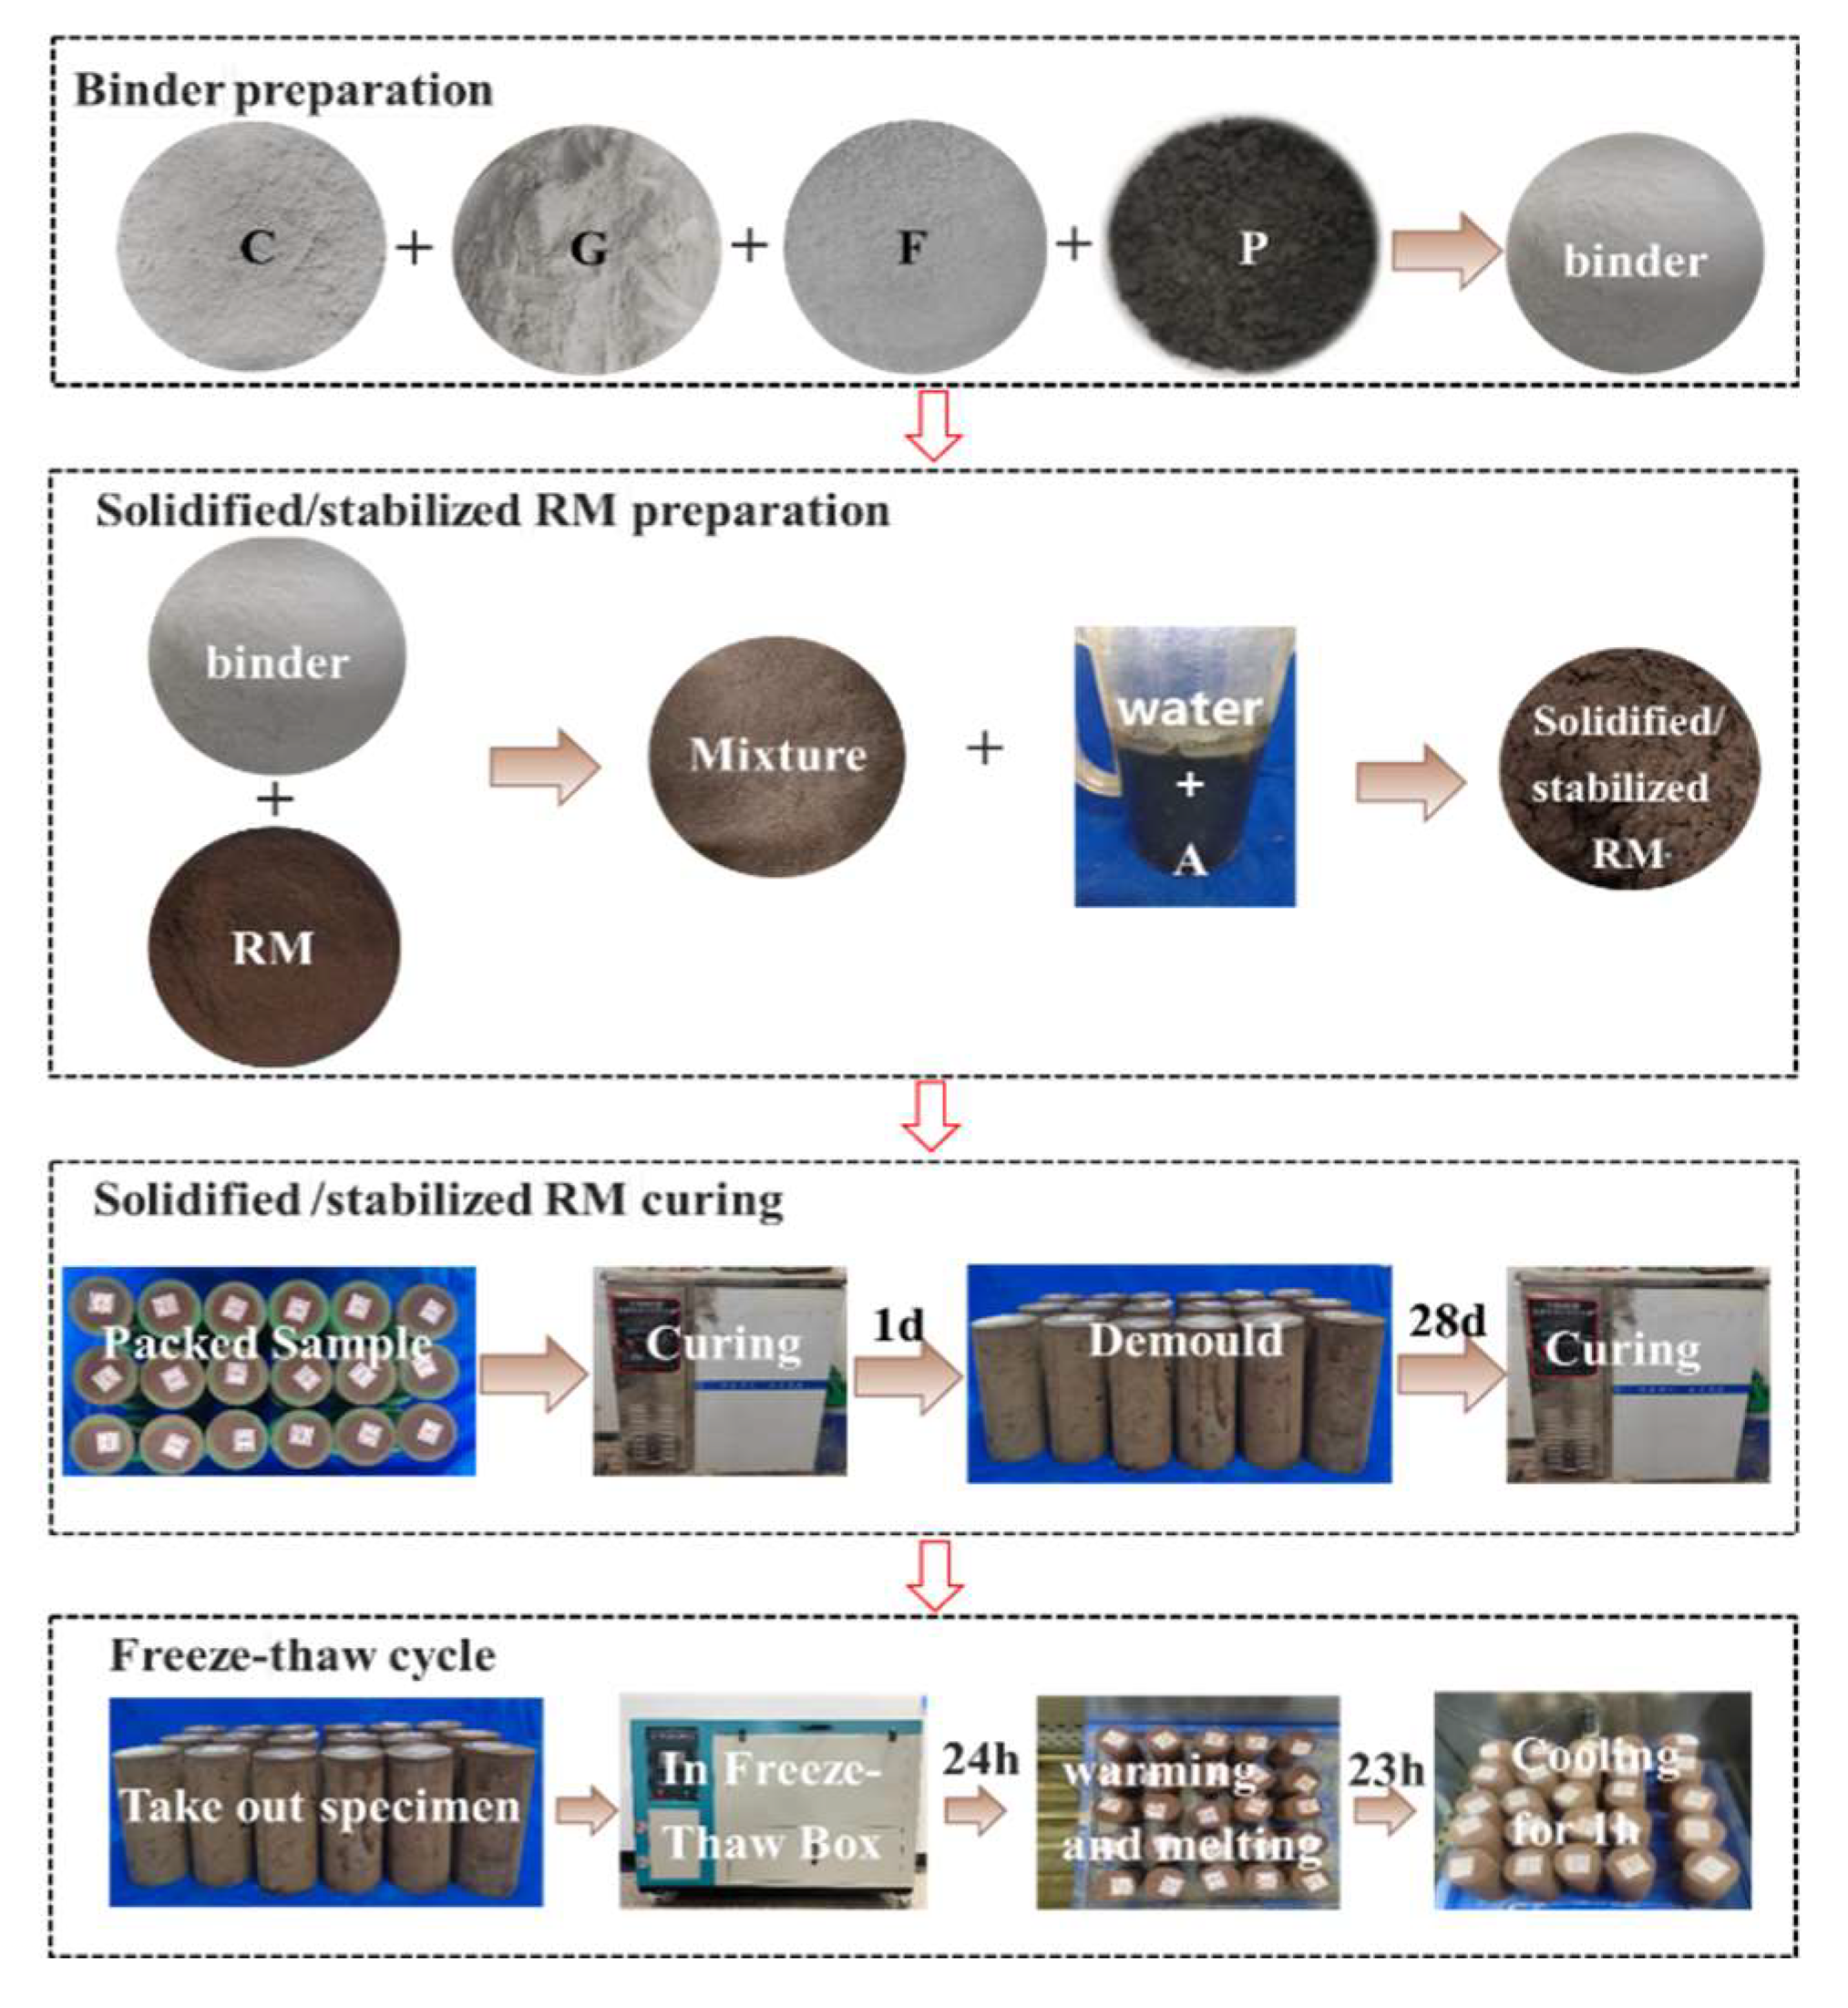
1.3. Test Process
1.4. Test Methods
3. Results and Discussion
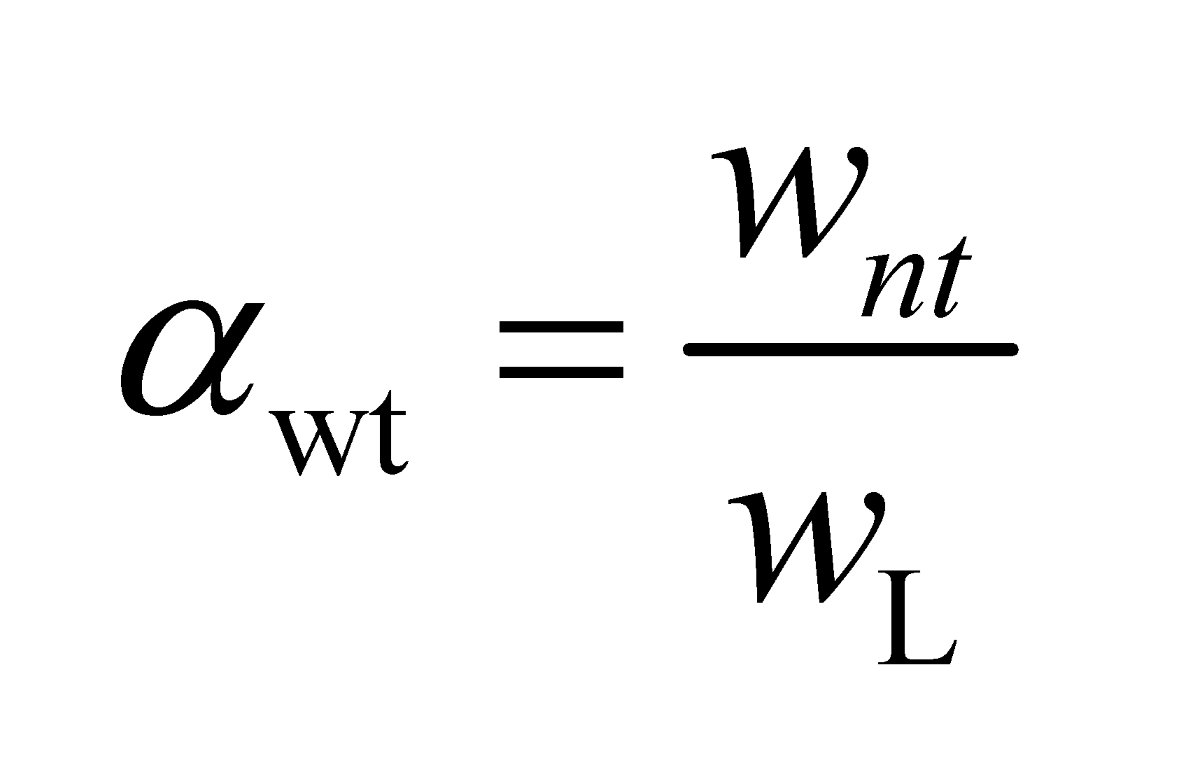
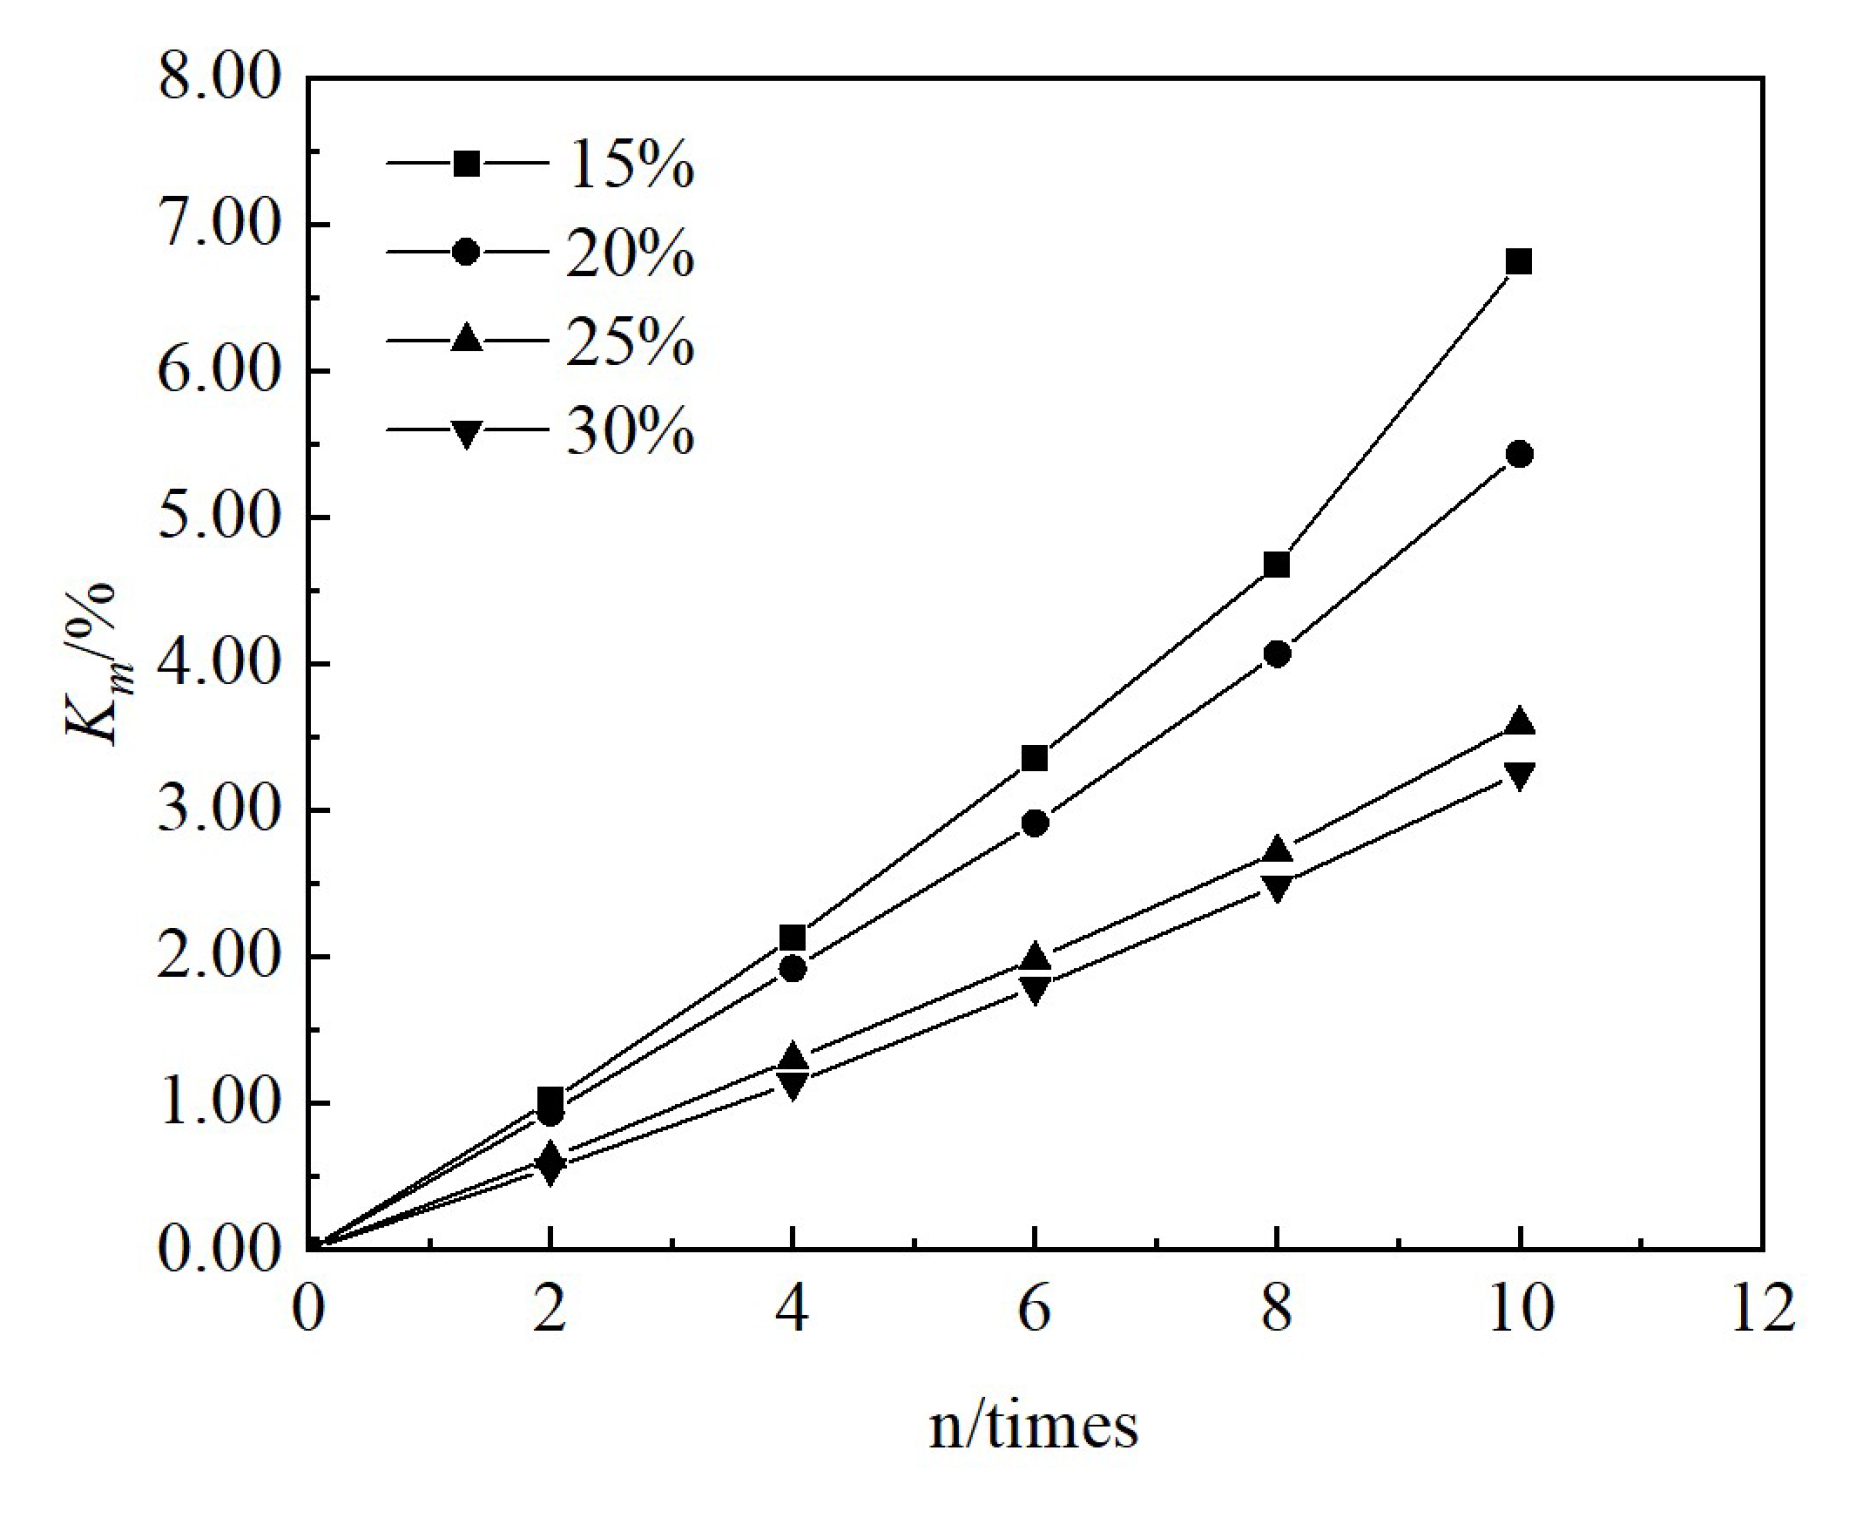
3.1. Changes in Physical Indicators
3.2. Changes in Mechanical Indicators
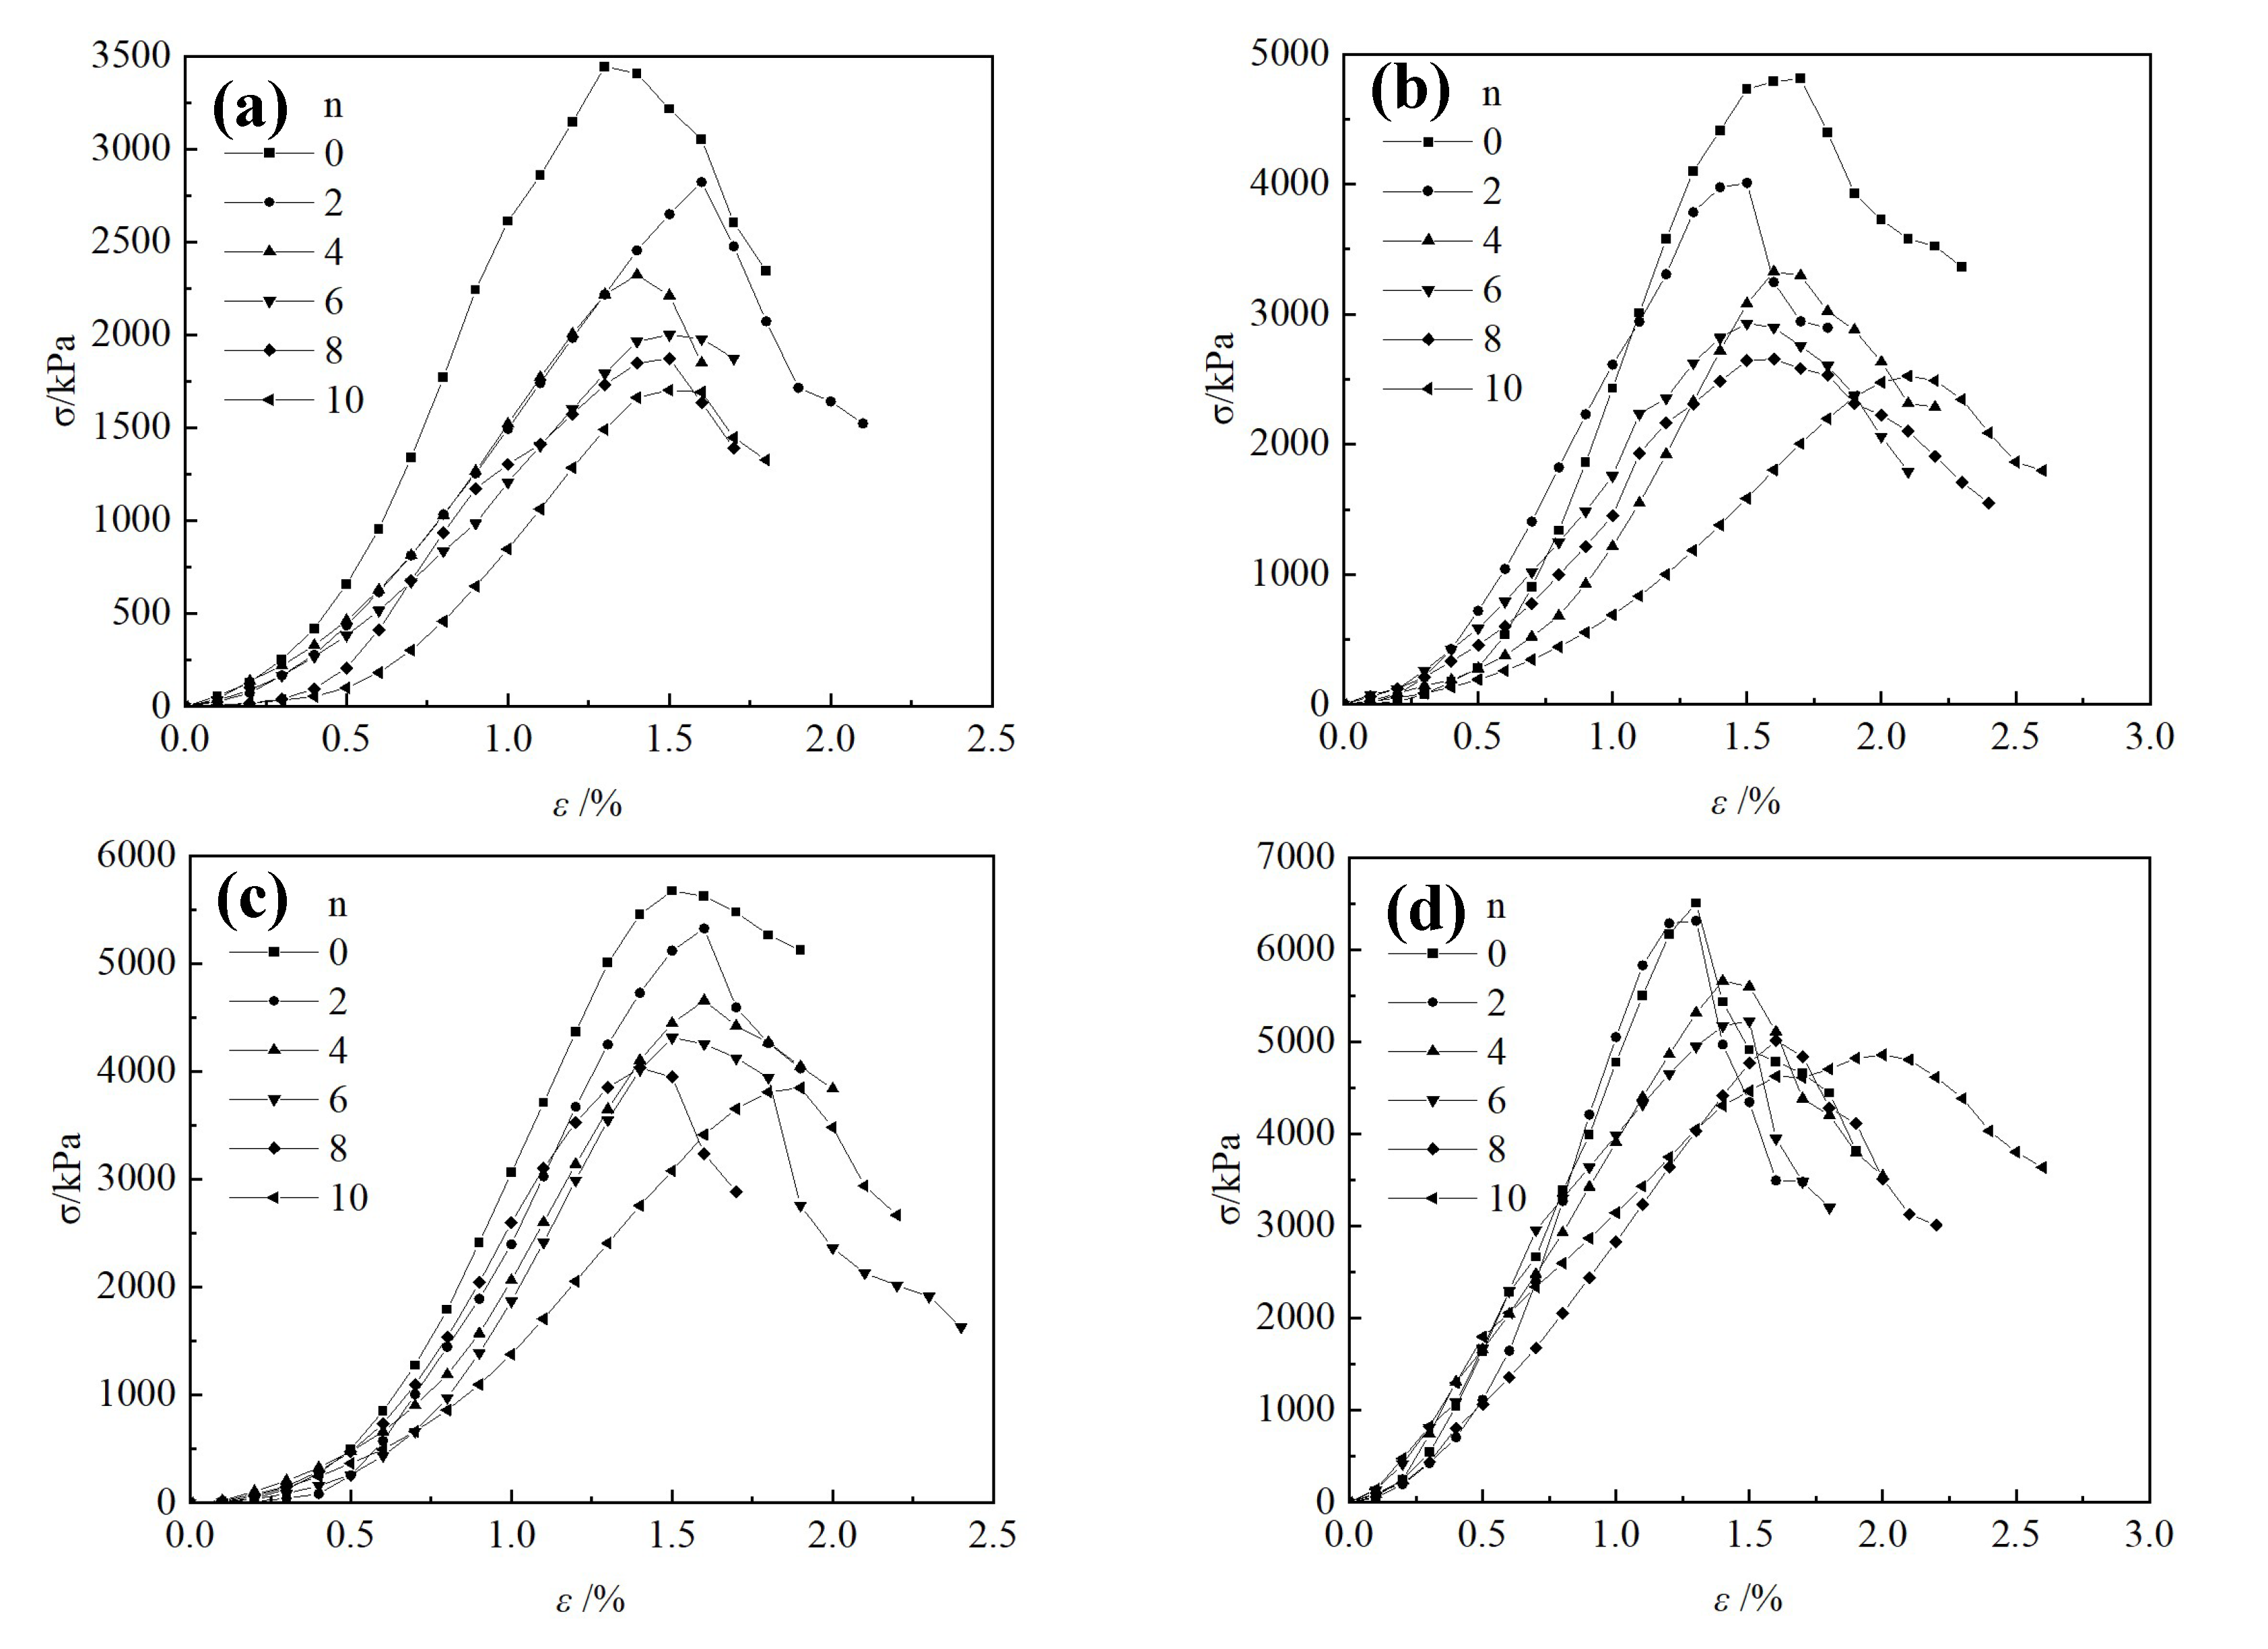
3.2.1. Stress-Strain Curve
3.2.2. Unconfined Compressive Strength Test
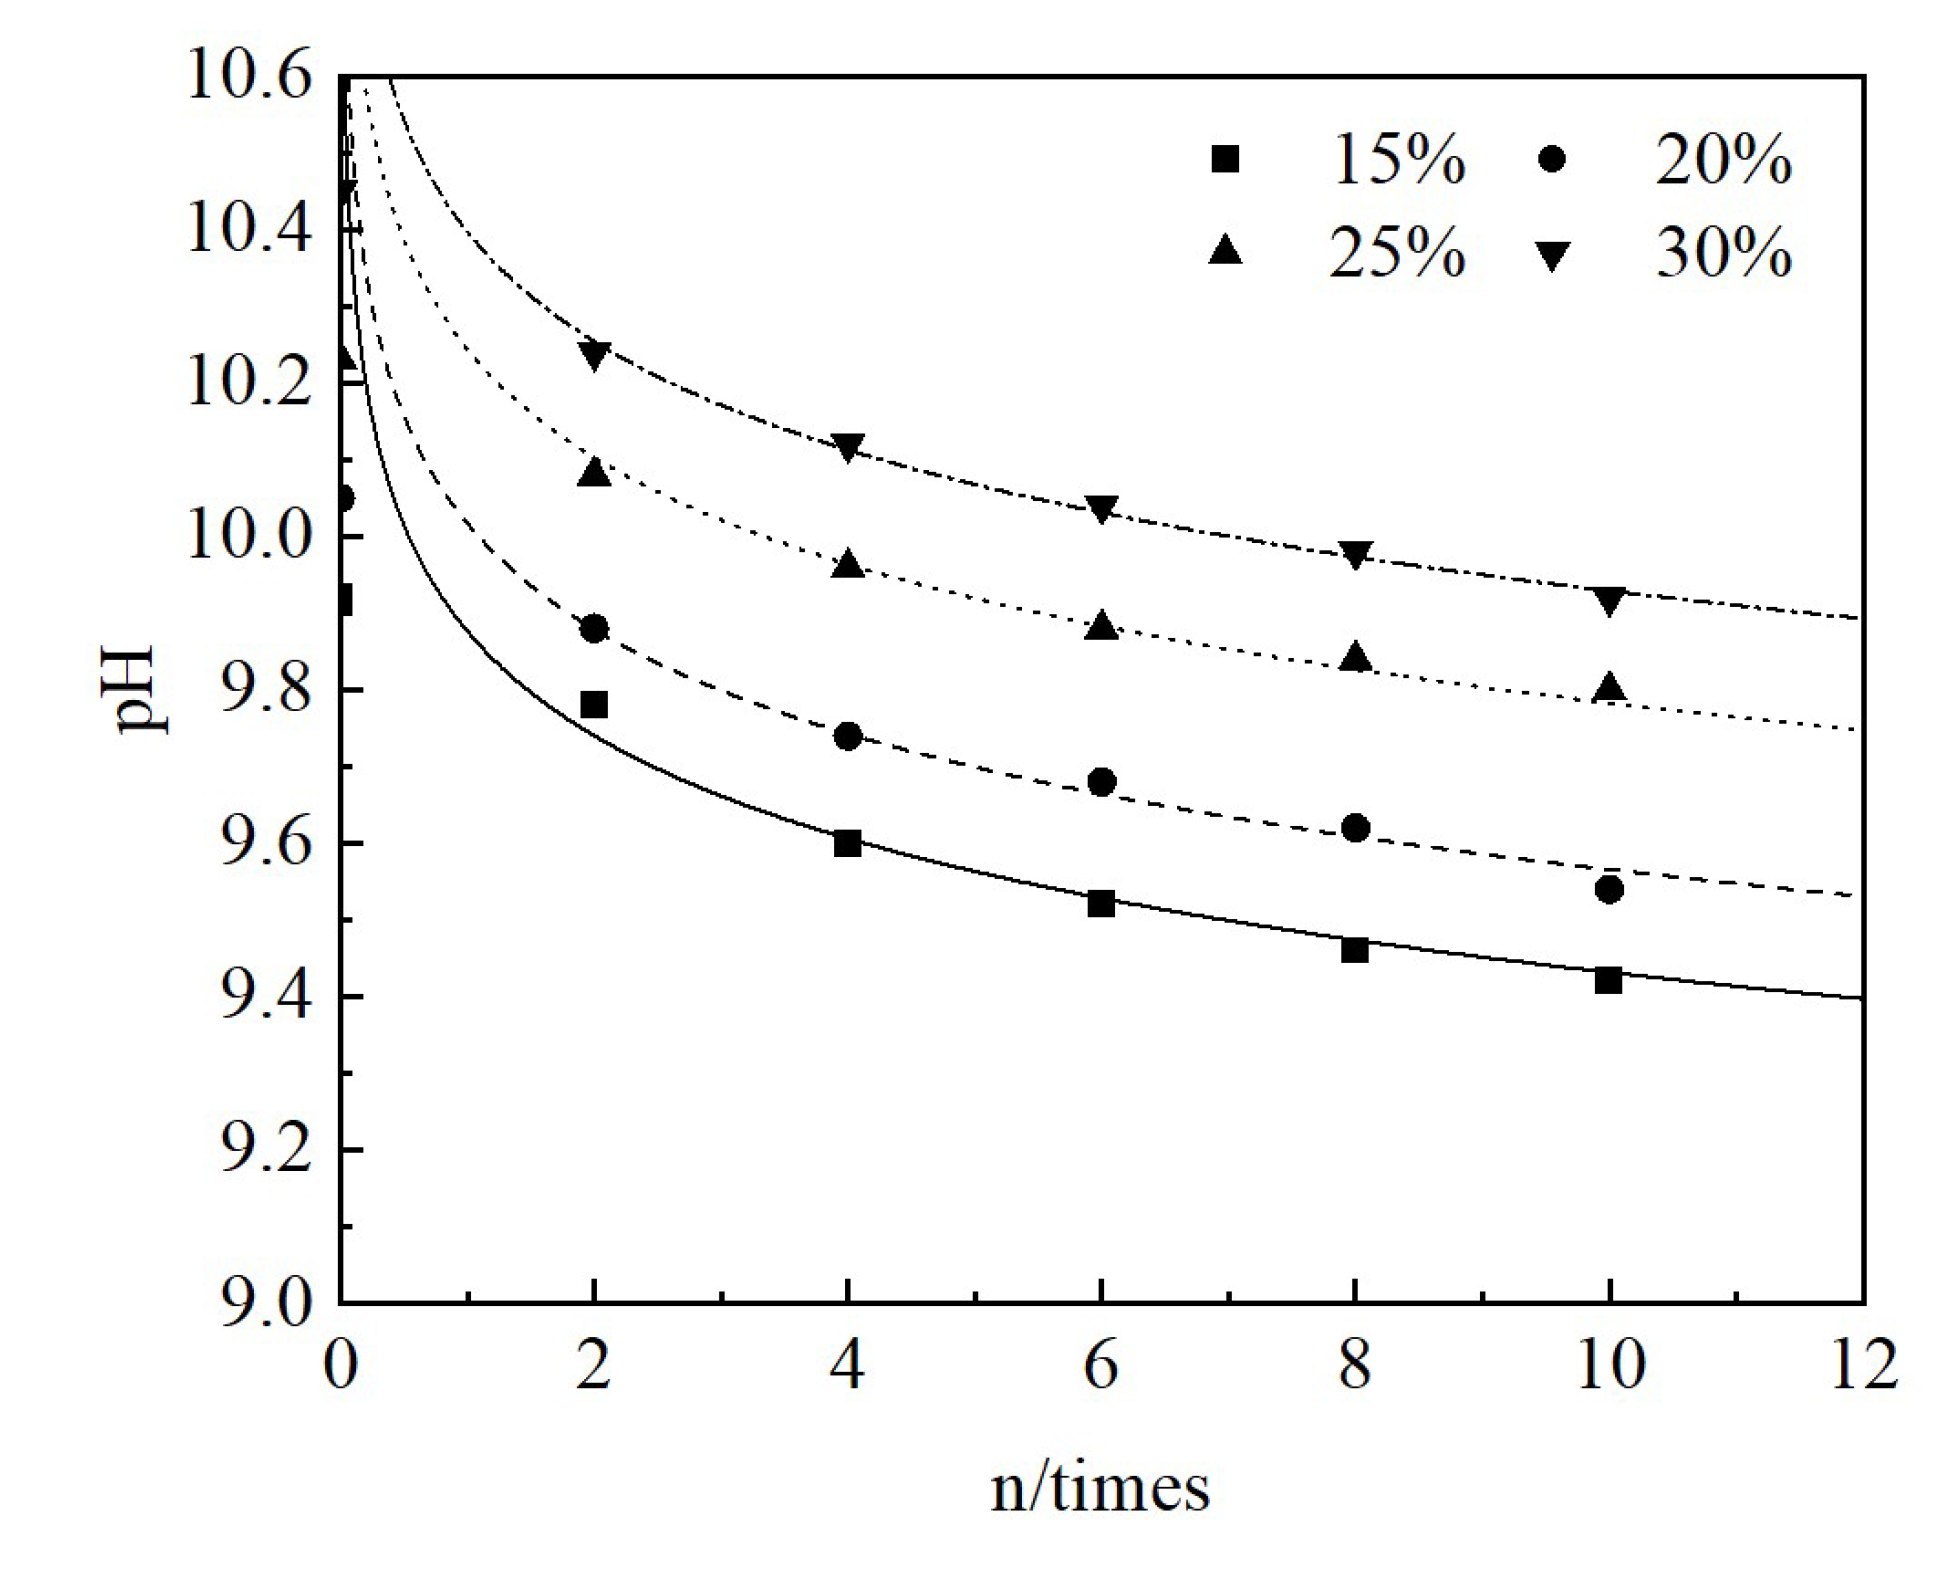
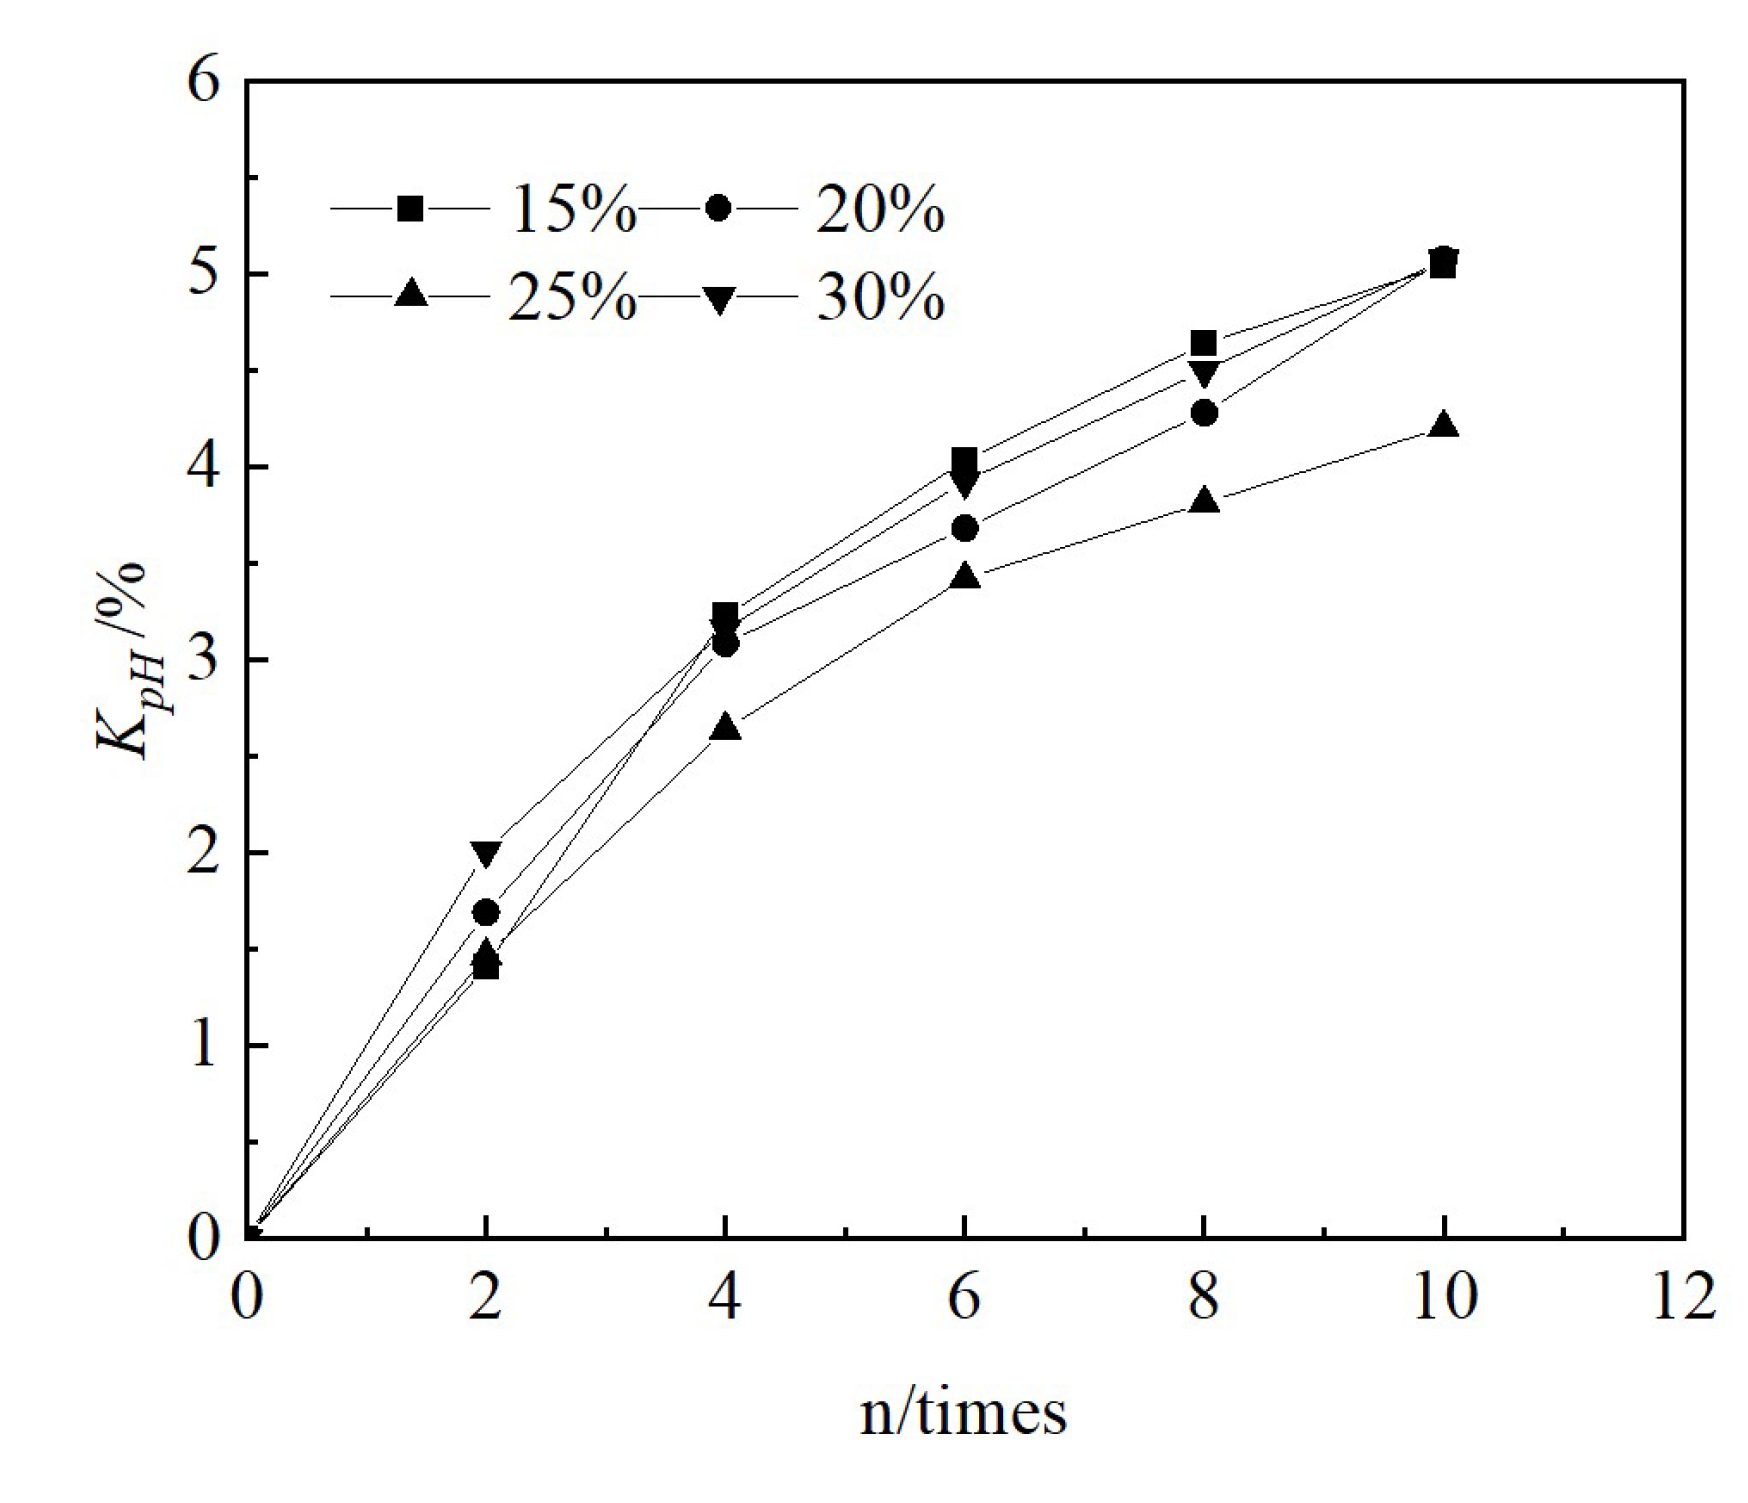
3.3. Changes in Chemical Indicators
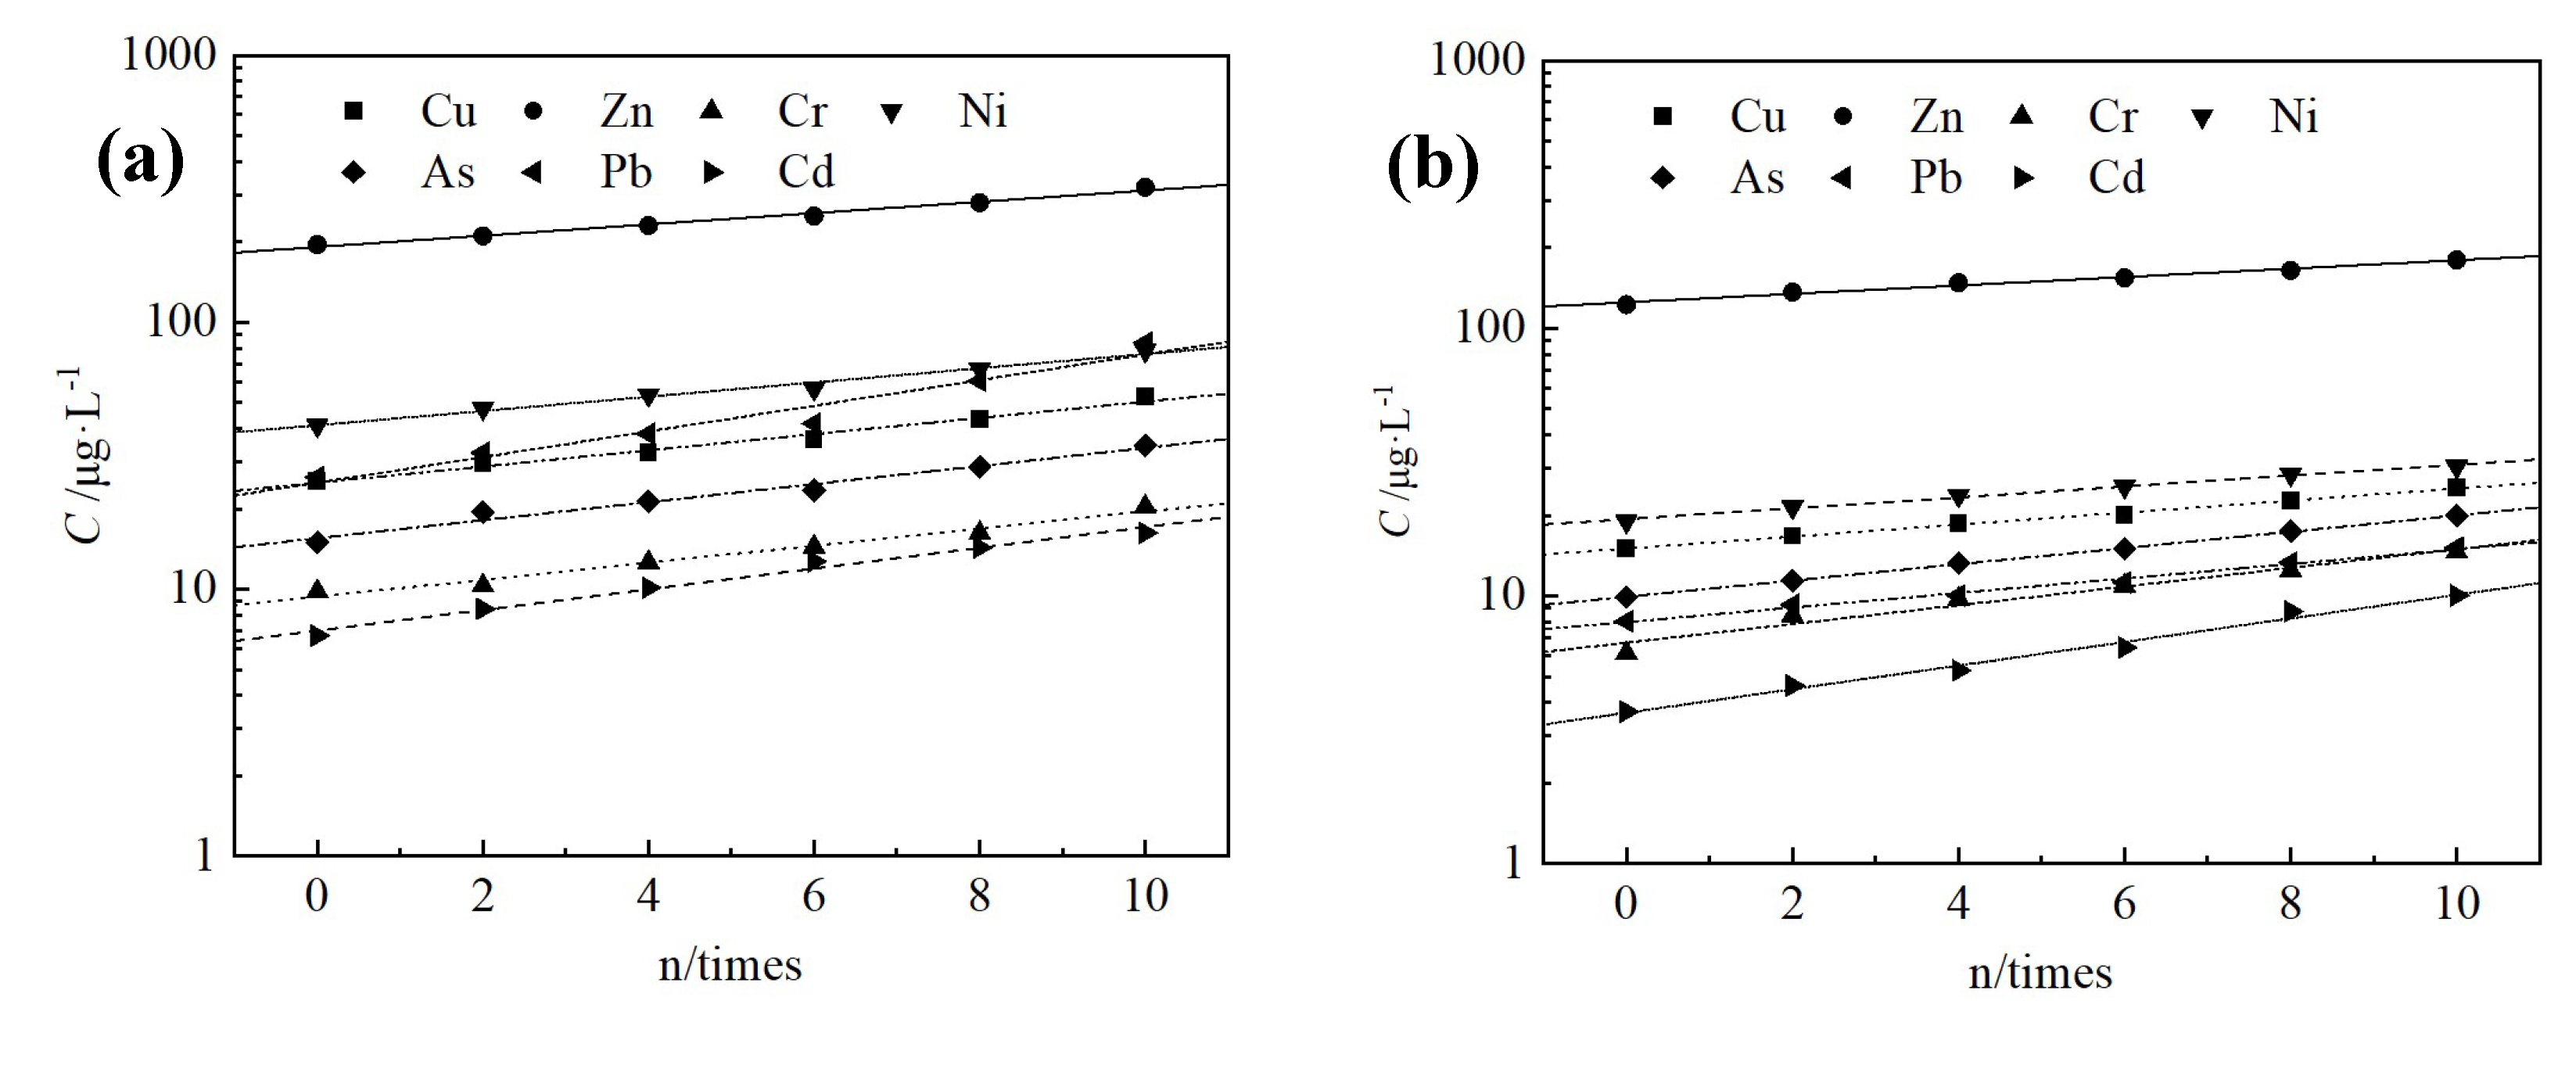
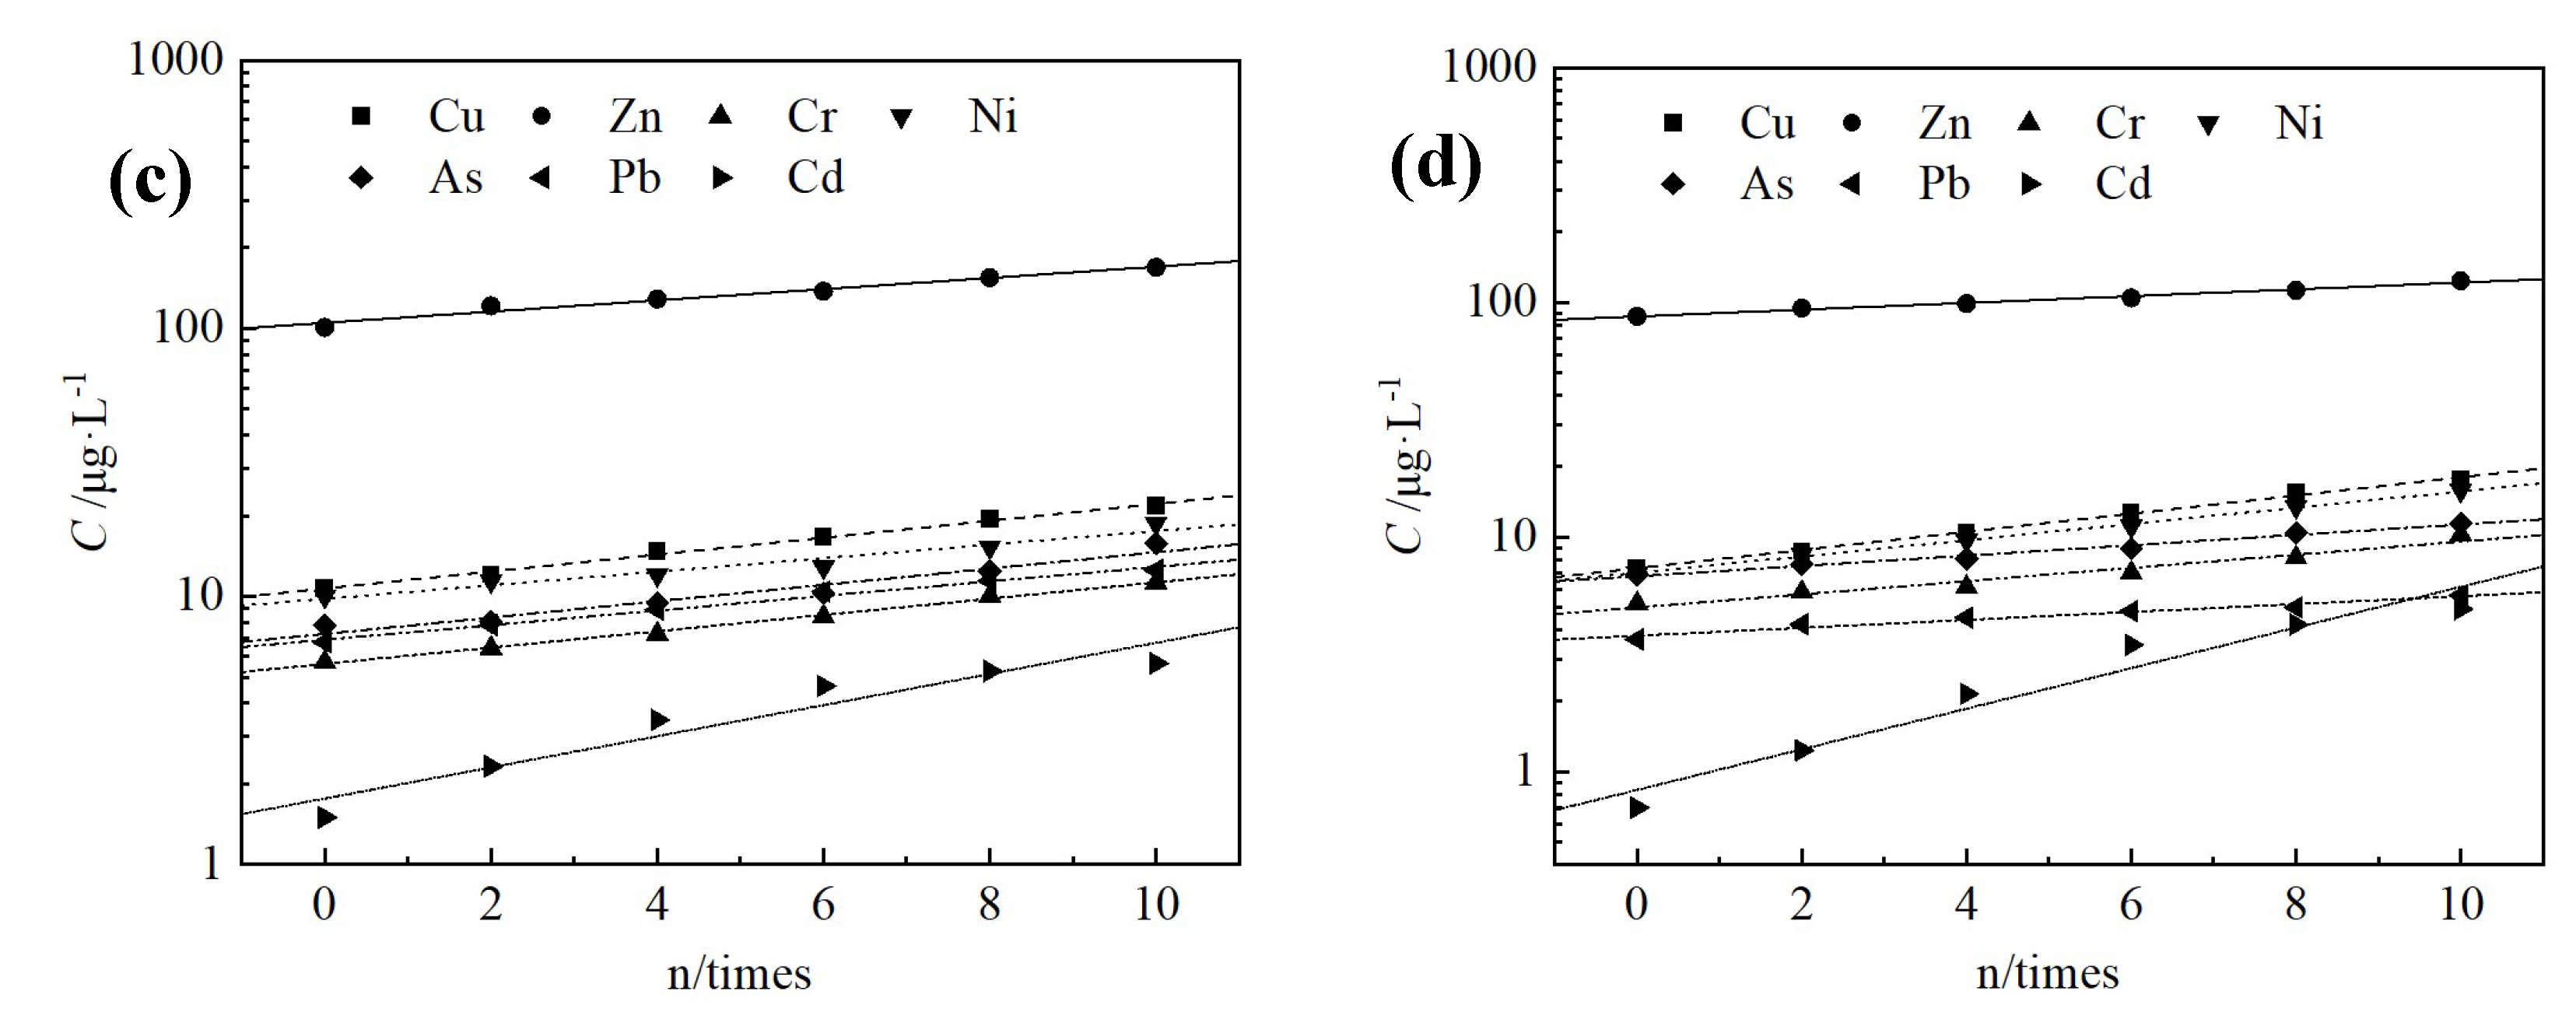
3.4. Changes in Leaching Toxicity
3.5. Microstructure Analysis and Degradation Mechanism
3.5.1. XRD Results and Analysis
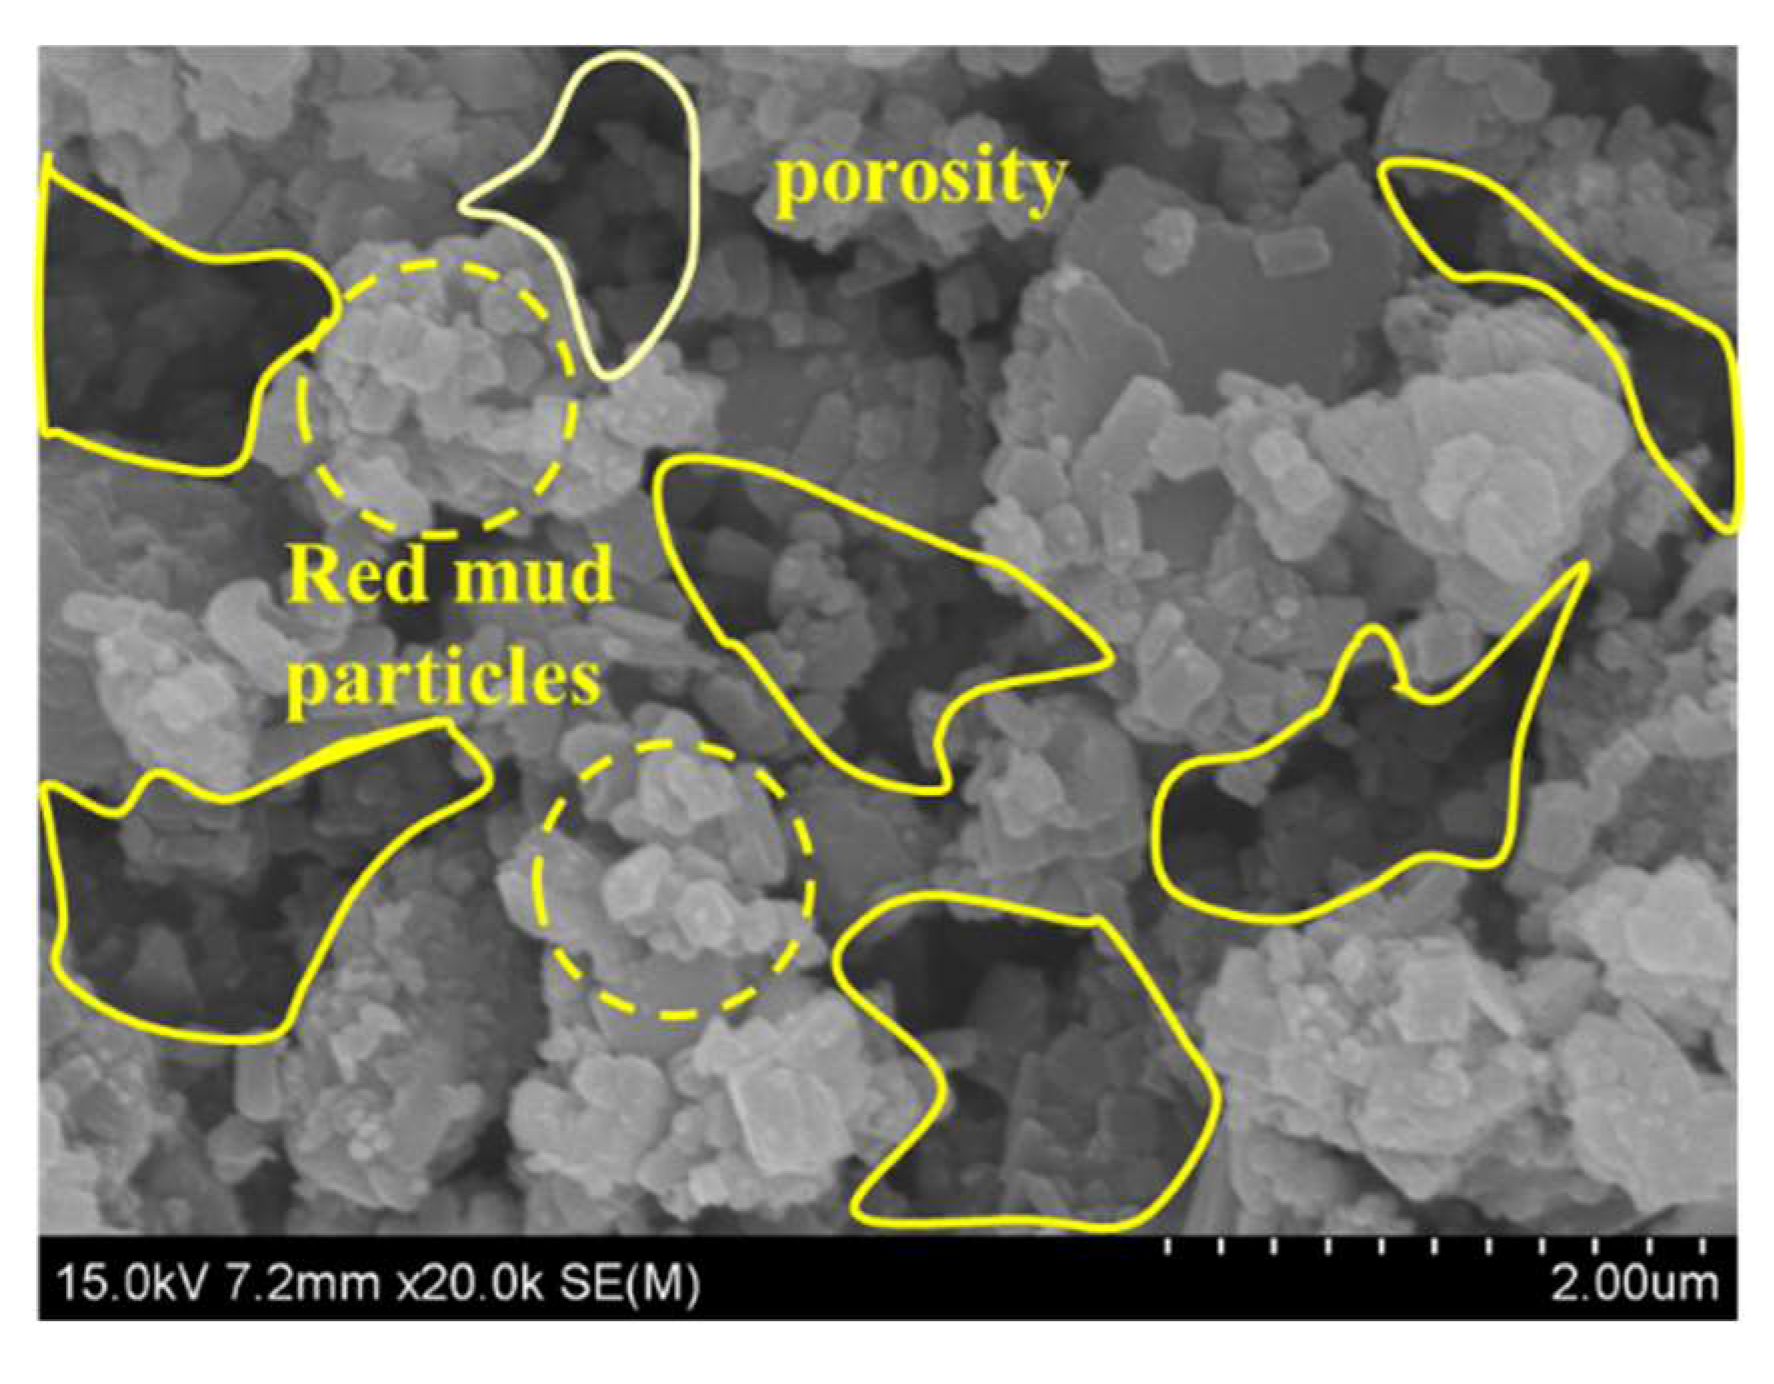
3.5.2. SEM-EDS Results and Analysis
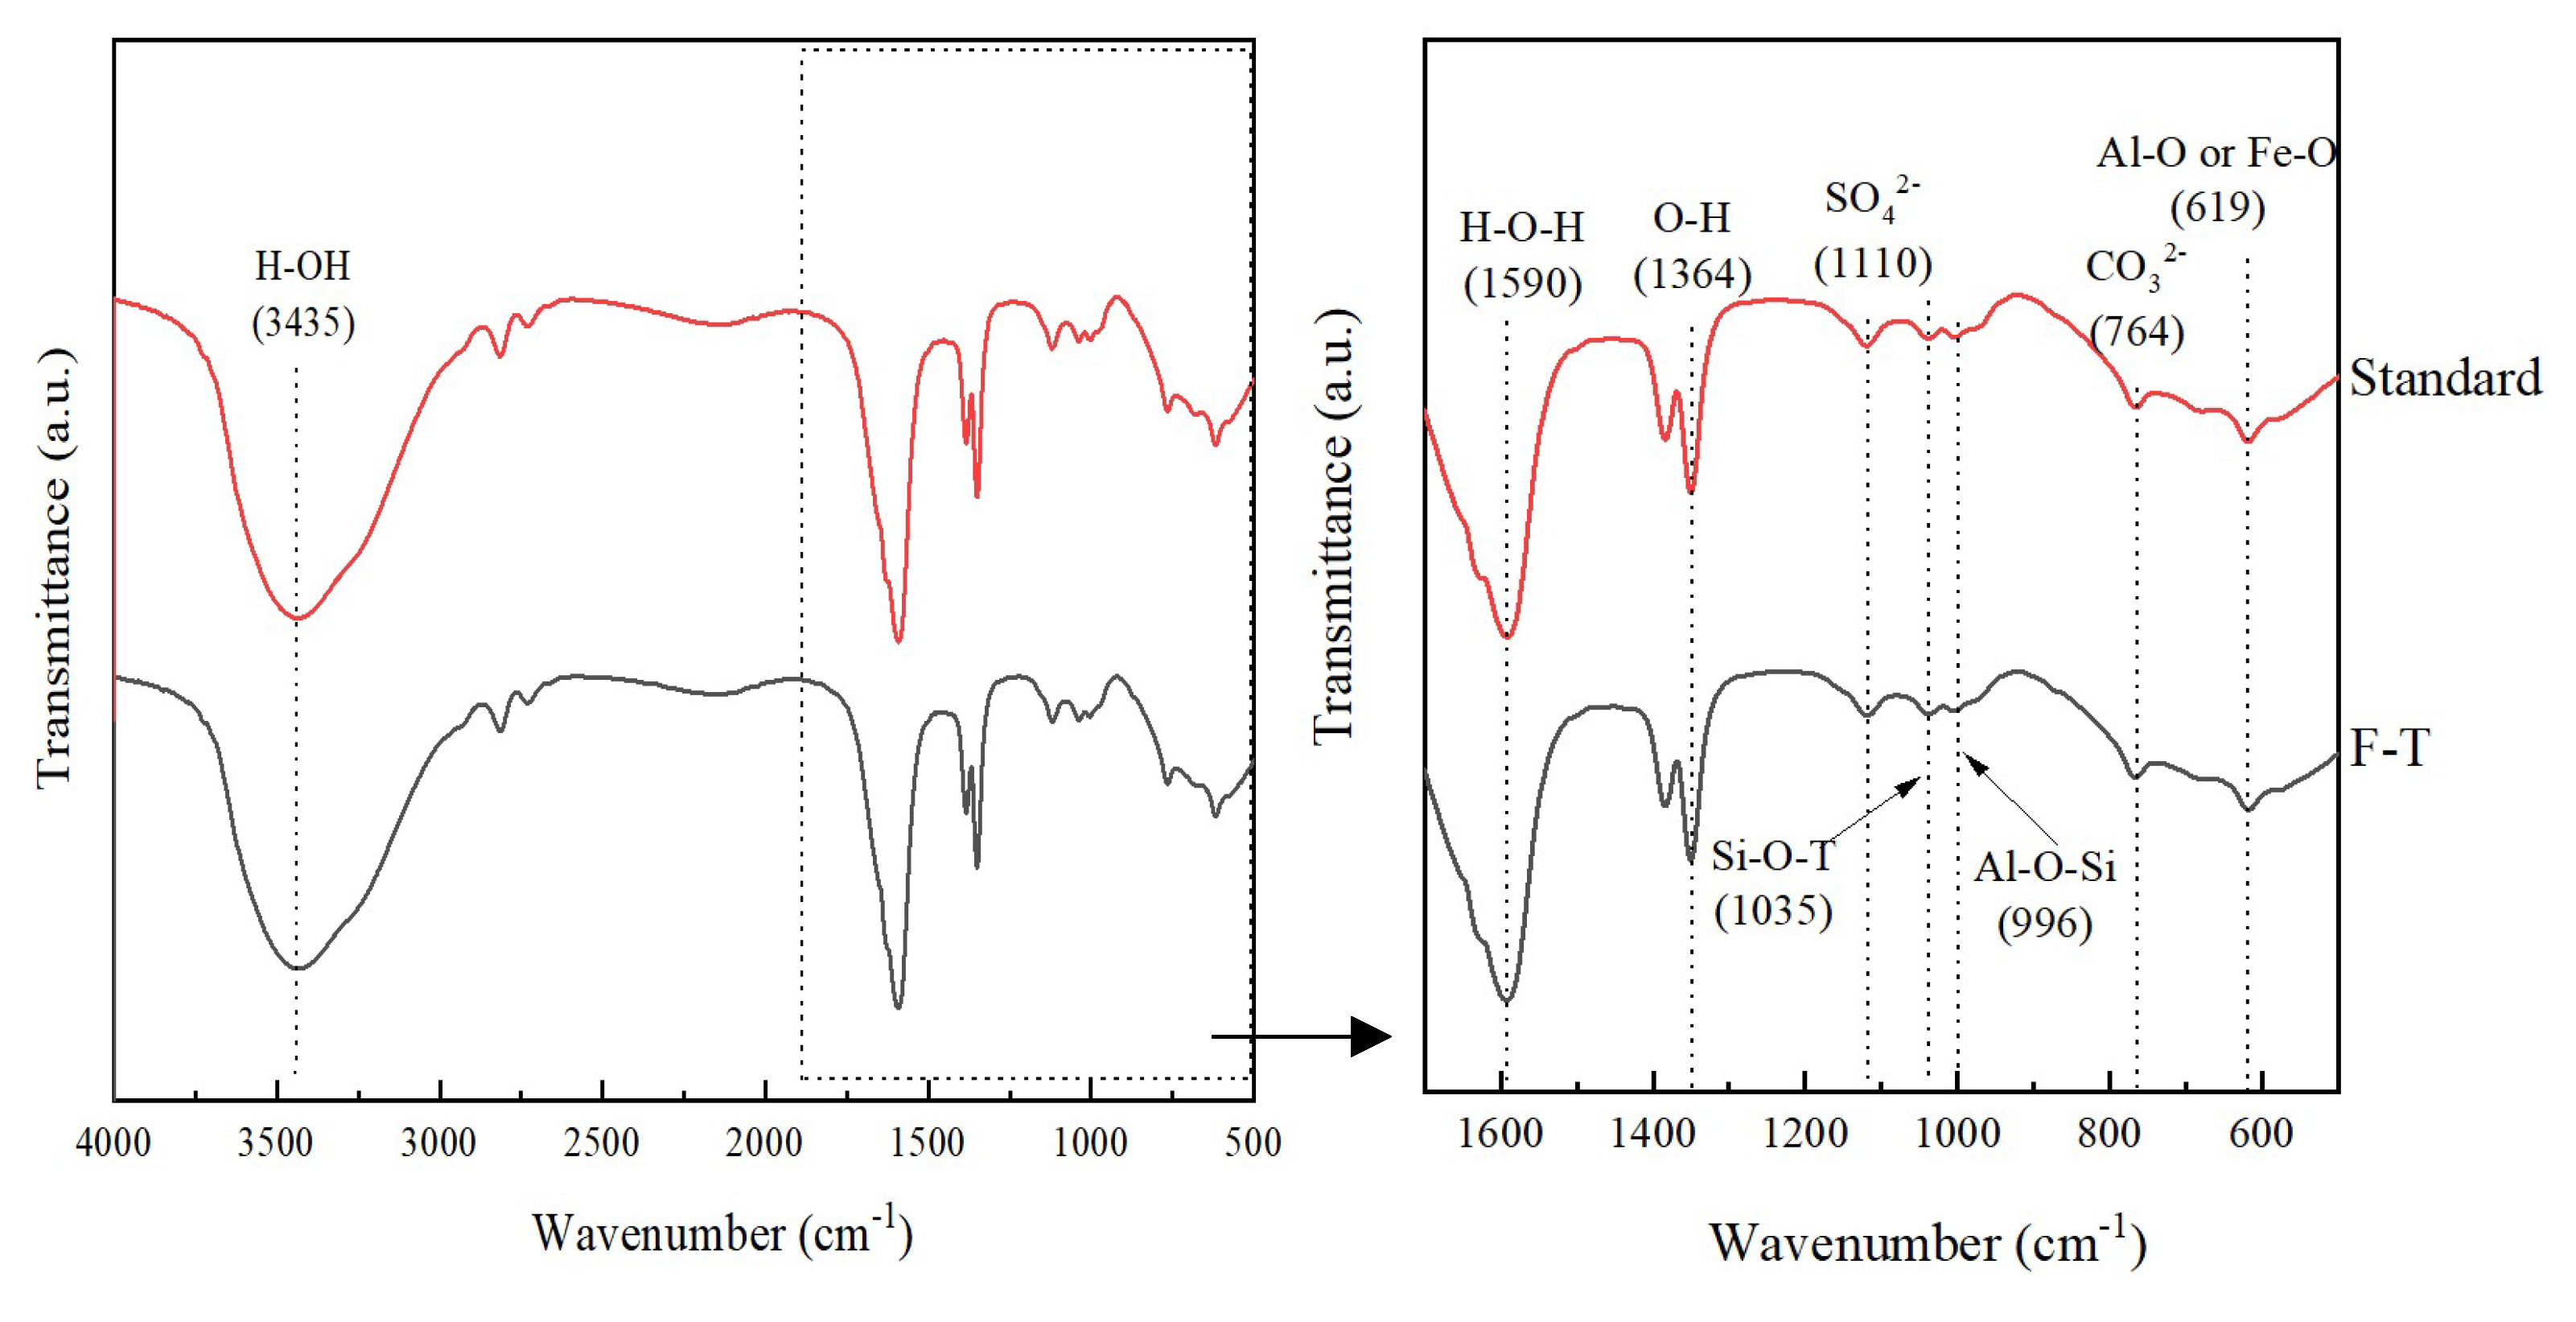
3.5.3. FT-IR Results and Analysis
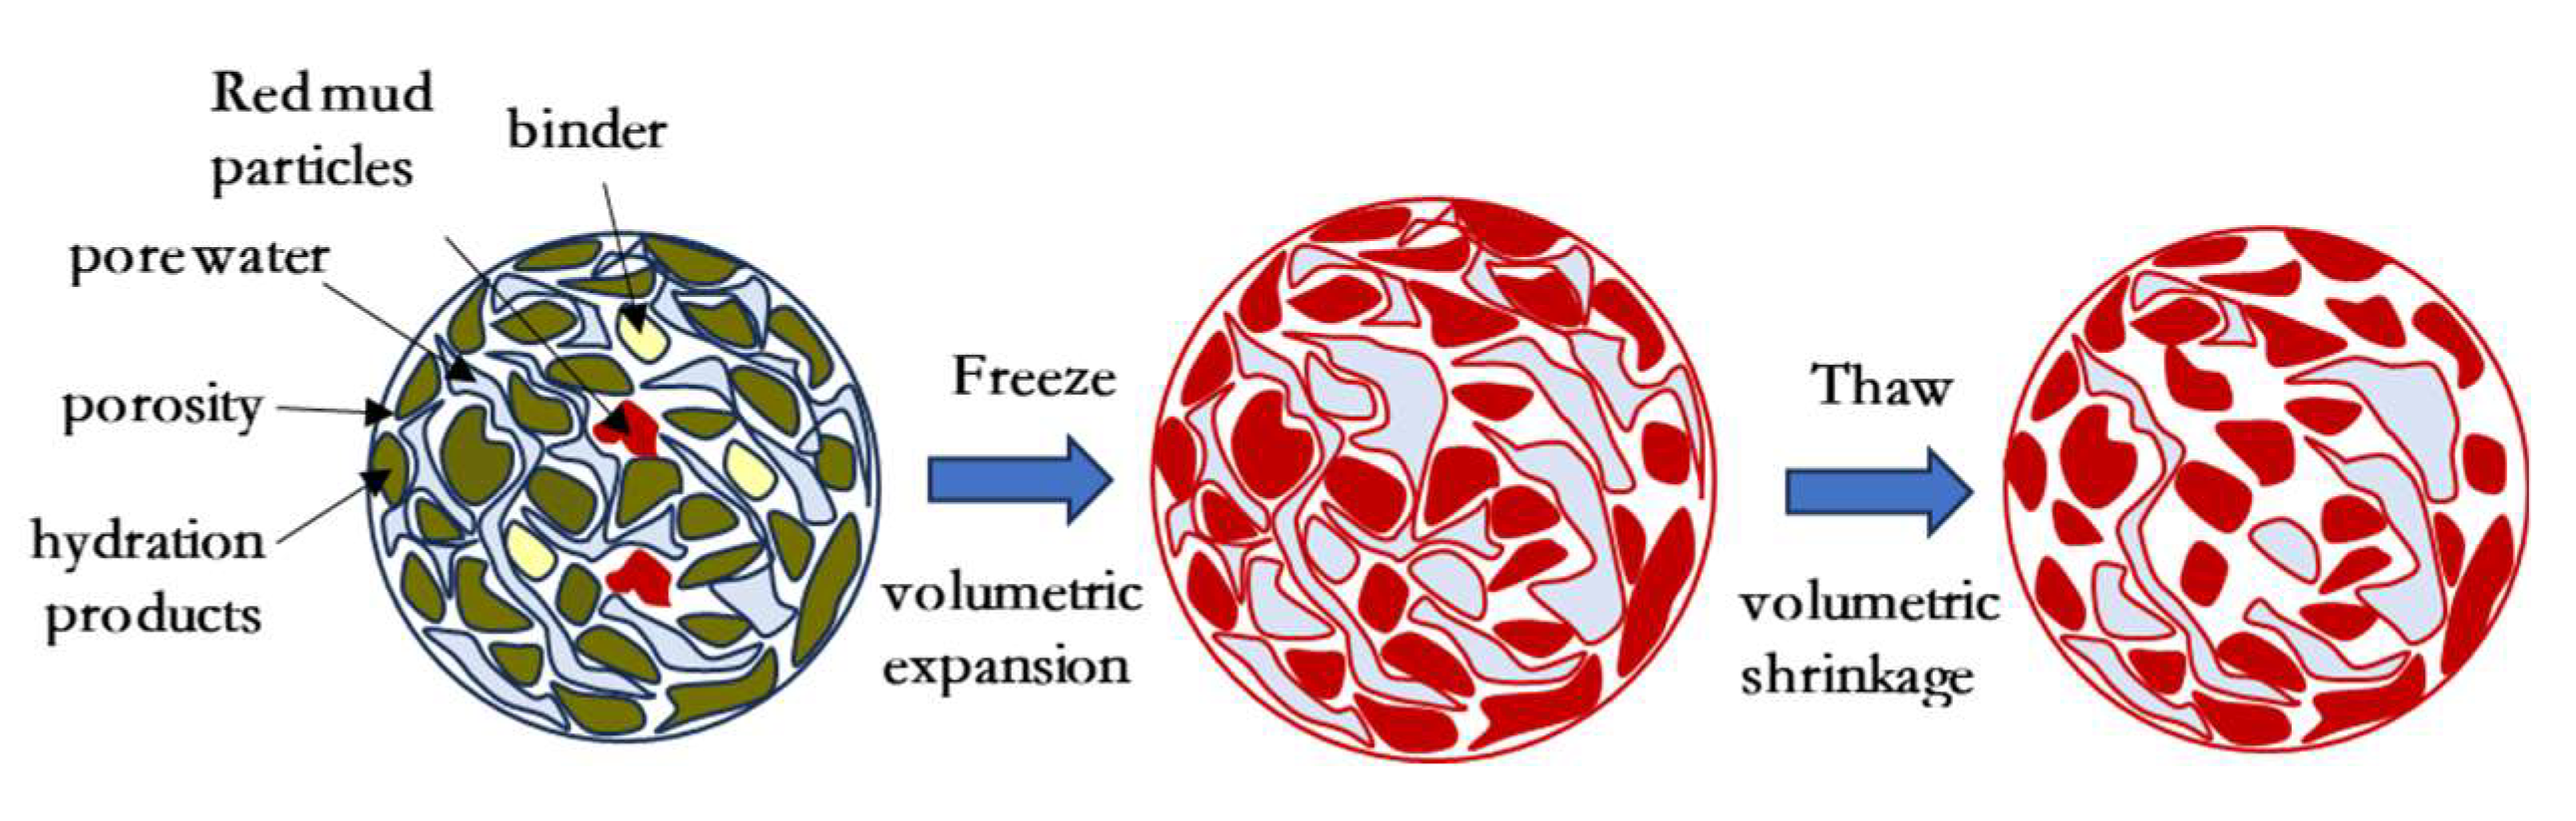
3.5.4. Structural Modeling of Solidified/Stabilized Red Mud
4. Conclusions
Author Contributions
Funding
Data Availability Statement
Acknowledgments
Conflicts of Interest
References
- Ministry of Housing and Urban-Rural Development of the People’s Republic of China. Code for design of dry red mud stack, GB50986-2014. Beijing: China Construction Industry Press, 2014. (in Chinese).
- J. Wang, X. M. Liu, Z. Q. Zhang, Y. Liu. Synergistic utilization, critical mechanisms, and environmental suitability of bauxite residue (red mud) based multi-solid wastes cementitious materials and special concrete, J. Environ. Manag. 2024, 361, 121255. [CrossRef]
- S. Rai, K. L. Wasewar, J. Mukhopadhyay, C. K. Yoo, H. Hslu. Neutralization and utilization of red mud for its better waste management. Arch. Environ. Sci., 2012, 6, 13-33.
- J. He, Y. X. Jie, J. H. Zhang, Y. Z. Yu, G. P. Zhang. Synthesis and characterization of red mud and rice husk ash-based geopolymer composites. Cem. Concr. Compos. 2013, 37, 108-118. [CrossRef]
- D. Tuazon, G. D. Corder. Life cycle assessment of seawater neutralised red mud for treatment of acid mine drainage. Resour. Conserv. Recy., 2008, 52, 1307-1314. [CrossRef]
- C. S. Wu, D. Y. Liu. Mineral phase and physical properties of red mud calcined at different temperatures, J. Nanomater., 2012, 1, 628592. [CrossRef]
- E. Mukiza, L. L. Zhang, X. M. Liu, N. Zhang. Utilization of red mud in road base and subgrade materials: A review. Resour. Conserv. Recy., 2019, 141, 187-199. [CrossRef]
- R. M. Novais, J. Carvalheiras, M. P. Seabra, R. C. Pullar, J. A. Labrincha. Innovative application for bauxite residue: Red mud-based inorganic polymer spheres as pH regulators. J. Hazard. Mater., 2018, 358, 69-81. [CrossRef]
- Kumar, S. Kumar. Development of paving blocks from synergistic use of red mud and fly ash using geopolymerization. Constr. Build. Mater., 2013, 38, 865-871. [CrossRef]
- X. Sun. The research on environmental risk assessment system of the typical staple industrial solid wastes, Kunming University of Science and Technology, Kunming. 2016. (in Chinese).
- Y. Zhou, Z. F. Li. Composition design and engineering practice of red mud-based polymer cementitious materials. Beijing: Science Press, 2023. (in Chinese).
- X. Y. Li, Z. P. Yang, S. Yang, K. S. Zhang, J. Z. Chang. Synthesis process-based mechanical property optimization of alkali-activated materials from red mud: A review. J. Environ. Manage., 2023, 344, 118616. [CrossRef]
- X. L. Fu, Y. J. Du, X. Y. You, Y. L Yang, Z. Y. Jiang. Influences of red mud leachates on hydraulic performance of a modified geosynthetic clay liner. Chinese Journal of Geotechnical Engineering, 2021, 43, 706-714. (in Chinese). [CrossRef]
- E. Balomenos, I. Gianopoulou, D. Panias, I. Paspaliaris, K. Perry, D. Boufounos. Efficient and complete exploitation of the bauxite residue (red mud) produced in the Bayer process. Proceedings of EMC., 2011, 3, 745-758.
- K. Deelwal, K. Dharavath, M. Kulshreshtha. Evaluation of characteristic properties of red mud for possible use as a geotechnical material in civil construction. Int. J. Adv. Eng. Techno., 2014, 7, 1053.
- Y. M. Hua, K. V. Heal, W Friesl-hanl. The use of red mud as an immobilizer for metal/metalloid-contaminated soil: A review. J. Hazard. Mater., 2017, 325, 17-30. [CrossRef]
- Shandong Province Market Supervision Administration. Technical regulations for the application of red mud (Bayer Method) roadbed in highway engineering, DB 37/T 3559—2019. Beijing: People’s Transportation Press, 2019. (in Chinese).
- Z. Y. Sun, H. Wu, J. L. Hou. Study on construction and quality evaluation for subgrade filling of red mud in modified Bayer process. Subgrade Engineering. 2018, 03, 69-72. (in Chinese). [CrossRef]
- S. Y. Jin, X. Y. Lou, J. Hu, J. Zhu, H. Chen. Preparation of high-strength permeable bricks with red mud: influencing factors and structure–performance mechanism. Journal of the Chinese Ceramic Society 2024, 52, 3159-3169. (in Chinese). [CrossRef]
- J. Qiao. Study on the preparation of environmentally friendly fire-free bricks from red mud of industrial solid waste. Master’s dissertation, University of Jinan, Jinan. 2022. (in Chinese).
- K. Sarath Chandra, S. Krishnaiah, S. Kobebe. Utilization of red mud-fly ash reinforced with cement in road construction applications. Adv. Mater. Sci. Eng., 2021, 2021, 1-8. [CrossRef]
- Y. T. Xu, B. Yang, X. M. Liu, S. Gao, D. S. Li, E. Mukiza, H. J Li. Investigation of the medium calcium based non-burnt brick made by red mud and fly ash: durability and hydration characteristics. Int. J. Miner. Metal. Mater., 2019, 26, 983-991. [CrossRef]
- Z. K. Wang, Y. M. Wang, L. B. Wu, A.X. Wu, Z. E. Ruan, M. Z. Zhang, R. K. Zhao. Effective reuse of red mud as supplementary material in cemented paste backfill: Durability and environmental impact, Constr. Build. Mater. 2022, 328, 127002. [CrossRef]
- Q. Y. Chen, M. Tyrer, C. D. Hills, X. M. Yang, P. Carey. Immobilization of heavy metal in cement-based solidification/stabilization: A review. Waste Manage., 2009, 29, 390-403. [CrossRef]
- Y. J. Du, N. J. Jiang. Stabilization/solidification of contaminated soils: a case study, Elsevier, Amsterdam, 2022, 75-92.
- R. Q. Chang, J. J. Yang, Y. L. Wu, R. F. Lu. Strength and leaching characteristics of CGF solidification/stabilization heavy metal contaminated soil. China Environmental Science, 2024, 44, 2580-2594. (in Chinese). [CrossRef]
- Y. L. Wu, J. J. Yang, R. Q. Chang. The design of ternary all-solid-waste binder for solidified soil and the mechanical properties, mechanism and environmental benefits of CGF solidified soil. J. Clean. Prod., 2023, 429, 139439. [CrossRef]
- Y. L. Yi, L. Y. Gu, S. Y. Liu, A. J. Puppala. Carbide slag–activated ground granulated blast furnace slag for soft clay stabilization. Can. Geotech J., 2014, 52, 656-663. [CrossRef]
- S. Siddiqua, P. N. M. Barreto. Chemical stabilization of rammed earth using calcium carbide residue and fly ash. Constr. Build. Mater. 2018, 2, 169. [CrossRef]
- W. T. Li, Y. L. Yi, J. P. Anand. Comparing carbide sludge-ground granulated blastfurnace slag and ordinary Portland cement: Different findings from binder paste and stabilized clay slurry. Constr. Build. Mater. 2022, 321, 126382. [CrossRef]
- Y. L. Wu, J. J. Yang, R. Q. Chang, S. C. Li, H. L. Kou. Strength, leaching characteristics and microstructure of CGF+P all-solid-waste binder solidification/stabilization Cu(Ⅱ) contaminated soil. Constr. Build. Mater., 2024, 411, 134431. [CrossRef]
- Y. J. Sun, J Ma, Y. G. Chen, B. H. Tan, W. J Chen. Mechanical behavior of copper contaminated soil solidified/stabilized with carbide slag and metakaolin. Environ. Earth Sci., 2020, 79, 1-13. [CrossRef]
- Y. S. Feng, Y. J. Du, A. Zhou, M. Zhang, J. S. Li, S. J Zhou, W. Y Xia. Geoenvironmental properties of industrially contaminated site soil solidified/stabilized with a sustainable by-product-based binder. Sci. Total Environ., 2021,765, 142778. [CrossRef]
- Y. G. Chen, S. Y. Zhu, B. H. Tan, K. Pan. Leaching characteristic of solidification/stabilization for cu2+ contaminated soils with carbide slag and metakaolin. Journal of Tongji University (natural science), 2018, 46, 182-187. (in Chinese). [CrossRef]
- Y. G. Chen, K. Pan, B. H. Tan, W. M. Ye, B Chen. Soaking experimental study on solidification/stabilization of Cu2+ contaminated soils with carbide slag and metakaolin. Journal of Central South University (Science and Technology), 2018, 49, 678-683. (in Chinese). [CrossRef]
- X. L. Guo, W. P. Hu, H. S. Shi. Microstructure and self-solidification/stabilization(S/S) of heavy metals of nano-modified CFA–MSWIFA composite geopolymers. Constr. Build. Mater., 2014, 56, 81-86. [CrossRef]
- Y. S. Zhang, W Sun, Q. L. Chen, L. Chen. Synthesis and heavy metal immobilization behaviors of slag based geopolymer. J. Hazard. Mater. 2007, 143, 206-213. [CrossRef]
- Y. G. Wang, F. L. Han, J. Q. Mu. Solidification/stabilization mechanism of Pb(II), Cd(II), Mn(II) and Cr(III) in fly ash based geopolymers. Constr. Build. Mater., 2018, 160, 818-827. [CrossRef]
- L. Chao, F. Q. Zhao. Application of fly ash/granulated blast-furnace slag cementing material for immobilization of Pb2+. MATEC Web of Conferences, 2018, 175, 01020. [CrossRef]
- L. H. Li, X. Li, W. T. Li, S. P. Huang. Strength and leaching characteristics of copper contaminated soil solidified with solid waste based material. Nonferrous Metals Engineering, 2023, 13, 136-142. (in Chinese). [CrossRef]
- H. Y. Wu, B. Bai. Availability and interfacial energy characteristics of heavy metal ions in soils solidified by graphene oxide. China Environmental Science, 2023, 43, 1277-1287. (in Chinese). 12. [CrossRef]
- D. Kang, K. S. Seo, H. Y. Lee, W. Chung. Experimental study on mechanical strength of GO-cement composites.Constr. Build. Mater., 2017, 131, 303-308. [CrossRef]
- L. J. Yan, J. J Yang, Y. L. Wu, F. M. Li. Experimental study of multifaceted solid waste synergistic treatment based on harmlessness and resource utilization of red mud. Journal of Civil and Environmental Engineering. 2025.(in Chinese)(accepted).
- W. Cui, X. Dong, F. Yang, G. He, & R. Zhao. Damage degradation pattern and life time prediction of solidified red mud under coupled environment of corrosive salt and freeze-thaw cycles. Constr. Build. Mater., 2024, 440, 137455. [CrossRef]
- E. Mukiza, L. L. Zhang, X. M. Liu. Durability and microstructure analysis of the road base material prepared from red mud and flue gas desulfurization fly ash. Int. J. Miner, Metal. and Mater., 2020, 27, 555-568. [CrossRef]
- H. Wen, C. Suo, Y. Hao, P. Fan, X. Dong. Effect of Freezing-Thawing Cycle on the Mechanical Properties and Micromechanism of Red Mud-Calcium-Based Composite Cemented Soil. Adv. in Civil Eng., 2020, 1, 8825576. [CrossRef]
- J. Zhang, & C. Li. Experimental study on lime and fly ash–stabilized sintered red mud in road base. J. of Test. Eval., 2018, 46, 1539-1547. [CrossRef]
- . X. M. Liu, B. W. Tang, H. F. Yin, E. Mukiza. Durability and environmental performance of Bayer red mud-coal gangue-based road base material. Chinese Journal of Engineering, 2018, 40, 438-445. [CrossRef]
- M. L. Shi, X. Y. Du, C. Y. Yu, R. K. Zhang, Z. H. Yang, X.T. Tian. Experimental research on feasibility and durability of stable red mud in road use. Journal of Engineering Geology, 2022, 06,1974-1985. (in Chinese). [CrossRef]
- H. J. Wang, M. L. Shi, X. T. Tian, C. Y. Yu, X. Y. Du. Experimental Study on Phosphogypsum-Amended Red Mud as Road Base Material. Sustainability, 2023, 15, 1719. [CrossRef]
- J. S. Li, P. Wang, T. T. Zhang, Z. Z. Li, Q. Xue. Effect of freeze-thaw cycle on engineering properties and microstructure of stabilized/solidified lead contaminated soil treated by cement. Chinese Journal of Geotechnical Engineering, 2016, 38, 2043-205. (in Chinese). [CrossRef]
- General Administration of Quality Supervision, Inspection and Quarantine of the People’s Republic of China, Standardization Administration of China. Groundwater quality standards, GBT14848-2017. Beijing: China Standard Press, 2017.
- Y. S. Feng. Solidification/stabilization of clay soil contaminated by nickel and zinc: sustainable binder development and performance evaluation. Doctoral dissertation, Southeast University, Nanjing. 2021.(in Chinese).
- W. Yang, S. K. Yang, Z. Wang, X. W. Zhang, Y. C. Wang. Long-term mechanical properties of solidified municipal sludge under freeze-thaw cycles. J. of Basic Sci. Eng., 2023, 31, 65-80. (in Chinese). [CrossRef]
- T. Y. Liu, M.Y. Cui, C.Y. Zhang. K. P. Zhou, W.C. Shi, P. Cao. Nuclear magnetic resonance analysis of the failure and damage model of rock masses during freeze‒thaw cycles. Bull. Eng. Geol. Environ., 2022, 81, 445. [CrossRef]
- J. L. Li, S. J. Tan, C. Yang, H. Chen, Y. Lin. Analysis of Damage Characteristics for Skarn Subjected to Freeze-Thaw Cycles Based on Fractal Theory. Fractal and Fractional, 2023, 7, 354. [CrossRef]
- J. X. Liao, J. Wang. X. M. Kong, Z. Z. Xu, P. Y. Zhou. Insights into the effect of aluminum sulfate and sodium aluminateon the compressive strength development of cement mortars, J. Build. Mater., 1-20, http://kns.cnki.net/kcms/detail/31.1764.TU.20240930.1707.016.html. (in Chinese) (in press).
- C. M. Li, T. T. Zhang, L. J. Wang. Mechanical properties and microstructure of alkali activated Pisha sandstone geopolymer composites. Constr. Build. Mater., 2014, 68, 233-239. [CrossRef]
- N. K. Lee, H. K. Lee. Reactivity and reaction products of alkali-activated, fly ash/slag paste. Constr. Build. Mater., 2015, 81, 303-312. [CrossRef]
- J. Zhang, S. Li, Z. F. Li. Investigation the synergistic effects in quaternary binder containing red mud, blast furnace slag, steel slag and flue gas desulfurization gypsum based on artificial neural networks. J. Clean. Prod., 2020, 273, 12297. [CrossRef]
- Y. L. Wu. Development of all solid waste binders & stabilization/solidification mechanism of heavy metal and application in contaminated site soil. Doctoral dissertation, Ocean University of China, Qingdao. 2022. (in Chinese).
| Natural moisture content (%) | specific gravity | Liquid limit (%) | Plastic limit (%) | Plasticity index |
| 31.9 | 2.72 | 37.8 | 25.2 | 12.6 |
| Chemical composition | SiO2 | Al2O3 | Fe2O3 | CaO | SO3 | Na2O | TiO2 | ZrO2 | Other |
| Percentage | 12.66 | 15.79 | 36.41 | 14.98 | 0.86 | 9.61 | 7.34 | 0.61 | 1.74 |
| Pollutants | Cu | Zn | Cr | Ni | As | Pb | Cd |
| Red mud | 63.7 | 441.2 | 30.6 | 140.0 | 314.0 | 418.0 | 20.6 |
| Water quality standard of groundwater class III | 1000 | 1000 | 50 | 20 | 10 | 10 | 5 |
| Mixing ratio (%) | a | R2 |
| 15 | 816.4 | 0.939 |
| 20 | 948.6 | 0.903 |
| 25 | 512.9 | 0.934 |
| 30 | 457.7 | 0.900 |
| Mixing ratio (%) | b | R2 |
| 15 | 9.93 | 0.995 |
| 20 | 10.03 | 0.985 |
| 25 | 10.20 | 0.999 |
| 30 | 10.39 | 0.994 |
Disclaimer/Publisher’s Note: The statements, opinions and data contained in all publications are solely those of the individual author(s) and contributor(s) and not of MDPI and/or the editor(s). MDPI and/or the editor(s) disclaim responsibility for any injury to people or property resulting from any ideas, methods, instructions or products referred to in the content. |
© 2025 by the authors. Licensee MDPI, Basel, Switzerland. This article is an open access article distributed under the terms and conditions of the Creative Commons Attribution (CC BY) license (http://creativecommons.org/licenses/by/4.0/).


