

Submitted:
01 January 2025
Posted:
03 January 2025
You are already at the latest version
Preprints on COVID-19 and SARS-CoV-2
Abstract
In this study, we analyzed daily time series data of new COVID-19 positive cases in each prefecture of Japan to investigate the mechanisms behind the spread of the virus. First, we decomposed the time series data for each prefecture into trend, weekly variation, and short-term components. Using the trend components, we estimated the time lag of infection spread between prefectures and found that Okinawa and Tokyo were leading the spread compared to other prefectures. We also analyzed factors affecting the lag values. Furthermore, through cluster analysis, we grouped all prefectures into 13 categories and conducted a detailed analysis of the infection transition structure within each group. The results suggested that regions centered around Tokyo in the Kanto area served as the epicenter, influencing nationwide spread through areas centered around Osaka and Kyoto. Additionally, we examined the effects of holidays and seasonal variations in the short-term components using regression analysis. The findings confirmed that the effect of holidays was negative immediately after the holidays but became significantly positive one week later. Regarding seasonal effects, the greatest positive impact occurred in November, while a negative impact was observed in March.
Keywords:
COVID-19
; Mechanisms of infection spread in Japan
; Time-series decomposition
; regression analysis
; cluster analysis
1. Introduction
During the COVID-19 pandemic, Japan rapidly and extensively collected data on new infections and related information, providing insights into infection trends across its prefectures. Analyzing this data is crucial not only for understanding the dynamics of COVID-19 but also for devising strategies to prevent the spread of future infectious diseases. This paper focuses on analyzing daily new positive case data of COVID-19 in Japan’s prefectures.
The daily data on new positive cases comprises a trend component reflecting long-term fluctuations, a weekly variation component with recurring patterns, and short-term fluctuations influenced by temporary factors such as weather, public holidays, seasons, local events, and regional prevention measures. To address these complexities, this study first decomposes the daily time series data of new positive cases into a trend component, a weekly variation component, and a short-term component. Based on this decomposition, we aim to analyze the mechanisms driving the spread of COVID-19 across Japan and identify factors influencing these trends.
Time series decomposition methods, such as those proposed by [3], are commonly employed in such analyses. However, the uneven fluctuations in new positive case data present challenges for traditional methods like Kitagawa’s. To overcome these limitations, we adopt the extended moving linear model (EMLM) approach proposed by [4], an extension of the moving linear model (MLM) introduced by [5], and confirm its effectiveness.
Among the components of new positive case data, the weekly variation component is primarily driven by the periodicity of socio-economic activities and is unrelated to regional infection dynamics. Thus, our analysis emphasizes the trend and short-term fluctuation components. The trend component reveals regional connections in the spread of infections, while short-term fluctuations, influenced by complex and random factors, are harder to interpret. Nevertheless, public holidays, being nationwide, provide a unique opportunity to examine their impact on infection dynamics.
Recent studies on Japan’s COVID-19 pandemic, such as [9,10,11,12,13], have reported that human mobility accelerates infection spread and that both trend and periodic fluctuations strongly characterize case variations. For instance, [10] highlight the impact of government campaigns on travel demand during the pandemic, while [11] examines infection patterns before major events like the Tokyo Olympics. Similarly, studies by [7] focuses on global trends, with [14] demonstrating the effectiveness of the Prophet model for predicting cases in the United States. Notably, [12,13] forecasts the spread of COVID-19 in Japan using epidemiological models. However, our study differs in its focus on uncovering the mechanisms behind regional transmission patterns within Japan.
In addition, [2] reviewed deep learning methods for COVID-19 forecasting, identifying 53 quality studies from over 150 reviewed publications. Their work provides valuable insights into machine learning’s potential for outbreak prediction. [8] proposed the SVIHRD model for COVID-19, employing a physics-informed neural network (PINN) to estimate parameters using real data from Japan. While machine learning methods such as these are effective for predicting outbreak trajectories, their utility for post-event analysis remains limited. This limitation arises from their opaque nature, as they often fail to explain the underlying mechanisms, posing challenges for policymaking aimed at future epidemic prevention.
Recently, [15] analyzed the spread of COVID-19 across prefectures in Japan’s Kanto region by decomposing daily time series data and performing time-lag correlation analysis on trend components. Their findings suggest that fluctuations in Tokyo’s cases lead those in surrounding prefectures. Similarly, [6] extended this method to the Kansai region, showing that cases in Osaka and Kyoto precede those in nearby prefectures. However, time-lag correlation methods have limitations, such as inconsistency when applied broadly across all prefectures. For instance, if prefecture A leads prefecture B by n days and prefecture B leads prefecture C by m days, it does not necessarily follow that prefecture A leads prefecture C by days.
To address these limitations, this study first decomposes the daily time series data of new positive cases in all prefectures into trend, weekly variation, and short-term fluctuation components. Using the trend component, we analyze inter-prefecture transmission dynamics by defining Euclidean distances based on time-lagged trend data and estimating lags that minimize total distances. This approach ensures consistent results across all prefectures. We further analyze factors affecting these lag values and apply cluster analysis to the lag-adjusted trend data to examine transmission mechanisms. Additionally, we investigate the holiday effect on infection spread using the short-term fluctuation component. By studying all prefectures comprehensively, this research aims to provide a deeper understanding of the mechanisms driving COVID-19 spread in Japan.
The ultimate goal of this study is to analyze the factors influencing the spread of COVID-19 from diverse perspectives through post-event analysis, even if some precision is compromised. Using straightforward methods, we aim to clarify infection dynamics and provide valuable insights for future epidemic prevention policies.
The remainder of this paper is organized as follows: Section 2 presents the hypotheses and describes the preprocessed data. Section 3 introduces the analytical methods and procedures. Section 4 presents the analysis results, along with related discussions. Finally, Section 5 offers a discussion of the findings, conclusions, and suggestions for future research.
2. Hypotheses and Data Preprocessing
2.1. Hypotheses
Regarding the spread of COVID-19 in Japan, we establish the following assumptions. First, the daily time series data of new COVID-19 cases in each prefecture in Japan, which is the subject of analysis, can be decomposed into trend components, weekly variation components, and short-term variation components. As for the trend component, we assume that its fluctuations lead in prefectures with major airports and tourist spots, such as Tokyo and Osaka, and then spread to surrounding prefectures. Next, for the short-term variation component, although it is influenced by many complex factors, we assume that there are some regularities in fluctuations due to factors common to all prefectures, such as holidays and seasons. These assumptions require statistical analysis to provide supporting evidence.
2.2. Data
This study analyzes data on new COVID-19 cases in Japan, with the aim of elucidating the mechanisms underlying the spread of the virus across the country’s prefectures. To achieve this, we utilize daily time series data of new cases from all 47 prefectures. For reference, Table 1 lists the serial numbers and names of each prefecture, while Figure 1 presents a map of Japan labeled with prefecture numbers.
The data used in this analysis were obtained from the Ministry of Health, Labour and Welfare (MHLW) website of Japan (see https://www.mhlw.go.jp/stf/english/ index.html). The analysis covers all prefectures of Japan. The daily changes in new COVID-19 cases for each prefecture span from January 20, 2020, to May 7, 2023, covering a total of 1204 days, equivalent to 172 weeks. The original time series is denoted as , and for the analysis, we transform it into . The purpose of applying the logarithmic transformation was to make the amplitude of cyclical fluctuations in the time series approximately uniform. However, since the original time series contains zeros, we added 1 before applying the logarithmic transformation. Therefore, the minimum value of the transformed time series is 0.
The dataset is extensive, and the time series data of new cases exhibit similar fluctuation patterns across all prefectures. Therefore, Tokyo is selected as an example, with its data presented in Figure 2. Panel (a) displays the original time series data, , while panel (b) shows the transformed time series data, . In the subsequent analysis, the transformed time series, , for each prefecture will be analyzed.
2.3. Decomposition of Time Series Components
Here, the time series for each prefecture is decomposed into trend, weekly fluctuation, and short-term components using the extended moving linear model (EMLM) approach1. Due to the subtle differences in the decomposition results across prefectures, which are difficult to recognize at a glance, and the limitations of space, only the decomposition results for Tokyo are presented as a typical example in Figure 3.
The following observations can be made from Figure 3. First, the trend component is smooth, reflecting not only the stable fluctuation trends in the number of new COVID-19 cases but also long-term waves. The stable fluctuations are primarily attributed to the mechanisms of infection spread within the prefecture, while the long-term waves are likely influenced by external factors, such as preventive measures and policies. Furthermore, the fluctuation patterns of the trend component are highly similar across prefectures, making it possible to analyze the progression relationships of COVID-19 spread among prefectures based on the similarity of their trend components.
Next, the weekly fluctuation component exhibits a nearly consistent pattern of variation on a weekly basis in the short term, but its fluctuation pattern changes over time in the long term, warranting further analysis. Additionally, the short-term component fluctuates irregularly around zero. These fluctuations are caused by temporary shocks such as weather, holidays, seasons, regional events, and local preventive measures. Due to the complexity of these influencing factors, a detailed analysis is required to obtain meaningful results. However, since the effects of holidays and seasons are nearly uniform nationwide, it is possible to analyze their impact.
It should be noted that the weekly fluctuation component not only changes its pattern over time but also shows variations in amplitude. However, this paper does not delve into a detailed analysis of these aspects.
3. Methods and Procedures
3.1. Estimating Time Lags of Infection Spread Among Prefectures
Based on the consideration that the waves of COVID-19 infection spread among prefectures may exhibit time lags (hereafter referred to as lags), we analyze the transition relationships of infection spread among prefectures. However, the mutual influence relationships among prefectures form a complex network, making it difficult to obtain consistent results when estimating lags on a pairwise basis. Additionally, prior studies have indicated that the trend components provide more information regarding the transitions of infection spread among prefectures. Consequently, the time series of the trend components are utilized in this analysis. Therefore, in this paper, an analysis is conducted for each prefecture based on the total distance calculated from the trend component time series in relation to other prefectures.
For convenience, each prefecture is identified by the number shown in Table 1. Let the time series of trend components for prefecture i and prefecture j be denoted as and , respectively. To eliminate dependency on the scale of each prefecture, the time series data for all prefectures are standardized such that their mean is zero and variance is one. The standardized time series corresponding to and are denoted as and , respectively. The data incorporating lags into their indices are expressed as
Here, N denotes the length of the time series, and and are the lags applied to the respective time series, both of which are integers. The Euclidean distance between prefectures i and j is defined as follows:
Since the data for and are standardized, the greater the similarity between their fluctuation patterns, the smaller becomes, and the higher the correlation coefficient between them. In other words, for prefectures i and j, the distance can be used as a measure of dissimilarity, while the correlation coefficient can be used as a measure of similarity, both reflecting the similarity in trend component fluctuations between the two. However, when used in conjunction with cluster analysis, the distance measure is more convenient.
Here, for prefecture i, the total distance with other prefectures is defined as follows:
As is evident, the total distance defined in Eq. (2) is a function of the lag . Therefore, by minimizing for , we can obtain an estimate of the lag denoted as . Specifically, in general,
where is obtained discretely. Here, M is a suitably chosen positive integer.
However, there is a dilemma hidden in the above steps. As can be seen from Eq. (2), the total distance depends on the lags of other prefectures, meaning that unless all the lags are estimated simultaneously for every prefecture, the estimation results will not be unique. However, estimating all lags simultaneously is a difficult task.
In this paper, the estimation of the lags is performed recursively, and the procedure is repeated to address the above issue. In the first step, the initial value of the lags is set as , and instead of Eq. (2), the total distance is newly defined as follows:
Then, for , by minimizing , the value of the lag is updated to . Furthermore,
and in the next step, for , the updated lag estimates are used in place of the initial values , and the total distance is updated to . The lag is then re-estimated by minimizing . This process is repeated for , and the lag estimates will eventually converge. The final lag estimates obtained are denoted as . Empirically, for Japan, the results can be obtained within five iterations.
The estimated lag results allow for the analysis of the transition relationships of infection spread between prefectures. For example, if for , this indicates that the wave of COVID-19 infection in prefecture i is preceding that in prefecture j. However, this does not necessarily imply that the COVID-19 infection spread in prefecture i is a causal factor for that in prefecture j. Such an interpretation cannot be made conclusively without considering the similarity in the trend component fluctuations between the prefectures. Therefore, a comprehensive analysis that integrates the results of the trend component cluster analysis is needed for a more complete understanding.
3.2. Cluster Analysis of Prefectures
Using the estimated lag values obtained through the procedure described in the previous section, the inter-prefectural relationships in the spread of COVID-19 infections can be analyzed. However, the lag values can also be interpreted relatively. In such cases, the lags can be converted into relative lags using the following formula:
where represents the maximum value of . Clearly, the relative lags have a maximum value of zero.
Here, the time series data of the trend components are lag-adjusted as follows:
For the first few values of the time series , if their indices satisfy , these values become missing and are supplemented with zeros. Since the initial values in the time series of the trend components for each prefecture are mostly zero or close to zero, the advantage of adjusting lags using relative lags in this way is that it preserves the length of the time series at N without compromising its accuracy.
By applying the lag-adjusted time series data described in Eq. (4) to Eq. (1), the distance for each pair of prefectures, where and , is calculated, thereby defining an inter-prefectural distance matrix. This resulting distance matrix corresponds to the minimum total distance between prefectures, reflecting their similarity based on trend components. The matrix is then utilized for cluster analysis among prefectures2.
The following describes the procedure for grouping the prefectures nationwide based on the results of the cluster analysis. The number of groups to be formed is equal to the number of cluster branches that are cut horizontally, and by determining this, the group membership of each prefecture is decided. For example, if the desired number of groups is , the set of prefecture numbers belonging to each group, denoted as for , is defined, and the number of prefectures in each group is denoted as . The following time series are then defined for the average and total variance of the trend components for all prefectures:
Next, the average time series within group is defined as:
Then, the time series of the variance between groups is defined as:
The ratio of the total variance to the variance between groups is calculated as:
Finally, by maximizing the ratio of the variance between groups, r, the number of groups, K, is determined, and the grouping of the prefectures based on the results of the cluster analysis is naturally decided.
Using the results of the cluster analysis and prefectural grouping, the similarity in the COVID-19 infection spread patterns between prefectures is analyzed, and grouping of the prefectures is performed accordingly. By associating this with the analysis of the transition relationships in the spread of COVID-19 between prefectures, the mechanisms of the spread of COVID-19 across prefectures are brought to light.
3.3. Further Analysis Based on Trend Components
The framework for analyzing the trend components described above is primarily based on the similarity of fluctuation patterns in the trend components of each prefecture. In addition to this, the trend components can also be used for the following analyses.
3.3.1. Mutual Influences Between Prefectures
The time series data of lag-adjusted trend components are defined as
Here, it should be noted that represents the original trend time series, that is, the trend time series before standardization. The first-order difference series for each of these is defined as . These difference series are considered to be approximately mean-stationary time series.
Let denote the covariance between and . If the value of is large, it can be inferred that there is a strong interconnection in the spread of COVID-19 infections between prefectures i and j. This indicates strong mutual influence in the spread of infections, providing crucial information for analyzing the propagation relationships of infection spread among prefectures.
3.3.2. Factors Influencing the Lag Values
The lag values can be interpreted as information regarding the propagation relationships of COVID-19 between prefectures. Identifying the factors influencing these lags is crucial for understanding inter-prefecture propagation dynamics. Factors that may affect the lag include population, land area, prefectural boundary length, and the number of airline passengers. Although railway usage could also influence the lag, consistent data were unavailable and, therefore, excluded from the analysis.
To investigate this, we employ a regression model where the estimated lag value for each prefecture serves as the objective variable. The explanatory variables include population, land area, perimeter length, the number of domestic airline passengers, and the number of international airline passengers (or their transformed values, where applicable) for each prefecture.
Through the estimation results for the regression coefficients, we can analyze the factors influencing the lag.
3.4. Analysis of Factors Influencing Short-Term Components
As mentioned earlier, short-term components are caused by temporary shocks such as weather, holidays, seasons, local events and festivals, as well as regional preventive measures. Due to the complexity of these influencing factors, detailed analysis is required. However, since the effects of holidays and seasons are almost uniform nationwide, it is possible to analyze their impacts.
In this study, we analyze the impact of holidays and seasonal factors on short-term components using regression analysis. Denoting the time series of short-term components for prefecture i as , we compile the time series data for short-term components across all prefectures to obtain the following 47-dimensional time series data of length N.
Furthermore, for this 47-dimensional data, we normalize the data for each component individually and apply principal component analysis to obtain the first principal component score data . Assuming that the effects of holidays and seasons are common to all prefectures, it is plausible that the time series contains variations attributable to these effects.
Holidays may differ significantly from regular days in terms of people’s daily routines and social activity patterns, potentially exerting a widespread influence that increases the likelihood of COVID-19 transmission. However, given that there is likely a lag between transmission and the confirmation of positive COVID-19 cases, it is necessary to estimate this lag using the available data. First, for holidays that do not overlap with Saturdays or Sundays, we define holiday dummy variables as follows, covering the holiday itself and up to J days after the holiday.
The seasonal effects are represented using 11 monthly seasonal dummy variables as follows:
Based on these, we establish the following regression model:
In this model, represents the holiday effect for each lag of holidays, while represents the seasonal effect, and denotes the error term. Note that this setup assumes the seasonal effect for December to be zero, and thus the values of should be interpreted relative to December.
Note that not all explanatory variables in the model given by Eq. (5) need to be included. In other words, variable selection must be performed before using this model. In this study, the minimum AIC method is primarily employed3.
4. Results
4.1. Estimation of Lags
In this study, the interval limit for lag estimation was set to , and the minimum total distance method proposed in Section 3.1 was used to estimate the trend component variation lags among prefectures. Furthermore, to normalize the maximum lag to zero, these lags were converted into relative lags based on Eq. (3). The results are shown in Table 2.
The following observations can be drawn from Table 2. Firstly, Okinawa (No. 47) and Tokyo (No. 13) have estimated relative lags of and , respectively, indicating small values. These regions have international airports with numerous flights connecting Japan to various countries worldwide, especially in Asia, which results in a high volume of foreign tourists. Consequently, it is believed that COVID-19 initially emerged in these areas and subsequently spread across Japan.
Next, Hokkaido (No. 1) and Gunma (No. 10) have relative lags estimated at , while the surrounding prefectures of Tokyo, such as Miyagi (No. 4), Saitama (No. 11), Chiba (No. 12), and Kanagawa (No. 14), as well as the central regions of the Kansai area, including Kyoto (No. 26), Osaka (No. 27), and Nara (No. 29), all have relative lags estimated at . Most of these prefectures are located near international airports, have active business environments, or are home to famous tourist destinations, which leads to high levels of movement and interaction.
In contrast, Akita (No. 5), Gifu (No. 21), Mie (No. 24), and Tokushima (No. 36) have the maximum relative lag value of 0, while Toyama (No. 16), Okayama (No. 33), Ehime (No. 38), Kochi (No. 39), and Oita (No. 44) have relative lags estimated at . These prefectures likely have a relatively large rural population, which results in less frequent interaction with external areas. Surprisingly, Iwate (No. 3), which is well known for having the latest first positive case of COVID-19 in Japan, has a relative lag of , indicating that its relative lag is not particularly high.
4.2. Cluster Analysis
Using the estimated relative lags mentioned above, a cluster analysis of the prefectures was performed using the method introduced in Section 3.2. Note that the Ward method in the free software R was used for the cluster analysis. The resulting dendrogram is shown in Figure 4. The dendrogram resembles an inverted tree. From this figure, hierarchical similarities in the fluctuation patterns of the trend components between prefectures can be observed. The numbers at the bottom of the leaves represent the prefecture numbers, and as you move upward, the branches bind hierarchically. Prefectures (or groups of prefectures, called clusters) that bind earlier have a higher degree of similarity. Additionally, the height of the branches represents the distance between prefectures (or clusters).
Based on the results in Figure 4, the grouping of prefectures was performed. By testing the number of groups from 2 to 17, it was found that the variance ratio between groups was maximized at , with a maximum value of 1.56. Therefore, all prefectures can be divided into 13 groups.
One notable feature is the presence of two single-prefecture groups: Hokkaido (No. 1) and Okinawa (No. 47). These prefectures are estimated to have small relative lags. Both Hokkaido and Okinawa have international airports, attract many foreign tourists, and are located on remote islands. Therefore, it is understood that the spread of COVID-19 in these prefectures followed a unique pattern. In Hokkaido, the spread of COVID-19 progressed relatively early, but it was particularly rapid in Okinawa, where the spread was the fastest in Japan. However, geographically, these prefectures did not have a strong influence on other regions.
Next, there are three groups consisting of two prefectures. The first group is made up of Miyagi (No. 4) and Gunma (No. 10). In these two prefectures, the spread of COVID-19 occurred relatively early. The second group includes the two neighboring prefectures of Toyama (No. 16) and Ishikawa (No. 17), both of which experienced a delay in the spread of COVID-19. The third group is composed of Gifu (No. 21) and Oita (No. 44). While these two prefectures are similar in that the spread of COVID-19 was delayed, it is interesting that they are geographically distant from each other.
Additionally, there is one group containing three prefectures: Fukushima (No. 7), Ibaraki (No. 8), and Mie (No. 24). These prefectures are characterized by a relatively delayed spread of COVID-19.
For the remaining groups, they will be explained in relation to the progression of COVID-19 spread among prefectures, as observed in the previous section, following the order from left to right in the dendrogram shown in Figure 3.
First, the group on the far left contains four prefectures from the Kanto region, structured as follows:
Here, ⇒ represents a unidirectional progression relationship, ⇔ indicates a simultaneous progression relationship, and {*} denotes the same cluster. This result suggests that the spread of COVID-19 progressed most rapidly in Tokyo, reflecting the active human interactions with its surrounding prefectures.
Next, the group consisting of four prefectures in the Kansai region, along with Aichi and Fukuoka, has the following structure:
Here, ⇐ indicates a progression relationship from the latter to the former, and ↔ signifies a complex bidirectional progression relationship. This represents the mutual relationships in the spread of COVID-19 among the prefectures in the Kansai region, Aichi, and Fukuoka. Additionally, Figure 3 shows that these two groups together with Okinawa form a larger cluster.
Additionally, the next group includes only four prefectures, but it spans across the Tohoku, Chubu, and Chugoku regions. Its structure is as follows:
Here, ↔ represents a complex bidirectional progression relationship, ⇐ indicates a progression relationship from the latter to the former, and ⇔ denotes a simultaneous progression relationship. This result highlights the spread of COVID-19 among these prefectures, revealing unique interregional interactions despite their geographical distances.
Other groups have complex structures, and detailed analyses of these groups are omitted here.
Synthesizing the results above, the following insights can be inferred: The initial source of COVID-19 infections likely entered Japan from abroad through Tokyo. After the spread of infections in Tokyo, they dispersed to surrounding prefectures. This impact extended to Osaka, Kyoto, and Nara. Subsequently, the spread reached Aichi Prefecture, centered on Nagoya, and Fukuoka Prefecture, centered on Fukuoka City. This progression formed the primary pattern of COVID-19’s spread in Japan, closely related to the fact that these metropolitan areas are well-connected by Shinkansen and flights, ensuring easy access via both land and air routes.
4.3. Further Analysis Based on Trend Components
4.3.1. Mutual Influences Between Prefectures
As shown in Section 3.3.1, we calculated the covariance of differenced time series for the trend components between prefectures to analyze the strength of interconnections in the spread of COVID-19 infections. For clarity, we multiplied the covariance values by 1000 and included only those exceeding 2.30. The results are presented in Table 3. The first column and the first row of Table 3 indicate the prefecture numbers i and j, while the values in the table represent the covariance between the prefectures i and j.
The following observations can be made from Table 3. The table includes 15 prefectures, among which are five prefectures from the Kanto region (Nos. 10–14) and four from the Kansai region (Nos. 26–29). These two regions are well-known as the political and economic centers of Japan, and they are also famous for their commercial areas and tourist destinations, making them hubs of human interaction. Additionally, Toyama (No. 16), Gifu (No. 21), and Aichi (No. 23) are included. These prefectures are adjacent to the Kansai region and are known for famous tourist spots. Furthermore, Fukuoka (No. 40) and Oita (No. 44) from the Kyushu region are also listed. These prefectures are hubs in Kyushu, well-connected by domestic transportation such as bullet trains and airplanes, and are close to China and South Korea, which makes them closely tied with international connections. They are also famous tourist destinations, contributing to vibrant exchanges with foreign regions.
In terms of the number of prefectures with strong connections, Fukuoka (No. 40) ranks first with 14 prefectures, followed by Saitama (No. 11) in second place with 10. This suggests a wide range of human interactions involving these two prefectures. Additionally, regarding the covariance values, the covariance between Fukuoka (No. 40), Osaka (No. 27), and Aichi (No. 23) exceeds 2.98, marking the highest values observed. These results provide further insight into the clustering analysis, which revealed that Fukuoka (No. 40) is grouped with the Kansai region cluster.
4.3.2. Factors Influencing the Lag Values
As mentioned in Section 3.3.2, to investigate the factors influencing the lag values, we consider the following regression model:
where i denotes the prefecture number, represents the estimated lag value, and represents the population (in millions of people). To enhance the model’s performance, logarithmic values were used as explanatory variables based on trial and error. Additionally, to represent the land area (in 10,000 square kilometers), the perimeter length length (in 10,000 kilometers), the number of domestic airline passengers (in millions of people), and the number of international airline passengers (in millions of people), respectively4. Here, b is a constant, to are the corresponding coefficients, and is the error term.
For the selection of explanatory variables, we used a stepwise regression procedure. As a result, the AIC value of the model in Eq. (6), which included all explanatory variables, was 68.87. The stepwise regression yielded a model that included the logarithm of the population, , and the number of domestic airline passengers, , achieving a minimum AIC value of 63.26. Table 4 presents the estimated regression coefficients and the corresponding p-values. From Table 4, the following observations can be made: there is a significant negative effect from both the population and the number of domestic airline passengers. It implies that in prefectures with larger populations, the lag tends to be more negative, indicating that the spillover effect to other prefectures is greater. A similar observation is made for the number of domestic airline passengers.
4.4. Analysis of Holiday and Seasonal Effects
In this section, we analyze the effects of holidays and seasons included in the short-term component using regression analysis. First, principal component analysis (PCA) was performed based on the correlation matrix of the short-term components for all combinations of prefectures. The contribution ratio of the first principal component (PC) was 42.78%, and its time series, , is shown in Figure 5.
Next, we set the number of holiday dummy variables to and incorporated 20 holiday dummy variables and 11 seasonal dummy variables to construct a regression model as shown in Eq. (5). The AIC value for the model using all explanatory variables was -596.13. Based on this, stepwise regression was performed for variable selection, resulting in a regression model that included 2 holiday dummy variables and 8 seasonal dummy variables, with a minimum AIC value of -628.18. Furthermore, using a 5% significance level as the criterion, t-tests confirmed that all regression coefficients for these dummy variables were significant. Table 5 presents the estimated regression coefficients and the upper bounds of their corresponding p-values. From Table 5, the following observations can be made: there is a significant negative effect on the day after a holiday and a positive effect eight days later. This suggests that despite active interpersonal interactions during holidays, the number of positive cases increases about a week later.
Regarding seasonal effects, assuming the effect for December is zero, the largest positive effect is observed in November, with significant positive effects also appearing in April, May, and August. The effect in October, while relatively weaker, remains positive. On the other hand, the effects for March and June are negative, with the effect in June being weaker than that in March. The adjusted coefficient of determination for the regression model is 0.4119, which is not particularly high. However, it is meaningful to have identified such significant holiday and seasonal effects amidst complex disturbance factors.
5. Discussion
In this study, we examined the mechanism of COVID-19 spread across prefectures in Japan by analyzing daily time series data of new COVID-19 positive cases. Through a comprehensive approach, we first performed time series decomposition, which allowed us to break down the complex fluctuation patterns in the data into trend components, weekly fluctuation components, and short-term components. We then estimated the relative lags in the progression of infection spread among prefectures using the shortest distance method, based on the decomposition results of the trend components. Finally, we classified the prefectures through cluster analysis, providing deeper insights into the regional dynamics of infection spread.
The key findings of the study are as follows. First, the spread of COVID-19 in Okinawa and Tokyo exhibited earlier fluctuations compared to other prefectures, suggesting that these regions were among the first to experience significant increases in new infections. Kyoto and Osaka followed Tokyo with a slight delay, but they also demonstrated earlier infection spread relative to other prefectures. The cluster analysis further classified the prefectures into 13 groups, highlighting regional differences in the progression of the pandemic. Notably, Hokkaido and Okinawa demonstrated unique fluctuation patterns, each forming its own distinct group. Okinawa, despite experiencing the earliest progression of the pandemic, had its influence geographically limited, as expected due to its isolation. The cluster analysis results also revealed clear progression structures in the groups centered around the Kanto region, led by Tokyo, and the Kansai region, led by Osaka and Kyoto. These findings suggest that the spread of COVID-19 in Japan likely originated in Tokyo, subsequently influenced Osaka and Kyoto, and then spread nationwide, with clear regional patterns emerging over time.
In further examining the trend components and the interconnections between prefectures, we analyzed the strength of regional ties by calculating the covariance between differenced time series of the trend components for different prefectures. The results revealed significant mutual influences, particularly between the Kanto and Kansai regions, which are central to Japan’s economy and human interactions. For example, Fukuoka stood out with the highest number of strong connections to other prefectures, reinforcing its pivotal role in the spread of infections. These findings, when combined with the cluster analysis results, highlight the crucial role of regional dynamics in the pandemic’s progression, with Tokyo acting as the primary epicenter influencing surrounding areas like Osaka, Kyoto, and Fukuoka. The clustering analysis further corroborates the idea that the spread followed distinct regional patterns, emphasizing the significance of inter-prefecture interactions in understanding the geographical spread of COVID-19 across Japan.
A significant contribution of this study was the regression analysis performed to understand the effects of holidays and seasonal factors on short-term fluctuations in infection rates. The analysis revealed a significant negative effect the day after a holiday and a positive effect eight days later, implying that the social interactions during holidays played a key role in the transmission of the virus. This aligns with the incubation period of COVID-19, where the effects of increased interactions become more evident approximately a week later. The analysis of seasonal effects further revealed that the largest positive effect occurred in November, followed by positive effects in April, May, and August. Conversely, March exhibited a significant negative effect. These findings underscore the importance of accounting for both holidays and seasonal patterns in infection control strategies, as they contribute to spikes in cases following periods of heightened social activity.
Further analysis of factors influencing the lag in infection spread, as described in Section 4.3.2, provided additional insights. Regression analysis showed that population size and the number of domestic airline passengers had a significant negative effect on the lag value, indicating a faster spread in more populated prefectures and those with higher domestic travel traffic. This suggests that social interaction, especially in regions with dense populations and high connectivity, is a key factor driving the spread. The AIC value from the stepwise regression suggested that incorporating these variables into a predictive model could refine our understanding of lag patterns in infection dynamics. These findings provide a foundation for developing more targeted interventions, especially in regions with high population density or significant transportation hubs.
Despite the valuable insights gained from analyzing the holiday and seasonal effects, this study has several limitations. One key limitation is the focus on regional trends and the lack of in-depth analysis of infection dynamics within individual prefectures. Future research could extend the current study by examining intra-prefecture transmission dynamics and identifying local factors that may influence the spread of infections. Additionally, while the regression analysis identified significant holiday and seasonal effects, the model’s adjusted coefficient of determination () was relatively low (0.4119), indicating that the model only explained a portion of the variability in the data. Future work could aim to refine the model by incorporating other potential explanatory variables, such as demographic factors, healthcare infrastructure, and public policy measures, to improve the model’s explanatory power.
Another limitation of this study is the exclusion of other possible factors influencing the spread of COVID-19, such as mobility patterns, public behavior, and the role of interventions such as lockdowns and vaccination campaigns. While we focused on the short-term components related to holidays and seasonal variations, a more comprehensive model would include these additional factors to provide a more holistic understanding of the spread of the virus. Moreover, the study primarily relied on statistical techniques to identify trends and relationships in the data. While these techniques are powerful, they do not account for all possible causal relationships and may overlook complex interactions between different variables. Future research could benefit from incorporating more advanced machine learning or causal inference methods to uncover deeper insights into the mechanisms of infection spread.
In conclusion, this study provides valuable insights into the regional dynamics of COVID-19 spread in Japan, highlighting the importance of holidays, seasonal variations, and geographic factors in shaping the pandemic’s progression. The findings from the cluster analysis and regression models offer practical implications for infection control strategies, emphasizing the need for targeted interventions during holidays and seasonal peaks. Furthermore, the covariance analysis between trend components, along with the investigation of lag values, reveals important regional interdependencies that can help guide future policy decisions. However, the study also identifies several areas for future research, particularly the need for a more detailed analysis of local transmission dynamics and the inclusion of additional factors in predictive models. By addressing these challenges, future studies can contribute to more effective public health strategies in managing infectious diseases.
Author Contributions
K.K. was responsible for drafting the research plan, conceptualizing the data analysis, organizing the programs, and handling the majority of the manuscript preparation. Y.S. and Y.K.N. contributed equally by providing ideas based on their professional knowledge, collecting and organizing data, and drafting parts of the manuscript.
Funding
The research reported in this publication was supported by Grants-in-Aid for Scientific Research (C) (23K06801 and 22K07333) from the Japan Society for the Promotion of Science.
Institutional Review Board Statement
Not applicable.
Data Availability Statement
All the data used in this paper are publicly available. The authors possess these data and can provide them upon a reasonable request.
Conflicts of Interest
The authors declare no competing interests.
References
- Akaike H (1974). A new look at the statistical model identification. IEEE Transactions on Automatic Contro AC-19: 716-723.
- Kamalova F, Rajabb K, Cherukuric AK, Elnagard A, Safaralieve M (2022) Deep learning for Covid-19 forecasting: State-of-the-art review. Neurocomputing 511: 142–154.
- Kitagawa G (2020) Introduction to Time Serise Modeling with Appications in R (Second Edition), CRC Press.
- Kyo K, Noda H, Fang F. (2024) An integrated approach for decomposing time series data into trend, cycle and seasonal components. Mathematical and Computer Modelling of Dynamical Systems 30(1): 792-813.
- Kyo K, Kitagawa G (2023) A moving linear model approach for extracting cyclical variation from time series data. Journal of Business Cycle Research 19(3): 373-397.
- Kyo K, Noda H (2024) Decomposition and correlation analysis of daily time series data for new COVID-19 cases in the Kansai region of Japan. In: Proceedings of 2024 IEEE Annual Congress on Artificial Intelligence of Things (AIoT), pp 134-141.
- Long C, Fu XM, Fu ZF (2020) Global analysis of daily new COVID-19 cases reveals many static-phase countries including the United States potentially with unstoppable epidemic. World Journal of Clinical Cases 8: 4431-4442.
- Nelson SP, Raja R, Eswaran P, et al. (2024) Modeling the dynamics of Covid-19 in Japan: employing data-driven deep learning approach. International Journal of Machine Learning and Cybernetics. https://doi.org/10.1007/s13042-024-02301-5. [CrossRef]
- Shibamoto M, Hayaki S, Ogisu Y (2022) COVID-19 infection spread and human mobility. Journal of the Japanese and International Economies 64: 1-24.
- Sun W, Schmöcker JD, Nakao S (2022) Restrictive and stimulative impacts of COVID-19 policies on activity trends: A case study of Kyoto. Transportation Research Interdisciplinary Perspectives 13: 1-15.
- Sumi A (2023) Time series analysis of daily reported number of new positive cases of COVID-19 in Japan from January 2020 to February 2023. PLoS ONE 18: 1-14.
- Tsuchiya T (2021) A Study on the spread of COVID-19 infection. Operations Research 66: 90–103 (in Japanese).
- Tsuchiya T (2022) The dynamics of COVID-19 and data science. SURIKGAKU, No. Tsuchiya T (2022) The dynamics of COVID-19 and data science. SURIKGAKU, No. 711, pp 44–50 (in Japanese).
- Wang Y, Yan Z, Wang D, Yang M, Li Z, Gong X, Wu D, Zhai L, Zhang W, Wang Y (2022) Prediction and analysis of COVID-19 daily new cases and cumulative cases: times series forecasting and machine learning models. BMC Infectious Diseases 22. https://doi.org/10.1186/s12879-022-07472-6. [CrossRef]
- Yagishita S, Yagishita-Ky N, Fang F, Kyo K, Noda H (2024) Tracing the Spread of COVID-19: Analyzing Daily Time Series Data for New Cases in the Kanto Region of Japan. In: Proceedings of the 2023 Congress in Computer Science, Computer Engineering, & Applied Computing (CSCE’23), IEEE Computer Society (in press).
| 1 | |
| 2 | In R, such a distance matrix can be directly used for cluster analysis computations. |
| 3 | In R, the stepwise regression method can be implemented using the step function for linear regression models. The details of the minimum AIC method can be found in [1]. |
| 4 | The details to be explained are as follows: The data on the population and area by prefecture were obtained from the website https://uub.jp/pjn/pb20191001.html, and the population data are based on the estimated population as of October 1, 2019, published by each prefecture. The data on the perimeter length of prefectures were obtained from the Coast Statistics of the River Bureau, Ministry of Land, Infrastructure, Transport and Tourism, reflecting the situation as of March 31, 2010, and were retrieved from the website https://uub.jp/pdr/g/b.html. The data for the number of domestic airline passengers and the number of international airline passengers are from the statistics for fiscal year 2020 and were obtained from the website https://air-line.info/ranking.html. |
Figure 1.
Map of Japan with prefecture numbers
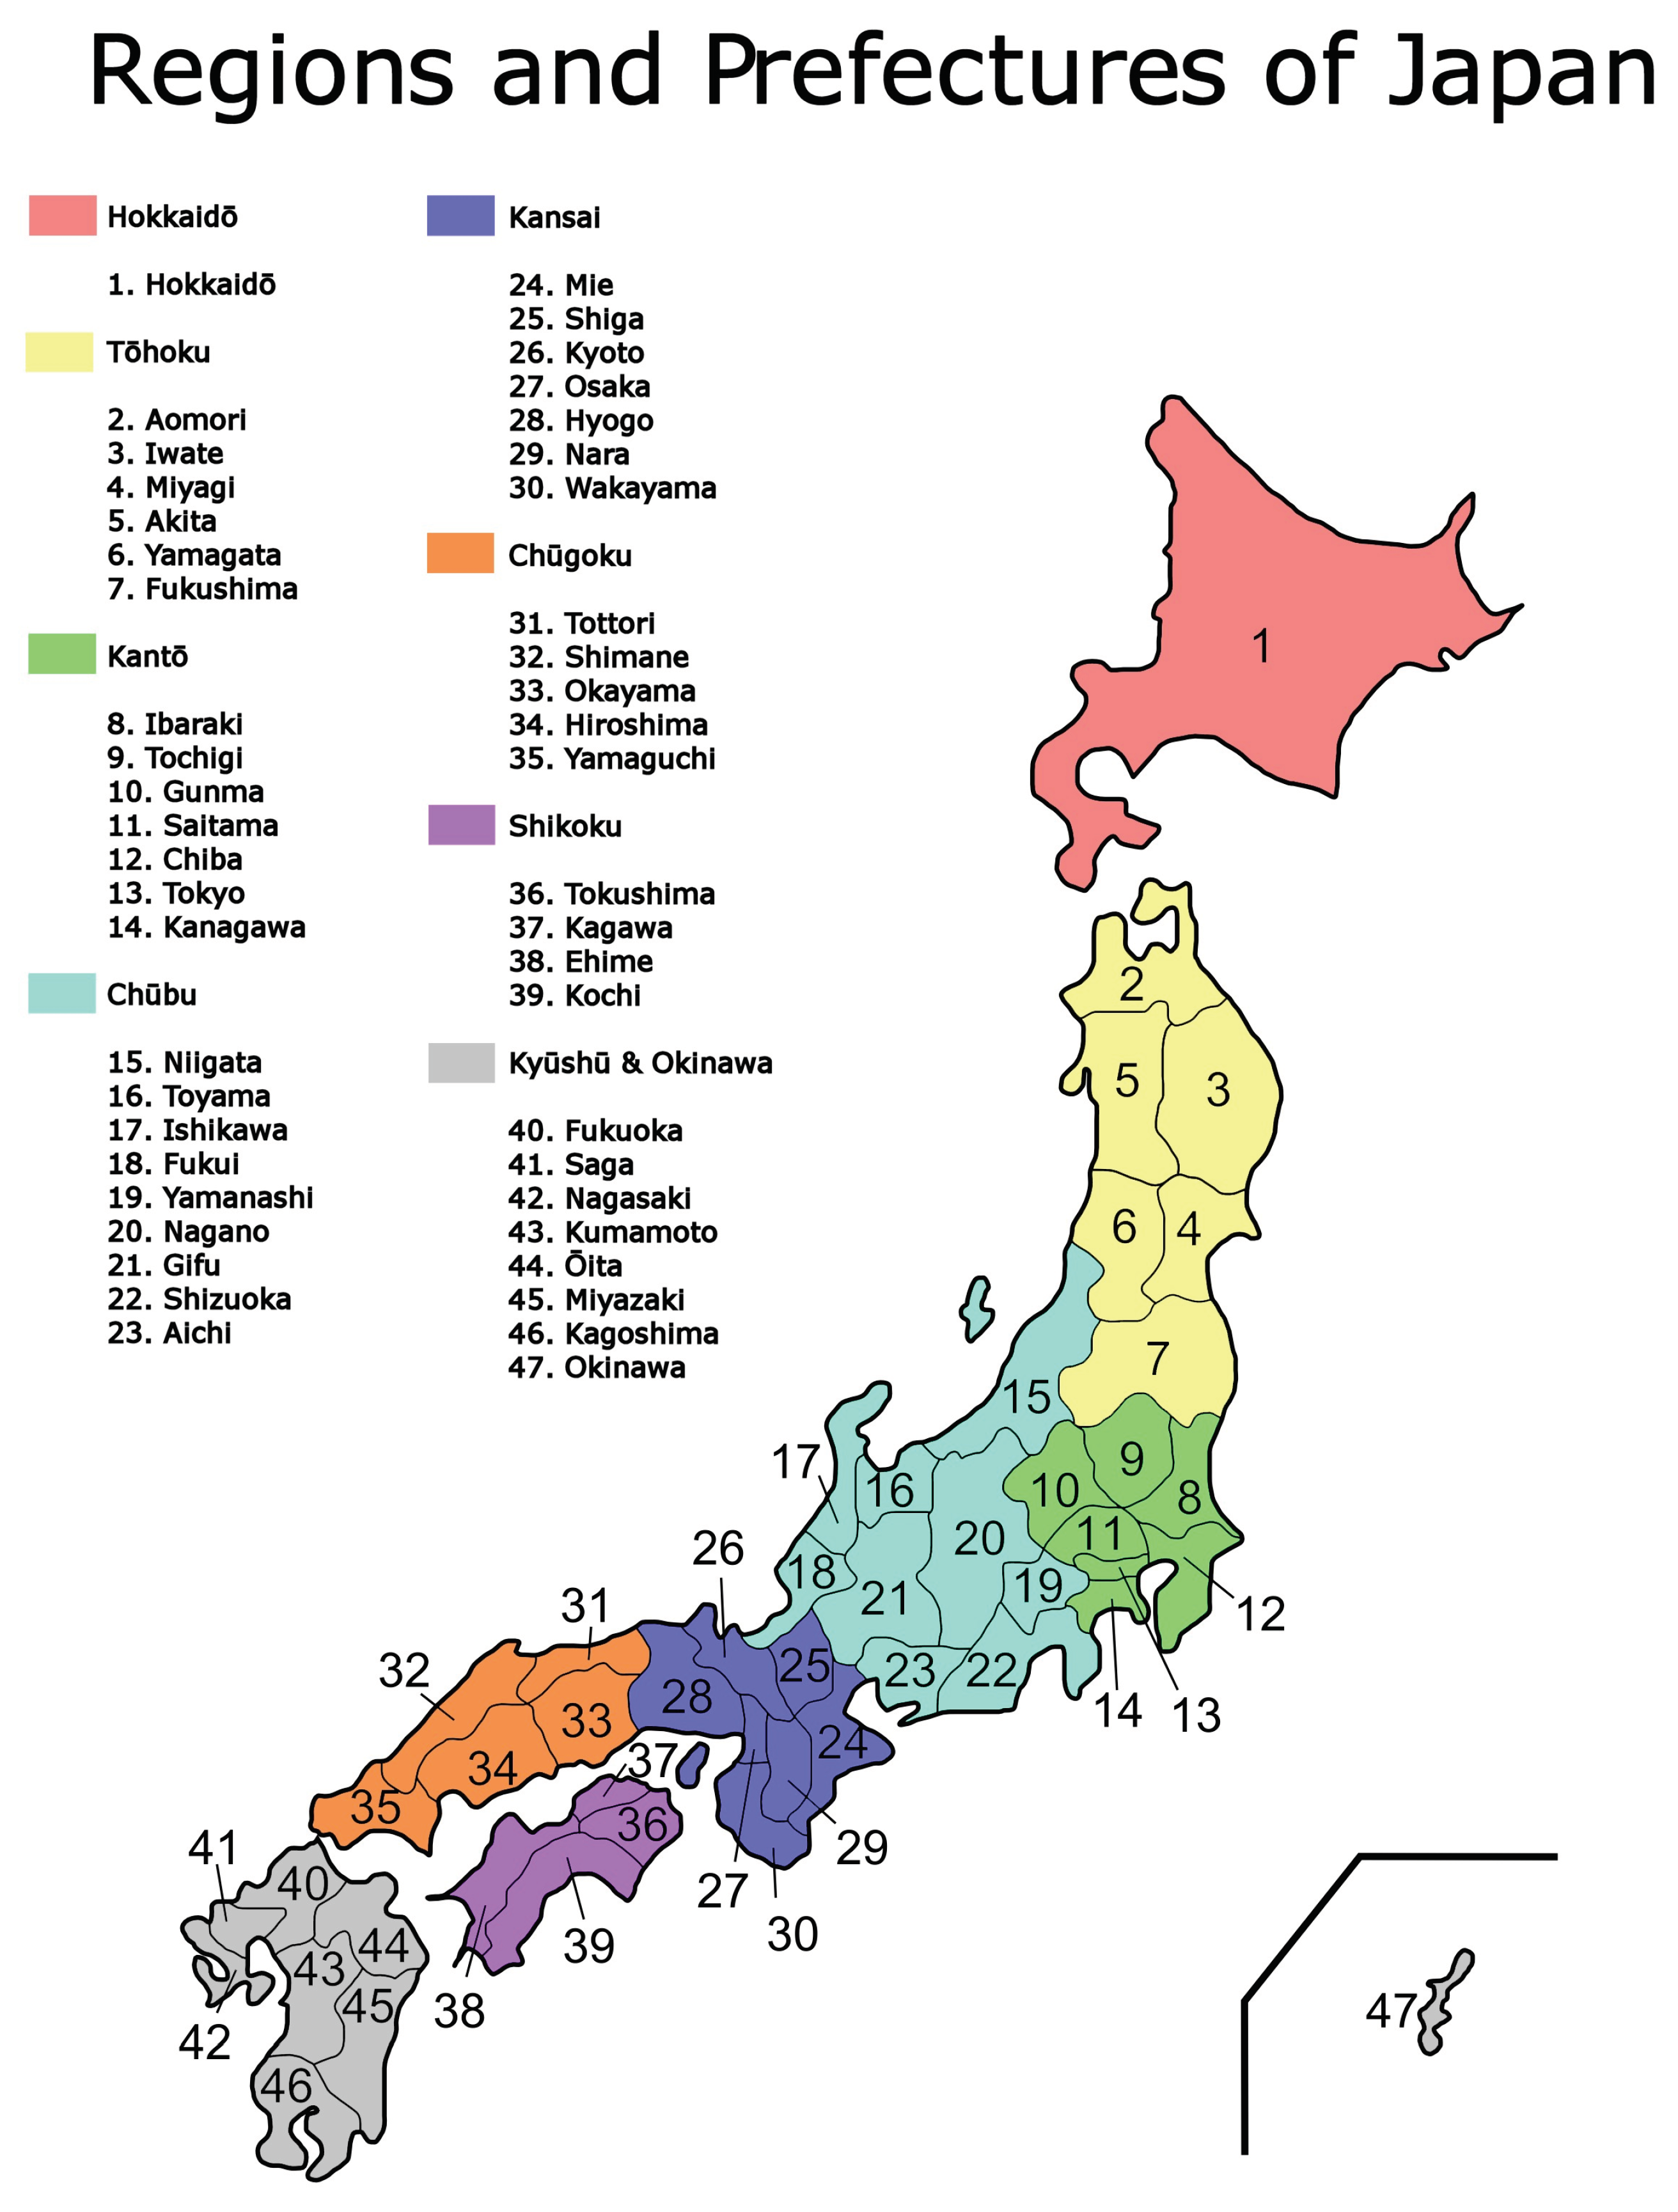
Figure 2.
Fluctuations in the number of new COVID-19 cases in Tokyo: (a) Original data (unit: persons), (b) Transformed data (dimensionless)
Figure 2.
Fluctuations in the number of new COVID-19 cases in Tokyo: (a) Original data (unit: persons), (b) Transformed data (dimensionless)
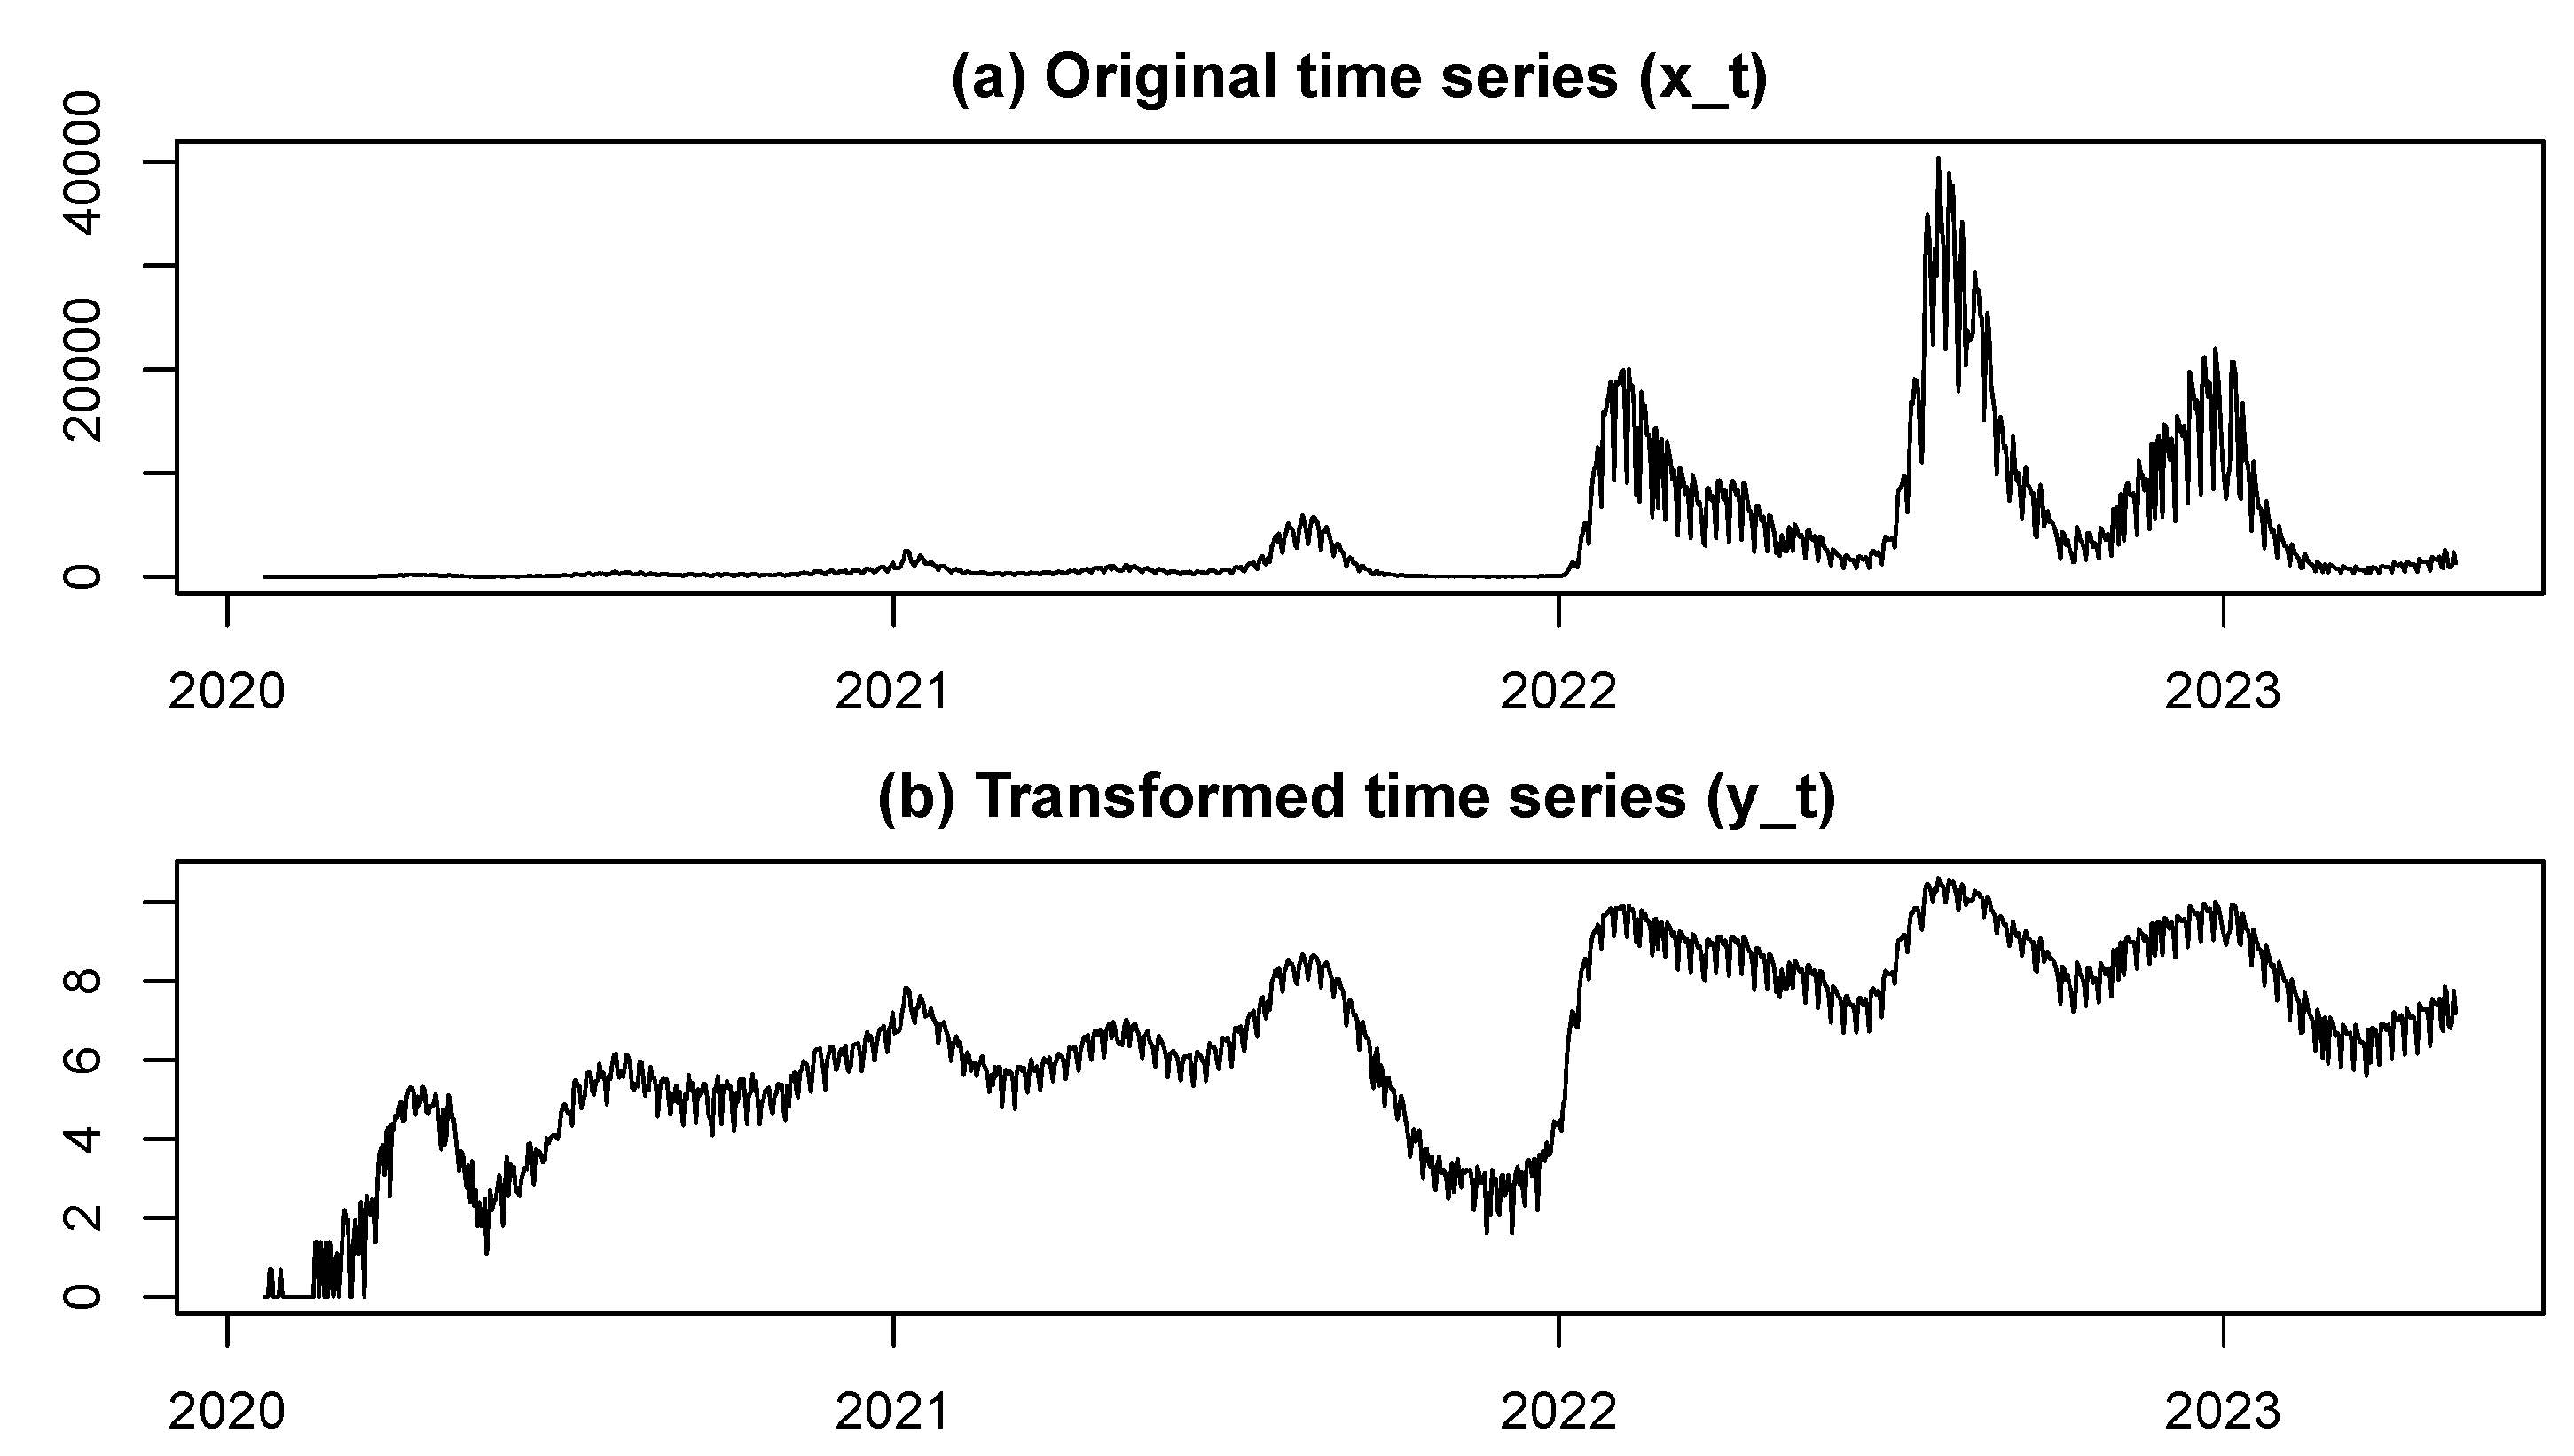
Figure 3.
Decomposition results of the transformed time series for Tokyo: (a) Trend component, (b) Weekly fluctuation component, (c) Short-term component
Figure 3.
Decomposition results of the transformed time series for Tokyo: (a) Trend component, (b) Weekly fluctuation component, (c) Short-term component
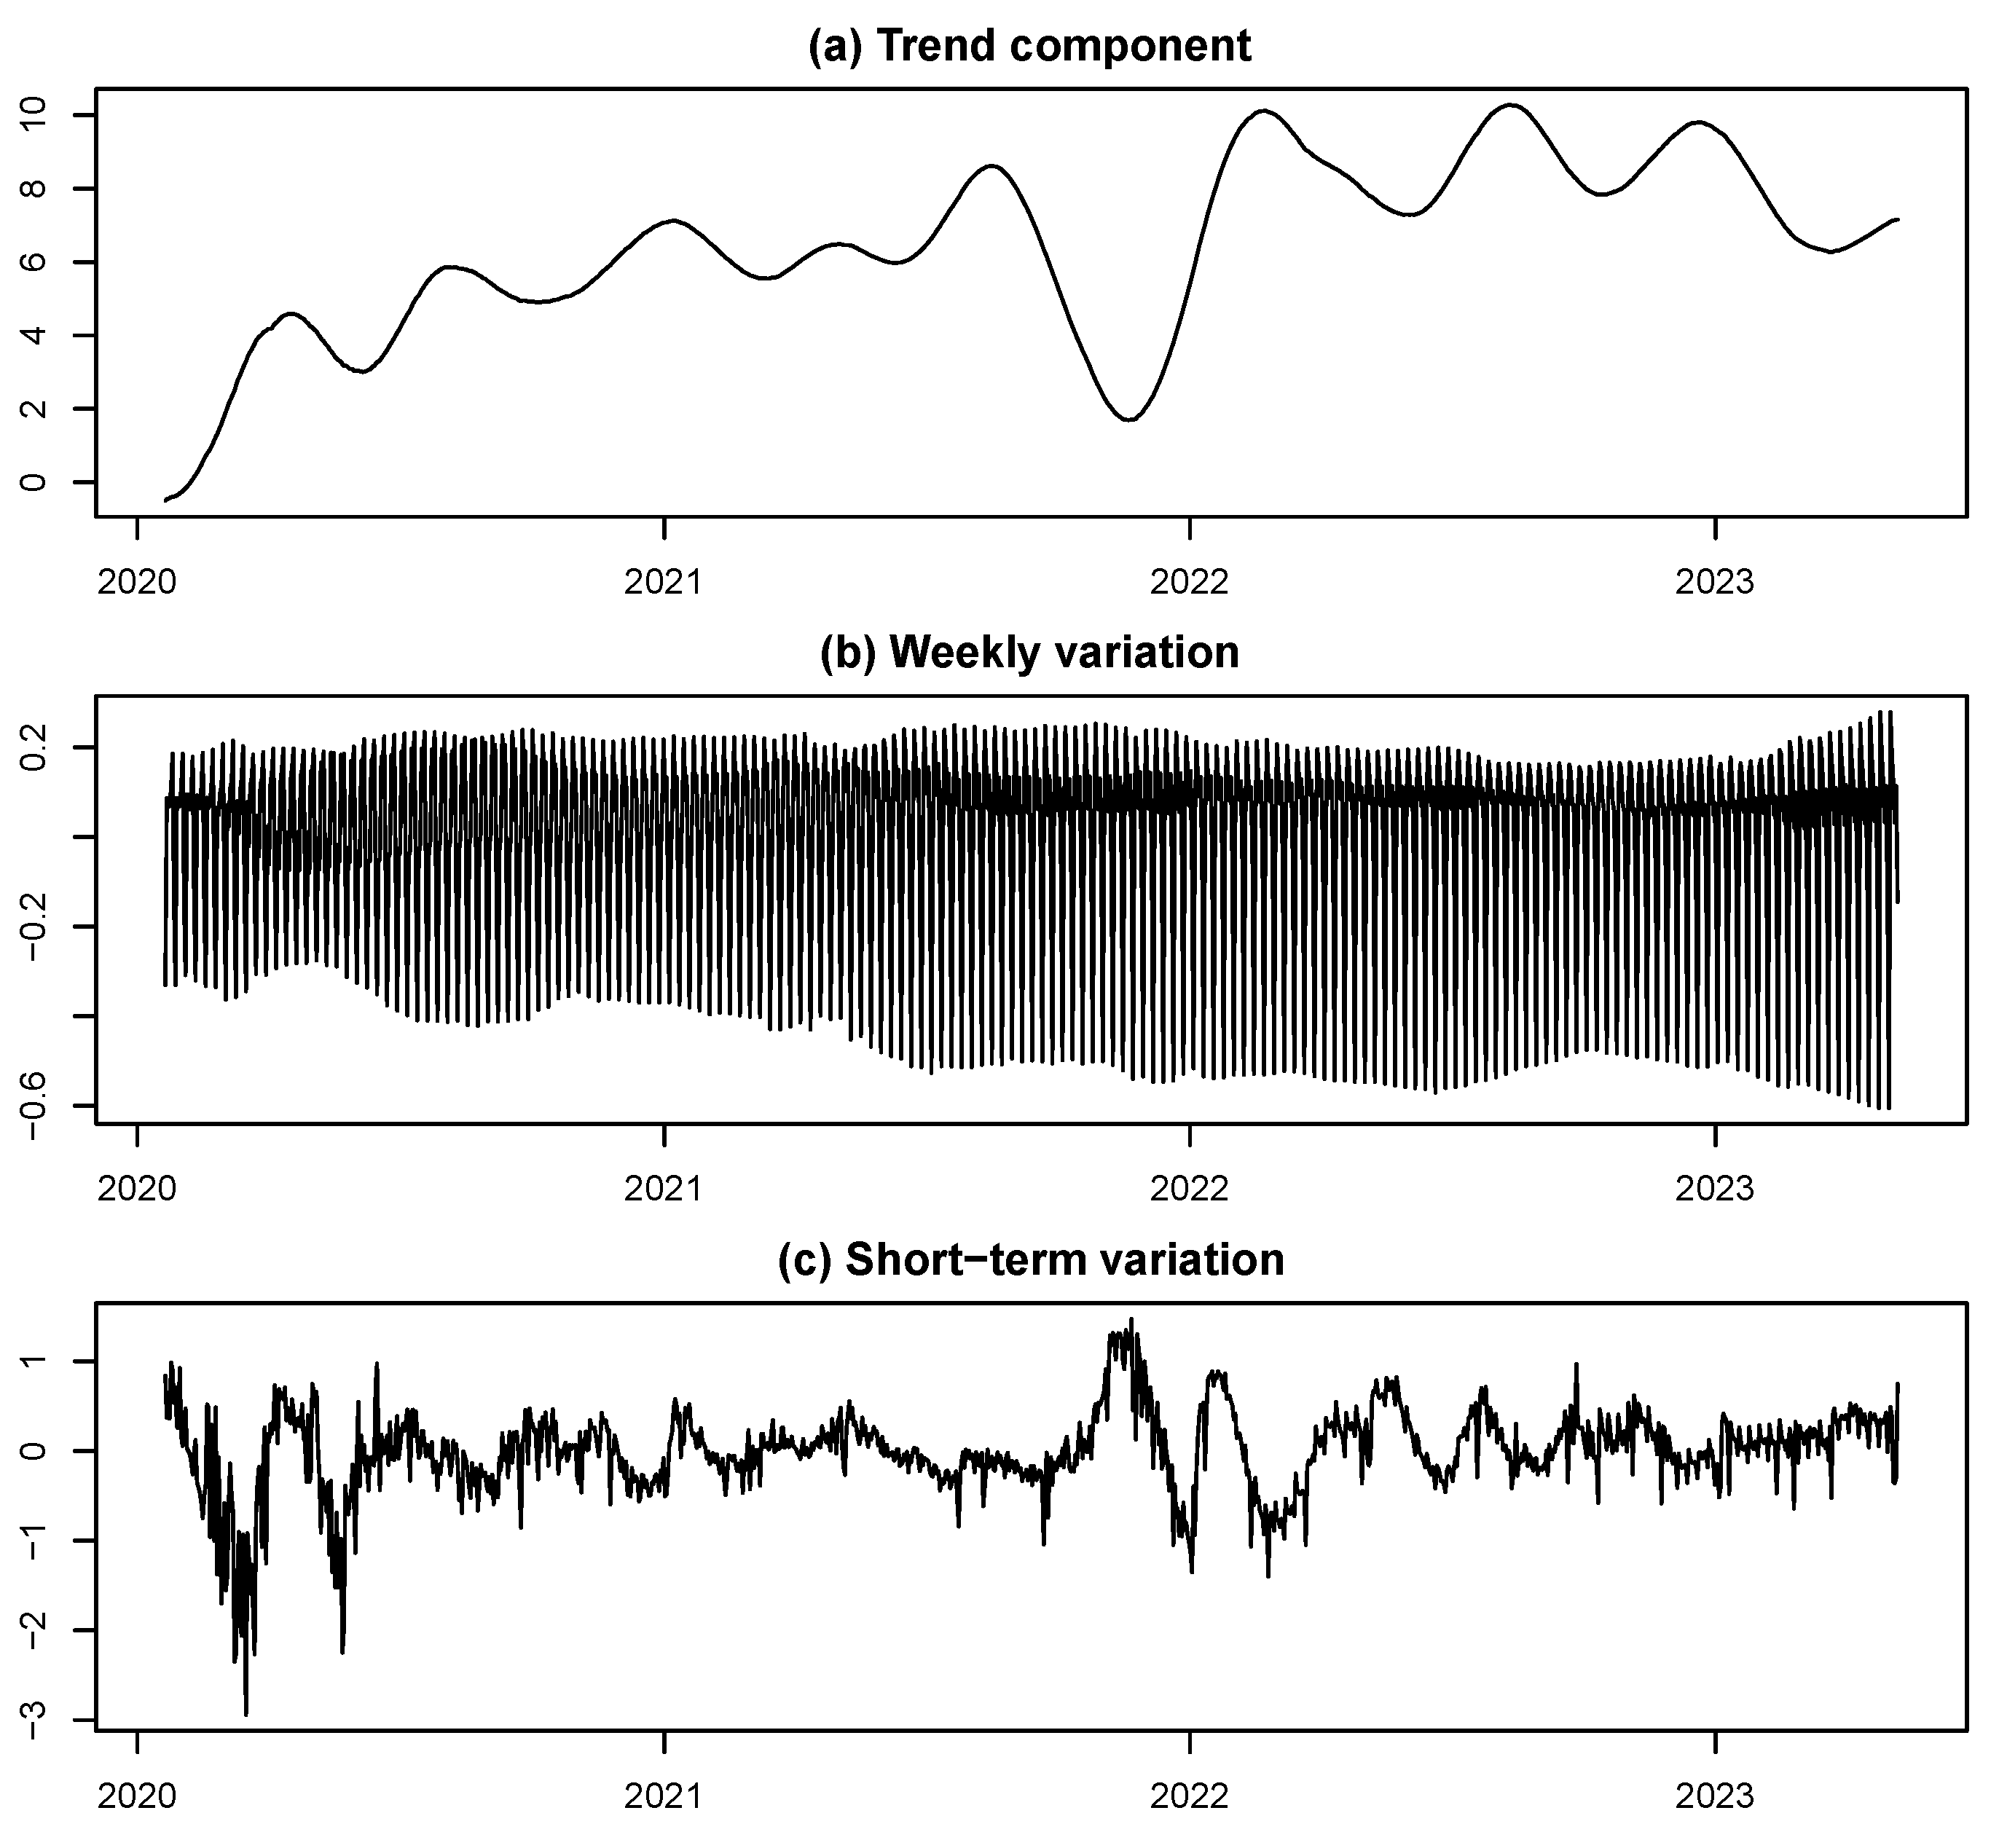
Figure 4.
Results of Cluster Analysis
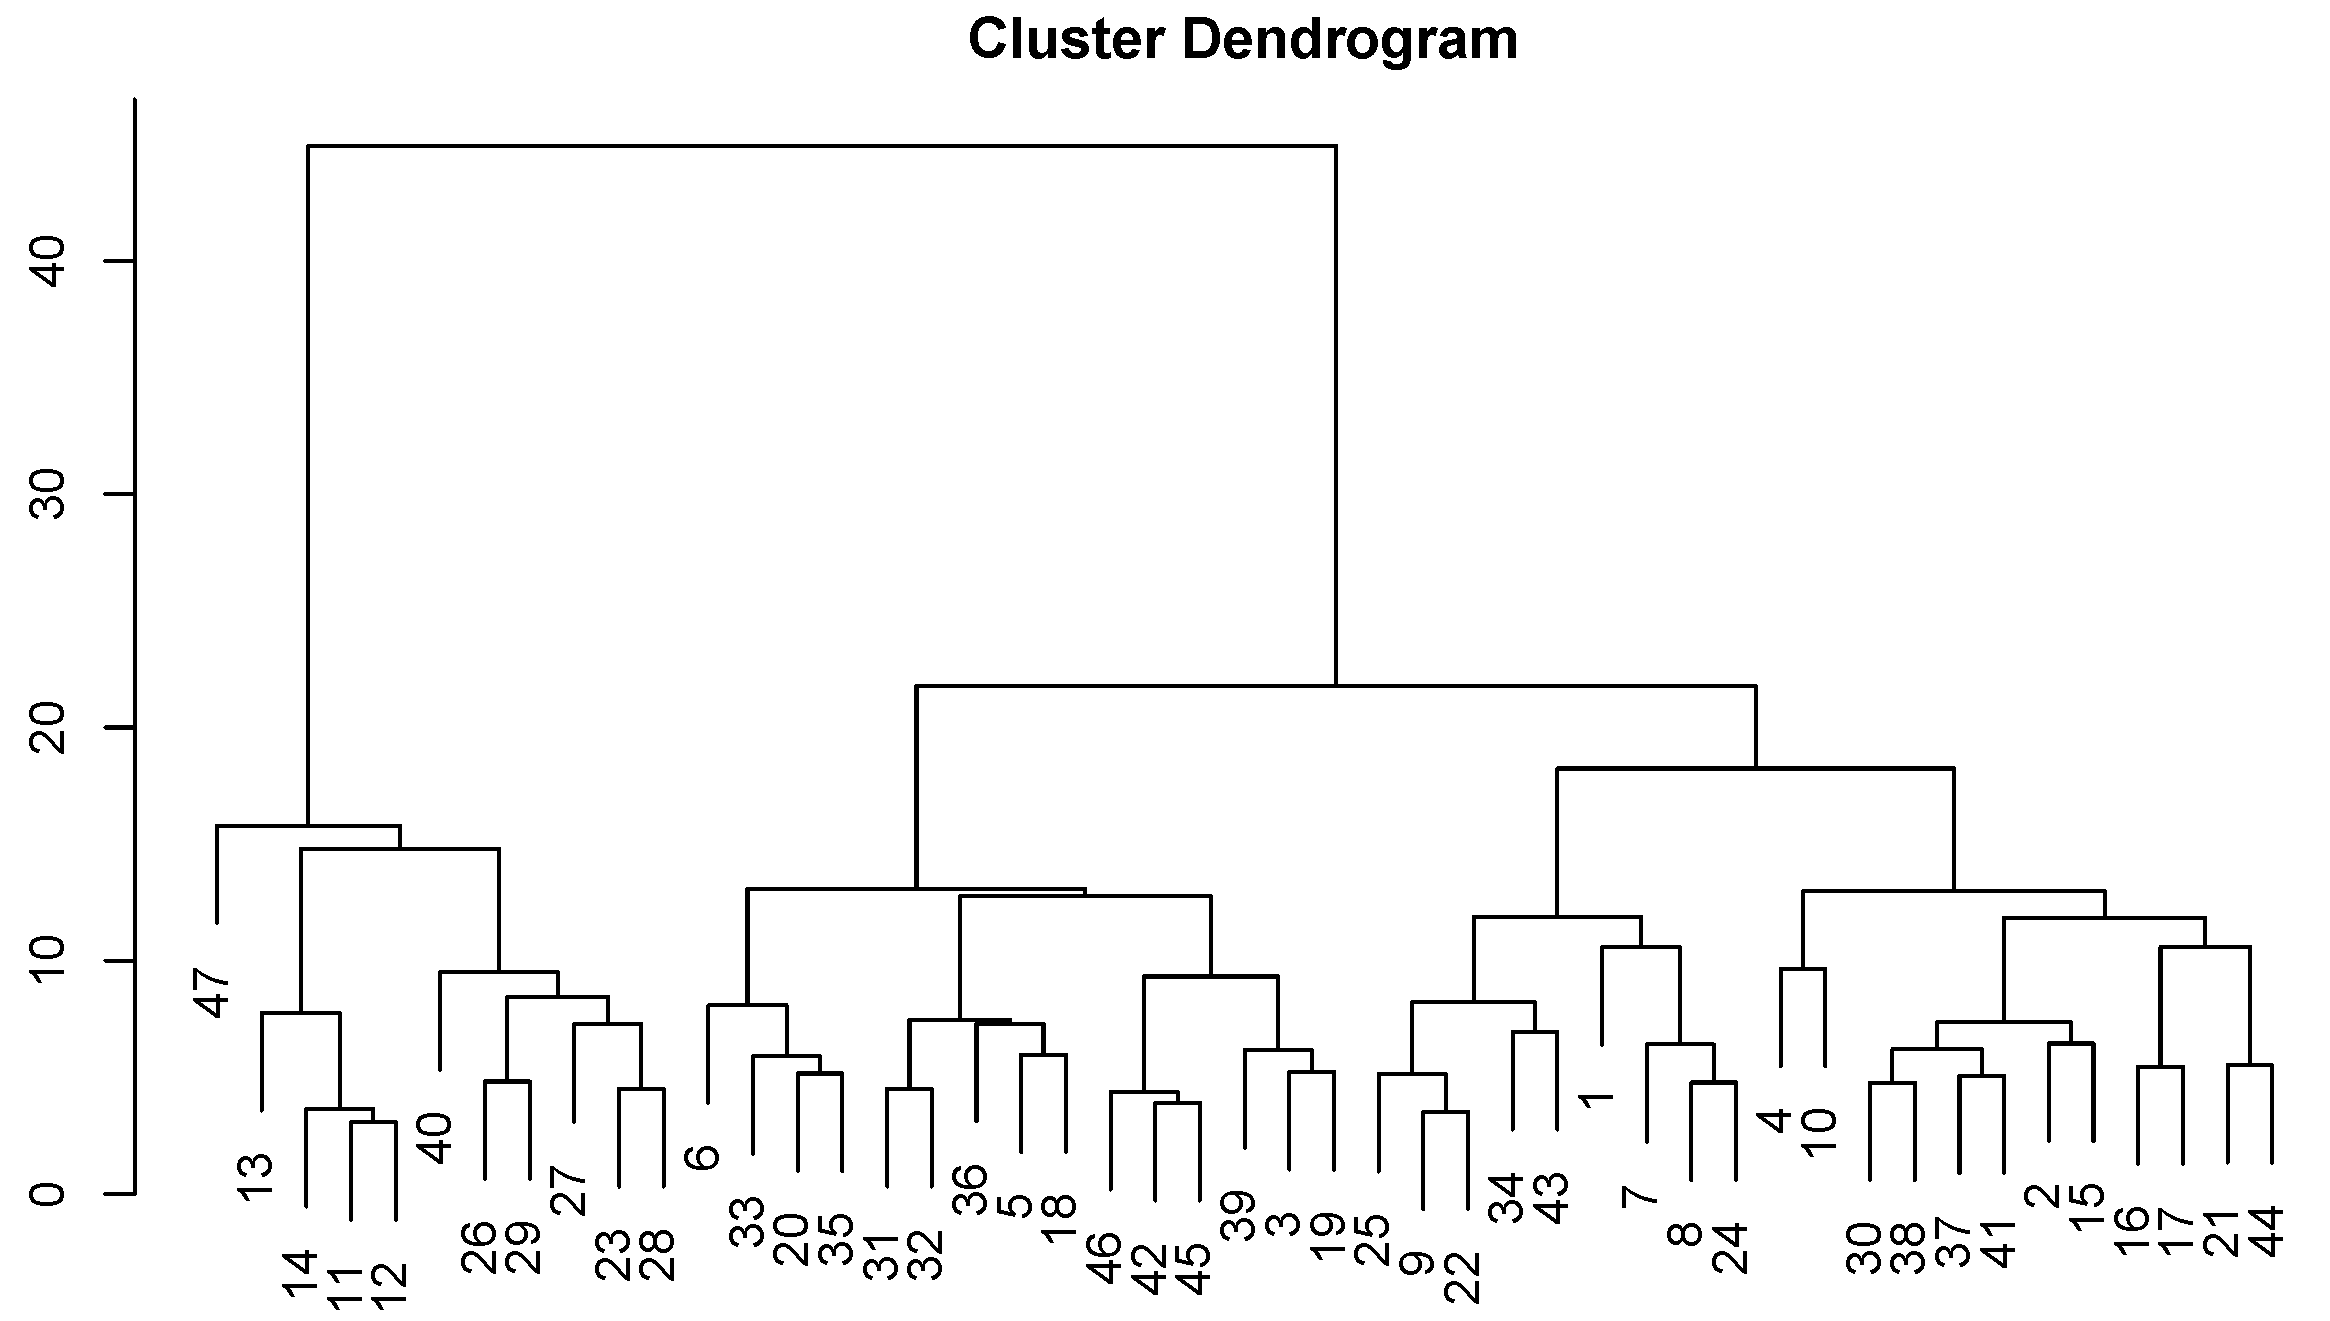
Figure 5.
Time series of the first principal component (PC) of the short-term components.
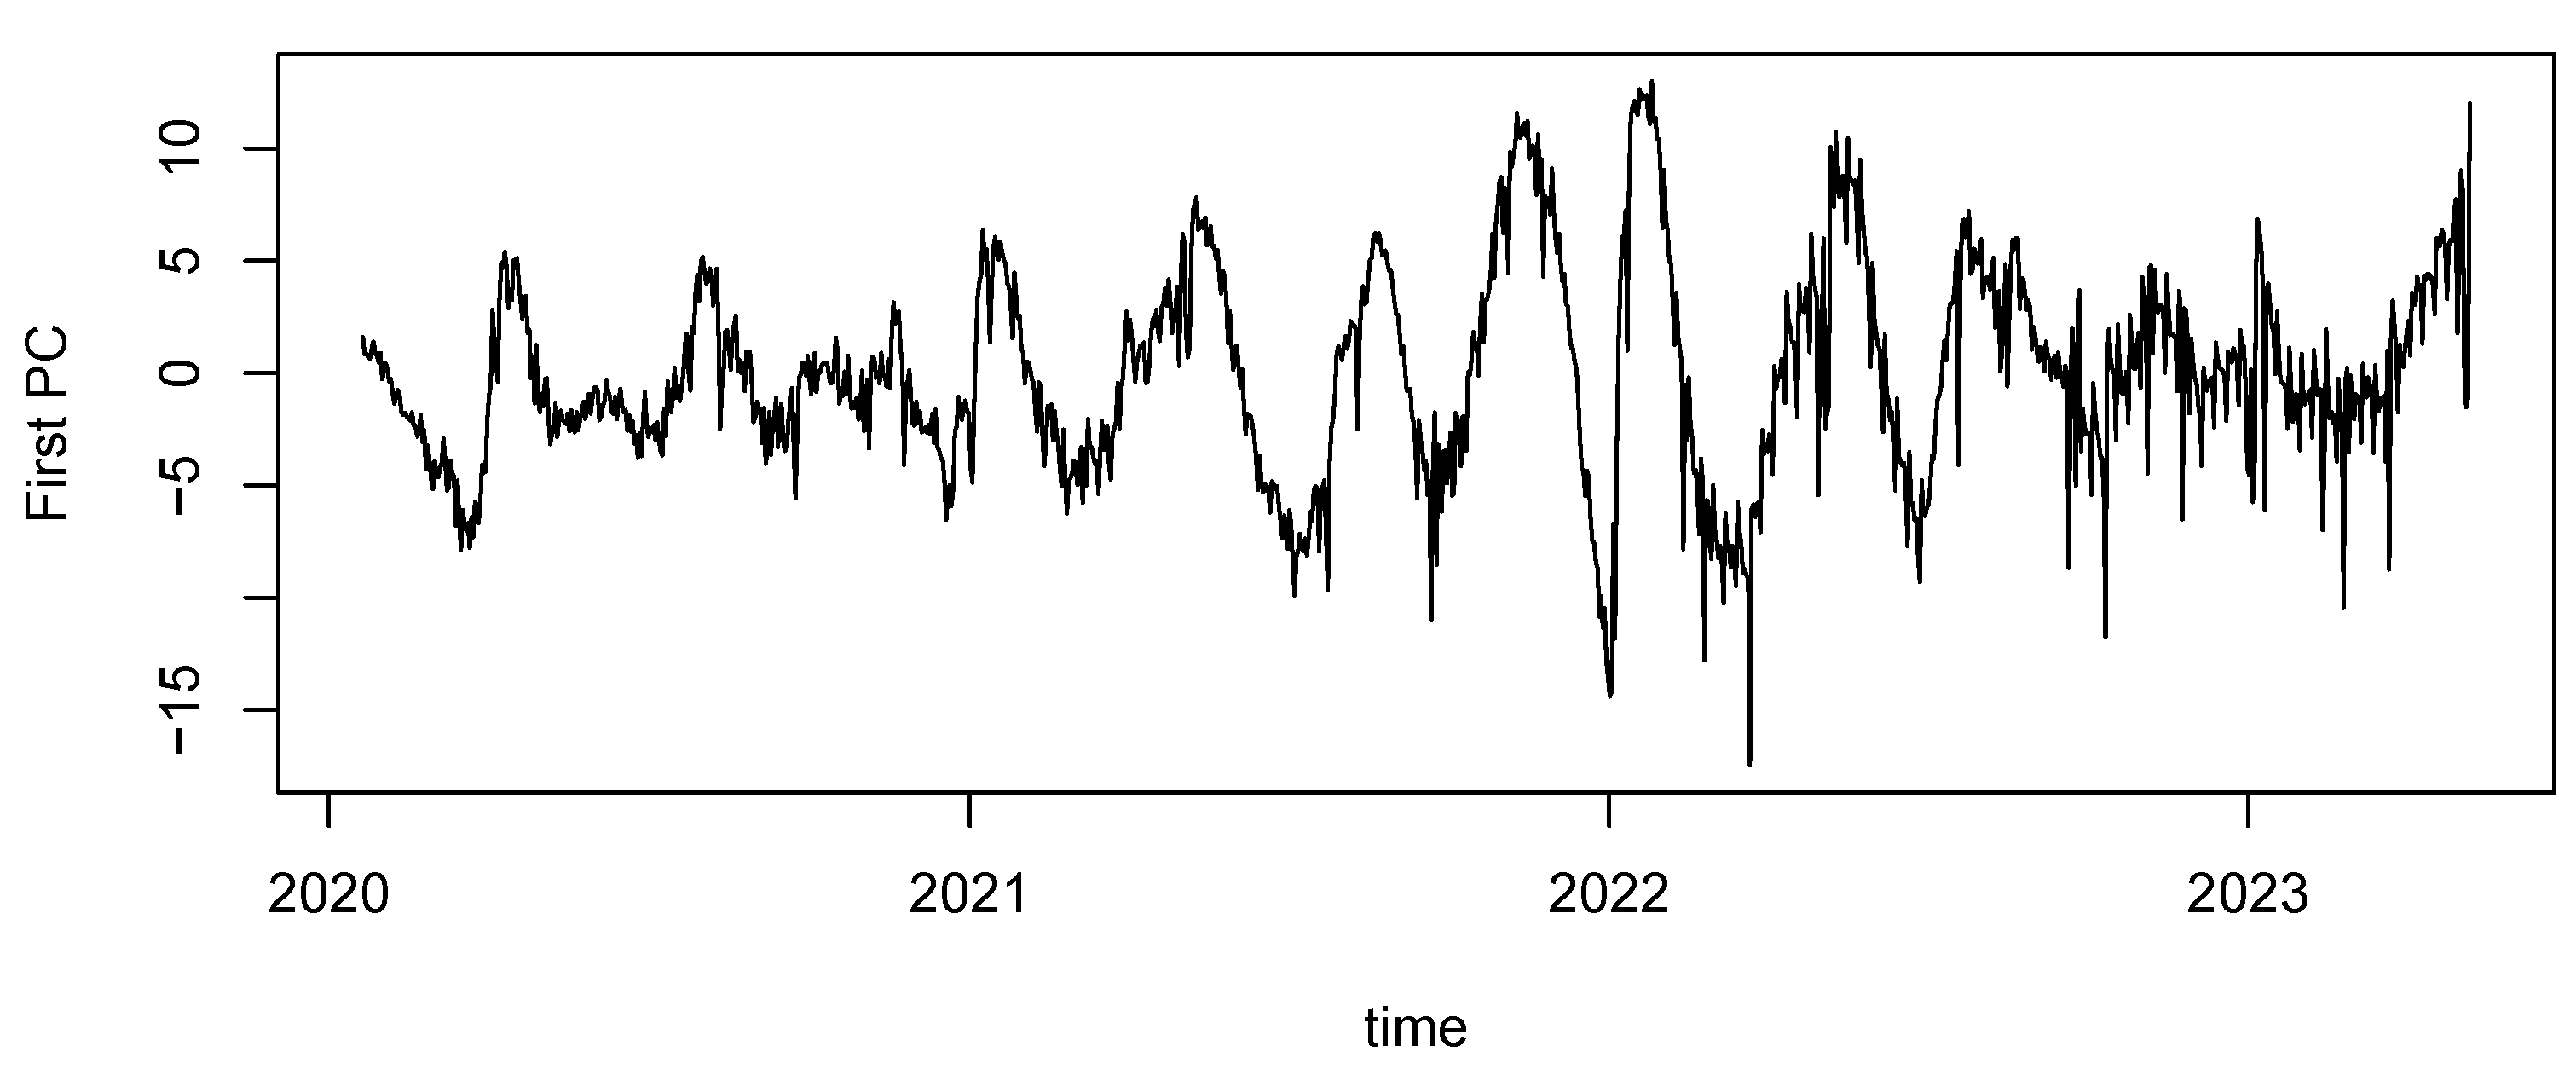

Table 1.
List of Numbers and Names of Prefectures in Japan
| No. | 1 | 2 | 3 | 4 | 5 | 6 |
|---|---|---|---|---|---|---|
| Name | Hokkaido | Aomori | Iwate | Miyagi | Akita | Yamagata |
| No. | 7 | 8 | 9 | 10 | 11 | 12 |
| Name | Fukushima | Ibaraki | Tochigi | Gunma | Saitama | Chiba |
| No. | 13 | 14 | 15 | 16 | 17 | 18 |
| Name | Tokyo | Kanagawa | Niigata | Toyama | Ishikawa | Fukui |
| No. | 19 | 20 | 21 | 22 | 23 | 24 |
| Name | Yamanashi | Nagano | Gifu | Shizuoka | Aichi | Mie |
| No. | 25 | 26 | 27 | 28 | 29 | 30 |
| Name | Shiga | Kyoto | Osaka | Hyogo | Nara | Wakayama |
| No. | 31 | 32 | 33 | 34 | 35 | 36 |
| Name | Tottori | Shimane | Okayama | Hiroshima | Yamaguchi | Tokushima |
| No. | 37 | 38 | 39 | 40 | 41 | 42 |
| Name | Kagawa | Ehime | Kochi | Fukuoka | Saga | Nagasaki |
| No. | 43 | 44 | 45 | 46 | 47 | |
| Name | Kumamoto | Oita | Miyazaki | Kagoshima | Okinawa |
Table 2.
Estimated Relative Lags for Each Prefecture
| i | 1 | 2 | 3 | 4 | 5 | 6 |
|---|---|---|---|---|---|---|
| Name | Hokkaido | Aomori | Iwate | Miyagi | Akita | Yamagata |
| -7 | -2 | -4 | -6 | 0 | -3 | |
| i | 7 | 8 | 9 | 10 | 11 | 12 |
| Name | Fukushima | Ibaraki | Tochigi | Gunma | Saitama | Chiba |
| -3 | -2 | -4 | -7 | -6 | -6 | |
| i | 13 | 14 | 15 | 16 | 17 | 18 |
| Name | Tokyo | Kanagawa | Niigata | Toyama | Ishikawa | Fukui |
| -8 | -6 | -6 | -1 | -2 | -3 | |
| i | 19 | 20 | 21 | 22 | 23 | 24 |
| Name | Yamanashi | Nagano | Gifu | Shizuoka | Aichi | Mie |
| -5 | -4 | 0 | -5 | -4 | 0 | |
| i | 25 | 26 | 27 | 28 | 29 | 30 |
| Name | Shiga | Kyoto | Osaka | Hyogo | Nara | Wakayama |
| -5 | -6 | -6 | -4 | -6 | -4 | |
| i | 31 | 32 | 33 | 34 | 35 | 36 |
| Name | Tottori | Shimane | Okayama | Hiroshima | Yamaguchi | Tokushima |
| -3 | -3 | -1 | -2 | -4 | 0 | |
| i | 37 | 38 | 39 | 40 | 41 | 42 |
| Name | Kagawa | Ehime | Kochi | Fukuoka | Saga | Nagasaki |
| -3 | -1 | -1 | -4 | -4 | -3 | |
| i | 43 | 44 | 45 | 46 | 47 | |
| Name | Kumamoto | Oita | Miyazaki | Kagoshima | Okinawa | |
| -4 | -1 | -3 | -4 | -10 |
Table 3.
Results of the covariance multiplied by 1000 (for values exceeding 2.30)
| Nos. | 12 | 13 | 14 | 21 | 23 | 26 | 27 | 28 | 29 | 40 | 44 |
|---|---|---|---|---|---|---|---|---|---|---|---|
| 10 | 2.57 | ||||||||||
| 11 | 2.49 | 2.50 | 2.34 | 2.31 | 2.57 | 2.38 | 2.85 | 2.42 | 2.30 | 2.84 | |
| 12 | 2.41 | 2.34 | 2.43 | 2.62 | 2.31 | 2.57 | |||||
| 13 | 2.34 | 2.50 | 2.67 | 2.37 | 2.71 | ||||||
| 14 | 2.37 | 2.55 | 2.57 | ||||||||
| 16 | 2.40 | 2.56 | |||||||||
| 21 | 2.61 | 2.64 | 2.38 | 2.32 | 2.82 | 2.51 | |||||
| 23 | 2.50 | 2.98 | 2.73 | 2.50 | 3.03 | 2.57 | |||||
| 26 | 2.71 | 2.38 | 2.60 | ||||||||
| 27 | 2.82 | 2.62 | 3.22 | 2.59 | |||||||
| 28 | 2.36 | 2.66 | 2.39 | ||||||||
| 29 | 2.64 | 2.33 | |||||||||
| 37 | 2.39 | ||||||||||
| 40 | 2.87 |
Table 4.
Parameter Estimation of the Model in Eq. (6)
| Variable | Constant Term | ||
|---|---|---|---|
| Coefficient | |||
| p-value |
Table 5.
Estimation Results of Holiday Effects and Seasonal Effects
| Variable | Constant Term | |||||
|---|---|---|---|---|---|---|
| Coefficient | ||||||
| p-value | ||||||
| Variable | ||||||
| Coefficient | ||||||
| p-value |
Disclaimer/Publisher’s Note: The statements, opinions and data contained in all publications are solely those of the individual author(s) and contributor(s) and not of MDPI and/or the editor(s). MDPI and/or the editor(s) disclaim responsibility for any injury to people or property resulting from any ideas, methods, instructions or products referred to in the content. |
© 2025 by the authors. Licensee MDPI, Basel, Switzerland. This article is an open access article distributed under the terms and conditions of the Creative Commons Attribution (CC BY) license (http://creativecommons.org/licenses/by/4.0/).
Copyright: This open access article is published under a Creative Commons CC BY 4.0 license, which permit the free download, distribution, and reuse, provided that the author and preprint are cited in any reuse.


