
Submitted:
31 December 2024
Posted:
06 January 2025
You are already at the latest version
Abstract
The biochemistry and physiology of the raw material, the metabolism of microorganisms, the methods used for processing and storage can affect the stability of wines. Due to the antimicrobial action of sulfur dioxide and dimethyl dicarbonate, the aim of the study is to determine the optimal treatment protocol to maintain physico-chemical and microbiological stability of white wines with high residual sugar. Thus, the present research focuses on analyzing the influence of both treatments, combined or separate, on 45 wine samples obtained from a blend of Muscat Ottonel and Fetească regală grape varieties, where different doses of 6% aqueous SO2 solution (40, 80, and 160 mg/L) and dimethyl bicarbonate (0, 100, and 200 mg/L) were used. In order to assess the ability of dimethyl dicarbonate to suppress microorganisms, varying concentrations of Brettanomyces bruxellensis and Schizosaccharomyces pombe yeasts were inoculated (0, 30, 100 cfu/mL wine). The results indicate that, while sulfur dioxide cannot be entirely substituted in wines, both treatments can effectively lower or inhibit the activity of spoilage microorganisms. For the wines' physicochemical and microbiological stability, the treatment that used the synergistic force of sulfur dioxide (160 mg/L) and dimethyl dicarbonate (200 mg/L wine) performed the best.
Keywords:
preservation
; antioxidants
; stability
; wine quality
; wine microbiology
1. Introduction
Wines’ quality is strongly affected by a variety of chemical and biological processes that occur within its complex system [1]. In order to produce a high-quality wine, a series of conditioning and stabilization procedures must be applied to preserve the product's distinctive color, taste, and flavors [2]. Several chemical, physical, thermal or non-thermal procedures can be applied to assure microbiological stability [3]. To fulfil the demands of modern consumers, winemaking techniques and oenological products have been adapted to improve the physical, chemical, sensory, and microbiological parameters of wine [4]. However, sulphur dioxide is still the most efficient in ensuring antioxidasic [5,6,7] and antiseptic activity in wine [8,9]. Three distinct mechanisms allow SO2 to function as an anti-oxidative: direct oxygen removal, an interaction with hydrogen peroxide, and the reduction of quinones produced during the oxidation process [10,11] The antiseptic action involves biological and microbiological stability in musts and wines [12] and can be significantly influenced by the grapes’ phytosanitary condition, yeast load, temperature, pH value and chemical composition of the media (concentration of aldehydes relative to alcohol) [13].
Throughout history, sulphur dioxide has been used for preserving various food products and beverages (such as fruit juices or wines). SO2 efficacy is highly dependent on pH value and can impact products sensory characteristics. However, because sulphur dioxide’s links to consumer allergic reactions, there is an increasing desire to find alternatives for SO2 reduction [14]. As such, alternative treatments, products, processes have been used in addition to sulphur dioxide in order to reduce its concentration [15]. Thermal and non-thermal processes such as high hydrostatic pressure (HHP), pulsed electric field (PEF), ultraviolet irradiation (UV-C), ultrasound (HPU) or chemical additives such as dimethyl dicarbonate, lysozyme, ascorbic acid, NaOCl (sodium hypochlorite), chitosan, colloidal silver complex (CSC) have been tested to prevent spoilage caused by microorganisms or faulty biochemical processes during fermentation or in storage [3,16]. Still, at present, SO2 cannot be fully removed from the wine-making process, as the above-mentioned products and methods may not always be able to fully ensure protection from a microbiological perspective [17].
Dimethyl dicarbonate (C4H6O5) is frequently used as an inhibitor of pathogenic microorganisms in beverages. Although it was first tested for the fruit juice industry [18] recent studies have attempted to use this product as a preventative against microbiological activity in wines [15,19,20]. In general, it has been used when bottling wines with high levels of residual sugar. The use of this additive in wines with more than 5 g/L residual sugar at bottling has been authorized within viticultural countries of the European Union (Regulation (EC) No 643/2006) at a maximum dosage of 200 mg/L [17]. Dimethyl dicarbonate (DMDC) is recognized as an inhibitor against harmful microorganisms such as Brettanomyces bruxellensis or other spoilage microorganisms when the treatment with sulphur dioxide is not recommended, as the microorganisms may enhance their resistance to treatment [21]. When added to wine, dimethyl dicarbonate hydrolyzes to produce methanol and carbon dioxide, hence raising the methanol content [22]. Stafford et al. [23] confirm that 96 mg/L of methanol may be produced when using the maximum amount of dimethyl dicarbonate (200 mg/L). But since dimethyl dicarbonate will also react with other substances in wine, it can be anticipated that fewer than 96 mg/L of methanol will be produced.
The International Organisation of Vine and Wine (OIV), the World Health Organization (WHO), the Food and Agriculture Organisation (FAO), and the Food Chemical Codex have established legislative guidelines and recommendations that must be followed when using antioxidants and antiseptics such as sulphur dioxide and dimethyl dicarbonate in beverage technology. According to Stoeckley et al. [24] and OIV regulations [25] for semidry, demi-sweet and sweet or special red, white, rosé wines, the maximum allowed threshold of SO2 content is 300 mg/L. According to dimethyl dicarbonate suppliers [26], the typical dosage for wine is between 125 and a maximum of 200 mg/L. According to international regulations in force, it can only be utilized only before bottling [27].
Numerous yeast species play a crucial role in winemaking due to their impact on both the chemical and sensory composition of wine, contributing both beneficial and detrimental effects, and thus requiring careful attention [28]. Schizosaccharomyces pombe has the ability to grow in environments with low content in water, as it is an osmophilic yeast [29] and therefore thrives in high sugar environments [30]. The yeast acts by converting malic acid into alcohol and carbon dioxide. It has many disadvantages, such as a slow fermentation rate, development of undesirable aromas or the ability to produce refermentation in wines with residual sugar [29]. In addition, this species can also progress in very low pH environments and over a wide temperature range. Also, it is not affected by food preservatives such as sulphur dioxide or benzoic acid [31].
In oenology, Brettanomyces bruxellensis has been considered to be the one of the most harmful yeast [32]. Numerous investigations have demonstrated the significant phenotypic diversity of Brettanomyces bruxellensis in terms of growth capacity [33], sugar metabolism [34], consumption of nitrogen sources, production of volatile phenols [35,36], sensitivity to pH, temperature, oxygen [37] and sulphur dioxide [38,39]. Due to its morphological variability, Brettanomyces bruxellensis spoiling potential is difficult to anticipate, being an significant challenge for winemakers. Certain chemicals, like volatile phenols, are known to be produced by Brettanomyces bruxellensis and are linked to disagreeable smells that are typically referred to as "barnyard" or "horse sweat" [40]. A variety of sensorial descriptors have been employed to describe wines fouled by Brettanomyces sp., however there is a wide range of sensory interpretations when comparing wines, juices, and other alcoholic [39] or non-alcoholic beverages. Additionally, species belonging to this genus may add disagreeable scents that are characterized as medicinal, smoky, spicy, wet wool, phenolic, and/or mousey, which can decrease the sensory quality of the finished product [36,41].
The purpose of this study is to monitor the influence of varying doses of sulphur dioxide and dimethyl dicarbonate on the quality of white wines. A blend from two local grape varieties (Muscat Ottonel and Fetească regală) with a high residual sugar content was used, allowing the study of alternative methods of semi-sweet wines stabilization. The novelty of this study lies in the fact that, to the best of the authors’ knowledge, there are no existing studies that investigate the use of wines obtained from the above-mentioned blend in combination with DMDC treatments. Additionally, while DMDC is frequently employed in juice production, its application in winemaking remains relatively unmapped. By integrating different SO₂ doses with DMDC under specific experimental conditions – including higher inoculum levels of pathogenic yeasts [14] – this study addresses a significant gap in the literature and explores dimethyl dicarbonate potential in maintaining microbiological stability in semi-sweet wines.
The treatments were applied under different experimental conditions: three doses of SO2 coupled with DMDC and various inoculum of pathogenic yeasts. In Europe, the product can be added to wines that have at least 5 g/L of sugar just before bottling. By demonstrating its practical application in semi-sweet wines with fermentable sugars, this study provides a valuable guideline for winemakers aiming to address microbial instability caused by pathogenic yeasts. Moreover, it highlights an alternative approach to combine SO₂ and DMDC, aligning with consumer preferences and regulatory requirements.
2. Materials and Methods
2.1. Grape varieties and winemaking
The experimental variants (V1-V45), presented in Table 1 were obtained from Muscat Ottonel and Fetească regală grapes, manually harvested at full ripeness from Iași-Copou vineyard (at 47°10′ north latitudes and 27°35′ east longitudes, Romania) and processed according to a general white wine technology. After harvest, destemming, crushing, and pressing the varieties together, the combined must was transferred to stainless steel tanks for the fermentation phase. The sugars concentration of the must was 264 g/L and titrable acidity was 5.72 g/L tartaric acid. Endozym® Ice, a liquid enzyme product, was used in concentrations of 4 mL/hL must to maximize the extraction of varietal flavors and to clarify the must. Fermentation was conducted at 10 °C and lasted 14 days, using Saccharomyces yeast from Sodinal®, as indicated on the package. The resulting wine registered a concentration 26 g/L of residual sugars. The wine was then inoculated with different concentrations of Brettanomyces bruxellensis and Schizossacharomyces pombe yeasts (30, 100 ufc/mL). Following this procedure, the wine was separated into three aliquots and various concentrations of 6% aqueous solution of sulphur dioxide (40, 80, and 160 mg/L) were added.
Wine samples were filtered via sterile filters with 0.2 µm porosity. Various concentrations of dimethyl dicarbonate (100 or 200 mg/L) were added, as can be seen in Table 1. The bottles were kept for 6 months in a temperature-controlled environment, at 12 °C.
2.2. Reagents and standards
In this study, volatile compounds acetaldehyde and methanol were utilized. The solutions were purchased from Merck KGaA (Darmstadt, Germany) and had a concentration of minimum 99.9%. Ethanol was used for the solubilization of compound standards, it was purchased from Merck KGaA (Darmstadt, Germany) and had 99.9% purity. Purified water was produced in-house with a Thermo Scientific™ GenPure™ UV-TOC system and used for preparation of a 10% (v/v) solution of ethanol in water.
2.3. Standard physicochemical parameters
Physicochemical characterization of wine samples was established in accordance with the analysis techniques indicated by International Organization of Vine and Wine (OIV) [25]. The following parameters were analysed: alcoholic strength (% vol. alc.); total acidity (g/L tartaric acid), volatile acidity (g/L acetic acid), free and total SO2 (mg/L) using titrimetric measurements; pH and density (instrumental measurements); residual sugar (g/L) using Luff-Schoorl assay. The wine samples and the analyses were evaluated in triplicate and standard deviations were calculated.
2.4. Microbiological protocol
The microbiological experiment involved the following steps: preparing the nutrient media, inoculating the yeast strains in/on nutrient media, multiplying the yeast, adapting the yeast to the experiment's wine concentration, reaching the ideal yeast concentration for inoculation into the wine, and finally performing a microscopic analysis of the wine. A counting chamber Neubauer and a Gerber colony reader (Funke Gerber ColonyStar) was used to determine the yeast concentration (CFU/mL), following standard methodology.
2.4.1. Experimental protocol for yeast strains' growth conditions
In accordance with the experimental protocol of ©LANXESS Deutschland, Germany, the yeasts utilized in the experiments, Schizosaccharomyces pombe and Brettanomyces bruxellensis, were propagated through inoculation on solid media, MEA (malt extract agar) and YMA (yeast malt agar) from Scharlau (Scharlab S.L., Barcelona, Spain), as well in liquid nutritive media, sterilized must and malt extract.
Pour plating is required to ascertain the cell titer from the end wine culture. Consequently, we generated serial dilutions from the final colony and inoculated them onto either malt extract agar or nutritional agar. The plates were incubated at 28 °C until they exhibited characteristics indicative of optimal cell growth.
For final culture, the cell titer has to be determined by pour plating. Therefore, we derived serial dilutions from the final culture and subsequently inoculated them onto nutrient agar or malt extract agar. Plates were incubated at 28 °C until optimal cellular proliferation was observed. The cell titer of the wine-adapted culture is determined by enumerating the colonies. Simultaneously, the final culture from the preceding phase was chilled to inhibit proliferation until the cells had proliferated on the agar plates. After determining the cell titer of the final culture, the ideal quantity necessary to achieve the requisite final colony titer for dimethyl dicarbonate (DMDC) tests was estimated.
2.4.2. Evaluation of yeast concentration
The concentration of yeast cells per milliliter of wine was determined using the dilution factor and a hemocytometer slide. Each species necessitated a yeast concentration of 30 CFU/mL and 100 CFU/mL, which were delivered in three aliquots to the examined wine.
2.5. Quantification of volatile compounds
The analysis was performed on a gas chromatograph with flame ionization detector GC-FID, Agilent 7890B from Agilent Technologies equipped with a GC sampler 80 with head-space technology. A chromatographic column with a length of 50 m, an internal diameter of 0.32 mm and a film thickness of 0.50 μm (Phenomenex Zebron FFAP GC) was employed for separation of compounds. For head space injector, incubation temperature was maintained at 85°C for 15 minutes, while the syringe temperature was of 87°C. A volume of 1,5 mL was injected in the split/splitless injector, which operated at a split-ratio 2:1, at 250 °C as is described by Macoviciuc et al. [42], and Cotea et al. [43].
2.6. Colour measurements
Chromatic parameters were analysed according to the OIV recommended [25] method using attributes of visual perception: chromaticity, tonality, clarity, brightness, and saturation, as was defined by Dumitriu et al. [44].
A Specord UV-VIS spectrophotometer SPECORD® PC 200/205/210/ 250 Analytik Jena AG was used to assess the chromatic properties. The color differences are specified by the CIELab system, which defines a homogeneous 3-dimensional space defined by colorimetric coordinates L*, a*, and b*. The vertical axis denoted by L* was measured from 0 - totally opaque, to 100 - completely transparent. The parameters "+a*" red, "-a*" green, "+b*" yellow, and "-b" blue were registered.
2.7. Sensory analyses
The experimental wines were subject to a sensory analysis which closely followed the guidelines provided by ISO3591:1997 [45], ISO8589:2010 [46] and the OIV legislation. Aromatic descriptors were generated based on the sensory experiences of the authors, based on the flavors present in Fetească regală and Muscat Ottonel varieties during a distinct pre-tasting session, that took place a day before the official evaluations.
The experimental samples were assessed by a professional panel of 20 tasters, 13 men and 7 women. The panel was comprised of winemakers, lab employees, and researchers. Panel members were trained prior to the sensory analysis stage, as to evaluate wines with faults correlated to refermentations. The panel members classified the intensity (from 0- absence to 5- intense) of aroma descriptors like honey, white flowers, overripe fruits, peach, and exotic fruits, the same descriptors that were decided the day before.
The tasting session began in the morning to ensure a better comprehension of the evaluated descriptions, and a wine temperature of 12 °C was used to evaluate the samples. The tasting session was carried out on three different days (15 samples per day) in order to reduce taste fatigue. Similarly, the same team of tasters analyzed the samples under the same conditions.
The samples were coded and stored in transparent white wine glasses. The tasting started with the samples with the lowest doses of SO2 and DMDC, V1-V15, 40 mg/L SO2 and 0, 100, 200 mg/L DMDC, followed by V16-V30, 80 mg/L SO2 and 0, 100, 200 mg/L DMDC and ended with the samples obtained by using the highest treatment doses, 160 mg/L SO2 and 0, 100, 200 mg/L DMDC. This allowed the tasters to evaluate the samples, unknowingly, from the most affected by the refermentation yeasts to the least spoiled.
The tasters were given information about the applied treatments and that the samples contained alcohol. A tasting sheet was generated using Google forms. Each taster received a link for each sample. At the end, the data were automatically processed using the answers given by each taster, after which the results were interpreted on a heat map. The mean value of the sensory analysis results is presented as a key value on this study.
2.8. Statistical analyses
With the help of XLStat (Luminevo, Denver, CO, USA), ANOVA test was conducted. The analysis of variance exposes the presence of significant differences regarding the physico-chemical and chromatic parameters (p<0.05) between the samples. The analysis includes only a single main factor (Variants) for data simplification and does not account for interactions. Additionally, the influence of dimethyl dicarbonate dosage on the main physico-chemical characteristics, chromatic parameters, methanol and acetaldehyde concentrations was made by linear regression analysis. Also, a heatmap was created to help with the sensory characteristics' better visualization. In that sense, an online platform was used (http://www.heatmapper.ca/expression).
3. Results and discussion
3.1. Physico-chemical parameters
Physico-chemical parameters were analyzed 6 months after bottling to detect the effects of dimethyl dicarbonate and sulphur dioxide treatments, results presented in Table 2. When all samples were analysed, it significant differences (p<0.05) were observed for the majority of parameters, except for density and pH. It is obvious that different doses of sulur dioxide and dimethyl dicarbonate significantly affect the physical-chemical quality of the analyzed samples.
The total acidity of grapes normally ranges from 5 to 16 g/L, while lower values of about 5 to 7 g/L of tartaric acid are observed in wine [47]. There are several factors that can influence this parameter, such as grape variety, ripeness, technological, storage conditions and climatic conditions [48]. The total acidity of the analyzed samples ranged from 4.74 to 6.43 g/L of tartaric acid across the variants, following the limits established by the current legislation. From Figure 1, it can be observed that in samples treated with lowest concentration of SO2 (40 mg/L) the results its statistically significant. The total acidity fluctuated between 5.80-6.43 g/L, which might relate to its role in stabilizing wine. It can be concluded that the small concentration of SO2 it not enough to preserve this type of semi-sweet wines. Also, these variations on chemical composition can influence the perceived acidity. On the other side, dimethyl dicarbonate shows a weaker and statistically insignificant effect.
Volatile acidity refers to the total content of volatile acids removed from wine by steam distillation. Acetic acid accounts for 95-99% of the total volatile acidity, with the remainder consisting of small amounts of lactic acid, propionic acid, butyric acid, and formic acid. Volatile acidity is an important parameter in assessing the quality and health of wine [49]. The values recorded in this study ranged from 0.13-0.39 g/L acetic acid and were also within the legal limit of 1.08 g/L acetic acid in wine [50].
pH is an important parameter in winemaking and is closely related to wine stability. The ideal pH level in wines is between 3.2 and 3.6. In general, if wine has a high acidity level, it will have a low pH. Wines with high acidity and low pH are considered stable; therefore, the growth of bacteria and other microorganisms is inhibited in this type of environment. The samples analyzed fall within this range, with values between 3.17 (V4, V42) and 3.47 (V15).
Alcohol content of is considered one of winemaking’s most important parameters, as it representing the result of the fermentation of sugars in must, which can cause significant changes in wine quality [50]. The analyzed variants showed variations in values ranging from 14.3-15.2% vol. alc. in V1-V30, consistent with the initial sugar content of the raw materials used (264 g/L sugars in must). Samples V1-V30 experienced fluctuations of alcoholic strength, likely due to yeasts activity in semi-sweet wines. It seems that the treatment schemes administered (with 40, 80 mg/L SO2 with or without DMDC) were not sufficient to ensure physio-chemical stability in the samples studied. In contrast, the variants V31-V45 were the most stable, the alcohol concentration values being similar 14.10-14.30% vol. alc. The interaction between SO2 and dimethyl dicarbonate in this case favored the physicochemical stability of wines. According to Figure 1, SO2 manifests a significantly negative influence on wine’s alcoholic strength, while dimethyl dicarbonate has no significant impact on the dependent variable.
The analyzed samples show a sugar concentration above 18.50 g/L (V18) in samples where the SO2 and DMDC treatment was deficient and of 22.00 g/L (V4) in variants where the combined behavior of the used products led to the inactivation of yeasts. The biological instability of wines is closely related to the higher content of sugars that could lead to refermentations [49]. As observed in Figure 1(d), SO2 treatment has a significant effect on microbiological stability of wines with residual sugar, a pattern also observed in other research [40,42]. Dimethyl dicarbonate, despite its chemical use in beverages stabilization, does not show the same influence over residual sugar in this case. The same effect of the combined treatments is confirmed by the volatile acidity in Figure 1(c), as the acetic acid concentration is kept under control and there is no microbial spoilage.
The SO2 concentrations registered differences between the analyzed groups. For the group V1-V15 (40 mg/L SO2), values of 10 or 11 mg/L of free SO2 and 39 or 40 mg/L of total SO2 were registered. For the group of samples treated with 80 mg/L SO2 and dimethyl dicarbonate (V16-V30) the values were 31 mg/L for free SO2 and 79 mg/L of total SO2. For the third group, V31-V45, treated with 160 mg/L SO2 the values were 95 mg/L of free SO2 and 159 mg/L of total SO2. It can be seen that there were minor fluctuations in the values for the first group (V1-V15), while no variations were observed in the other two groups, indicating that the samples were physico-chemically balanced. This aspect emphasizes that there were no major differences between the initial doses applied in the experiment and the values obtained from the analysis. According to Gallego et al. [51], Delfini et al. [52] and Lisanti et al. [53] it can be observed that the action of dimethyl dicarbonate and sulphur dioxide on chemical composition of wines offer stability and conservation.
In this study, the application of sulphur dioxide and dimethyl dicarbonate did not yield any notable variations among the studied variants, suggesting that both treatments are effective in maintaining wine stability. In opposition, the variants without dimethyl dicarbonate showed a slight physicochemical instability. The results indicate that 160 mg/L SO₂ in combination with dimethyl dicarbonate contribute to maintaining wine stability results found also by Costa et al. [54] and Divol et al. [55].
3.2. Colour measurements
Wine color parameters are key factors in assessing wine quality being influenced by factors such as grape variety, pH, temperature, different oenological treatments applied pre- or post-fermentation, certain physico-chemical processes, and applied winemaking technology, etc. The ANOVA test results for the selected variables (L*, a*, b*) show significant differences (p<0.05) between samples. It can be observed that SO2, dimethyl dicarbonate concentrations and inoculated yeasts have a major impact on wine’s chromatic parameters.
From Table 3, it is observed that samples V1-V15 have a high degree of oxidation, with wine colors showing brownish shades, indicating that the treatment with 40 mg/L SO2 was insufficient for long-term antioxidative protection. For the chromatic indicator L*, there is a considerable increase in value with higher concentrations of sulphur dioxide and dimethyl dicarbonate (from 60 with 40 mg/L SO2 to 99 with 160 mg/L SO2). In the case of a* indicator, the values were much lower in samples treated with higher amounts of SO2 (from 9.00 in the first group to -0.50 in the 160 mg/L SO2 group) indicating good stability provided by SO2 and dimethyl dicarbonate treatments. For the b* parameter, the average values decreased from 33.00 in the 40 mg/L SO2 group to 5.00 in the 160 mg/L SO2 group. Others samples showed high clarity values, such as 96.50 (V19) and 97.10 (V22) for samples treated with 80 mg/L SO2 with and without dimethyl dicarbonate. Samples treated with 160 mg/L SO2 with and without dimethyl dicarbonate, had similar values ranging from 98.00 to 98.60.
The results show a significant chromatic difference between samples treated with 40/80 mg/L SO2 and dimethyl dicarbonate and those treated with 160 mg/L SO2 and dimethyl dicarbonate. This confirms the hypothesis that the treatments administered can contribute to the color stabilization of wines results confirmed also by Santos et al. [17].
The color parameters indicated that the highest dose of SO2 (160 mg/L) and dimethyl dicarbonate provided the white wines with stability and antioxidative protection. Similar results were confirmed by Santos et al. [17] and Delfini et al. [52]. So, this treatment scheme is a good alternative for producing quality wines. From Figure 2, SO2 has a strong and statistically significant effect on luminosity. These results suggest that higher levels of sulfur dioxide are associated with brighter wine samples. This could be due to its antioxidative effects, which may impact the optical properties of the wine.
Dimethyl dicarbonate, on the other hand, does not significantly influence luminosity, implying its role in the wine samples is unrelated to this characteristic. The results from linear regression suggest that higher levels of sulfur dioxide reduce the values of the red component of the CIELab system. This could be due to its role in preventing oxidation. Dimethyl dicarbonate does not have a significant influence on the red-green axis of wine color, indicating that its role does not affect this specific color parameter.
3.3. Microbiological results
From a technological standpoint, the inactivation of microbes by treatments is a significant topic for oenologists in wine production and has been the focus of various studies. This study utilized Schizosaccharomyces pombe and Brettanomyces bruxellensis yeasts to demonstrate strain-specific resistance based on the treatments administered to the wines. In the samples treated with 40 mg SO2/L, both with and without dimethyl dicarbonate (samples V1-V15), Schizosaccharomyces pombe and Brettanomyces bruxellensis were identified, irrespective of the dimethyl dicarbonate dosage applied.
In Figure 3 are presented some microscopic aspects and measurements of the studied yeasts.
Bacterial species from the lactic acid bacteria group, exhibiting spherical (cocci) and cylindrical (bacilli) morphological features, were identified. The wine displayed sediment at the bottle's base, color alterations (oxidation), and noticeable CO2 production due to pathogenic refermentation.
Yeast species introduced as inoculum were found in samples treated with 80 mg/L SO2, both with 100 mg/L dimethyl dicarbonate and without it (samples V16-V30). The wine was transparent, although the presence of CO2 was apparent. This outcome can be associated with the inoculum of Schizosaccharomyces and Brettanomyces yeasts, as the lower treatment levels are inadequate to guarantee the wines' optimal shelf-life.
Conversely, in samples subjected to the maximum quantity of sulfur dioxide (160 mg/L) and any of the two doses of dimethyl dicarbonate, no yeasts or other microbes were detected. The wine had the characteristic hue of its originating types, manifesting as a transparent, straw-yellow liquid, with no evidence of refermentation observed. This results from the synergistic interaction between sulfur dioxide and dimethyl dicarbonate, validating their capacity to suppress microorganisms as indicated by Ough [18] and Divol et al. [55]. In samples with 160 mg/L SO2 and no DMDC, some colonies of yeasts were identified in Petri plates. In this case, treatments with DMDC proved important to assure microbiological stabilization even if sulphur dioxide was administered in high concentrations.
The data indicate that sulfur dioxide and dimethyl dicarbonate function synergistically and merit additional research to enhance the microbiological and antioxidative stability of wines (Figure 4), corroborating results reported by Costa et al. [54].
Nonetheless, it was shown that samples exposed to the lowest quantities of SO2 (40 and 80 mg/L) failed to provide enough protection, as indicated by sedimentation, turbidity, and refermentation. In contrast, elevating the content of dimethyl dicarbonate enhanced the wine's color and clarity, removing sediment and preventing refermentation. Comparable findings were also reported by Costa et al. [54]. In his research, the optimal dose of dimethyl dicarbonate to prevent the growth of 500 CFU/ml inocula of Schizosaccharomyces pombe, Dekkera bruxellensis, Saccharomyces cerevisiae, and Pichia guilliermondii was determined to be 100 mg/L without SO2 treatment.
Dimethyl dicarbonate is an efficient antimicrobial against a broad spectrum of microorganisms, particularly yeasts, although its efficacy is diminished against bacteria responsible for wine contamination, as corroborated by Divol et al. [55] and Renouf et al. [56]. To enhance its efficacy and reduce the necessity for elevated concentrations, the chemical is often utilized with other preservation techniques, such as sulfur dioxide (SO2).
3.4. Volatile compounds
The main volatile compounds of interest for this study were acetaldehyde and methanol represented in Figure 5 and Figure 6.
Ethanal, or acetaldehyde, is a volatile carbonyl molecule that can be produced by wine oxidation or yeast activity during biological processes [57]. Increased levels of ethanal are also correlated with an increase in ethanol content, as observed in the case of samples V16-V30. Ethanol can be oxidized by acetic acid bacteria and yeasts to produce acetaldehyde. It is thought to be a by-product of alcoholic fermentation, even the amount produced by different yeasts species. Yeasts' production of acetaldehyde can be affected by oxygen and SO2. According to Osborne et al. [58], it plays a big part in the flavor, color, and stability of wine. In accordance with Griffith et al. [59], the substance is unstable and can react with amino acids to form unwanted taste compounds. Smaller concentrations of acetaldehyde can result in fruity or nutty flavors and herbaceous (green grass) notes in freshly fermented wine [60]. However, excess acetaldehyde at concentrations above 125 mg/L causes changes, irritation, and unpleasant smells in wines [61,62,63,64].
Samples treated with 40 mg/L SO2 and without dimethyl dicarbonate had acetaldehyde values ranging from 4.58 mg/L (V4) to 6.6 mg/L (V13). When treated with 40 mg/L SO2 and 100 mg/L dimethyl dicarbonate, levels ranged from 4.37 mg/L (V2) to 12.27 mg/L (V14). Those preserved with 40 mg/L SO₂ and 200 mg/L dimethyl dicarbonate had values from 4.53 mg/L (V6) to 6.12 mg/L (V15).
Variants with 80 mg/L SO2 and no dimethyl dicarbonate presented 18.49 mg/L (V25) - 27.44 mg/L (V28) of acetaldehyde. When 100 mg/L of dimethyl dicarbonate were added, a range between 14.63 mg/L (V20) and 27.63 mg/L (V23) was observed. Samples treated with 200 mg/L dimethyl dicarbonate presented 13.01 mg/L (V21) - 25.21 mg/L (V30) of acetaldehyde. Wines obtained after the addition of 160 mg/L SO2 showed 7.48 mg/L (V34) - 11.29 mg/L (V40) levels of the mentioned compound.
Wines treated with the same amount of SO2 and also 100 mg/L dimethyl dicarbonate recorded values ranging from 6.25 mg/L (V38) to 11.11 mg/L (V35) of ethanal. Those treated with the same amount of SO2 but with 200 mg/L dimethyl dicarbonate had values ranging from 7.18 mg/L (V44) to 13.23 mg/L (V45). The samples treated with different concentrations of SO₂ (40, 80, or 160 mg/L) with or without dimethyl dicarbonate, showed the lowest acetaldehyde levels.
Methyl pectinesterases, which naturally occur in fruit, break down pectins to produce methanol before and during alcoholic fermentation. Methanol production can increase during maceration, especially in red wines compared to rosé or white wines. The International Organization of Vine and Wine (OIV) sets strict limits on methanol levels in wines: < 400 mg/L for red wines and < 250 mg/L for white or rosé wines [25]. The amounts of methanol in wine depend on several factors, such as grape variety [6], grape health, fermentation temperature, maceration treatment and different treatments applied in the winemaking process [67]. In the analyzed samples, increased methanol content is attributed to the hydrolysis of dimethyl dicarbonate (DMDC) into methanol and carbon dioxide results confirmed also by Ough et al. [18] and Stafford et al. [23].
Samples treated with 40 mg/L SO2 and without dimethyl dicarbonate recorded the minimum methanol content (52.11 mg/L) in V7, and a maximum value (76.97 mg/L) in V13. On the other hand, samples treated with 100 mg/L dimethyl dicarbonate had the lowest value of 93.44 mg/L (V20) and the highest value of 121.09 mg/L(V14). Those treated with 200 mg/L dimethyl dicarbonate presented between 115.87 mg/L (V12) and 160.2 mg/L (V40) of methanol. For the treatment with 80 mg/L SO2 and without dimethyl dicarbonate, the samples contained from 51.07 mg/L (V25) to 64.52 mg/L (V28) of methanol. The variants with the addition of 100 mg/L dimethyl dicarbonate contained values between 92.43 mg/L (V20) and 102.02 mg/L (V23).
Wines treated with 40 mg/L SO2 and 200 mg/L dimethyl dicarbonate had methanol content ranging from 95.93 mg/L (V21) to 155.71 mg/L (V30). The administration of 160 mg/L SO2 and 100 mg/L dimethyl dicarbonate produced 69.64 mg/L methanol (V44) and 100.95 mg/L (V41). In contrast, adding 200 mg/L dimethyl dicarbonate led to an increase in methanol content from 119.75 mg/L (V36) to 148.82 mg/L methanol (V39). This increasing trend in methanol concentrations due to the hydrolysis of dimethyl dicarbonate into methanol and carbon dioxide is also confirmed by Santos et al. [17] and Lisanti et al. [53]. However, the resulting concentrations are within the legislative limit for white wines, which is 250 mg/L methanol [25]. Therefore, the analyzed samples are balanced and not hazardous to consumer health. The additional methanol resulting from DMDC as a food additive used within regulations does not represent a significantly higher risk than the hazard from the methanol naturally produced and from its normal occurrence in foods [68,69].
To evaluate the impact of SO2 and dimethyl dicarbonate doses, linear regression was applied (Figure 7). The results highlighted that 82% of the variability of the methanol and only 1% of the variability of the acetaldehyde (dependent variables) are explained by SO2 and DMDC doses (explanatory variables).
From Figure 7, due to the larger absolute values of standardized coefficients indicate a stronger effect of DMDC dose on methanol concentrations (r=0,900). Acetaldehyde is not significantly affected by these treatments. This figure displays the standardized coefficient from a linear regression model predicting methanol and acetaldehyde concentrations in the analysed wines. The coefficient indicates the change in these compound levels (in standard deviations) for a one standard deviation change in each predictor variable (SO2 and dimethyl dicarbonate doses, and their interaction). Larger absolute values represent stronger effects, with positive coefficient indicating a direct relationship and negative coefficient indicating an inverse relationship. As shown in Figure 7a, dimethyl dicarbonate is a key variable that significantly influences the increasing concentration of the dependent variable (methanol). SO₂ has little to no effect, and its contribution may not be statistically meaningful. On the other hand, SO2 levels manifest important impact on acetaldehyde formation (Figure 7b).
3.5. Sensory analyses
Wine's character is primarily determined by its acidity, bitterness, or sweetness. These qualities are produced by non-volatile substances that dissolve in water or an alcohol blend. Wines treated with the lowest amount of SO2 (40 mg/L) with or without dimethyl dicarbonate, exhibited the most pronounced oxidative-related flavors such as over-ripe fruits, cooked fruits, jam, with the highest values of oxidation and refermentation parameters. The heatmap presented in the Figure 8 illustrates the existing relationship between the various wine samples and the analyzed sensory descriptors, following a gradient color scheme. Wines within the same cluster manifest similar patterns of sensory attributes, highlighting how different treatments influence the wine styles. A higher intensity is observed for the descriptors (eg. D6-grapefruit, D10-wild flowers) compared to the others. This suggests that these characteristics are representative of the majority of samples analyzed. Descriptors such as refermentation (D20), and oxidation (D21) show low values in most samples, indicating that these characteristics are either rare or undesirable in this type of wine.
The high intensity of descriptors D20 (refermentation) and D21 (oxidation) in a few samples (eg. wines 41-45) could indicate microbiological stability issues in the production or storage process. The main characteristic that distinguishes Schizosaccharomyces pombe from other fermentative yeasts is its ability to metabolize malic acid into ethanol and CO2, explaining the occurrence of refermentation in samples with this type of yeast, a result also confirmed by other authors [17], or by international reglementations in force [27].
As the treatment concentrations increased to 80 mg/L SO2 and dimethyl dicarbonate the resulting wines were more balanced, with reduced oxidation and refermentation faults due to the stabilization action of the doses administered. The floral and fruity notes (tropical fruits, ripe fruits, honey and wildflowers) of the dimethyl dicarbonate - treated samples were more expressive compared to the SO2 - only treated variants. The samples treated with the highest amount of SO2 (160 mg/L) and dimethyl dicarbonate were characterized by a 'clean', elegant, balanced profile with good stability [52] confirm that dimethyl dicarbonate can partially replace SO2 and is an effective conservation method against pathogenic microorganisms that are responsible for undesirable flavors in wines. Threlfall et al. [14] also confirmed that using dimethyl dicarbonate prevents the action of microorganisms and unpleasant odors or flavors in wine, especially when using the maximum dose of 200 mg/L, authorized by the International Wine and Vine Organization, a result also confirmed in this study. The results demonstrate dimethyl dicarbonate potential to improve and preserve wine quality, inhibit the growth of pathogenic microorganisms, and maintain the wine’s aroma profile, as was also demonstrated by Lisanti et al. [53].
4. Conclusions
In wine samples where sulphur dioxide was added without any synergistic action of the dimethyl dicarbonate treatment, Schizosaccharomyces pombe and Brettanomyces bruxellensis yeasts led to instability in the chemical, microbiological and sensory aspects of the wine. Thus, optimal results were evident following treatments with DMDC and sulfur dioxide at doses higher than 40 mg/L. The concerted activity between sulfur dioxide and dimethyl dicarbonate on the sensory profile contributes to the maintenance of sensory descriptors specific to the grape varieties used, such as balanced, correct and elegant aromas. By quantification of methanol and acetaldehyde, it can be observed that wine samples obtained through the use of DMDC are adequate for consumption. This study provides a method for the optimization of technologies to produce quality demi-sweet and sweet wines by using different doses of DMDC. The results indicate that the synergistic action of sulfur dioxide and dimethyl dicarbonate significantly improves both microbiological and oxidative stability of wine, warranting further investigation as optimal oenological techniques for winemaking. The applied methods will contribute to the development of preventive strategies against problematic yeasts in winemaking.
Author Contributions
For research articles with several authors, a short paragraph specifying their individual contributions must be provided. The following statements should be used “Conceptualization, I.B. and C.I.Z.; methodology, C.I.Z, F.D.L. and E.U.; software, E.C.S. and L.C.C.; validation, B.C.N., F.D.L.; formal analysis, C.E.L.; investigation, I.B.; resources, V.V.C.; data curation, F.D.L. and B.C.N.; writing—original draft preparation, I.B.; writing—review and editing, V.V.C. and I.B.; visualization, E.C.S., L.M.I.; supervision, C.E.L. and L.C.C.; funding acquisition V.V.C. All authors have read and agreed to the published version of the manuscript.
Funding
This work was supported by the Iasi University of Life Science, Romania.
Institutional Board Statement
Not applicable.
Informed Consent Statement
Not applicable.
Data Availability Statement
The raw data supporting the conclusions of this article will be made available by the authors on request.
Acknowledgments
The authors of this manuscript thank LANXESS - Deutschland team for their involvement in logistical support.
Conflicts of Interest
The authors declare no conflicts of interest.
References
- Morgan, S.C. The effect of sulfur dioxide addition and alternative fermentation techniques on the microbial communities and sensory profiles of wine. Doctoral thesis, The university of British Columbia, 2019. [Google Scholar]
- Cotea, V.D. Tratat de Oenologie; Ceres Publisher: București, Romania, 1985; vol I. [Google Scholar]
- Lisanti, M. T. , Gambuti, A., Genovese, A., Piombino, P., & Moio, L. Earthy off-flavour in wine: Evaluation of remedial treatments for geosmin contamination. Food Chem., 2014, 154, 171–178. [Google Scholar] [PubMed]
- Scutarașu, E.C. , Luchian, E.C., Vlase, L., Nagy, K., Colibaba, L.C., Trinca, L.C., Cotea, V.V. Influence Evaluation of Enzyme Treatments on Aroma Profile of White Wines. Agronomy 2022, 12, 2897. [Google Scholar] [CrossRef]
- Carrascón, V. , Vallverdú-Queralt, A., Meudec, E., Sommerer, N., Fernandez-Zurbano, P., & Ferreira, V. The kinetics of oxygen and SO2 consumption by red wines. What do they tell about oxidation mechanisms and about changes in wine composition? Food Chem. 2018, 241, 206214. [Google Scholar] [CrossRef]
- Ribéreau-Gayon, P.; Dubourdieu, D.; Donèche, B.; Lonvaud, A. The Microbiology of Wine and Vinifications. In Handbook of Enology; John Wiley & Sons; Anglia Publisher, 2006; vol. 1. [Google Scholar]
- Zironi, R.; Comuzzo, P.; Tat, L.; Scobiola, S. Sulphur dioxide management in low input winemaking. Journal of enology and viticulture 12/1. www.infowine.com – internet journal of enology and viticulture. 2009, 2009, 12/1. [Google Scholar]
- Branco, P. , Coutinho, R., Malfeito-Ferreira, M., Prista, C., Albergaria, H. Wine Spoilage Control: Impact of Saccharomycin on Brettanomyces bruxellensis and Its Conjugated Effect with Sulfur Dioxide. Microorganisms. 2021, 9, 2528. [Google Scholar] [CrossRef]
- Christofi, S.; Katsaros, G.; Mallouchos, A.; Cotea, V.; Kallithraka, S. Reducing SO2 content in wine by combining High Pressure and glutathione addition. OENO One 2021, 1, 235–252. [Google Scholar] [CrossRef]
- Oliveira, C.M.; Ferreira, A.C.S.; De Freitas, V.; Silva, A. M. S. Oxidation mechanisms occurring in wines- Review. Food Research International 2011, 44, 1115–1126. [Google Scholar] [CrossRef]
- Guerrero, R. F. , Cantos-Villar E. Demonstrating the efficiency of sulphur dioxide replacements in wine: A parameter review. Trends Food Sci Technol 2015, 42, 1. [Google Scholar] [CrossRef]
- Ough, C.S. Were, L. Sulfur dioxide and sulfites. Food science and Technology-New York-Marcel Dekker 2005, 145, 143. [Google Scholar]
- Popa, A.; Popa, D.; Dragomir, F. Microbiologie oenologică; Universitaria Craiova Publisher: Romania, 2014. [Google Scholar]
- Threlfall, R.T.; Morris, J.R. Using dimethyldicarbonate to minimize sulfur dioxide for prevention of fermentation from excessive yeast contamination in juice and semi-sweet wine. J. Food Sci. 2002, 67, 2758–2762. [Google Scholar] [CrossRef]
- Yíldírím, H.K.; Darící, B. Alternative methods of sulfur dioxide used in wine production. J Microbiol Biotech Food Sci. 2020, 9(4), 675–687. [Google Scholar] [CrossRef]
- Arriagada-Carrazana, J.P.; Saez-Navarrete, C.; Bordeu, E. Membrane filtration effects on aromatic and phenolic quality of Cabernet Sauvignon wines. J. Food Eng 2005, 68, 363–368. [Google Scholar] [CrossRef]
- Santos, M.C. , Nunes, C., Saraiva, J.A., Coimbra, M.A. Chemical and physical methodologies for the replacement/reduction of sulfur dioxide use during winemaking: review of their potentialities and limitations. Eur. Food Res. Technol 2012, 234, 1–12. [Google Scholar] [CrossRef]
- Ough, CS. Dimethyldicarbonate as a wine sterilant. Am.J.Enol.Vitic 1975, 26, 130–133. [Google Scholar] [CrossRef]
- Chen, K.; Han, S.; Zhang, B.; Li, M.; Sheng, W. Development of lysozyme-combined antibacterial system to reduce sulfur dioxide and to stabilize Italian Riesling ice wine during aging process. Food Sci.Nutr. 2015, 3, 453–455. [Google Scholar] [CrossRef]
- Ancín-Azpilicueta, C. , Jiménez-Moreno, N., Moler, J.A., Nietorojo, R., Urmeneta, H. Effects of reduced levels of sulfite in wine production using mixtures with lysozyme and dimethyl dicarbonate on levels of volatile and biogenic amines. Food Addit. Contam.: Part A 2016, 33, 1518–1526. [Google Scholar] [CrossRef]
- Escott, C. , Loira, I., Morata, A., Bañuelos, M.A., Suárez-Lepe, J.A. Wine Spoilage Yeasts: Control Strategy Chapter 4. In Yeast - Industrial Applications. [CrossRef]
- Bruhn, C. , Feng, Y. Exploring Consumer Response to Labeling a Processing Aid That Enhances Food Safety. Food Prot. Trends, 2021, 41, 305–313. [Google Scholar]
- Stafford, P.A.; Ough, C.S. Formation of methanol and ethyl methyl carbonate by dimethyl dicarbonate in wine and model solutions. Am. J. Enol. Vitic. 1976, 27, 7–11. [Google Scholar] [CrossRef]
- Stockley, C.; Paschke-Kratzin, A.; Teissedre P., L.; Restani, P.; Garcia Tejedor, N.; Quini, C. SO2 and wine: a review; OIV collective expertise document; 2021. [Google Scholar]
- International Organization of Wine and Vine. International Code of Oenological Practices, Paris, France. 2020. Available online: https://www.oiv.int/standards/international-code-of-oenological-practices (accessed on 20 May 2024).
- Anonymous, *!!! REPLACE !!!*. Lanxess Emerging Chemistry. Velcorin® Spectrum of use, The best choice for wines. [monograph online]. 2020b. Available online: https://velcorin.com/velcorin/spectrum-of-use/velcorin-wine/ practices (accessed on 1 June 2024).
- Commission Regulation (EC) No 606/2009 of 10 July 2009 laying down certain detailed rules for implementing Council Regulation (EC) No 479/2008 as regards the categories of grapevine products, oenological practices and the applicable restrictions. (accessed on 2 June 2024).
- Romano, P.; Ciani, M.; Fleet, G. H. Yeasts in the production of wine.; Publisher Springer: New York, USA, 2019; pp. 375–395. [Google Scholar]
- Loira, I. , Morata, A., Palomero, F. González Carmen and Suárez-Lepe, J.A. Schizosaccharomyces pombe: A Promising Biotechnology for Modulating Wine Composition. Fermentation 2018, 4, 70. [Google Scholar] [CrossRef]
- Kurtzman, C.P.; Fell, J.W.; Boekhout, T. The Yeasts: A Taxonomic Study; Elsevier: London, UK, 2010. [Google Scholar]
- Suárez-Lepe, J. A.; Palomero, F.; Benito, S.; Calderón, F.; Morata, A. Oenological versatility of Schizosaccharomyces spp. Eur. Food Res. Technol., 2012, 235, 375–383. [Google Scholar] [CrossRef]
- Cibrario, A.; Avramova, A.; Dimopoulou, M.; Magani, M.; MiotSertier, C.; Mas, A.; Portillo, M.C.; Ballestra, P.; Warren Albertin, W.; Masneuf-Pomarede, I.; Dols-Lafargue, M. Brettanomyces bruxellensis wine isolates show high geographical dispersal and long persistence in cellars. PLoS ONE 2018, 14, e0222749. [Google Scholar] [CrossRef] [PubMed]
- Vigentini, I.; et al. Physiological and oenological traits of diferent Dekkera/Brettanomyces bruxellensis strains under wine-model conditions. FEMS Yeast Res. 2008, 8, 1087–1096. [Google Scholar] [CrossRef] [PubMed]
- Crauwels, S.; et al. Fermentation assays reveal diferences in sugar and (of-) favor metabolism across diferent Brettanomyces bruxellensis strains. FEMS Yeast Res. 2017, 17. [Google Scholar]
- Joseph, C. M. L. , Gorton, L. W., Ebeler, S. E. & Bisson, L. F. Production of Volatile Compounds by Wine Strains of Brettanomyces bruxellensis Grown in the Presence of Diferent Precursor Substrates. Am. J. Enol. Vitic. 2013, 64, 231–240. [Google Scholar]
- Romano, A. , Perello, Mc, Revel, Gde & Lonvaud-Funel, A. Growth and volatile compound production by Brettanomyces/Dekkera bruxellensis in red wine. J. Appl. Microbiol. 2008, 104, 1577–1585. [Google Scholar] [PubMed]
- Galafassi, S.; et al. Dekkera/Brettanomyces yeasts for ethanol production from renewable sources under oxygen-limited and low-pH conditions. J. Ind. Microbiol. Biotechnol. 2011, 38, 1079–1088. [Google Scholar] [CrossRef]
- Vigentini, I. , Joseph, C. M. L., Picozzi, C., Foschino, R. & Bisson, L. F. Assessment of the Brettanomyces bruxellensis metabolome during sulphur dioxide exposure. FEMS Yeast Res. 2013, 13, 597–608. [Google Scholar] [PubMed]
- Avramova, M.; Cibrario, A.; Peltier, E.; Coton, M.; Coton, E.; Schacherer, J.; Spano, G.; Capozzi, V.; Blaiotta, G.; Salin, F.; Dols-Lafargue, M.; Grbin, P.; Curtin, C.; Albertin, W.; Masneuf-Pomarede, I. Brettanomyces bruxellensis population survey reveals a diploid-triploid complex structured according to substrate of isolation and geographical distribution. ScientiFic RePOrtS 2018, 8, 4136. [Google Scholar] [CrossRef]
- Agnolucci, M. , Rea, F., Sbrana, C., Cristani, C., Fracassetti, D., Tirelli A. Sulphur dioxide affects culturability and volatile phenol production by Brettanomyces/Dekkera bruxellensis. International Journal of Food Microbiology 2010, 143, 76–80. [Google Scholar] [CrossRef] [PubMed]
- Campolongo, S.; Kalliopi, R.; Giordano, M.; Gerbi, V.; Cocolin, L. Prevalence and Biodiversity of Brettanomyces bruxellensis in Wine from Northwestern Italy. Am J Enol Vitic 2010, 61, 486–491. [Google Scholar] [CrossRef]
- Macoviciuc, S.; Nechita, C.B.; Cioroiu, I.B.; Cotea, V.; Niculaua, M. Effect of added sulphur dioxide levels on the aroma characteristics of wines from Panciu wine region. Ştiinţa agricolă 2022, 1, 73–77. [Google Scholar] [CrossRef]
- Cotea, V. , Focea, M.C., Luchian, C.E., Colibaba, L.C., Scutarașu, E.C., Niculaua, M., Zamfir, C.I., Popîrdă, A. Influence of Different Commercial Yeasts on Volatile Fraction of Sparkling Wines. Foods. 2021, 10, 247. [Google Scholar] [CrossRef]
- Dumitriu, G. D.; Teodosiu, C.; Gabur, I.; Cotea, V.V.; Peinado, R.A.; López de Lerma, N. Alternative Winemaking Techniques to Improve the Content of Phenolic and Aromatic Compounds in Wines. Agriculture. 2021, 11, 233. [Google Scholar] [CrossRef]
- ISO 3591: 1977; Sensory Analysis. Apparatus. Wine-Tasting Glass. ISO: Geneva, Switzerland, 1977.
- ISO 8589: 2007; Sensory Analysis. General Guidance for the Design of Test Room. ISO: Geneva, Switzerland, 2007.
- Zoecklein, B.W.; Fugelsang, K.C.; Gump, B.H.; Nury, F.S. Wine analysis an production, Chapter 13 Sorbic acid, benzoic acid, and dimethyldicarbonate; Chapman & Hall: New York, 2013; pp. 209–210. [Google Scholar]
- Samoticha, J.; Wojdyło, A.; Chmielewska, J.; Politowicz, J.; Antoni, S. The effects of enzymatic pre-treatment and type of yeast on chemical properties of white wine. LWT-Food Sci. Technol 2017, 79, 445–453. [Google Scholar] [CrossRef]
- Țârdea, C. Chimia și analiza vinului; Editura Ion Ionescu de la Brad: Iași, 2007. [Google Scholar]
- Moreno, J.; Peinado, R. Enological chemistry; Academic Press: United State of America, 2012. [Google Scholar]
- Gallego, R.F.; Puxeu, M.; Martín, L.; Nart, E.; Hidalgo, C.; Andorrà, I. Microbiological, Physical, and Chemical Procedures to Elaborate High-Quality SO2-Free Wines. In Grapes and Wines - Advances in Production, Processing, Analysis and Valorization; Jordão, A.M., Cosme, F., Eds.; IntechOpen, 2018. [Google Scholar] [CrossRef]
- Delfini, C.; Gaia, P.; Schellino, R.; Strano, M.; Pagliara, A.; Ambro, S. Fermentability of grape must after inhibition with dimethyl dicarbonate (DMDC). J. Agric. Food Chem. 2002, 50, 5605–5611. [Google Scholar] [CrossRef]
- Lisanti, M.T. , Blaiotta G., Nioi C., Moio L. Alternative Methods to SO2 for Microbiological Stabilization of Wine. Comprehensive Reviews in Food Science and Food Safety, 2019, 18. [Google Scholar]
- Costa, A.; Barata, A.; Loureiro, V. Evaluation of the inhibitory effect of dimethyl dicarbonate (DMDC) against wine microorganisms. Food Microbiol. 2008, 25, 422–427. [Google Scholar] [CrossRef]
- Divol, B. , Strehaiano, P., Lonvaud-Funel, A. Effectiveness of dimethyl dicarbonate to stop alcoholic fermentation in wine. Food Microbiol., 2005, 22, 169–178. [Google Scholar] [CrossRef]
- Renouf, V. , Strehaiano, P., Lonvaud-Funel, A. Effectiveness of dimethlydicarbonate to prevent Brettanomyces bruxellensis growth in wine. Food Contr. 2008, 19(2), 208–216. [Google Scholar] [CrossRef]
- Nykanen, L. Formation and occurrence of flavor compounds in wine and distilled alcoholic beverages. AJEV. 1986, 37, 84–96. [Google Scholar] [CrossRef]
- Osborne J., P. , Dube Morneau A., Mira de Ordun R. Degradation of free and sulfur-dioxide-bound acetaldehyde by malolactic lactic acid bacteria in white wine. J. Appl. Microbiol 2006, 101, 474–479. [Google Scholar] [CrossRef]
- Griffith, R.; și Hammond, E. G. Generation of Swiss cheese flavor components by the reaction of amino acids with carbonyl compounds. Journal of Dairy Science 1989, 72, 604–613. [Google Scholar] [CrossRef]
- Soldatenco Olga. Bazele științifice și practice ale utilizării levurilor în Oenologie; Institutul Științifico-Practic de Horticultură și Tehnologii Alimentare: Chișinău, 2021. [Google Scholar]
- Miyake, T.; și Shibamoto, T. Quantitative analysis of acetaldehyde in foods and beverages. Journal of Agricultural and Food Chemistry 1993, 41, 1968–1970. [Google Scholar] [CrossRef]
- Byrne, S.; Howell, G. Acetaldehyde: how to limit its formation during fermentation. Australian Grapegrower & Winemaker. 2017, 637, 68–69. [Google Scholar]
- Erhu, L. Ramón Mira de Orduña Heidinger. Acetaldehyde metabolism in industrial strains of Saccharomyces cerevisiae inhibited by SO2 and cooling during alcoholic fermentation. OENO one 2020, 54, 2. [Google Scholar]
- Francois, M.O. Effect of yeasts and oenological parameters on acetaldehyde production during alcoholic fermentation of South African grape musts. Thesis (MSc), Stellenbosch University, 2020. [Google Scholar]
- Călin (Buțerchi), I.; Cotea, V.V.; Colibaba, L.C.; Luchian, C.E.; Cerbu, I.M.; Zamfir, C.I.; Nechita, B.C. The dynamic of methanol and acetaldehyde in white wines treated with sulphur dioxide and dimethyl decarbonate. LUCR. ŞTIINŢ. SERIA HORTICULTURĂ 2021, 64, USV IAŞI. [Google Scholar]
- Călin, I.; Luchian, C.E.; Colibaba, L.C.; Scutarașu, E.C.; Popîrdă, A.; Cimpoi, V.I.; Zamfir, C.I.; Cotea, V.V. Study concerning the influence of sulphur dioxide and dimethyl dicarbonate treatments in wine. Scientific Papers. Series B, Horticulture 2020, LXIV, USAMV București. [Google Scholar]
- Cabaroglu, T. Methanol contents of Turkish varietal wines and effect of processing. Food Control. 2005, 16, 177–181. [Google Scholar] [CrossRef]
- EFSA, ANS Panel (EFSA Panel on Food Additives and Nutrient Sources Added to Food). Scientific Opinion on the re-evaluation of dimethyl dicarbonate (DMDC, E 242) as a food additive. EFSA Journal 2015, 13, 4319. [Google Scholar] [CrossRef]
- SCF (Scientific Committee for Food). Opinion of the Scientific Committee on Food on the use of dimethyl dicarbonate (DMDC) in wines. Opinion expressed on . SCF/CS/ADD/CONS/43 Final, 12 July 2001. 11 July.
Figure 1.
Standardize coefficients from linear regression model for alcoholic strength (a), total acidity (b), volatile acidity (c) and residual sugars (d) concentration (95% conf. interval).
Figure 1.
Standardize coefficients from linear regression model for alcoholic strength (a), total acidity (b), volatile acidity (c) and residual sugars (d) concentration (95% conf. interval).
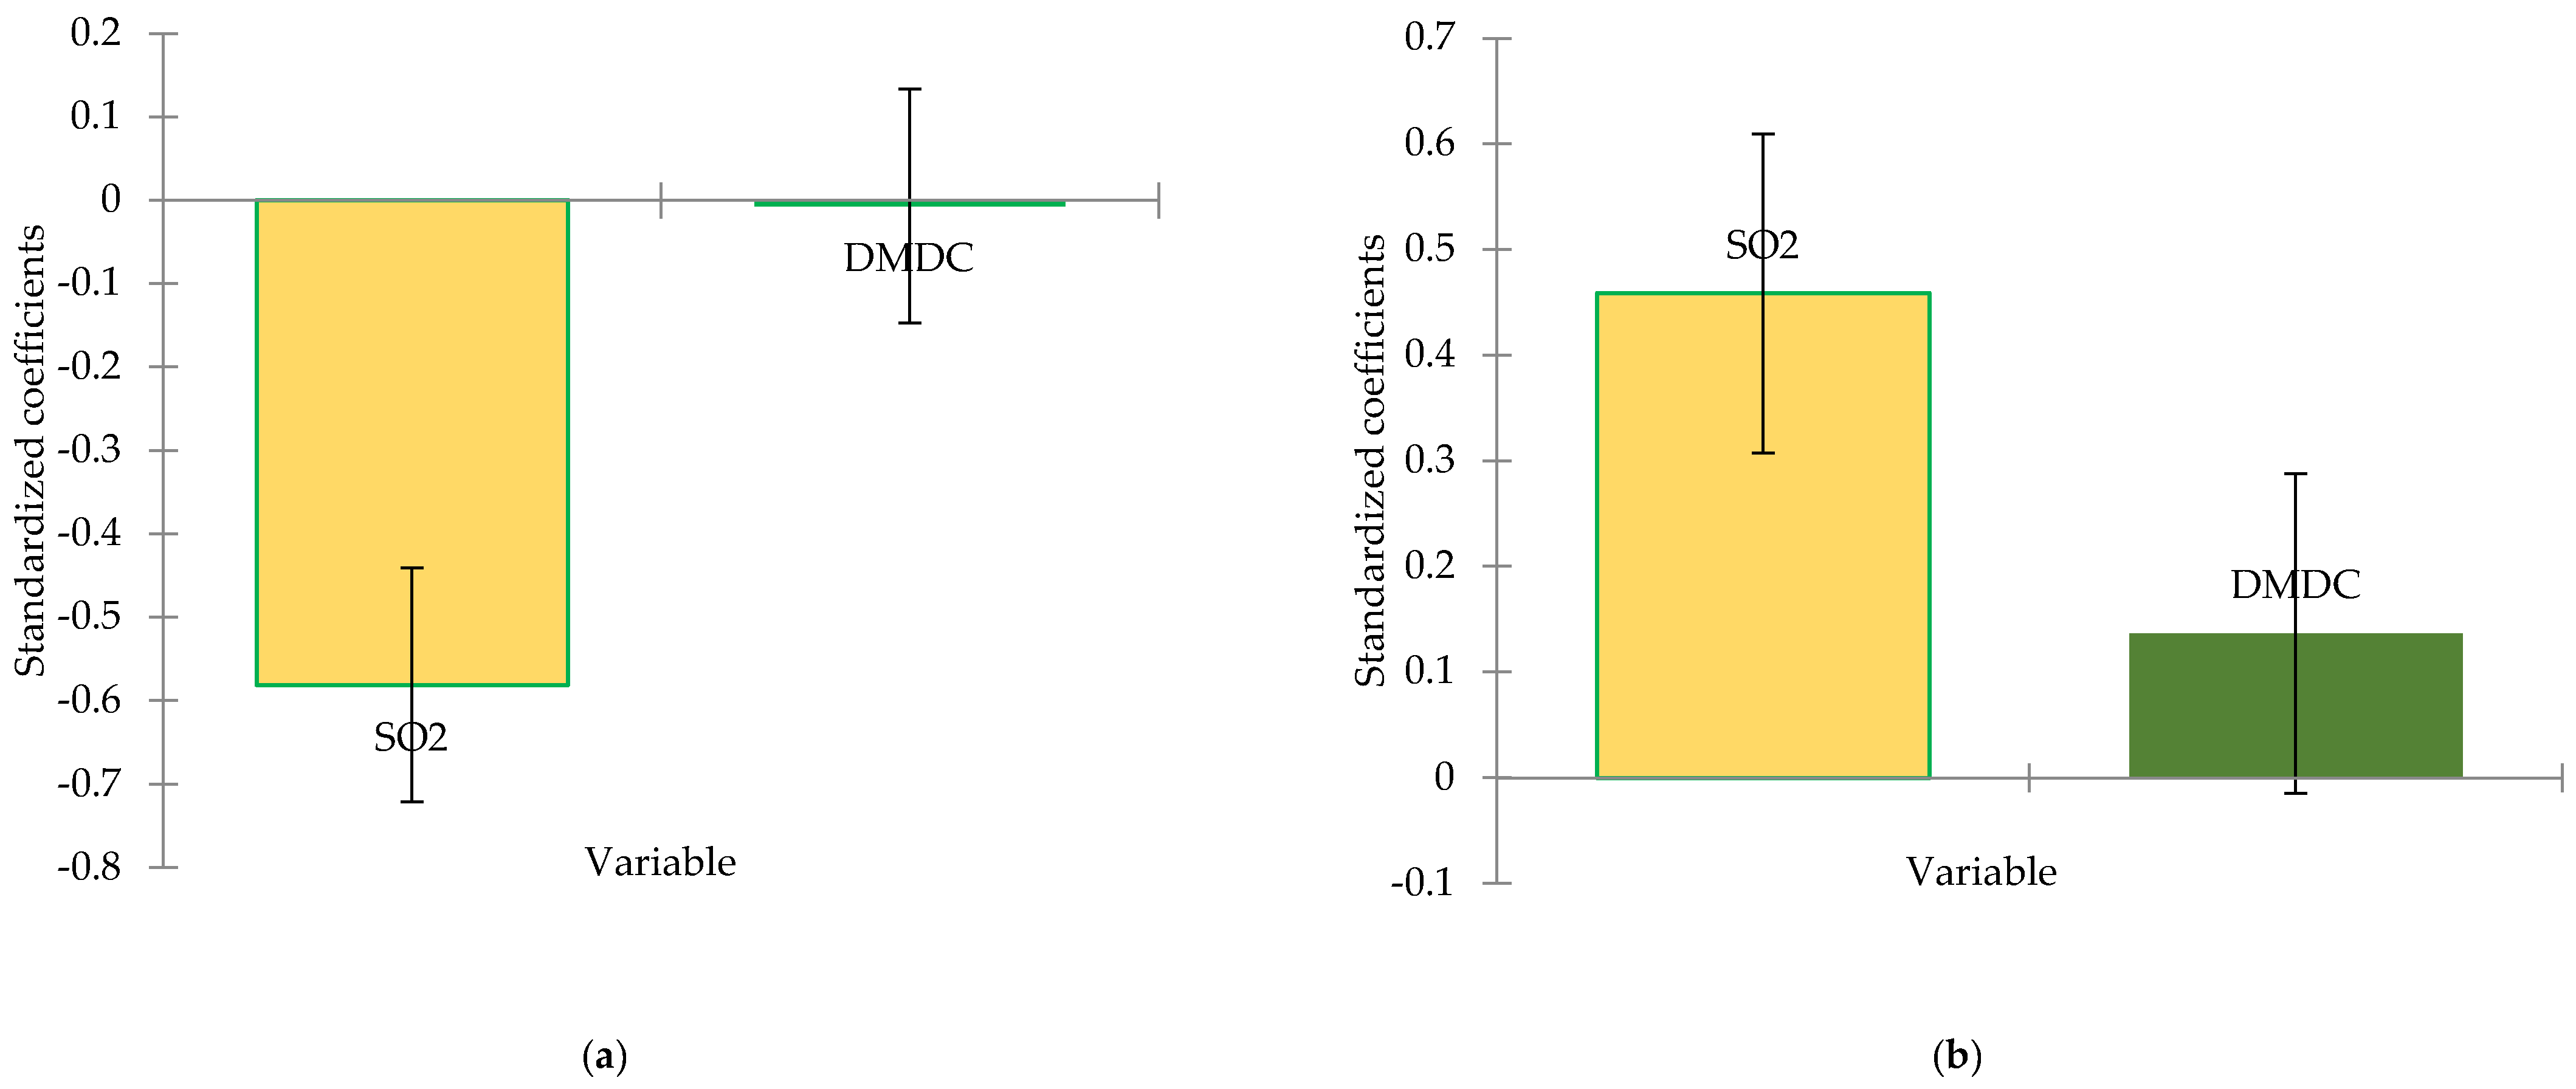
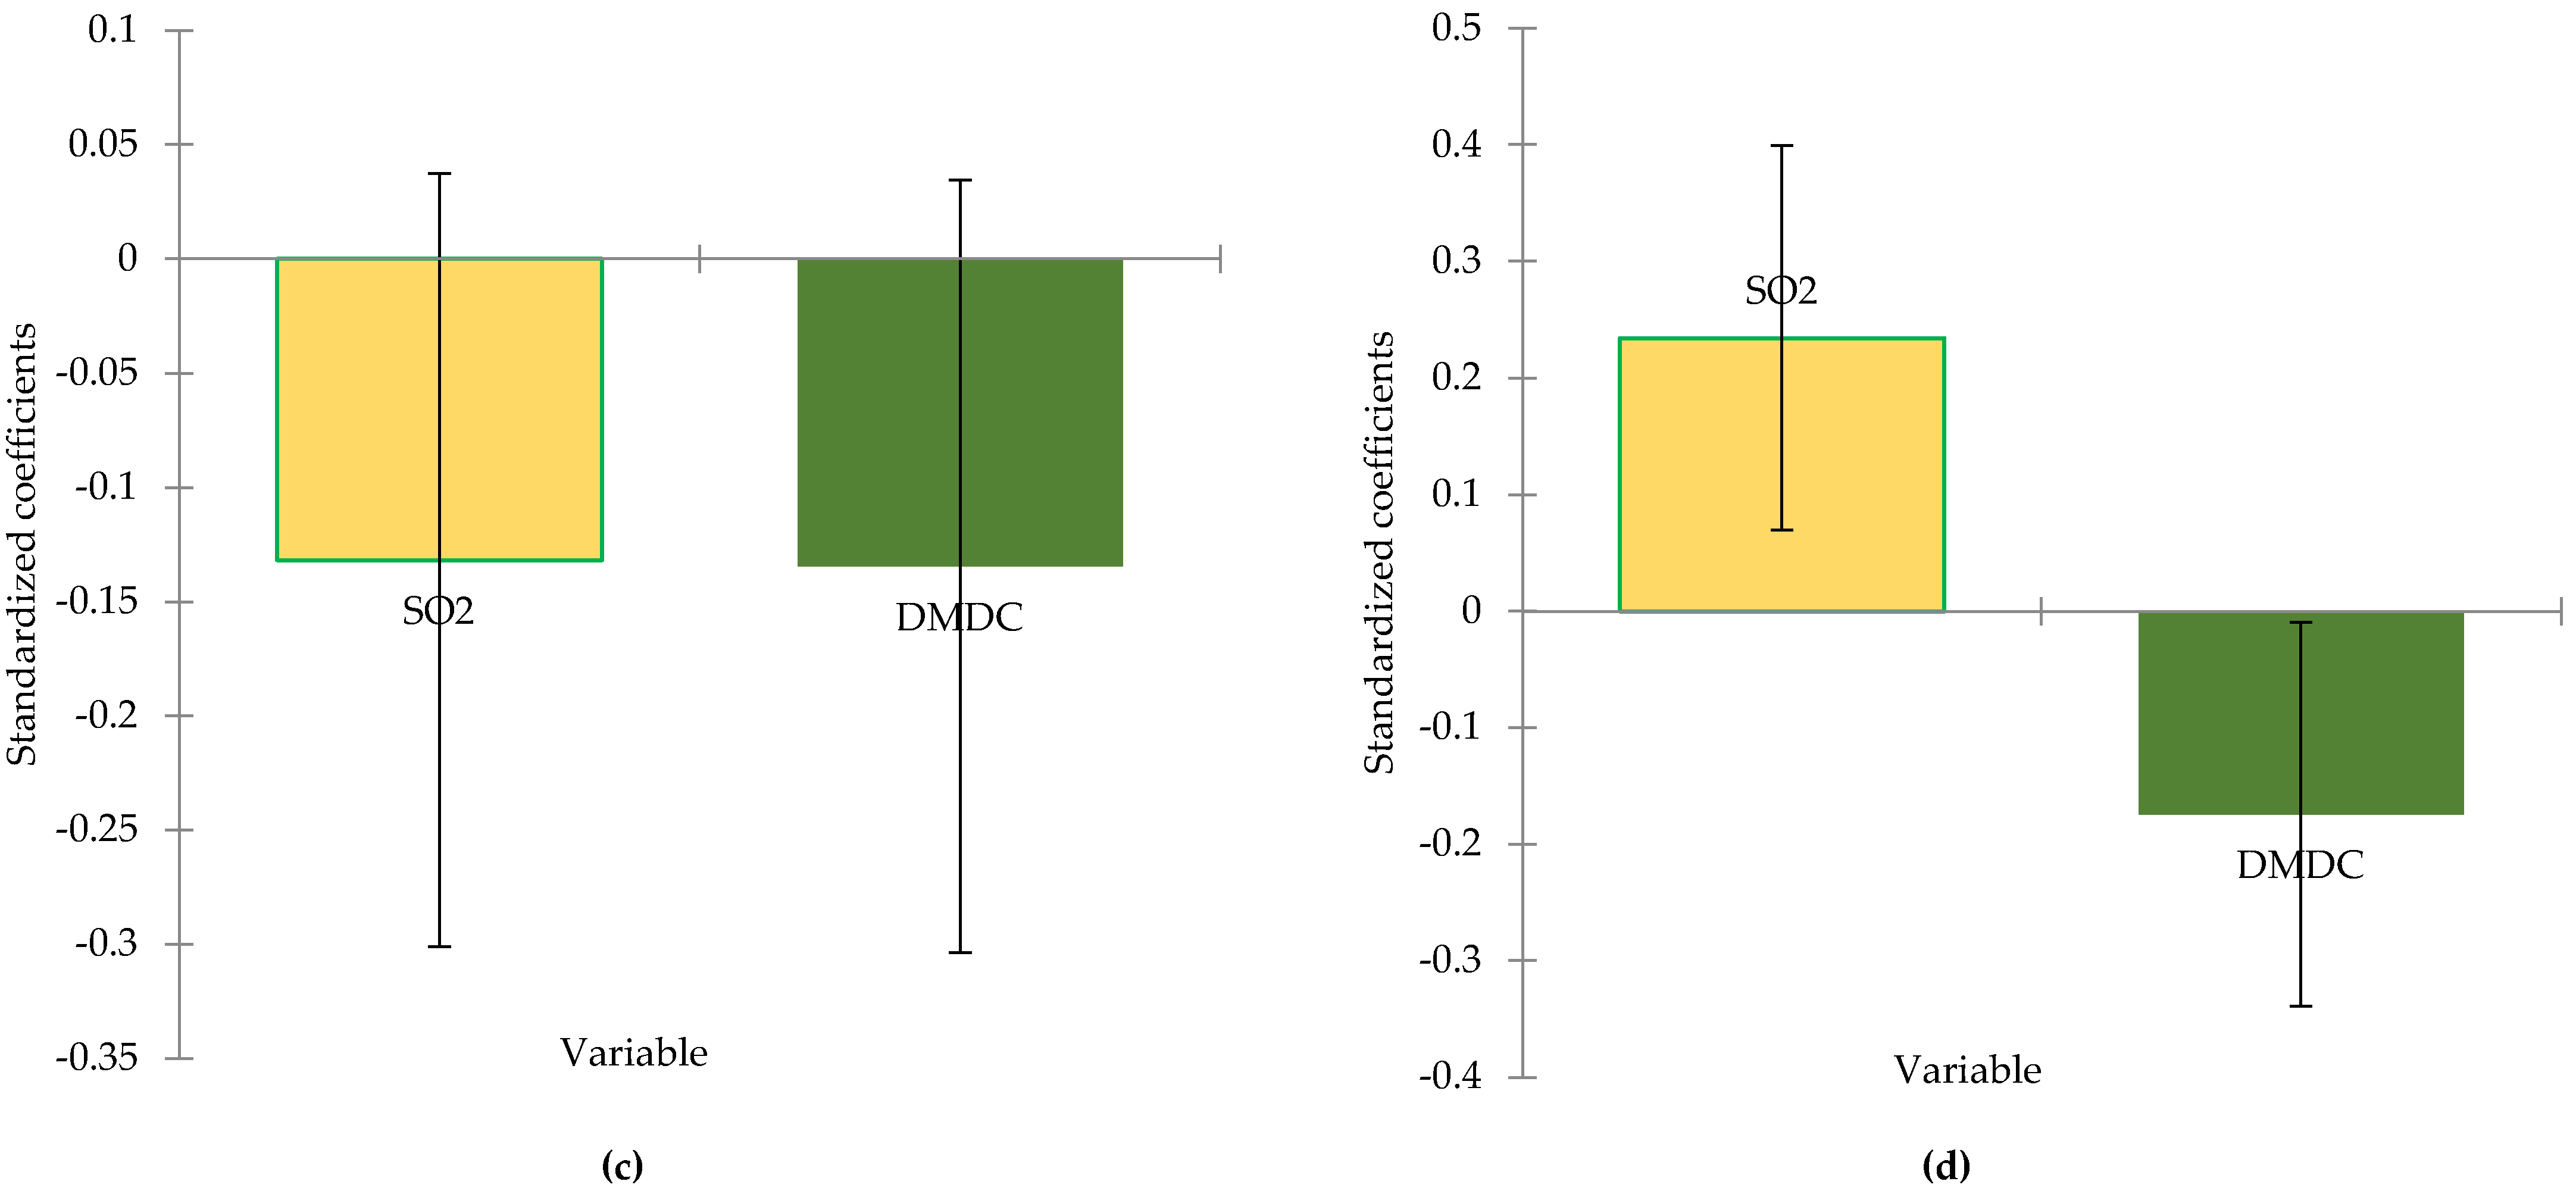
Figure 2.
Standardize coefficients from linear regression model for luminosity (a), a* (b), and b* (c) parameters (95% conf. interval).
Figure 2.
Standardize coefficients from linear regression model for luminosity (a), a* (b), and b* (c) parameters (95% conf. interval).

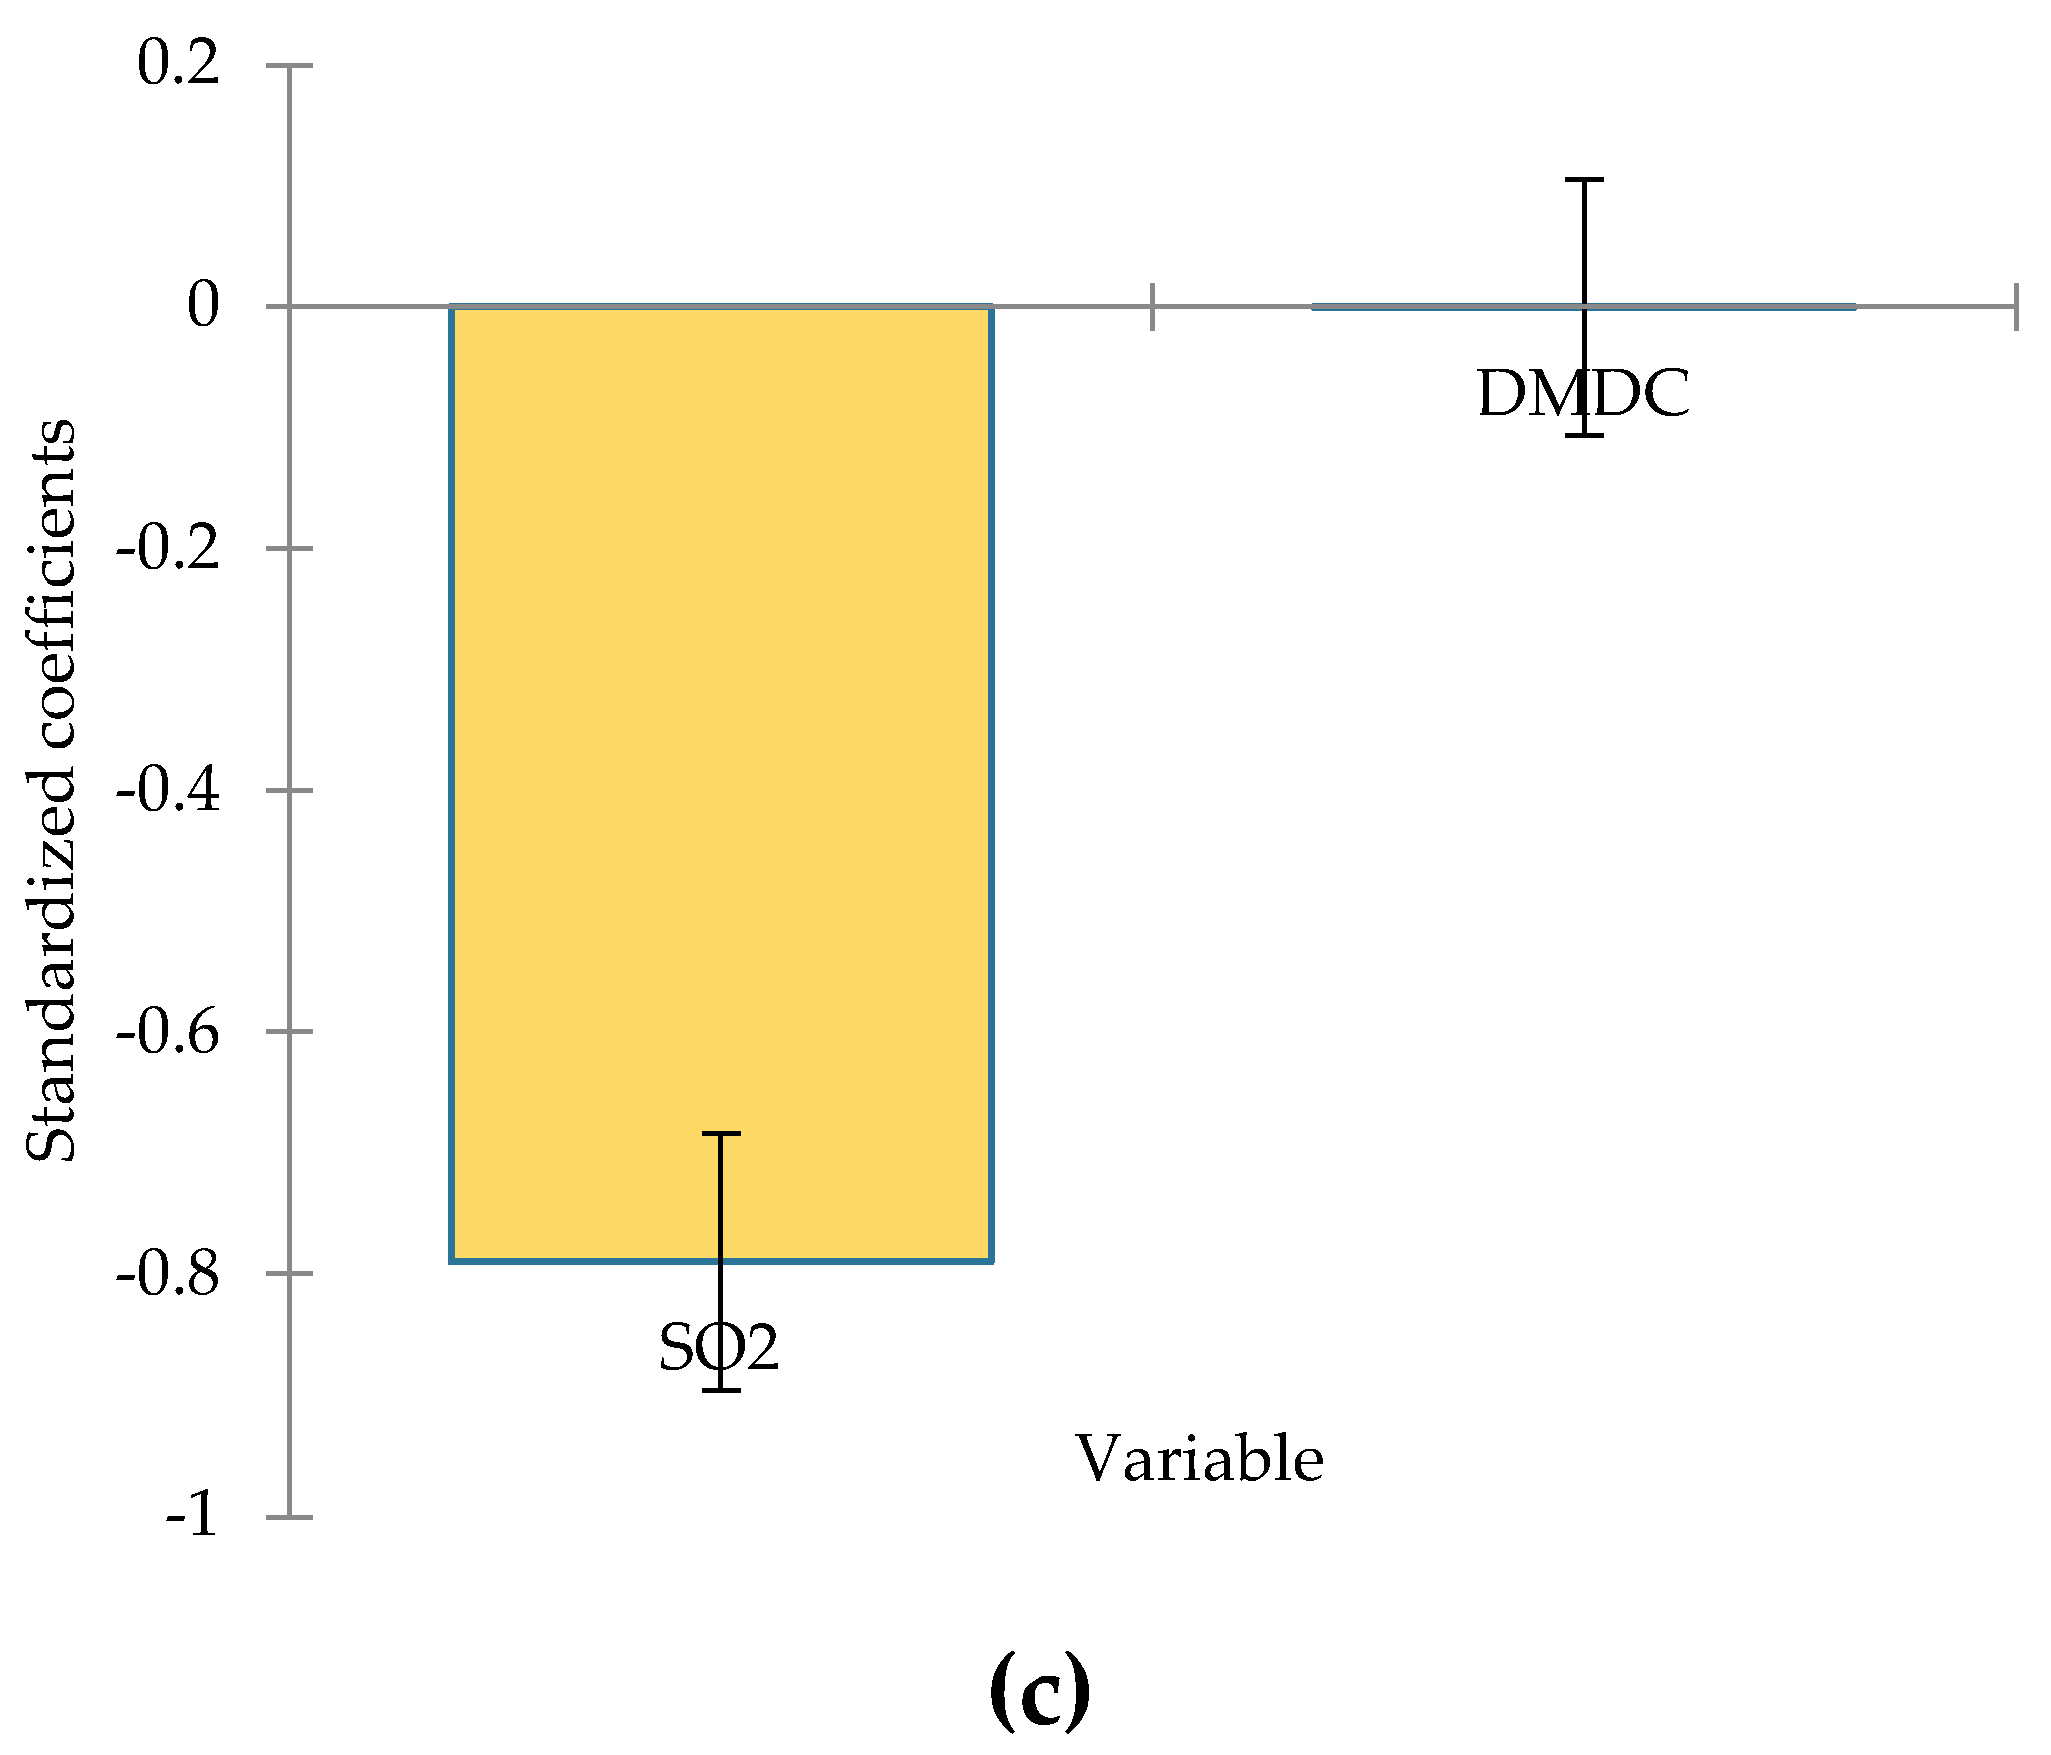
Figure 3.
Aspects for Schizosaccharomyces pombe (a) and Brettanomyces bruxellensis (b).
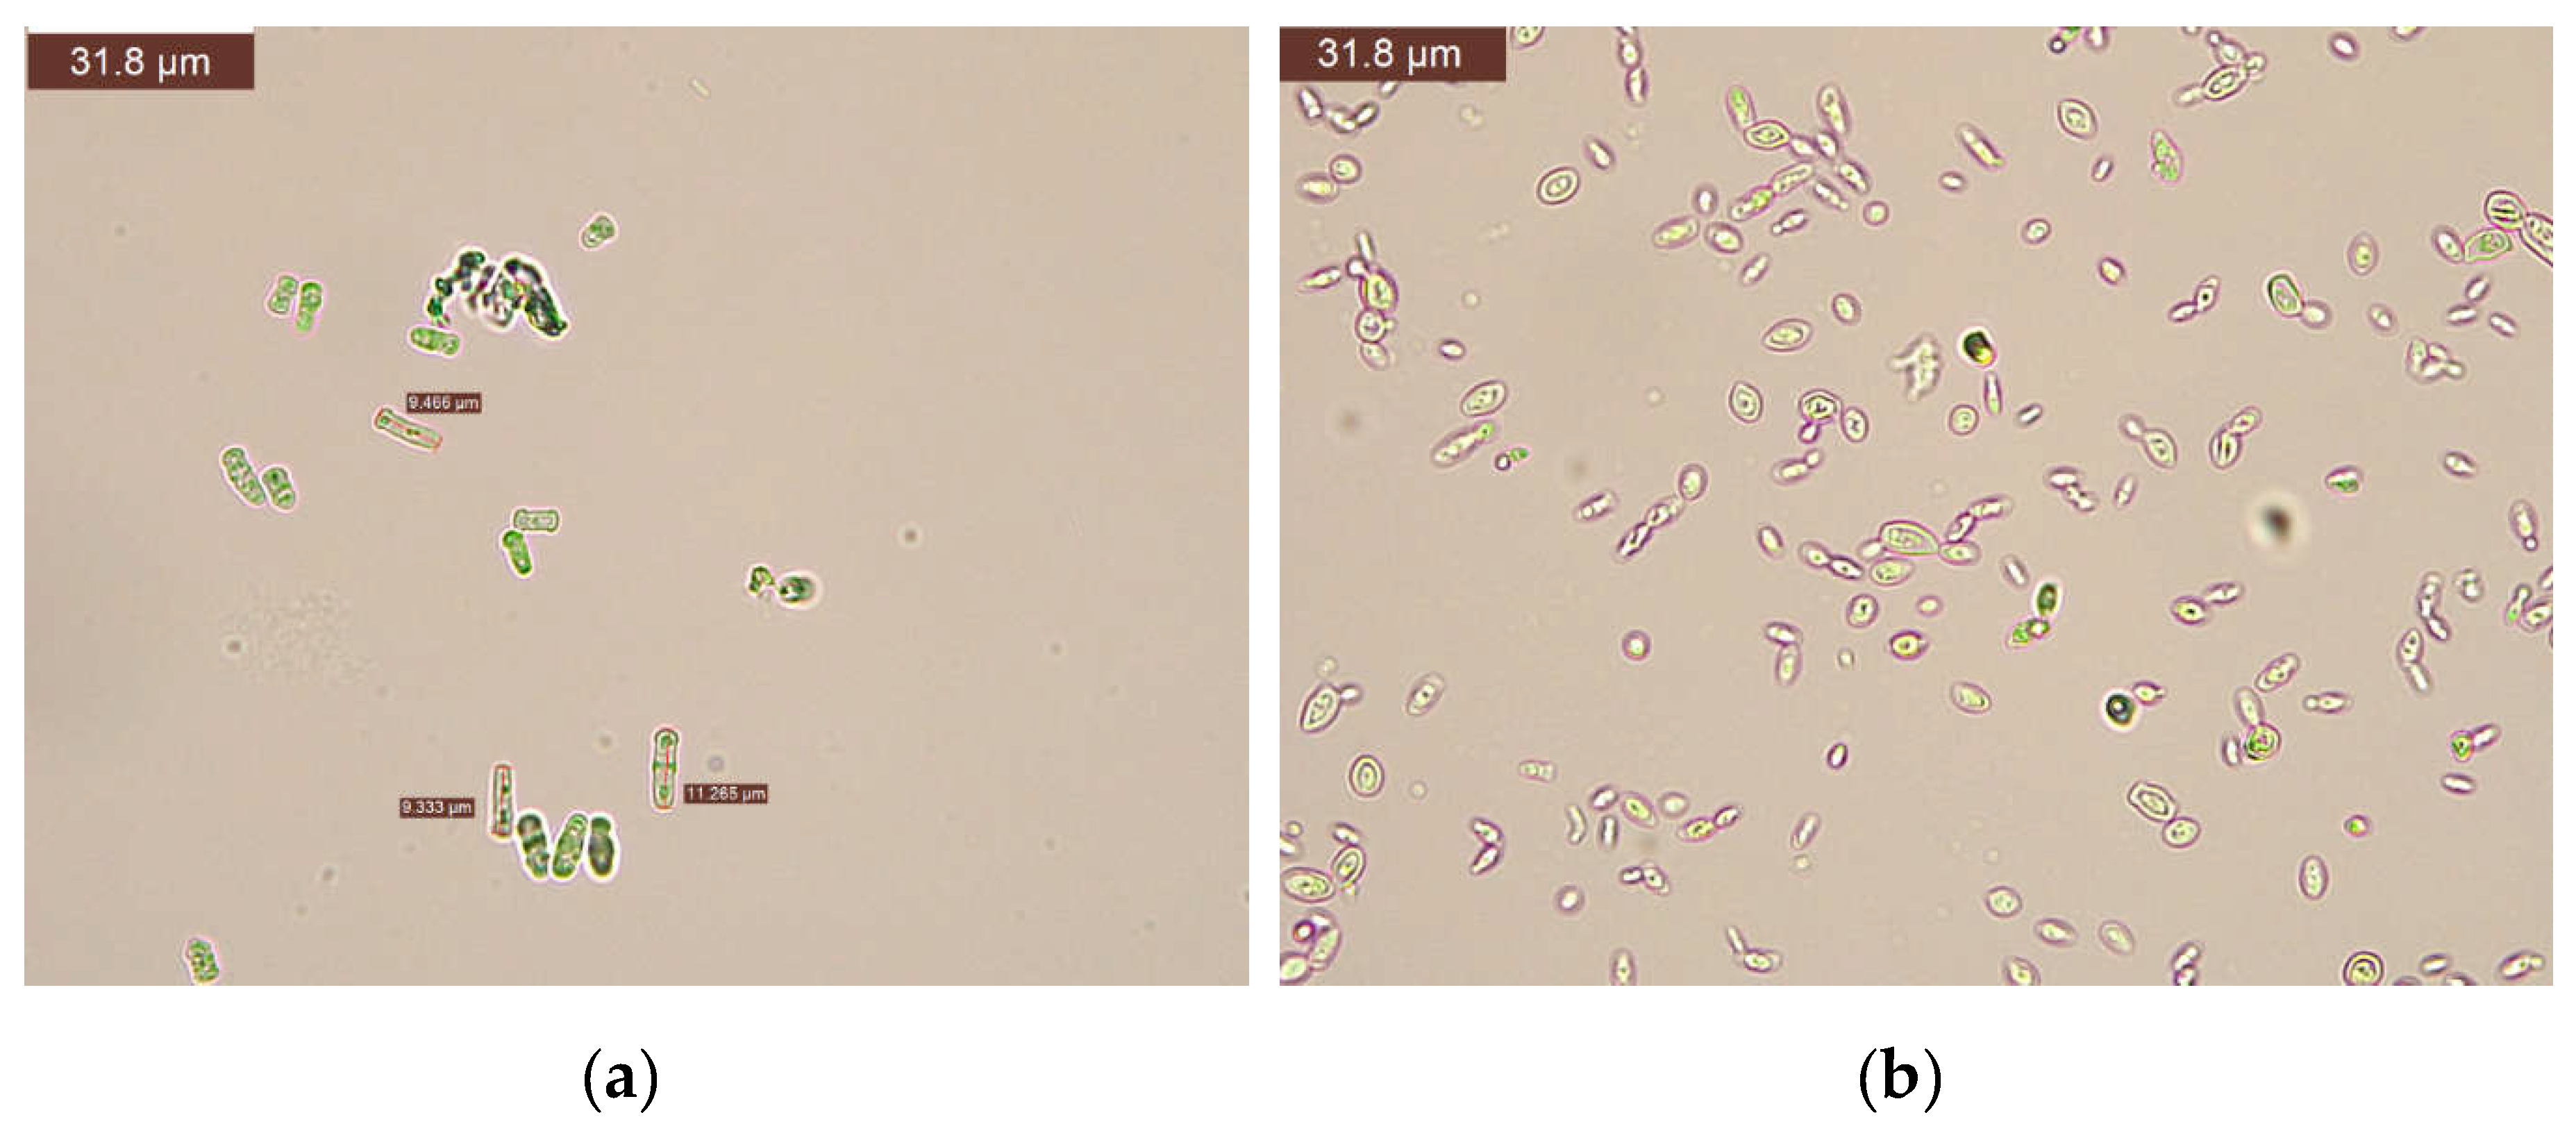
Figure 4.
Aspects of the efficiency of synergic treatments on analysed wines (a) (after 7 days of bottling); after 3 months of bottling c. after 6 months of bottling (b).
Figure 4.
Aspects of the efficiency of synergic treatments on analysed wines (a) (after 7 days of bottling); after 3 months of bottling c. after 6 months of bottling (b).
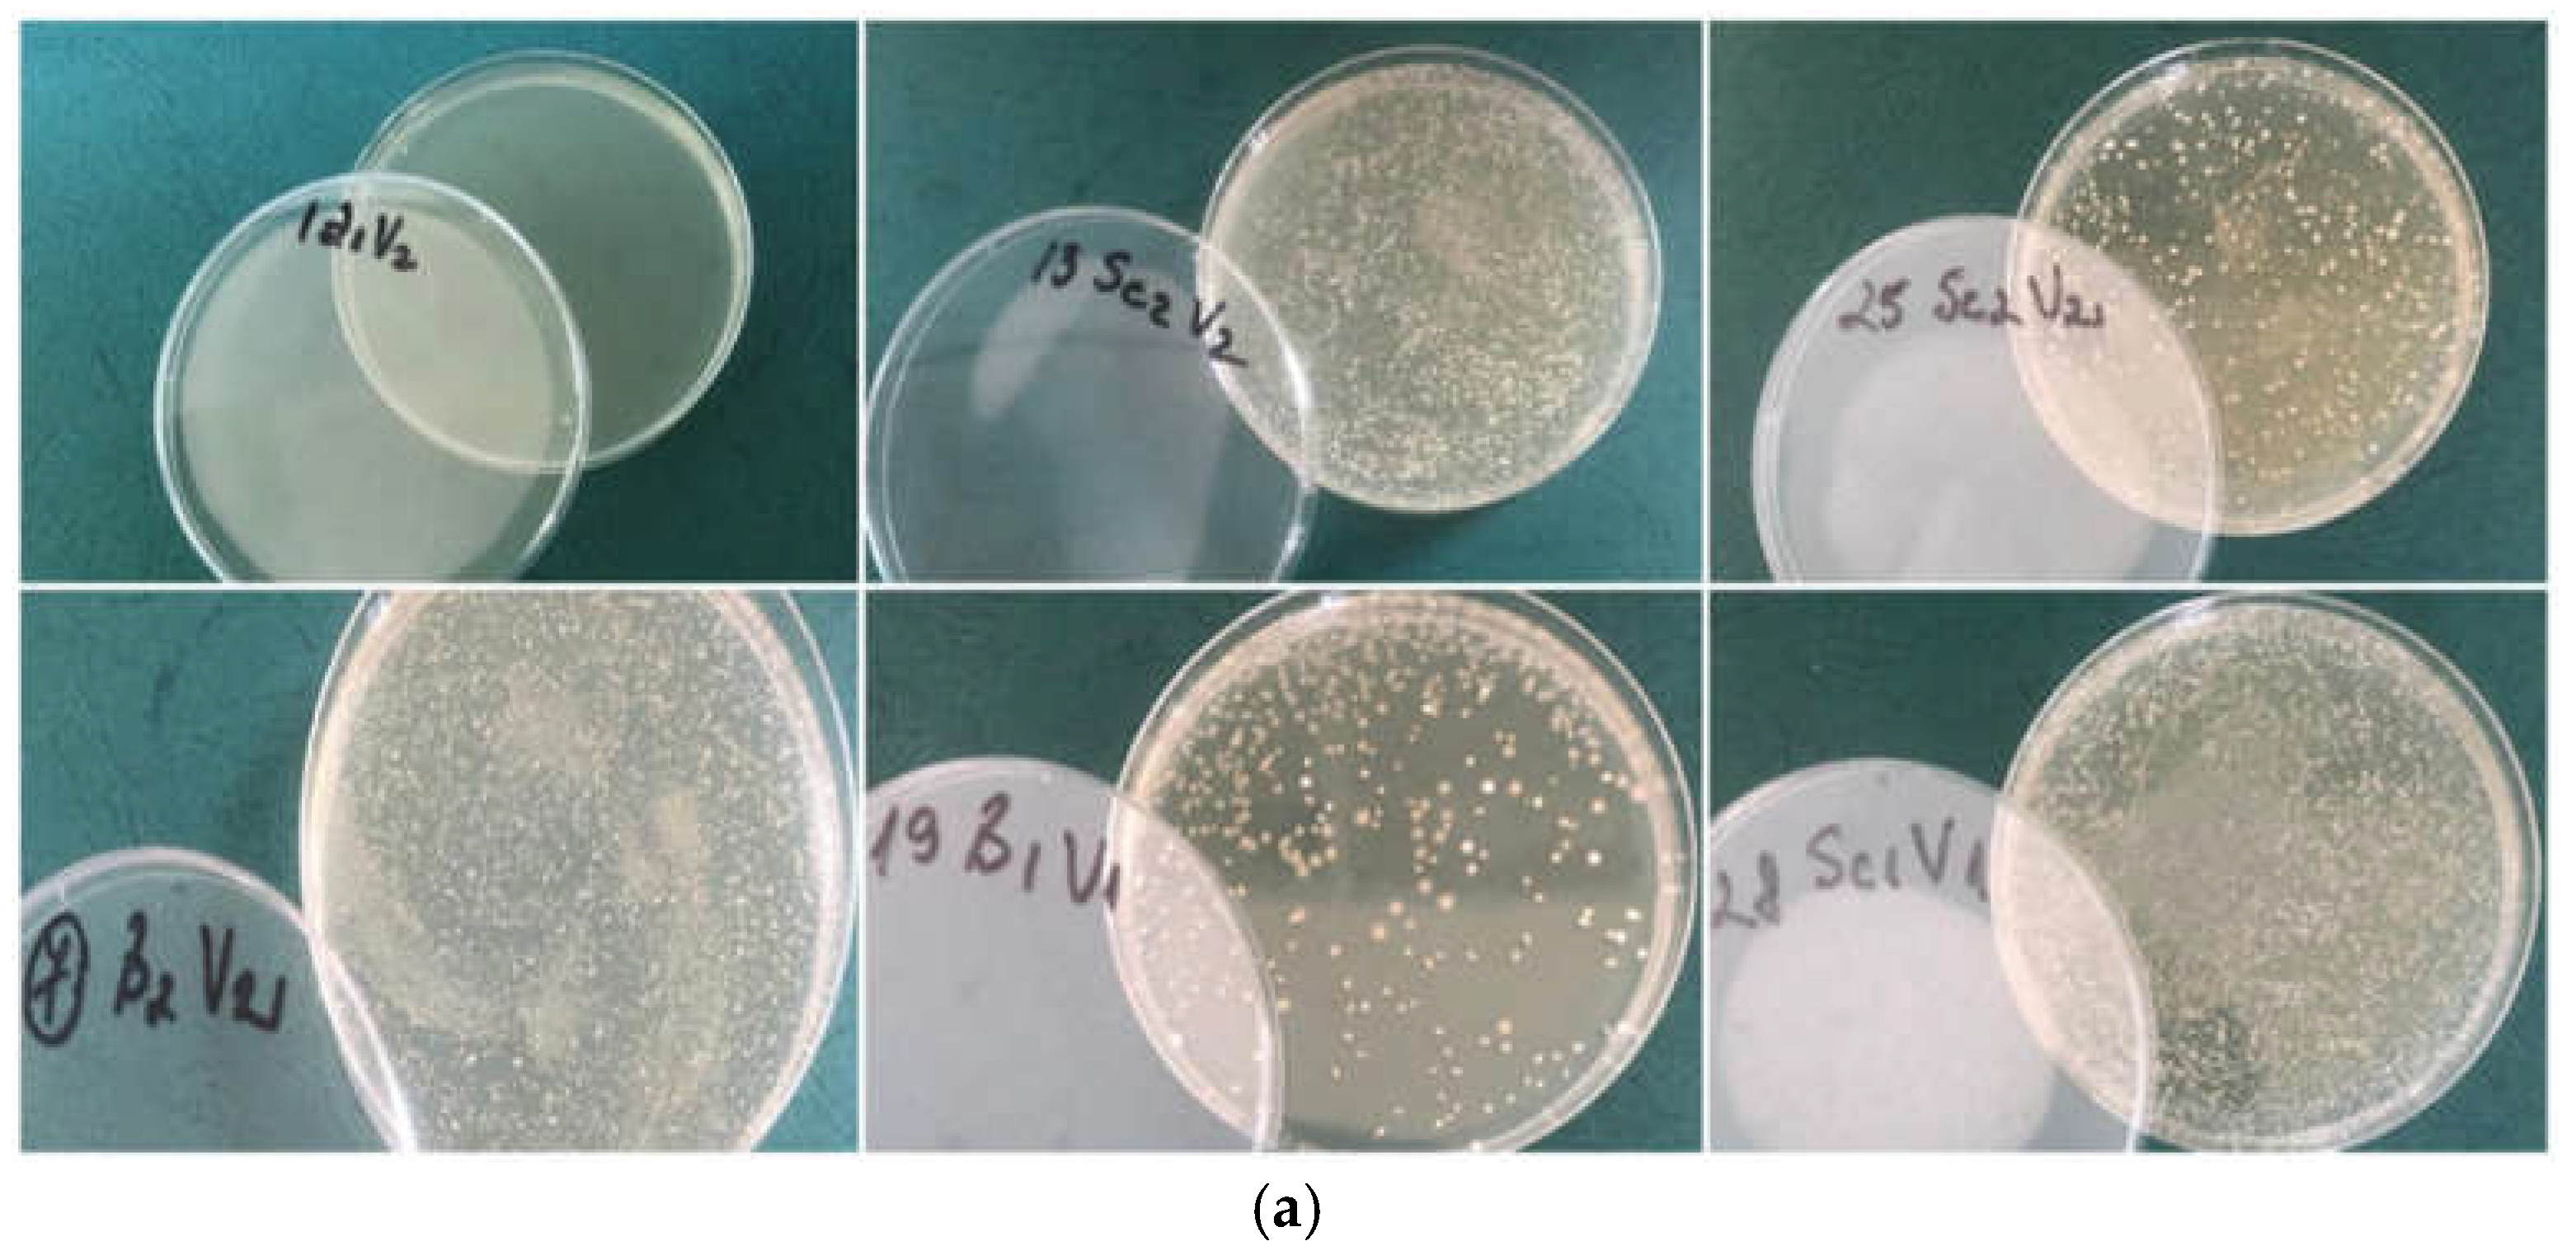
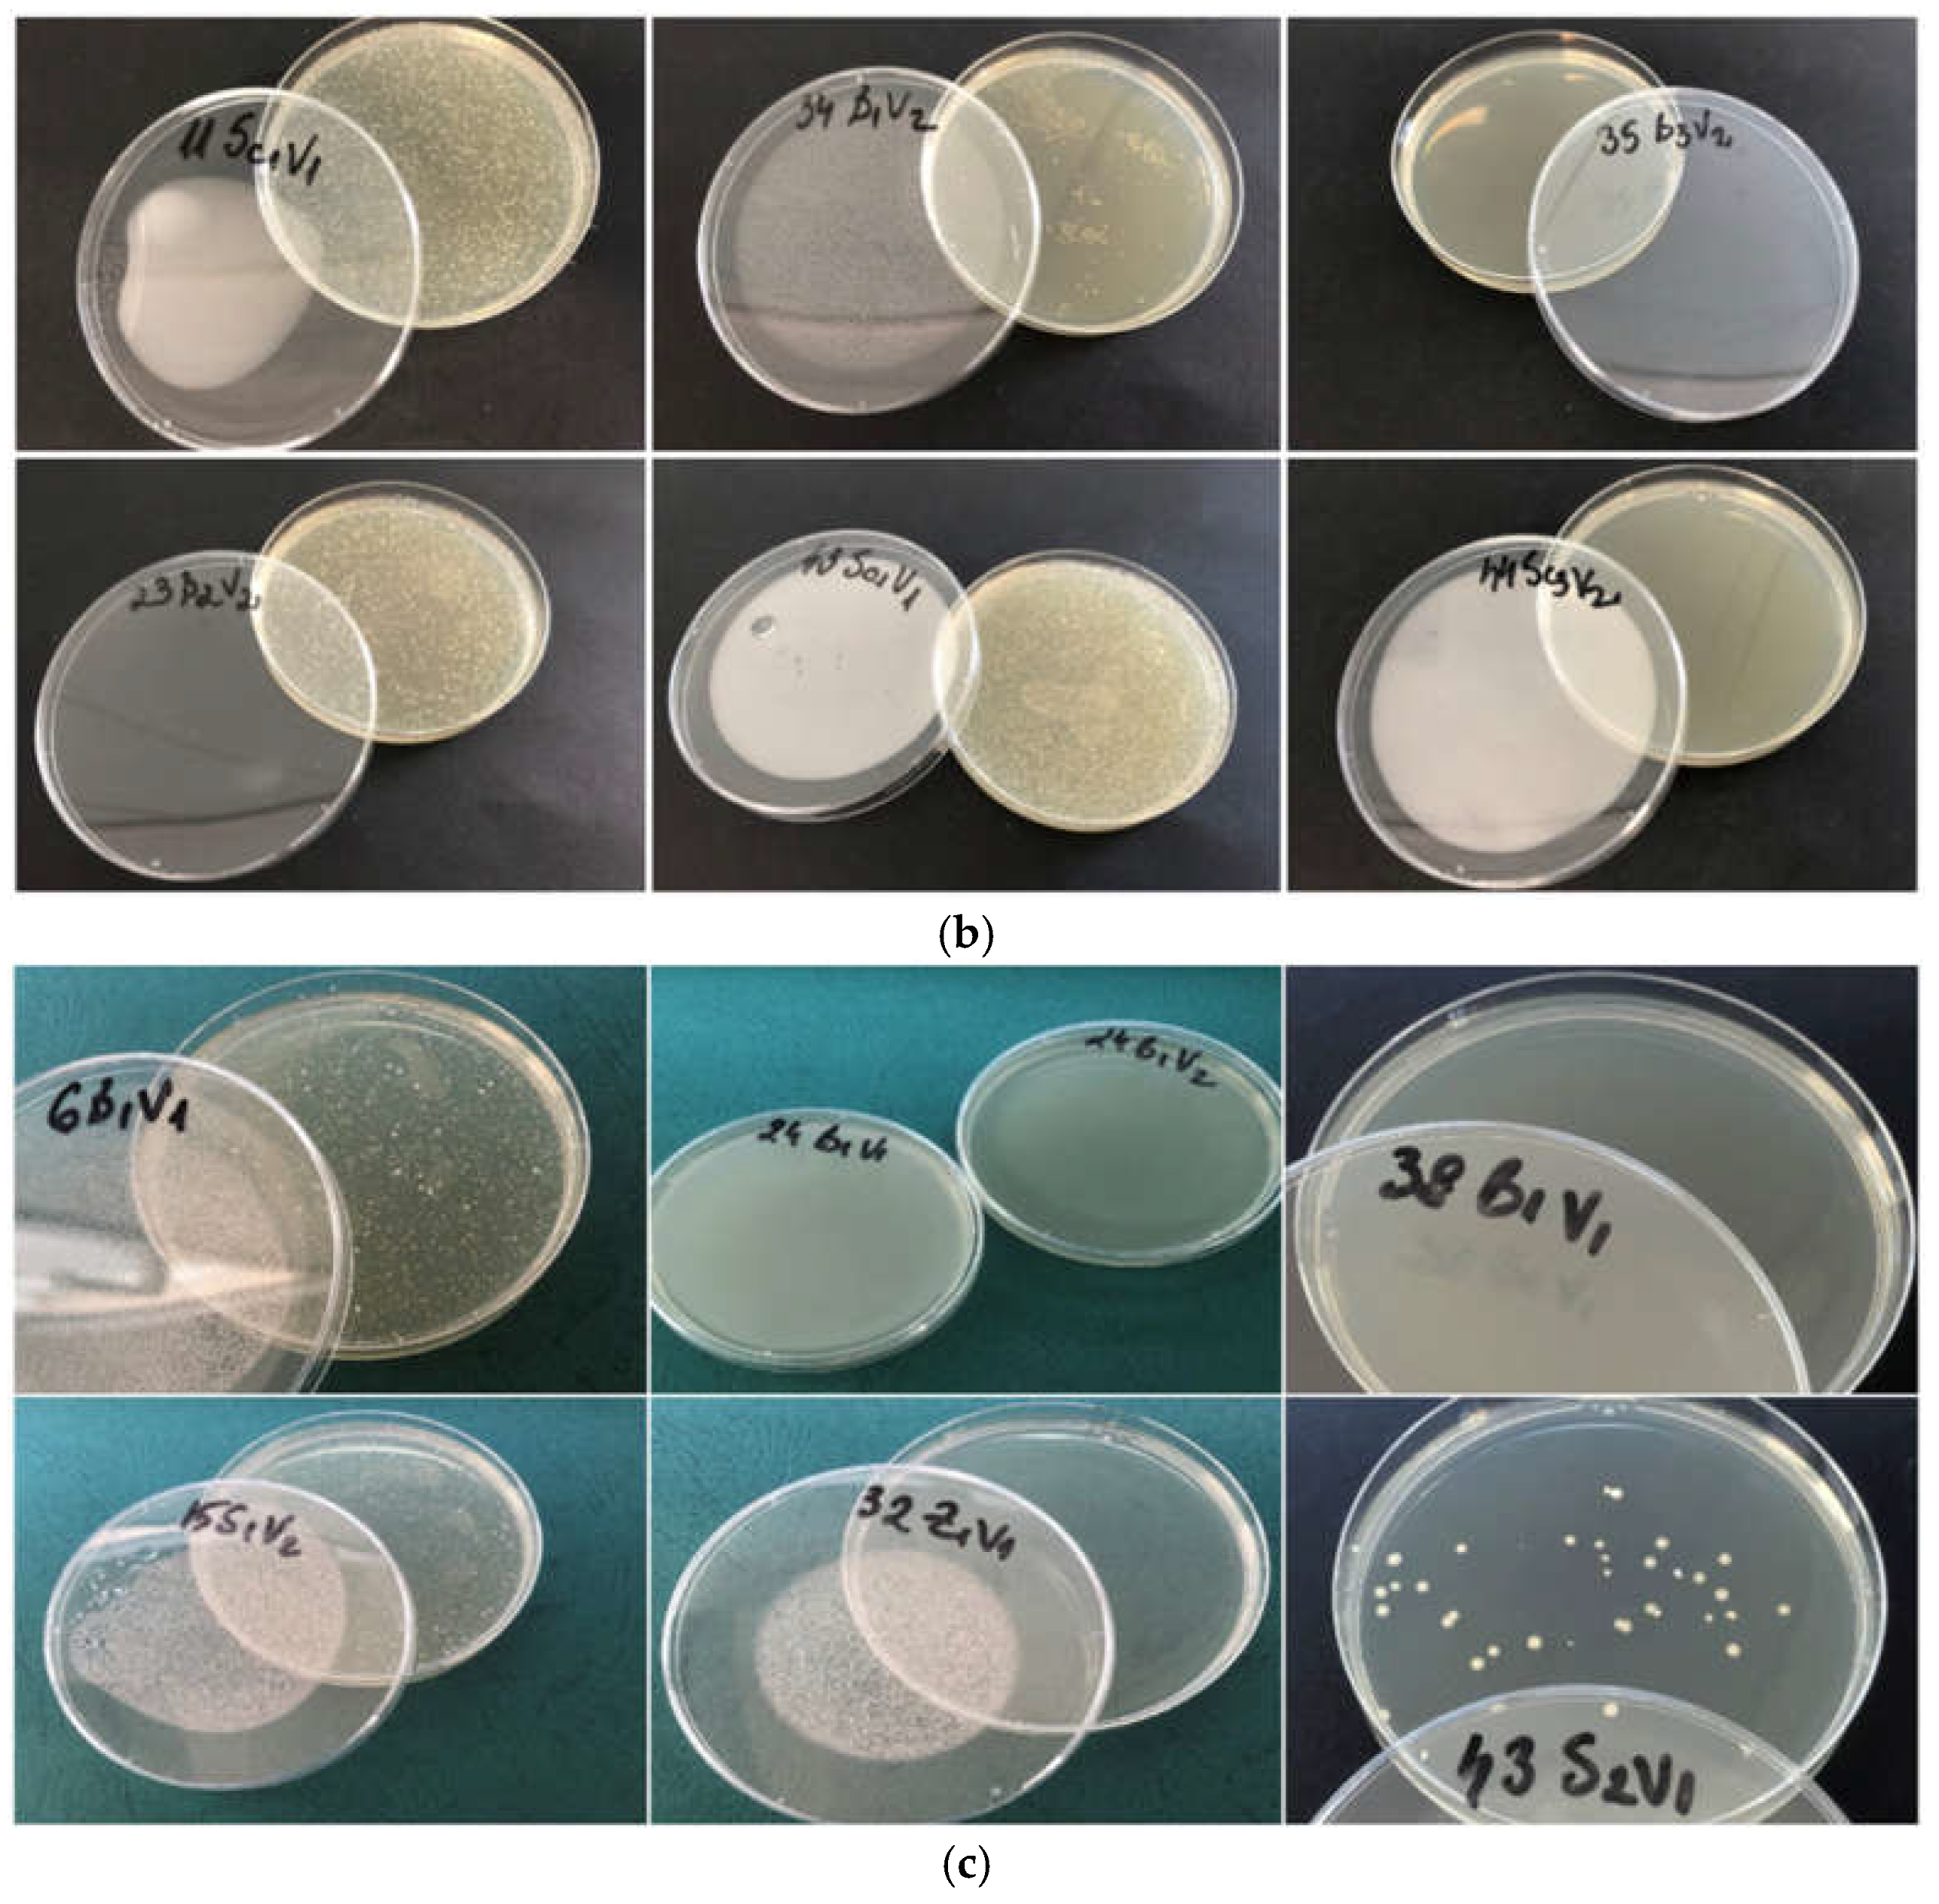
Figure 5.
Acetaldehyde content in wine samples
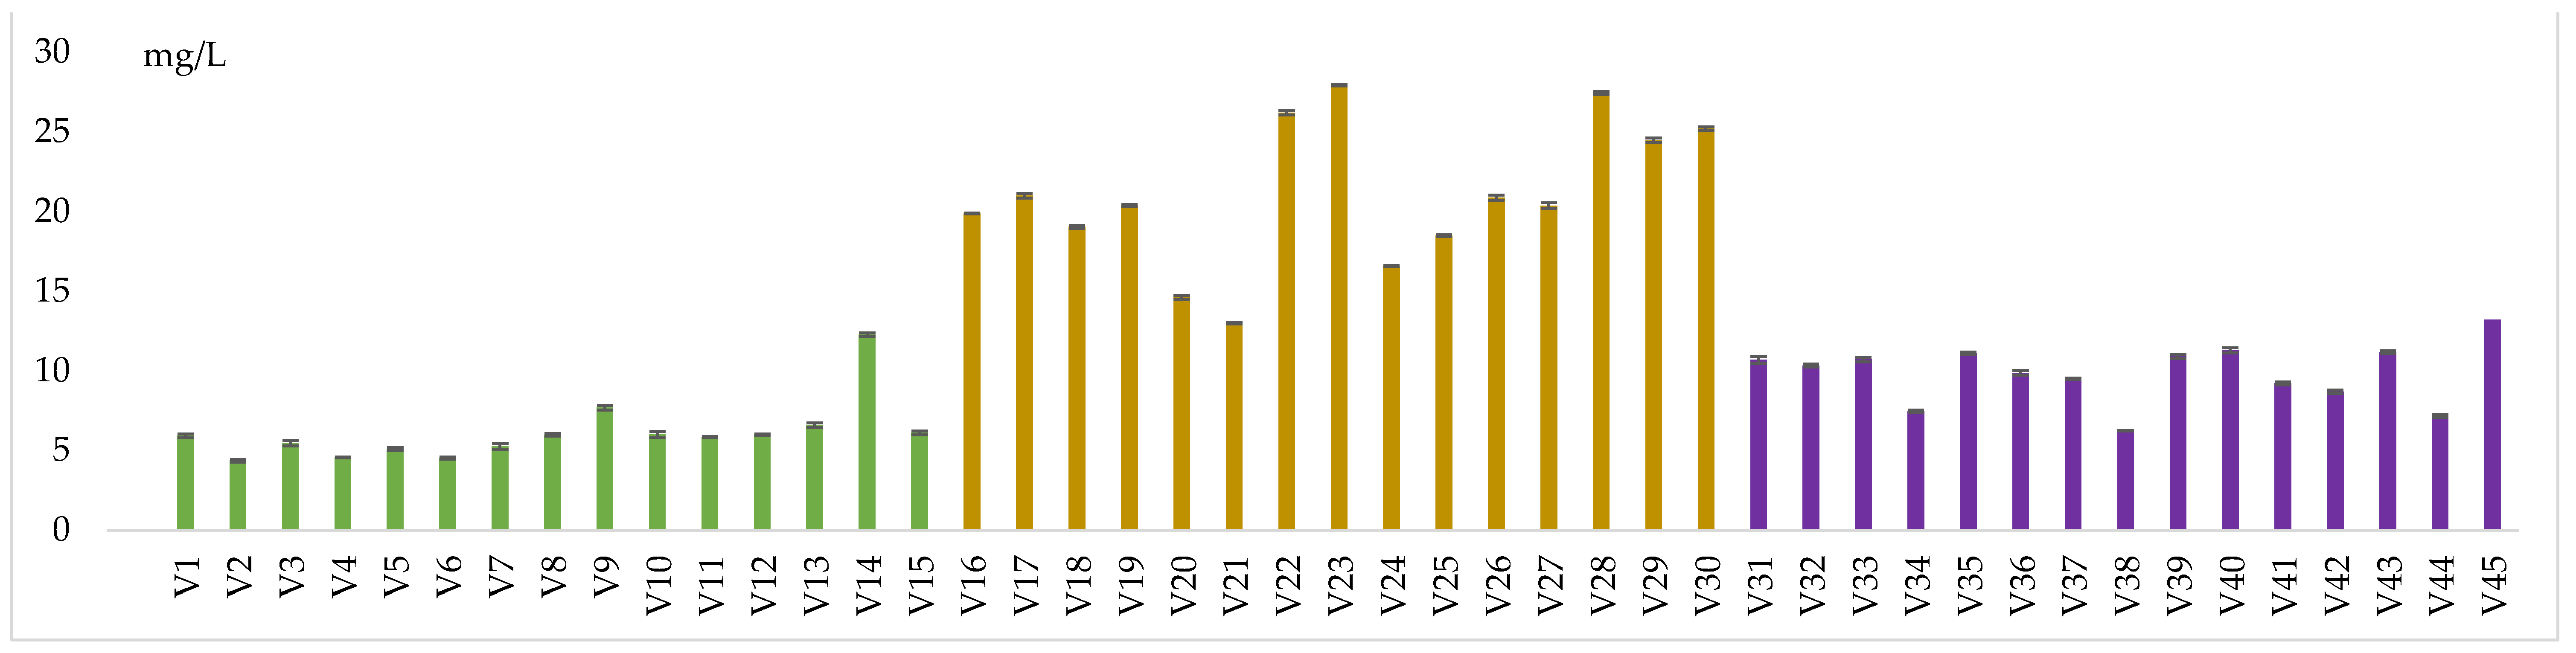
Figure 6.
Methanol content in wine samplesSimilar results were found by our work team, in previous experiments [65,66]. This indicates that the treatments did not significantly impact the sensory profiles of the wines.
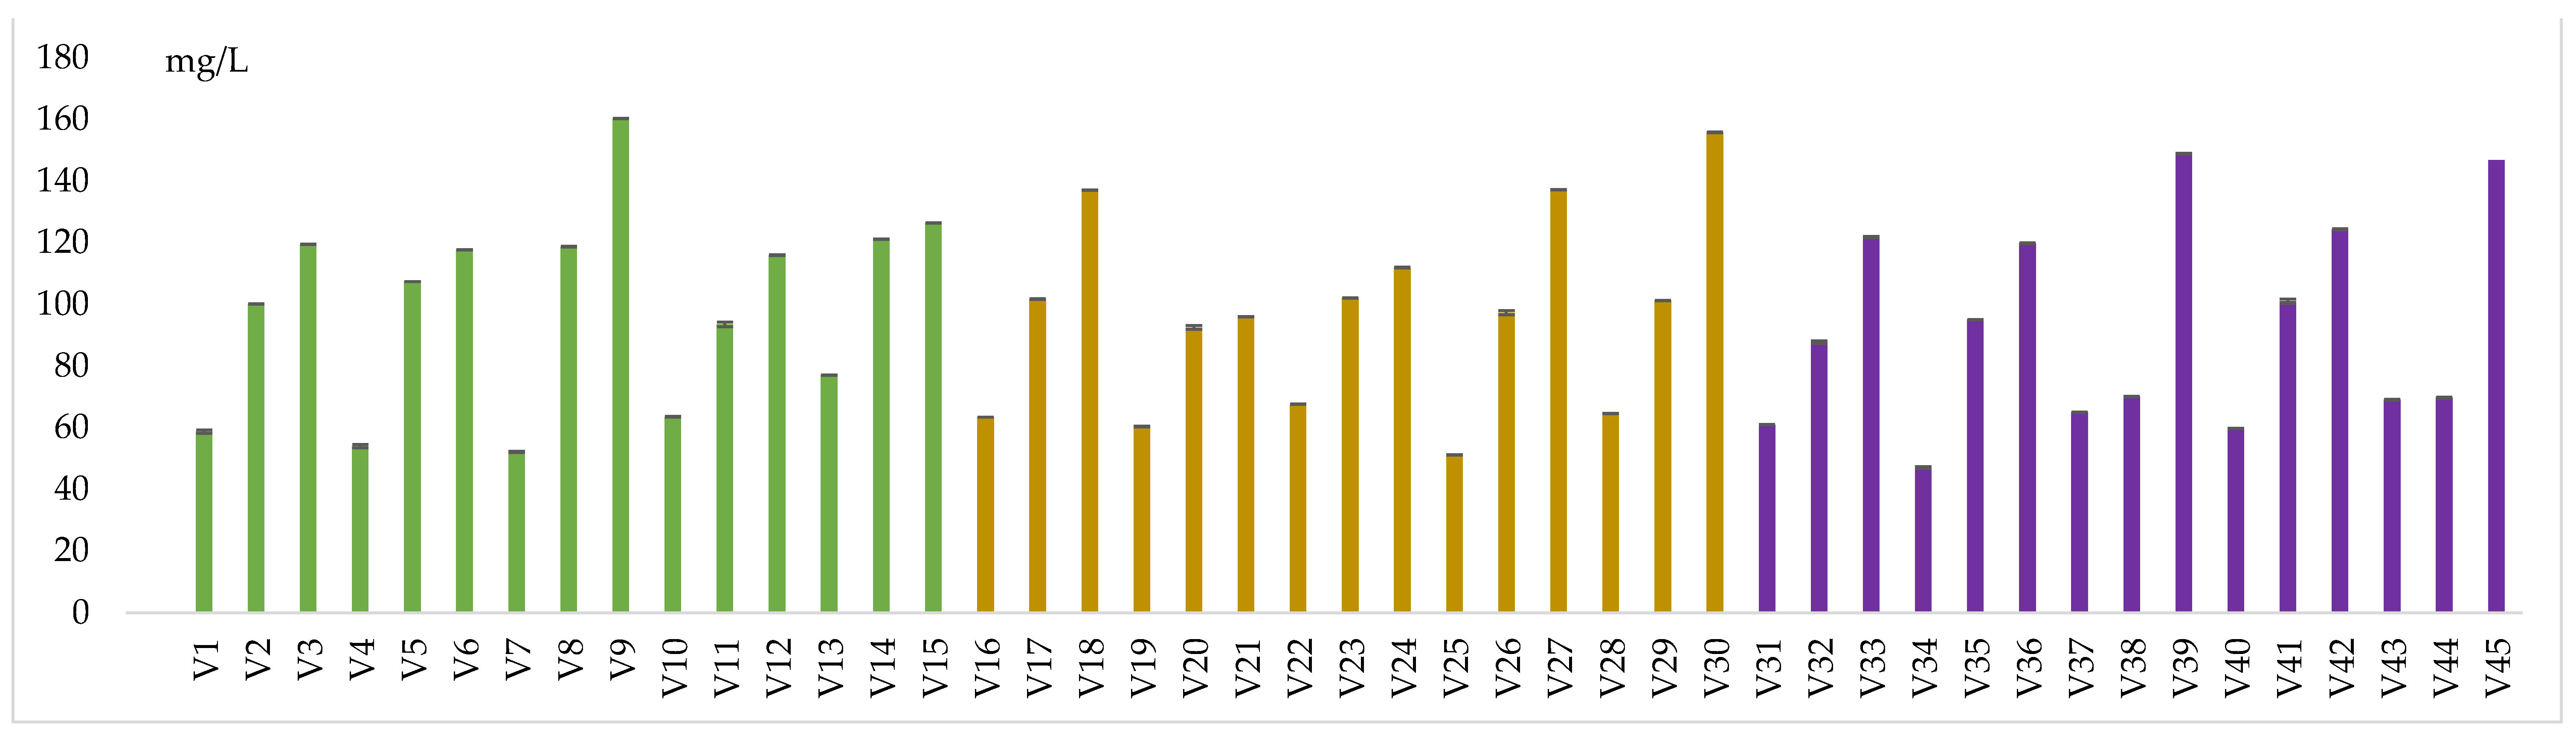
Figure 7.
Standardize coefficients from linear regression model for methanol (a) and acetaldehyde (b) concentration (95% conf. interval).
Figure 7.
Standardize coefficients from linear regression model for methanol (a) and acetaldehyde (b) concentration (95% conf. interval).
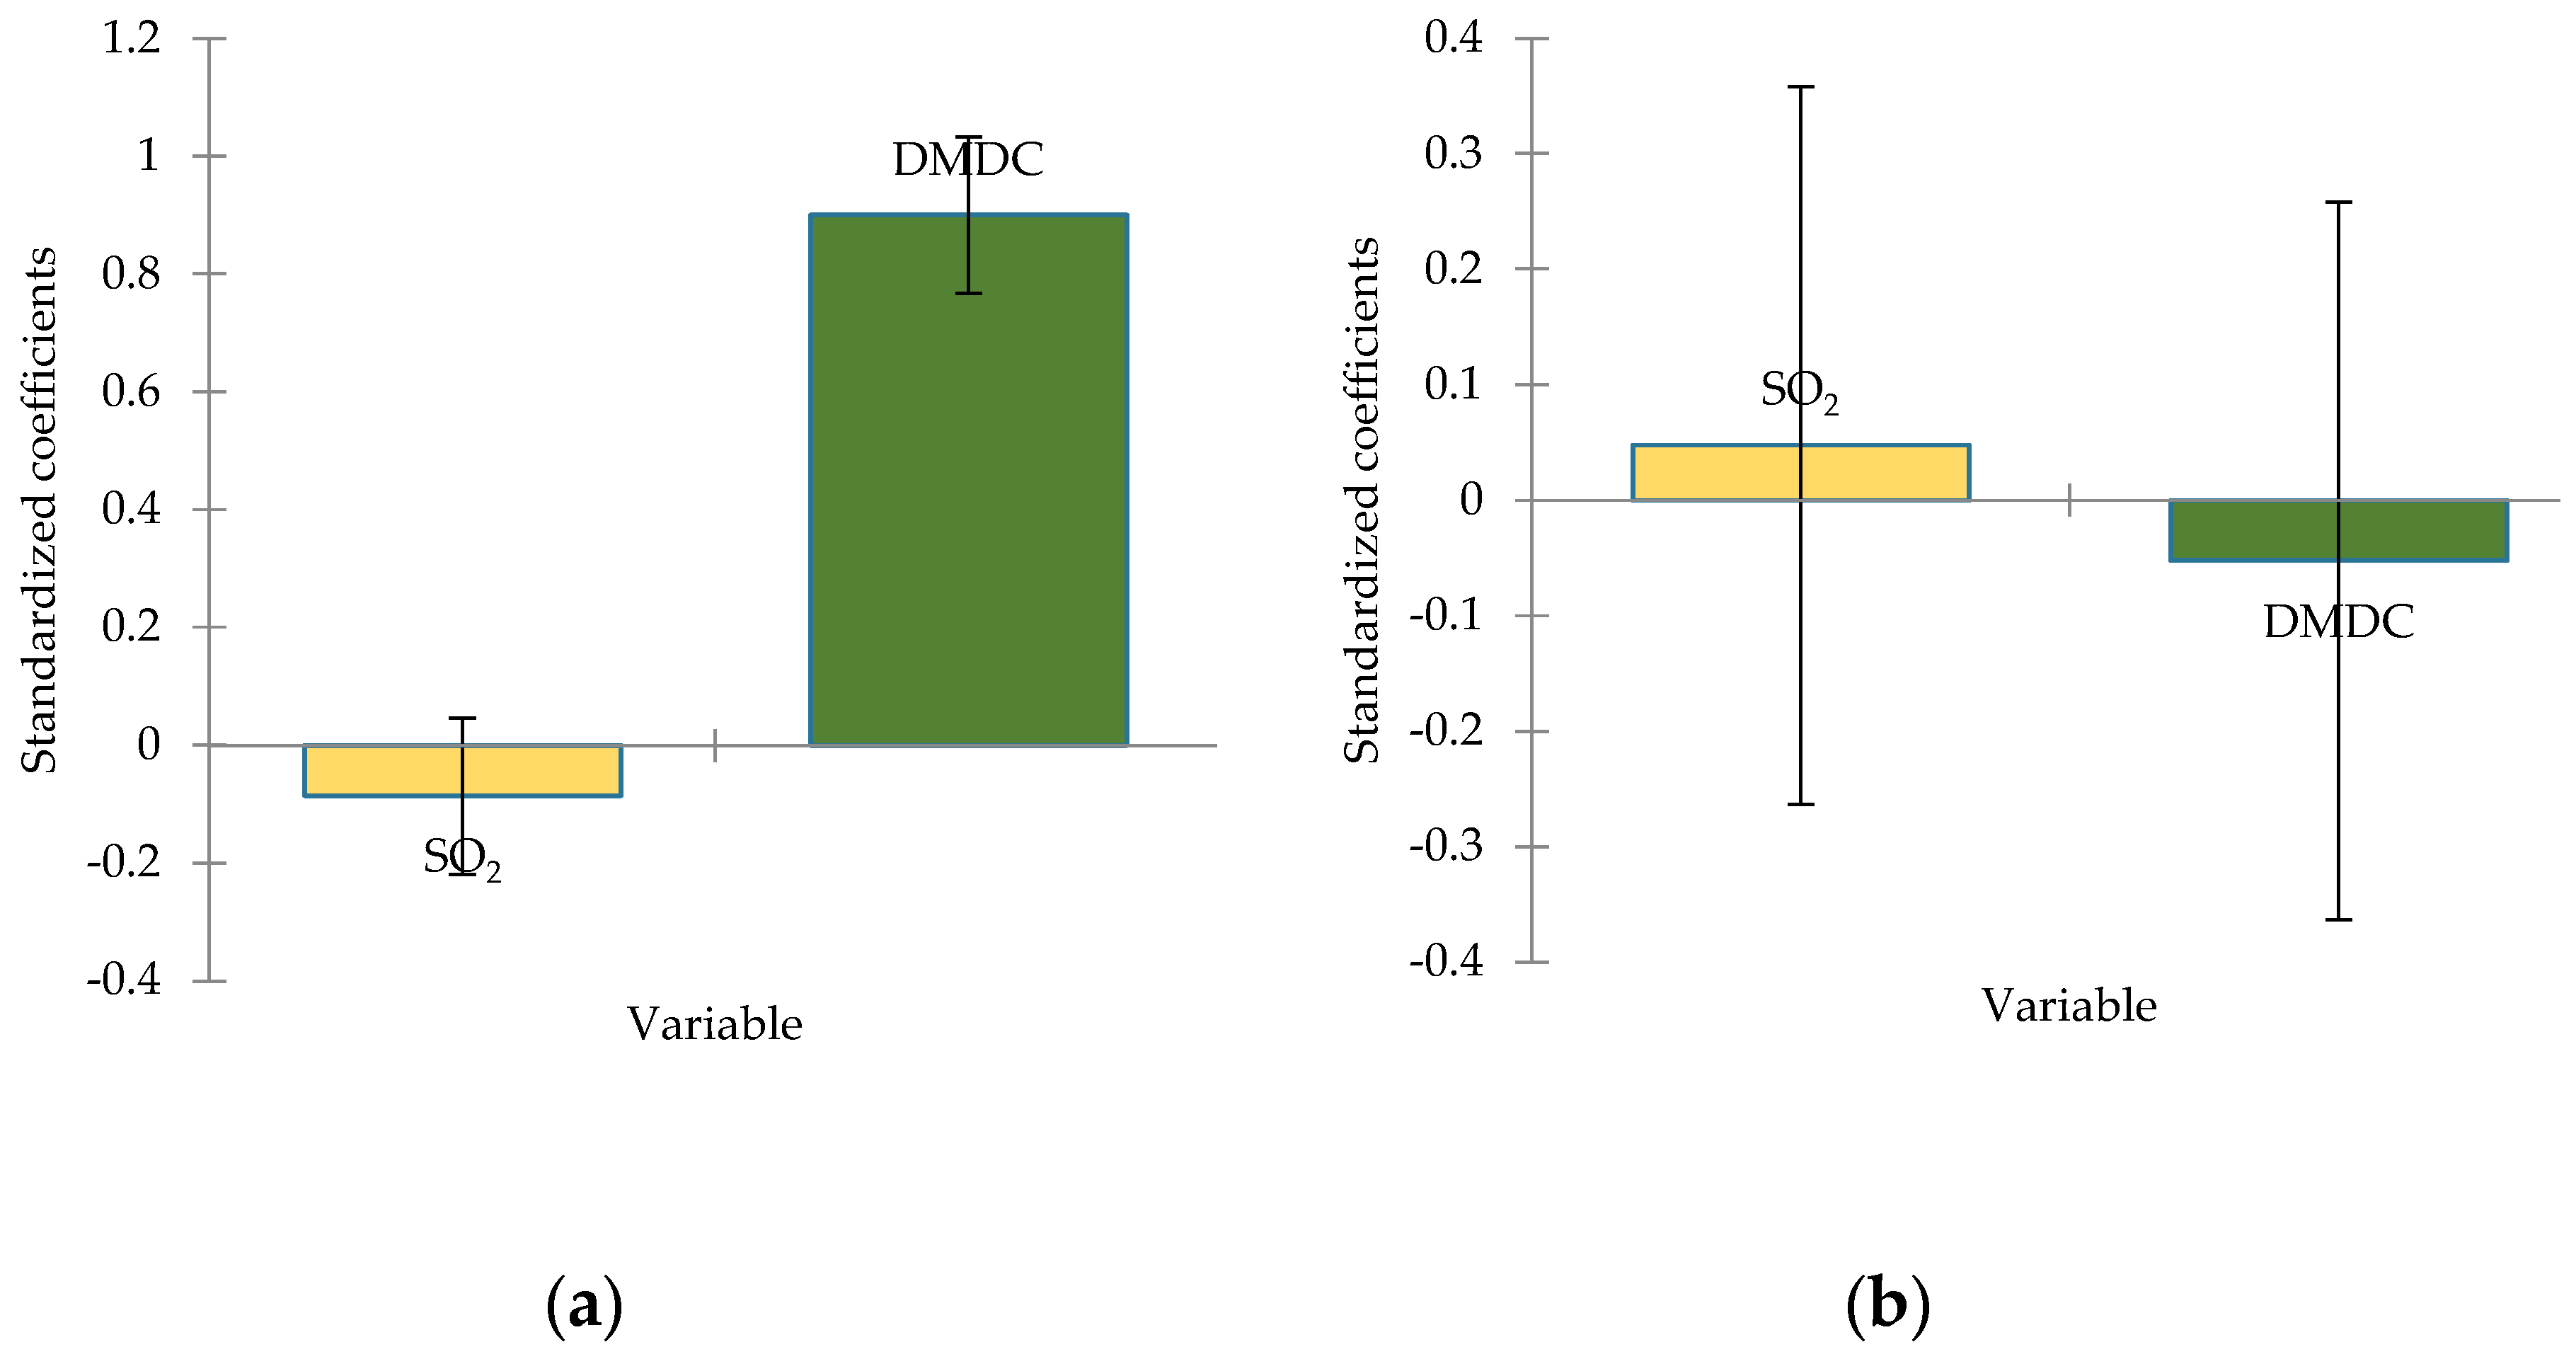
Figure 8.
Heatmap of experimental samples. 1–45 wine samples, D1–grassy, D2–over-ripe fruits, D3–cooked fruits, D4–plums, D5–cooked apple core, D6–grapefruit, D7–green fruits, D8–green apple, D9–honey/comb, D10–wild flowers, D11–acid, D12–salted, D13–bitter, D14–sweet, D15–onctuos, D16–phenolic, D17–vegetal, D18–crisp, D19–jam, D20–refermentation, D21–oxidation. Green indicates lower values of the descriptors, red represents higher values, while white and lighter tones signify intermediate values.
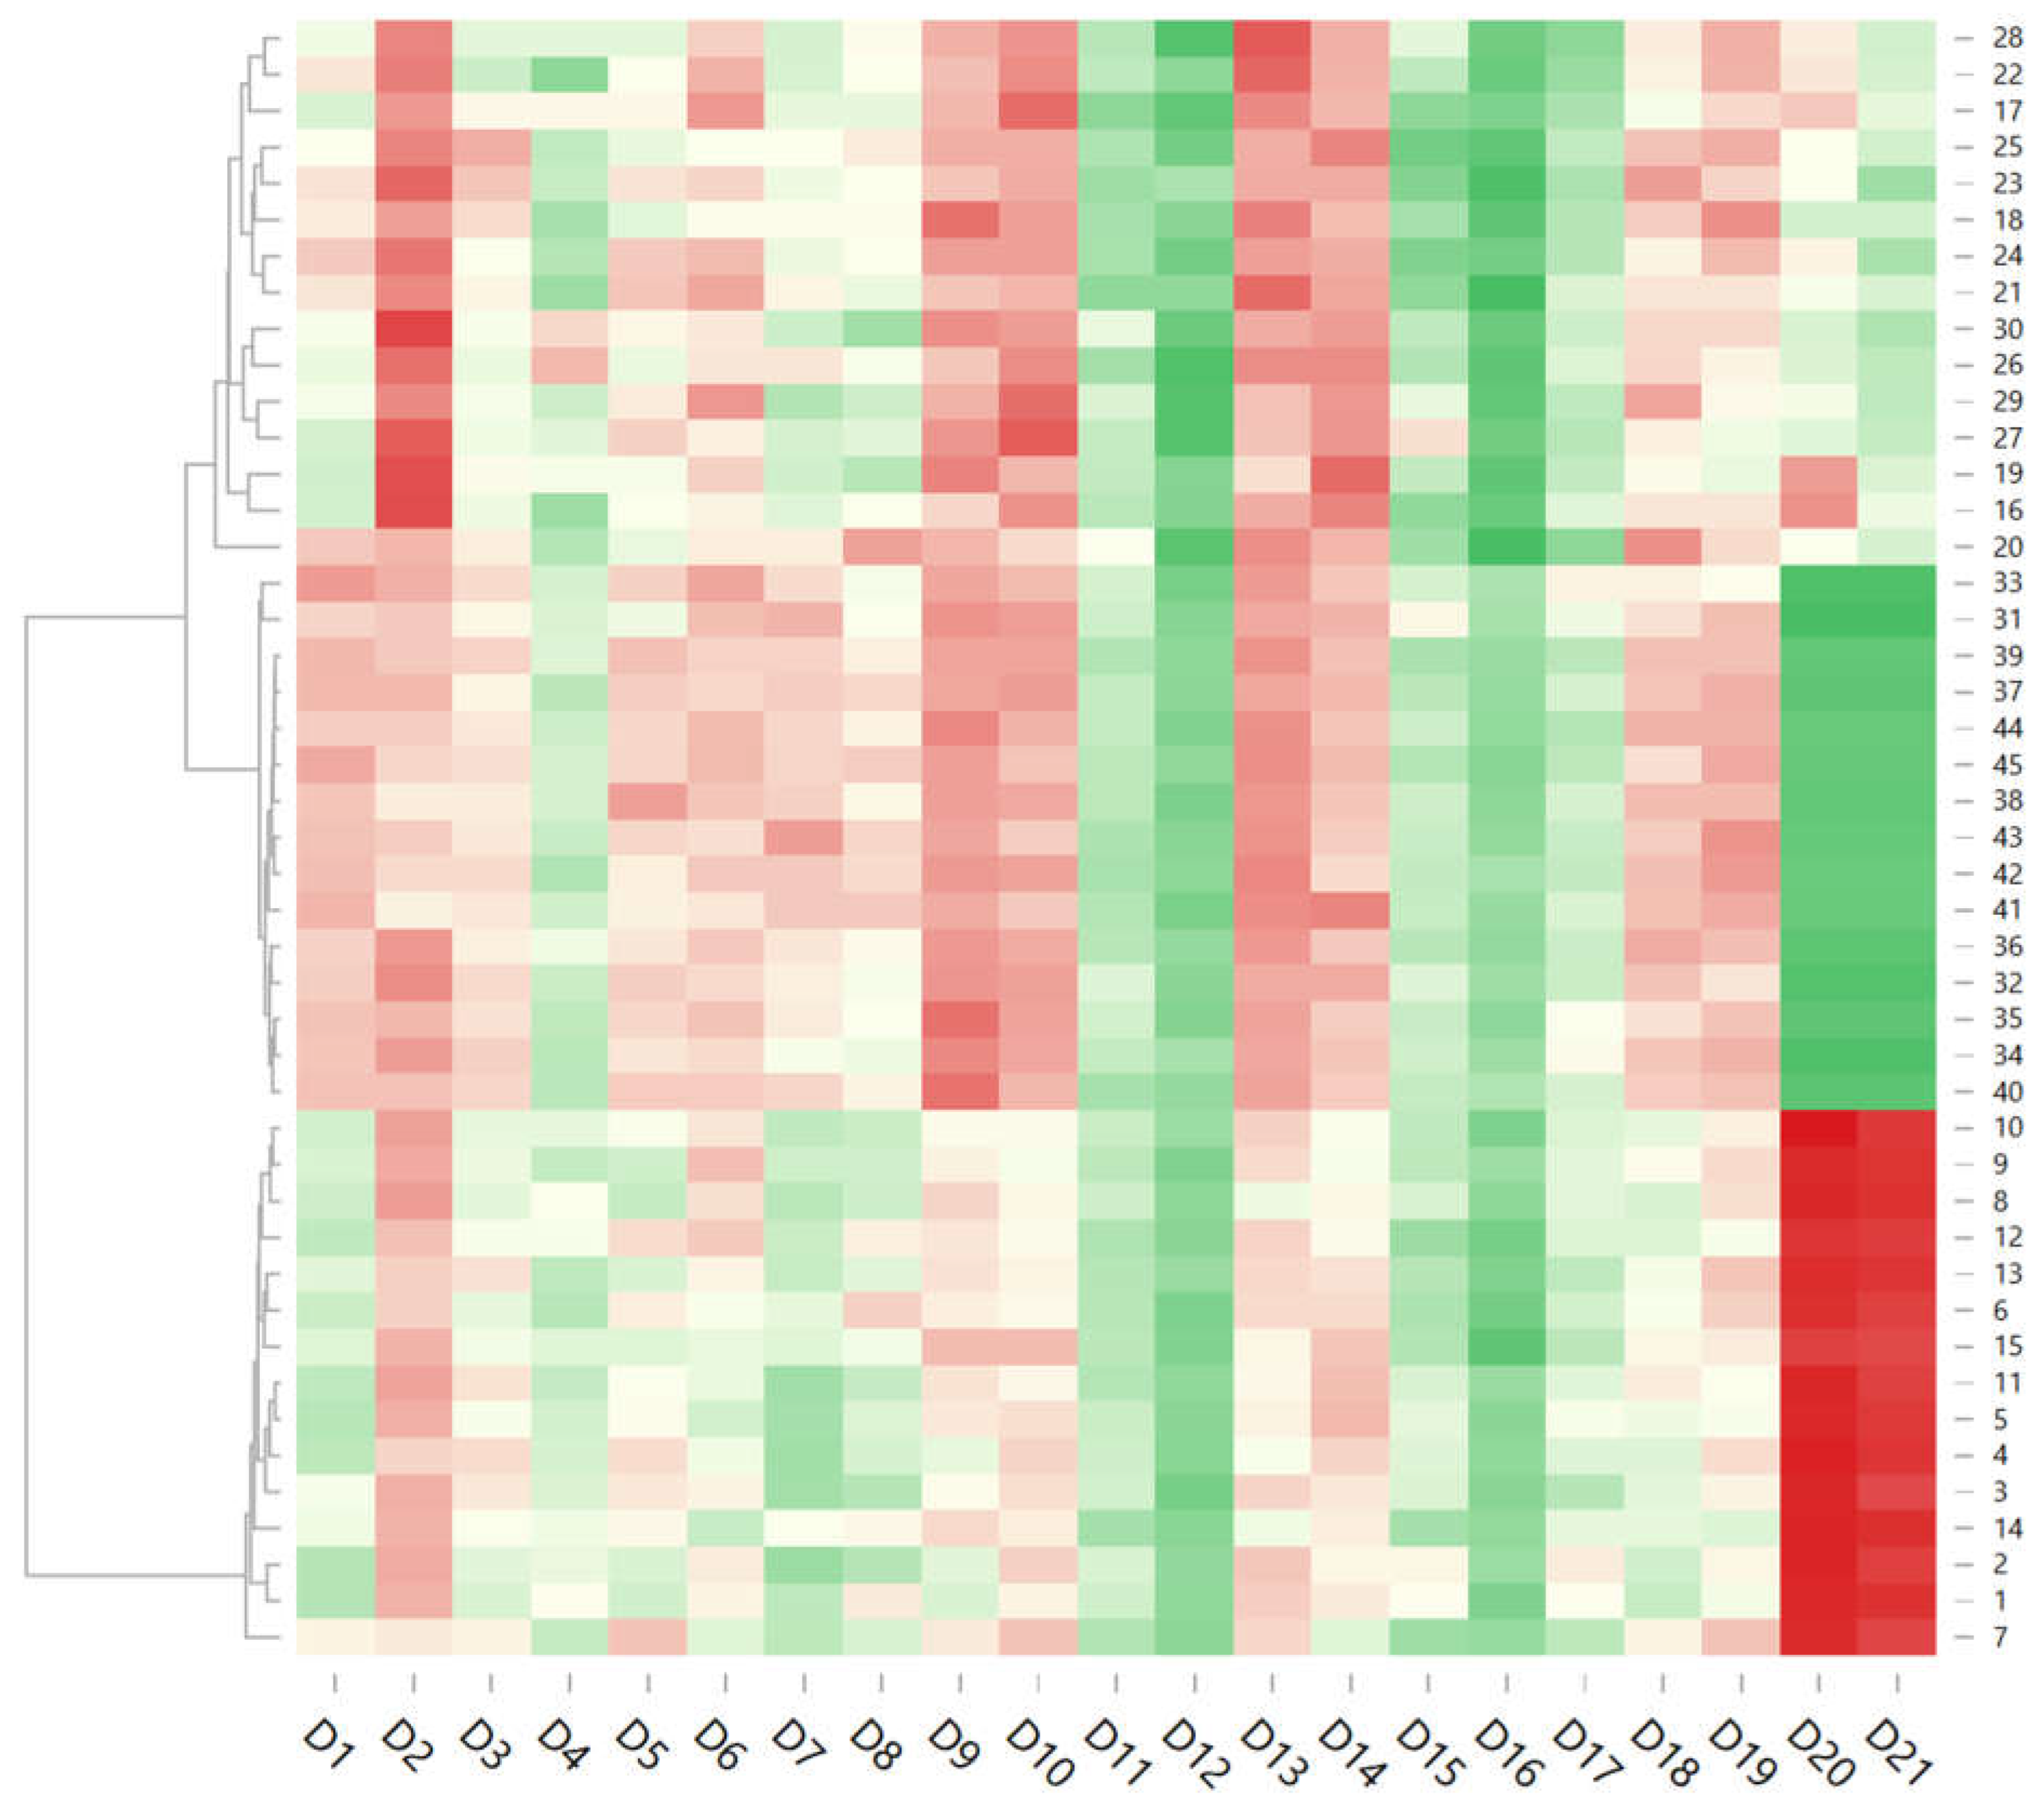

Table 1.
Experimental samples.
| Variant | Yeast | cfu/mL | SO2 mL | DMDC mg/L | Variant | Yeast | cfu/mL | SO2 ml | DMDC mg/L |
Variant | Yeast | SO2 mL | cfu/ mL |
DMDC mg/L |
|---|---|---|---|---|---|---|---|---|---|---|---|---|---|---|
| V1 | Without yeast | 0 | 40 | 0 | V16 | Without yeast | 0 | 80 | 0 | V31 | Without yeast | 160 | 0 | 0 |
| V2 | 100 | V17 | 100 | V32 | 100 | |||||||||
| V3 | 200 | V18 | 200 | V33 | 200 | |||||||||
| V4 |
Brettanomyces bruxellensis |
30 | 0 | V19 |
Brettanomyces bruxellensis |
30 | 0 | V34 |
Brettanomyces bruxellensis |
30 | 0 | |||
| V5 | 100 | V20 | 100 | V35 | 100 | |||||||||
| V6 | 200 | V21 | 200 | V36 | 200 | |||||||||
| V7 | 100 | 0 | V22 | 100 | 0 | V37 | 100 | 0 | ||||||
| V8 | 100 | V23 | 100 | V38 | 100 | |||||||||
| V9 | 200 | V24 | 200 | V39 | 200 | |||||||||
| V10 | Schizzossacharomyces pombe | 30 | 0 | V25 | Schizossacharomyces pombe | 30 | 0 | V40 | Schizossacharomyces pombe | 30 | 0 | |||
| V11 | 100 | V26 | 100 | V41 | 100 | |||||||||
| V12 | 200 | V27 | 200 | V42 | 200 | |||||||||
| V13 | 100 | 0 | V28 | 100 | 0 | V43 | 100 | 0 | ||||||
| V14 | 100 | V29 | 100 | V44 | 100 | |||||||||
| V15 | 200 | V30 | 200 | V45 | 200 |
V1,V2,V3,V16,V17,V18,V31,V32,V33–wine samples, without pathogen yeast inoculation, considered control for this research, DMDC–dimethyl dicarbonate, SO2–sulphur dioxide 6%, cfu–colony forming units.
Table 2.
Physico-chemical characteristics of variants.
| Variants | Alc. strength % vol. alc. |
Tot. acidity g/L ac. tartaric |
Vol. acidity g/L ac. |
Res. sugars g/L |
Density | pH | Free SO2 mg/L |
Tot. SO2 mg/L |
|---|---|---|---|---|---|---|---|---|
| 40 mg/L SO2 with/without DMDC | ||||||||
| V1 | 14.20±0.23ab | 5.80±0.04a | 0.30±0.13a | 20.70±0.19ghi | 0.9971±0.24a | 3.42±0.07a | 10±0.24b | 40±0.05b |
| V2 | 14.30±0.04abc | 5.80±0.16a | 0.27±0.23a | 21.10±0.13ijk | 0.9969±0.05a | 3.40±0.08a | 10±0.15b | 40±0.12b |
| V3 | 14.30±0.19abc | 5.82±0.13a | 0.21±0.19a | 21.60±0.07lmno | 0.9972±0.04a | 3.26±0.16a | 11±0.18b | 40±0.15b |
| V4 | 14.60±0.07abcde | 6.20±0.16a | 0.19±0.24a | 22.00±0.23o | 0.9975±0.13a | 3.36±0.04a | 10±0.11b | 40±0.18b |
| V5 | 14.70±0.03bcdef | 5.90±0.07a | 0.21±0.19a | 21.00±0.23jk | 0.9972±0.13a | 3.41±0.16a | 10±0.11b | 40±0.05b |
| V6 | 14.80±0.18cdef | 6.10±0.24a | 0.18±0.04a | 20.50±0.19fgh | 0.9970±0.23a | 3.23±0.13a | 11±0.15b | 40±0.19b |
| V7 | 14.50±0.24abcd | 5.90±0.04a | 0.28±0.07a | 21.80±0.13no | 0.9970±0.16a | 3.41±0.23a | 10±0.03b | 39±0.03a |
| V8 | 14.30±0.05abc | 5.90±0.04a | 0.26±0.24a | 19.90±0.16cde | 0.9972±0.05a | 3.41±0.01a | 10±0.03a | 39±0.11a |
| V9 | 14.50±0.12abcd | 5.90±0.04a | 0.19±0.23a | 21.30±0.24klm | 0.9970±0.13a | 3.24±0.16a | 11±0.11b | 40±0.05b |
| V10 | 15.00±0.23def | 6.00±0.13a | 0.21±0.19a | 21.70±0.01mno | 0.9967±0.16a | 3.38±0.24a | 10±0.19b | 39±0.13a |
| V11 | 14.80±0.08cdef | 6.12±0.16a | 0.20±0.13a | 21.20±0.19jkl | 0.9972±0.24a | 3.25±0.04a | 11±0.04b | 40±0.00b |
| V12 | 14.80±0.29cdef | 6.43±0.23a | 0.16±0.13a | 19.20±0.24b | 0.9972±0.08a | 3.26±0.04a | 11±0.22b | 40±0.05b |
| V13 | 14.70±0.16bcdef | 5.90±0.19a | 0.28±0.13a | 20.30±0.04efg | 0.9967±0.16a | 3.37±0.24a | 10±0.03b | 39±0.19a |
| V14 | 14.90±0.04def | 6.12±0.16a | 0.18±0.13a | 21.70±0.19mno | 0.9970±0.23a | 3.21±0.04a | 11±0.05b | 39±0.15a |
| V15 | 14.80±0.26cdef | 6.30±0.16a | 0.18±0.13a | 21.10±0.24ijk | 0.9972±0.04a | 3.23±0.23a | 11±0.11b | 40±0.19b |
| p-value (V1-V15) | <0.001* | 0.681 | 0.681 | <0.001* | 1.000 | 0.550 | 0.122 | 1.000 |
| 80 mg/L SO2 with/without DMDC | ||||||||
| V16 | 15.20±0.02f | 6.28±0.09a | 0.17±0.01a | 20.70±0.19ghi | 0.9969±0.08a | 3.25±0.13a | 31±0.24c | 79±0.13c |
| V17 | 15.20±0.13f | 6.12±0.01a | 0.18±0.08a | 21.30±0.02klm | 0.9968±0.03a | 3.21±0.08a | 31±0.05c | 79±0.05c |
| V18 | 15.10±0.01ef | 6.43±0.02a | 0.20±0.01a | 18.50±0.19a | 0.9971±0.11a | 3.26±0.04a | 31±0.07c | 79±0.24c |
| V19 | 15.10±0.08ef | 6.12±0.19a | 0.18±0.07a | 21.00±0.02ijk | 0.9971±0.07a | 3.21±0.15a | 31±0.11c | 79±0.11c |
| V20 | 15.10±0.11ef | 6.43±0.08a | 0.16±0.07a | 19.60±0.01bc | 0.9971±0.02a | 3.27±0.19a | 31±0.03c | 79±0.08c |
| V21 | 15.10±0.21ef | 6.12±0.19a | 0.20±0.13a | 21.40±0.01klmn | 0.9967±0.03a | 3.21±0.08a | 31±0.19c | 79±0.02c |
| V22 | 15.10±0.22ef | 6.12±0.02a | 0.18±0.08a | 21.60±0.07lmno | 0.9973±0.01a | 3.21±0.08a | 31±0.13c | 79±0.15c |
| V23 | 15.00±0.26def | 6.12±0.02a | 0.17±0.03a | 21.20±0.08jkl | 0.9970±0.15a | 3.20±0.07a | 31±0.05c | 79±0.12c |
| V24 | 15.00±0.06def | 6.28±0.13a | 0.18±0.01a | 21.90±0.15o | 0.9975±0.02a | 3.21±0.03a | 31±0.09c | 79±0.03c |
| V25 | 15.00±0.11def | 6.43±0.08a | 0.13±0.02a | 20.10±0.04def | 0.9971±0.13a | 3.27±0.07a | 31±0.00c | 79±0.03c |
| V26 | 15.00±0.17def | 6.12±0.09a | 0.17±0.01a | 20.80±0.08hij | 0.9968±0.04a | 3.22±0.13a | 31±0.05c | 79±0.14c |
| V27 | 15.00±0.27def | 6.12±0.13a | 0.13±0.09a | 19.70±0.03cd | 0.9965±0.13a | 3.22±0.01a | 31±0.03c | 79±0.05c |
| V28 | 14.90±0.12def | 6.12±0.13a | 0.18±0.02a | 21.30±0.08klm | 0.9972±0.07a | 3.22±0.09a | 31±0.19c | 79±0.01c |
| V29 | 14.90±0.14def | 6.28±0.08a | 0.17±0.01a | 20.70±0.13ghi | 0.9966±0.04a | 3.22±0.09a | 31±0.15c | 79±0.02c |
| V30 | 14.80±0.21cdef | 6.12±0.13a | 0.19±0.01a | 21.40±0.19klmn | 0.9968±0.08a | 3.21±0.07a | 31±0.11c | 79±0.09c |
| p-value (V16-V30) | 0.972 | 0.129 | 0.129 | <0.001* | 1.000 | 0.999 | 1.000 | 0.972 |
| 160 mg/L SO2 with/without DMDC | ||||||||
| V31 | 14.20±0.13ab | 6.20±0.01a | 0.27±0.19a | 21.30±0.02klm | 0.9953±0.03a | 3.19±0.08a | 95±0.09d | 159±0.28d |
| V32 | 14.30±0.02abc | 6.28±0.01a | 0.27±0.08a | 21.20±0.09jkl | 0.9950±0.04a | 3.19±0.07a | 95±0.23d | 159±0.16d |
| V33 | 14.20±0.19ab | 6.20±0.19a | 0.26±0.03a | 21.30±0.08klm | 0.9953±0.13a | 3.18±0.15a | 95±0.01d | 159±0.24d |
| V34 | 14.20±0.07ab | 6.40±0.13a | 0.25±0.01a | 21.30±0.08klm | 0.9953±0.01a | 3.18±0.19a | 95±0.00d | 159±0.02d |
| V35 | 14.20±0.01ab | 6.28±0.09a | 0.24±0.08a | 21.30±0.09klm | 0.9953±0.07a | 3.18±0.13a | 95±0.28d | 159±0.28d |
| V36 | 14.20±0.03ab | 6.43±0.08a | 0.24±0.02a | 21.30±0.15klm | 0.9953±0.09a | 3.22±0.19a | 95±0.23d | 159±0.07d |
| V37 | 14.10±0.07a | 6.30±0.13a | 0.24±0.04a | 21.40±0.02klmn | 0.9954±0.09a | 3.19±0.08a | 95±0.09d | 159±0.16d |
| V38 | 14.20±0.21ab | 6.20±0.08a | 0.18±0.04a | 21.30±0.07klm | 0.9953±0.13a | 3.18±0.09a | 95±0.03d | 159±0.01d |
| V39 | 14.20±0.15ab | 6.28±0.13a | 0.17±0.09a | 21.30±0.15klm | 0.9953±0.08a | 3.18±0.07a | 95±0.24d | 159±0.28d |
| V40 | 14.20±0.02ab | 6.28±0.13a | 0.17±0.08a | 21.30±0.07klm | 0.9953±0.03a | 3.20±0.09a | 95±0.02d | 159±0.05d |
| V41 | 14.10±0.13a | 6.28±0.15a | 0.16±0.13a | 21.40±0.11klmn | 0.9954±0.19a | 3.17±0.08a | 95±0.07d | 159±0.09d |
| V42 | 14.10±0.21a | 6.28±0.07a | 0.16±0.13a | 21.40±0.15klmn | 0.9954±0.08a | 3.17±0.19a | 95±0.02d | 159±0.24d |
| V43 | 14.10±0.15a | 6.12±0.08a | 0.16±0.07a | 21.40±0.02klmn | 0.9954±0.04a | 3.18±0.13a | 95±0.03d | 159±0.33d |
| V44 | 14.10±0.13a | 6.12±0.04a | 0.16±0.13a | 21.40±0.07klmn | 0.9954±0.15a | 3.18±0.02a | 95±0.07d | 159±0.11d |
| V45 | 14.10±0.03a | 6.12±0.19a | 0.16±0.11a | 21.40±0.09klmn | 0.9954±0.01a | 3.18±0.19a | 95±0.16d | 159±0.00d |
|
p-value (V31-V45) |
0.722 | <0.001* | 0.055 | 0.268 | 1.000 | 1.000 | 1.000 | 0.987 |
|
p-value (V1-V45) |
<0.001* | <0.001* | 0.006* | <0.001* | 1.000 | 0.367 | <0.001* | 0.722 |
The data were obtained in triplicate and represent the arithmetic mean of the results, including the standard deviation. The * highlights a statistically significant difference in the analyzed parameters, depending on the applied treatments. The superscript letters highlight the homogeneous groups for each individual physico-chemical parameter.
Table 3.
Colorimetric parameters of wine samples.
| Samples | Luminosity L 0-100 |
Colorimetric coordinates | |
|---|---|---|---|
| a red (+)/green (-) |
b yellow (+)/blue (-) |
||
| 40 mg SO2 | |||
| V1 | 55.3±0.03a | 8.86±0.19a | 31.29±0.01zd |
| V2 | 58.5±0.11a | 8.52±0.07a | 31.81±0.05zf |
| V3 | 54.7±0.13a | 9.15±0.19a | 32.61±0.09zm |
| V4 | 63.5±0.09a | 8.44±0.18a | 32.40±0.11zj |
| V5 | 60.9±0.20a | 8.74±0.90a | 32.46±0.01zl |
| V6 | 64.2±0.05a | 8.38±0.19a | 31.98±0.03zh |
| V7 | 56.4±0.16a | 9.27±0.09a | 32.41±0.11zk |
| V8 | 54.8±0.07a | 10.09±0.20a | 33.34±0.01zo |
| V9 | 55.5±0.18a | 9.28±0.03a | 31.86±0.07zg |
| V10 | 59.8±0.19a | 9.00±0.11a | 32.82±0.05zn |
| V11 | 67.4±0.01a | 7.95±0.90a | 32.15±0.18zi |
| V12 | 60.2±0.20a | 9.33±0.19a | 30.65±0.01zb |
| V13 | 65.9±0.22a | 7.47±0.03a | 31.13±0.07zc |
| V14 | 61.9±0.11a | 8.91±0.20a | 31.38±0.18ze |
| V15 | 60.2±0.03a | 8.93±0.19a | 32.15±0.09zi |
| p-value (V1-V15) | 0.000* | 0.000* | 0.000* |
| 80 mg SO2 | |||
| V16 | 96.6±0.25b | 1.17±0.03a | 7.39±0.18w |
| V17 | 96.8±0.09b | 1.08±0.05a | 7.31±0.20u |
| V18 | 96.7±0.11b | 1.12±0.19a | 7.29±0.07s |
| V19 | 96.5±0.07b | 1.29±0.01a | 7.48±0.09za |
| V20 | 96.7±0.03b | 1.09±0.05a | 7.37±0.18v |
| V21 | 96.7±0.22b | 1.13±0.09a | 7.29±0.20s |
| V22 | 97.1±0.16b | 0.65±0.11a | 7.12±0.07n |
| V23 | 96.9±0.19b | 0.88±0.20a | 7.20±0.01p |
| V24 | 96.8±0.05b | 0.99±0.03a | 7.25±0.18q |
| V25 | 96.9±0.01b | 0.96±0.07a | 7.17±0.11o |
| V26 | 96.7±0.18b | 1.15±0.09a | 7.41±0.19y |
| V27 | 96.7±0.11b | 1.15±0.05a | 7.40±0.16x |
| V28 | 96.4±0.09b | 1.00±0.03a | 7.26±0.18r |
| V29 | 96.8±0.20b | 0.97±0.11a | 7.30±0.01t |
| V30 | 96.7±0.03b | 0.98±0.07a | 7.37±0.16v |
| p-value (V16-V30) | 0.000* | 0.000* | 0.000* |
| 160 mg SO2 | |||
| V31 | 98.2±0.11 b | -0.25±0.20 a | 5.67±0.01g |
| V32 | 98.2±0.19 b | -0.25±0.18 a | 5.64±0.16f |
| V33 | 98.2±0.01 b | -0.24±0.09 a | 5.67±0.03g |
| V34 | 98.2±0.20 b | -0.36±0.11 a | 5.79±0.13h |
| V35 | 98.2±0.07 b | -0.34±0.19 a | 5.80±0.01i |
| V36 | 98.1±0.09 b | -0.28±0.18 a | 5.85±0.22j |
| V37 | 98.4±0.20 b | -0.40±0.09 a | 5.52±0.03b |
| V38 | 98.4±0.19 b | -0.38±0.05 a | 5.56±0.01d |
| V39 | 98.3±0.03 b | -0.22±0.11 a | 5.62±0.16e |
| V40 | 98.4±0.20 b | -0.31±0.07 a | 5.54±0.09c |
| V41 | 98.2±0.01 b | -0.29±0.05 a | 5.61±0.01a |
| V42 | 98.3±0.09 b | -0.31±0.03 a | 5.51±0.18k |
| V43 | 98.2±0.18 b | -0.22±0.07 a | 5.92±0.01m |
| V44 | 98.1±0.19 b | -0.17±0.09 a | 5.97±0.20l |
| V45 | 98.1±0.11 b | -0.16±0.16 a | 5.96±0.05l |
| p-value (V31-V45) | 0.000 * | 0.000* | 0.000* |
| p-value (V1-V45) | 0.000* | 0.000* | 0.000* |
The data were obtained in triplicate and represent the arithmetic mean of the results, including the standard deviation. The * highlights a statistically significant difference in the analyzed parameters, depending on the applied treatments. The superscript letters highlight the homogeneous groups for each individual chromatic parameter.
Disclaimer/Publisher’s Note: The statements, opinions and data contained in all publications are solely those of the individual author(s) and contributor(s) and not of MDPI and/or the editor(s). MDPI and/or the editor(s) disclaim responsibility for any injury to people or property resulting from any ideas, methods, instructions or products referred to in the content. |
© 2025 by the authors. Licensee MDPI, Basel, Switzerland. This article is an open access article distributed under the terms and conditions of the Creative Commons Attribution (CC BY) license (http://creativecommons.org/licenses/by/4.0/).
Copyright: This open access article is published under a Creative Commons CC BY 4.0 license, which permit the free download, distribution, and reuse, provided that the author and preprint are cited in any reuse.


