Submitted:
24 December 2024
Posted:
27 December 2024
You are already at the latest version
Abstract
Standard algorithms face difficulties when learning from unbalanced datasets because they are built to handle balanced class distributions. Although there are various approaches to solving this issue, solutions that create false data represent a more all-encompassing strategy than algorithmic changes. In particular, they produce fictitious data that any algorithm can use without limiting the user's options. In this paper, we present five oversampling methods: Synthetic Minority Oversampling Technique (SMOTE), Random Over Sampling (ROS), K-Means Smote (KMS), Affinity Propagation and Random Over Sampling-Based Oversampling (APROSO), and Self-Organizing Map-based Oversampling (SOMO). We also present four undersampling methods: Random Under Sampling (RUS), Cluster Centroids (CCs), Neighborhood Cleaning Rule (NCR), Near Miss-1 (NM1). To evaluate those over and under-sampling methods, we have used two different Deep Neural Network (DNN) models, i.e., DNN model 1 and DNN model 2. The empirical result shows that all the over and under-sampling methods are providing more effective results on DNN model 2. The result analysis also shows that the oversampling methods are more effective in classifying the Magnoliopsida and Pinopsida images.
Keywords:
1. Introduction
2. Related Work
2.1. Deep Neural Network
2.2. Data over Sampling Techniques
2.2.1. Smote
2.2.2. Random over Sampler (ROS)
2.2.3. K-Means SMOTE (KMS)
2.2.4. Affinity Propagation and Random over Sampler-Based Oversampling (APROSO)
2.2.5. Self-Organizing Map Oversampling (SOMO)
2.3. Data Under Sampling Techniques
2.3.1. Cluster Centroids (CCs)
2.3.2. Near Miss 1 (NM1)
2.3.3. Random Under Sampler (RUS)
2.3.4. Neighborhood Cleaning Rule (NCR)
2.4. Pros and Cons of oversampling methods

| Method | Pros | Cons |
|---|---|---|
| SMOTE | SMOTE (Synthetic Minority Over-sampling Technique) is a valuable tool for addressing class imbalance in machine learning. It improves model performance [16] and preserves data patterns, reducing overfitting to the majority class [35]. | SMOTE introduces complexity, potentially lengthening training times, and risks overfitting to the minority class [16]. The choice of the k-value can impact results, and SMOTE may generate noisy synthetic samples in certain scenarios [34]. Careful parameter tuning and consideration of dataset characteristics are essential [33]. |
| ROS | Random Over-sampling is a straightforward technique used to balance imbalanced datasets. Its primary advantage is that it effectively increases the representation of the minority class, which can lead to improved model performance [51,52]. | Despite its simplicity, Random Over-sampling has certain drawbacks. It can lead to overfitting, especially when applied excessively [16]. Additionally, it doesn’t introduce new information into the dataset, potentially resulting in a loss of variety in the minority class [53]. Careful consideration of these limitations and experimentation is necessary when employing this technique. |
| K-means SMOTE | K-Means SMOTE is an extension of the SMOTE algorithm that uses clustering to generate synthetic samples. Its advantages include improved handling of class imbalance by creating diverse synthetic samples and its potential to mitigate overfitting [33]. | However, K-Means SMOTE has its limitations. It introduces complexity, which can increase training times, and it may require careful parameter tuning [33]. Additionally, like SMOTE, it can generate noisy synthetic samples, especially in cases of high class overlap [34]. |
| APROSO | Affinity propagation is a method of identifying clusters and selecting high-quality exemplars through communication between data points [54]. When it comes to large scale datasets, Affinity Propagation is an effective method to use [55]. | Affinity propagation algorithm is not efficient for solving high-dimensional problems [56]. |
| SOMO | SOMO effectively identifies oversampling areas and helps to avoid noisy examples [57]. SOM provides data distribution visualization [58]. | The self-organizing map is not capable of detecting small shifts in individual pixels [59]. |
2.5. Pros and cons of Undersampling Methods
| Method | Pros | Cons |
|---|---|---|
| Cluster Centroids (CCs) | CCs reduce computational cost, preserve class distribution, and improve model performance [16,23,53]. | Risk of information loss, sensitivity to clustering algorithm, and challenges with high-dimensional data [23,53]. |
| Random Under Sampler (RUS) | RUS speeds up training time, prevents overfitting, and enhances recall of the minority class [15,16,51]. | RUS may lead to information loss, bias towards the majority class, and reduced diversity for large datasets [15,16,51]. |
| Neighborhood Cleaning Rules (NCL) | NCL preserves minority class information, improves generalization, and works with noisy data [20,32]. | Requires tuning hyperparameters, can be a time-consuming process, and may eliminate relevant majority class instances [20]. |
| Near Miss 1 (NM1) | NM1 maintains the minority class, decreases computational costs, and works with high-dimensional data [18,20]. | Possible information loss, sensitivity to minority class samples, and potential for overfitting [18,20]. |
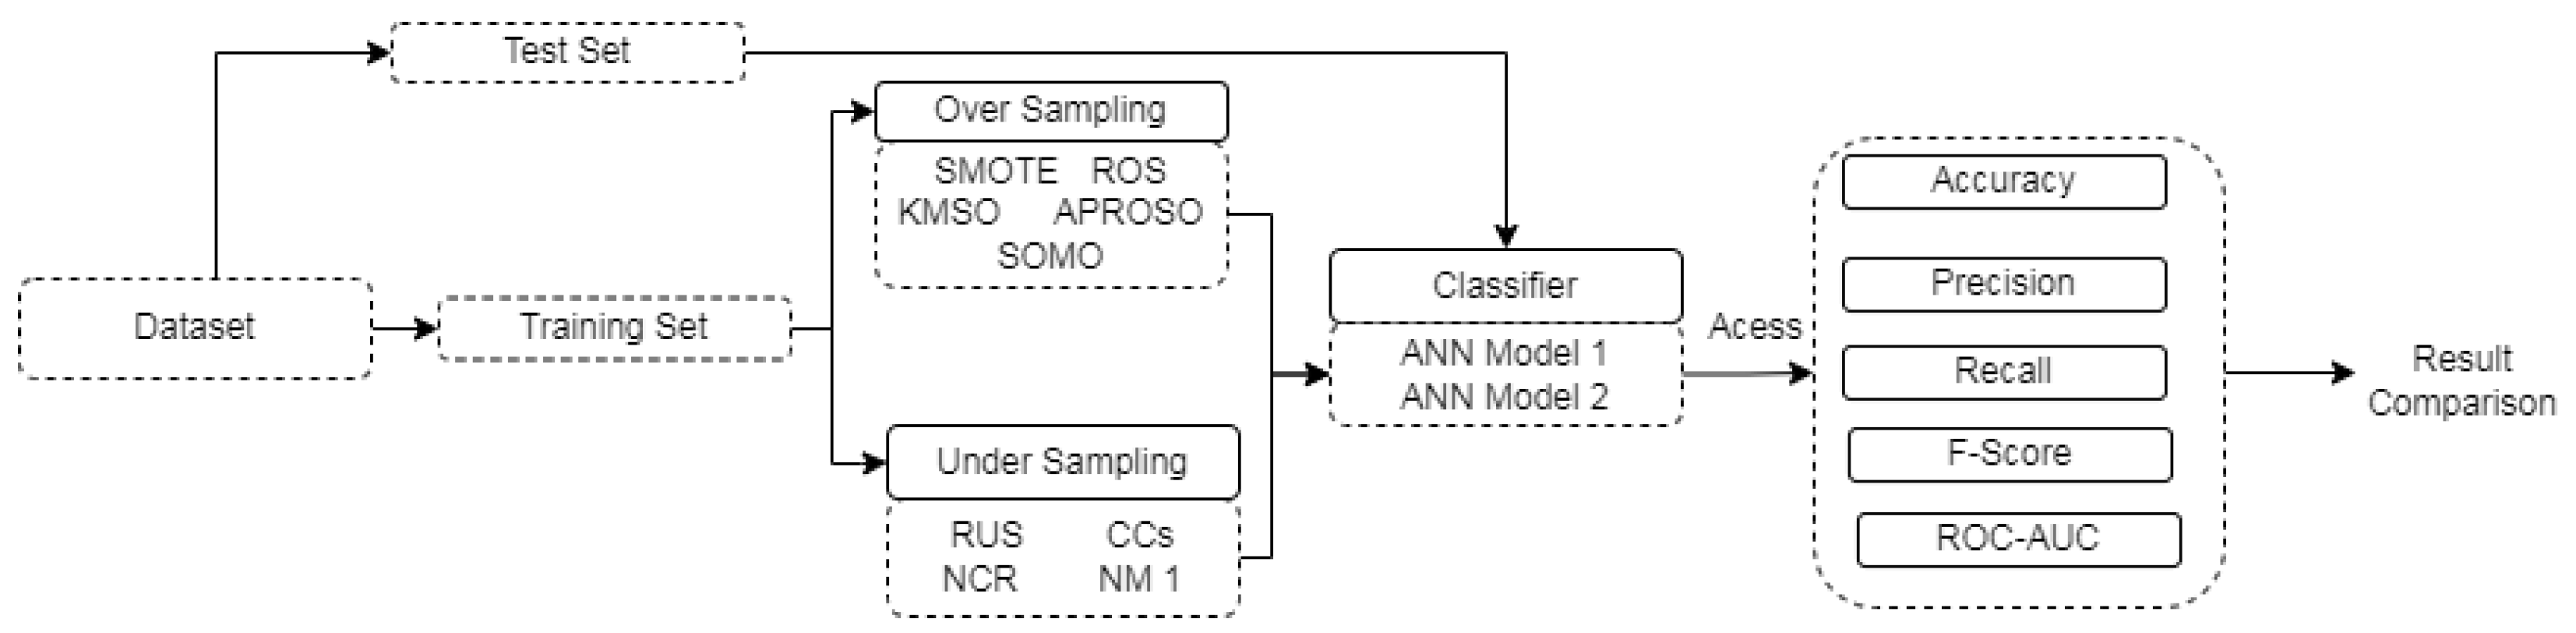
3. Methodology
3.1. Dataset
3.2. Samples And Labels
3.3. Expected Data Format
3.4. Organize the Data
- A small sample of Magnoliopsida images and an extremely small sample of Pinopsida images
- The extreme imbalance between the two classes (Magnoliopsida and Pinopsida)
3.5. Data Conversion and Balancing
3.6. Metrics
| Confusion Matrix | Observed Positive | Observed Negative |
|---|---|---|
| Predicted Positive | TP | FP |
| Predicted Negative | FN | TN |
3.7. Experimental Procedure
4. Result Analysis
4.1. F1 Score for Oversampling Methods
| Oversampling Method | Class | F1 Score |
|---|---|---|
| SMOTE | 0 | 0.9 |
| 1 | 0.9 | |
| ROS | 0 | 0.9 |
| 1 | 0.9 | |
| KMS | 0 | 0.9 |
| 1 | 0.89 | |
| APROSO | 0 | 0.92 |
| 1 | 0.91 | |
| SOMO | 0 | 0.88 |
| 1 | 0.87 |
4.2. F1 Score for Undersampling Methods
| Undersampling Method | Class | F1 Score |
|---|---|---|
| Random Under Sampler | 0 | 0.77 |
| 1 | 0.76 | |
| Cluster Centroids | 0 | 0.76 |
| 1 | 0.77 | |
| Neighborhood Cleaning Rule | 0 | 0.79 |
| 1 | 0.67 | |
| Near Miss | 0 | 0.73 |
| 1 | 0.75 |
4.3. AUC Comparison for Oversampling
| Oversampling Technique | DNN1 | DNN2 |
|---|---|---|
| SMOTE | 0.9563 | 0.9722 |
| ROS | 0.9488 | 0.971 |
| KMS | 0.9551 | 0.967 |
| APROSO | 0.9741 | 0.9773 |
| SOMO | 0.9331 | 0.9747 |
4.4. AUC Comparison for Undersampling
| Undersampling Method | DNN1 | DNN2 |
|---|---|---|
| Random Under Sampler | 0.7794 | 0.8871 |
| Cluster Centroids | 0.8446 | 0.9463 |
| Neighborhood Cleaning Rule | 0.8257 | 0.9134 |
| Near Miss | 0.8127 | 0.8729 |
4.5. Oversampling Method G-Score Comparison
| Oversampling Method | DNN1 | DNN2 |
|---|---|---|
| SMOTE | 0.895794 | 0.911724 |
| ROS | 0.897774 | 0.919521 |
| KMS | 0.897477 | 0.91594 |
| APROSO | 0.915892 | 0.925475 |
| SOMO | 0.88259 | 0.925475 |
4.6. Undersampling Methods G-Score Comparison
| Undersampling Method | DNN1 | DNN2 |
|---|---|---|
| Random Under Sampler | 0.763864 | 0.835467 |
| Cluster Centroids | 0.764929 | 0.863856 |
| Neighborhood Cleaning Rule | 0.747892 | 0.838093 |
| Near Miss | 0.742217 | 0.799503 |
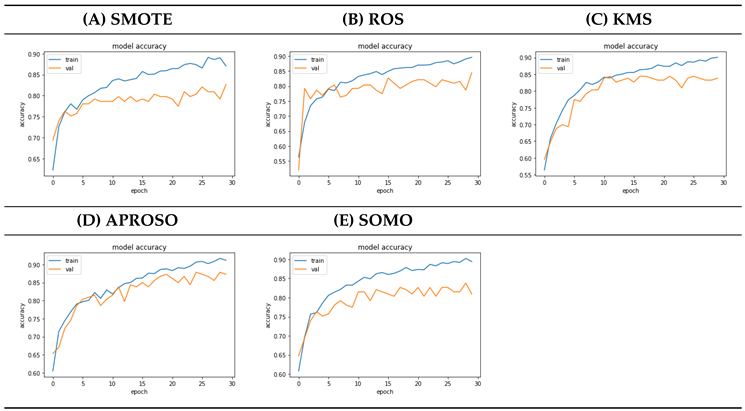
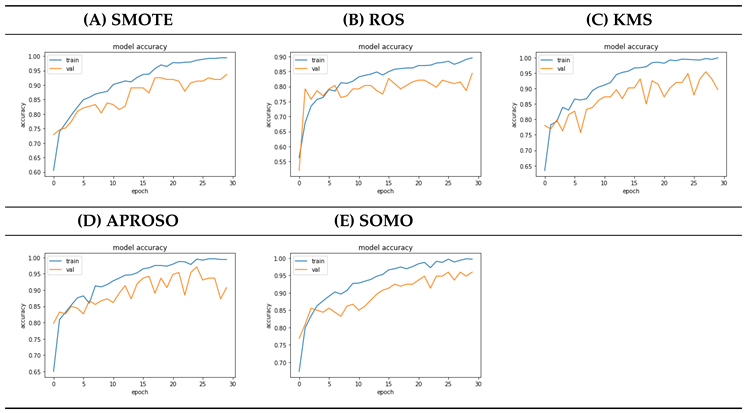
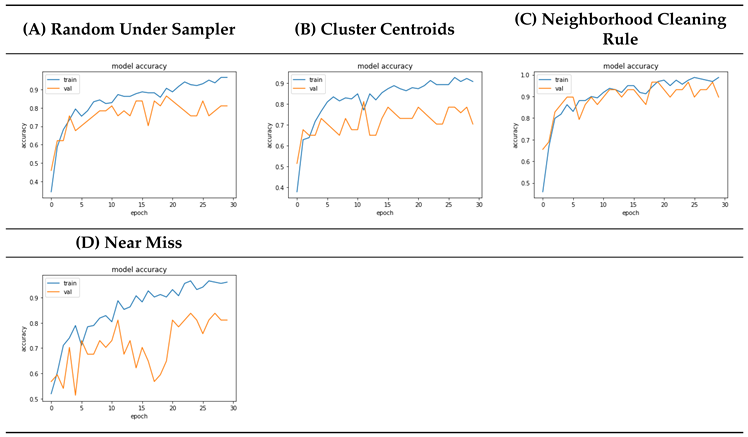
4.7. Oversampling Model Accuracy Comparison
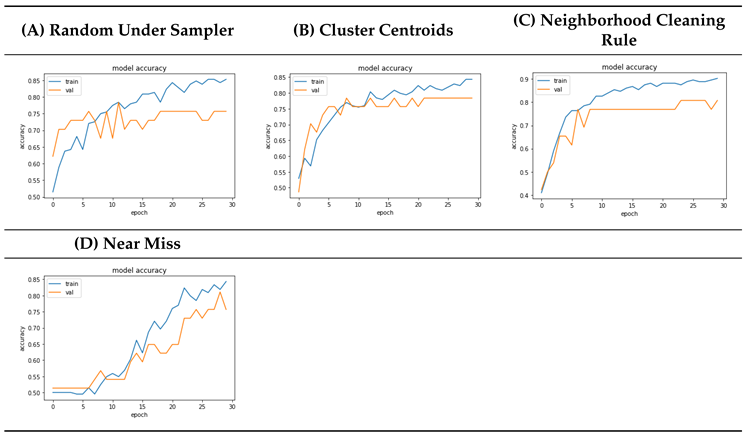
4.8. Undersampling Model Accuracy Comparison
4.9. Discussions
5. Conclusion
Author Contributions
Funding
Institutional Review Board Statement
Informed Consent Statement
Data Availability Statement
Conflicts of Interest
References
- Hassaan, M.A.; El Nemr, A.; Hassaan, A. Health and environmental impacts of dyes: mini review. American Journal of Environmental Science and Engineering 2017, 1, 64–67. [Google Scholar]
- Gürses, A.; Açıkyıldız, M.; Güneş, K.; Gürses, M.S. Colorants in Health and Environmental Aspects. In SpringerBriefs in Molecular Science; Springer International Publishing, 2016; pp. 69–83. [CrossRef]
- Yusuf, M.; Shabbir, M.; Mohammad, F. Natural Colorants: Historical, Processing and Sustainable Prospects. Natural Products and Bioprospecting 2017, 7, 123–145. [Google Scholar] [CrossRef] [PubMed]
- Chawla, N.; Japkowicz, N.; Kolcz, A. Workshop learning from imbalanced data sets II. In Proceedings of the Proc. Int’l Conf. Machine Learning; 2003. [Google Scholar]
- Sanz, J.; Sesma-Sara, M.; Bustince, H. A fuzzy association rule-based classifier for imbalanced classification problems. Information Sciences 2021, 577, 265–279. [Google Scholar] [CrossRef]
- Chawla, N.V.; Japkowicz, N.; Kotcz, A. Editorial. ACM SIGKDD Explorations Newsletter 2004, 6, 1–6. [Google Scholar] [CrossRef]
- Zhao, X.M.; Li, X.; Chen, L.; Aihara, K. Protein classification with imbalanced data. Proteins: Structure, Function, and Bioinformatics 2007, 70, 1125–1132. [Google Scholar] [CrossRef]
- Yu, L.; Zhou, R.; Tang, L.; Chen, R. A DBN-based resampling SVM ensemble learning paradigm for credit classification with imbalanced data. Applied Soft Computing 2018, 69, 192–202. [Google Scholar] [CrossRef]
- Dastile, X.; Celik, T.; Potsane, M. Statistical and machine learning models in credit scoring: A systematic literature survey. Applied Soft Computing 2020, 91, 106263. [Google Scholar] [CrossRef]
- Domingos, P. MetaCost. In Proceedings of the Proceedings of the fifth ACM SIGKDD international conference on Knowledge discovery and data mining.; p. 1999. [CrossRef]
- Ting, K.M. An instance-weighting method to induce cost-sensitive trees. IEEE Transactions on Knowledge and Data Engineering 2002, 14, 659–665. [Google Scholar] [CrossRef]
- Clearwater, S.; Stern, E. A rule-learning program in high energy physics event classification. Computer Physics Communications 1991, 67, 159–182. [Google Scholar] [CrossRef]
- Prati, R.C.; Batista, G.E.A.P.A.; Silva, D.F. Class imbalance revisited: a new experimental setup to assess the performance of treatment methods. Knowledge and Information Systems 2014, 45, 247–270. [Google Scholar] [CrossRef]
- Fernández, A.; López, V.; Galar, M.; del Jesus, M.J.; Herrera, F. Analysing the classification of imbalanced data-sets with multiple classes: Binarization techniques and ad-hoc approaches. Knowledge-Based Systems 2013, 42, 97–110. [Google Scholar] [CrossRef]
- Galar, M.; Fernandez, A.; Barrenechea, E.; Bustince, H.; Herrera, F. A review on ensembles for the class imbalance problem: bagging-, boosting-, and hybrid-based approaches. IEEE Transactions on Systems, Man, and Cybernetics, Part C (Applications and Reviews) 2011, 42, 463–484. [Google Scholar] [CrossRef]
- Chawla, N.V.; Bowyer, K.W.; Hall, L.O.; Kegelmeyer, W.P. SMOTE: Synthetic Minority Over-sampling Technique. Journal of Artificial Intelligence Research 2002, 16, 321–357. [Google Scholar] [CrossRef]
- He, H.; Bai, Y.; Garcia, E.A.; Li, S. ADASYN: Adaptive synthetic sampling approach for imbalanced learning. In Proceedings of the 2008 IEEE international joint conference on neural networks (IEEE world congress on computational intelligence). Ieee; 2008; pp. 1322–1328. [Google Scholar]
- He, H.; Garcia, E.A. Learning from imbalanced data. IEEE Transactions on knowledge and data engineering 2009, 21, 1263–1284. [Google Scholar]
- Guzmán-Ponce, A.; Sánchez, J.; Valdovinos, R.; Marcial-Romero, J. DBIG-US: A two-stage under-sampling algorithm to face the class imbalance problem. Expert Systems with Applications 2021, 168, 114301. [Google Scholar] [CrossRef]
- Laurikkala, J. Improving Identification of Difficult Small Classes by Balancing Class Distribution. In Artificial Intelligence in Medicine; Springer Berlin Heidelberg, 2001; pp. 63–66. [CrossRef]
- Tomek, I. Two modifications of CNN. 1976.
- Hart, P. The condensed nearest neighbor rule (corresp.). IEEE transactions on information theory 1968, 14, 515–516. [Google Scholar] [CrossRef]
- Kubat, M.; Matwin, S.; et al. Addressing the curse of imbalanced training sets: one-sided selection. In Proceedings of the Icml. Citeseer, 1997, Vol. 97, p. 179.
- Wang, H.; Liu, X. Undersampling bankruptcy prediction: Taiwan bankruptcy data. PLOS ONE 2021, 16, e0254030. [Google Scholar] [CrossRef]
- Hakki Karaman, I.; Koksal, G.; Eriskin, L.; Salihoglu, S. A Similarity-Based Oversampling Method for Multi-label Imbalanced Text Data. arXiv e-prints 2024, pp. arXiv–2411.
- Wongvorachan, T.; He, S.; Bulut, O. A comparison of undersampling, oversampling, and SMOTE methods for dealing with imbalanced classification in educational data mining. Information 2023, 14, 54. [Google Scholar] [CrossRef]
- Hou, B.; Chen, G. A new imbalanced data oversampling method based on Bootstrap method and Wasserstein Generative Adversarial Network. Mathematical Biosciences and Engineering 2024, 21, 4309–4327. [Google Scholar] [CrossRef]
- Pan, T.; Pedrycz, W.; Yang, J.; Wang, J. An improved generative adversarial network to oversample imbalanced datasets. Engineering Applications of Artificial Intelligence 2024, 132, 107934. [Google Scholar] [CrossRef]
- Kamalov, F.; Leung, H.H.; Cherukuri, A.K. Keep it simple: random oversampling for imbalanced data. In Proceedings of the 2023 Advances in Science and Engineering Technology International Conferences (ASET). IEEE; 2023; pp. 1–4. [Google Scholar]
- Shen, F.; Zhao, X.; Kou, G.; Alsaadi, F.E. A new deep learning ensemble credit risk evaluation model with an improved synthetic minority oversampling technique. Applied Soft Computing 2021, 98, 106852. [Google Scholar] [CrossRef]
- Elreedy, D.; Atiya, A.F. A Comprehensive Analysis of Synthetic Minority Oversampling Technique (SMOTE) for handling class imbalance. Information Sciences 2019, 505, 32–64. [Google Scholar] [CrossRef]
- Batista, G.E.A.P.A.; Prati, R.C.; Monard, M.C. A study of the behavior of several methods for balancing machine learning training data. ACM SIGKDD Explorations Newsletter 2004, 6, 20–29. [Google Scholar] [CrossRef]
- Bunkhumpornpat, C.; Sinapiromsaran, K.; Lursinsap, C. Safe-Level-SMOTE: Safe-Level-Synthetic Minority Over-Sampling TEchnique for Handling the Class Imbalanced Problem. In Advances in Knowledge Discovery and Data Mining; Springer Berlin Heidelberg, 2009; pp. 475–482. [CrossRef]
- He, H.; Bai, Y.; Garcia, E.A.; Li, S. ADASYN: Adaptive synthetic sampling approach for imbalanced learning. In Proceedings of the 2008 IEEE international joint conference on neural networks (IEEE world congress on computational intelligence). Ieee; 2008; pp. 1322–1328. [Google Scholar]
- Han, H.; Wang, W.Y.; Mao, B.H. Borderline-SMOTE: A New Over-Sampling Method in Imbalanced Data Sets Learning. In Lecture Notes in Computer Science; Springer Berlin Heidelberg, 2005; pp. 878–887. [CrossRef]
- Barua, S.; Islam, M.M.; Yao, X.; Murase, K. MWMOTE–majority weighted minority oversampling technique for imbalanced data set learning. IEEE Transactions on knowledge and data engineering 2012, 26, 405–425. [Google Scholar] [CrossRef]
- Tang, B.; He, H. KernelADASYN: Kernel based adaptive synthetic data generation for imbalanced learning. In Proceedings of the 2015 IEEE congress on evolutionary computation (CEC). IEEE; 2015; pp. 664–671. [Google Scholar]
- Yi, H.; Jiang, Q.; Yan, X.; Wang, B. Imbalanced classification based on minority clustering synthetic minority oversampling technique with wind turbine fault detection application. IEEE Transactions on Industrial Informatics 2020, 17, 5867–5875. [Google Scholar] [CrossRef]
- Elyan, E.; Moreno-Garcia, C.F.; Jayne, C. CDSMOTE: class decomposition and synthetic minority class oversampling technique for imbalanced-data classification. Neural Computing and Applications 2020, 33, 2839–2851. [Google Scholar] [CrossRef]
- Vo, M.T.; Nguyen, T.; Vo, H.A.; Le, T. Noise-adaptive synthetic oversampling technique. Applied Intelligence 2021, 51, 7827–7836. [Google Scholar] [CrossRef]
- Nekooeimehr, I.; Lai-Yuen, S.K. Adaptive semi-unsupervised weighted oversampling (A-SUWO) for imbalanced datasets. Expert Systems with Applications 2016, 46, 405–416. [Google Scholar] [CrossRef]
- Cieslak, D.A.; Chawla, N.V. Start globally, optimize locally, predict globally: Improving performance on imbalanced data. In Proceedings of the 2008 Eighth IEEE International Conference on Data Mining. IEEE; 2008; pp. 143–152. [Google Scholar]
- Jo, T.; Japkowicz, N. Class imbalances versus small disjuncts. ACM SIGKDD Explorations Newsletter 2004, 6, 40–49. [Google Scholar] [CrossRef]
- Cieslak, D.A.; Chawla, N.V.; Striegel, A. Combating imbalance in network intrusion datasets. In Proceedings of the GrC; 2006; pp. 732–737. [Google Scholar]
- Sun, Z.; Song, Q.; Zhu, X.; Sun, H.; Xu, B.; Zhou, Y. A novel ensemble method for classifying imbalanced data. Pattern Recognition 2015, 48, 1623–1637. [Google Scholar] [CrossRef]
- Goodfellow, I.; Bengio, Y.; Courville, A. Deep Learning; MIT Press, 2016. http://www.deeplearningbook.org.
- Bishop, C. Pattern recognition and machine learning. Springer google schola 2006, 2, 5–43. [Google Scholar]
- LeCun, Y.; Bengio, Y.; Hinton, G. Deep learning. nature 2015, 521, 436–444. [Google Scholar] [CrossRef] [PubMed]
- He, K.; Zhang, X.; Ren, S.; Sun, J. Deep residual learning for image recognition. In Proceedings of the Proceedings of the IEEE conference on computer vision and pattern recognition, 2016; pp. 770–778.
- Pan, S.J.; Yang, Q. A survey on transfer learning. IEEE Transactions on knowledge and data engineering 2009, 22, 1345–1359. [Google Scholar] [CrossRef]
- Japkowicz, N.; Stephen, S. The class imbalance problem: A systematic study. Intelligent data analysis 2002, 6, 429–449. [Google Scholar] [CrossRef]
- Weiss, G.M.; McCarthy, K.; Zabar, B. Cost-sensitive learning vs. sampling: Which is best for handling unbalanced classes with unequal error costs? Dmin 2007, 7, 24. [Google Scholar]
- Sun, Y.; Wong, A.K.; Kamel, M.S. Classification of imbalanced data: A review. International journal of pattern recognition and artificial intelligence 2009, 23, 687–719. [Google Scholar] [CrossRef]
- Frey, B.J.; Dueck, D. Clustering by passing messages between data points. science 2007, 315, 972–976. [Google Scholar] [CrossRef]
- Liu, X.; Yin, M.; Li, M.; Yao, D.; Chen, W. Hierarchical affinity propagation clustering for large-scale data set. Computer Science 2014, 41, 185–188. [Google Scholar]
- Wang, Z.J.; Zhan, Z.H.; Lin, Y.; Yu, W.J.; Yuan, H.Q.; Gu, T.L.; Kwong, S.; Zhang, J. Dual-strategy differential evolution with affinity propagation clustering for multimodal optimization problems. IEEE Transactions on Evolutionary Computation 2017, 22, 894–908. [Google Scholar] [CrossRef]
- Douzas, G.; Rauch, R.; Bacao, F. G-SOMO: An oversampling approach based on self-organized maps and geometric SMOTE. Expert Systems with Applications 2021, 183, 115230. [Google Scholar] [CrossRef]
- Douzas, G.; Bacao, F. Self-Organizing Map Oversampling (SOMO) for imbalanced data set learning. Expert systems with Applications 2017, 82, 40–52. [Google Scholar] [CrossRef]
- Hua, W.; Mo, L. Clustering ensemble model based on self-organizing map network. Computational Intelligence and Neuroscience 2020, 2020. [Google Scholar] [CrossRef]
Disclaimer/Publisher’s Note: The statements, opinions and data contained in all publications are solely those of the individual author(s) and contributor(s) and not of MDPI and/or the editor(s). MDPI and/or the editor(s) disclaim responsibility for any injury to people or property resulting from any ideas, methods, instructions or products referred to in the content. |
© 2024 by the authors. Licensee MDPI, Basel, Switzerland. This article is an open access article distributed under the terms and conditions of the Creative Commons Attribution (CC BY) license (http://creativecommons.org/licenses/by/4.0/).


