
Submitted:
26 December 2024
Posted:
26 December 2024
You are already at the latest version
Abstract
Fatigue detection in elderly individuals is critical for preventing health complications and enhancing quality of life. This study presents a comprehensive approach to monitoring and classifying fatigue states using electrocardiogram (ECG) signals, leveraging advanced machine learning techniques. The proposed methodology involves five key stages: ECG signal acquisition, preprocessing, feature extraction, dimensionality reduction using Principal Component Analysis (PCA), and classification through recurrent neural network models. Among the evaluated models, the Gated Recurrent Unit (GRU), the Long Short-Term Memory (LSTM) model, and the standard Recurrent Neural Network (RNN) model exhibited the performance, of 98.86%, 97.73%, and 82.76%. respectivily. The results underscore the GRU model’s superior ability to classify fatigue states accurately, highlighting its potential for real-time applications in elderly care. This study emphasizes the importance of robust signal processing and advanced neural architectures in developing efficient fatigue detection systems, paving the way for improved health monitoring solutions for aging populations.
Keywords:
Fatigue
; ECG
; AI
; Classification
; GRU
; LSTM
; RNN
1. Introduction
Fatigue is a state that often arises from responses to various stressors, situations, experiences, or psychological conditions. It is generally defined as a subjective sense of energy depletion, whether physical or mental, perceived by individuals as an obstacle to their daily or desired activities. Fatigue can manifest as a general feeling of weariness or through specific symptoms, such as muscle discomfort. Physical fatigue results in an inability to sustain normal activity levels, while mental fatigue occurs when the brain's energy reserves are depleted, leading to cognitive exhaustion. The literature identifies six main categories of fatigue: social, emotional, physical, pain-related, mental, and induced by chronic illnesses. These categories are often grouped into physical and mental fatigue to highlight their distinct effects [1].
Mental fatigue (MF) frequently occurs in daily life and during professional tasks requiring sustained attention and prolonged efficiency [2]. It is characterized as a psychobiological state resulting from extended cognitive effort [3]. Globally, overwork is associated with conditions such as cerebrovascular and cardiovascular diseases, diabetes, and cancer, making it a major public health concern [4,5]. Furthermore, fatigue is a widely prevalent symptom, affecting not only individuals with underlying illnesses but also healthy individuals, highlighting its broad impact [6].
Among the elderly, cardiovascular diseases (CVDs) are a leading health concern and a primary cause of mortality, with prevalence rates rising alongside global population aging. In 2020, the World Health Organization (WHO) reported approximately 18 million deaths worldwide due to CVDs, accounting for 32% of all global deaths [7]. The risk is particularly high for individuals over 65, with nearly 60% of those aged 75 and above showing signs of CVD. Key risk factors include hypertension, diabetes, smoking, and genetic predisposition [8].
Cardiac arrhythmias, such as tachycardia (heart rate >100 bpm) and bradycardia (heart rate <60 bpm) [9], are common manifestations of cardiovascular issues, which, if undetected, can lead to severe outcomes like heart attacks or strokes. Given the high cost of treatment and the inaccessibility of care for many, early detection and continuous monitoring are vital, especially for older adults who often present atypical symptoms [9].
Electrocardiography (ECG) plays a pivotal role in non-invasive heart function monitoring, making it indispensable for detecting cardiovascular abnormalities and assessing fatigue in elderly individuals. Fatigue, a critical marker of declining health, can be effectively identified through ECG signals, as it reflects physiological changes linked to cardiovascular strain. Compared to image-based techniques, ECG offers advantages such as fewer sensors, reduced susceptibility to environmental noise, and lower computational requirements, making it an efficient and reliable tool for fatigue detection and monitoring in aging populations.
Given the importance of accurately assessing fatigue in elderly individuals, a method that employs fewer sensors or electrodes, minimizes the influence of environmental factors, and reduces computational and storage requirements compared to image-based techniques is essential. Among physiological measurements, ECG has emerged as a promising tool for detecting fatigue in elderly populations.
Electrocardiograms (ECG) are traditionally used to assess and analyze arrhythmias by recording the heart's electrical activity. ECG signals provide valuable insights into cardiac function, characterized primarily by the P wave, QRS complex, and T wave [11]. These signals are generated by the heart’s electrical activity, which spreads not only within the heart but also throughout the body. The sinus node, regulated by both sympathetic and parasympathetic nerves, drives this activity. The uniqueness of an individual's ECG, shaped by the size, structure, and orientation of their heart and valves, has also led to its growing use in biometric human identification.
In this context, ECG signals represent a dual-purpose tool—providing critical insights into both cardiovascular health and fatigue assessment in elderly populations. By leveraging advances in ECG-based fatigue detection, particularly through the integration of modern machine learning techniques, there is a significant opportunity to enhance both healthcare outcomes and the quality of life for older individuals.
The remainder of the paper is organized as follows: the "Related Work" section reviews prior research, while the "Materials and Methods" section outlines the proposed methodology and dataset. The "Experiments" section details the conducted experiments and their findings. Finally, the "Conclusion and Future Work" section summarizes the key results and outlines potential directions for future research.
2. Related Works
This section reviews key research on ECG signal monitoring and the application of artificial intelligence techniques for predicting and detecting fatigue states in elderly individuals, emphasizing advancements and challenges in this field.
Various non-invasive and cost-effective activity monitoring systems have been reviewed, with a particular focus on sensors integrated into wearable platforms [12,13].
In [14], an intelligent mobile environment leveraging integrated smartphone sensors has been proposed as an Ambient Assisted Living (AAL) method to recognize ongoing activities of elderly individuals and their context. This approach employs a layered architecture comprising a context manager, a context reasoner, and a service controller.
Furthermore, a context-aware sensor system (CARE) was developed for nurses in nursing homes. This system, accessible through an Android tablet application, leverages sensors to enhance care services for elderly residents [15].
In [16], considering the severe implications of falls and fall-related injuries, a private, real-time, context-aware fall detection system has been proposed for elderly individuals. This system incorporates a smart carpet embedded with a sensor pad, placed discreetly under the carpet, to detect falls and promptly alert healthcare personnel.
In study [17], a fall detection system leveraging smart textiles and a non-linear Support Vector Machine (SVM) has been proposed to classify fall orientations into 11 distinct categories. These categories include activities such as moving upstairs, running, falling forward, backward, to the right, to the left, and others.
In [18], a personalized health monitoring system utilizing an all-in-one device has been introduced to track the health of elderly individuals. This system is designed to offer computer-aided decision support for healthcare practitioners, enhancing the quality and precision of medical care.
In work [19], Data was collected from eleven elderly individuals by monitoring their activities and vital signs using a Sony wellness tracker. Machine learning methods were applied to predict their health and wellness status one day in advance. Furthermore, an *Ambient Assisted Living* (AAL) system was developed, based on automated feature engineering for activity recognition. This system identified the most relevant features from multiple sensors, and various classification models were trained and evaluated to assess their performance.
In [20], a cloud-based Internet of Medical Things (IoMT) platform with a multi-layered architecture was proposed to monitor and collect patients’ vital signs and environmental data for AAL. This platform facilitates real-time sensing, data aggregation, and analysis to enhance care and improve the quality of life for elderly individuals.
With the aim of promoting "aging well at home," an IoT-based smart home automation system was proposed to enable continuous health monitoring and provide assistive care for elderly and sick individuals. This system integrates various sensors and technologies to monitor vital signs, detect health issues, and offer support to enhance the well-being and safety of elderly people around the clock [21].
In [22], a non-invasive ambient intelligence system for older individuals was proposed to address the noisy patterns in data collected by multiple wireless sensors installed in the subjects' rooms. Random Forest machine learning techniques were utilized to monitor and analyze regular behavioral patterns, such as occupancy and ventilation, to ensure effective monitoring and care for elderly people. This approach helps in providing a safer and more comfortable living environment for the elderly, while also assisting in detecting deviations from normal behavior that might indicate potential health concerns.
In [23], a fall detection system based on edge computing has been proposed to enable real-time patient monitoring and analysis. This system leverages edge computing technology to process data directly on the devices, allowing for faster fall detection and reduced response times. By minimizing the need to transmit data to the cloud, the system enhances the efficiency and reliability of fall detection, particularly in critical environments such as healthcare facilities caring for elderly patients. Through real-time processing, the system can send immediate alerts to caregivers or healthcare professionals, thereby improving their responsiveness and potentially reducing the severity of injuries caused by falls.
Wearable sensors, specifically the MetaMotionR from MbientLab, were utilized in conjunction with an open-source streaming engine, Apache Flink, for real-time data streaming. A long short-term memory (LSTM) network model was employed for fatigue classification, achieving an impressive 95.8\% accuracy in detecting fatigues through real-time streaming data analytics. Notifications were generated instantly to alert caregivers or medical personnel for immediate assistance. The model was trained using the "MobiAct" public dataset [24], which provided a diverse range of fall-related data for robust learning.
In addition to fatigue detection, a remote health monitoring system for elderly individuals was proposed, focusing on tracking vital signs such as pulse and blood oxygen levels through wearable sensors. This system aims to proactively monitor health and prevent the onset of chronic diseases in the elderly [25].
In [26], a system leverages wearable sensors to continuously monitor vital signs, such as heart rate, blood pressure, and oxygen levels, and transmits the data to healthcare providers in real-time through the IoT infrastructure. Arduino and Raspberry Pi serve as the core components for data collection, processing, and communication, enabling efficient remote monitoring and timely intervention for patients with chronic conditions.
For rural telemedicine, a tablet PC-enabled body sensor system was proposed, utilizing a body sensor device that continuously collects physiological parameters from patients [27].
In [28], an automatically system detects abnormal conditions and sends real-time alert messages to healthcare staff, ensuring immediate intervention when necessary. This approach enhances healthcare delivery in remote areas, enabling timely monitoring and response without the need for frequent in-person visits. In another approach, a health monitoring system with RFID sensors was implemented to tag objects using hand movements, while wireless accelerometers were employed to classify human body states for recognizing users' daily activities. This system tracks and analyzes the movements and interactions of individuals, providing valuable insights into their physical activity and helping healthcare providers monitor their well-being in real-time.
Table 1 provides a comprehensive comparative analysis of the various approaches discussed in previous work.
3. Materials and Methods
In this section, we detail the data analysis and classification methods developed to identify fatigue in elderly individuals using ECG signals. The overall approach consists of five main stages: ECG signal acquisition, signal preprocessing, feature extraction, Principal Component Analysis (PCA), and the application of machine learning (Figure 1).
ECG signals are captured using the AD8232 sensor, which ensures reliable data acquisition (Figure 2). Preprocessing of these signals involves the use of advanced filtering techniques to remove noise and artifacts, thereby providing clean signals for analysis. Key features are extracted from the preprocessed ECG signals, followed by Principal Component Analysis (PCA) to identify significant differences between fatigue states.
Finally, machine learning algorithms such as GRU, LSTM, and RNN are implemented to classify fatigue states with high accuracy. This project adheres to established ethical principles and aims to improve the quality of life of elderly individuals by monitoring their fatigue levels through innovative biomedical signal analysis approaches.
4. ECG Signal Characteristics and Data Analysis
The waves of an electrocardiogram (ECG) provide crucial information about the heart's electrical activity (Figure 3). In this study, various features of the ECG signal were analyzed and classified to better understand these dynamics. A detailed description of the main ECG waves (Table 2) forms the foundation for extracting and interpreting the data necessary for thorough analysis.
4.1. Signal Acquisition
This section presents the proposed embedded system designed for the analysis of electrocardiogram (ECG) signals to detect and classify fatigue. The system is built around two key components: the AD8232 sensor and the ESP32s microcontroller.
The AD8232 sensor is an integrated heart monitoring module used to measure the heart's electrical activity and represent it as an electrocardiogram (ECG). It is designed to extract, amplify, and filter small biopotential signals, even in the presence of noise, such as interference from movement or electrode placement. To ensure accurate measurements, electrodes must be correctly placed at specific points on the body: RA (right arm), LA (left arm), and RL (right leg) [29].
The ESP32s microcontroller is a system-on-chip (SoC) developed by Espressif Systems, based on the Xtensa LX6 architecture by Tensilica. It features integrated Wi-Fi and Bluetooth modules, as well as a dual-core processor running at a clock frequency of 240 MHz. The ESP32s offers significant flexibility for IoT and embedded projects, thanks to its wireless connectivity capabilities and low power consumption.
The configuration of the ESP32s microcontroller for capturing ECG signals involved several methodical steps, utilizing the Arduino IDE for programming. First, the ESP32s was programmed to acquire raw ECG data from the AD8232 sensor, which measures heart activity. The data was then processed to calculate metrics like heart rate and to ensure data accuracy. To facilitate analysis, the collected data was saved in CSV files, making it easier to review heartbeat counts and analyze trends.
Additionally, a serial plotter (often referred to as a logic or protocol analyzer) was employed. This tool is essential for verifying and debugging signals in serial communication systems, allowing real-time observation of data flow and ensuring the reliability of the ECG signal acquisition process. This setup enables efficient monitoring and troubleshooting, making it well-suited for real-time ECG signal processing and analysis (Figure 4).
4.2. Signal Filtering
After extracting the data, we proceed with filtering to enhance the quality and accuracy of the results. Filtering removes unwanted noise or distortions, such as interference from muscle activity, environmental electromagnetic signals, or baseline drifts that can distort the original signal. In the case of ECG data, for example, specific filters like low-pass filters help eliminate high-frequency noise, while high-pass filters remove low-frequency baseline shifts. Additionally, bandpass filters focus on the heart's relevant frequency range, preserving critical information about the heart's electrical activity. By applying these filters, we obtain cleaner data, which improves the reliability of subsequent analyses and interpretations.
The 4th-order Butterworth filter was selected for bandpass filtering of ECG signals due to its flat frequency response, smooth transition, simplicity in design, stability, and robustness. While other filters may provide sharper transitions or improved phase response, they often introduce ripples or added complexities that may not be desirable in ECG signal analysis. The Butterworth filter offers an optimal balance for this specific application, ensuring faithful preservation of the frequency components of interest while minimizing distortions and artifacts.
Bandpass filtering was crucial step in processing the collected ECG signals. This filtering technique preserves the frequency components of interest while eliminating unwanted noise and interference. For ECG signals, the useful frequency range typically falls between 10 Hz and 40 Hz.
The bandpass filtering was implemented using MATLAB. A 4th-order Butterworth filter was designed with the butter function, specifying cutoff frequencies at 10 Hz and 40 Hz. This configuration ensured that the filter effectively isolates the desired ECG signal frequencies, improving signal clarity and accuracy for further analysis.
This method successfully eliminated high- and low-frequency interference while maintaining the essential frequency components of the ECG signals, enhancing the accuracy of detecting key waves such as the P wave, QRS complex, and T wave. This was vital for the later analysis of arrhythmias.
The choice of cutoff frequencies at 10 Hz and 40 Hz was based on the fact that the majority of the energy in ECG signals lies within this frequency range. The lower cutoff frequency of 10 Hz helps eliminate baseline wander and low-frequency fluctuations, while the upper cutoff frequency of 40 Hz removes high-frequency noise related to electromagnetic interference and muscle movement sequency range ensures that the key features of the ECG signal, such as the P, QRS, and T waves, are preserved while reducing unwanted noise that could interfere with accurate signal analysis.
As shown in Figure 5, the application of a 4th-order Butterworth filter with cutoff frequencies at 10 Hz and 40 Hz effectively removed unwanted noise and interference while preserving the essential frequency components of the ECG signal. A comparison of the figures before and after filtering demonstrates a significant reduction in baseline wander and high-frequency noise. Zooming in on the filtered signal clearly shows an improvement in the visibility of the characteristic P, QRS, and T waves, which are crucial for arrhythmia analysis. These results confirm the effectiveness of the Butterworth filter in enhancing the quality of ECG signals, facilitating more accurate and reliable analysis.
4.3. Dataset
Building a reliable database is a key element to ensuring the success of a machine learning-based approach. In this study, we created a database using data collected from sensors, combined with the outputs from the filtering steps, to ensure optimal quality and relevance of the data for future analyses.
The structure of the database was organized hierarchically for efficient data management. A main collection called "csv\_files" was created, containing individual documents for each patient. Each patient document was then divided into sub-collections named "Patient+number," where the ECG data was stored in an organized manner.
Our database contains detailed information about patients who have undergone ECG recordings. This includes demographic data, medical history, and specific ECG data points that were recorded during the procedure. Each patient's data is organized to ensure easy access and retrieval, with clear labeling and structured data points to facilitate analysis. This allows for an in-depth review of patient conditions and the ability to identify patterns or anomalies in their ECG readings, contributing to better diagnosis and monitoring.
The ECG database used contains 50 recordings, each lasting 2 minutes, collected from 100 participants. The signals were sampled at 250 Hz and include 12 standard leads. In total, this database offers more than 180 million labeled data points for analysis.
5. Machine Learning Models Employed for Fatigue Detection
The detection of fatigue in elderly individuals using ECG data relies on advanced machine learning techniques and a well-curated dataset. In this study, we utilize a dedicated database of ECG signals collected from elderly individuals to identify patterns indicative of fatigue. This dataset serves as the foundation for training, validating, and testing three cutting-edge deep learning models: Recurrent Neural Networks (RNN), Long Short-Term Memory Networks (LSTM), and Gated Recurrent Units (GRU). Each of these algorithms is tailored to analyze temporal dependencies inherent in ECG data, enabling precise detection of fatigue states. Below, we detail the specific features, architecture, and role of each algorithm in the system.
5.1. Recurrent Neural Networks (RNN)
Recurrent Neural Networks (RNN) are foundational deep learning architectures designed to handle sequential and time-series data. Unlike traditional neural networks, RNN incorporate a feedback loop that enables information persistence, making them suitable for modeling temporal dependencies. In the context of ECG data, RNN process sequential heart activity signals by maintaining a "memory" of past information. The architecture includes input, hidden, and output layers, with the hidden layer maintaining connections to its previous state. However, due to their tendency to suffer from vanishing gradient problems, the direct application of RNN is often limited in capturing long-term dependencies in ECG data.
5.2. Gated Recurrent Units (GRU)
Gated Recurrent Units (GRU) are an advancement of Recurrent Neural Networks (RNN) designed to address the limitations of traditional models, particularly the vanishing gradient problem during training. Their simplified architecture utilizes memory units with gates to control the flow of information. Unlike standard RNN, GRU are less complex and more efficient at capturing long-term dependencies in sequential data, while requiring fewer computational resources. This makes them especially well-suited for applications that demand robust sequential modeling without the complexities of more resource-intensive architectures like LSTM (Figure 7).
5.3. Long Short-Term Memory Networks (LSTM)
Long Short-Term Memory (LSTM) networks are advanced recurrent neural networks designed to efficiently handle long-term temporal dependencies in sequential data. Their complex architecture utilizes memory cells equipped with three distinct gates: one for forgetting irrelevant information, one for introducing new information, and one for regulating the output. This structure enables LSTMs to retain information over extended periods, making them ideal for tasks such as machine translation, text generation, and other applications requiring a deep understanding of temporal contexts. However, their increased complexity can make training and model interpretation more demanding compared to simpler architectures like GRU (Figure 8).
5.4. Model Evaluation
A confusion matrix is a tabular representation used to evaluate the classification performance of a model. It consists of four key components:
- True Positives (TP): Cases where the model correctly predicted positive outcomes.
- True Negatives (TN): Cases where the model correctly predicted negative outcomes.
- False Positives (FP): Cases where the model incorrectly predicted positive outcomes for instances that are actually negative.
- False Negatives (FN): Cases where the model incorrectly predicted negative outcomes for instances that are actually positive.
This matrix provides a comprehensive overview of a model's accuracy, allowing for the calculation of key metrics like sensitivity, specificity, and precision.
Accuracy is a metric used to evaluate the performance of a classification model. It measures the proportion of correctly classified instances out of the total number of instances. The formula for accuracy is:
Sensitivity, also referred to as the true-positive rate or recall, evaluates a model's effectiveness in correctly identifying positive cases. It is particularly critical in medical diagnostics, where the accurate detection of conditions such as diseases is paramount. High sensitivity minimizes false negatives, ensuring that individuals with the condition are properly identified and reducing the risk of undiagnosed cases.
Specificity evaluates a model's ability to accurately identify negative cases, distinguishing individuals without a condition. It plays a critical role in ensuring that healthy individuals are correctly recognized as such. High specificity reduces false positives, thereby minimizing the misclassification of healthy individuals as having the condition.
6. Results and Discussion
Various visualization tools, particularly Matplotlib, were employed to generate detailed graphical representations of the training process for the LSTM, RNN, and GRU models. These graphs, including loss curves and performance metrics over multiple epochs, provide critical insights into the behavior of each model. By analyzing these figures, such as Figure 9, Figure 10 and Figure 11, users can compare the models' convergence rates, stability, and overall efficiency in capturing patterns from the dataset. This visualization facilitates a comprehensive evaluation of the strengths and weaknesses of each approach in the context of fatigue detection in the elderly.
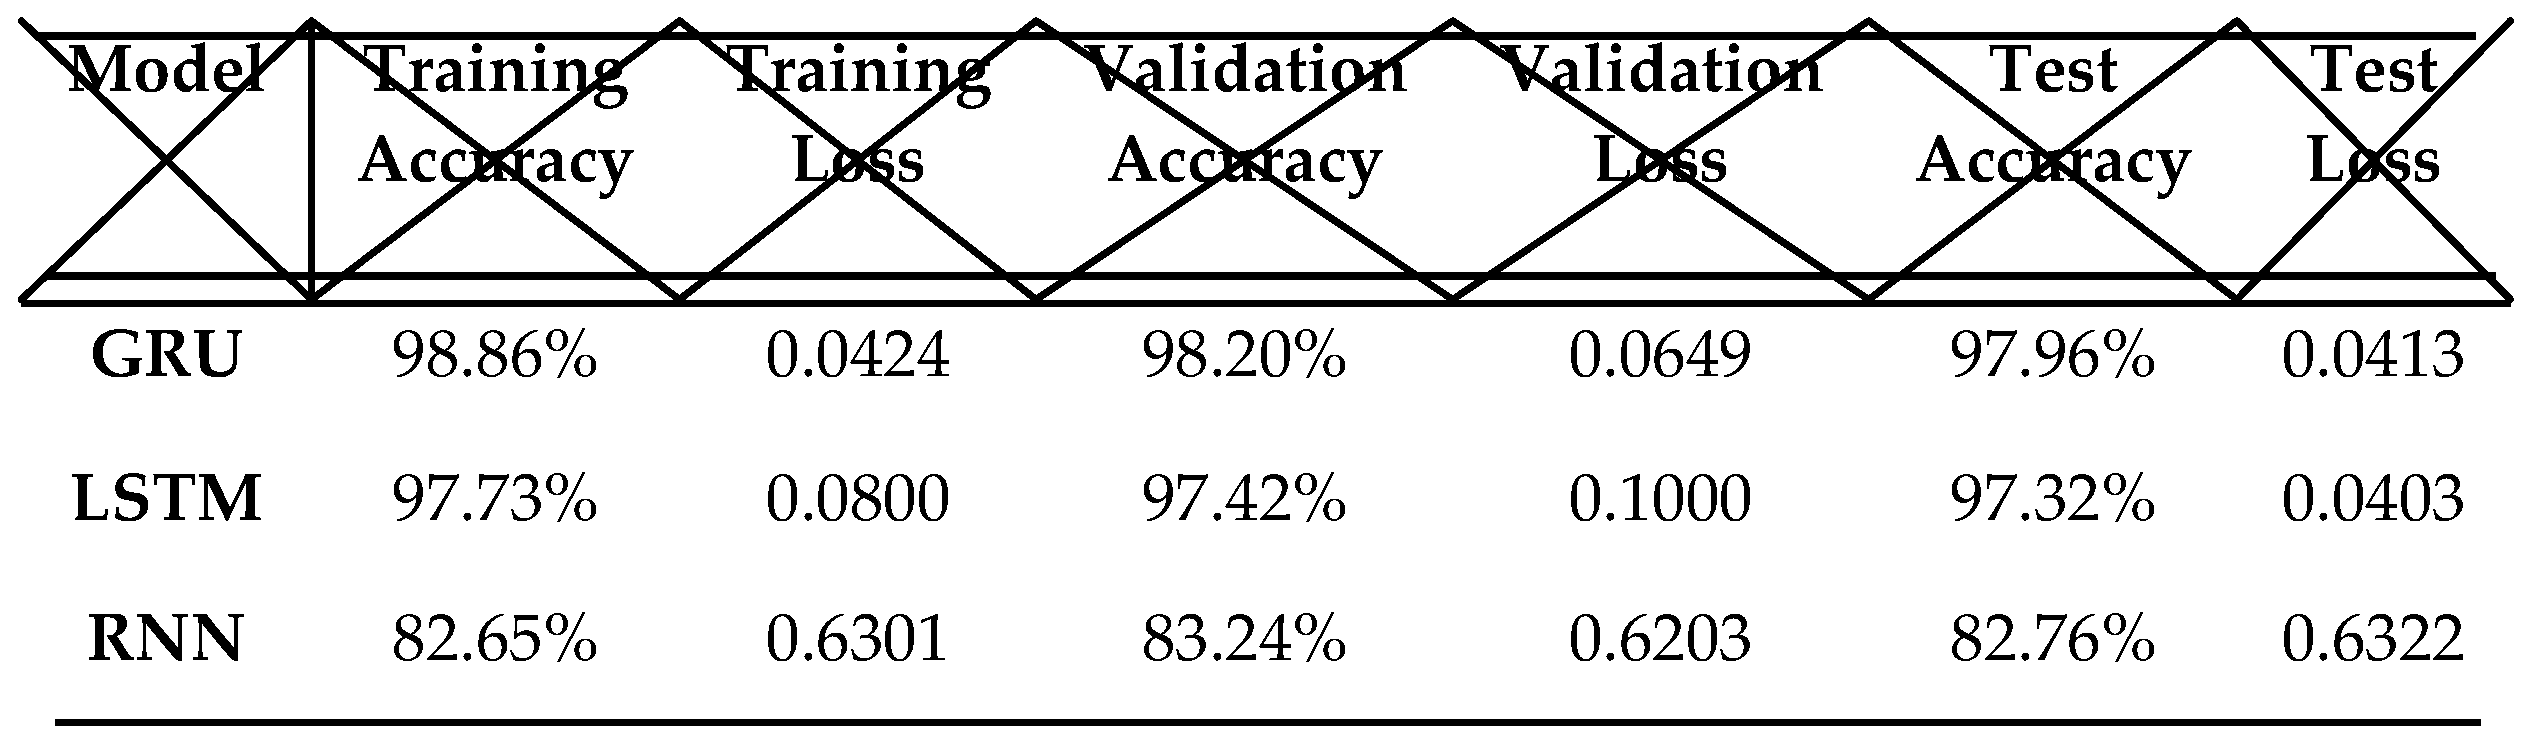
In this section, we review the experimental results used to illustrate the performance of the proposed technique, as well as the outcomes related to fatigue detection. As shown in Table 3, we present and compare the performance of the LSTM, GRU, and RNN models.
GRU: The GRU model demonstrates the highest overall performance, achieving a training accuracy of 98.86%, a validation accuracy of 98.20%, and a test accuracy of 97.96%. It also has the lowest loss among the three models, suggesting a strong fit to the training and validation datasets.
LSTM: The LSTM model has a slightly lower accuracy than the GRU model, but it still performs well, with a training accuracy of 97.73%, a validation accuracy of 97.42%, and a test accuracy of 97.32%. Its loss is slightly higher than that of the GRU model, yet remains low, indicating a good fit to the data.
RNN: The RNN model shows the weakest performance among the three models, with a training accuracy of 82.65%, a validation accuracy of 83.24%, and a test accuracy of 82.76%. Its loss is the highest, indicating a poorer fit to the training and validation data.
In conclusion, the GRU model stands out as the best choice for our task, with the LSTM model following closely behind. Although the RNN model shows acceptable accuracy, its performance is notably lower compared to the other two models.
7. Conclusions
This study demonstrates the potential of ECG signal monitoring and classification for detecting fatigue states in elderly individuals, leveraging advanced machine learning models. Among the tested algorithms, the Gated Recurrent Unit (GRU) emerged as the most effective, achieving exceptional performance metrics with a test accuracy of 97.96% and minimal loss, indicating a robust ability to capture complex temporal dependencies in ECG signals. The Long Short-Term Memory (LSTM) model also delivered strong results, achieving comparable accuracy and demonstrating its reliability for this task.
In contrast, the standard Recurrent Neural Network (RNN) exhibited limited performance, with significantly lower accuracy (82.76%) and higher loss, highlighting its inability to handle the intricacies of ECG data as effectively as GRU and LSTM models. These findings emphasize the importance of employing advanced neural architectures for precise and reliable classification of physiological signals.
The GRU model's superior performance highlights its suitability for real-time fatigue detection systems, offering significant potential for integration into wearable and remote health monitoring technologies. Future work should explore optimizing these models further, incorporating larger datasets, and evaluating their application in diverse real-world scenarios to enhance scalability and generalizability. By advancing ECG-based fatigue detection, this research contributes to improving health monitoring and preventative care for aging populations.
Author Contributions
Conceptualization, methodology, writing—original draft, results analysis, I.K.; data collection, data analysis, writing—review and editing, results analysis, C.B.; methodology, writing—review and editing, design and presentation, references, C.B.; methodology, writing—review and editing, C.B.; methodology, writing—review and editing, C.B.; methodology, writing—review and editing, C.B.; methodology, writing—review and editing, C.B. All authors have read and agreed to the published version of the manuscript.
Funding
This research was financially supported by MACS Laboratory: Modeling, Analysis and Control of Systems LR16ES22 National Engineering School Gabes, University of Gabes.
Institutional Review Board Statement
Not applicable.
Informed Consent Statement
Not applicable.
Data Availability Statement
The datasets used during the current study are available from the corresponding author on reasonable request.
Conflicts of Interest
The authors declare no conflict of interest.
Acknowledgments
This work was supported by MACS Laboratory: Modeling, Analysis and Control of Systems LR16ES22 National Engineering School Gabes, University of Gabes and LR-Sys'Com-ENIT, Communications Systems LR-99-ES21 National Engineering School of Tunis, University of Tunis.
References
- Ruvalcaba, N.M.M.; Humboldt, S.; Villavicencio, M.E.F.; García, I.F.D. Psychological Fatigue. In Encyclopedia of Gerontology and Population Aging; Springer: Cham, Switzerland, 2019; pp. 1–5.
- Zhao, C.; Zhao, M.; Liu, J.; Zheng, C. Electroencephalogram and Electrocardiograph Assessment of Mental Fatigue in a Driving Simulator. Accid. Anal. Prev. 2012, 45, 83–90. [Google Scholar]. [CrossRef]
- Proost, M.; Habay, J.; De Wachter, J.; De Pauw, K.; Rattray, B.; Meeusen, R.; Roelands, B.; Van Cutsem, J. How to Tackle Mental Fatigue: A Systematic Review of Potential Countermeasures and Their Underlying Mechanisms. Sport. Med. 2022, 52, 2129–2158. [CrossRef]
- Huang, S.; Li, J.; Zhang, P.; Zhang, W. International Journal of Medical Informatics Detection of Mental Fatigue State with Wearable ECG Devices. Int. J. Med. Inform. 2018, 119, 39–46.
- Bin Heyat, M.B.; Akhtar, F.; Abbas, S.J.; Al-Sarem, M.; Alqarafi, A.; Stalin, A.; Abbasi, R.; Muaad, A.Y.; Lai, D.; Wu, K. Wearable Flexible Electronics Based Cardiac Electrode for Researcher Mental Stress Detection System Using Machine Learning Models on Single Lead Electrocardiogram Signal. Biosensors 2022, 12, 427. [CrossRef]
- Tanaka, M.; Mizuno, K.; Yamaguti, K.; Kuratsune, H.; Fujii, A.; Baba, H.; Matsuda, K.; Nishimae, A.; Takesaka, T.; Watanabe, Y. Autonomic Nervous Alterations Associated with Daily Level of Fatigue. Behav. Brain Funct. 2011, 7, 46. [CrossRef]
- GREISER, Karin H., KLUTTIG, Alexander, SCHUMANN, Barbara, et al. Cardiovascular disease, risk factors and heart rate variability in the elderly general population: design and objectives of the CARdiovascular disease, Living and Ageing in Halle (CARLA) Study. BMC cardiovascular disorders, 2005, vol. 5, p. 1-14. [CrossRef]
- JACKSON, Charles F. et WENGER, Nanette K. Cardiovascular disease in the elderly. Revista Española de Cardiología (English Edition), 2011, vol. 64, no 8, p. 697-712.
- Antzelevitch, C.; Burashnikov, A. Overview of basic mechanisms of cardiac arrhythmia. Card. Electrophysiol. Clin. 2011, 3, 23–45. [CrossRef]
- Banos, O.; Damas, M.; Pomares, H.; Prieto, A.; Rojas, I. Daily living activity recognition based on statistical feature quality group selection. Expert Syst. Appl. 2012, 39, 8013–8021. [CrossRef]
- Clifford, G.D.; Azuaje, F.; McSharry, P. Advanced Methods and Tools for ECG Data Analysis; Artech House: Boston, MA, USA, 2006; Volume 10.
- M.J. Deen, Information and communications technologies for elderly ubiquitous healthcare in a smart home, Personal and Ubiquitous Computing 19(3) (2015), 573–599. [CrossRef]
- S. Majumder, T. Mondal and M.J. Deen, Wearable sensors for remote health monitoring, Sensors 17(1) (2017), 130. [CrossRef]
- F. Buendia, S. Faiz, R. Jabla and M. Khemaja, Smartphone devices in smart environments: Ambient assisted living approach for elderly people, in: International Conference on Advances in Computer-Human Interactions, 2020, pp. 216–222.
- S. Klakegg, K.O. Asare, N. van Berkel, A. Visuri, E. Ferreira, S. Hosio, J. Goncalves, H.-L. Huttunen and D. Ferreira, CARE: Contextawareness for elderly care, Health and Technology 11(1) (2021), 211–226. [CrossRef]
- F. Muheidat, L. Tawalbeh and H. Tyrer, Context-aware, accurate, and real time fall detection system for elderly people, in: 2018 IEEE 12th International Conference on Semantic Computing (ICSC), IEEE, 2018, pp. 329–333.
- N. Mezghani, Y. Ouakrim, M.R. Islam, R. Yared and B. Abdulrazak, Context aware adaptable approach for fall detection bases on smart textile, in: 2017 IEEE EMBS International Conference on Biomedical & Health Informatics (BHI), IEEE, 2017, pp. 473–476.
- L. Yu, W.M. Chan, Y. Zhao and K.-L. Tsui, Personalized health monitoring system of elderly wellness at the community level in Hong Kong, IEEE Access 6 (2018), 35558–35567. [CrossRef]
- E. Zdravevski, P. Lameski, V. Trajkovik, A. Kulakov, I. Chorbev, R. Goleva, N. Pombo and N. Garcia, Improving activity recognition accuracy in ambient-assisted living systems by automated feature engineering, Ieee Access 5 (2017), 5262–5280. [CrossRef]
- A. Rashed, A. Ibrahim, A. Adel, B. Mourad, A. Hatem, M. Magdy, N. Elgaml and A. Khattab, Integrated IoT medical platform for remote healthcare and assisted living, in: 2017 Japan-Africa Conference on Electronics, Communications and Computers (JAC-ECC), IEEE, 2017, pp. 160–163.
- M.Á. Antón, J. Ordieres-Meré, U. Saralegui and S. Sun, Non-invasive ambient intelligence in real life: Dealing with noisy patterns to help older people, Sensors 19(14) (2019), 3113. [CrossRef]
- D. Ajerla, S. Mahfuz and F. Zulkernine, A real-time patient monitoring framework for fall detection, Wireless Communications and Mobile Computing 2019 (2019). [CrossRef]
- G. Vavoulas, C. Chatzaki, T. Malliotakis, M. Pediaditis and M. Tsiknakis, The MobiAct dataset: Recognition of activities of daily living using smartphones, in: ICT4AgeingWell, 2016, pp. 143–151.
- M. Al-Khafajiy, T. Baker, C. Chalmers, M. Asim, H. Kolivand, M. Fahim and A. Waraich, Remote health monitoring of elderly through wearable sensors, Multimedia Tools and Applications 78(17) (2019), 24681–24706. [CrossRef]
- J.-L. Bayo-Monton, A. Martinez-Millana, W. Han, C. Fernandez-Llatas, Y. Sun and V. Traver, Wearable sensors integrated with Internet of things for advancing eHealth care, Sensors 18(6) (2018), 1851. [CrossRef]
- N.V. Panicker and A.S. Kumar, Tablet PC enabled body sensor system for rural telehealth applications, International journal of telemedicine and applications 2016 (2016). [CrossRef]
- Y.-J. Hong, I.-J. Kim, S.C. Ahn and H.-G. Kim, Mobile health monitoring system based on activity recognition using accelerometer, Simulation Modelling Practice and Theory 18(4) (2010), 446–455. [CrossRef]
- G. Doquire and M. Verleysen, Mutual information-based feature selection for multilabel classification, Neurocomputing 122 (2013), 148–155. [CrossRef]
- Analog Devices. (n.d.). AD8232 Single-Lead, Heart Rate Monitor Front End. Retrieved from Analog Devices website.
- Arias, F., Nunez, M. Z., Guerra-Adames, A., Tejedor-Flores, N., & Vargas-Lombardo, M. (2022). Sentiment analysis of public social media as a tool for health-related topics. IEEE Access, 10, 74850-74872. [CrossRef]
- Mohsen, S. (2023). Recognition of human activity using GRU deep learning algorithm. Multimedia Tools and Applications, 82(30), 47733-47749. [CrossRef]
- https://emergingindiagroup.com/long-short-term-memory-lstm/.
Figure 1.
Proposed framework.
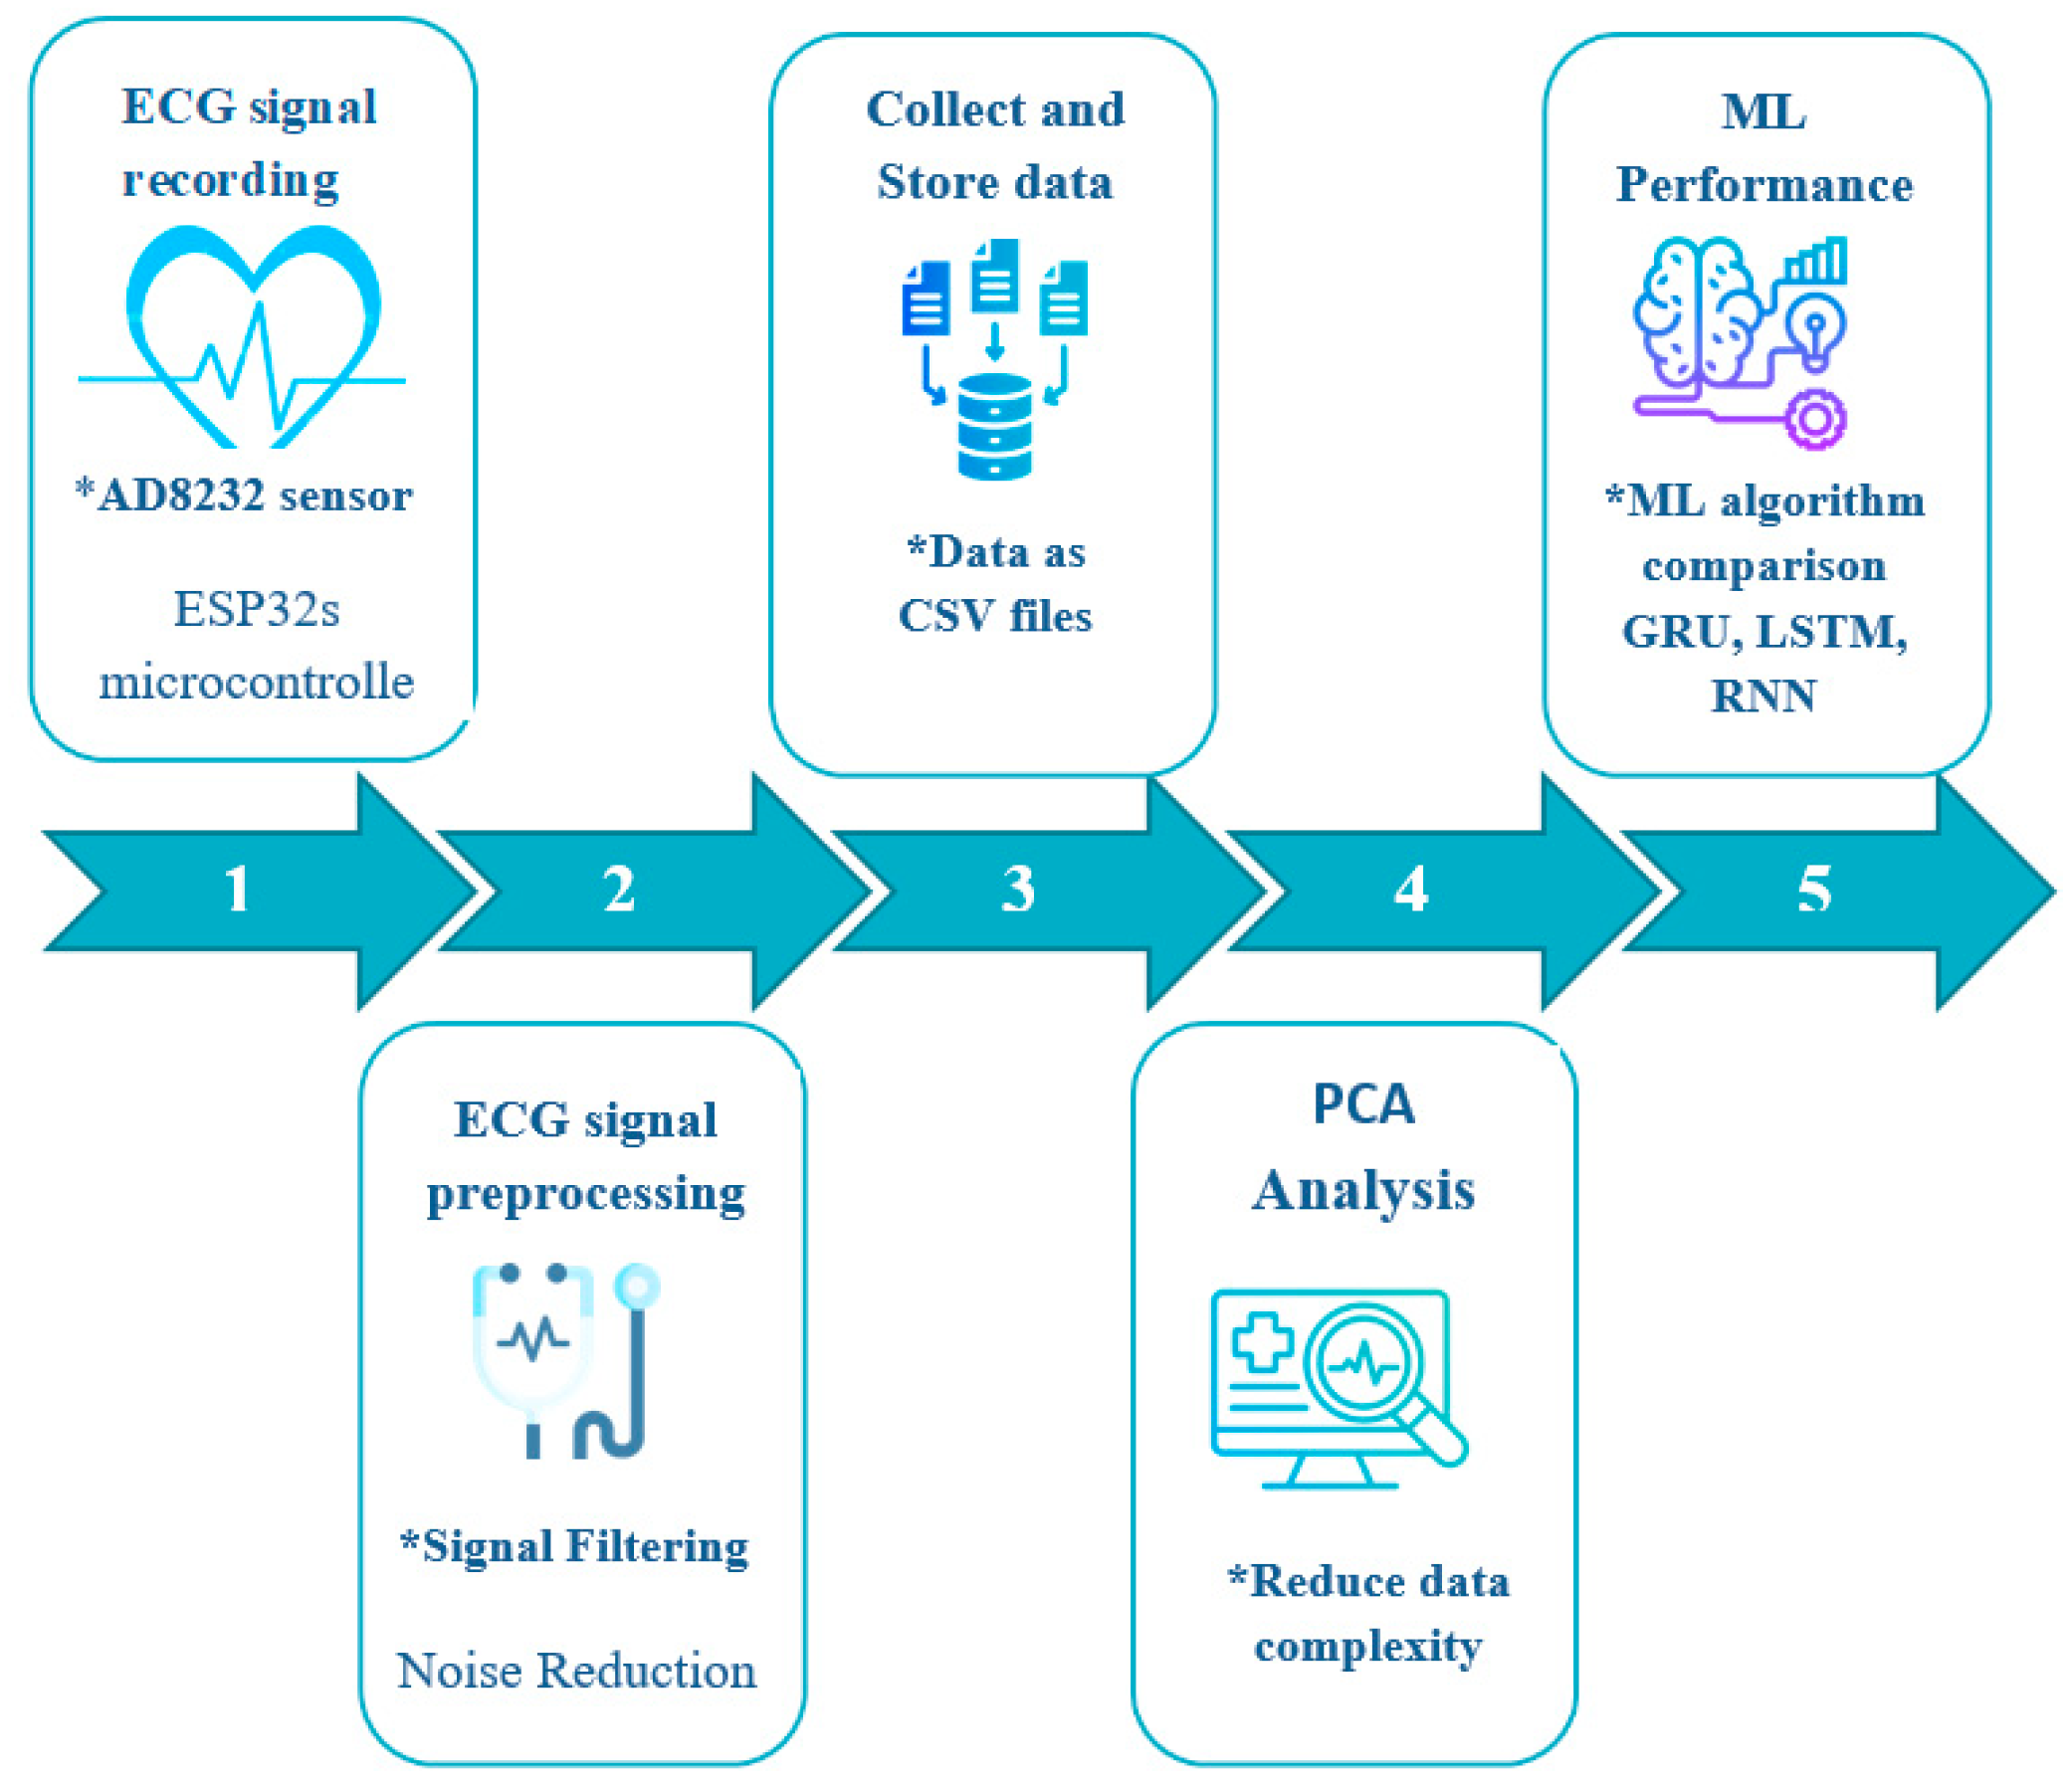
Figure 2.
Embedded System for ECG Signal Monitoring: Experimental Setup.
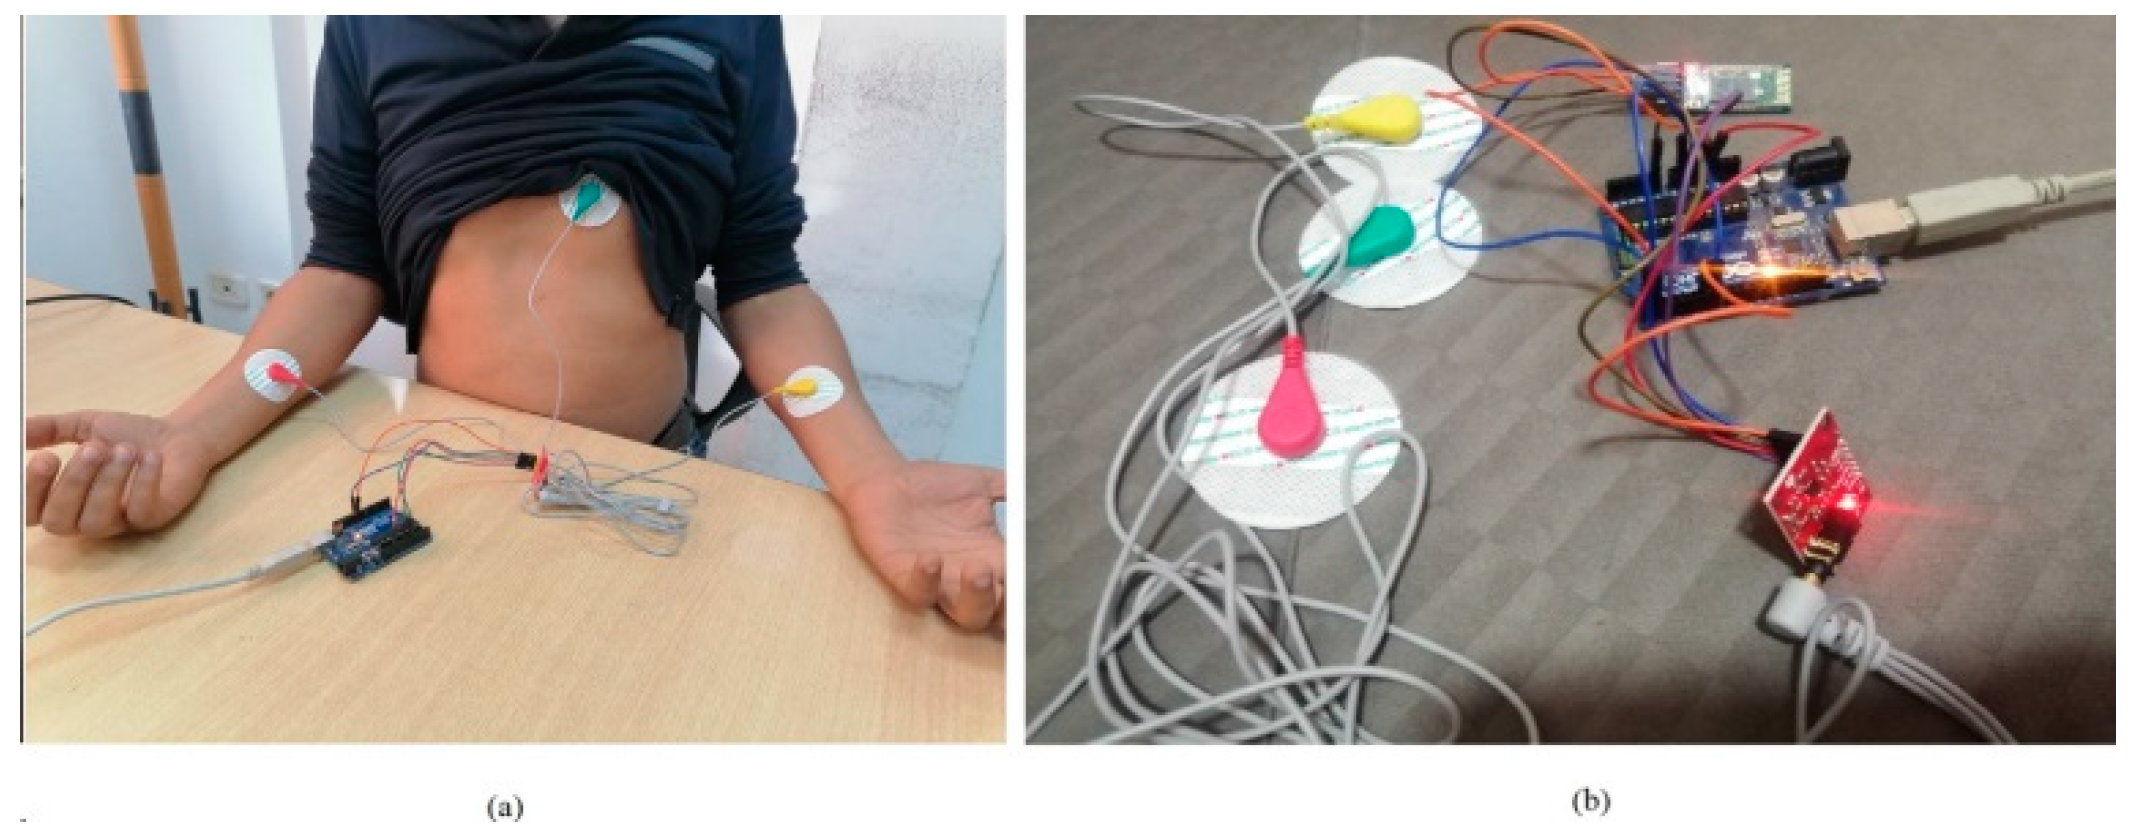
Figure 3.
Representation of an ECG signal.
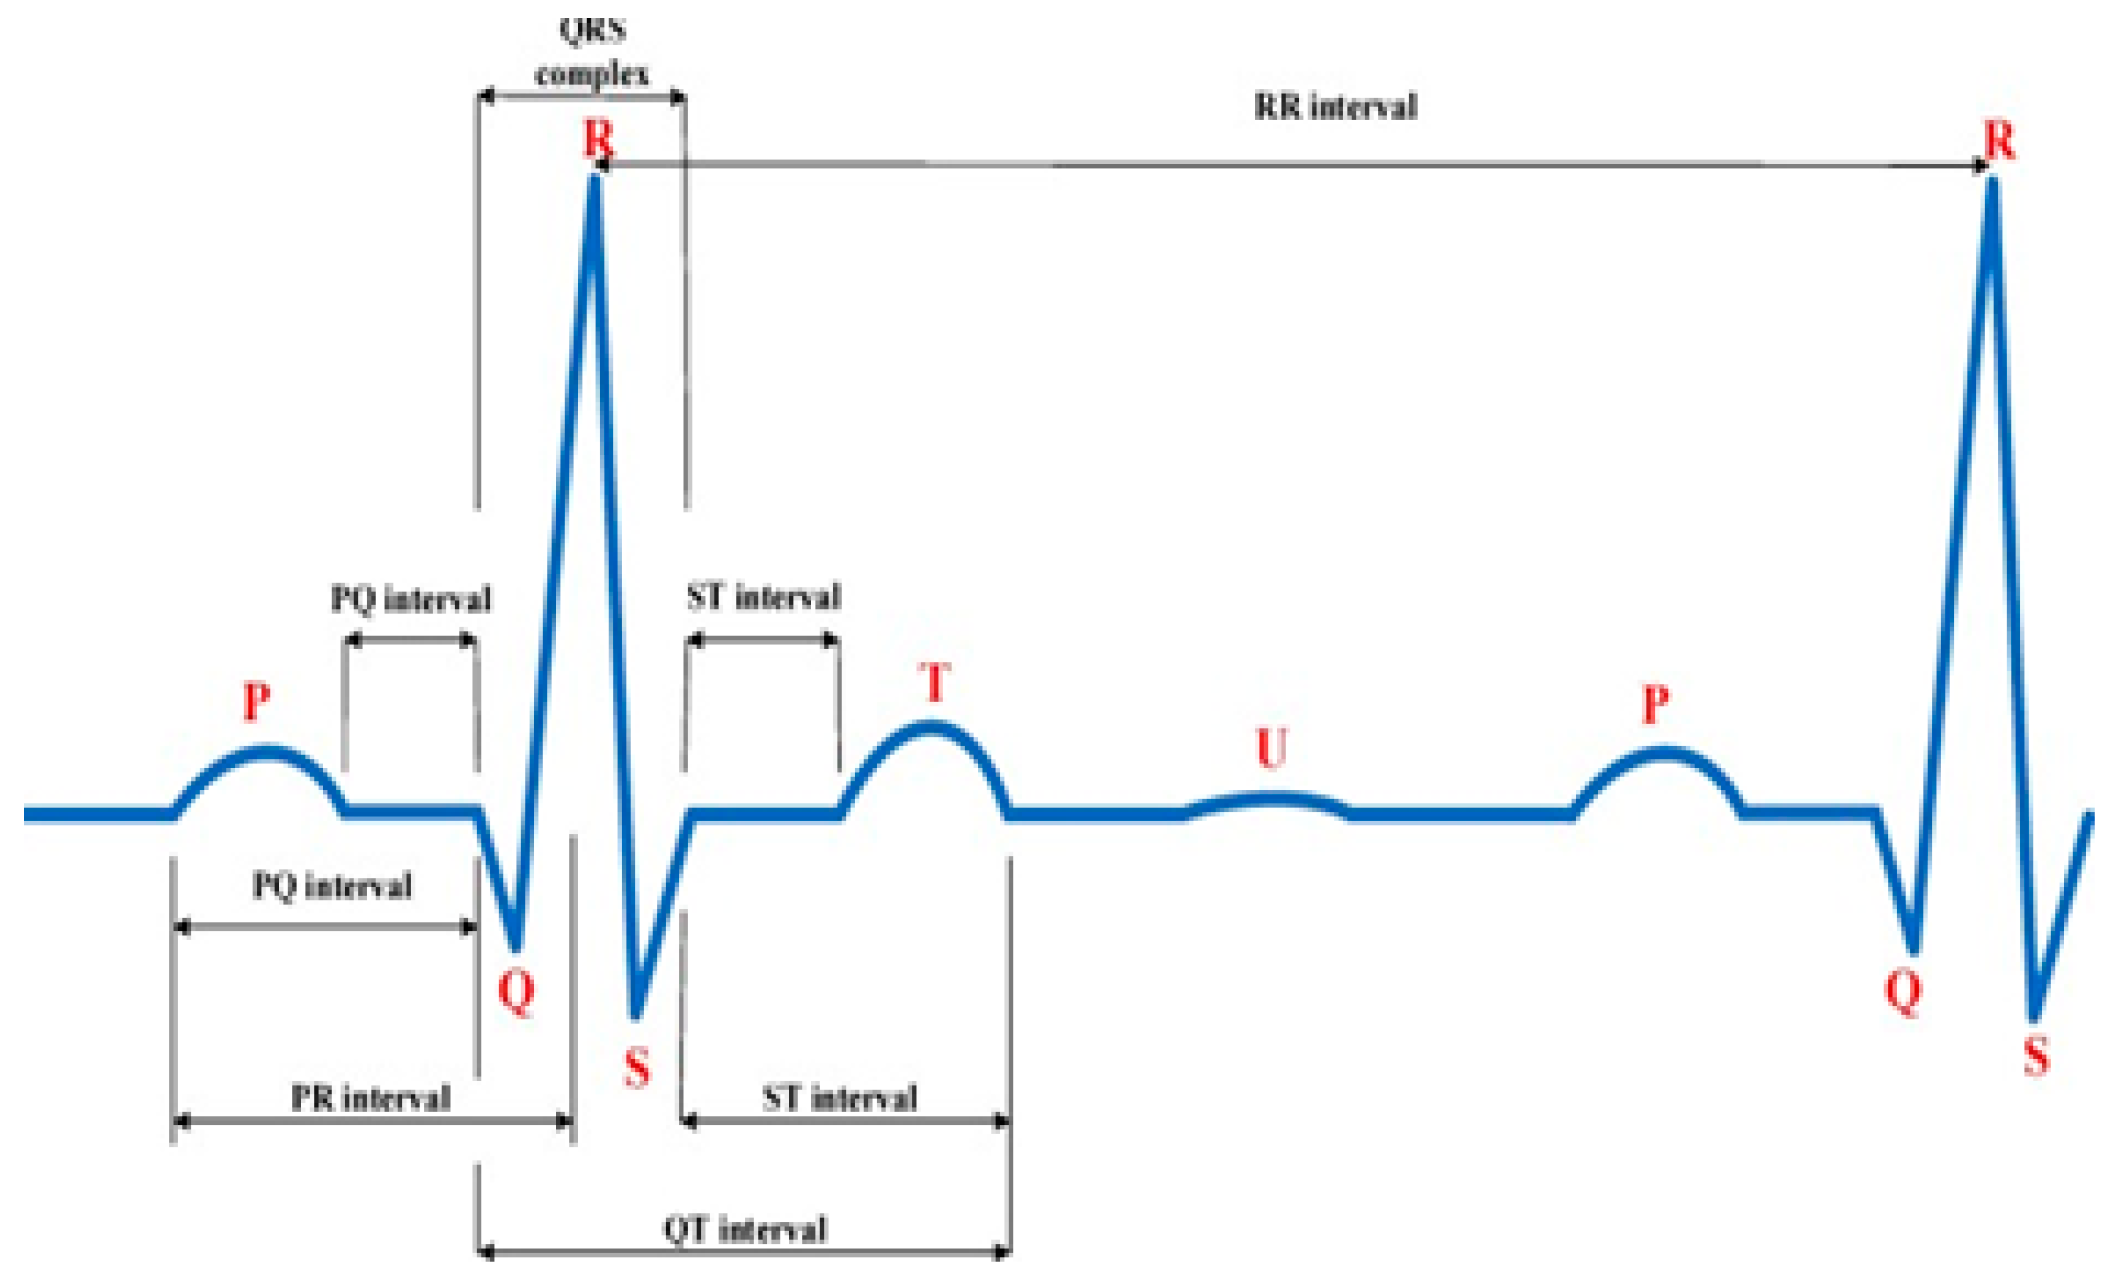
Figure 4.
ANN Serial Plotter.
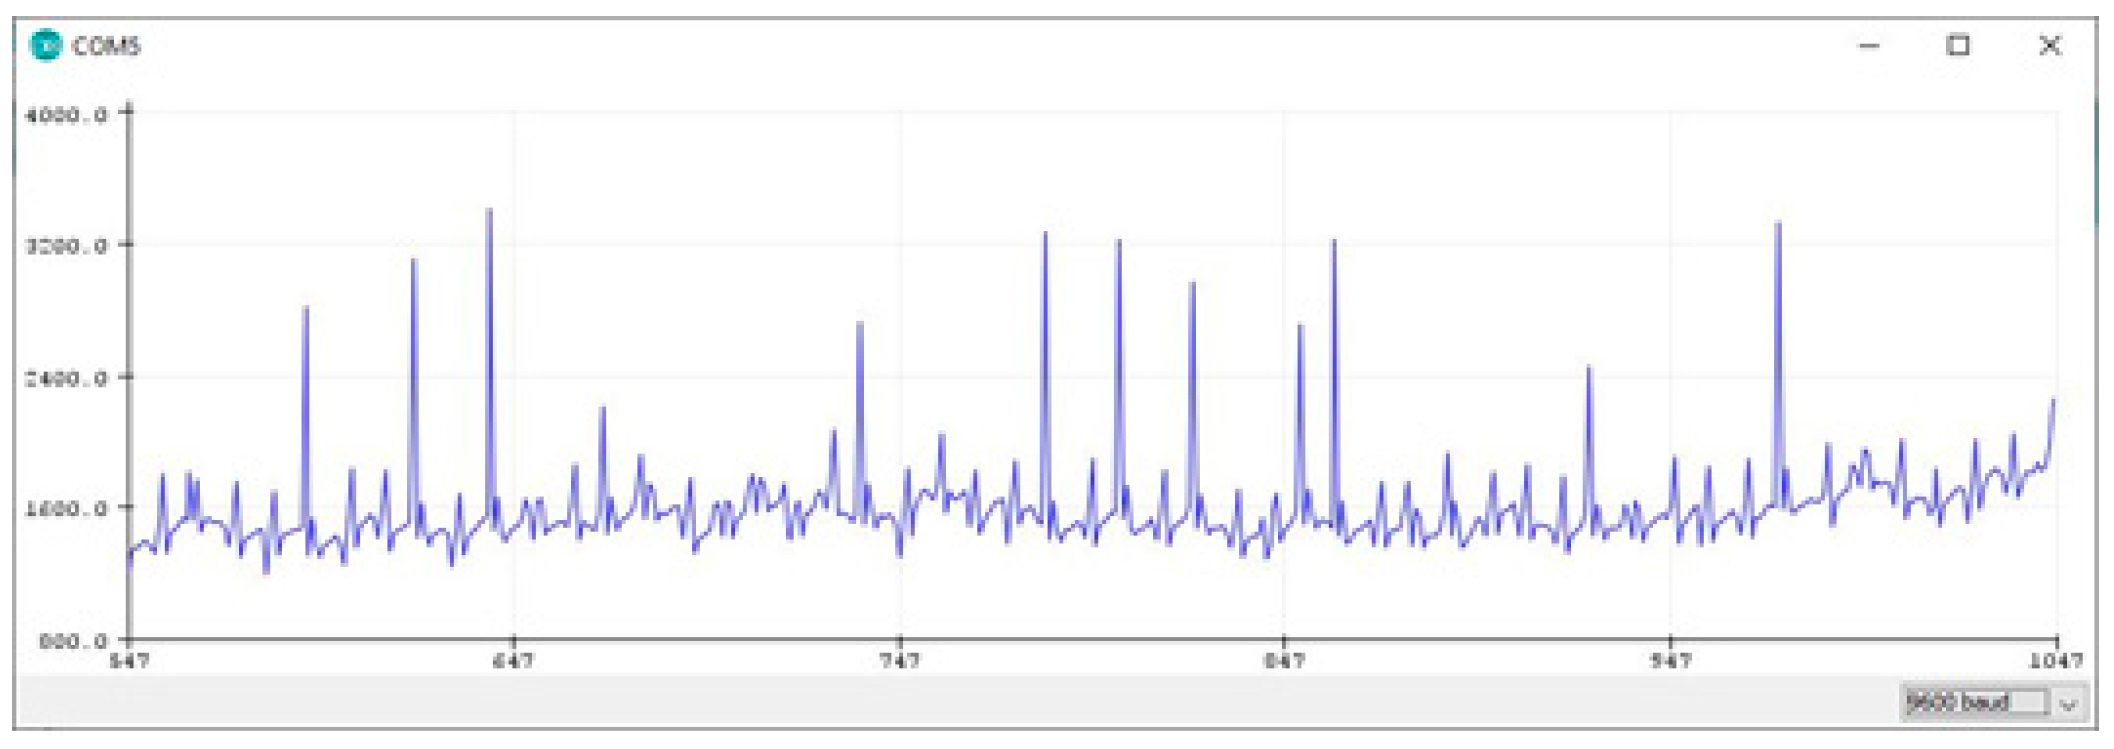
Figure 5.
Real ECG Signal Before and After Filtering.
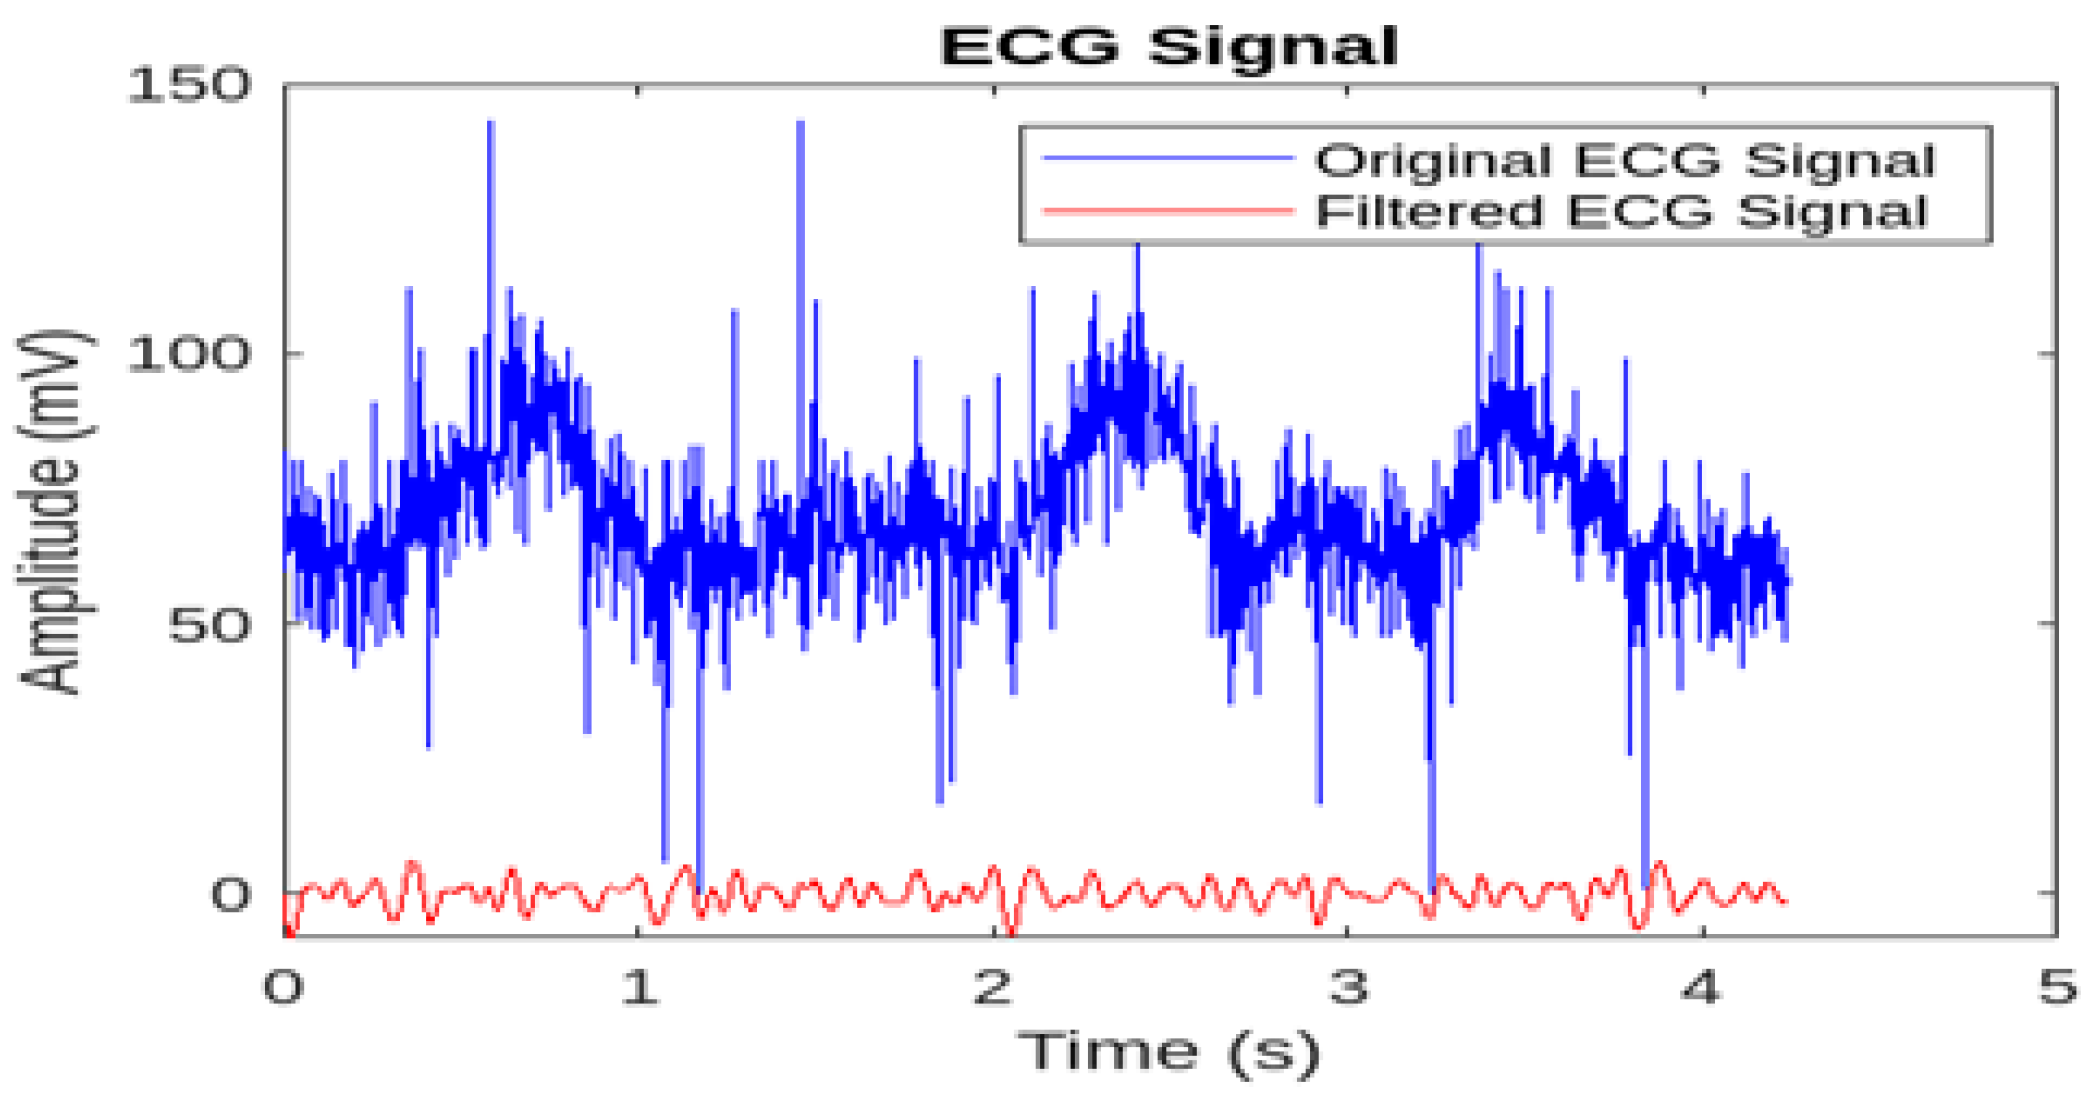
Figure 6.
Architecture of the Recurrent Neural Network.
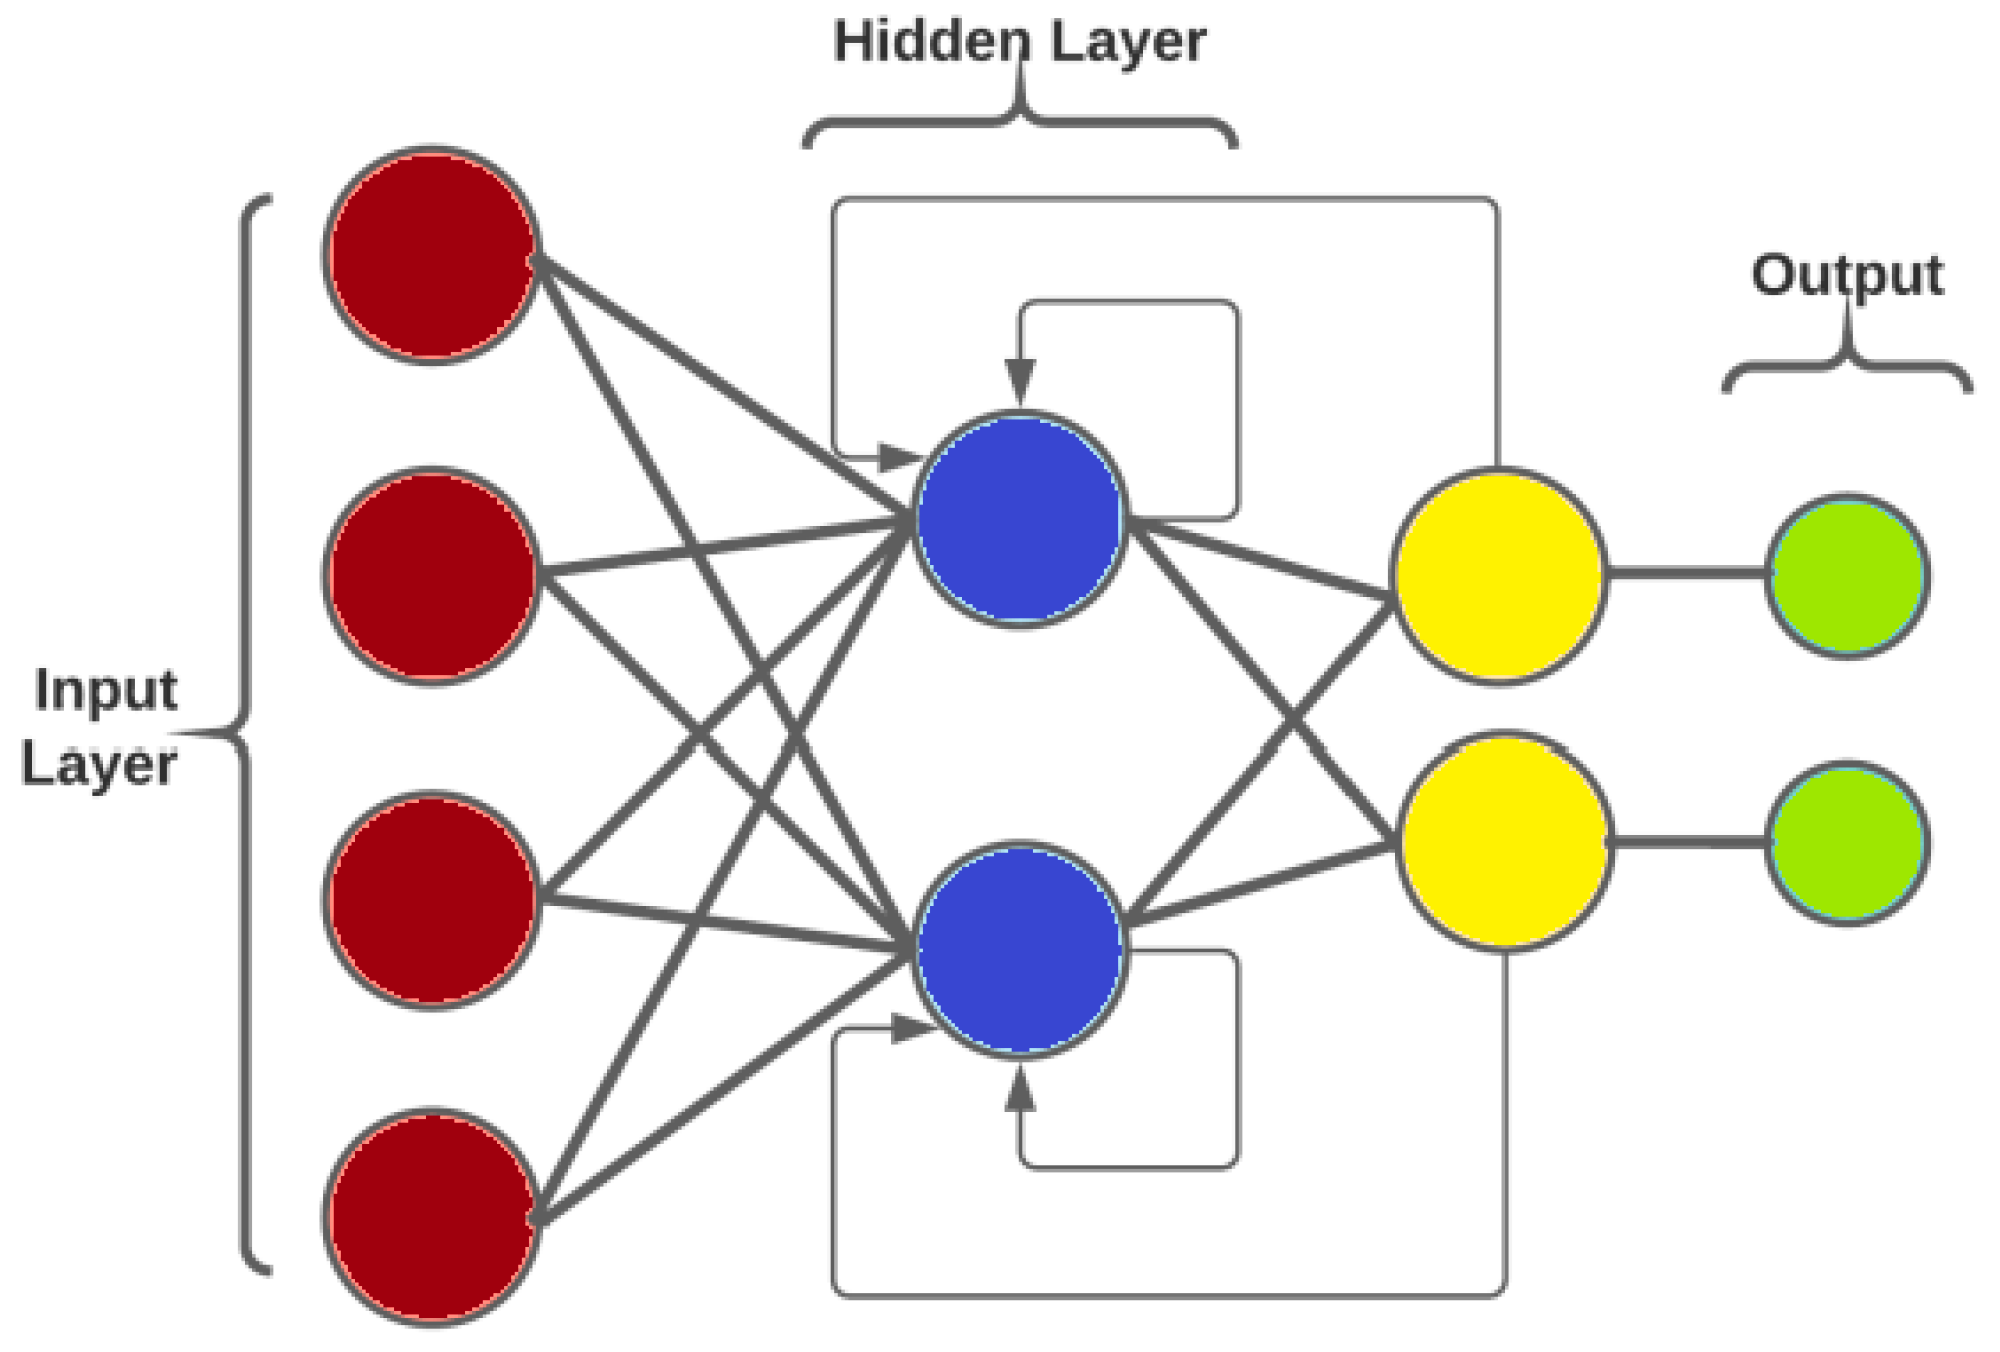
Figure 7.
Architecture of the Gated Recurrent Units (GRU) [31].
Figure 7.
Architecture of the Gated Recurrent Units (GRU) [31].
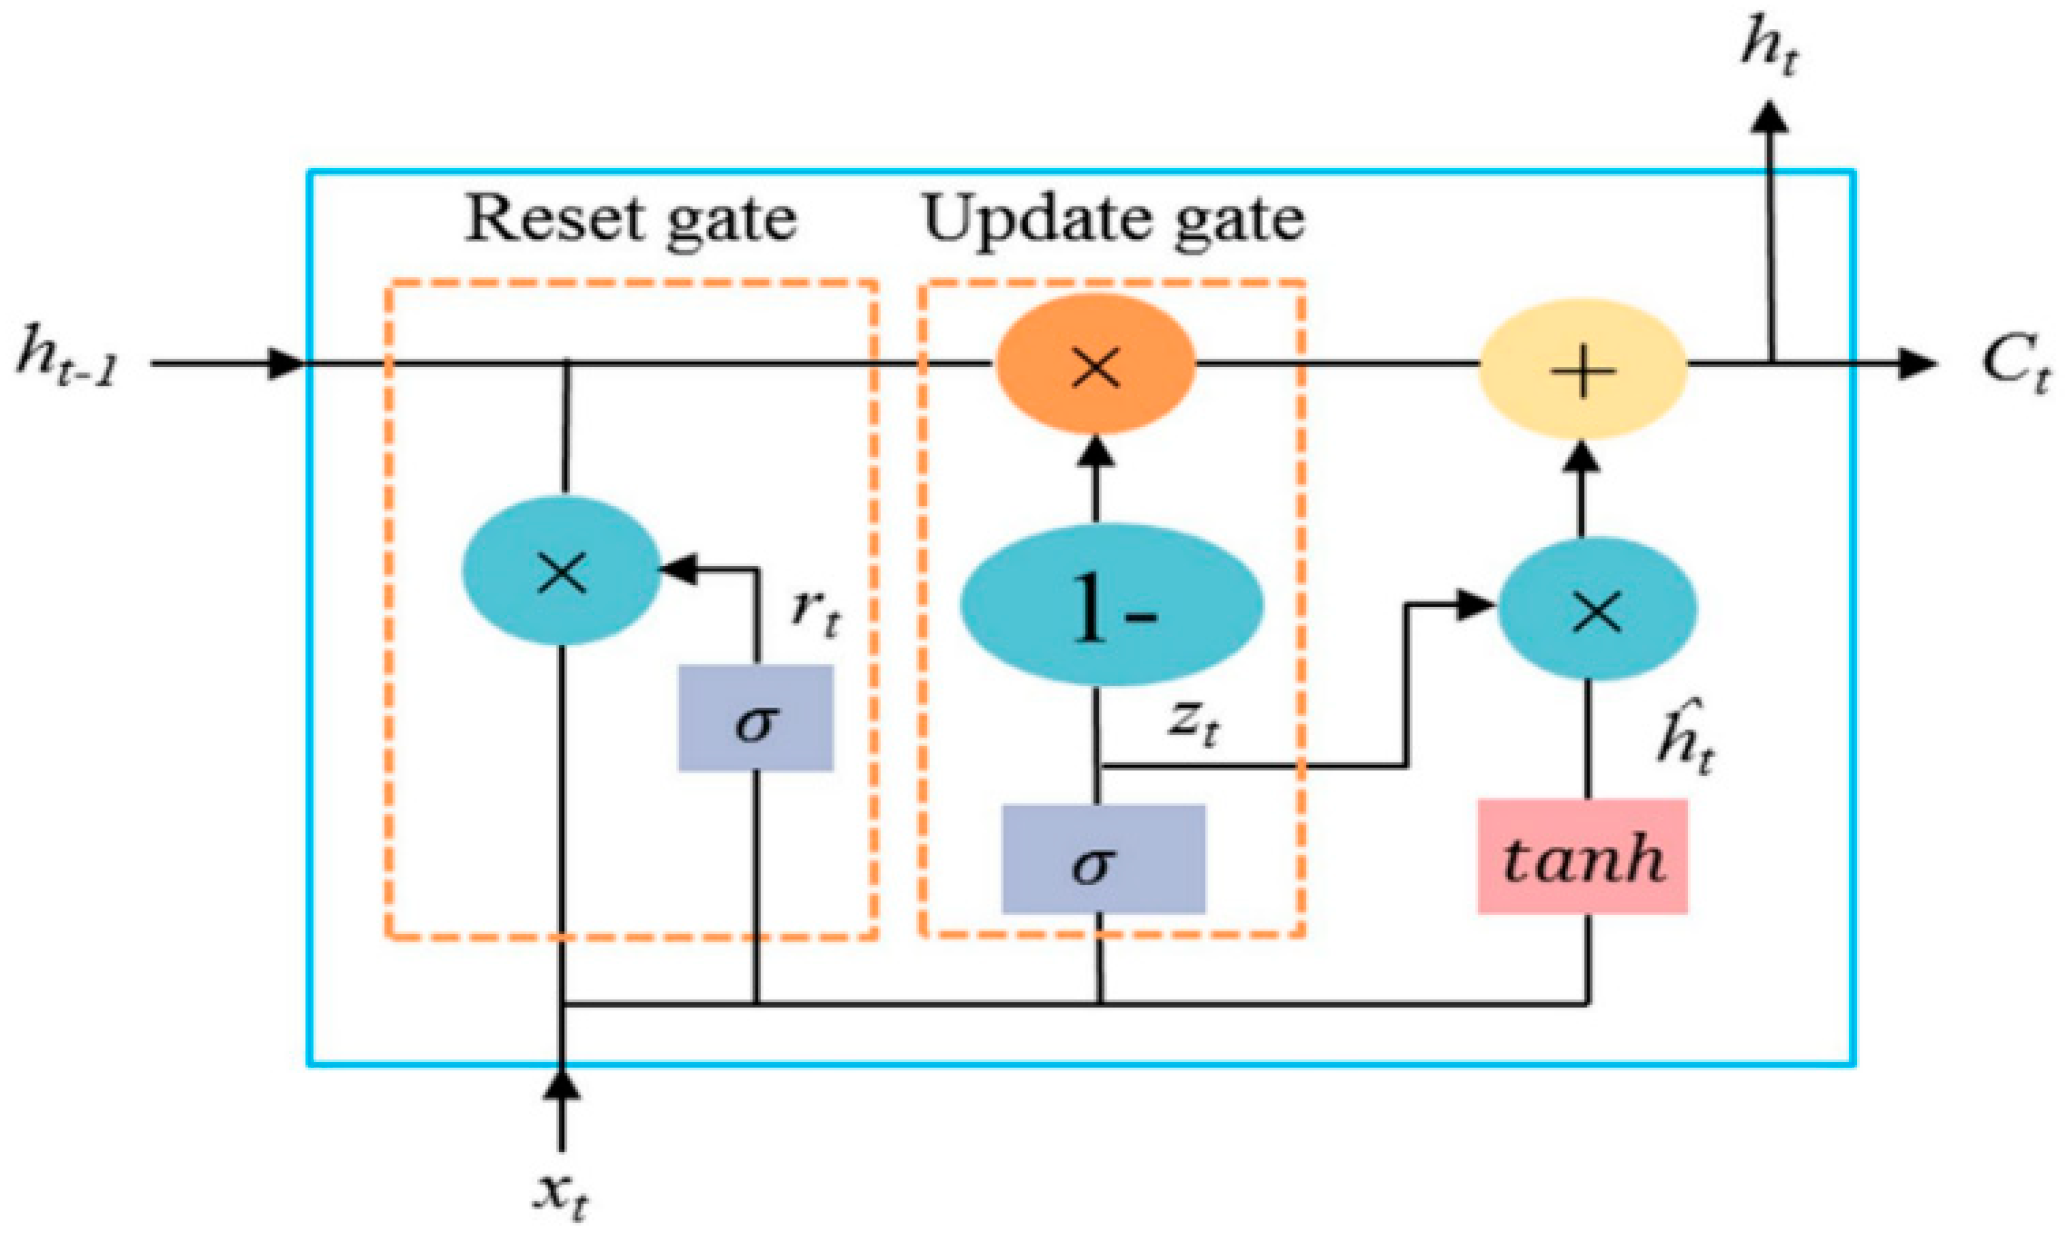
Figure 8.
Architecture of the Long Short-Term Memory (LSTM) [32].
Figure 8.
Architecture of the Long Short-Term Memory (LSTM) [32].
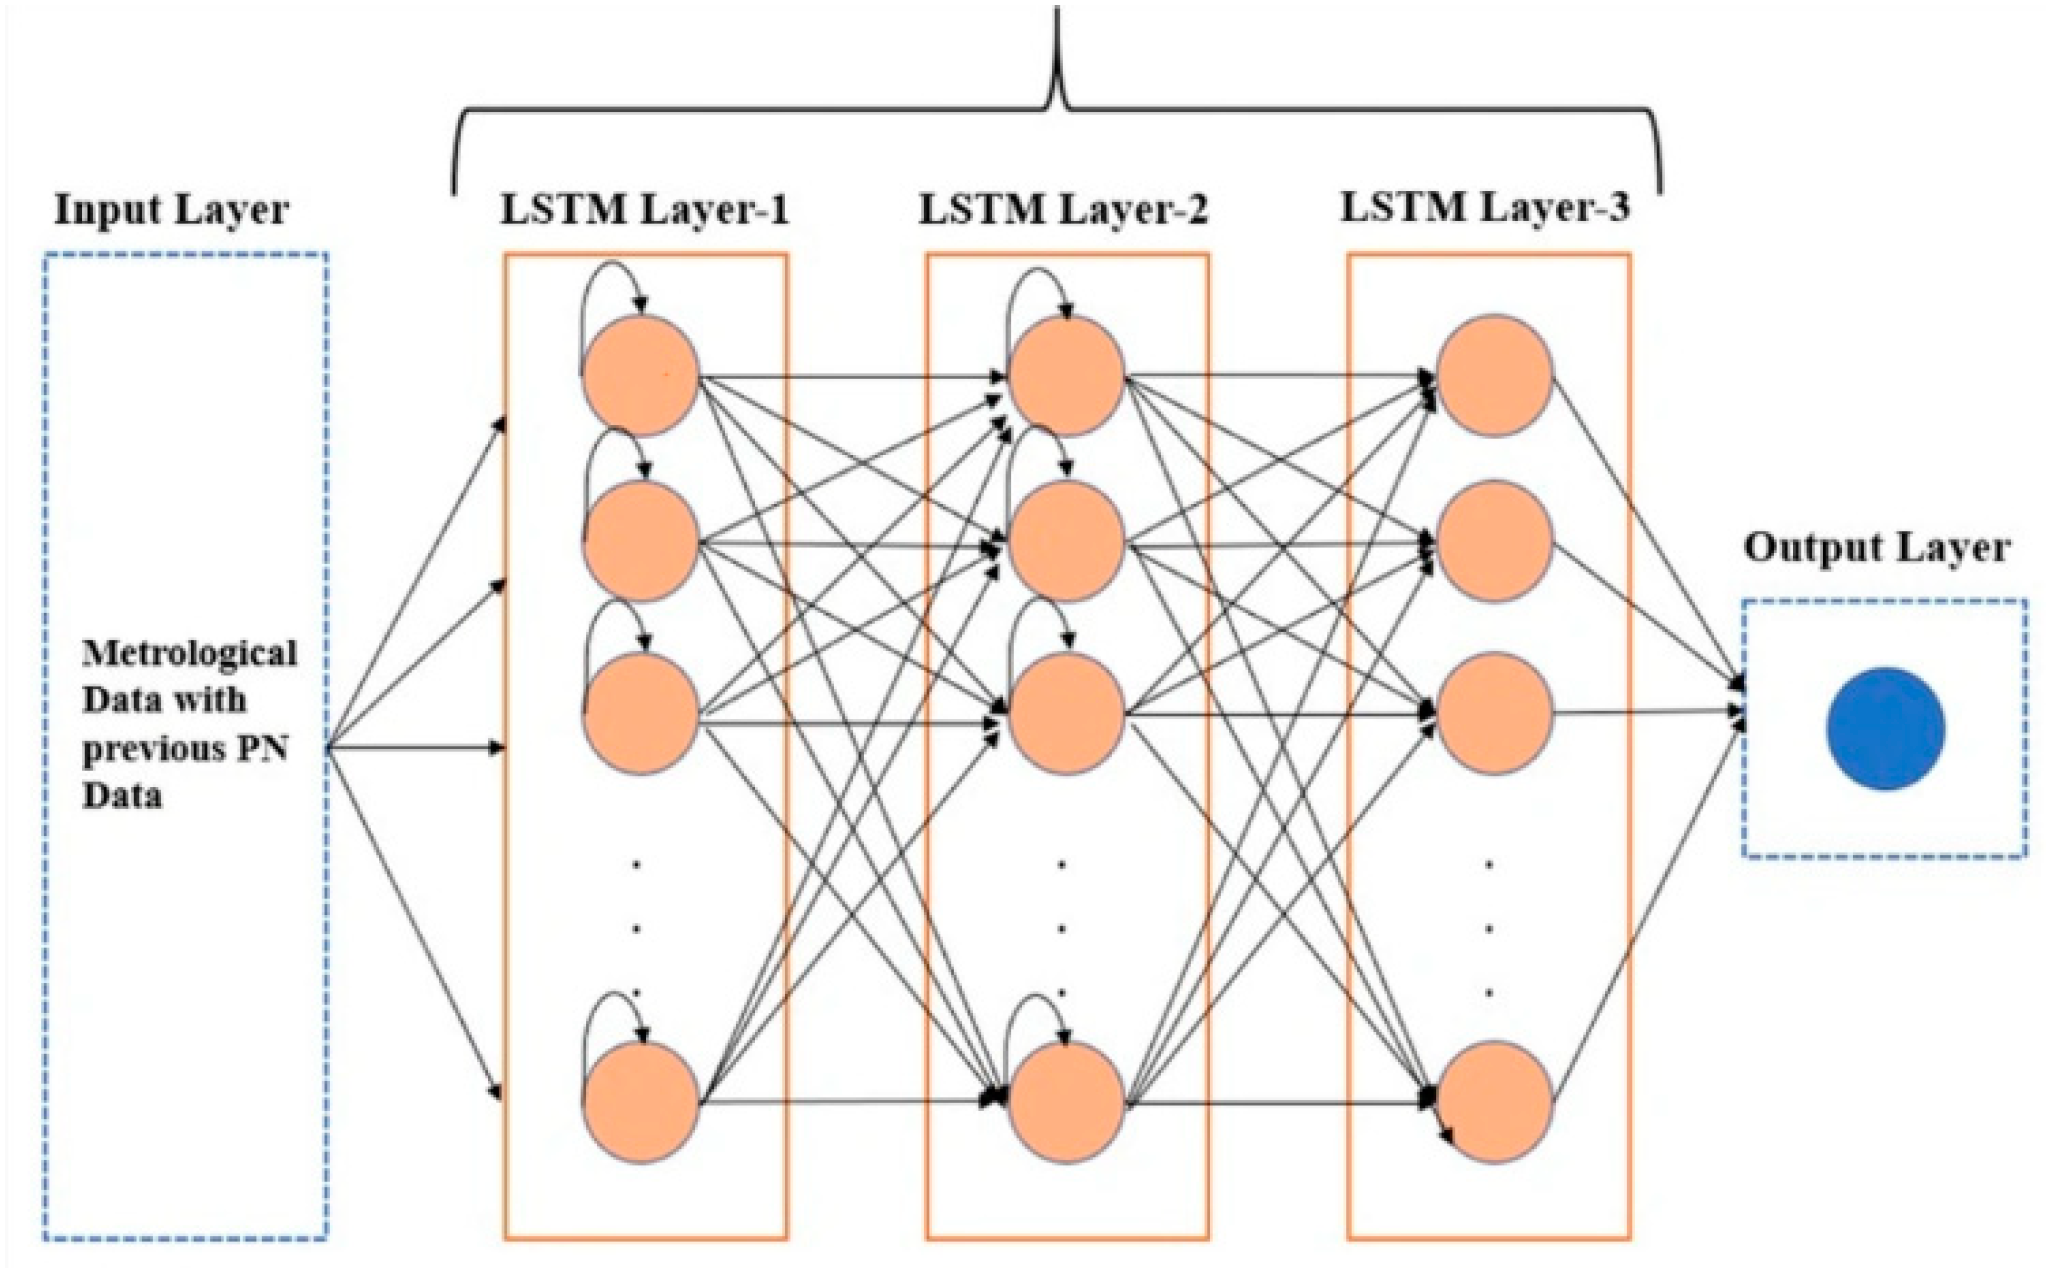
Figure 9.
Accuracy and loss for RNN model.
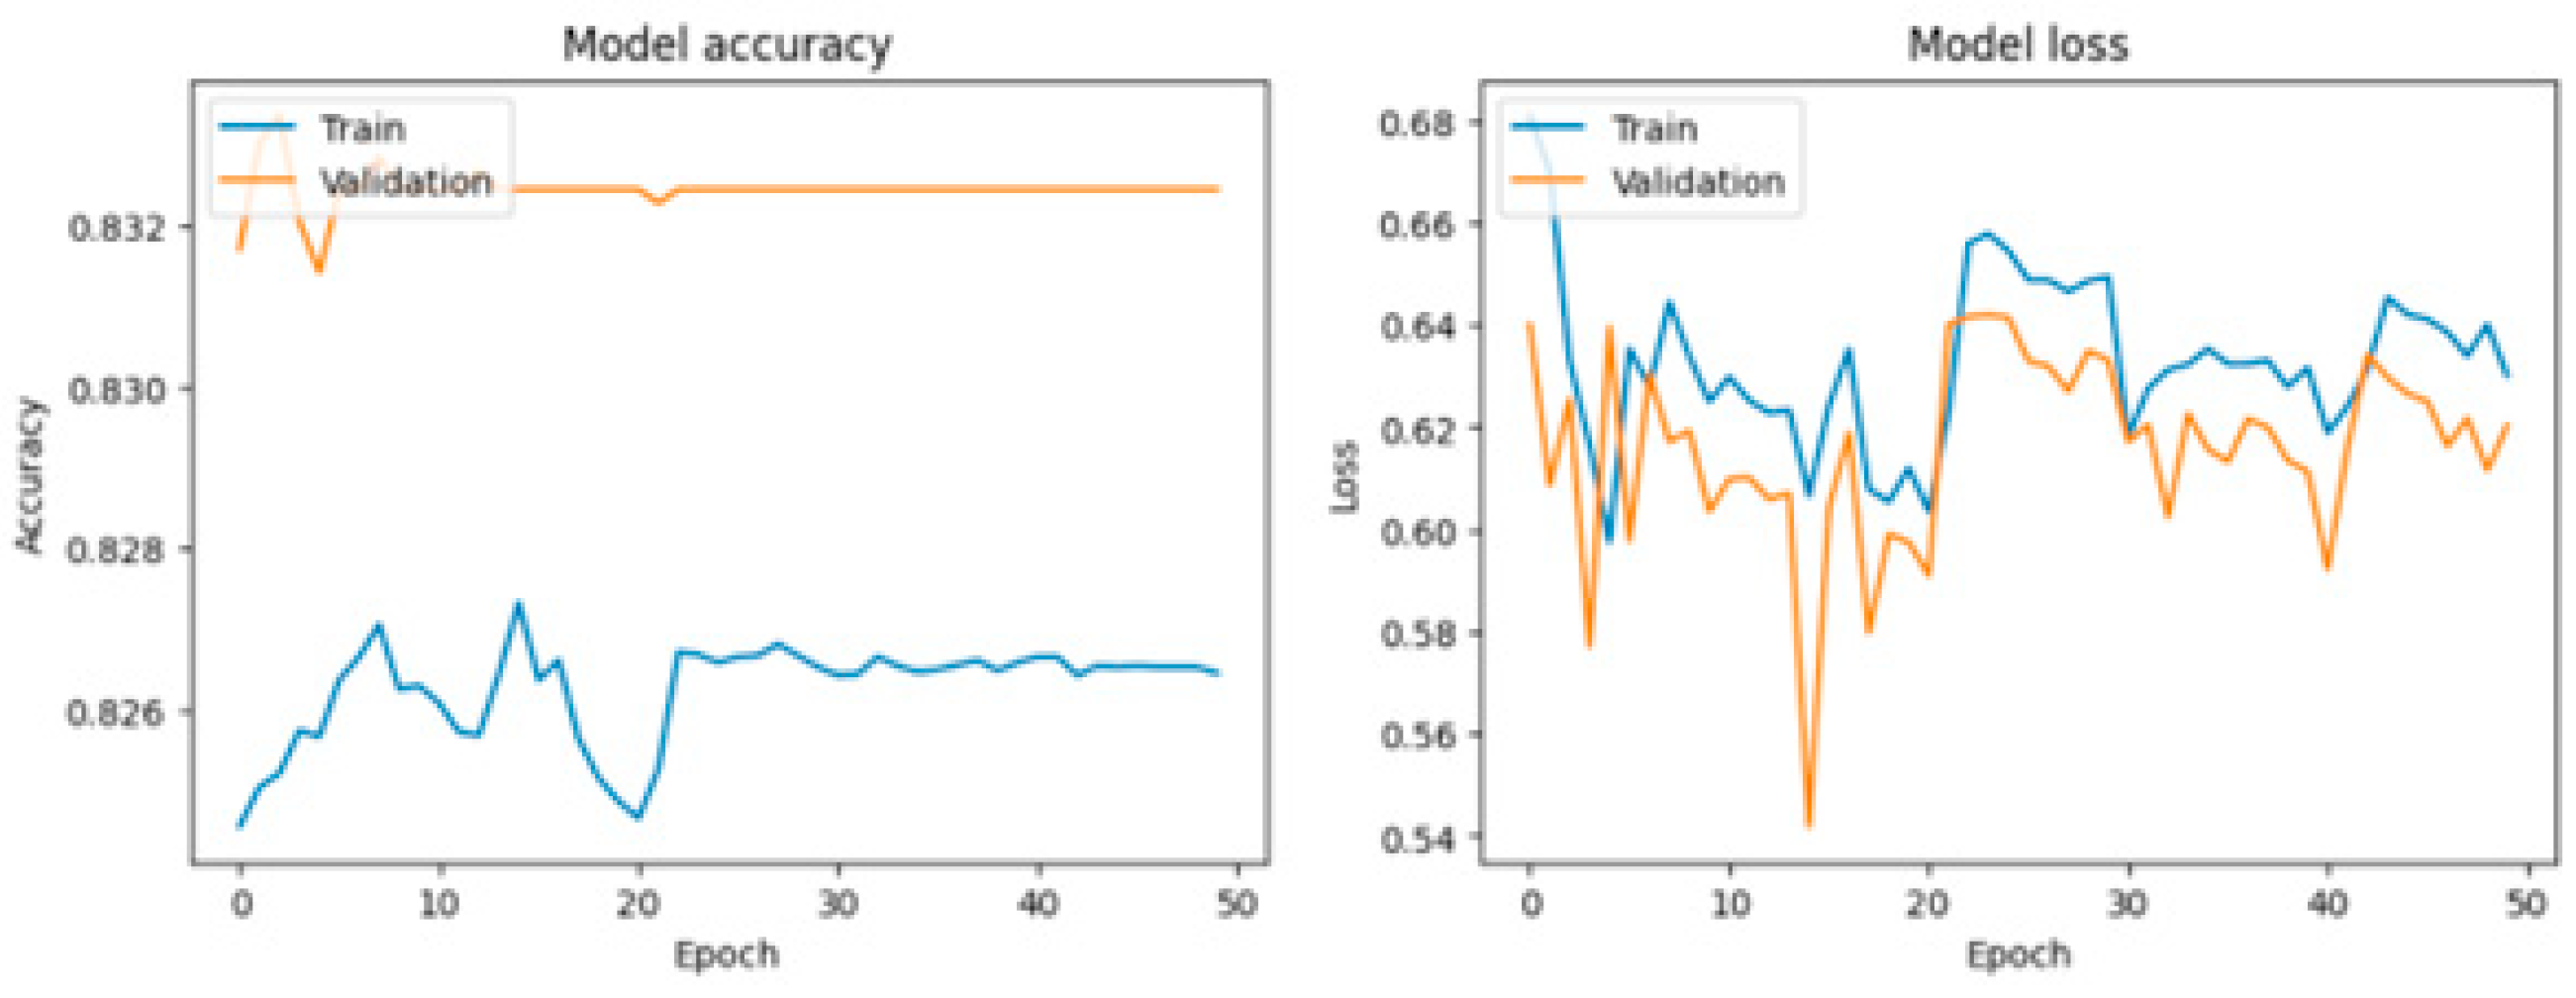
Figure 10.
Accuracy and loss for GRU model.
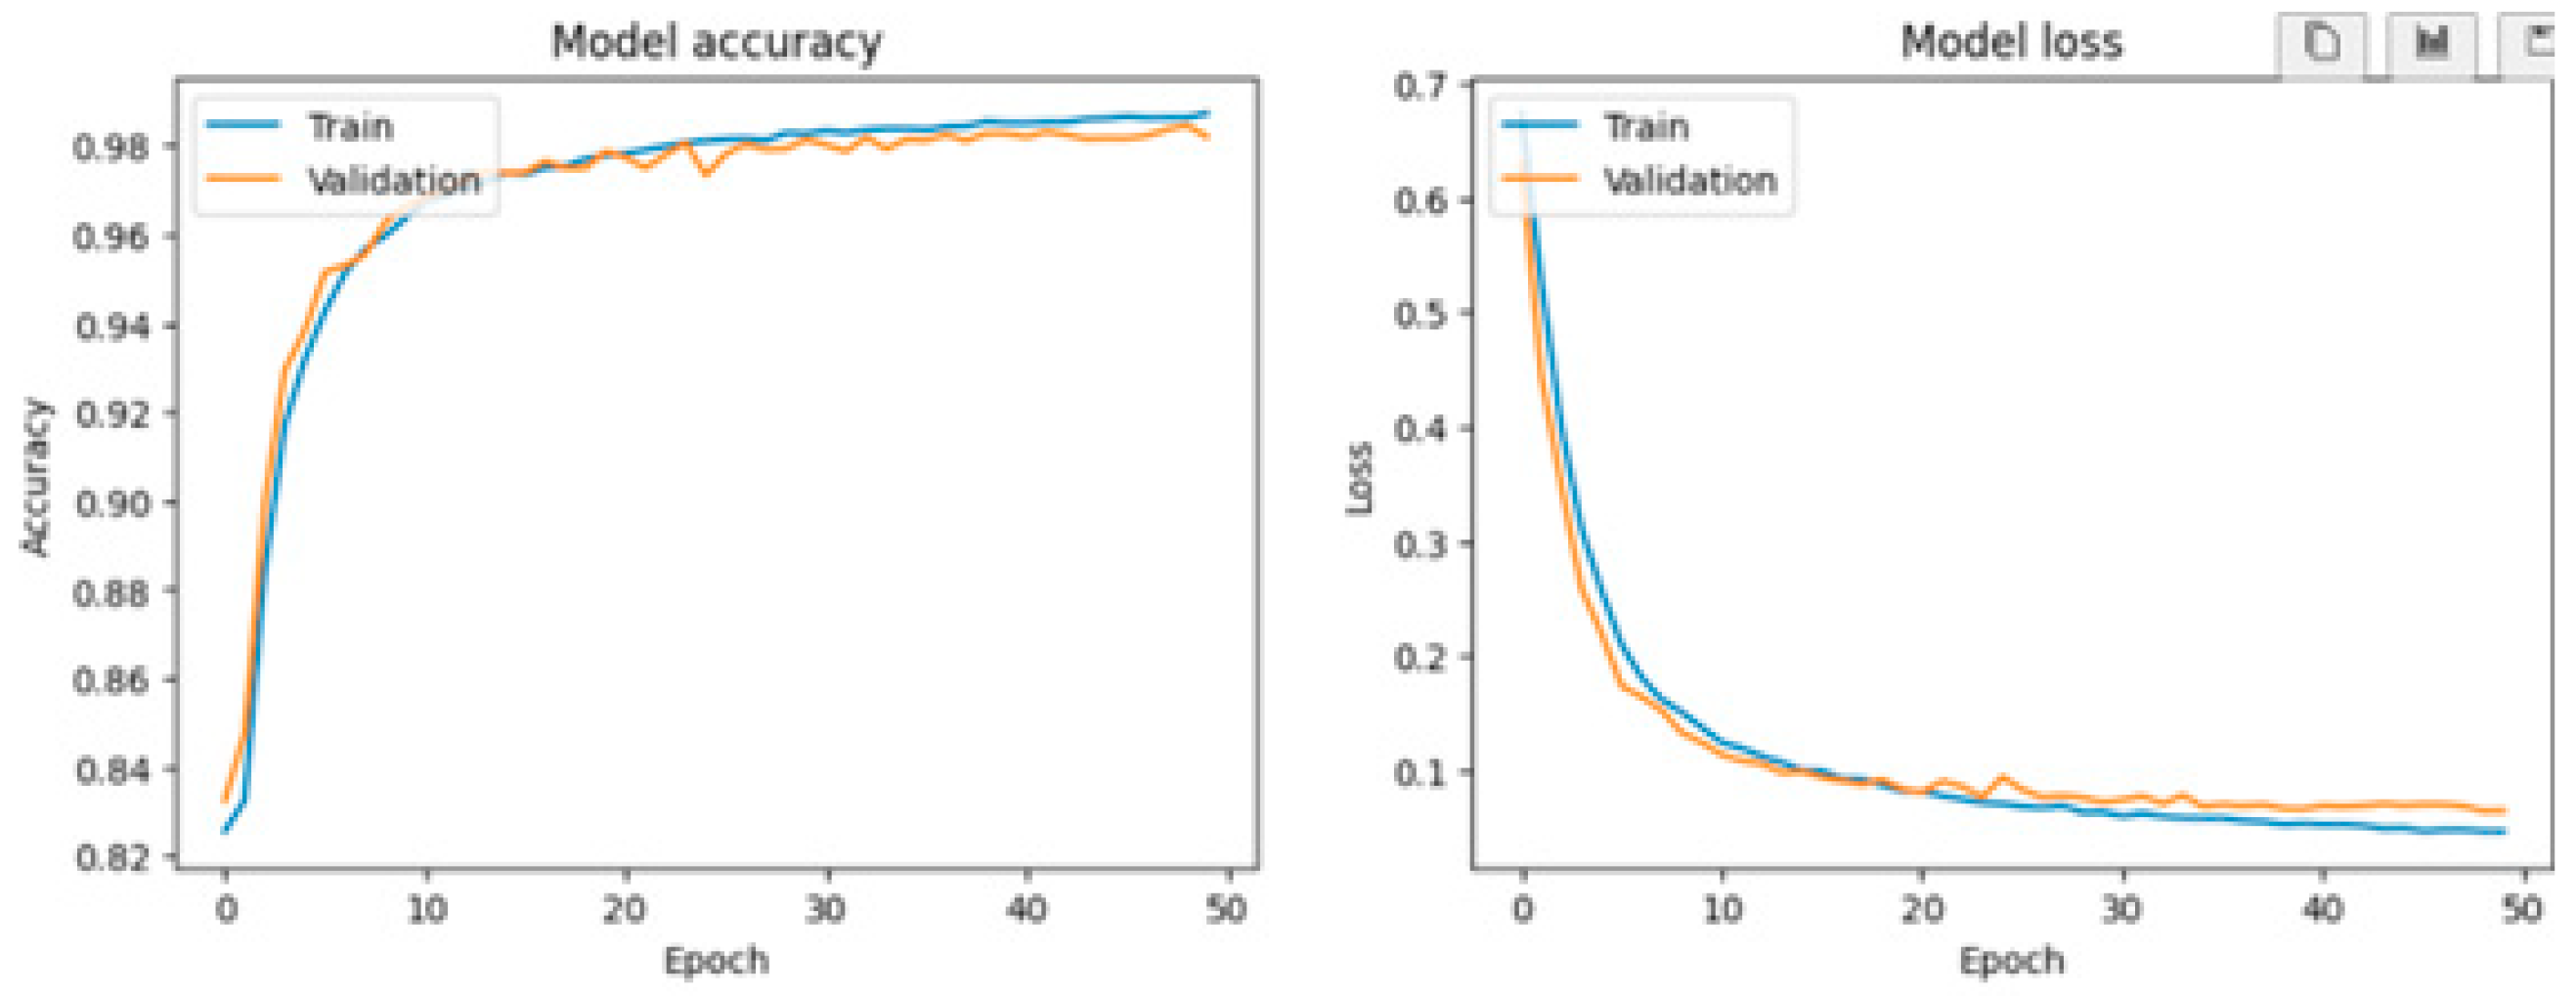
Figure 11.
Accuracy and loss for LSTM model.
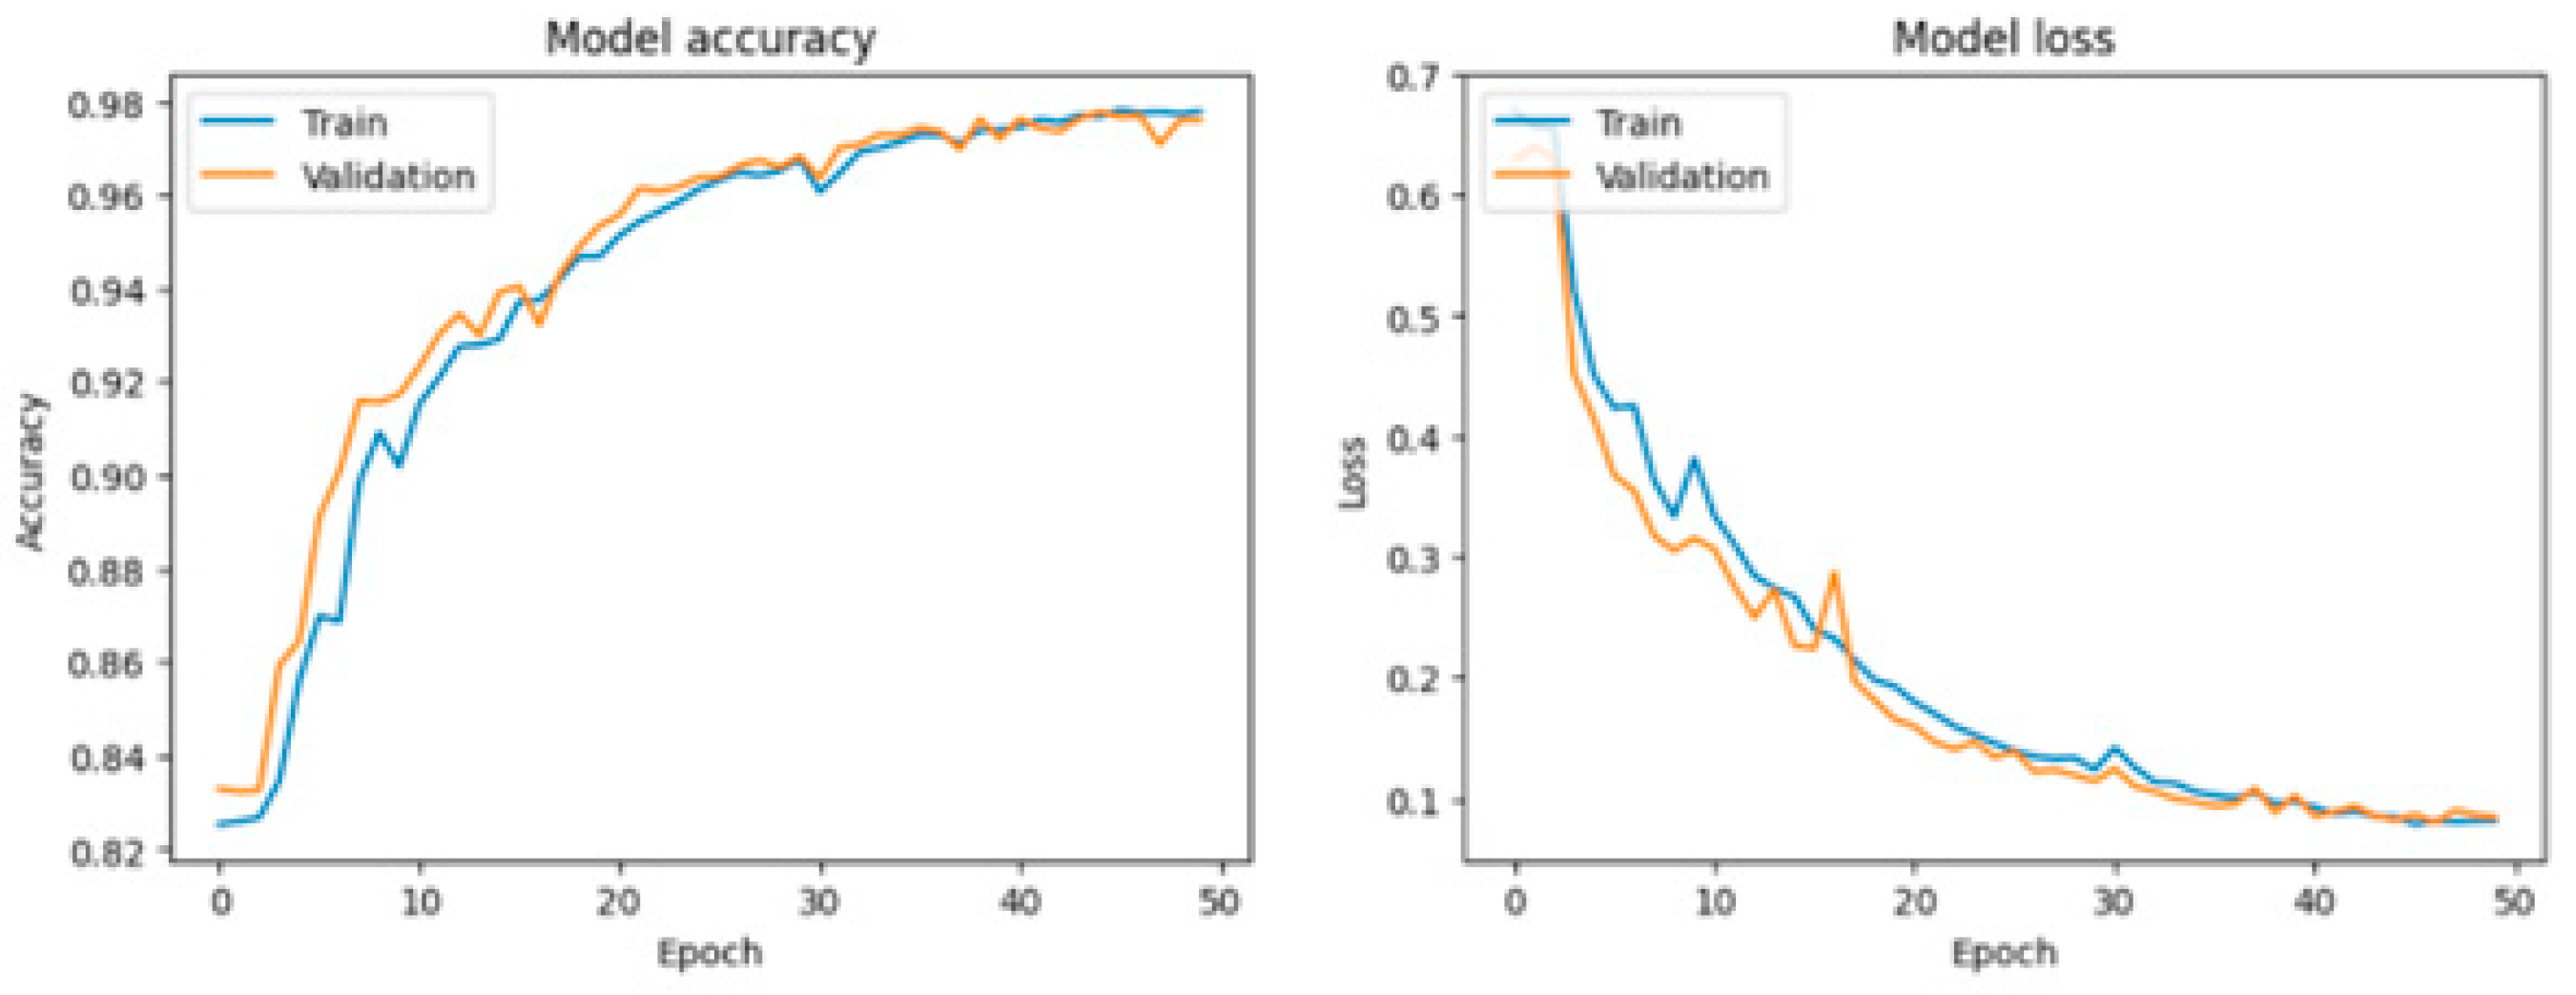

Table 1.
Related work.
| Study | Sensor Type | Health Focus | Techniques | Accuracy (%) | ||
|---|---|---|---|---|---|---|
| [14] | Smartphone Sensors | Activity Recognition | Random Forest | _ | ||
| [15] | Accelerometer, RSSI, Beacon Sensor | Activity monitoring | Android application | _ | ||
| [16] | Sensor pad | Fall detection | Mobile application | _ | ||
| [17] | Smart textile | Fall detection | SVM | _ | ||
| [18] | Wearable Smart Band Sensors | Sleep activity and Heart rate monitoring | Lasso regression, ANN, SVM, decision trees | _ | ||
| [19] | Smartwatch sensors, Smartphone sensors, | Activities Recognition | Random forests, SVM, logistic regression and K-Nearest Neighbors | - | ||
| [20] | Accelerometer, Body Temperature and Heartbeat | Fall Detection, Heart Rate | Mobile Application | _ | ||
| [21] | Motion detection sensor and humidity, ambient Temperature, CO2 | Movement detection | Random Forest | 68.08% | ||
| [22] | Smartphone sensors | Fall Detection | LSTM deep learning technique | 98.08% | ||
| [24] | Pulse sensor | Heart-rate | LSTM deep learning technique | 96.00% | ||
| [25] | Pulse Sensor | Heart Rate and Blood Oxygen monitoring | Mobile Application Random Forest |
99.00% | ||
| [26] | ECG, EMG Sensor, Galvanic Skin Response Sensor (GSR) |
eHealth |
Web Application |
- |
||
| [27] | Pulse Sensor, temperature and Accelerometer sensor | Temperature and Fall detection, Blood Pressure | Android Application | _ | ||
| [28] | Accelerometer Sensor and RFID sensor |
Activities Recognition | Smartphone application | _ | ||
Table 2.
Characteristics of the ECG signal.
| Wave Type | Heart Activity |
|---|---|
| Q wave | Initial phase of ventricular depolarization, reflecting the electrical activation of the interventricular septum |
| T wave | Ventricular repolarization, that is, the process of electrical recovery of heart cells after contraction. |
| U wave | The repolarization of the ventricles, typically following the T wave |
| PR interval |
Interval between the onset of depolarization of the atrium and that of the ventricle. |
| QRS complex | The QRS complex represents the depolarization of the ventricles. It consists of the Q, R, and S waves. |
| The ST segment | The portion of the ECG trace between the end of the QRS complex and the beginning of the T wave. |
| The QT interval | the interval between the onset of ventricular depolarization and the end of ventricular repolarization. |
| RR interval | The interval between the onset of depolarization of the atrium and that of the ventricle. |
Table 3.
Comparatif results.
Disclaimer/Publisher’s Note: The statements, opinions and data contained in all publications are solely those of the individual author(s) and contributor(s) and not of MDPI and/or the editor(s). MDPI and/or the editor(s) disclaim responsibility for any injury to people or property resulting from any ideas, methods, instructions or products referred to in the content. |
© 2024 by the authors. Licensee MDPI, Basel, Switzerland. This article is an open access article distributed under the terms and conditions of the Creative Commons Attribution (CC BY) license (http://creativecommons.org/licenses/by/4.0/).
Copyright: This open access article is published under a Creative Commons CC BY 4.0 license, which permit the free download, distribution, and reuse, provided that the author and preprint are cited in any reuse.