Preprint
Article

This version is not peer-reviewed.

Three Year Quantitative Study of Compassion Satisfaction and Fatigue Among Teachers and Educational Workers in Alberta, Canada

A peer-reviewed article of this preprint also exists.

Submitted:

20 December 2024

Posted:

24 December 2024

You are already at the latest version

Abstract

Although the psychological workplace hazards of compassion satisfaction and compassion fatigue are a known risk factor for mental and emotional health distress for caring professionals, the extent of these hazards has not been explored in Alberta, Canada. Understanding and tracking the experiences of compassion fatigue and satisfaction of teachers and other educational workers was the primary focus of this three-year, cross-sectional research study. Methods: Multimethod, longitudinal study from June 2020-May 2023. Data were collected at three different time points between 2020 and 2023 to explore the mental and emotional health of teachers and other educational workers, and the quantitative analysis of this data suggests that mental and emotional health distress is widespread and intensifying across Alberta. Findings: This paper discusses the extent of compassion fatigue and satisfaction across Alberta both at a general level and related to years of experience in the education field. Data analysis suggests worsening workplace wellbeing over time in both number and intensity, across gender and job role. Discussion: This article provides further evidence of the deepening crisis in education and contains some suggestions for policymakers, teacher educators, and system decision-makers invested in improving workplace well-being in educational settings.

Keywords: 
;  ;  ;  ;  ;  
Subject: 
Social Sciences  -   Education

1. Three Year Quantitative Study of Compassion Satisfaction and Fatigue Among Teachers and Educational Workers in Alberta, Canada

The onset of the COVID-19 pandemic in 2020 highlighted the importance of public education as a key pillar supporting Canadian society. Parents, guardians, and other caregivers scrambled to find alternative childcare and child-minding services when schools alternated between being open and closed to in-person learning. While the period of full school closures was relatively short in many Canadian provinces, the disruption to the expected operation of schools was keenly felt across the country from March 2020 onwards (Cardinal, 2020; Duffin, 2022; Whitely et al., 2021).
During the acute pandemic period (March 2020-June 2022), many provincial governments in Canada prioritized in-person instruction, albeit highly structured, and included several critical health measures to ensure that the economy would keep moving such as masking, extra cleaning, and social distancing (Duffin, 2022). Teachers and other educational workers, understanding their role as critical to the functioning of the Canadian economy and society, willingly provided both virtual and in-person instruction as directed (ATA Research, 2020), sidelining their concerns about their own health and well-being for the good of children and youth in schools (Cardinal, 2020), with gendered caregiving work creating an extra layer of accountability (Smith & Thompson, 2022).
Initially, educational workers were lauded for prioritizing schooling (Karchut, 2021; Sophinos, 2021), however, the period of appreciation for teachers and other educational workers appeared short-lived, and by 2024, several teacher unions began calling for and enacting job action to resolve longstanding concerns regarding class size, complexity, and curriculum (CBC News, 2023; French, 2023; Prisciak, 2024). The social contract to support children and youth through this difficult period brokered between governments and educational workers appeared broken. However, the problems of under-resourcing, chronic stress for educational workers, and complex, over-sized classes of students plaguing the effectiveness of schools and efficacy of educational workers far pre-dated the COVID-19 pandemic (OECD, 2005; Robertson, 2024).
Chronic underfunding of education by provincial governments beginning in the 1990s (Davidson-Harden et al., 2008) had led to unmaintained schools, increasing numbers of children in each teacher’s class, and the erosion of working conditions for support staff, managers, transportation and maintenance personnel, and educational assistants. These challenges were having a negative impact on workers’ well-being across the education field prior to March 2020 (Viac & Fraser, 2020), so the pandemic stress and measures accelerated the effect of existing problems, creating the conditions for acute on chronic stress (Farmer, 1994; Gabrielli et al., 2013).
In late 2019, a two-year research study (Kendrick, 2022) was designed to explore whether two known psychological workplace hazards, namely compassion fatigue and burnout, were impacting the emotional and mental health of Alberta’s educational workforce. The influence of the COVID-19 pandemic was not the aim of this initial study nor of the current data analysis. While the data collected during this study reflects the disruption caused by this global health crisis, qualitative data collected suggested that the well-being and career longevity of adults working in the education field were already at risk in Alberta prior to March 2020 (Bennett, 2020; Viac & Fraser, 2020).
Data from the first study were collected in the Years 2020 and 2021, then used to support a new project in mid-2022, allowing for a third data collection point in 2023. Given the three data point collection points, a multi-year quantitative analysis of the data aimed to understand the following two research questions:
  • To what extent are compassion fatigue and compassion satisfaction felt by educational workers and teachers between the years 2020-2023?
  • To what extent does job role and years of experience in that job role influence compassion fatigue and compassion satisfaction in teachers and other educational workers in Alberta, Canada?
This article will describe the overall well-being of educational workers in Alberta, Canada over the period of data collection (2020-2023), suggesting that implementing interventions to improve their occupational well-being will be a critical point of concern for decision-makers concerned with maintaining a healthy and productive workforce. The findings from this research study can also inform other jurisdictions facing teacher distress or shortages.

2. Research Study Context and Psychological Safety in Educational Workplaces

Alberta is one of the ten provinces and three territories in Canada with a strong resource and energy sector and is seen as a highly appealing location to live and work. In general, salaries are higher, and the average age of the provincial population is lower than the rest of Canada (Statistics Canada, 2024). Between 2020 and 2024, Alberta has experienced a population boom, with over 40,000 new people immigrating into the province, outpacing net migration nationally by over one percentage point (Alberta Government, 2024a).
Despite this population boom, Alberta consistently ranks as the lowest funder of public education in Canada, falling to the bottom in 2024 (Fortner, 2024; Statistics Canada, 2024b). While funding is only one indicator of school effectiveness, consistent under-resourcing of public education results in over-crowded classrooms (Bennett, 2020; Viac & Fraser, 2020), reduced supports and resources for special education and inclusion (Murphy Fries, 2007; Woodcock & Woolfson, 2019), and increased moral distress for educational workers as they work harder to ensure students reach the target learning outcomes (Stelmach et al., 2021).
Adding to the context, a shortage of trained educational workers in Alberta has been predicted for the current time period since the late 1990s (Press & Lawton, 1999) as members of the Baby Boom Generation began to retire. Although post-secondary institutions have been preparing and graduating new educational workers to fill this forecasted gap, the perceived high stress and low pay of the education profession has resulted in more early career educators leaving the field for other opportunities at an increased rate (Nguyen et al., 2019), and the stressful pandemic years have prompted late career educators to retire early or ‘right on time’ rather than staying in the field past retirement as has been the practice of earlier generations (Robinson, 2024; RAND survey, 2021).
The combined effect of early career educators choosing other professions, late career educators retiring early, chronic under-resourcing of public schools, and the additional caregiving and health care responsibilities through the pandemic years appear to have collided negatively on the overall wellbeing of Alberta’s educational workforce.

3. Compassion Fatigue, Burnout, and Finding a Better Way Forward

Beginning in the 1990s, the psychological hazards for professionals who provided frontline mental and emotional health interventions as a part of their regular workday has been studied widely. Charles Figley (1995, 2001) described one of the major psychological workplace hazards for people providing crisis and trauma work to their clients as secondary traumatic stress (compassion stress) and secondary traumatic stress disorder (compassion fatigue). Other researchers have suggested that this form of vicarious trauma could result in a wide variety of somatic and psychological symptoms that could reduce a workers’ ability to effectively work compassionately with their clients (Coetzee & Laschinger, 2017; Ludick & Figley, 2017; Rauvola et al., 2019).
Studying the influence of compassion stress and compassion fatigue on educational workers is more recent (Oberg et al., 2023) as an assumption had been that educational workers do not provide crisis or trauma work because there are other professionals who should be doing that work on their behalf (Dubois & Mistretta, 2018). However, hiring trained professional guidance counselors, school psychologists, and social workers has stagnated as school budgets have been reduced, resulting in more educational workers intervening in crisis or traumatic situations with students or colleagues without having the proper training thereby engaging in role overload (Mathieu, 2012, p.37).
Adding to overwork, school districts and government education departments have increased the amount of data reporting expected on and from students in Alberta over the past two decades (Servage & Couture, 2014). Having robust data to support improved literacy and numeracy because of integrating effective teaching and learning strategies is critical to ensuring a responsive and effective educational system (Mekhitarian, 2023). Knowing how students learn, what information is being retained, and ensuring that graduates of the public system are knowledgeable and can solve complex unforeseeable problems is the main purpose of the Alberta educational system (Alberta Education, 2024). However, educational workers have felt the consequences of the increased emphasis on data collection and reporting. Increased testing has been shown to take time away from relationship-building and developing safe and caring classroom and school environments, one of the key preconditions for quality teaching in Alberta (Servage & Couture, 2014).
The increased workload created by formal assessments and taking on work roles not meant for educational workers could result in burnout (Maslach & Leiter, 2022). Burnout is a psychological work hazard characterized by physical and emotional exhaustion, cynicism and lack of acknowledgment, and depersonalization (Maslach & Leiter, 2016). For professionals engaged in caregiving work with children and youth, such as educational workers, the impact of depersonalization can have lifelong consequences. Children and youth in schools led by teachers, principals, and paraprofessionals who do not appear to care for their well-being will not flourish (Ancess et al., 2019; Cooper & Miness, 2014), so preventing and treating burnout needs to be a priority in educational settings.

4. Research Methodology and Design
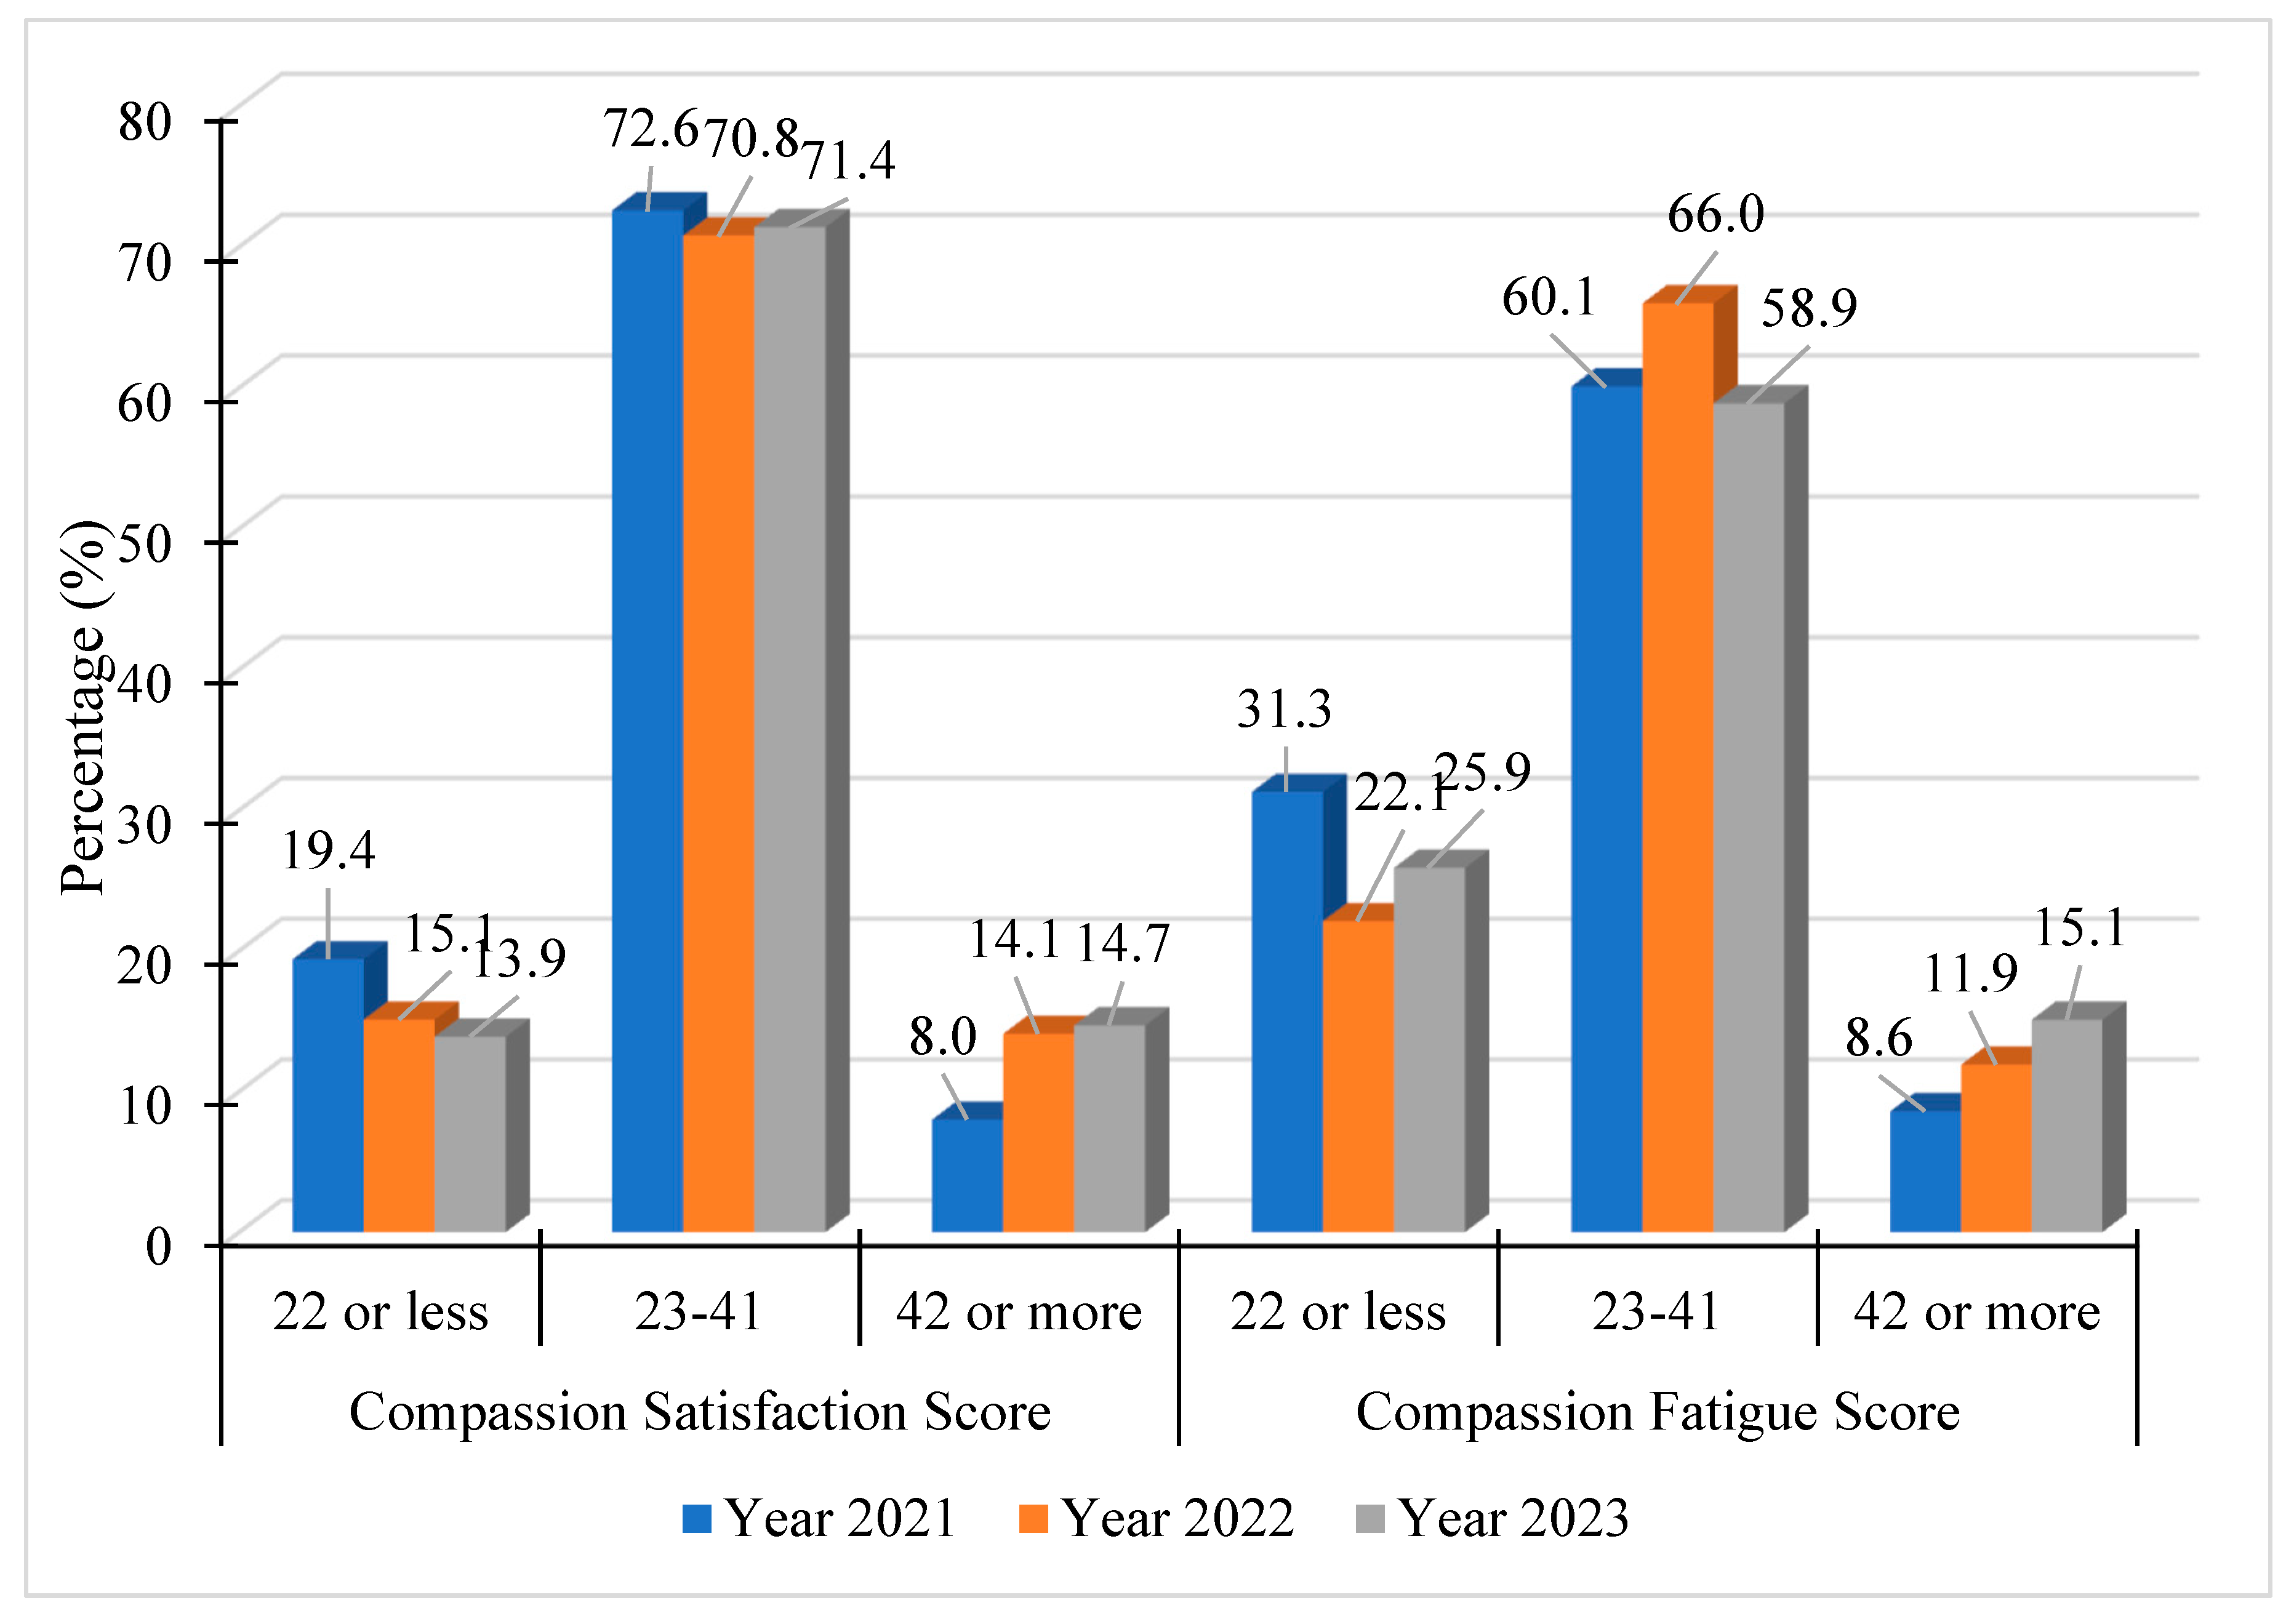
The purpose of this three-year quantitative study was to explore and track the trends of compassion satisfaction, compassion stress or fatigue, and burnout in Alberta’s educational workforce over time. The research design was exploratory mixed methods, with the main instrument being a survey with questions designed to collect both quantitative and qualitative data.
After receiving institutional ethics approval from the University of Calgary for secondary use of previously collected data and the collection of new data (REB#22-0650), the survey link was circulated to potential respondents through two research partners on the study, the Alberta Teachers Association (ATA) and the ASEBP (Alberta School Employee Benefits Plan). The ATA represents all certificated teaching professionals, including teachers and teacher leaders, from across Alberta. The ASEBP membership includes some certificated teachers, as well as educational assistants, support staff, and other non-teaching professional staff. These two organizations can reach a total population of approximately 60,000 educational workers from across Alberta.
The raw data was collected via the ATA Survey Alchemer account and was transferred via the platform to the research team’s account. Data were collected at three distinct time periods. The first data collection period was for three weeks ending in June 2020 (Year 1), the second collection point was for three weeks ending in January 2021 (Year 2), and the third collection point was for three weeks, ending May, 2023 (Year 3). The decision for these three time points was to determine if time of year had an impact on the results, as the first survey point, June, is considered a difficult and stressful time of the school year. The intent was to determine if the survey results would be different in a less stressful month (January). In the final analysis, the time of year of data collection did not appear to have an impact on the results.
The survey was hosted on Survey Alchemer and designed using the Professional Quality of Life (ProQOL Version 5) (Stamm, 2010) including five Likert-style options ranging from Always-Never, with fourteen statements to assess compassion satisfaction and thirteen statements related to compassion fatigue. The statements related to compassion satisfaction were scored a one for Always and a five for Never, and the statements related to compassion fatigue were scored a five for Always and a one for Never. As a result, a higher score meant higher levels of compassion fatigue and a lower score indicated a higher level of compassion satisfaction.
Once the survey respondent answered each of the statements, the Alchemer platform would calculate a numerical score for the respondent, and from this number, the respondent would self-select if their mental state aligned more closely with compassion satisfaction or compassion fatigue. The numerical score was recorded as a spreadsheet for download from the Survey Alchemer platform for further analysis by the research team.
To assess burnout, a checklist of common signs and symptoms based on the Maslach and Jackson Burnout scale (1984) was created with additional symptoms specific to teaching and learning added to the January 2021 checklist that emerged from the qualitative data analysis (Kendrick, 2021). Respondents were asked to select all the symptoms they were feeling in the past six months.
The numerical scores were then tabulated and cleaned by the research assistant and analyzed according to the below categories:
Compassion Satisfaction (CS)
Score Rating
22 or less High Levels of CS
23-41 Moderate Levels of CS
42 or more Low Levels of CS
Compassion Fatigue (CF)
Score Rating
22 or less Low Levels of CF
23-41 Moderate Levels (possible compassion stress)
42 or more High Levels of CF
The burnout checklist was kept in the form of a table to show the main symptoms felt by educational workers. The items in the burnout checklist included exhaustion, lack of energy, sleep disorders, reduced performance of work-related tasks, concentration problems, memory problems, inability to make decisions, reduced initiative, apathy or lack of commitment to helping students and colleagues, and reduced creativity.

5. Data Analysis for Three Years Period

For each survey period, data was organized by job role, year, and by rates of compassion satisfaction and compassion fatigue. The first analysis was completed on respondents who selected their job role as teacher (see Figure 1). The total number of teacher respondents over the three years was 4332, with 1515 responses collected in June 2020, 1584 total responses collected in January 2021, and 1214 responses collected in May, 2023. Overall, the data suggests declining trends in the mental health and well-being of teachers over the three-year period.
A noticeable trend in the data was a reduction in the number of respondents indicating high levels of compassion satisfaction, or the joy in caregiving (Stamm, 2010). This number declined from a high of 11.3% in Year 1 to a low of 6.3% in Year 3. Compassion fatigue, on the other hand, shows a marked increase in the number of respondents with high levels of compassion fatigue and lower numbers having little or no compassion stress or fatigue.
Over the three years, the data reveals a steady decrease in the percentage of teachers experiencing high compassion satisfaction, suggesting that between June 2020 and May 2023, fewer teachers were deriving a sense of positive fulfillment from their roles. On the contrary, the data shows an increasing trend in high compassion fatigue for teachers, moving from 13.6% of respondents having a calculated total in line with compassion fatigue in Year 1 to 22.7% reporting high compassion fatigue in Year 3.
Because of much smaller sample size numbers related to other roles held by educational workers, all other respondents were separated into a second group (see Figure 2). This group of workers includes a wide role disparity, as it includes people holding positions such as school leaders (such as principals or assistant principals), educational assistants, support staff (administrative assistants, finance managers, and school counselors), and district staff (superintendents and other managers).
The percentage of respondents in the moderate compassion satisfaction category remained relatively stable across the years, with some decrease in the number of educational workers expressing high levels of compassion satisfaction. In Year 1, 72.6% reported moderate levels, a slight drop to 70.8% in Year 2, and a small rise to 71.4% in Year 3 suggesting that the majority of respondents have consistently felt moderate levels of compassion satisfaction.
The data shows a noticeable increase in low compassion satisfaction from Year 1 to Year 2, moving from 8.0% to 14.1% that might reflect with increased disruption and difficult decision-making related to the COVID-19 pandemic between June 2020 and January 2021. This trend stabilized at the lower rate of compassion satisfaction into Year 3, at a rate of 14.7%.
In terms of compassion fatigue, between Year 1 to Year 3, the percentage of respondents reporting low compassion fatigue fluctuated. Starting at 31.3% of respondents with low compassion fatigue in Year 1, the score average dropped to 22.1% in Year 2 and then rose slightly to 25.9% in Year 3. The noticeable decrease from Year 1 to Year 2 suggests that fewer people felt low levels of compassion fatigue in the second year, but this trend partially reversed in Year 3.
For respondents in the moderate compassion fatigue category, the percentage was highest in Year 1 at 60.1%. There was an increase in Year 2 with 66.0% of the respondents reporting moderate levels of fatigue. However, in Year 3, this percentage decreased to 58.9%. This indicates that while more respondents felt moderate levels of compassion fatigue in Year 2 compared to Year 1, this trend reversed in Year 3.
The percentage of respondents experiencing high compassion fatigue has been steadily increasing across the years. From 8.6% in Year 1, the overall percentage of this group scoring the highest levels of compassion fatigue rose to 11.9% in Year 2 and further increased to 15.1% in Year 3. A closer look at the individuals completing the survey suggests that people in school leadership roles, specifically principals and assistant principals, may be driving this increased compassion fatigue. Further analysis is required to understand the experiences of school-based leaders with compassion fatigue.

6. Influence of Number of Years of Service on CS and CF Scores

The years of service were divided into 0-5 (early career), 5-10, 11-15, 16-20 (mid-career), and 21+ years (later career). Table 1 breaks down the number of respondents in each group.
Figure 3 illustrates the range of compassion satisfaction and compassion fatigue across the three years of data collection for both the teacher group and the administrators group.
The data in Figure 3 illustrates a comprehensive view of teachers' compassion satisfaction and fatigue over a three-year span from 2021 to 2023. Irrespective of their years of service, teachers consistently reported moderate levels of both compassion satisfaction and fatigue. In 2021, the average compassion satisfaction score was 31.31, while fatigue averaged 31.66. By 2022, satisfaction decreased with an average score of 33.94, with teachers having 11-15 years of experience scoring the highest, reflecting lower levels of compassion satisfaction. This trend persisted into 2023, with the compassion satisfaction average rising to 36.25. At the same time, compassion fatigue also showed an upward trend, moving from an average of 31.66 in 2021 to 34.76 in 2023. Notably, mid-career teachers with 11-15 years of experience reported the highest fatigue levels in the last two years of data collection.
The simultaneous rise of the average score in compassion satisfaction and compassion fatigue presents a paradox. The data suggests that educational workers may feel more fulfilled, however they are also emotionally drained. Further, the data suggests that mid-career teachers are feeling the symptoms of compassion fatigue more deeply than their colleagues.
Regarding the second group of respondents, labelled administrators, over the same three-year period, they displayed consistent moderate levels of compassion satisfaction across all experience levels. In 2021, satisfaction scores ranged from 28.45 for the most seasoned administrators (those with over 21 years of experience) to 30.44 for those with 6-10 years of experience. The overall average was 29.36, which increased to 31.69 by 2023. Compassion fatigue scores also exhibited noticeable patterns; in 2021, the fatigue score ranged from 27.08 (for the 6–10 years group) to 29.06 (for the 16-20 years group) with an average of 27.94, which rose to 30.05 by 2023. Similarly to the teacher respondents, the administrator respondents consistently found both satisfaction and emotional challenges related to their work roles.
Other comparisons among the groups do not show statistically significant differences at the 0.05 level, suggesting that the experiences of these educators in terms of compassion satisfaction and fatigue are relatively similar. While the ANOVA confirmed significant differences in the means among the groups, the post hoc tests pinpointed where these differences primarily exist. Educators with the most experience (21+ years) appear to be driving these significant differences. This analysis suggests that educators in their mid and late careers may have established positive coping skills but the experience of uncertainty during the COVID-19 pandemic was overwhelming their usual ability to cope.
Table 2. ANOVA Results on Teachers’ CS and CF Based on Experience.
Sum of Squares df Mean Square F Sig.
Teachers (Year 1) Compassion Satisfaction Between Groups 1289.31 4 322.33 4.93 <.001
Within Groups 99179.63 1517 65.38
Total 100468.93 1521
Compassion Fatigue Between Groups 1314.65 4 328.66 4.59 .001
Within Groups 108638.46 1517 71.61
Total 109953.11 1521
Teachers (Year 2) Compassion Satisfaction Between Groups 1274.30 4 318.57 3.93 .004
Within Groups 128212.14 1582 81.04
Total 129486.43 1586
Compassion Fatigue Between Groups 419.85 4 104.96 1.41 .227
Within Groups 117400.08 1582 74.21
Total 117819.93 1586
Teachers (Year 3) Compassion Satisfaction Between Groups 1339.194 4 334.799 3.522 .007
Within Groups 115601.618 1216 95.067
Total 116940.812 1220
Compassion Fatigue Between Groups 1632.082 4 408.021 4.460 .001
Within Groups 111250.160 1216 91.489
Total 112882.242 1220
Table 3. ANOVA Results on Administrators’ CS and CF Based on Experience.
Sum of Squares df Mean Square F Sig.
Administrators (Year 1) Compassion Satisfaction Between Groups 236.40 4 59.10 .94 .440
Within Groups 33436.95 532 62.85
Total 33673.35 536
Compassion Fatigue Between Groups 255.95 4 63.99 .80 .526
Within Groups 42619.03 532 80.11
Total 42874.97 536
Administrators (Year 2) Compassion Satisfaction Between Groups 2167.38 4 541.85 8.32 <.001
Within Groups 19998.69 307 65.14
Total 22166.07 311
Compassion Fatigue Between Groups 362.61 4 90.65 1.11 .351
Within Groups 25010.26 307 81.47
Total 25372.87 311
Administrators (Year 3) Compassion Satisfaction Between Groups 1110.25 4 277.56 3.72 .005
Within Groups 35589.07 477 74.61
Total 36699.32 481
Compassion Fatigue Between Groups 1812.90 4 453.23 4.71 <.001
Within Groups 45915.70 477 96.26
Total 47728.60 481
Based on the ANOVA results, there are significant differences in compassion satisfaction and compassion fatigue scores depending on the years of service in education. The Bonferroni post hoc test further identified specific groups where these differences were significant, as teachers with 21+ years of service showed a significant increase in compassion satisfaction when compared to the 6-10 years group, with a mean difference of 2.580 (p < 0.001).
Similarly, the 21+ years group also displayed a significantly higher compassion satisfaction than the 16-20 years group, showing a mean difference of 2.217 (p = 0.009). With regards to the compassion fatigue scores, the 21+ years group reported a significantly higher compassion fatigue score than the 6-10 years group, with a mean difference of 2.701 (p < 0.001) and the 21+ years group showed a significant increase in compassion fatigue compared to the 16-20 years group, with a mean difference of 2.000 (p = 0.044).
Specifically, teachers in their early career (0-5 years) tend to have lower compassion satisfaction but also less fatigue compared to those in the middle (11-15 years) and those with extensive experience (21+ years). Of particular note, teachers with 11-15 years of service seem to be a notable group, showing higher levels of both satisfaction and fatigue compared to other groups.
Of additional interest is whether or not gender identity played a role in the experiences of compassion satisfaction and compassion fatigue in the Alberta educational workforce. Table 4 shows the analysis of gender identity on these scores.

7. Compassion Satisfaction and Compassion Fatigue Based on Gender Identity

The results presented in Table 4 provide insight into the differences in compassion satisfaction and compassion fatigue scores among teachers and educational workers by their self-selected gender identity from the demographics section of the survey. The options provided were Male/Female/Transgender/Prefer Not to Say. An analysis of variance was conducted to investigate differences in compassion satisfaction scores among various gender identities. The initial assessment revealed significant heterogeneity in variances (p < .001). Consequently, Welch's ANOVA (Table 5) was employed.
The ANOVA results (F = 1.421, p = .224) indicate no significant differences in compassion satisfaction scores across gender groups, however in terms of compassion fatigue score, the ANOVA results (F = 9.098, p < .001) indicate significant differences in compassion fatigue scores among the gender groups. Multiple comparisons (Table 6) (Tukey HSD) test pinpointed the difference in terms of compassion fatigue score, we found that when comparing males with females, and males with transgender individuals, males tended to exhibit lower compassion fatigue scores in both comparisons.
These findings highlight the necessity for targeted interventions to address the disparities in compassion fatigue across different gender identities in addition to job role and the number of years of service. Specifically, the data suggests that female, mid-career teachers are at the greatest risk of compassion fatigue, requiring extra and targeted supports.

8. Three Year Analysis Related to Burnout

Survey respondents were also asked to check all the burnout symptoms that applied to them over the six months prior to completing the survey. The data collected each year was analyzed according to the number of years of service and work role. Table 7 illustrates the main burnout symptoms identified by teachers separated by years of experience. The analysis of the data categorizes the teacher respondents into five experience groups: 0-5 years, 6-10 years, 11-15 years, 16-20 years, and 21+ years. Across three years, they reported symptoms such as Exhaustion, Lack of Energy, Sleep Disorders, and Reduced Performance, among others.
A growing number of respondents across the three-year data collection period identified that they were moving into more severe symptoms of burnout pointing to an area of concern.

9. Burnout Data Insights by Years of Service

Across the teaching profession and at increasing rates over the three years, high levels of physical and emotional exhaustion were reported, with nuanced differences associated with the years of experience. Specifically, those teachers with 16-20 years of experience consistently reported higher sleep disorders across the three years. Early career teachers (0-5 years) phase and late career teachers (21+ years) often reported high exhaustion and lack of energy as their primary burnout symptoms.
The highest prevalence of exhaustion was among those with 16-20 years of experience (87.0%), whereas those with 21+ years of experience had the lowest (79.3%). In Year 2, The 0-5 years group saw a significant jump from the previous year, reaching 96.0%. By Year 3, The 0-5 years group saw a slight decrease, yet this symptom still remained high at 90.8%, while the 6-10 years group has a slight increase to 93.5%.
Almost every experience group reported a lack of energy, with the 6-10 years group at the top with 93.2%. The lack of energy consistently rated high through Year 2 and by Year 3, Nearly all groups have more than 90% of their members reporting a lack of energy, with the 0-5 years and 21+ years groups tied at 94.3%.
In terms of sleep disorders, in Year 1, notably, teachers with 16-20 years of experience suffered the most from sleep disorders (68.8%). By Year 2, the 21+ years group reported a dramatic increase in sleep disorders, leading at 73.6%, and in Year 3, the 21+ years group continued to lead in reporting sleep disorders, marking 64.4%.
Lastly, in Year 1, reduced performance of work-related tasks was least reported. In the second year, a declining trend in reduced performance is reported across most experience groups, with the 21+ years group at 50.7%. In the final year of data collection, this trend reversed, as the 6-10 years and 11-15 years respondents experienced higher levels of reduced performance, with 64.9% and 66.2% of respondents respectively selecting this symptom. Across years of data collection, teacher respondents selected a greater intensity of burnout symptoms, suggesting an intensification of workplace mental health distress.

10. Burnout Symptoms Over Three Years Among Administrators

Similarly, respondents within the administrator role group selected increased symptoms of burnout across the three-year study. The data in Table 8 presents a crosstabulation of burnout indicators across three data collection points, segmented by the number of years of service educators have in their current work role.
The administrator group also indicated high levels of exhaustion and lack of energy. In Year 1, the highest rate is found in the 11-15 years category (80.7%). Notably, the 21+ years group reported a relatively lower rate at 70.5%, with the second year, the 16-20 years group exhibits the highest exhaustion level at 92.7%. The 21+ years group shows a lower percentage in comparison with the other groups, at 79.3%. By the third data collection point, the mid-career administrators, selecting 11-15 years and 16-20 years of service, reported the highest exhaustion levels, both exceeding 88%.
In terms of lack of energy, in the first year, the highest rate is found in the 11-15 years category (80.7%) with the 21+ years group reported a relatively lower rate at 70.5%. In the second year, almost all groups report very high lack of energy with both 6-10 years and 21+ years groups leading with over 90%. In the final year of data collection, nearly all categories report high energy depletion, with those respondents having 6-10 years of service leading at 96.5%.
Sleep disorder persisted as a common symptom of burnout with the administrators group of respondents, as did reduced performance of work tasks. By Year 3, the 21+ years group had the highest percentage with 61.1% reporting sleep issues and the 11-15 years category has the most educators reporting reduced performance at 58.2%. Over half of all respondents in this category selected both having sleep disturbances and reduced work performance.
Also worth noting is that while burnout seems pervasive across all experience levels and job roles in Alberta’s educational workforce, the exact burnout symptoms and the intensity of that symptom vary. For instance, while exhaustion was high in the 11-15 years group in Year 3, they reported a relatively lower percentage for Reduced Imagination or Creativity. The experience and symptoms burnout does not manifest uniformly, and interventions might need to be tailored based on years of experience and job role.

11. Limitations

Given the time period that data were collected, the impact of the COVID-19 on the findings of this study needs acknowledgment. The qualitative data suggested that the respondents perceived the pandemic as having an intensifying effect on their mental and emotional health (Kendrick, 2022), however, a follow up study would be required to fully understand the influence of the pandemic on educational workers’ compassion fatigue and burnout scores as well as the persistence of these symptoms over a longer period of time.
Further, quantitative analysis cannot provide clear insights into the nuanced reasons for the differences of experiences between early, mid, and later career educational workers. Further study into the career-long factors that impact educational workers’ mental health would be useful.
The data was collected across one province in Canada, limiting the overall generalizability of these results. While a clear snapshot of the wellbeing of educational workers has been captured, further study comparing this group with other educational workers in different provinces and countries should be pursued.

12. Discussion and Conclusions

The data collected between 2020-2023 provides a comprehensive view of Albertan educational workers emotional states, specifically their compassion satisfaction, compassion fatigue and burnout. Irrespective of their years of service, educational workers consistently reported moderate levels of both satisfaction and fatigue, with respondents selecting intensifying levels of compassion fatigue and decreased levels of compassion satisfaction. In 2021, the compassion fatigue scores averaged 31.66 across the sample of the population, suggesting that educational workers were feeling compassion stress (Figley, 1995, 2002) at the time of the pandemic. This trend persisted into 2023, with the compassion fatigue scores average reaching 36.25, suggesting an intensification of compassion stress could overwhelm respondents usual coping strategies.
A nuanced analysis of the data suggested that female teachers with 11-15 years of experience reported the highest compassion fatigue levels in the last two years, suggesting an urgent need for targeted interventions to retain critical mid-career educators in the profession. The increasing trajectory for compassion fatigue suggests that educational policymakers, human resource managers, and government departments should investigate, resource, and implement strategies that ensure educational workers can return to a state of stability and resilience.
While the number of years in service influences compassion satisfaction and fatigue, the relationship is not linear or predictable. Educational workers in their mid-late stages of their career often displayed moderate levels of both compassion satisfaction and compassion fatigue suggesting an opportunity for targeted interventions that highlight compassion resilience (Ludick & Figley, 2017) to assist them with boosting their adaptive coping skills. However, only highlighting self-directed or individual interventions will not improve educational workers’ working conditions such as increasingly complex classrooms. Rather, solutions need to address the multiple levels of the educational system, and focus on improving workplace culture, resources for traumatized students and colleagues, and embedded professional learning to create physically and psychologically safe schools need to be implemented.
The data also revealed that across the three years of data collection, the most popular strategy used by respondents was to access their personal support network, comprised of family and friends followed closely by accessing in-person services such as massage, physiotherapy, or mental health therapy, however, only a little over 40% of respondents indicated using employer-supported benefits (Kendrick et al., 2024). Given the evidence of widespread mental distress, educational workers should be encouraged to access professional and evidence-based medical and psychological support to recover adequately. Further, developing interventions that can support mid-career teachers is an urgent need. The evidence strongly suggests that the educators required to provide mentorship and leadership across the profession are struggling and finding ways to understand and address their specific needs is an area of future inquiry.
Given the concerns about secondary traumatic stress and educators’ diminishing capacity with demonstrate compassion, a positive intervention might be specific training for educational worers to cultivate compassion and build compassionate educational organizations (Worline & Dutton, 2017). Compassion is a foundational human emotion that connects individuals through caring and supportive school culture and leadership, and focusing self-compassion can be a pathway to improved workplace well-being.
Regardless of a person’s role in the field of education or the number of years of service, the overall analysis of the data reveals that the workplace well-being of adults in the field of education in Alberta has declined from 2020-2023. Given these evident challenges, proactive interventions, support and resources, and training are essential to improve the well-being of educators and administrators.

References

  1. Alberta Government. (2024). Current provincial population estimates. https://www.alberta.ca/population-statistics.
  2. Alberta Education. (2024). Guide to education: Introduction. https://www.alberta.ca/education-guide-introduction.
  3. Ancess, J., Rogers, B., Duncan Grand, D., & Darling-Hammond, L. (2019). Teaching the Way Students Learn Best: Lessons from Bronxdale High School. In Learning Policy Institute. Learning Policy Institute.
  4. ATA Research. (2020, June). Alberta Teachers responding to coronavirus (COVID-19): Pandemic study research study initial report. Alberta Teachers Association. https://legacy.teachers.ab.ca/SiteCollectionDocuments/ATA/News%20and%20Info/Issues/COVID-19/Alberta%20Teachers%20Responding%20to%20Coronavirus%20(COVID-19)%20-%20ATA%20Pandemic%20Research%20Study%20(INITIAL%20REPORT)-ExSum.pdf.
  5. Bennett, Paul. W. (2020). The state of the system: a reality check on Canada’s schools. In The state of the system (1st ed.). McGill-Queen’s University Press. https://doi.org/10.2307/j.ctv15d7xr0Cardinal, Jacob. (2020/07/23/, 2020 Jul 23). Mixed COVID messages in Alberta leave parents and teachers concerned about schools reopening with inadequate supports. The Canadian Press. Canadian Press Enterprises Inc.
  6. CBC News. (2023, December 19). Striking teachers in Quebec consider switching jobs rather than continuing fight for change. https://www.cbc.ca/news/canada/montreal/strike-quebec-teachers-job-change-1.7063118.
  7. Coetzee, S. K., & Laschinger, H. K. S. (2018). Toward a comprehensive, theoretical model of compassion fatigue: An integrative literature review. Nursing & Health Sciences, 20(1), 4–15. [CrossRef]
  8. Cooper, K. S., & Miness, A. (2014). The Co-Creation of Caring Student-Teacher Relationships: Does Teacher Understanding Matter? The High School Journal, 97(4), 264–290. [CrossRef]
  9. Davidson-Harden, Adam, Kuehn, Larry, Schugurensky, Daniel, & Smaller, Harry. (2008). Neoliberalism and education in Canada. In ed. Dave Hill, The Rich World and the Impoverishment of education: Diminishing democracy, equity, and workers’ rights. Taylor and Francis Group. (pp. 51–73). [CrossRef]
  10. Dubois, Alison L. & Mistretta, Molly A. (2018). Overcoming burnout and compassion fatigue in schools. Routledge.
  11. Duffin, J. (2022). COVID-19: A History (1st ed., Vol. 1). McGill-Queen’s University Press. [CrossRef]
  12. Farmer, P. (2011). Haiti after the earthquake (A. M. Gardner, C. van der Hoof Holstein, & J. Mukherjee, Eds.; First edition.). PublicAffairs.
  13. Figley, C. R. (1995). Compassion fatigue: Toward a new understanding of the costs of caring. In B. H. Stamm (Ed.), Secondary traumatic stress: Self-care issues for clinicians, researchers, and educators (pp. 3–28). The Sidran Press.
  14. Figley, C.R. (2001). Compassion fatigue: Coping with secondary stress disorder in those who treat the traumatized. Routledge.
  15. Fortner, Cole. (2024, February 27). Alberta spends the least on public education among provinces: Stats Can. https://edmonton.citynews.ca/2024/02/27/alberta-public-education-spending-statscan/.
  16. French, Janet. (2023, December 22). Alberta teachers eyeing job action as local disagreements drag on for years. https://www.cbc.ca/news/canada/edmonton/alberta-teachers-eyeing-job-action-as-local-disagreements-drag-on-for-years-1.7066524.
  17. E Murphy Fries. (2007). B.C. Human Rights Tribunal Finds Underfunding Plus Program Cutbacks Equals Discrimination against Students with Severe Learning Disabilities. Education Law Journal, 17(1), 147-.
  18. Job-related stress threatens the teacher supply - RAND survey. (2021). In Mental Health Weekly Digest (pp. 37-). NewsRX LLC.
  19. Gabrielli, Joy, Gill, Meghan, Sanford Koester, Lynne, & Borntrager, Cameo. (2013). Psychological perspectives on ‘acute on chronic’ trauma in children: Implications of the 2010 earthquake in Haiti. Children & Society, 28 (6), 438-450. [CrossRef]
  20. Maslach, Christina & Leiter, Micheal P. (2022). The burnout challenge: Managing people’s relationships with their jobs. Harvard: Cambridge, Massachusetts.
  21. Maslach, C., & Leiter, M. P. (2016). Understanding the burnout experience: recent research and its implications for psychiatry. World Psychiatry, 15(2), 103–111. [CrossRef]
  22. Mekhitarian, S. (2023). Introduction. In Harnessing Formative Data for K-12 Leaders (1st ed., pp. 3–13). Routledge. [CrossRef]
  23. Karchut, Paul. (2021, January 28). Everyday COVID heroes recognized in their community. https://www.cbc.ca/news/canada/calgary/filipino-covid-heroes-winston-gaqui-rinna-lamano-rosman-valencia-1.5888878.
  24. Kendrick, A.H. (2022). Compassion fatigue, burnout, and the emotional labor of educational workers. The International Journal of Health, Wellness and Society, 13 (1). 31-55. DOI:10.18848/2156-8960/CGP/v13i01/31-55.
  25. Kendrick, A.H. (2021). Compassion fatigue, emotional labour and educator burnout: Research Study: Phase 2 Report: Analysis of the interview data. Alberta Teachers Association. https://legacy.teachers.ab.ca/SiteCollectionDocuments/ATA/Publications/Research/COOR-101-30-2%20Compassion%20Fatigue-P2-%202021%2006%2018-web.pdf.
  26. Kendrick, A. H., Tay, M. K., Everitt, L., Pagaling, R., & Russell-Mayhew, S. (2024). A Longitudinal Multi-Method Inquiry of Educational Workers’ Use of Interventions for Positive Mental Wellbeing. Healthcare, 12(22), 2200. [CrossRef]
  27. Ludick, M., & Figley, C. R. (2017). Toward a mechanism for secondary trauma induction and reduction: Reimagining a theory of secondary traumatic stress. Traumatology, 23(1), 112–123. https://doi-org.ezproxy.lib.ucalgary.ca/10.1037/trm0000096.
  28. Maslach, C., & Leiter, M. P. (2016). Understanding the burnout experience: recent research and its implications for psychiatry. World Psychiatry, 15(2), 103–111. [CrossRef]
  29. Mathieu, Francoise. (2012). The compassion fatigue workbook. Routledge.
  30. Nguyen, Tuan D., Lam Pham, Matthew Springer, and Michael Crouch. (2019). The Factors of Teacher Attrition and Retention: An Updated and Expanded Meta-Analysis of the Literature. (EdWorkingPaper: 19-149). [CrossRef]
  31. Oberg, G., Carroll, A., & Macmahon, S. (2023). Compassion fatigue and secondary traumatic stress in teachers: How they contribute to burnout and how they are related to trauma-awareness. Frontiers in Education (Lausanne), 8. [CrossRef]
  32. OECD (2005), Teachers Matter: Attracting, Developing and Retaining Effective Teachers, Education and Training Policy, OECD Publishing, Paris, . [CrossRef]
  33. Press, Harold & Lawton, Stephen. (1999). The changing teacher labour market in Canada: Patterns and conditions. The Alberta Journal of Educational Research, 45 (2). 154-169. https://core.ac.uk/download/pdf/236133483.pdf.
  34. Prisciak, David. (2024, May 9). Here’s a complete timeline of the Saskatchewan teachers labour dispute. https://regina.ctvnews.ca/here-s-a-complete-timeline-of-the-saskatchewan-teachers-labour-dispute-1.6879578.
  35. Rauvola, Rachel. S., Vega, Dulce. M., & Lavigne, Kristi. N. (2019). Compassion Fatigue, Secondary Traumatic Stress, and Vicarious Traumatization: a Qualitative Review and Research Agenda. Occupational Health Science, 3(3), 297–336. [CrossRef]
  36. Robertson, Ricky. (2024). The other teachers : A guide to psychological safety among educators. Corwin: Thousand Oaks, California.
  37. Robinson, Kyle. (2024). Where’s My Teacher? Factors Influencing Teacher Retention/Attrition in a Post-COVID Landscape. CGU Theses & Dissertations, 798. https://scholarship.claremont.edu/cgu_etd/798.
  38. Servage, L., & Couture, J.-C. (2014). A week in the life of Alberta school leaders. The Alberta Teachers’ Association, Council for School Leadership.
  39. Sophinos, Luke. (2021, August 13). Educators: The forgotten heroes of the Covid-19 pandemic. Forbes. https://www.forbes.com/sites/forbestechcouncil/2021/08/13/educators-the-forgotten-heroes-of-the-covid-19-pandemic/.
  40. Stamm, Beth H. (2010). 2010: The concise ProQOL manual. https://proqol.org/proqol-manual.
  41. Statistics Canada. (2024a, February 21). Annual demographic estimates: Canada, provinces and Territories, 2023. https://www150.statcan.gc.ca/n1/pub/91-215-x/91-215-x2023002-eng.htm.
  42. Statistics Canada. (2024b, February 20). Public and private spending on elementary and secondary schools 2021/2022. https://www150.statcan.gc.ca/n1/daily-quotidien/240220/dq240220c-eng.htm.
  43. Stelmach, Bonnie., Smith, Lee., & O’Connor, Barbara-. (2021). Moral distress among school leaders: an Alberta, Canada study with global implications. International Journal of Leadership in Education, 1–23. [CrossRef]
  44. Smith, Julia & Thompson, Stevie. (2022). COVID-19, caregiving and careers of Alberta teachers and school leaders: A qualitative study. Alberta Teachers Association. https://teachers.ab.ca/sites/default/files/2023-05/COOR-101-37_COVIDCaregiversCareersRepor_%202022-01.pdf.
  45. Jess Whitley, Miriam H. Beauchamp, and Curtis Brown. 2021. The impact of COVID-19 on the learning and achievement of vulnerable Canadian children and youth. FACETS. 6(): 1693-1713. [CrossRef]
  46. Woodcock, Stuart & Woolfson, Lisa M. (2019). Are leaders leading with way with inclusion? Teachers’ perceptions of systemic support and barriers towards inclusion. International Journal of Educational Research, 93. 232-242. [CrossRef]
  47. Worline, Monica & Dutton, Jane. (2017). Awakening compassion at work. Berrett-Koehler Publishers Inc.
  48. Viac, C. and P. Fraser (2020), "Teachers’ well-being: A framework for data collection and analysis", OECD Education Working Papers, No. 213, OECD Publishing, Paris, . [CrossRef]
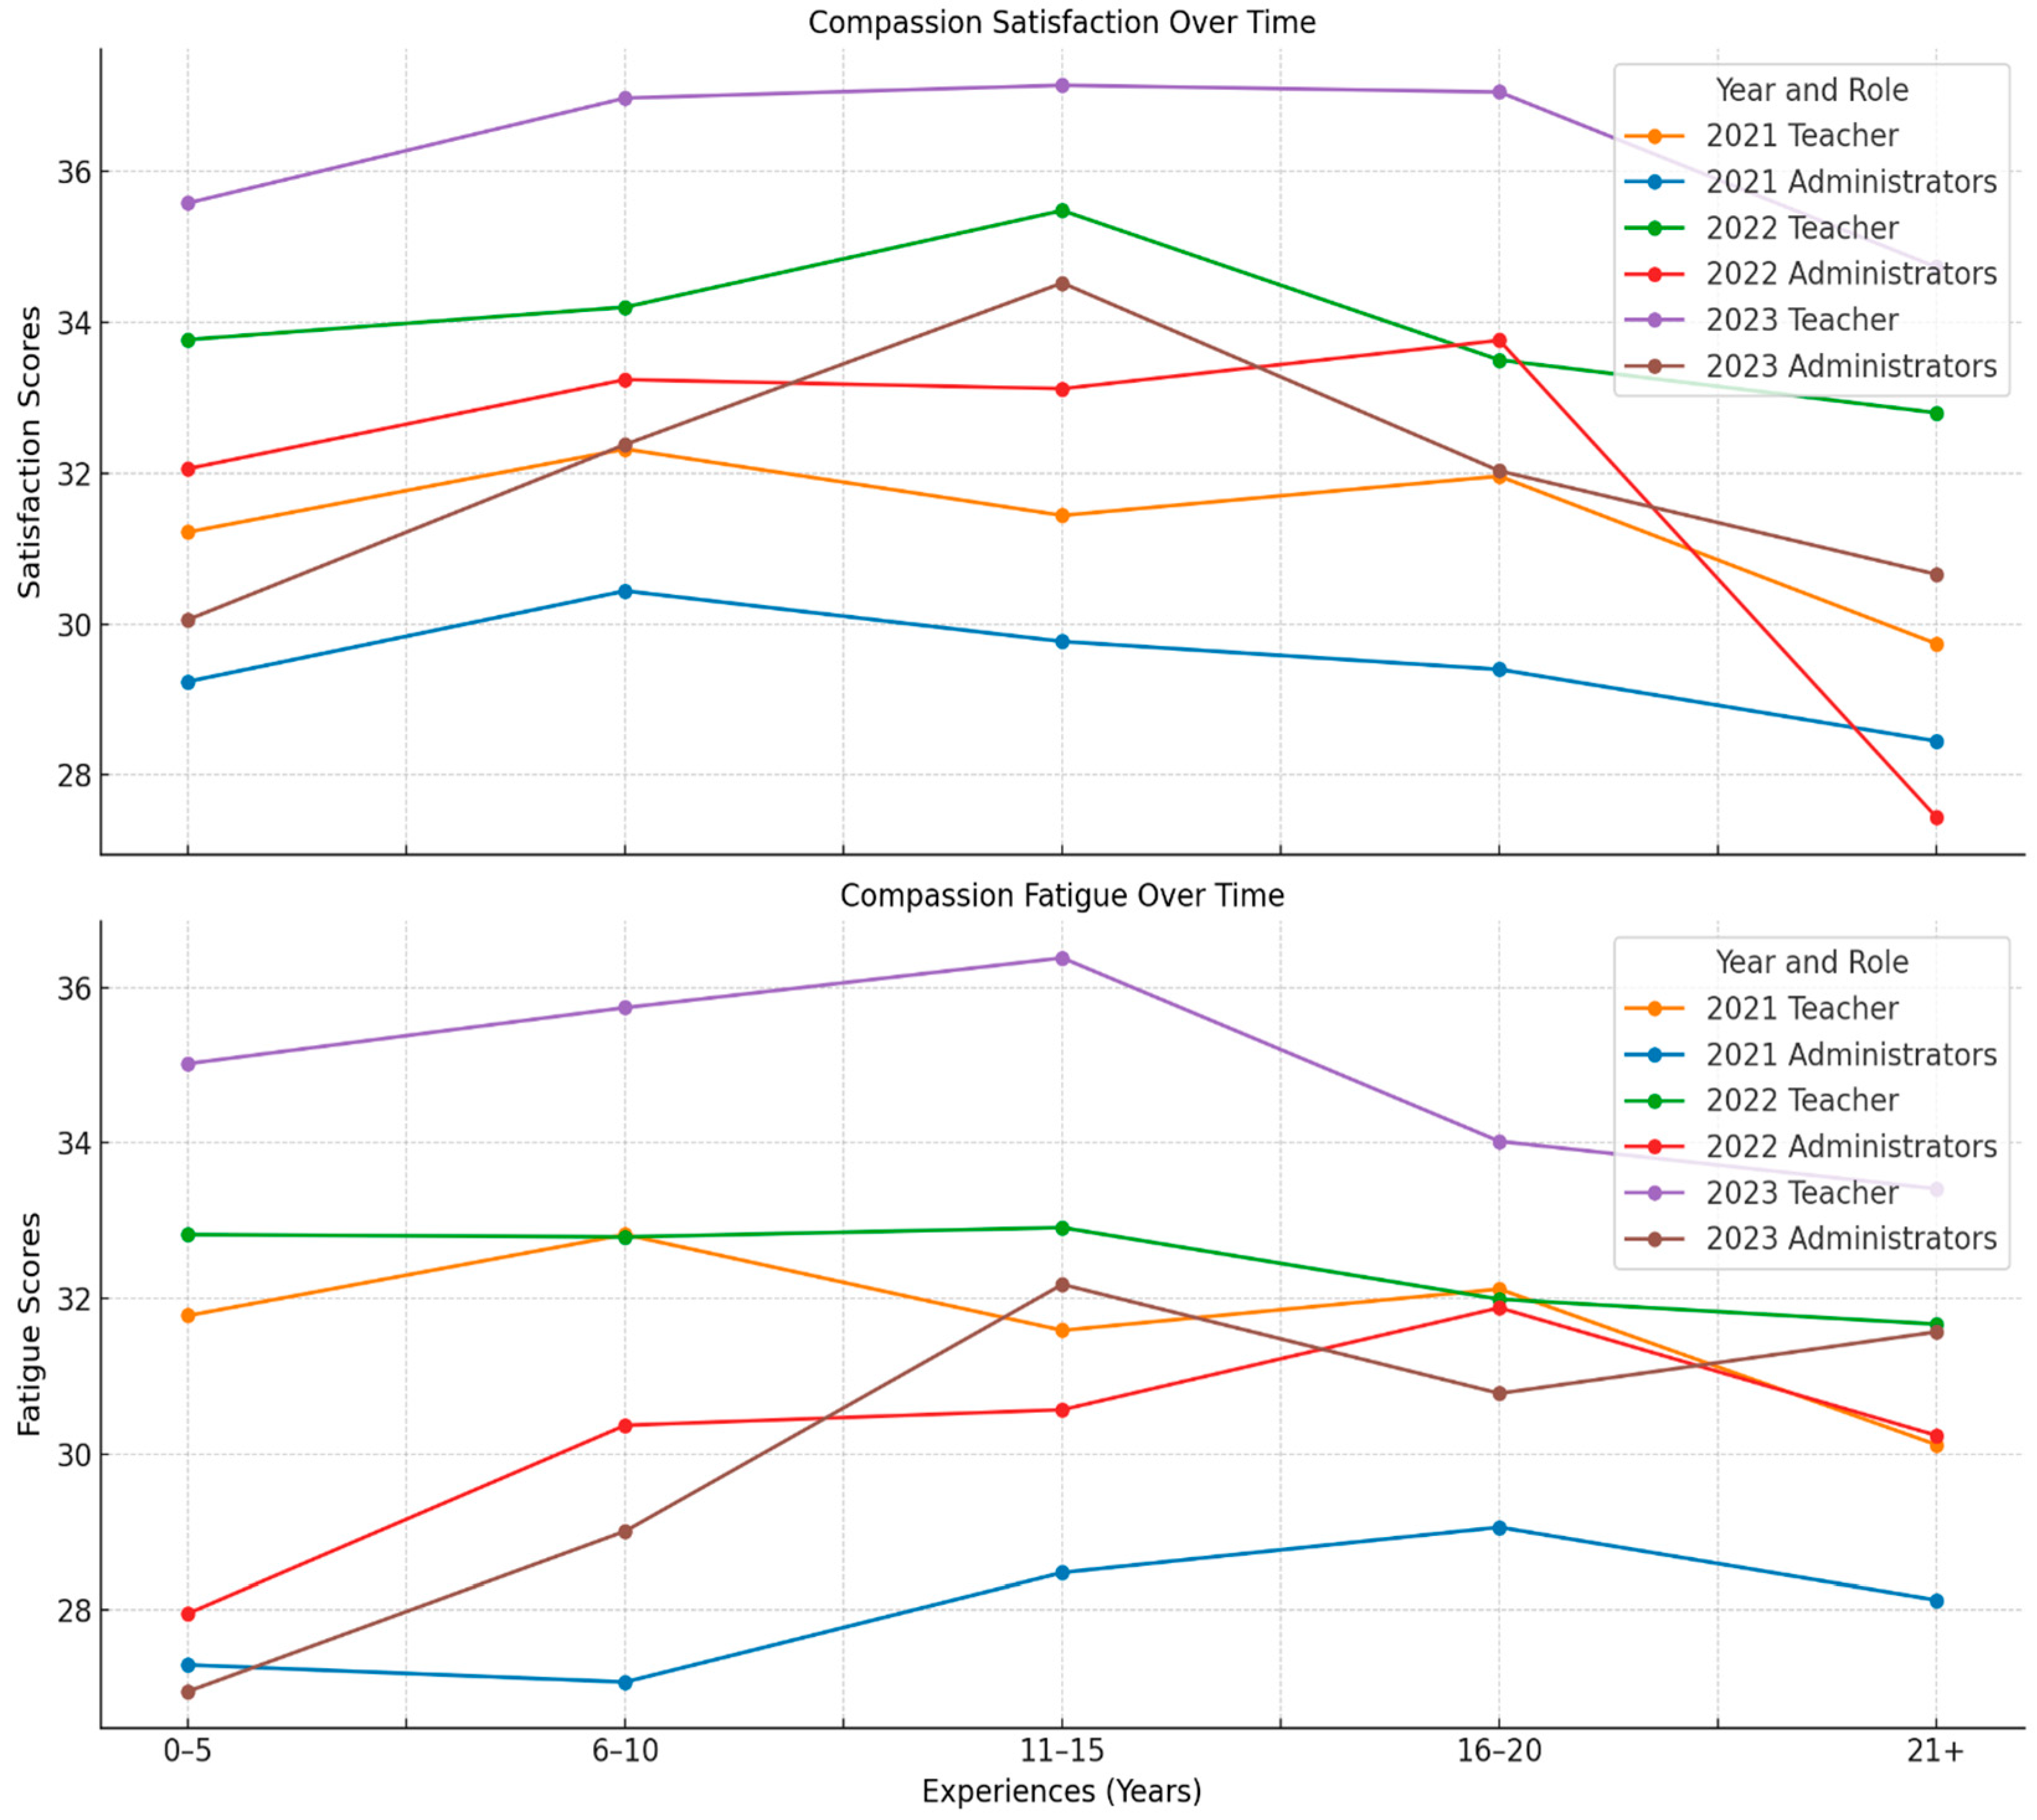
Figure 1. Compassion Satisfaction and Fatigue Among Teachers (N = 4332). Note: Compassion Satisfaction 22 or less = High; 23-41 = Moderate; 42 or more = low. Compassion Fatigue: 22 or less = Low; 23-41 = Moderate (stress); 41+ = High.
Preprints 143656 g001
Figure 2. Compassion Satisfaction and Fatigue Among All Other Educational Workers (N = 1331) Note: Compassion Satisfaction: 22 or less = High; 23-41 = Moderate; 42 or more = Low Compassion Stress/Fatigue: 22 or less = Low; 23-41 = Moderate; 42 or more = High.
Preprints 143656 g002
Figure 3. Teachers’ and Educational Workers’ Compassion Satisfaction and Compassion Fatigue Based on Teaching Experience Across Three Years Span. Note: Teachers (N = 4330); Administrators (N = 1331); Compassion Satisfaction: 22 or less = High, 23-41 = Moderate, 42+ = Low; Compassion Fatigue: 22 or less = Low; 23-41 = Moderate; 42 or more = High.
Preprints 143656 g003
Table 1. Teachers’ and Administrators’ Compassion Satisfaction and Compassion Fatigue Based on Teaching Experience Across Three Years Span.
Character of Compassion Experiences (Years) Teachers (N = 4330) Administrators (N = 1331)
N Mean Interpretation N Mean Interpretation
Compassion Satisfaction (Year 1) 0–5 304 31.22 Moderate 139 29.24 Moderate
6–10 339 32.32 Moderate 90 30.44 Moderate
11–15 285 31.44 Moderate 92 29.77 Moderate
16–20 258 31.96 Moderate 80 29.40 Moderate
21+ 336 29.74 Moderate 136 28.45 Moderate
Total 1522 31.31 Moderate 537 29.36 Moderate
Compassion Satisfaction
(Year 2)
0–5 323 33.77 Moderate 47 32.06 Moderate
6–10 349 34.20 Moderate 62 33.24 Moderate
11–15 310 35.48 Moderate 65 33.12 Moderate
16–20 255 33.50 Moderate 41 33.76 Moderate
21+ 350 32.80 Moderate 97 27.44 Moderate
Total 1587 33.94 Moderate 312 31.30 Moderate
Compassion Satisfaction
(Year 3)
0–5 120 35.58 Moderate 106 30.06 Moderate
6–10 262 36.97 Moderate 91 32.38 Moderate
11–15 229 37.14 Moderate 79 34.52 Moderate
16–20 265 37.05 Moderate 72 32.03 Moderate
21+ 345 34.73 Moderate 134 30.66 Moderate
Total 1221 36.25 Moderate 482 31.69 Moderate


Compassion Fatigue
(Year 1)
0–5 304 31.78 Moderate 139 27.30 Moderate
6–10 339 32.82 Moderate 90 27.08 Moderate
11–15 285 31.59 Moderate 92 28.48 Moderate
16–20 258 32.12 Moderate 80 29.06 Moderate
21+ 336 30.12 Moderate 136 28.13 Moderate
Total 1522 31.66 Moderate 537 27.94 Moderate
Compassion Fatigue
(Year 2)
0–5 323 32.82 Moderate 47 27.96 Moderate
6–10 349 32.79 Moderate 62 30.37 Moderate
11–15 310 32.91 Moderate 65 30.57 Moderate
16–20 255 31.99 Moderate 41 31.88 Moderate
21+ 350 31.67 Moderate 97 30.24 Moderate
Total 1587 32.44 Moderate 312 30.21 Moderate
Compassion Fatigue
(Year 3)
0–5 120 35.02 Moderate 106 26.96 Moderate
6–10 262 35.74 Moderate 91 29.01 Moderate
11–15 229 36.38 Moderate 79 32.18 Moderate
16–20 265 34.02 Moderate 72 30.78 Moderate
21+ 345 33.41 Moderate 134 31.57 Moderate
Total 1221 34.76 Moderate 482 30.05 Moderate
Table 4. Compassion Satisfaction and Compassion Fatigue Scores by Gender.
Gender Identity Compassion Satisfaction Mean Score Compassion Fatigue Mean Score
Male 33.16 30.34
Female 32.91 32.21
Transgender 37.86 41.00
Prefer not to answer 31.77 32.62
Not listed 36.92 35.54
Overall 32.95 31.98
Table 5. ANOVA for Compassion Satisfaction Score among gender groups.
ANOVA
Compassion Satisfaction Score
Sum of Squares df Mean Square F Sig.
Between Groups 467.905 4 116.976 1.421 .224
Within Groups 464980.324 5650 82.297
Total 465448.229 5654
Table 6. Comparisons of compassion fatigue among gender groups.
Multiple Comparisons
Dependent Variable: Compassion Fatigue Score
Tukey HSD
(I) How do you identify? (J) How do you identify? Mean Difference (I-J) Std. Error Sig. 95% Confidence Interval
Lower Bound Upper Bound
Male Female -1.863* .356 <.001 -2.83 -.89
Transgender -10.655* 3.480 .019 -20.15 -1.16
Prefer not to answer -2.271 1.504 .556 -6.38 1.83
Not listed -5.194 2.563 .253 -12.19 1.80
Female Male 1.863* .356 <.001 .89 2.83
Transgender -8.792 3.467 .083 -18.25 .67
Prefer not to answer -.408 1.474 .999 -4.43 3.61
Not listed -3.331 2.545 .686 -10.28 3.61
Transgender Male 10.655* 3.480 .019 1.16 20.15
Female 8.792 3.467 .083 -.67 18.25
Prefer not to answer 8.385 3.762 .169 -1.88 18.65
Not listed 5.462 4.297 .709 -6.26 17.19
Prefer not to answer Male 2.271 1.504 .556 -1.83 6.38
Female .408 1.474 .999 -3.61 4.43
Transgender -8.385 3.762 .169 -18.65 1.88
Not listed -2.923 2.935 .857 -10.93 5.09
Not listed Male 5.194 2.563 .253 -1.80 12.19
Female 3.331 2.545 .686 -3.61 10.28
Transgender -5.462 4.297 .709 -17.19 6.26
Prefer not to answer 2.923 2.935 .857 -5.09 10.93
*. The mean difference is significant at the 0.05 level.
Male vs. Female: Significant difference in compassion fatigue scores (Mean Difference = -1.863, p < .001), with males having lower scores. Male vs. Transgender: Significant difference in compassion fatigue scores (Mean Difference = -10.655, p = .019), with males having lower scores.
Table 7. Burnout Symptoms Over Three Years Among Teachers with Experience.
Data Collection Point Burnout How many years of service do you have in your current work role in education? Total
0-5 Years 6-10 Years 11-15 Years 16-20 Years 21+
Years
Year 1 Exhaustion N 253 286 229 215 257 1240
% 84.1 85.1 82.4 87.0 79.3
Lack of energy N 277 313 250 220 281 1341
% 92.0 93.2 89.9 89.1 86.7
Sleep disorders N 146 170 153 170 197 836
% 48.5 50.6 55.0 68.8 60.8
Reduced performance of work-related tasks N 183 208 149 133 151 824
% 60.8 61.9 53.6 53.8 46.6
Concentration problems N 233 256 192 182 189 1052
% 77.4 76.2 69.1 73.7 58.3
Memory problems N 150 166 146 146 163 771
% 49.8 49.4 52.5 59.1 50.3
Inability to make decisions N 133 159 112 97 113 614
% 44.2 47.3 40.3 39.3 34.9
Reduced initiative to complete work-related tasks N 230 255 196 163 196 1040
% 76.4 75.9 70.5 66.0 60.5
Reduced imagination or creativity N 170 208 161 119 154 812
% 56.5 61.9 57.9 48.2 47.5
Year 2 Exhaustion N 308 321 282 222 298 1431
% 96.0 93.3 92.2 88.4 87.4
Lack of energy N 309 323 292 233 318 1475
% 96.3 93.9 95.4 92.8 93.3
Sleep disorders N 176 204 186 175 251 992
% 54.8 59.3 60.8 69.7 73.6
Reduced performance of work-related tasks N 210 222 176 134 173 915
% 65.4 64.5 57.5 53.4 50.7
Concentration problems N 232 242 213 165 229 1081
% 72.3 70.3 69.6 65.7 67.2
Memory problems N 174 193 177 145 201 890
% 54.2 56.1 57.8 57.8 58.9
Inability to make decisions N 154 177 140 107 133 711
% 48.0 51.5 45.8 42.6 39.0
Reduced initiative to complete work-related tasks N 234 261 212 162 213 1082
% 72.9 75.9 69.3 64.5 62.5
Reduced imagination or creativity N 197 211 184 139 173 904
% 61.4 61.3 60.1 55.4 50.7
Year 3 Exhaustion N 109 245 210 229 289 1082
% 90.8 93.5 92.1 88.1 86.5
Lack of energy N 113 251 215 243 315 1137
% 94.2 95.8 94.3 93.5 94.3
Sleep disorders N 51 144 129 158 215 697
% 42.5 55.0 56.6 60.8 64.4
Reduced performance of work-related tasks N 67 170 151 169 203 760
% 55.8 64.9 66.2 65.0 60.8
Concentration problems N 74 197 177 203 214 865
% 61.7 75.2 77.6 78.1 64.1
Memory problems N 69 180 161 178 211 799
% 57.5 68.7 70.6 68.5 63.2
Inability to make decisions N 71 149 125 142 146 633
% 59.2 56.9 54.8 54.6 43.7
Reduced initiative to complete work-related tasks N 88 193 174 190 244 889
% 73.3 73.7 76.3 73.1 73.1
Reduced imagination or creativity N 80 167 133 166 179 725
% 66.7 63.7 58.3 63.8 53.6
Table 8. Burnout Symptoms Over Three Years Among Administrators.
Years Burnout How many years of service do you have in your current work role in education? Total
0-5 Years 6-10 Years 11-15 Years 16-20 Years 21+
Years
Year 1 Exhaustion N 99 59 71 59 91 379
% 77.3 67.8 80.7 76.6 70.5
Lack of energy N 116 69 80 62 109 436
% 90.6 79.3 90.9 80.5 84.5
Sleep disorders N 63 40 37 40 68 248
% 49.2 46.0 42.0 51.9 52.7
Reduced performance of work-related tasks N 54 40 39 41 49 223
% 42.2 46.0 44.3 53.2 38.0
Concentration problems N 81 54 55 52 74 316
% 63.3 62.1 62.5 67.5 57.4
Memory problems N 52 37 43 39 63 234
% 40.6 42.5 48.9 50.6 48.8
Inability to make decisions N 36 26 27 25 37 151
% 28.1 29.9 30.7 32.5 28.7
Reduced initiative to complete work-related tasks N 78 44 43 44 65 274
% 60.9 50.6 48.9 57.1 50.4
Reduced imagination or creativity N 58 38 40 32 49 217
% 45.3 43.7 45.5 41.6 38.0
Year 2 Exhaustion N 41 55 54 38 73 261
% 91.1 90.2 84.4 92.7 79.3
Lack of energy N 37 56 58 37 84 272
% 82.2 91.8 90.6 90.2 91.3
Sleep disorders N 29 31 34 25 59 178
% 64.4 50.8 53.1 61.0 64.1
Reduced performance of work-related tasks N 17 36 39 21 45 158
% 37.8 59.0 60.9 51.2 48.9
Concentration problems N 34 42 40 29 61 206
% 75.6 68.9 62.5 70.7 66.3
Memory problems N 27 39 45 28 51 190
% 60.0 63.9 70.3 68.3 55.4
Inability to make decisions N 25 32 26 20 32 135
% 55.6 52.5 40.6 48.8 34.8
Reduced initiative to complete work-related tasks N 22 32 36 27 53 170
% 48.9 52.5 56.3 65.9 57.6
Reduced imagination or creativity N 20 32 24 26 39 141
% 44.4 52.5 37.5 63.4 42.4
Year 3 Exhaustion N 81 69 70 60 107 387
% 81.8 81.2 88.6 88.2 84.9
Lack of energy N 93 82 69 63 115 422
% 93.9 96.5 87.3 92.6 91.3
Sleep disorders N 48 44 42 37 77 248
% 48.5 51.8 53.2 54.4 61.1
Reduced performance of work-related tasks N 38 46 46 35 62 227
% 38.4 54.1 58.2 51.5 49.2
Concentration problems N 66 60 49 40 88 303
% 66.7 70.6 62.0 58.8 69.8
Memory problems N 59 52 52 46 93 302
% 59.6 61.2 65.8 67.6 73.8
Inability to make decisions N 37 37 33 23 53 183
% 37.4 43.5 41.8 33.8 42.1
Reduced initiative to complete work-related tasks N 40 46 45 33 64 228
% 40.4 54.1 57.0 48.5 50.8
Reduced imagination or creativity N 36 43 39 32 60 210
% 36.4 50.6 49.4 47.1 47.6
Disclaimer/Publisher’s Note: The statements, opinions and data contained in all publications are solely those of the individual author(s) and contributor(s) and not of MDPI and/or the editor(s). MDPI and/or the editor(s) disclaim responsibility for any injury to people or property resulting from any ideas, methods, instructions or products referred to in the content.
Copyright: This open access article is published under a Creative Commons CC BY 4.0 license, which permit the free download, distribution, and reuse, provided that the author and preprint are cited in any reuse.
Prerpints.org logo

Preprints.org is a free preprint server supported by MDPI in Basel, Switzerland.

Subscribe

Disclaimer

Terms of Use

Privacy Policy

Privacy Settings

© 2025 MDPI (Basel, Switzerland) unless otherwise stated