
Submitted:
17 December 2024
Posted:
18 December 2024
You are already at the latest version
Abstract
Soil is one of the most important factors of agricultural productivity, directly influencing crop growth, water management, and overall yield. However, inefficient soil moisture monitoring methods, such as manual observation and gravimetric in rural areas, often lead to overwatering or underwatering, wasting resources and reduced yields, and harming soil health. This study offered a digital twin approach for soil moisture measurement, integrating real-time physical data, virtual simulations, and machine learning to classify soil moisture conditions. The digital twin is proposed as a virtual representation of physical soil designed to replicate real-world behavior. We used a multi-spectral rotocam, and high-resolution soil images were captured under controlled conditions. Physically Based Rendering (PBR) materials were created from this data and implemented in a game engine to simulate soil properties accurately. Image processing techniques were applied to extract key features, followed by machine learning algorithms to classify soil moisture levels (wet, normal, dry). Our results demonstrate that the Soil Digital Twin replicates real-world behavior, with the Random Forest model achieving a high classification accuracy of 96.66\% compared to actual soil. This data-driven approach conveys the potential of the Soil Digital Twin to enhance precision farming initiatives and water use efficiency for sustainable agriculture.
Keywords:
digital twin
; soil classification
; physically based rendering
; image processing
; machine learning
; smart farming
1. Introduction
Agriculture security is a multi-faceted concept that aims to protect the agricultural sector from threats, ensure food safety, and maintain a stable food supply worldwide. According to the United Nations, the world population has risen from 1 billion in 1800 to 7.9 billion in 2020, with forecasts of 8.6 billion in 2030, 9.8 billion in 2050, and 11.2 billion in 2100 [1]. Due to the increasing population, challenges like climate change, political instability, and economic disparities pose significant risks to our food supply. Understanding and tackling these challenges is vital to ensure global food security [2].
Soil is one of the most important factors of agricultural productivity, directly influencing crop growth, water management, and overall yield [3]. However, in many regions, particularly those dominated by traditional farming practices, soil moisture monitoring, such as manual observation and gravimetric, still needs to be solved. In particular, farmers in rural and agricultural communities often manually estimate soil conditions, using visual observations or physical touch to determine whether watering schedules are rigid or twice daily, morning and afternoon, regardless of whether the soil needs water. This inefficient approach frequently results in overwatering or underwatering, leading to wasted resources and reduced crop yields [4].
The challenges faced in this rural context reflect a broader, global issue. According to the Food and Agriculture Organization, 33% of the world’s soils are degraded due to erosion, salinization, compaction, acidification, and chemical pollution [3]. Human activities are rapidly depleting fertile topsoil at an alarming rate. Salinization of soils also impacts more than 424 million hectares globally, considerably limiting soil fertility. These challenges are compounded by climate change and the scarcity of scalable, accessible soil monitoring solutions that endanger worldwide food security [5].
In addition to traditional manual methods, advanced technologies such as sensor-based systems and Internet of Things (IoT) devices have revolutionized precision agriculture by enabling real-time soil moisture monitoring [6,7]. However, these technologies face limitations that hinder widespread adoption, including high costs, limited digital literacy, reliance on stable internet connectivity, and inadequate infrastructure—all of which are key barriers to adopting agricultural technologies, especially for smallholder farmers[8].
Although smart farming has made great strides in smart farming, significant barriers to adoption remain for smallholder farmers due to the costs of modern technologies, low levels of digital literacy, and gaps in infrastructure. Their unique challenges have thus increased the need for sustainable, affordable solutions. As highlighted in [9], creating affordable and functional digital ecosystems is essential to empower smallholder farmers and support their transition to modern agricultural practices. These highlights that soil moisture can be monitored and accurately predicted using a digital twin framework as a cost-effective and scalable solution that integrates real-time data and machine learning to improve crop practices and encourage sustainable agriculture [10]. Furthermore, image processing methods, as described in [11], have proven useful in assessing soil moisture through soil texture and feature analysis. These techniques form an essential part of the framework we propose.
The proposed framework builds on these principles by introducing a digital twin framework for soil moisture measurement that combines physically based virtual simulations and machine learning to create a scalable, accessible, and sustainable solution for precision agriculture.
2. Related Studies and Motivation
Traditional soil moisture monitoring techniques, like manual observation and gravimetric analysis, are still commonly used in rural farming because of their simplicity and affordability. Manual observation involves visual checks or physical touch to assess moisture levels, but this method is highly subjective and often unreliable [12]. Gravimetric analysis, though more accurate, is time-consuming and labor-intensive, making it impractical for regular monitoring, especially across larger fields [13]. This inefficient approach frequently results in overwatering or underwatering, leading to wasted resources, reduced crop yields, and harmed soil health [12]. An easily accessible soil monitoring system is essential, and sensor-based technologies combined with IoT offer a promising way to provide accurate and scalable real-time moisture measurements.
Recent sensor technologies and IoT developments have significantly impacted precision agriculture, enabling real-time data collection and analysis and supporting precision irrigation and resource management. Soil moisture sensors, such as TDRs and capacitance probes that measure volumetric water content provide accurate insights into soil conditions [14]. IoT devices enhance these systems by enabling remote monitoring and automation integrated with decision support tools, making them the cornerstone of innovative farming practices [15]. However, the widespread adoption of sensor-based systems has been hindered by several limitations, such as high initial costs, dependency on stable internet connectivity, and environmental concerns from battery use, including resource depletion, pollution, and soil contamination present significant barriers, especially for smallholder farmers in rural areas with limited resources and infrastructure [8,12,15,16,17]. These issues highlight the need for cost-effective, sustainable alternatives. Imaging-based solutions with digital twin technology are proposed to overcome sensor-based limitations.
Digital twins have emerged as a powerful approach to modeling complex physical systems in various domains, including precision agriculture. Digital twins offer a dynamic, digital replica of physical objects, beneficial for sustainable manufacturing and maintenance by enabling data-driven insights, predictions, and improvements throughout a product’s lifecycle [18]. In agriculture, digital twins enable virtual replicas of real farms, facilitating remote management, real-time data analysis, and simulations to optimize decision-making and resources [19]. In another study, digital twins provide insights into soil health, irrigation needs, and environmental impacts [20]. However, current solutions require expensive sensors, making them inaccessible for smallholder farmers[21]. A combination of digital twins and imaging-based methods is proposed, providing an affordable and scalable solution.
By building on the digital twin framework, imaging enhances simulations by providing detailed visual data for accurate soil moisture monitoring. Imaging systems, particularly Multispectral imaging, coupled with texture analysis using Grey Level Co-occurrence Matrix and classification via Artificial Neural Networks, effectively identify and classify sashimi food quality and detect surface damage [22]. According to [23], integrating Sentinel-1, Sentinel-2, and SMAP data improves soil moisture mapping accuracy by addressing spatial variability limitations, while also highlighting the need for advanced simulation tools. This work integrates imaging and physically-based rendering within a digital twin framework, offering a cost-effective, sustainable solution for soil moisture mapping.
Physically Based Rendering (PBR), a technique originating from the domain of computer graphics, enhances realism in soil simulations by accurately simulating light interactions with soil surfaces based on physical properties like reflectivity and texture [24]. The approach applies PBR within a digital twin framework to create realistic soil visualizations and improve soil moisture classification accuracy.
Machine learning further enhances the proposed framework by enabling predictive modeling and automation. The machine learning algorithms used, such as Random Forest, SVM, and ANNs, demonstrate excellence in managing intricate datasets with precision [25,26]. Existing studies demonstrate machine learning’s effectiveness in classifying soil moisture based on visual, spectral, and textural features [27]. Hossain and Kabir [28] explored machine learning models for estimating soil moisture from smartphone images, highlighting the potential of integrating such techniques within a digital twin framework for accessible and cost-effective soil moisture assessment.
This study presents a cost-effective, adaptable, and eco-friendly approach to soil moisture monitoring through the integration of real-time physical data, virtual modeling, and machine learning. The soil digital twin, driven by realistic PBR simulations, image processing techniques, and predictive machine learning algorithms, delivers accurate and dependable soil moisture forecasts. This approach addresses the limitations of sensor-based systems and contributes to more efficient water management and improved agricultural productivity.
3. Digital Twin in Practice
A Digital Twin, as conceptualized by Grieves, is a virtual model that mirrors a physical product or system, allowing for comparison between the planned and actual states [29]. So far, Digital Twins found various applications, most at all in architecture, product design, plant, warehouse and urban infrastructure planning and design, medicine, just to name a few. The digital twin concept can be applied to soil moisture measurement in agriculture. Developing a virtual soil model that integrates real-world data, simulations, and machine learning to enhance soil moisture monitoring and management. This section bridges the gap between existing research on soil moisture monitoring and the proposed digital twin framework by clarifying the practical implications, definition, and evaluation criteria for digital twins in this context.
A digital twin for soil moisture is a practical tool for monitoring and managing soil, providing valuable insights to optimize agricultural practices and ensure sustainable soil usage [19]. It allows us to analyze soil properties like moisture and texture in real-time, within a virtual environment, separating the actual physical processes from planning and control. For instance, as discussed in [30], it offers a way to model and optimize irrigation strategies by creating a virtual representation of the soil-water-plant system. This capability, which simulates the impact of different irrigation schedules on crop growth and water usage, can significantly improve water management and contribute to soil health and agricultural sustainability, leading to more efficient and sustainable water management practices.
A system must encounter several key criteria to qualify as a digital twin. A critical requirement is integrating physical data with virtual simulations, ensuring an accurate physical system representation [29]. As hinted at in [31], a digital twin for soil moisture measurement needs reliable data (imaging, sensors) for real-world accuracy and real-time interaction between physical and virtual models for up-to-date, actionable feedback. Another important characteristic is the ability to perform high-fidelity simulations replicating physical conditions under various scenarios, such as changing soil moisture levels or environmental stresses [20]. Finally, the digital twin, like the sensor guidance in [32], should generate actionable insights for practical soil management decisions, such as optimizing irrigation and improving soil health.
When evaluating and comparing different digital twin approaches, several key factors, such as accuracy, scalability, integration ease, and environmental sustainability, come into play. Accuracy is crucial in soil moisture prediction, which assesses how well the digital twins’ predictions match or at least match with real soil moisture levels. Scalability is also a key consideration in agriculture, as solutions must be adaptable to diverse farming scales. Research on Spatial Digital Twins (SDT) and their applications in various fields, such as smart cities and agriculture, demonstrates their potential for scalability [33]. It highlights how ease of integration, including cost and ease of use, are important considerations for practical applications. As hinted at in [31], a digital twin for soil moisture measurement requires reliable data (e.g., imaging, sensors) to ensure real-world accuracy and real-time interaction between physical and virtual models, enabling up-to-date and actionable feedback. Furthermore, [21] has shown that using digital twins to improve maintenance and lifecycle management can minimize waste and contribute to more sustainable practices. The emphasis on modeling also suggests that digital twins can be used to consider the environmental impact of different strategies before real-world implementation.
This study presents a novel imaging-based digital twin designed for soil moisture monitoring. By combining multispectral imaging and Physically Based Rendering (PBR), this approach achieves high accuracy in replicating soil behavior and its cost-effective nature compared to sensor-dependent systems. The scalability and sustainability of the digital twin systems make them quite useful for smallholder farming, further strengthening some broader objectives within precision agriculture. Integrating imaging systems and machine learning algorithms offers actionable insights for soil moisture classification and irrigation optimization.
4. Proposed Scheme
The proposed framework outlines a digital twin approach that leverages advanced imaging techniques, physically-based rendering simulations, and machine learning models to accurately predict soil moisture conditions. The proposed digital twin framework is illustrated in Figure 1.
The main components of the proposed digital twin system are as follows:
-
Real Soil WorkflowThe Real Soil Workflow involves collecting and preprocessing physical soil data to establish the ground truth:
- Soil moisture and temperature are measured using sensors to capture the physical properties of the soil.
- Soil samples are categorized into three moisture levels: Dry, Normal, and Wet.
- Multi-spectral images are captured using six filters and lighting control via four LED combinations (Red, Green, Blue, Yellow) to enhance visual soil properties.
-
Digital Twin WorkflowThe Digital Twin Workflow involves the generation and validation of simulated soil environments to replicate real soil properties accurately:
-
PBR Texture Creation:Physically Based Rendering (PBR) techniques are utilized to develop realistic soil textures that mimic real soil samples’ visual and structural characteristics.
-
Game Engine Integration:The generated soil textures are integrated into a game engine, enabling the simulation of environmental conditions and soil interactions under controlled scenarios.
-
Image Comparison:Real soil images and digital soil images are compared to validate the fidelity of the digital twin. This comparison ensures that the digital twin accurately reproduces critical properties, including texture, color, and structure of real soil.
-
Rendering and Simulation:Once validated, the digital twin is rendered to create high-quality simulations suitable for downstream analysis, ensuring high realism and reliability.
-
-
Data PreprocessingA unified preprocessing and analysis pipeline is implemented for both Real Soil Images and Digital Soil Images, ensuring consistency in feature extraction and classification:
- Color ratios such as Red-Green (RG), Red-Blue (RB), and Green-Blue (GB) are computed to analyze color intensity relationships.
- Statistical measures, including Mean, Median, Standard Deviation, Min, Max, Range, 25th Percentile, and 75th Percentile, are calculated to summarize pixel intensities’ central tendencies and spread.
- Texture properties are evaluated using the Gray-Level Co-Occurrence Matrix (GLCM), focusing on metrics such as Contrast, Correlation, Energy, Homogeneity, and Entropy to assess spatial texture patterns and variability.
- Distribution metrics such as Skewness and Kurtosis are computed to assess the asymmetry and peakedness of pixel intensity distributions.
-
Machine LearningAdvanced machine learning algorithms are employed to classify soil moisture levels (Dry, Normal, Wet) based on the extracted features:
- Artificial Neural Networks (ANN) are used as deep learning models with multiple hidden layers to capture non-linear patterns in the data.
- Random Forest (RF) is implemented as an ensemble-based decision tree algorithm for robust classification.
- Support Vector Machines (SVM) are kernel-based models optimized for high-dimensional feature spaces.
- The dataset is divided into 70% for training and 30% for testing to evaluate the performance of these models. Classification metrics such as Accuracy, Precision, Recall, and F1-Score are computed on the test set to ensure robustness and reliability in soil moisture classification.
-
Comparison and EvaluationThe final component assesses the performance of the proposed framework by comparing the results from real and digital soil workflows and evaluating the classification models:
-
ComparisonClassification results from the actual soil workflow and the digital twin workflow are compared to assess the accuracy and reliability of the digital twin in replicating real-world soil properties. This comparison ensures that the digital twin faithfully mimics the physical characteristics of soil, including moisture classification for Dry, Normal, and Wet categories.
-
EvaluationThe performance of machine learning models is evaluated using standard metrics such as Accuracy, Precision, Recall, F1-Score, Matthews Correlation Coefficient, and other metrics, providing a comprehensive assessment of model performance. These metrics are calculated for both workflows to determine the robustness and effectiveness of the models in classifying soil moisture levels. The evaluation ensures that the digital twin framework produces results comparable to real soil data, validating its application for soil moisture analysis.
-
5. Materials and Methods
In this study, we investigated the ability of digital soil twins to replicate real-world soil samples’ properties accurately. The research used a comparative approach, using a custom imaging system to collect data on physical soil samples and advanced Physically Based Rendering techniques to generate digital soil models. The subsequent sections provide a detailed account of the materials and methodologies used for real and digital soil experiments.
5.1. Materials
5.1.1. Real Soil Workflow
This study collected data from four representative soil types: Loam, Clay, Sand, and Silt, which collectively encompass the range of soil varieties typically encountered in agricultural contexts. The samples were prepared and categorized into three moisture levels: dry (moisture content below 12%), normal (moisture content between 12% and 21%), and wet (moisture content above 21%).
A custom-built multi-spectral rotocam was employed to collect real soil data. The rotocam, controlled by a Raspberry Pi 3, was equipped with six spectral filters (purple, blue, green, yellow, brown, and red), enabling high-resolution image capture across various spectral ranges. The camera was mounted on a tripod, and the distance between the camera and the soil sample was maintained at a constant 40 cm to ensure consistency across all images. The experiments were conducted under room temperature conditions. The experimental setup, including the rotocam and soil sample placement, is shown in the Figure 2.
Illumination was provided by four high-intensity LEDs—blue (465–470 nm), green (520–525 nm), yellow (590–610 nm), and red (630–640 nm). These LEDs were arranged into 15 unique lighting combinations to ensure sufficient spectral diversity in the captured images. The LEDs were controlled through a resistor-based circuit integrated with the Raspberry Pi, allowing precise LED intensity and sequence management.
Soil moisture levels were measured using a Vernier soil moisture sensor, with values expressed as percentages. To maintain consistency, an ambient temperature sensor recorded the environmental conditions during the experiments.
5.1.2. Digital Twin Workflow
The digital soil experiment was conducted using Physically Based Rendering (PBR) techniques to replicate the optical and physical properties of the real soil used in the experiment. Digital soil twins were created for the same four soil types and moisture levels as those used in the real soil workflow. The implementation and experimental setup in Unreal Engine, including camera placement, lighting configurations, and spectral filters, are shown in Figure 3.
The soil models, filters, and LED configurations were implemented as materials within Unreal Engine to accurately replicate the real soil setup. A Cine Camera Actor was used to simulate the camera system, with LED light sources represented as Spotlights for precise control over intensity, directionality, and color. The spectral filters were set directly within the camera settings, enabling the generation of filtered images for each lighting configuration.
To ensure consistency, all ambient light sources, including sunlight, were manually disabled, creating a dark environment to prevent interference with the controlled LED lighting setup. Exposure settings on the Cine Camera Actor were also manually adjusted to match the lighting conditions and optimize image quality. These adjustments ensured that only the LED light sources contributed to the illumination of the digital soil models, maintaining a controlled and replicable setup.
Using Materialize, an open-source application, PBR materials were developed based on the real photos taken during the study to generate texture maps, including albedo, normal, roughness, metallic, and ambient occlusion (AO). The open-source image manipulation software GIMP was utilized to create and refine specular maps manually, ensuring an accurate representation of surface reflectivity and glossiness under varying moisture conditions. These texture maps captured the soil samples’ key visual and physical characteristics.
The digital soil twins were implemented in Unreal Engine, a game engine providing an efficient real-time rendering and simulation platform. The soil models were rendered under experimental conditions that mimicked the real soil setup, including camera placement, lighting configurations, and spectral filters. The use of Unreal Engine allowed precise adjustments to lighting and material properties, ensuring consistency and fidelity in the digital dataset. Simulations were performed using 15 unique lighting combinations to replicate the spectral diversity observed in the real soil experiments.
The digital soil models were validated by comparing their visual and spectral properties to the corresponding real soil data to ensure consistency and accuracy. Rendering was conducted on a high-performance MSI laptop equipped with 16 GB of RAM, an NVIDIA GeForce RTX 3050 Ti GPU, and a 12th Gen Intel(R) Core(TM) i7-1280P processor (2.00 GHz).
5.2. Methods
The real soil experiment was designed to capture high-quality datasets for training machine learning models to predict soil moisture levels. A systematic workflow, including the innovative use of multi-spectral images, was developed to measure soil moisture and extract relevant features for subsequent analysis. As illustrated in the framework, the experiment followed the proposed scheme in Figure 1 to ensure consistency between real soil and digital twin workflows.
5.2.1. Data Collection for Real Soil Workflow
As illustrated in the Section 5.1.1 of the framework Figure 1, the initial phase of the research entailed data acquisition from physical soil samples. The study encompassed four representative soil types: loam, clay, silt, and sand, which were analyzed under three distinct moisture conditions: dry, normal, and wet. A Vernier soil moisture sensor measured soil moisture content, while room temperature was also recorded to maintain a controlled environmental condition. The soil samples were categorized according to their respective moisture levels based on these measurements.
The images were acquired with a multi-spectral rotocam controlled by a Raspberry Pi 3. The imaging system used six spectral filters to isolate specific wavelengths of light, enabling enhanced feature extraction. The details of the filters are presented in Table 1.
These filters facilitated the spectral separation of light reflected from the soil, providing critical data for feature extraction in subsequent machine-learning analysis.
To ensure consistent and replicable lighting conditions, the soil samples were illuminated using four high-intensity LED light sources, each with specific wavelengths and intensities. The details of the LEDs are presented in Table 2.
This precise LED and filter configuration ensured a controlled and consistent lighting environment for capturing high-quality soil images. The LEDs were configured into 15 unique lighting combinations. For each combination, images were sequentially captured through the six spectral filters, resulting in 90 images per soil sample and moisture condition.
5.2.2. Data Collection for Digital Twin Workflow
According to the Section 5.1.2 of the framework Figure 1, data collection for the digital twin experiment involved simulating the optical and physical properties of real soil using Physically Based Rendering (PBR) techniques in Unreal Engine. Digital soil models were created for four soil types under the same moisture conditions as the real soil experiment (dry, normal, and wet). These digital models replicated the properties of real soil samples to provide comparable datasets.
The Physically Based Rendering (PBR) materials applied to the digital soil models were designed to simulate realistic surface characteristics. These materials incorporated color reflectance, texture, and moisture-dependent surface effects. Using high-fidelity PBR techniques in Unreal Engine, the soil models accurately mimicked the interaction of light with soil surfaces.
The virtual imaging setup in Unreal Engine replicated the controlled conditions of the real soil experiment. The LED lighting system, composed of four virtual light sources (red, green, blue, and yellow), was calibrated to provide consistent lighting conditions. The intensity and directionality of the LEDs were carefully configured to mimic the real setup. At the same time, rendering was conducted in low-light or dark conditions to minimize interference from ambient light. The specific LED settings, including RGB values and intensity coefficients, are shown in Table 3.
Six virtual color filters (purple, blue, green, yellow, brown, and red) were applied during rendering to replicate the spectral effects of real soil imaging. Each filter simulated specific spectral properties based on its RGB values and intensity coefficients, as detailed in Table 4.
Moisture levels were simulated by dynamically adjusting the material properties of the soil models. Changes in specularity, glossiness, and darkening were applied to reflect varying moisture conditions accurately. Before rendering, a side-by-side comparison of real and digital soil images was conducted to validate their similarity, ensuring that the digital models accurately represented the optical properties of the real samples, as shown in Figure 4.
For each combination of LED light source and filter, images were rendered using Unreal Engine’s real-time rendering pipeline, producing six filtered images for each of the 15 lighting combinations. This process resulted in 90 images per soil type and moisture condition. The rendering process was efficient, with each image requiring approximately 3–3.33 seconds. A single soil type and moisture condition (e.g., dry loam) produced 900 images, while a complete dataset for one soil type (all moisture conditions) resulted in 2700 images. Rendering all 2700 images required approximately 2.5 hours.
As shown in Figure 4, slight cracks are visible in the digitally rendered clay soil images. These cracks are caused by the extreme dryness of the clay soil during the experiments and were accurately captured in the rendering process. Despite these artifacts, the digital models remain faithful representations of the physical soil samples.
To ensure consistency, virtual environmental conditions, such as ambient light and temperature, were kept constant across all simulations. The generated images were visually inspected after rendering to confirm accurate feature representation.
5.2.3. Feature Extraction
The acquired images from the real soil and digital soil experiments were processed at their original resolutions of 640 × 480 pixels, as captured and rendered. No resizing or additional preprocessing was conducted to preserve the integrity of the data. Instead, feature extraction was directly applied to the images to extract meaningful characteristics, including color ratios, statistical features, texture features, and distribution metrics, for further analysis.
-
Color Ratios;Color ratios are critical features that capture the relative intensity of different color channels in soil images, providing insights into spectral properties that vary with soil type and moisture conditions [11]. These ratios are computed by comparing the intensity values of the red, green, and blue channels, normalized for each pixel in the image.
- Red/Green Ratio: This ratio captures the balance between reddish and greenish hues, which can correlate with soil mineral content and organic matter levels;
- Red/Blue Ratio: This ratio highlights the balance between reddish and bluish tones, which may indicate the presence of specific soil constituents or moisture content;
- Green/Blue Ratio: This ratio reflects the relative abundance of greenish and bluish shades, which can be linked to soil organic matter, water content, and microbial activity.
These color ratios serve as valuable features for the subsequent machine learning models, enabling the digital twin system to accurately predict soil moisture conditions based on the visual characteristics of the soil samples. -
Statistical Features;Statistical measures are fundamental features used to describe the distribution and variability of pixel intensity values in soil images, similar to their application in multispectral imaging for food and fruit classification [34]. These measures provide insights into the overall characteristics of the image, aiding in distinguishing soil types and moisture levels. The statistical measures extracted include Mean, Median, Standard Deviation, Min, Max, Range, 25th Percentile, and 75th Percentile [35].
-
Texture Features;This study employed the Grey Level Co-occurrence Matrix (GLCM) technique to perform texture analysis. The GLCM is a square matrix that can provide insights into the spatial distribution of gray-level pixels by examining their immediate neighbors within the texture image [22].The co-occurrence matrix is defined as:where is the image of size, , is a central pixel (reference pixel), and offset is defined as and , where defines the direction of the matrix from the central pixel , and D is the distance from the central pixel .From the co-occurrence matrix , each direction (i.e., contrast, correlation, energy, and homogeneity) can be calculated as follows:where i is the number of pixels in the vertical direction, j is the pixels in the horizontal direction, is the mean of the probability matrix, and is the standard deviation of the probability matrix. In our proposed work, we considered only one neighboring pixel D (), which defines four possible spatial relationships (directions) as:In addition to the features derived from the Gray Level Co-occurrence Matrix (GLCM), entropy is another critical metric that provides insights into the complexity and randomness of the pixel intensity distribution. Entropy captures the overall unpredictability in the image data, offering complementary information to the spatial relationships described by GLCM features. It is calculated as:where, represents the probability of a pixel intensity value i occurring in the image, and N is the total number of unique intensity values in the image, and N is the total number of unique intensity values in the image. Higher entropy indicates greater randomness and complexity, while lower entropy reflects a more uniform distribution of pixel intensities [36].
-
Distribution Metrics;Additionally, measures of distribution shape, including Skewness and Kurtosis, were analyzed. Skewness describes the asymmetry of the pixel intensity distribution, while Kurtosis reflects the peakedness or flatness of the distribution. These higher-order statistical moments provide further insights into the characteristics of the soil images [37]. High Kurtosis indicates a distribution with heavy tails and a sharp peak, while low Kurtosis suggests lighter tails and a flatter peak. These metrics provide critical insights into the distribution’s shape, allowing the analysis of subtle variations in soil texture and moisture conditions.
5.2.4. Soil Dataset Overview
This research collected datasets for four common soil types: loam, clay, sand, and silt, under controlled conditions. For each soil type, images were categorized into three moisture levels: dry, normal, and wet. The datasets were created using real soil experiments and digital twin simulations in Unreal Engine, ensuring consistency and comparability between the two approaches.
The real soil dataset was collected by capturing high-resolution images of physical soil samples under varying moisture conditions. Each soil type was prepared by adjusting its moisture content and allowing sufficient drying time for the dry category. The real soil dataset is summarized in Table 5.
The dataset reflects each soil type’s unique physical and moisture-related characteristics, providing a comprehensive basis for feature extraction and classification tasks.
The digital twin dataset was generated by simulating soil properties in Unreal Engine using Physically Based Rendering (PBR) techniques. High-resolution images were rendered under controlled lighting and filter configurations, replicating the conditions of the real soil experiments. Each soil type was simulated to produce a consistent number of samples across moisture levels. The digital twin dataset is summarized in Table 6.
The digital twin dataset was designed to replicate the physical and optical characteristics of the real soil samples, ensuring that both datasets could be directly compared in subsequent analysis.
5.2.5. Machine Learning
The machine learning framework was implemented using Python 3.10, with scikit-learn 1.0.2 for specific algorithms, and TensorFlow 2.10.0 with a Keras frontend for deep learning-based approaches. The extracted features obtained in Section 5.2.3, including color ratios, texture metrics, statistical measures, and distribution metrics, were used as input variables for the machine learning models. These features captured the soil images’ spectral, spatial, and statistical properties under varying lighting and moisture conditions. The output of the models was the soil moisture class, categorized into three levels: Dry, Normal, and Wet.
In the data preparation stage, the target variable (soil moisture class) was numerically encoded as 0 (Dry), 1 (Normal), and 2 (Wet). The features were standardized using the StandardScaler from Scikit-learn to ensure equal weight for all variables during training. The dataset was then split into training (70%) and testing (30%) subsets, with stratified sampling to preserve the class distributions across splits.
Three machine learning models were trained to classify the soil moisture class: Artificial Neural Networks (ANNs), Support Vector Machines (SVMs), and Random Forest (RF).
The first machine learning model used in this study was Artificial Neural Networks (ANNs), which are powerful tools for solving classification problems due to their ability to learn complex patterns from data [38]. This study implemented an ANN using TensorFlow and Keras to classify soil moisture levels into three categories: Dry, Normal, and Wet. The network architecture consisted of an input layer, four fully connected hidden layers, and an output layer. Each hidden layer employed the Rectified Linear Unit (ReLU) activation function to introduce non-linearity:
while dropout regularization (rate: 0.3) and batch normalization were applied to stabilize the learning process and prevent overfitting. The output layer utilized the Softmax activation function to compute probabilities for each soil moisture class:
The ANN was trained using the RMSprop optimizer with a learning rate of 0.0005 and sparse categorical cross-entropy as the loss function:
where is the predicted probability for the true class , and N is the batch size [39]. The training was conducted for up to 100 epochs with early stopping and learning rate schedules to optimize performance. These techniques enabled the ANN to classify soil moisture levels robustly based on extracted features.
The next machine learning model was Support Vector Machine (SVM), implemented to classify soil moisture into three categories: Dry, Normal, and Wet. The model utilized the SVC class from scikit-learn, with hyperparameter tuning performed using GridSearchCV. The SVM decision function is expressed as:
where represents the support vectors, are the Lagrange multipliers, are the class labels of the support vectors, is the kernel function, and b is the bias term. The radial basis function (RBF) kernel was primarily used, defined as:
where and x represent data points, and controls the kernel’s influence. The foundational theory of SVMs, including the RBF kernel, was introduced by Cortes and Vapnik [40]. Hyperparameters, including C (regularization parameter), kernel type (linear, RBF, polynomial), and , were tuned using 5-fold cross-validation.
The third machine learning method used in this research is Random Forest (RF), an ensemble learning approach that constructs multiple decision trees and aggregates their predictions for robust classification performance [25]. RF was implemented using 100 estimators to classify soil moisture into three categories: Dry, Normal, and Wet. Each tree was trained on a random subset of the data (bagging), with random feature selection at each split, ensuring diversity among the trees and reducing overfitting.
The RF classifier predicts the final class using majority voting:
where represents the prediction of the t-th tree, and is the aggregated class. Probabilities for each class were calculated as the average of the probabilities predicted by all trees.
Model performance was evaluated using several metrics derived from the confusion matrix, which summarizes the classification results. The true positives (TP) represent correctly classified instances for a given class, true negatives (TN) are correctly classified instances for all other classes, false positives (FP) are instances incorrectly classified as the target class, and false negatives (FN) are instances belonging to the target class but classified as another class [41]. These parameters formed the foundation for constructing the evaluation metrics, including accuracy (A), precision (P), recall (R), F1-score (F1), Matthews Correlation Coefficient (MCC), and other metrics, providing a comprehensive assessment of model performance.
Additionally, the models were evaluated using the area under the Receiver Operating Characteristic curve (ROC Area) and the Precision-Recall Curve area (PRC Area). (ROC Area) measures the model’s ability to discriminate between classes, while (PRC Area) focuses on performance under imbalanced class distributions.
6. Results
As described in the preceding sections of the data processing methodology, the real soil and digital soil datasets were subjected to the same feature extraction technique in Section 5.2.3. This consistent approach ensures that the input data for both datasets is uniform and comparable, enabling a robust and rigorous analysis. The extracted features provide a constant and reliable foundation for evaluating the performance of machine learning models across real soil and digital soil twin datasets. Following the feature extraction phase, classification tasks were performed using various machine learning models. The results of the classification models applied to real soil and digital twin datasets are presented in Table 7, along with the corresponding performance comparisons illustrated in Figure 5, provide detailed insights into the classification performance for Neural Networks (NN), Random Forest (RF), and Support Vector Machine (SVM) across the four soil types (loam, clay, silt, and sand). The confusion matrices, depicted in Figure 6, Figure 7 and Figure 8 illustrate the classification performance, providing detailed insights into true positive, false positive, and misclassification rates.
As shown in Figure 5, Random Forest achieved the best performance for both real soil 96.89% and digital twin data 95.67% for loam soil. However, ANN and SVM showed noticeable declines in digital twin accuracy, which aligns with the confusion matrices in Figure 6, Figure 7, and , indicating increased misclassifications for loam’s variable composition.
For clay soil, Random Forest achieved the highest accuracy for real soil, 95.32%, while SVM slightly outperformed RF on digital twin data, 95.06% vs. 92.22%. The confusion matrices Figure 6, Figure 7, and highlight the strong predictive performance of both RF and SVM for this relatively homogenous soil type.
Silt soil results show Random Forest as the most effective model, achieving the highest accuracy for both real 96.02% and digital twin datasets 96.66%, as illustrated in Figure 5. The confusion matrices in Figure 6, Figure 7, and reveal reduced misclassifications for digital twin data, indicating that silt’s intermediate properties are well-simulated in the digital twin.
For sand soil, Random Forest again demonstrated the best performance for both real 95.60% and digital twin datasets at 92.96%, with SVM following closely on the digital twin at 90.00%. The confusion matrices Figure 6, Figure 7, and highlight the challenges ANN faced with this soil type, particularly for digital twin data.
As shown in Figure 6, ANN exhibited moderate classification performance across soil types. For real soil datasets, ANN achieved high accuracy for loam 93.82% and clay 91.34%, while its performance declined for silt 83.43% and sand 85.11%. On the digital twin datasets, ANN’s accuracy decreased for all soil types, with significant drops for loam 89.14% and sand 87.41%, highlighting its sensitivity to subtle variations that may not be fully captured in the digital twin framework.
Random Forest consistently achieved the highest accuracy across real soil and digital twin datasets, as depicted in Figure 7. For real soil, RF achieved 96.89% for loam, 95.32% for clay, 96.02% for silt, and 95.60% for sand. On digital twin data, RF maintained strong performance, with accuracies of 95.67% for loam, 92.22% for clay, 96.66% for silt, and 92.96% for sand. These results underscore RF’s robustness and ability to generalize effectively across datasets.
As shown in Figure 8, SVM performed competitively on both real and digital twin datasets. For real soil, SVM achieved high accuracy for loam 94.80% and clay 91.29%, with slightly lower performance for silt 87.54% and sand 87.49%. On the digital twin, SVM’s accuracy improved for clay 95.06% and silt 92.83% but decreased for loam 88.76% and sand 90.00%. These results highlight SVM’s effectiveness in structured datasets such as clay and silt.
7. Discussion
The results confirm the effectiveness of the digital twin framework in replicating soil dynamics and enabling accurate soil moisture classification. However, accuracy on real soil data was consistently higher than digital twin data, particularly for ANN and SVM, suggesting that the digital twin might need more variability or feature detail in real soil datasets. This performance gap was more pronounced for soil types like loam and sand, which exhibit more significant variability. In contrast, the digital twin performed comparably to real soil data for structured soils such as clay and silt, showing that it can be trusted for these soil types.
The digital twin model showed a larger difference in performance when predicting soil moisture for soils that change a lot, like loam and sand. However, for soils with a clear structure, like clay and silt, the digital twin performed just as well as real soil data, showing that its reliability for these types.
While the digital twin provided a scalable and cost-effective alternative for data generation, its limitations in capturing variability for complex soils like loam and sand highlight areas for improvement, enhancing the digital twin framework with additional sensing modalities and environmental simulations could further close this performance gap and improve overall accuracy.
These findings suggest that the digital twin framework can be effectively employed in precision agriculture and soil management applications, especially for structured soils. Further research into improving simulation fidelity and integrating additional environmental parameters could expand its applicability to more diverse soil conditions.
8. Conclusions and Future Work
This study showcases the viability of a digital twin framework for soil moisture prediction, bridging the gap between traditional manual assessments and emerging sensor-based technologies. By leveraging the advantages of machine learning and virtual simulations, this approach promises to deliver a scalable, cost-effective, and environmentally friendly solution to address the global challenge of sustainable soil management. The digital twin approach demonstrates promising potential as a cost-effective and scalable alternative to physical soil experiments, with performance matching that of real soil for specific soil types. While some discrepancies remain for Loam and Sand, the consistent outperformance of the Random Forest model positions it as the optimal choice for future soil moisture classification endeavors. By integrating advanced visualization techniques and imaging with multiple wavelengths of light (multispectral or hyperspectral imaging), we can gather more detailed information for machine learning models. This enables the models to better distinguish between different types of soil and their moisture content.
In future research, we plan to improve the digital twin system by using more sensing methods, such as a broader range of light-emitting diodes (LEDs) with different wavelengths and brightness. LEDs with different settings can help better describe soil qualities like moisture, texture, and nutrient availability. The digital twin can also be used for more things, including weather simulation and climate modeling. By mimicking environmental factors like rain, temperature changes, and moisture, the framework could represent actual soil conditions under different weather conditions. These enhancements would make the digital twin more accurate and valid in applications like precision agriculture.
Author Contributions
Conceptualization, I.P. and M.K.; methodology, M.K.; software, I.P., and M.K.; validation, I.P. and M.K.; formal analysis, I.P., and M.K.; investigation, I.P. and M.K.; resources, I.P. and M.K.; data curation, I.P. and M.K.; writing—original draft preparation, I.P.; writing—review and editing, M.K.; visualization, I.P.; supervision, M.K. All authors have read and agreed to the published version of the manuscript.
Funding
This research received no external funding.
Data Availability Statement
Not Applicable.
Acknowledgments
The authors of this article would like to thank the lab members of the Human Centered Computing Lab at the Kyushu Institute of Technology for their valuable discussions and contributions during this research.
Conflicts of Interest
The authors declare that they have no known competing financial interests or personal relationships that could have appeared to influence the work reported in this paper.
References
- Costello, C.; Cao, L.; Gelcich, S.; Cisneros-Mata, M.Á.; Free, C.M.; Froehlich, H.E.; Golden, C.D.; Ishimura, G.; Maier, J.; Macadam-Somer, I.; others. The future of food from the sea. Nature 2020, 588, 95–100. [Google Scholar] [CrossRef] [PubMed]
- Fao. The future of food and agriculture: Trends and challenges; Fao, 2017. [Google Scholar]
- Food and Agriculture Organization of the United Nations. Status of the World’s Soil Resources; FAO: Rome, Italy, 2015. [Google Scholar]
- Savva, A.P.; Frenken, K.; others. Irrigation manual. Planning, development monitoring and evaluation of irrigated agriculture with farmer participation. FAO 2002.
- FAO. Global map of salt-affected soils, 2021.
- Yin, H.; Cao, Y.; Marelli, B.; Zeng, X.; Mason, A.J.; Cao, C. Soil sensors and plant wearables for smart and precision agriculture. Advanced Materials 2021, 33, 2007764. [Google Scholar] [CrossRef] [PubMed]
- Mahbub, M. A smart farming concept based on smart embedded electronics, internet of things and wireless sensor network. Internet of Things 2020, 9, 100161. [Google Scholar] [CrossRef]
- Mizik, T. How can precision farming work on a small scale? A systematic literature review. Precision agriculture 2023, 24, 384–406. [Google Scholar] [CrossRef]
- Gumbi, N.; Gumbi, L.; Twinomurinzi, H. Towards sustainable digital agriculture for smallholder farmers: A systematic literature review. Sustainability 2023, 15, 12530. [Google Scholar] [CrossRef]
- Silva, L.; Rodríguez-Sedano, F.; Baptista, P.; Coelho, J.P. The digital twin paradigm applied to soil quality assessment: a systematic literature review. Sensors 2023, 23, 1007. [Google Scholar] [CrossRef]
- Liu, G.; Tian, S.; Mo, Y.; Chen, R.; Zhao, Q. On the acquisition of high-quality digital images and extraction of effective color information for soil water content testing. Sensors 2022, 22, 3130. [Google Scholar] [CrossRef]
- Food and Agriculture Organization of the United Nations (FAO). The State of the World’s Land and Water Resources for Food and Agriculture; FAO: Rome, 2021. [Google Scholar]
- Hillel, D. Introduction to environmental soil physics; Elsevier, 2003. [Google Scholar]
- Dorigo, W.; Wagner, W.; Hohensinn, R.; Hahn, S.; Paulik, C.; Xaver, A.; Gruber, A.; Drusch, M.; Mecklenburg, S.; Van Oevelen, P.; others. The International Soil Moisture Network: a data hosting facility for global in situ soil moisture measurements. Hydrology and Earth system sciences 2011, 15, 1675–1698. [Google Scholar] [CrossRef]
- Quy, V.K.; Hau, N.V.; Anh, D.V.; Quy, N.M.; Ban, N.T.; Lanza, S.; Randazzo, G.; Muzirafuti, A. IoT-enabled smart agriculture: architecture, applications, and challenges. Applied Sciences 2022, 12, 3396. [Google Scholar] [CrossRef]
- Robinson, D.A.; Campbell, C.S.; Hopmans, J.W.; Hornbuckle, B.K.; Jones, S.B.; Knight, R.; Ogden, F.; Selker, J.; Wendroth, O. Soil moisture measurement for ecological and hydrological watershed-scale observatories: A review. Vadose zone journal 2008, 7, 358–389. [Google Scholar] [CrossRef]
- Zeng, X.; Li, J.; Singh, N. Recycling of spent lithium-ion battery: a critical review. Critical Reviews in Environmental Science and Technology 2014, 44, 1129–1165. [Google Scholar] [CrossRef]
- Rojek, I.; Mikołajewski, D.; Dostatni, E. Digital twins in product lifecycle for sustainability in manufacturing and maintenance. Applied Sciences 2020, 11, 31. [Google Scholar] [CrossRef]
- Verdouw, C.; Tekinerdogan, B.; Beulens, A.; Wolfert, S. Digital twins in smart farming. Agricultural Systems 2021, 189, 103046. [Google Scholar] [CrossRef]
- Boschert, S.; Rosen, R. Digital twin—the simulation aspect. Mechatronic futures: Challenges and solutions for mechatronic systems and their designers 2016, pp. 59–74.
- Rasheed, A.; San, O.; Kvamsdal, T. Digital twin: Values, challenges and enablers from a modeling perspective. IEEE access 2020, 8, 21980–22012. [Google Scholar] [CrossRef]
- Parewai, I.; As, M.; Mine, T.; Koeppen, M. Identification and classification of sashimi food using multispectral technology. Proceedings of the 2020 2nd Asia Pacific Information Technology Conference, 2020, pp. 66–72.
- Attarzadeh, R.; Bagheri, H.; Khosravi, I.; Niazmardi, S.; Akbari, D. Segment-based fusion of multi-sensor multi-scale satellite soil moisture retrievals. Remote Sensing Letters 2022, 13, 1260–1270. [Google Scholar] [CrossRef]
- Pharr, M.; Jakob, W.; Humphreys, G. Physically based rendering: From theory to implementation; MIT Press, 2023. [Google Scholar]
- Breiman, L. Random forests. Machine learning 2001, 45, 5–32. [Google Scholar] [CrossRef]
- LeCun, Y.; Bengio, Y.; Hinton, G. Deep learning. nature 2015, 521, 436–444. [Google Scholar] [CrossRef]
- Rahimi-Ajdadi, F.; Abbaspour-Gilandeh, Y.; Mollazade, K.; Hasanzadeh, R.P. Development of a novel machine vision procedure for rapid and non-contact measurement of soil moisture content. Measurement 2018, 121, 179–189. [Google Scholar] [CrossRef]
- Hossain, M.R.H.; Kabir, M.A. Machine learning techniques for estimating soil moisture from smartphone captured images. Agriculture 2023, 13, 574. [Google Scholar] [CrossRef]
- Grieves, M. Digital twin: manufacturing excellence through virtual factory replication. White paper 2014, 1, 1–7. [Google Scholar]
- Nasirahmadi, A.; Hensel, O. Toward the next generation of digitalization in agriculture based on digital twin paradigm. Sensors 2022, 22, 498. [Google Scholar] [CrossRef] [PubMed]
- Fuller, A.; Fan, Z.; Day, C.; Barlow, C. Digital twin: Enabling technologies, challenges and open research. IEEE access 2020, 8, 108952–108971. [Google Scholar] [CrossRef]
- Kukal, M.S.; Irmak, S.; Sharma, K. Development and application of a performance and operational feasibility guide to facilitate adoption of soil moisture sensors. Sustainability 2019, 12, 321. [Google Scholar] [CrossRef]
- Ali, M.E.; Cheema, M.A.; Hashem, T.; Ulhaq, A.; Babar, M.A. Enabling spatial digital twins: Technologies, challenges, and future research directions. PFG–Journal of Photogrammetry, Remote Sensing and Geoinformation Science 2024, pp. 1–18.
- Ismail. Identification and Classification of Food and Fruit Using Multispectral Technology. Master’s thesis, Kyushu Institute of Technology, 2020.
- Zhang, H.K.; Roy, D.P.; Luo, D. Demonstration of large area land cover classification with a one dimensional convolutional neural network applied to single pixel temporal metric percentiles. Remote Sensing of Environment 2023, 295, 113653. [Google Scholar] [CrossRef]
- Zhou, X.; Lei, W.; Ma, J. Entropy Base Estimation of Moisture Content of the Top 10-m Unsaturated Soil for the Badain Jaran Desert in Northwestern China. Entropy 2016, 18, 323. [Google Scholar] [CrossRef]
- Torre, I.G.; Losada, J.C.; Tarquis, A.M. Multiscaling properties of soil images. biosystems engineering 2018, 168, 133–141. [Google Scholar] [CrossRef]
- Heaton, J. Ian goodfellow, yoshua bengio, and aaron courville: Deep learning: The mit press, 2016, 800 pp, isbn: 0262035618. Genetic programming and evolvable machines 2018, 19, 305–307. [Google Scholar] [CrossRef]
- TensorFlow. Sparse Categorical Cross-Entropy, 2024. Accessed: 2024-11-22. 2: Accessed, 2024.
- Cortes, C. Support-Vector Networks. Machine Learning 1995. [Google Scholar] [CrossRef]
- Scikit-learn. Random Forest Classifier, 2024. Accessed: 2024-11-22. 2: Accessed, 2024.
Figure 1.
The Soil digital twin development Scheme
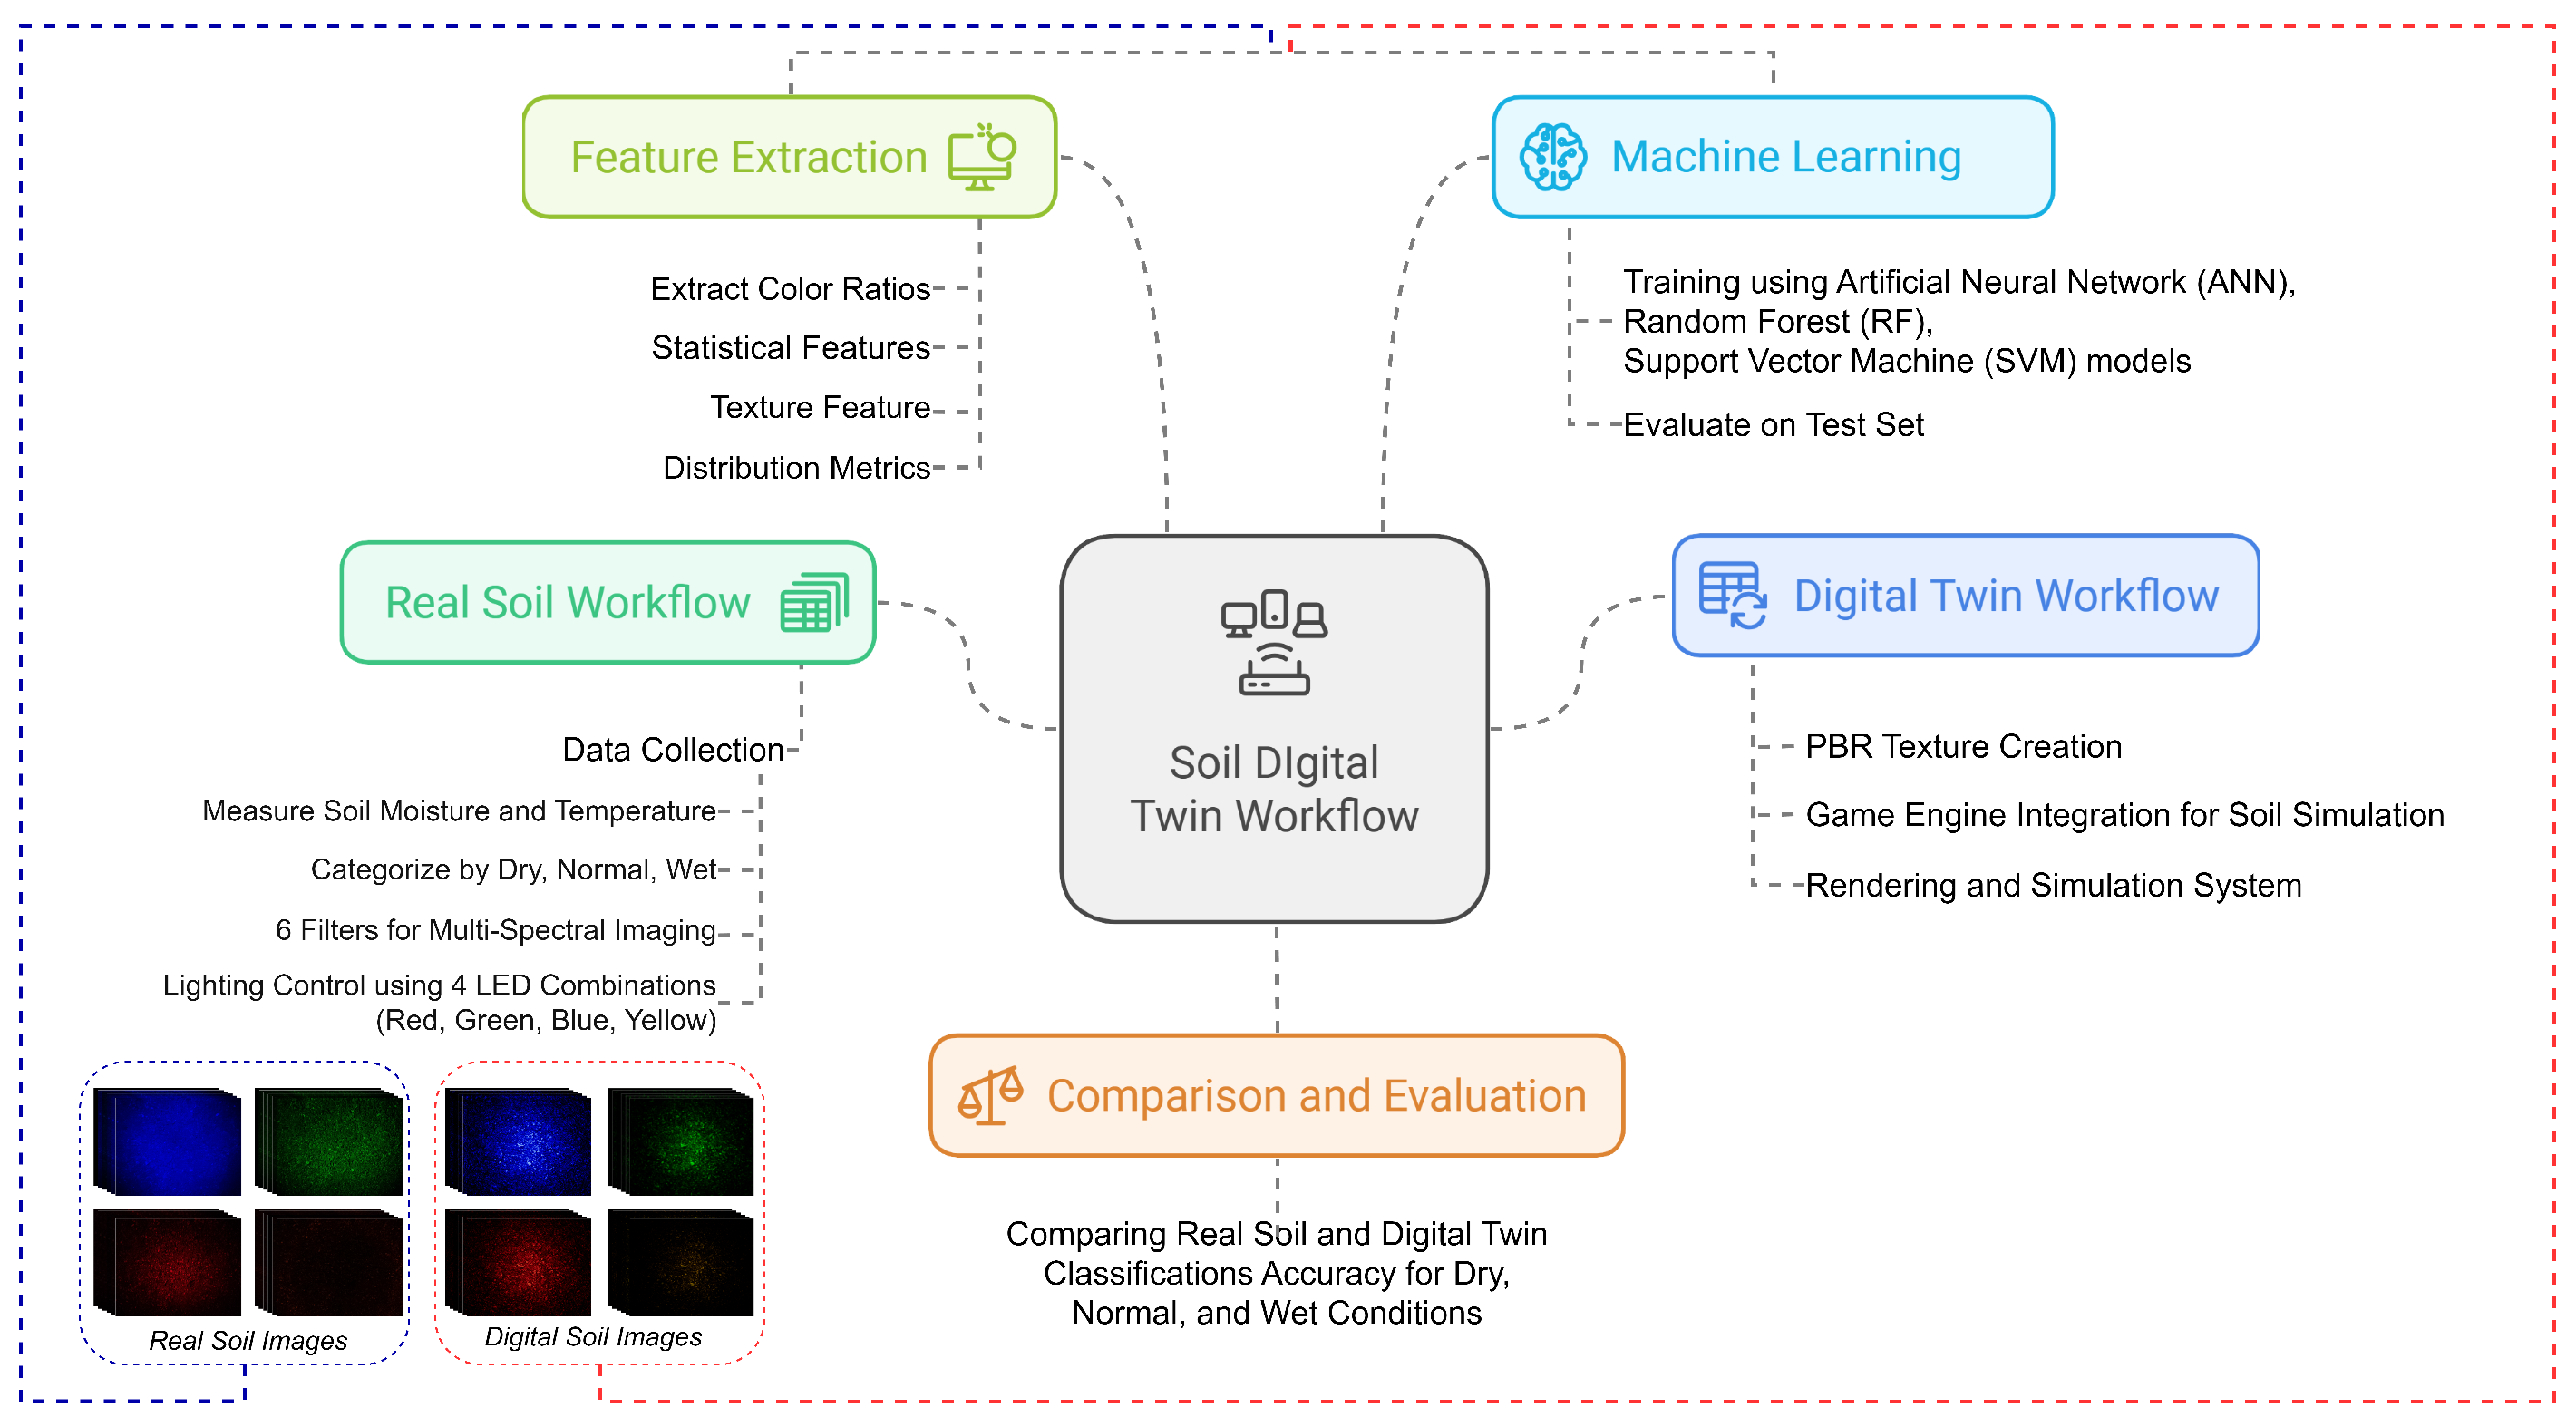
Figure 2.
Experimental Setup for real soil: (Left) Indoor setup for soil moisture analysis with LED lighting and real-time data display. (Right) Low-light indoor setup capturing soil properties with LED lighting for digital twin modeling.
Figure 2.
Experimental Setup for real soil: (Left) Indoor setup for soil moisture analysis with LED lighting and real-time data display. (Right) Low-light indoor setup capturing soil properties with LED lighting for digital twin modeling.
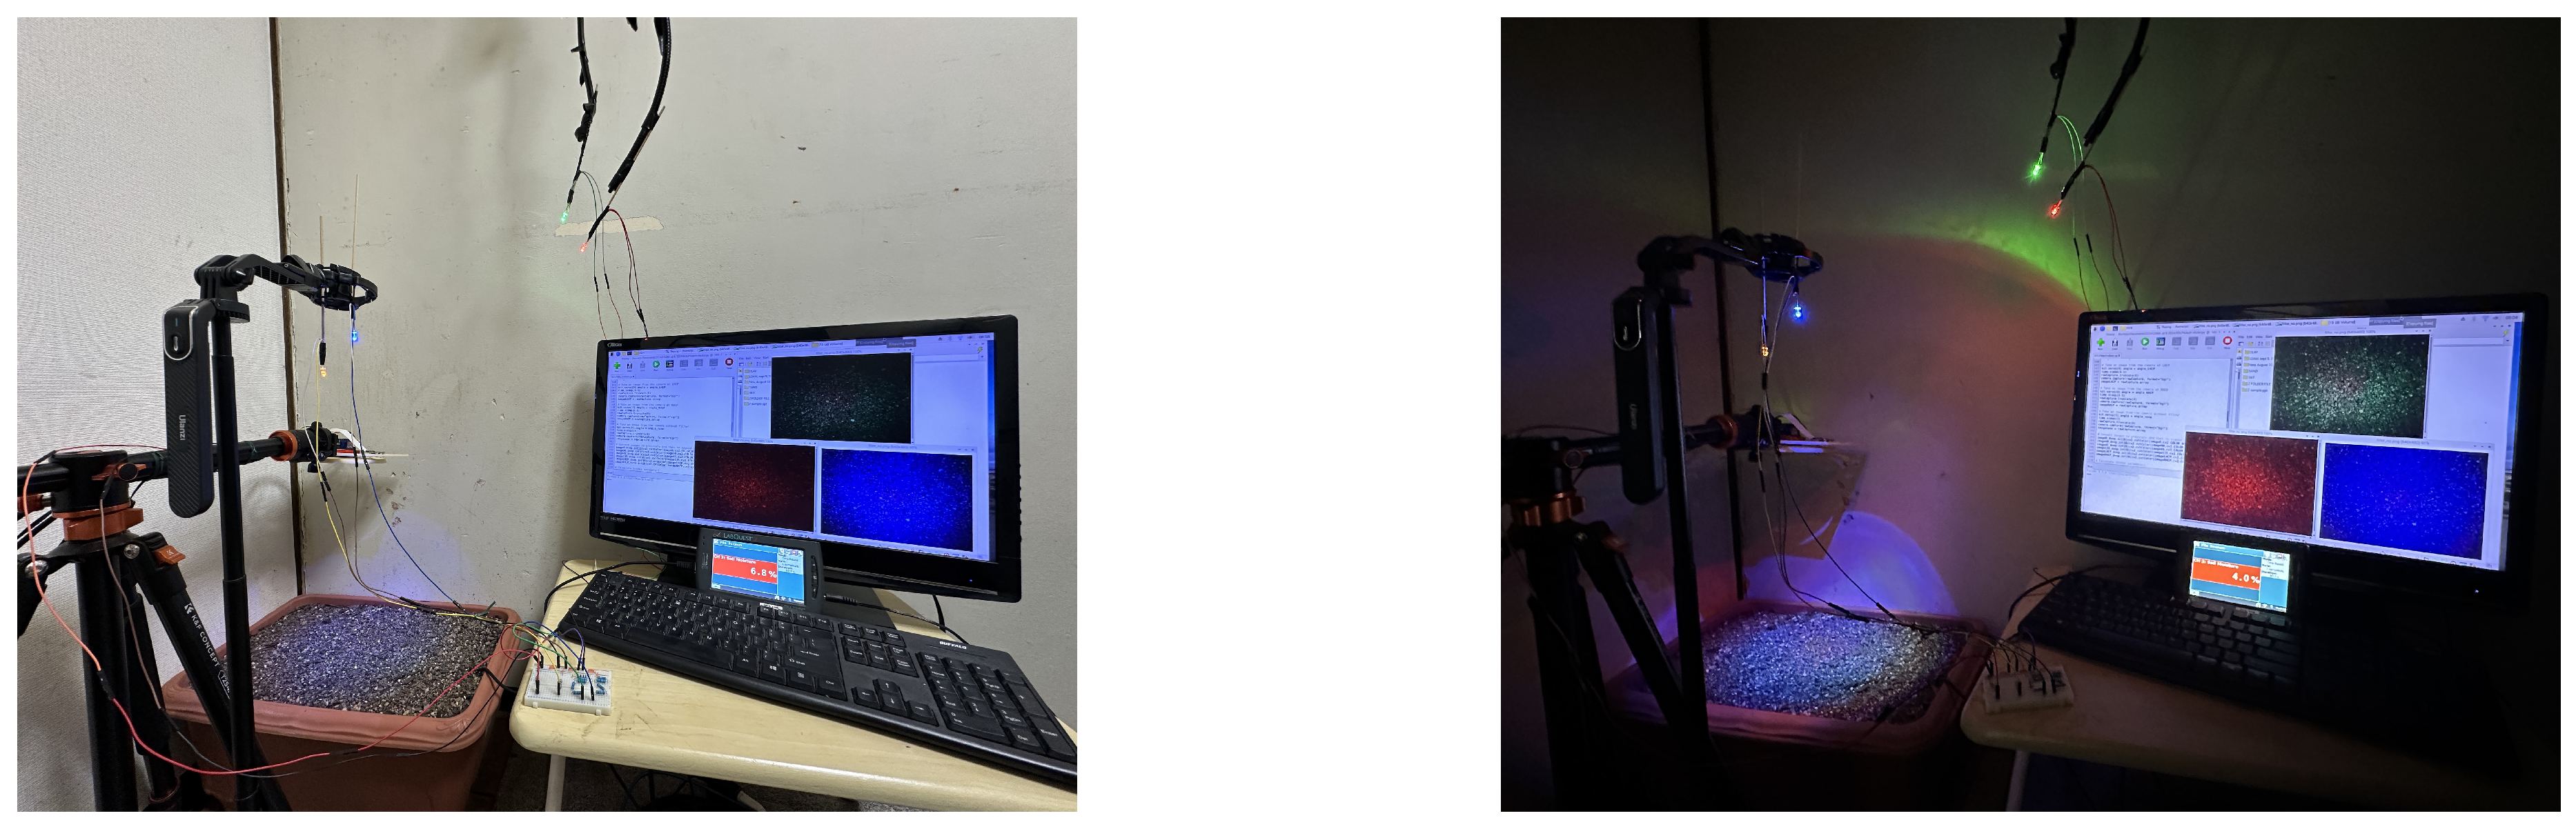
Figure 3.
Experimental setup in Unreal Engine for soil texture and lighting analysis: (Left) daylight scene with camera placement, (Right) simulation of blue LED lighting effect on soil texture
Figure 3.
Experimental setup in Unreal Engine for soil texture and lighting analysis: (Left) daylight scene with camera placement, (Right) simulation of blue LED lighting effect on soil texture
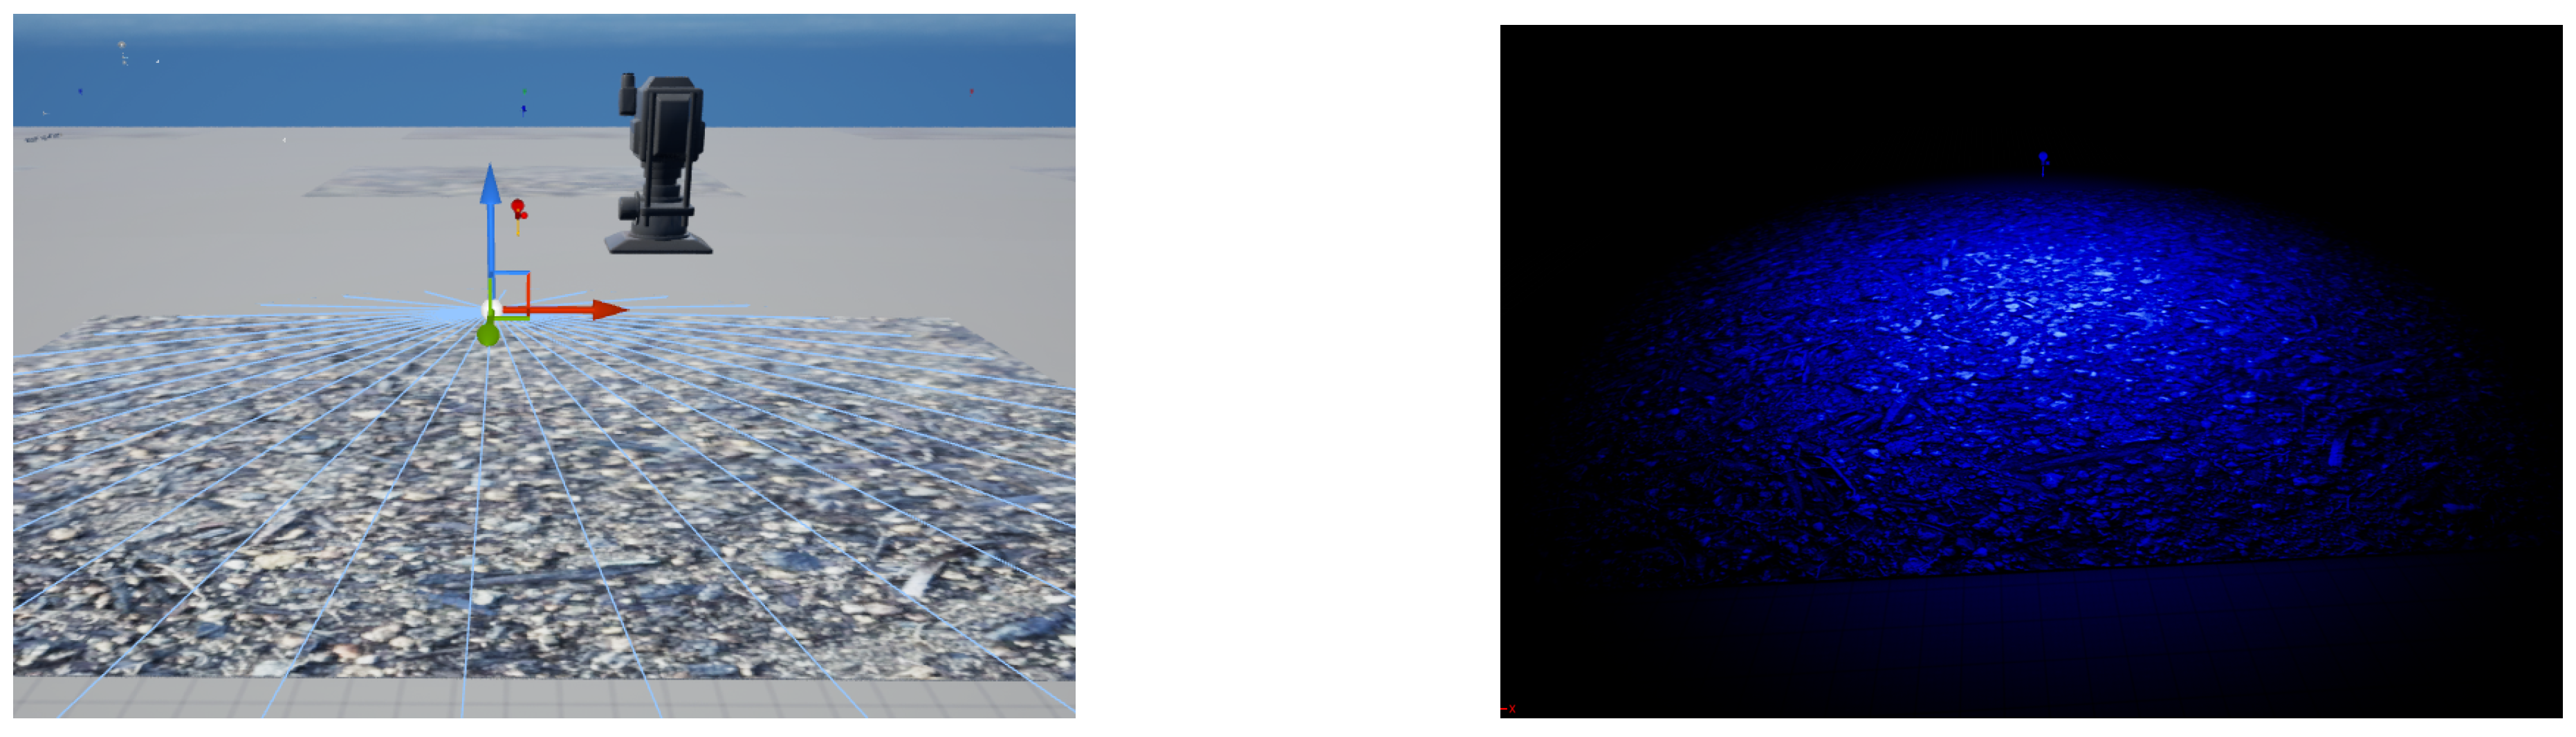
Figure 4.
Comparison of real soil images (top row) and digital twin images (bottom row) across different color channels: (a, e) Blue, (b, f) Green, (c, g) Red, (d, h) Yellow.
Figure 4.
Comparison of real soil images (top row) and digital twin images (bottom row) across different color channels: (a, e) Blue, (b, f) Green, (c, g) Red, (d, h) Yellow.
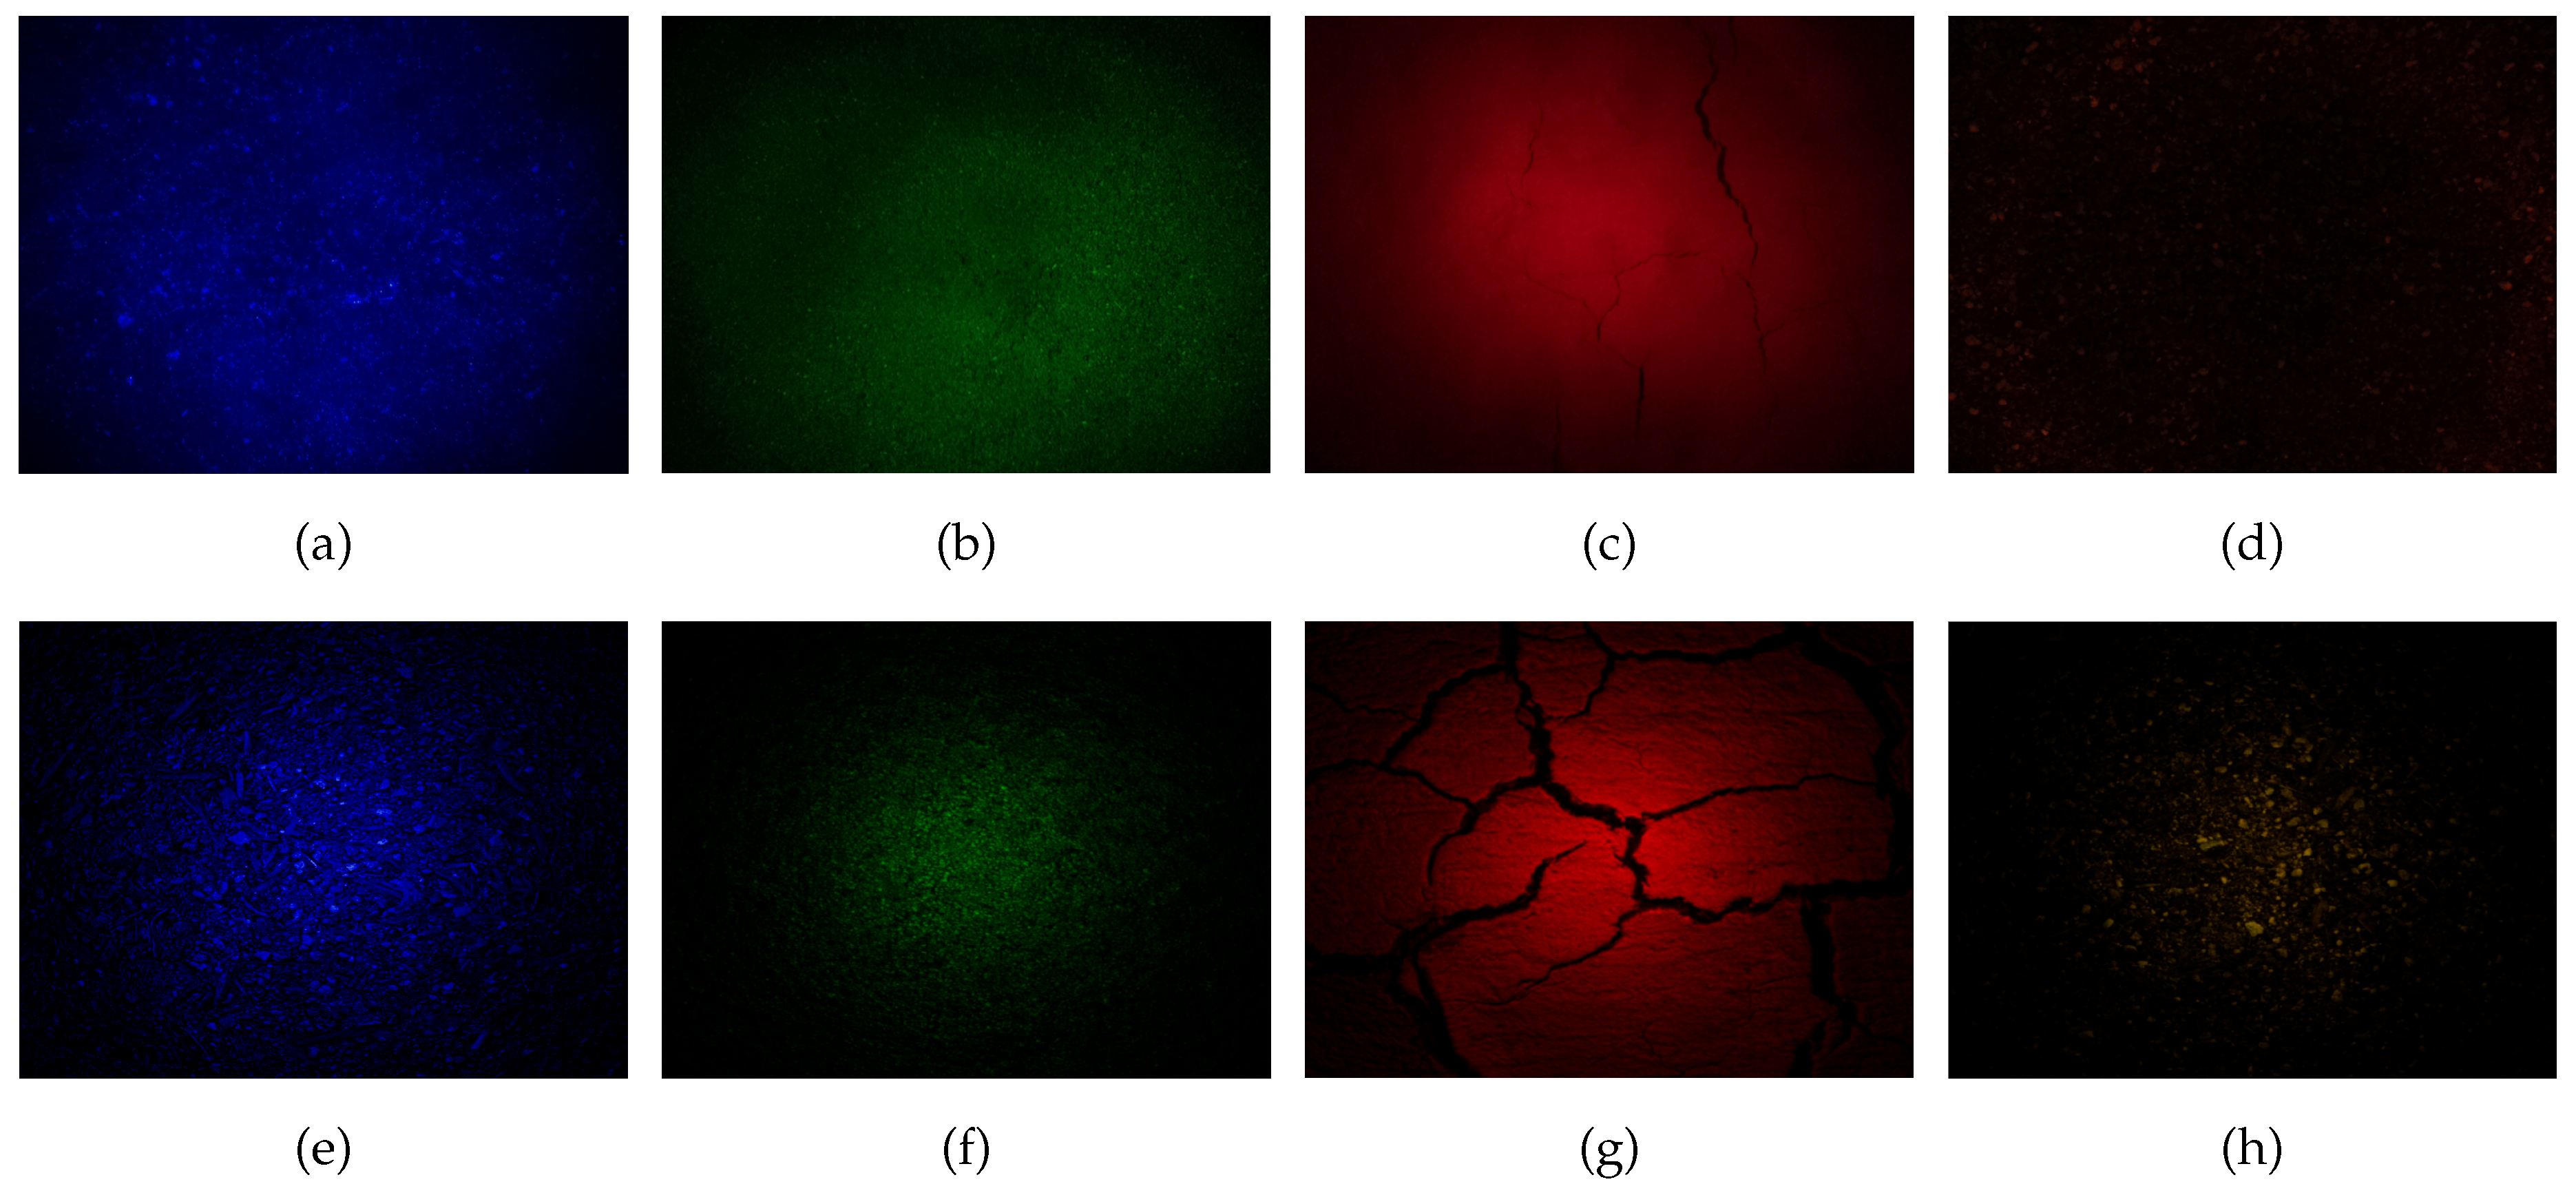
Figure 5.
Accuracy comparison across soil types
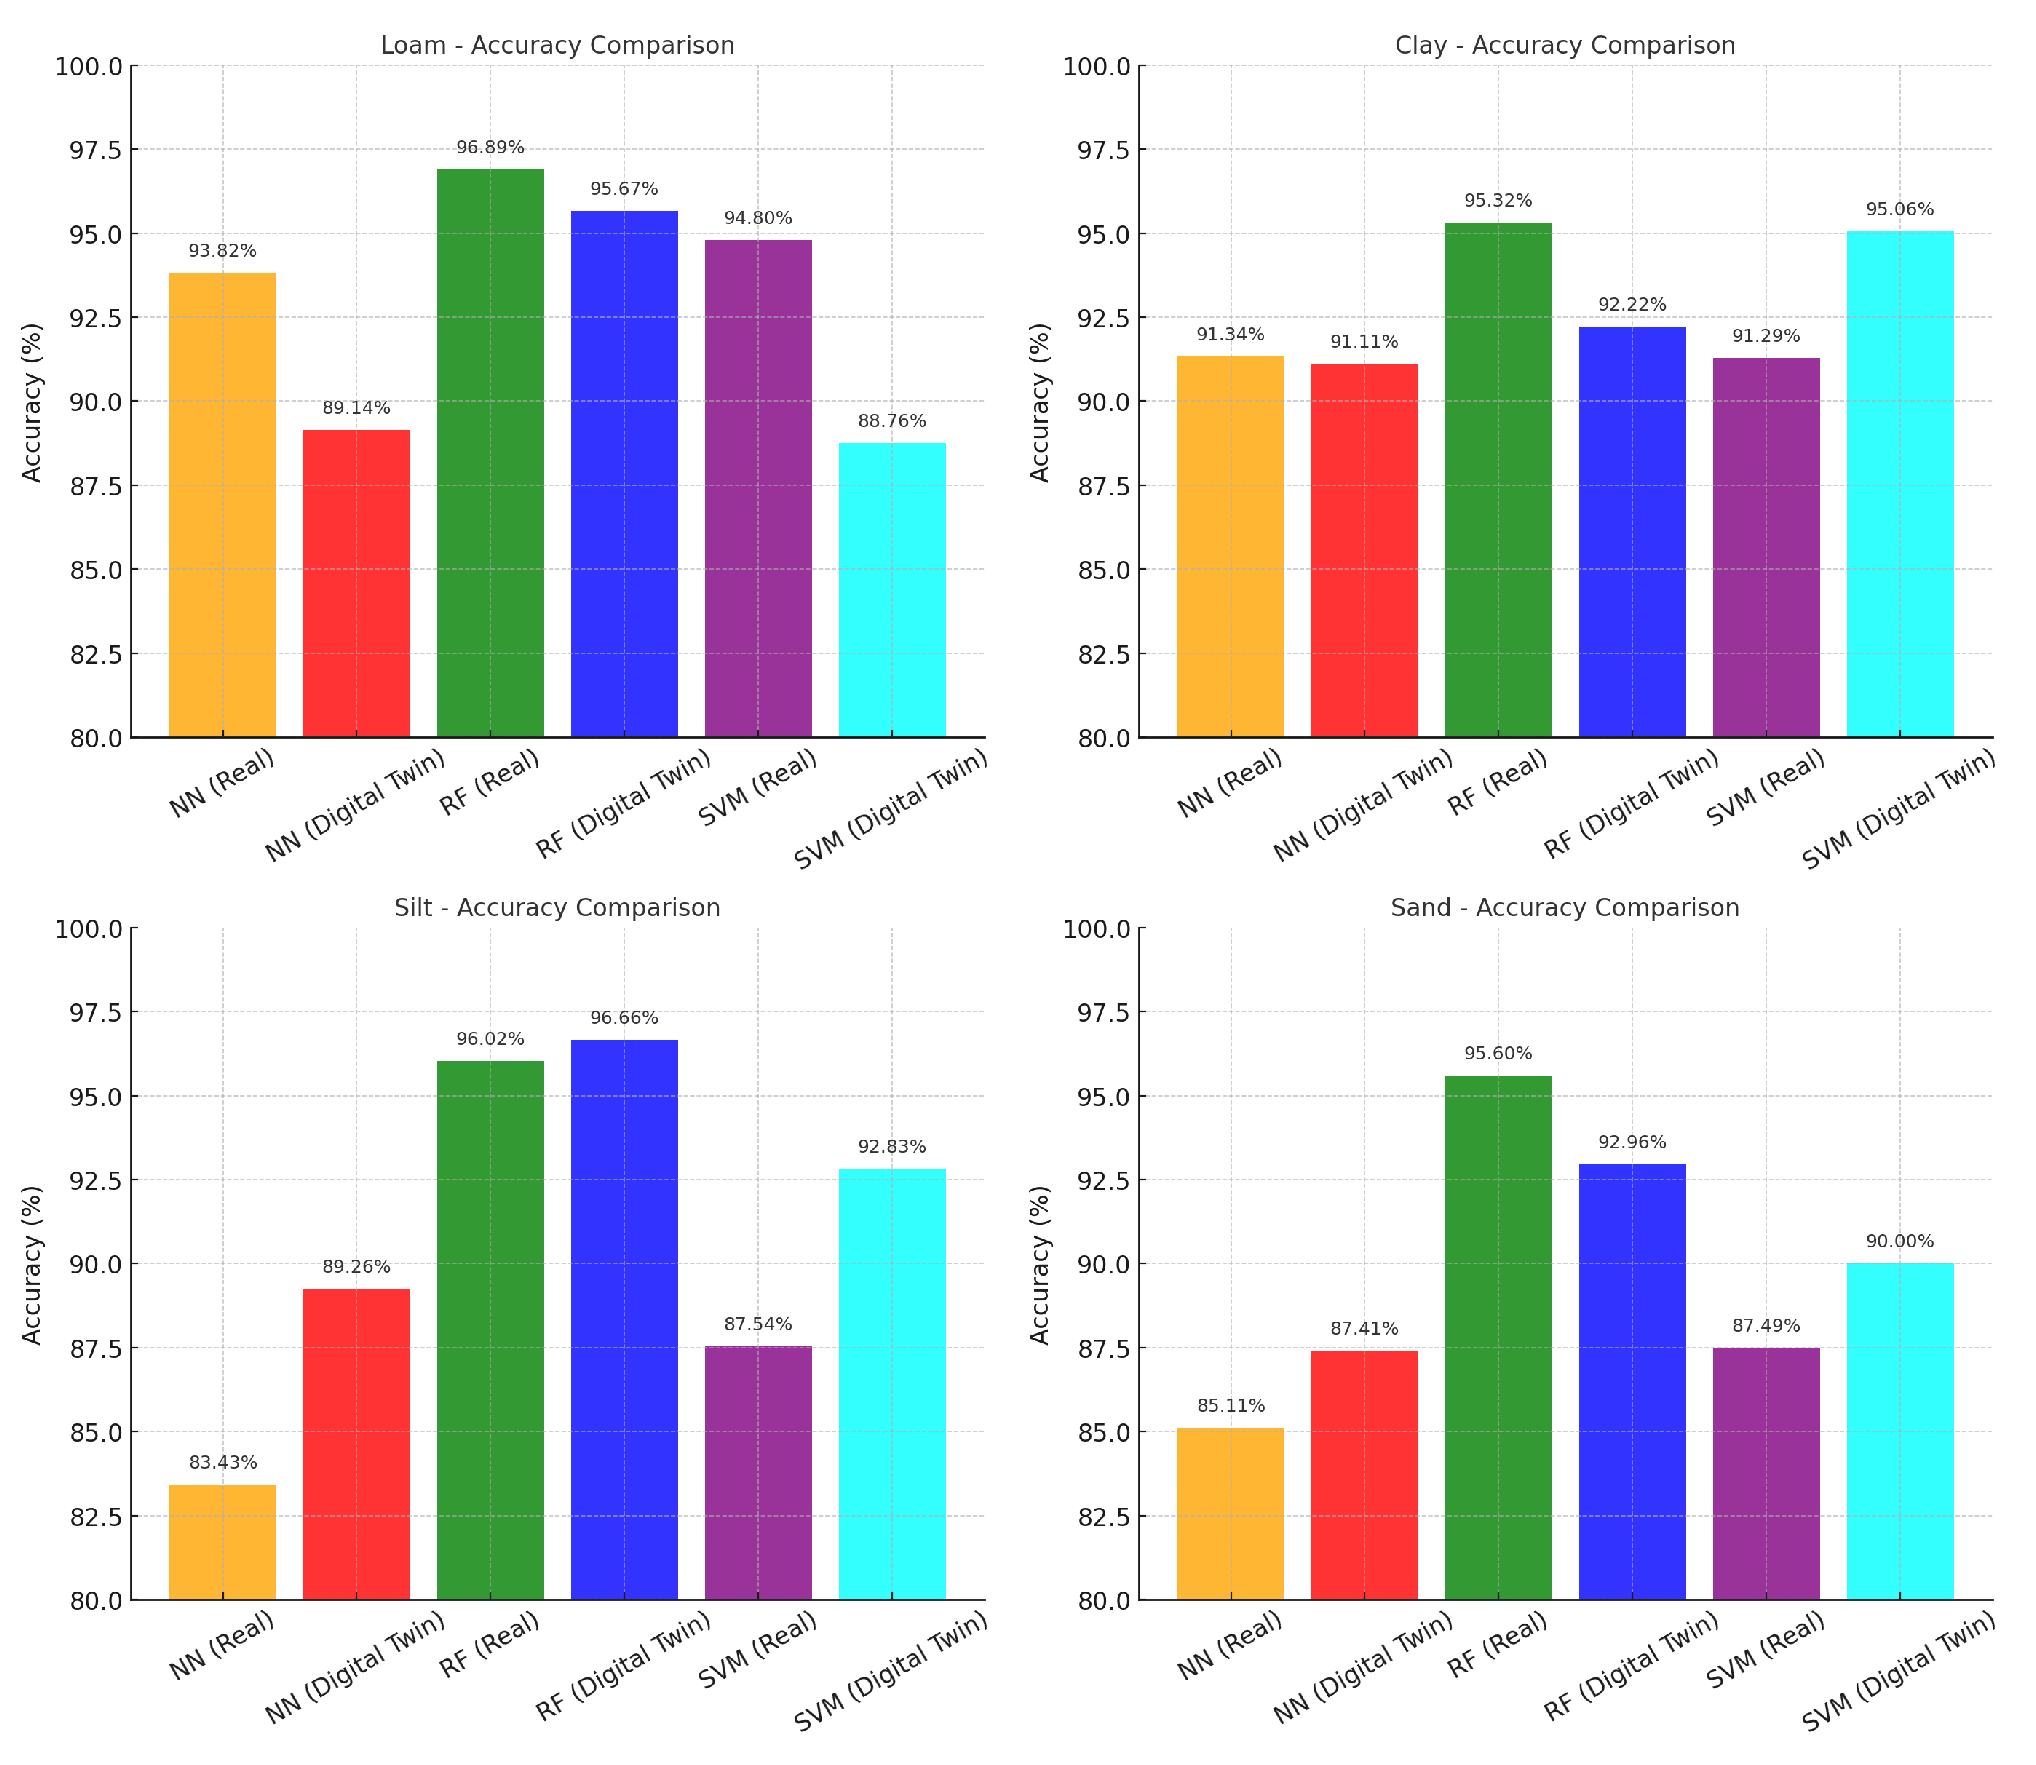
Figure 6.
Confusion matrix results forArtificial Neural Networks (ANN): Real soil (Top row) vs Digital Twin (Bottom row)
Figure 6.
Confusion matrix results forArtificial Neural Networks (ANN): Real soil (Top row) vs Digital Twin (Bottom row)
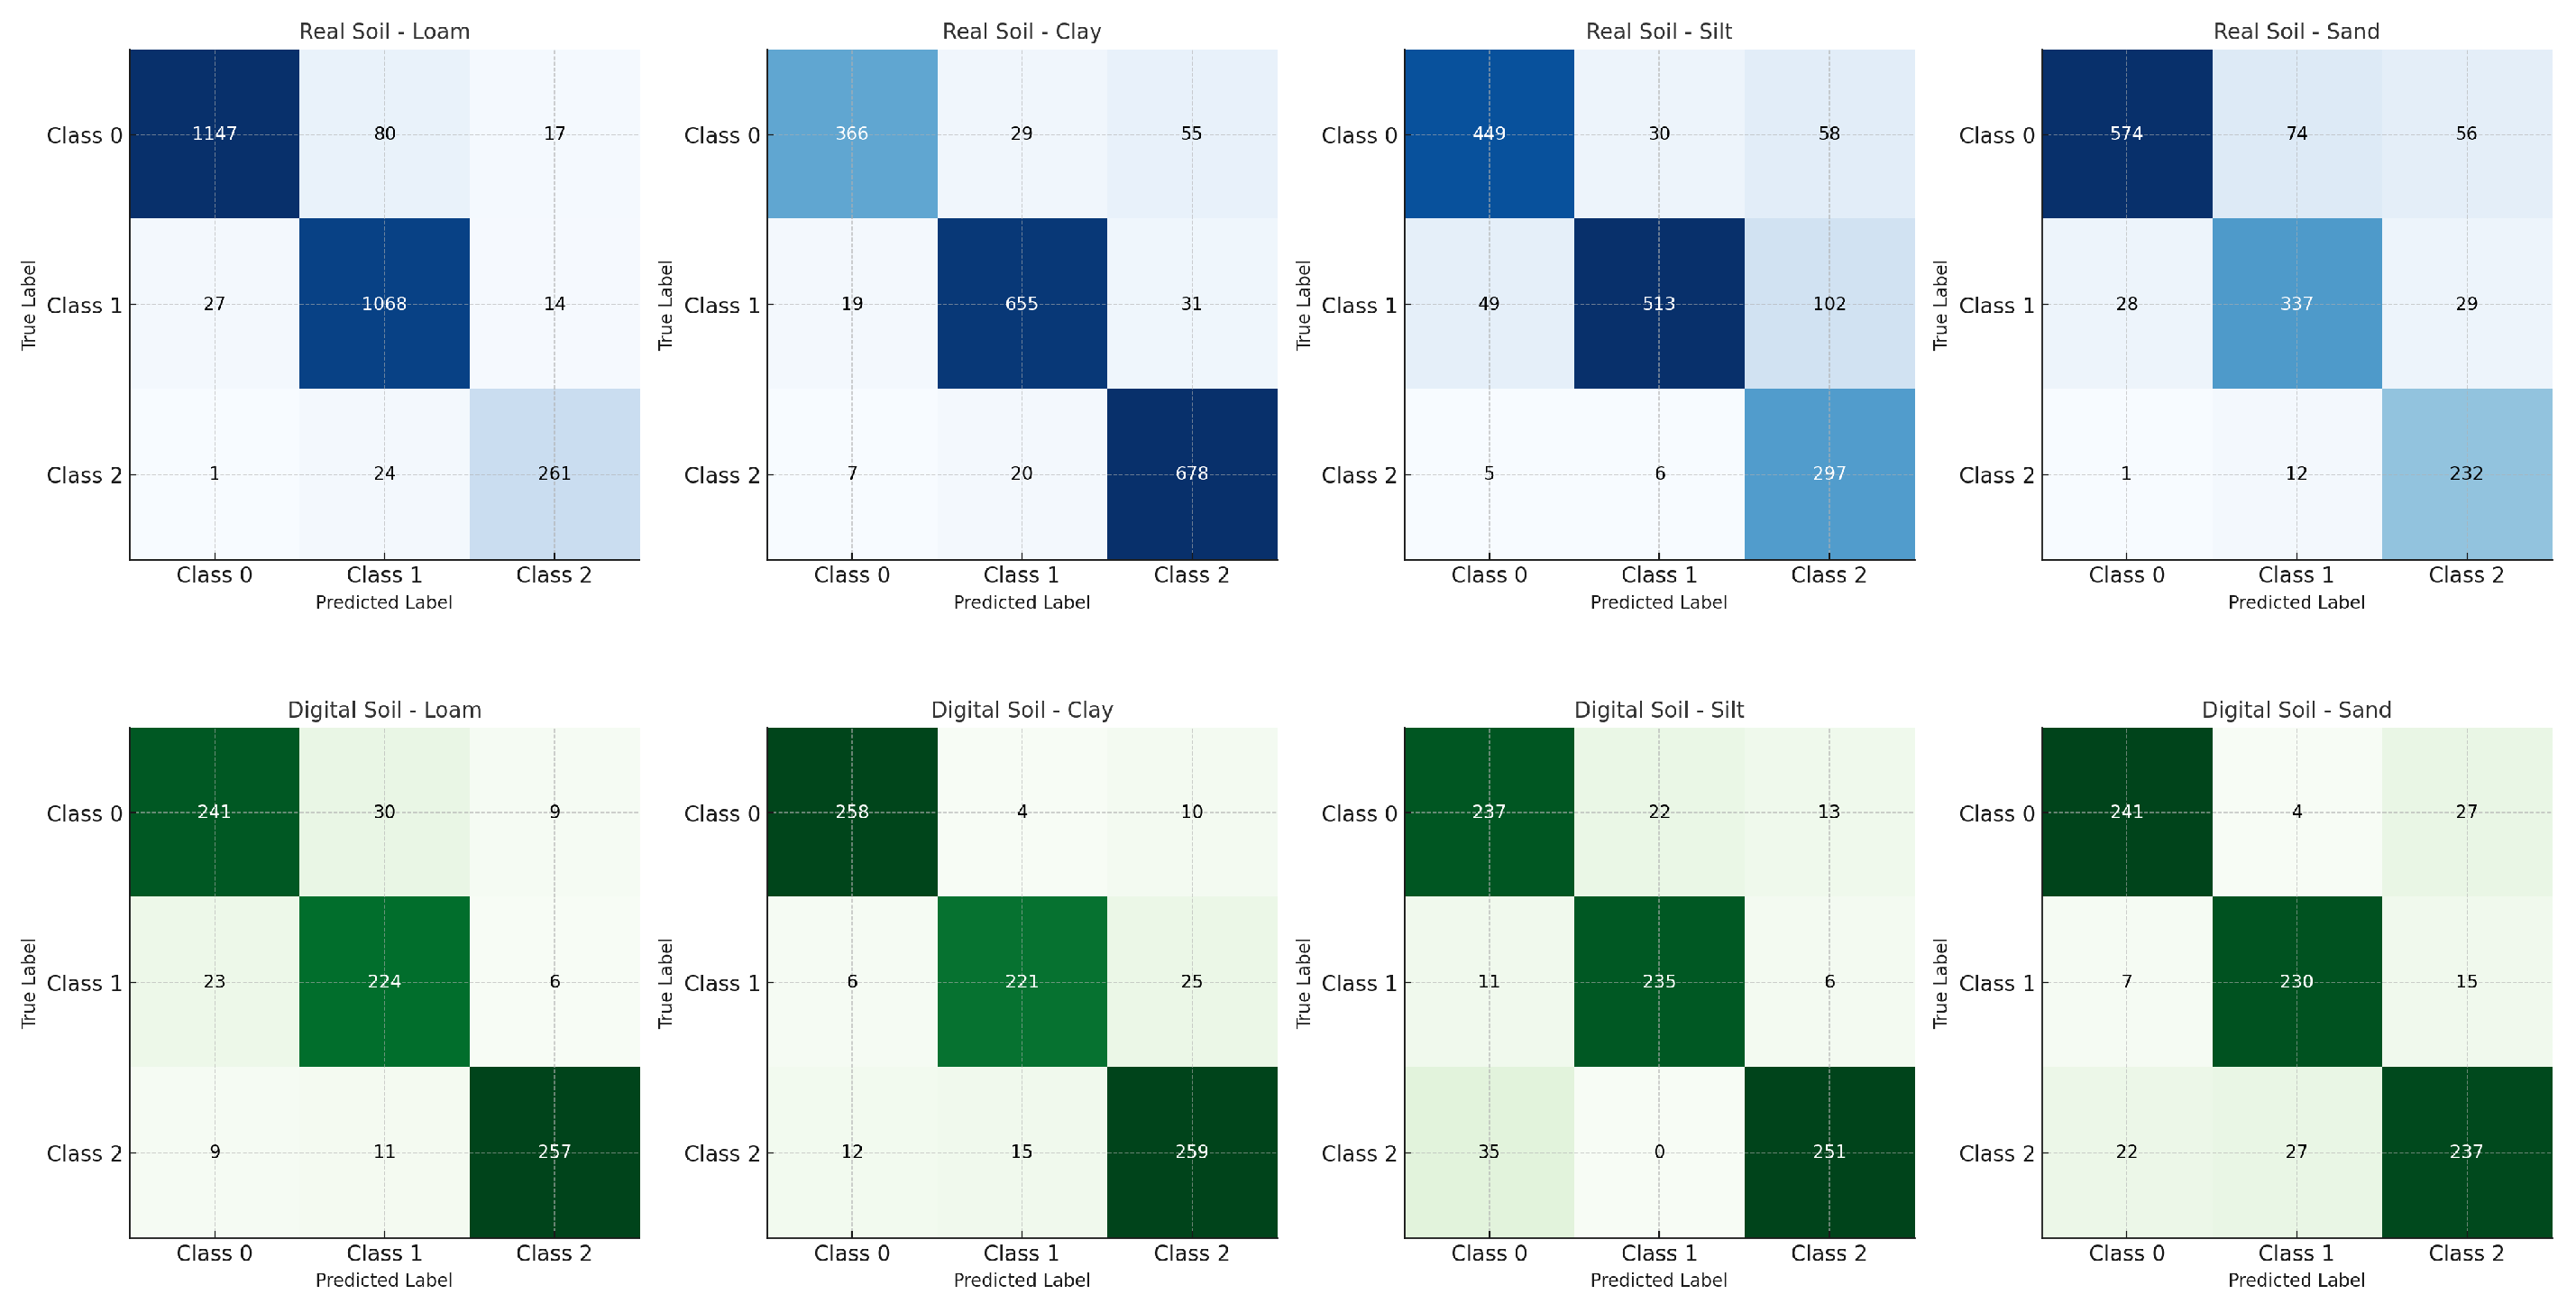
Figure 7.
Confusion matrix results for Random Forest (RF): Real soil (Top row) vs Digital Twin (Bottom row)
Figure 7.
Confusion matrix results for Random Forest (RF): Real soil (Top row) vs Digital Twin (Bottom row)
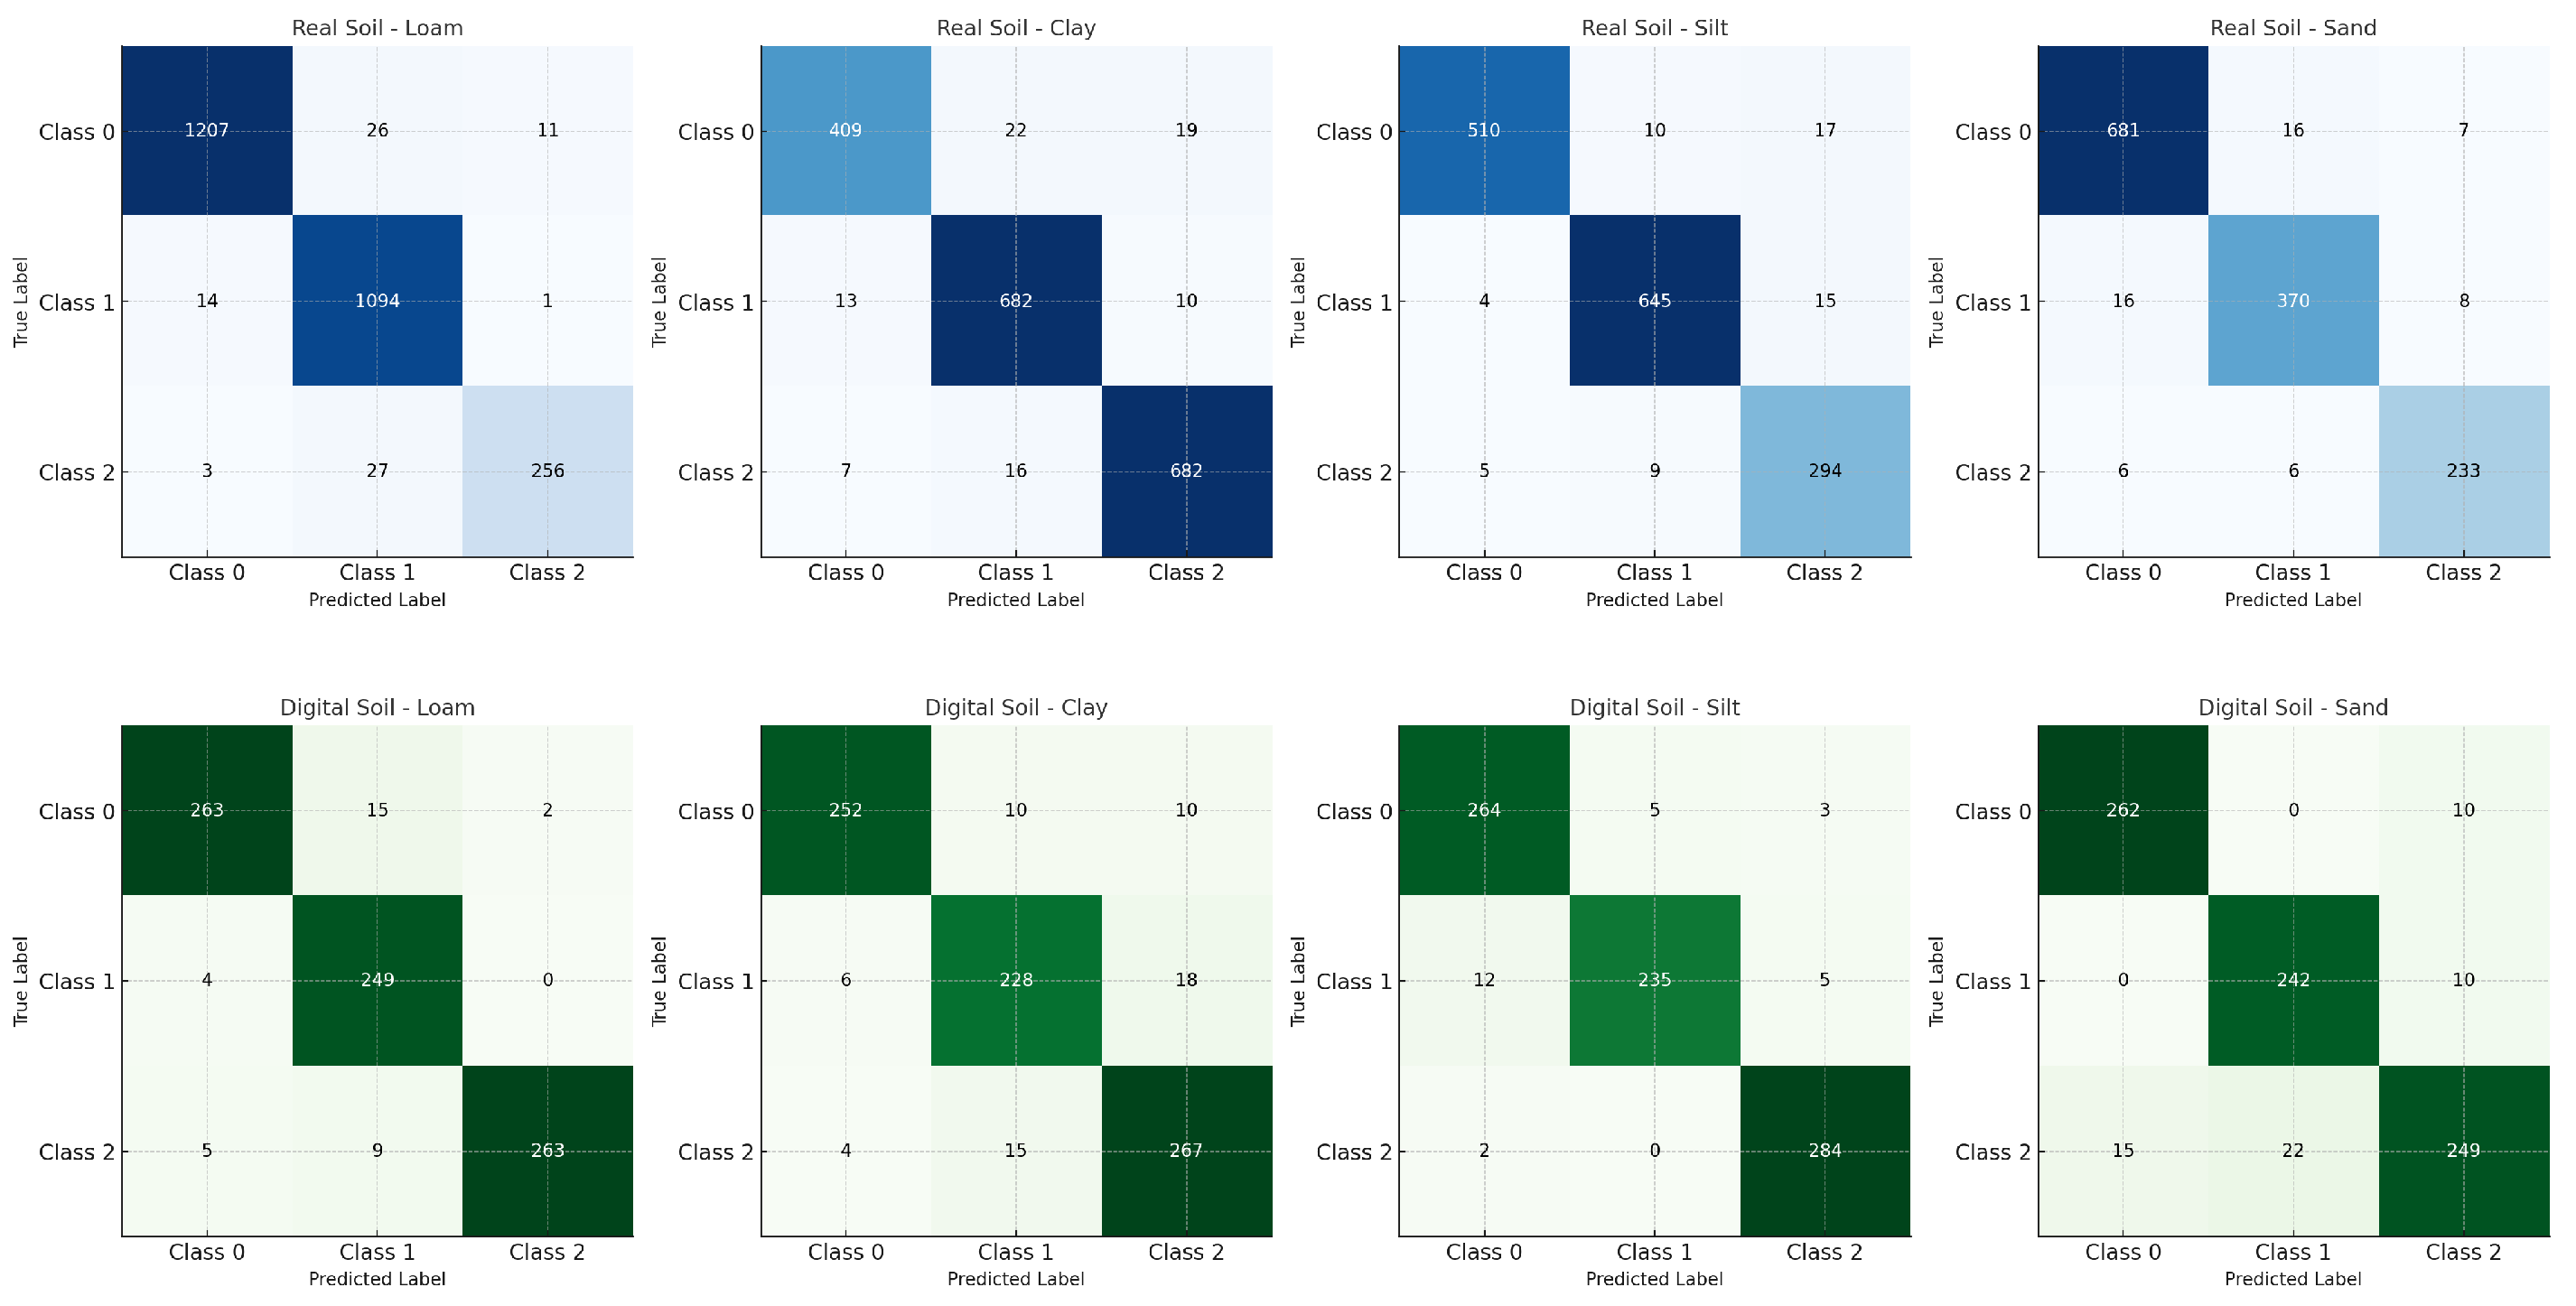
Figure 8.
Confusion matrix results for Support Vector Machine (SVM): Real soil (Top row) vs Digital Twin (Bottom row)
Figure 8.
Confusion matrix results for Support Vector Machine (SVM): Real soil (Top row) vs Digital Twin (Bottom row)
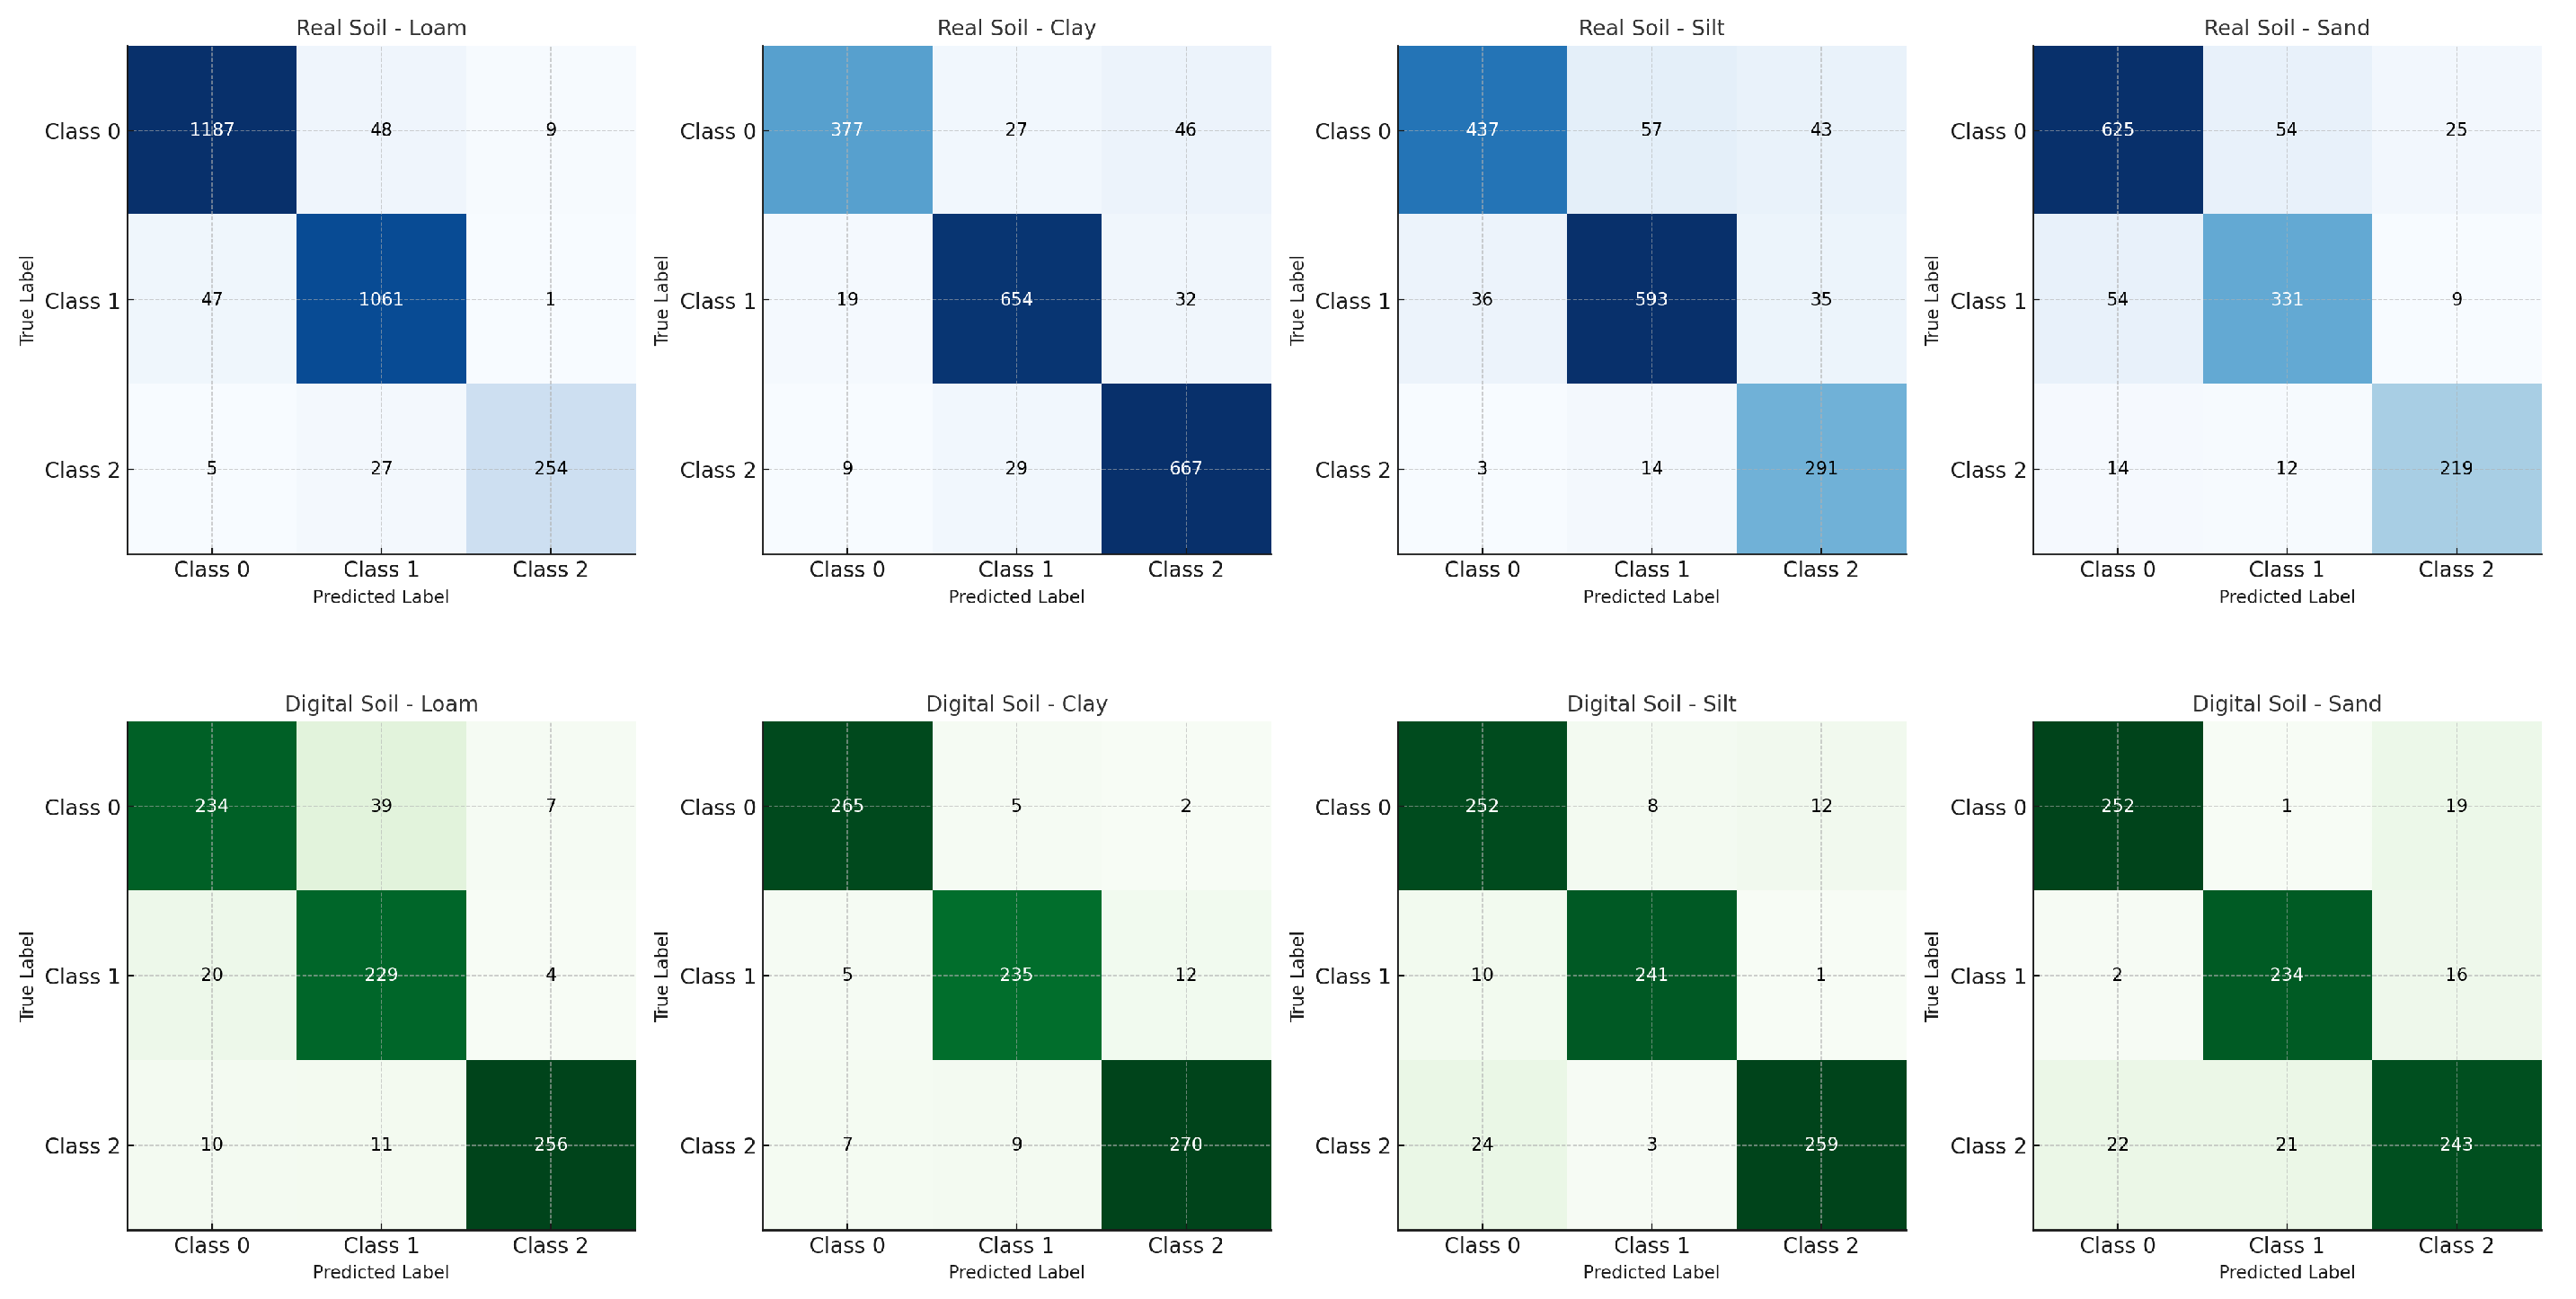

Table 1.
Specifications of spectral filters used in the imaging system.
| Filter Name | Color | Spectral Range (nm) | Intensity Coefficient |
|---|---|---|---|
| Filter1 | Purple | <380 | 0.480 |
| Filter2 | Blue | 380–480 | 0.608 |
| Filter3 | Green | 480–560 | 0.828 |
| Filter4 | Yellow | 560–590 | 0.933 |
| Filter5 | Brown | 590–630 | 0.693 |
| Filter6 | Red | >630 | 0.427 |
Table 2.
Specifications of LEDs used for soil illumination.
| LED Color | Wavelength (nm) | Intensity (mcd) | Intensity Coefficient |
|---|---|---|---|
| Blue | 465–470 | 8,400 | 0.961 |
| Green | 520–525 | 39,000 | 0.958 |
| Yellow | 590–610 | 19,000 | 0.974 |
| Red | 630–640 | 12,500 | 0.961 |
Table 3.
Specifications of LEDs used for digital soil illumination.
| LED Color | RGB Value | Intensity (cd) | Intensity Coefficient |
|---|---|---|---|
| Blue | (0, 0, 1) | 2.0 | 0.961 |
| Green | (0, 1, 0) | 1.7 | 0.958 |
| Yellow | (1, 0.5, 0) | 1.5 | 0.974 |
| Red | (1, 0, 0) | 3.0 | 0.961 |
Table 4.
Specifications of filters used for digital soil imaging.
| Filter Name | Color | RGB Value | Intensity Coefficient |
|---|---|---|---|
| Filter1 | Purple | (0.681, 0.185, 0.611) | 0.480 |
| Filter2 | Blue | (0.072, 0.381, 0.814) | 0.608 |
| Filter3 | Green | (0.642, 0.837, 0.359) | 0.828 |
| Filter4 | Yellow | (0.967, 0.909, 0.255) | 0.933 |
| Filter5 | Brown | (0.435, 0.166, 0.052) | 0.693 |
| Filter6 | Red | (1, 0.056, 0.054) | 0.427 |
Table 5.
Summary of the real soil dataset.
| Soil Type | Number of Samples | Drying Time | Moisture Categories |
|---|---|---|---|
| Loam | 8,796 | 3 days (56 hours) | Dry, Normal, Wet |
| Clay | 6,198 | 10 days (240 hours) | Dry, Normal, Wet |
| Sand | 4,476 | 1 day (23 hours) | Dry, Normal, Wet |
| Silt | 5,028 | 2 days (35 hours) | Dry, Normal, Wet |
Table 6.
Summary of the digital twin dataset.
| Soil Type | Number of Samples | Render Time | Moisture Categories |
|---|---|---|---|
| Loam | 2,700 | 2 hours 25 minutes | Dry, Normal, Wet |
| Clay | 2,700 | 2 hours 20 minutes | Dry, Normal, Wet |
| Sand | 2,700 | 2 hours 17 minutes | Dry, Normal, Wet |
| Silt | 2,700 | 2 hours 16 minutes | Dry, Normal, Wet |
Table 7.
Model accuracy comparison for real soil vs. digital twin.
| Soil Type | Model | Accuracy (Real Soil) | Accuracy (Digital Twin) |
|---|---|---|---|
| Loam | Neural Networks (NN) | 93.82% | 89.14% |
| Random Forest | 96.89% | 95.67% | |
| Support Vector Machine (SVM) | 94.80% | 88.76% | |
| Clay | Neural Networks (NN) | 91.34% | 91.11% |
| Random Forest | 95.32% | 92.22% | |
| Support Vector Machine (SVM) | 91.29% | 95.06% | |
| Silt | Neural Networks (NN) | 83.43% | 89.26% |
| Random Forest | 96.02% | 96.66% | |
| Support Vector Machine (SVM) | 87.54% | 92.83% | |
| Sand | Neural Networks (NN) | 85.11% | 87.41% |
| Random Forest | 95.60% | 92.96% | |
| Support Vector Machine (SVM) | 87.49% | 90.00% |
Disclaimer/Publisher’s Note: The statements, opinions and data contained in all publications are solely those of the individual author(s) and contributor(s) and not of MDPI and/or the editor(s). MDPI and/or the editor(s) disclaim responsibility for any injury to people or property resulting from any ideas, methods, instructions or products referred to in the content. |
© 2024 by the authors. Licensee MDPI, Basel, Switzerland. This article is an open access article distributed under the terms and conditions of the Creative Commons Attribution (CC BY) license (http://creativecommons.org/licenses/by/4.0/).
Copyright: This open access article is published under a Creative Commons CC BY 4.0 license, which permit the free download, distribution, and reuse, provided that the author and preprint are cited in any reuse.


